
Navigating the Environmental Paradox of AI: A Decision Framework for Clean Technology Practitioners




Highlights
- Analysis of 73 empirical studies supports a synthesized S-curve trajectory for AI's environmental impact across three phases: initial emission reductions (0–2 years, moderate evidence); a rebound period (2–5 years, moderate evidence) in which infrastructure scaling outpaces efficiency gains via the Jevons Paradox; and conditionally projected long-term optimization (5+ years, indicative evidence only), contingent on grid decarbonization, infrastructure stabilization, and sector-wide efficiency adoption.
- Deployment location determines environmental outcomes as strongly as system design. Grid carbon intensity ranges from under 20 gCO₂e/kWh in renewable-heavy regions to over 800 gCO₂e/kWh in fossil-dependent ones, and combined carbon and water multipliers produce up to 60x variation in lifecycle impact, meaning identical AI workloads can be net positive in Iceland and net negative in Arizona or Northern China.
- Because the rebound phase is predictable (typically 2–5 years post-deployment), it is manageable through coupling AI infrastructure with new renewable capacity, extending hardware lifecycles from 2–3 to 4–6 years, and deploying zero-water or closed-loop cooling in water-stressed regions.
- Point-in-time environmental reporting systematically misrepresents AI's lifecycle impacts. Sustainable deployment requires context-sensitive, temporally dynamic governance, including location-based deployment incentives, renewable procurement mandates with verified additionality, and an integrated AI Lifecycle Environmental Score (ALES) weighting energy, water, e-waste, and supply chain impacts by regional resource scarcity.
Abstract
1. Introduction
2. Theoretical Framework: The Environmental Asset-Cost Model
2.1. Framework Overview and Development
2.2. Asset Dimension: Categories of Environmental Benefits
- Energy Optimization: AI-driven systems optimize energy consumption across industrial processes, building management systems, and electrical grid operations. Machine learning algorithms detect inefficiencies that traditional monitoring misses, enabling 20–40% reductions in industrial energy consumption and 15–30% improvements in building HVAC performance [4,9,13,17,37,49,52,63,64].
- Green Innovation Acceleration: AI speeds up clean technology research and development by enabling materials discovery, molecular simulation, and design optimization [1,46]. Machine learning-driven materials science has shortened discovery timelines for battery materials, catalysts, and carbon capture compounds [31,46,66]. Generative design algorithms develop energy-efficient product geometries and sustainable material mixes [49,66].
- Resource Conservation: Circular economy applications promote waste reduction, optimized reuse of components, and planning for extending product lifecycles [11]. Predictive models determine the best times for refurbishment, cutting down premature disposal [11,30,37]. Supply chain optimization reduces transportation emissions and inventory waste through demand forecasting and route optimization [37,46].
- Precision Applications: AI-driven targeted interventions facilitate precise and efficient resource allocation by analyzing high-resolution data from sensors, drones, and satellites to ensure that inputs like water and fertilizer are applied only when and where they are necessary [49,65]. In the healthcare sector, AI acts as an “organizational consciousness” that helps reduce unnecessary procedures and redundant diagnostic tests, reducing the industry’s environmental impact [38,39]. Infrastructure monitoring systems detect leaks, structural weaknesses, and inefficiencies early, preventing larger resource losses [4,37,49].
2.3. Cost Dimension: Categories of Environmental Burdens
- Energy Consumption: Training large language models requires 1287 to 7200 MWh of electricity per model, equivalent to 500–1500 U.S. homes’ annual electricity consumption [2,4,15,19,21,42,49,67] (GPT-3 baseline of 1287 MWh from Patterson et al. 2021, reported as contextual background in [2,49,68]; GPT-4 estimate of 7200 MWh from industry modeling reported in [4,49]; unit: MWh per training run; these figures derive from external industry and academic sources cited through reviewed studies, not directly measured in this review’s empirical corpus). More advanced models like GPT-4 have significantly higher requirements. Inference operations at scale consume 40 to 260 MWh daily for major platforms [4,15,49,68]. Data centers supporting AI workloads demand three to five times more energy than traditional computing centers due to accelerated hardware requirements [15]. Global AI data center electricity consumption is projected to reach 620 to 1050 TWh annually in 2026, representing more than 2% of global electricity demand [3,4,36] (baseline: IEA 2022 estimate of 460 TWh; projection: IEA scenario range reported in [4]; unit: TWh annually; contextual background via reviewed study). One source predicted this share could surge to 10% [4] (industry analyst forecast reported as contextual background in [4]; unit: % of global electricity demand).
- Water Use: Data center cooling systems use 1.8 to 12 L of water per kWh depending on the technology and climate [4,19,48] (unit: liters per kWh of electricity consumed; lower bound from air-cooled systems; upper bound from evaporative cooling in warm climates; range derived from Water Use Efficiency (WUE) data in reviewed empirical study [19] and contextual background reported in [4] via the Organisation for Economic Co-operation and Development (OECD) AI estimates). Training a single large language model indirectly consumes over 700,000 L through electricity generation and direct cooling [14,19,21,23] (estimate based on GPT-3-scale model; includes indirect consumption through electricity generation and direct evaporative cooling; reported as contextual background in [19], citing Hao 2024 and Bhaskar & Seth 2024; unit: liters per training run). U.S. data centers are expected to use 660–1200 billion liters of water annually by 2030 [48], with AI workloads accounting for a significant portion of this demand. Globally, AI water withdrawal is expected to reach 4.2 to 6.6 billion cubic meters by 2027 [4,19,38]. Data centers are frequently located in water-stressed regions such as Arizona, Nevada, India, and Australia, primarily to take advantage of lower energy costs, exacerbating regional shortages [19,48].
- E-waste Generation: AI requires specialized hardware, such as Graphics Processing Units (GPUs) and Tensor Processing Units (TPUs), which are frequently retired before the end of their operational life due to constant demand for faster systems [38]. This has accelerated obsolescence cycles, with GPU lifespans averaging two to three years compared to four to six years for traditional servers [39]. One source states that processing just one ton of rare earth ores, as critical for AI capacitors and sensors, can generate 2000 tons of toxic waste [39] (unit: tons of toxic waste per ton of ore processed; contextual background reported in [39]; original industry/environmental assessment source cited through the reviewed study). Recycling is insufficient, with about 20% of global e-waste properly recycled due to the complexity of specialized components [13,15,39].
- Infrastructure Impacts: Data centers are housed in large structures requiring massive amounts of steel, aluminum, and concrete [15]. As these facilities are typically built horizontally to reduce costs, the footprint of one facility can span dozens of acres, transforming land and disrupting local ecosystems. The construction and resource extraction for these facilities are linked to the destruction of natural habitats and loss of biodiversity. The environmental burden includes not just the servers but also the mechanical cooling systems, transformers, and backup diesel generators required to maintain operations and supply backup power and ongoing maintenance [13,15,52].
- Supply Chain Extraction: Semiconductor supply chains require rare earth mining, contaminating water sources and degrading land. Manufacturing a single AI accelerator GPU requires 20,000 to 30,000 L of ultrapure water and releases CO2 [19]. Mining for critical AI minerals like lithium and cobalt is linked to deforestation, soil contamination, and water pollution [7,48]. These extractive processes are often concentrated in the Global South under poor labor conditions [13,15]. The information and communications technology sector accounts for 3.9% of global greenhouse gas emissions, surpassing global air travel, with data center emissions projected to triple by 2030 [7,49].
2.4. Temporal Dynamics: The S-Curve Pattern
- Phase 1—Initial Optimization (0–2 years): [Evidence Level: Moderate—primarily cross-sectional empirical and econometric studies] Research using a dynamic threshold model found that in countries or periods with low AI intensity, increases in AI activity were associated with a significant reduction in emissions [16]. Early deployment, leveraged to enhance data monitoring, environmental governance, and eco-efficiency, show net environmental benefits as efficiency improvements outweigh infrastructure costs [16]. Infrastructure needs stay limited during this stage, using existing data center capacity or needing modest expansion. The carbon savings from optimization far surpass the additional emissions from infrastructure, resulting in net positive environmental effects. Studies in manufacturing, transportation, agriculture, and energy sectors consistently show this early positive phase [16].
- Phase 2—Rebound Effect (2–5 years): [Evidence Level: Moderate—supported by observed longitudinal and econometric data across multiple sectors and geographies] As AI deployment expands, research uncovers the rebound effect as infrastructure growth outpaces efficiency improvements. As AI adoption broadens beyond initial applications, organizations deploy more models, increase inference frequency, and expand training datasets. One study explicitly identifies a “Digital Rebound Paradox” where theoretical efficiency gains from AI applications are offset by increased consumption, computational demands, and system expansion [16]. Data center capacity additions surpass efficiency gains, hardware refresh cycles speed up to maintain competitive performance, and water use rises due to cooling needs. Beyond a critical threshold of AI intensity, the relationship reverses, and further intensification in highly digitized contexts leads to deteriorated environmental performance and rising emissions [16]. The implementation of AI often triggers Jevons Paradox, a phenomenon where improvements in energy efficiency paradoxically stimulate increased energy consumption [8]. The energy rebound effect is identified as a critical mediating mechanism that amplifies emissions in the early-to-mid stages of AI technology development [8]. Chen et al. [3] project China’s AI carbon footprint will double between 2030 and 2035 despite efficiency advancements, illustrating this rebound pattern. Ren et al. [34] note that between 2020 and 2024, large language model (LLM) scaling increased overall emissions despite per-parameter efficiencies, another sign of rebound. The rebound period poses a key challenge for clean technology efforts. Efficiency improvements plateau while infrastructure demands keep growing, potentially causing negative environmental impacts.
- Phase 3—Mature Optimization (5+ years): [Evidence Level: Indicative—based primarily on modeling projections and conditional extrapolations; limited observed longitudinal data] Long-term maturation can lead to positive outcomes if infrastructure growth stabilizes and system-wide improvements build up. AI technology follows an inverted U-shaped pattern (similar to the Environmental Kuznets Curve), where it initially increases emissions but ultimately facilitates their reduction as the technology develops [8,33]. In the context of AI data centers, projections indicate a sharp rise in carbon footprints reaching a peak in 2038, followed by a significant decline through 2050 [3]. This long-term maturation leads to positive outcomes as data center efficiency improves and clean electricity sources become more prevalent [3]. In High-Income Countries (HICs), which represent a more mature stage of AI development, AI technology is already associated with a nonlinear decline in emissions [8]. Organizations that continue AI deployment through the rebound period can gain significant benefits as optimizations spread across operations. However, reaching this stage requires ongoing commitment during the tough rebound period and depends heavily on local context, renewable energy availability, and proactive mitigation plans. Evidence for Phase 3 results is limited, as most current AI deployments have not yet achieved this level of maturity.
2.5. Geographical Mediators
- Carbon Intensity of Local Grids. The carbon footprint of a data center is directly proportional to the carbon intensity of its location’s electricity mix [49]. Regional electrical grid composition determines whether AI energy consumption translates to high or low carbon emissions. Data centers in regions with 80%+ renewable electricity (e.g., Norway and Switzerland) generate less than 20 g CO2/kWh, while those in coal-dependent regions (e.g., Australia and South Africa) generate over 800 g CO2/kWh—a difference of 40 times those that rely primarily on renewable electricity [49]. This disparity means identical AI workloads produce vastly different carbon footprints based solely on location. Chen et al. [3] demonstrate that China’s AI carbon footprint projection varies widely depending on grid decarbonization speed. Even within the U.S., carbon emissions for the same AI workload can vary significantly between regions like California, West Nebraska, and the Rocky Mountains due to different levels of renewable energy integration [25]. Availability of additional renewable energy capacity determines whether AI deployment drives new fossil fuel generation or absorbs existing renewable surplus. Regions with renewable overcapacity during certain periods (e.g., high solar and wind production) can deploy AI workloads with minimal marginal emissions by utilizing otherwise-curtailed energy. Conversely, regions at grid capacity limits face the opposite scenario: new AI demand necessitates new generation, typically fossil fuel-based due to faster construction timelines.
- Water Availability. Water scarcity determines whether cooling systems create acute environmental stress or manageable impact. AI’s water footprint is exacerbated in water-stressed regions (e.g., Western U.S., India, Australia, parts of China, and the Middle East) where data centers compete with agriculture and domestic needs [19,38]. Estimates suggest global AI demand could account for 4.2 to 6.6 billion cubic meters of water withdrawal by 2027, a burden concentrated in these vulnerable watersheds [38]. Herrera et al. project that AI infrastructure water consumption in water-stressed regions could exceed sustainable withdrawal rates in these areas by 2030 without alternative cooling technologies. Conversely, deployment in water-abundant regions with access to seawater or ample freshwater (Nordic countries, Pacific Northwest) creates minimal scarcity pressure.
- Climate and Thermal Impacts. Geography influences power usage effectiveness (PUE) and cooling costs [3,28]. Ambient temperature and humidity determine the level of cooling energy intensity required. Data centers in cooler climates (e.g., Nordic countries, Canada) can save energy by using free ambient air for up to 60–80% of the year, reducing cooling energy compared to those in hot or humid regions, which will require more electricity and water [19,38,49]. This geographical advantage compounds over years, creating substantial cumulative energy and water savings.
- Socioeconomic Strength. Lower-income countries often adopt advanced AI technologies without the necessary regulatory capacity or digital infrastructure to mitigate environmental costs [16]. In these contexts, AI may follow a linear trajectory of rising emissions rather than the inverted U-shaped pattern (peaking and then declining) observed in mature economies [8]. Strong institutions (e.g., in Germany and Sweden) can use AI to meet decarbonization targets through strict environmental auditing [16]. Empirical panel data analysis across 35 OECD countries confirms that institutional quality, measured by governance effectiveness, regulatory quality, and rule of law, has a significant positive effect on environmental performance, and that without strong institutions and effective energy transition strategies, AI deployment increases rather than reduces carbon emissions [33]. Conversely, in regions with weak governance, AI adoption may occur in extractive or high-emission sectors without oversight, intensifying carbon output, and natural resource depletion [16]. Trade restrictions and export controls on advanced semiconductors can force certain regions to rely on less energy-efficient legacy hardware, which increases the energy footprint of their domestic AI sectors and limits their access to efficiency gains [1].
3. Methodology
3.1. Search Strategy and Data Sources
3.2. Inclusion and Exclusion Criteria
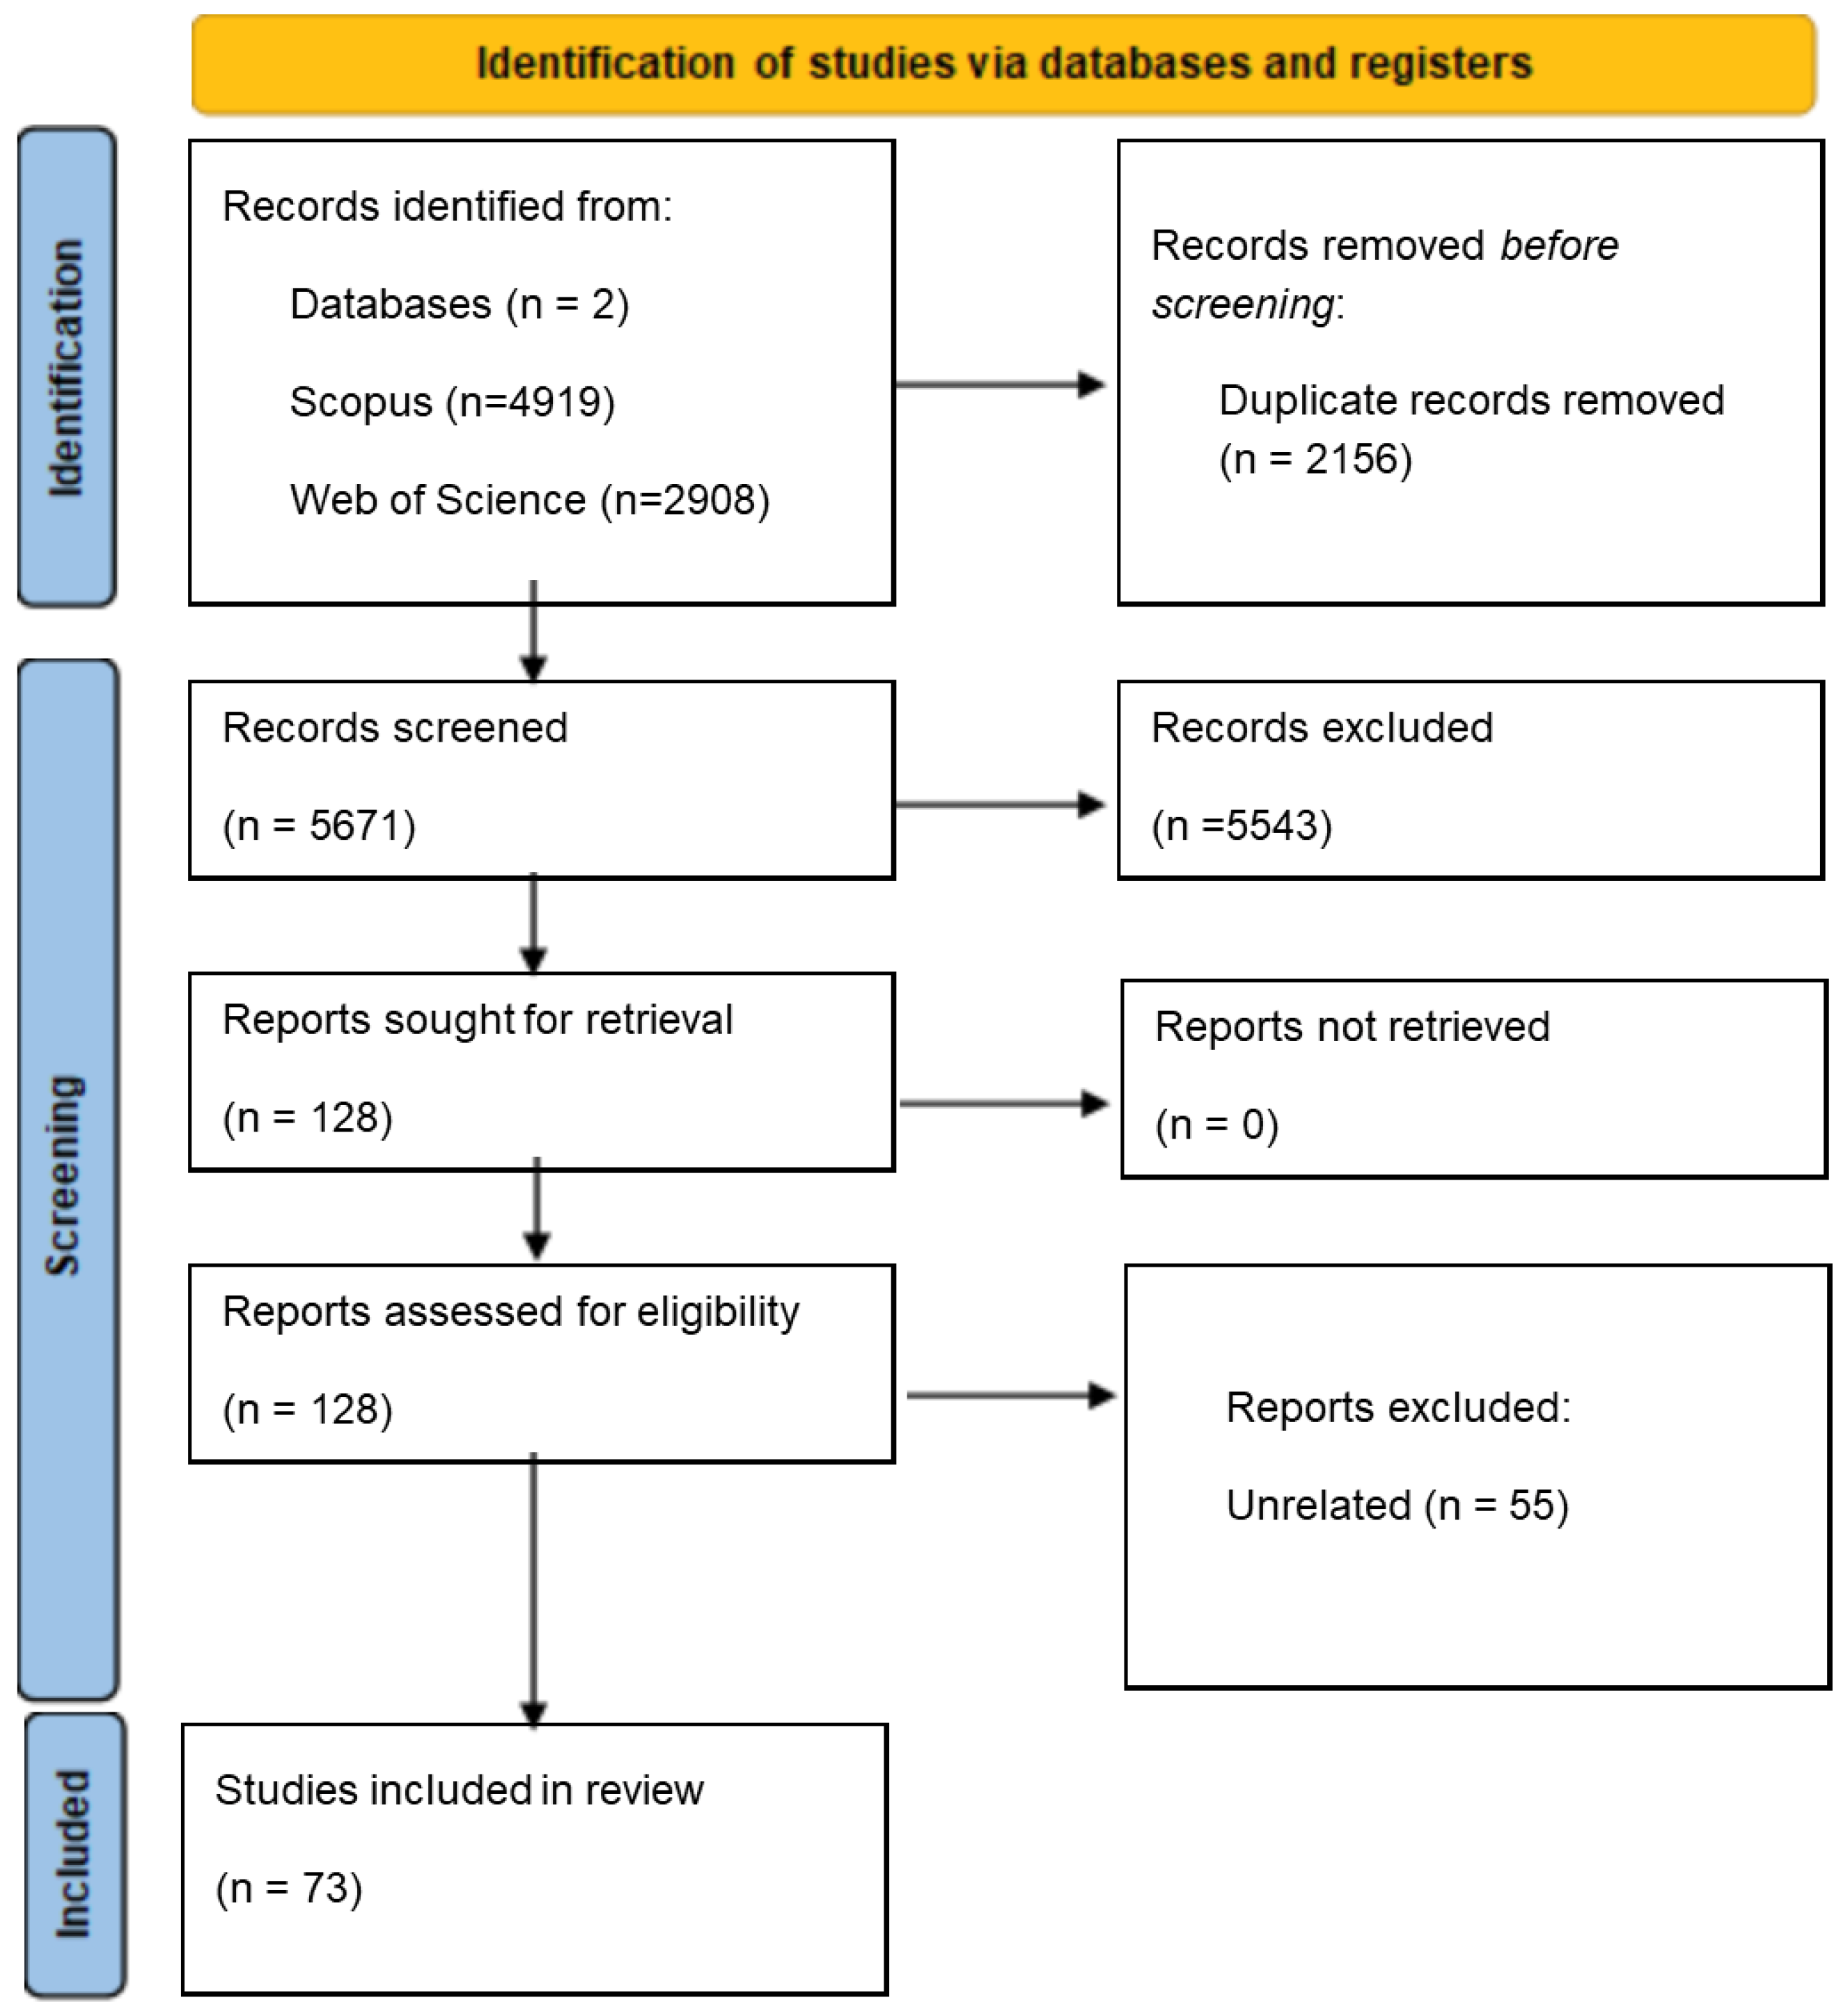
3.3. Article Selection Process
3.4. Framework Development and Validation
- Case 1: Dual Asset assignment (A1 and A2): Ajagekar et al. [6]. This study applies deep reinforcement learning to control greenhouse climate and supplementary lighting, simultaneously yielding measurable reductions in energy consumption (A1) and improvements in crop production outcomes (A2). Initial review considered assigning it solely to A1, as energy optimization is the primary intervention mechanism. However, the study explicitly reports crop yield outcomes alongside energy metrics, providing distinct empirical data for both dimensions. Applying Decision Rule 3 (multi-category assignment), the study was coded to both A1 and A2, with A1 as the primary category.
- Case 2: Asset–Cost intersection (A5 and C1/C2/C3): Kocak et al. [38]. This study examines radiology AI, which simultaneously generates environmental benefits through precision diagnostics that reduce unnecessary procedures and repeat imaging (A5) and imposes environmental costs through the energy demand, cooling water use, and hardware waste of the AI systems supporting those diagnostics (C1, C2, C3). The borderline question was whether the environmental benefit of precision medicine (A5) is sufficiently distinct from the cost burden of the AI system itself. Applying Decision Rule 4 (Asset–Cost intersection), the study was coded to A5, C1, C2, and C3, as both sides are empirically quantified and the study explicitly frames them as a sustainability paradox.
- Case 3: Scope boundary (borderline inclusion): Muhammad et al. [60]. This study investigates the strategic enablers of AI-driven public sector transformation in Nigeria using a Fuzzy DEMATEL model, with leadership commitment, institutional frameworks, and digital infrastructure identified as primary drivers. Because the paper does not directly quantify AI’s environmental footprint or AI-enabled environmental benefits, it represents a boundary case under the revised inclusion criteria. It was retained in the corpus because it contributes measurable data on digital infrastructure requirements in a lower-income country context, directly informing the C4 (Infrastructure Impacts) dimension, and because understanding institutional readiness in such contexts is necessary for the framework’s geographic moderator analysis. Studies of this type were flagged during coding for consensus review, and their primary category assignment (C4) was confirmed by the third reviewer.
3.5. Data Extraction and Synthesis
4. Results: Environmental Asset-Cost Analysis
4.1. The S-Curve Temporal Pattern
4.2. Geographical Disparities in Net Environmental Impact
- Optimal Context (High Renewables and Water Abundance). Nordic countries, the Pacific Northwest U.S., Scotland, and parts of Canada combine renewable electricity, water abundance, and cool climates, enabling free cooling. AI deployments in these regions demonstrate lower carbon footprints and lower water consumption than global averages [19,38]. The S-curve rebound phase is attenuated or eliminated, with some deployments maintaining net environmental benefits throughout the lifecycle [16]. Iceland’s data center sector exemplifies this optimal context: 100% renewable electricity (geothermal and hydro), negligible water stress, and ambient temperatures enabling year-round free cooling [35]. The carbon intensity of electricity is less than 20 gCO2e/kWh in Norway and Switzerland, a carbon footprint roughly 40 times lower than coal-dependent counterparts [49]. Higher renewable energy consumption shifts the turning point of the AI emissions curve to the left, effectively eliminating or shortening the period where AI adoption increases net emissions [8].
- Challenging Context (Fossil-Heavy and Water-Stressed). Parts of the Middle East, Western U.S., Northern China, and India face compounded challenges: >70% fossil fuel electricity, severe water scarcity, and hot climates requiring intensive cooling. China’s data centers are concentrated in northern provinces that experience chronic water scarcity, while India faces high water stress across much of the country [19]. Both regions rely on coal-dominated energy structures [3,15]. Data center hotspots in Arizona and Virginia consume millions of liters of water daily, often in arid climates which make water-intensive evaporative cooling systems ecologically problematic [19]. AI deployments in these regions generate 800–1200 g CO2/kWh and consume 5–9 L water per kWh, creating acute environmental burdens [4,19,25,32,49]. The S-curve rebound phase is amplified and extended, with some scenarios never achieving net environmental benefits even in long-term projections [8,16]. Jha et al. [48] project that data center CO2 emissions will account for 3–14% of the U.S. power sector’s total emissions by 2030, representing a significant hurdle for national climate goals. Due to high water consumption, expected to reach 1006 billion liters annually by 2030, data centers in water-stressed areas like Arizona and Nevada are facing increased public scrutiny and likely will see regulatory constraints on water withdrawals which could lead to costly technology upgrades or facility relocations [48].
- Transition Context (Mixed Grids and Moderate Resources). Eastern U.S., Central Europe, Coastal China, and parts of East Asia occupy middle ground: 40–60% renewable electricity with ongoing transition, moderate water availability, and variable climates. AI deployments in transition regions demonstrate high variability in environmental outcomes depending on specific local conditions, renewable energy procurement strategies, and technology choices [25]. These regions offer potential for accelerated improvement as grid decarbonization progresses, but also risk extended rebound phases if infrastructure growth outpaces grid transformation [1]. Zhang et al. [8] demonstrate that regions coupling AI deployment with dedicated renewable energy procurement can achieve impacts comparable to optimal contexts, while those relying on existing grid mix face impacts approaching challenging contexts.
4.3. Asset Categories: Quantified Environmental Benefits
4.4. Cost Categories: Quantified Environmental Burdens
5. Discussion: Framework Applications for Clean Technology Decision-Making
5.1. Decision Criteria for Sustainable AI Deployment
- Asset Optimization Potential Assessment. Evaluate: (1) What specific efficiency gains are achievable in this application context? (2) What is the baseline energy or resource consumption being optimized? (3) Are optimization opportunities substantial (>20% potential reduction) or marginal (<10%)? (4) What is the projected timeline to realize optimization benefits? Applications with large optimization potential in baseline inefficient systems offer the strongest asset benefits. Evidence for substantial optimization gains (>20%) in baseline-inefficient systems is well-established across sectors: manufacturing [6,9,49,52,64], building energy management [5,17,58], grid integration [7,49,63], and precision agriculture [23,65]. Evidence for marginal-gain scenarios in already-optimized systems is limited to a smaller number of studies and should be treated with caution [31,71]. [Evidence Level: Established for high-baseline systems; Emerging for near-efficiency-frontier systems]. Systems already operating near efficiency frontiers show limited optimization potential, weakening the asset case.
- Cost Burden Assessment. Evaluate: (1) What is the carbon intensity of the local electrical grid (<200 g CO2/kWh favorable, >600 g CO2/kWh challenging)? (2) Is the deployment region water-stressed or water-abundant? (3) What is the expected hardware refresh cycle (longer is better for e-waste reduction)? (4) Can dedicated renewable energy procurement accompany deployment? (5) Are alternative cooling technologies viable? Grid carbon intensity thresholds are supported by observed grid data reported across multiple reviewed studies [25,49], with the <200 gCO2/kWh favorable threshold derived from grid intensity data in optimal deployment regions and the >600 gCO2/kWh challenging threshold from fossil-heavy regional comparisons [49]. Water stress assessments are supported by scenario-based forecasting [19] and U.S. data center analyses [48]. Hardware refresh cycle evidence derives from industry lifecycle data reported in healthcare and general AI hardware studies [30,39]. [Evidence Level: Established for carbon intensity and water stress dimensions; Emerging for combined multi-factor threshold scoring]. High-renewable grids with water abundance and cool climates minimize cost burdens, while fossil-heavy, water-stressed, hot regions maximize burdens.
- Temporal Planning Assessment. Evaluate: (1) When will the rebound effect likely occur based on planned infrastructure scaling? (2) What mitigation strategies can bridge the rebound period? (3) What is the projected timeline to net positive outcomes? (4) Can the organization sustain commitment through the rebound phase? Deployments should include explicit rebound mitigation strategies rather than assuming initial benefits will persist. Phase 1 and Phase 2 timing evidence is supported by observed and econometric data across multiple studies [3,8,16,34,35]. Phase 3 timeline projections (5–7 years to net positive outcomes) are based primarily on modeled projections and are conditional on grid decarbonization and infrastructure stabilization [3,8,33]; organizations should treat these timelines as indicative rather than definitive. [Evidence Level: Moderate for Phase 1–2 timing; Indicative/Emerging for Phase 3 timelines—see Conditions for Phase 3 in Section 2.4.]. Organizations unable to commit to five to seven-year timelines should reconsider deployment or focus on applications with minimal infrastructure growth requirements.
5.2. Regional Deployment Strategies
- Optimal Deployment Regions (Prioritize AI Infrastructure). Characteristics: >70% renewable electricity, water abundance, cool climates enabling free cooling. Examples: Iceland, Norway, Sweden, Finland, Scotland, Pacific Northwest U.S., parts of Canada. Strategy: Maximize AI deployment for optimization applications. Infrastructure investment yields minimal environmental burden while asset benefits remain high. These regions can absorb substantial AI infrastructure growth without environmental degradation. Recommendation: Governments should incentivize data center development and encourage transparent ecological reporting, organizations should prioritize these locations for infrastructure expansion, and clean technology sectors should leverage AI extensively for optimization applications. This recommendation is supported by grid carbon intensity data showing <20 gCO2e/kWh in Nordic regions [49], water footprint scenario analysis confirming low scarcity risk in these geographies [19], and evidence that high renewable energy consumption shifts the AI emissions curve toward earlier net benefits [8,16,33]. [Evidence Level: Established].
- Challenging Deployment Regions (Delay or Constrain AI Infrastructure). Characteristics: >70% fossil fuel electricity, severe water stress, hot climates. Examples: Parts of Middle East, Western U.S. (Nevada, Arizona), Northern China, parts of India. Strategy: Delay AI infrastructure deployment until grid decarbonization substantially progresses or restrict deployment to low-intensity, AI applications with proven optimization benefits exceeding infrastructure costs (as opposed to training massive new models). Recommendation: Organizations should avoid building new AI infrastructure in these regions, governments should implement strict efficiency standards and water use limits, and clean technology priorities should focus on grid decarbonization before AI expansion. This recommendation is supported by China-specific carbon trajectory modeling projecting rebound amplification under fossil-heavy grids [3], U.S. data center emissions projections showing 3–14% of power sector CO2 under high-growth scenarios [48], water footprint forecasting in stressed regions [19], and multi-country empirical evidence that fossil-heavy, institutionally limited contexts may never achieve Phase 3 net benefits [16,33]. [Evidence Level: Established].
- Transition Regions (Strategic Deployment with Renewable Coupling). Characteristics: 40–60% renewable electricity with ongoing transition, moderate water availability. Examples: Eastern U.S., Central Europe, Coastal China, parts of East Asia. Strategy: Deploy AI infrastructure strategically with mandatory renewable energy procurement agreements and advanced cooling technologies. These regions offer variable outcomes depending on specific implementation choices. Recommendation: Require renewable energy procurement for new AI infrastructure, incentivize zero-water cooling technologies, and accelerate grid decarbonization to improve deployment conditions over time. This recommendation draws on evidence that AI workload carbon impact varies significantly by grid mix within the same country [25], that renewable energy coupling demonstrably shifts emission turning points earlier [8], and that regions at transitional grid composition show high variability in outcomes [1,16]. Direct empirical evidence for transition-region outcomes is more limited than for optimal or challenging contexts. [Evidence Level: Emerging—primarily modeled projections and cross-sectional studies; fewer observed longitudinal case studies].
5.3. Mitigating the Rebound Effect
- Renewable Energy Coupling. Ensure AI infrastructure deployment coincides with new renewable energy capacity additions rather than consuming existing renewable supply that could displace fossil generation elsewhere. Temporal matching through battery storage or demand flexibility can align AI workloads with renewable availability periods. Evidence base: multi-country econometric analysis confirming renewable energy consumption as the dominant moderator of the AI-emissions relationship [8,33]; China trajectory modeling showing grid decarbonization as the primary Phase 3 enabler [3]; global assessment linking high-income country emission reductions to renewable energy maturity [16]; AI infrastructure expansion review confirming renewable integration as the critical alignment variable [1]. [Evidence Level: Established for the principle; Emerging for specific implementation mechanisms such as temporal matching and battery storage].
- Energy Consumption Caps. Implement absolute energy consumption limits that prevent infrastructure scaling from overwhelming efficiency gains. Set caps at levels preserving net environmental benefits even during infrastructure expansion. Caps should adjust for validated optimization benefits but maintain absolute limits on infrastructure growth. Evidence base: rebound analysis showing infrastructure scaling consistently outpaces per-unit efficiency gains in the absence of absolute limits [3,16,35]; sustainability budget frameworks proposing analogous cap mechanisms for AI development [71]; digital rebound paradox documentation confirming that efficiency alone does not constrain total consumption [16]. [Evidence Level: Emerging—the principle of caps is supported, but direct empirical evidence of cap effectiveness as an implemented policy is limited in the reviewed corpus].
- Hardware Lifecycle Extension. Design for hardware longevity to delay e-waste impacts and reduce embodied emissions from manufacturing. Target 4–6-year lifecycles rather than 2–3 years through modular upgrades, robust cooling, and conservative utilization. Refurbishment and secondary markets can further extend useful life, though specialized AI hardware presents challenges. Evidence base: reported GPU lifecycle data of 2–3 years versus 4–6 years for traditional servers [39]; semiconductor circularity analysis showing lifecycle extension as the highest-leverage supply chain intervention [30]; circular economy AI architecture frameworks demonstrating resource optimization through extended lifecycle design [11]. [Evidence Level: Emerging—supported by 3 independent studies; direct evidence of lifecycle extension as an implemented organizational strategy is limited].
- Alternative Cooling Technologies. Deploy zero-water cooling (air cooling, immersion cooling in dielectric fluids) or closed-loop systems eliminating evaporative loss in water-stressed regions. Evidence base: scenario-based water footprint forecasting identifying cooling technology choice as the primary lever for reducing AI water consumption [19]; U.S. data center analysis projecting water consumption trajectories under different cooling scenarios [48]. [Evidence Level: Emerging—supported by 2 directly relevant reviewed studies; technical feasibility is established but large-scale deployment evidence is limited].
- Circular Economy Integration. Plan for component reuse and refurbishment from deployment onset rather than as end-of-life afterthought. Design infrastructure for disassembly, establish take-back programs, and create secondary markets for functional components. Evidence base: semiconductor value chain circularity analysis identifying design-for-disassembly and secondary markets as viable strategies [30]; green AI architecture research demonstrating resource reuse integration in AI infrastructure design [11]; Industry 5.0 framework analysis confirming circular economy as a core AI sustainability pathway [66]. [Evidence Level: Emerging—supported by 3 studies; implementation evidence is primarily conceptual/framework-level rather than from observed longitudinal deployments].
Practitioner Monitoring Template
5.4. Measurement and Standardization Needs
- AI Lifecycle Environmental Score (ALES). Develop integrated metric accounting for energy, water, e-waste, material extraction, and infrastructure impacts across the full lifecycle. Current metrics measure individual dimensions in isolation, preventing comprehensive assessment. ALES would weight dimensions by regional scarcity (higher water weight in water-stressed regions, higher carbon weight in fossil-heavy grids) and incorporate temporal dynamics through multi-year projections. This enables comparison across deployment contexts and identification of optimization priorities. The need for integrated lifecycle metrics is supported by evidence that existing single-dimension metrics (PUE, WUE, carbon per inference) consistently fail to capture multi-dimensional and temporal impacts [22,27,28,53,55]. The sustainability budget framework in [71] provides a directly analogous governance model. Carbon tracking tool development [26] and hybrid environmental impact assessment methods [55] demonstrate technical feasibility. [Evidence Level: Established for the need; Emerging for the specific ALES construct, which is proposed here as a synthesis contribution].
- Temporal Impact Disclosure Requirements. Require AI developers and deployers to project S-curve impacts rather than reporting point-in-time snapshots. Disclosures should include (1) Phase 1 optimization benefits with evidence of additionality, (2) Phase 2 infrastructure scaling plans and projected peak impact, (3) Phase 3 mitigation strategies and timeline to net positive outcomes. Phase 3 evidence is more limited and conditional than Phases 1 and 2. This transforms environmental reporting from backward-looking accounting to forward-looking planning, enabling stakeholders to evaluate long-term sustainability rather than current status. Supported by evidence that point-in-time assessments produce systematically misleading conclusions depending on deployment phase [3,16,35] and that practitioners lack forward-looking projection tools [1,53]. Phase 3 projections within any disclosure framework should be explicitly labeled as conditional (see Section 2.4 Conditions for Phase 3). [Evidence Level: Emerging—the principle is well-motivated but no reviewed study directly evaluates the effectiveness of temporal disclosure requirements].
- Geographical Context Reporting Standards. Mandate transparent reporting of grid carbon intensity, water stress indices, and renewable energy procurement for all AI infrastructure. Current voluntary reporting allows selective disclosure that obscures unfavorable conditions. Standardized reporting would enable stakeholders to assess deployment context appropriateness and compare environmental performance across organizations. Reporting should include marginal grid impact (not average grid mix) to capture true environmental consequences of additional demand. Supported by documented carbon intensity variation across deployment regions [25,49], water footprint geographic sensitivity analysis [19], and multi-country empirical evidence that identical AI workloads produce dramatically different outcomes based on location alone [8,16,49]. [Evidence Level: Moderate—well-supported empirically but policy implementation evidence is limited to frameworks rather than observed outcomes].
5.5. Policy Implications and Recommendations
- Location-Based Deployment Incentives. Provide tax incentives, expedited permitting, and infrastructure support for AI facilities in optimal regions (high renewables, water abundance) while implementing disincentives (carbon taxes, water use fees, efficiency mandates) for challenging regions. This aligns private incentives with environmental outcomes and channels infrastructure investment toward sustainable locations. Supported by econometric evidence that institutional quality and energy transition policy are the dominant moderators of whether AI deployment reduces or increases emissions [33], multi-country evidence that high-income countries with strong institutions achieve AI-enabled emission reductions [16], and grid carbon intensity data confirming 40× variation in deployment impact based solely on location [49]. [Evidence Level: Emerging—principle is strongly evidenced; specific incentive mechanism effectiveness has not been empirically tested in the reviewed corpus].
- Renewable Energy Procurement Mandates. Require new AI data centers to procure renewable energy with verified additionality rather than relying on existing grid mix. Procurement should include temporal matching requirements, ensuring AI workloads align with renewable generation periods, not just annual volume matching that allows fossil fuel consumption during renewable scarcity periods. Supported by evidence that renewable energy share is the primary determinant of Phase 3 timing [8,33] and that infrastructure expansion without accompanying renewable capacity additions extends and amplifies the rebound phase [1,3]. [Evidence Level: Emerging—causal mechanism is empirically supported; policy effectiveness evidence is not available in the reviewed corpus].
- Water Use Regulations in Stressed Regions. Implement strict water withdrawal limits and technology requirements for data centers in water-stressed regions. Regulations should mandate zero-water cooling technologies or closed-loop systems, prohibit evaporative cooling expansion, and require water accounting in environmental impact assessments. Water pricing should reflect scarcity value rather than historical cost-recovery rates that subsidize excessive consumption. Supported by scenario-based forecasting projecting AI water demand exceeding sustainable withdrawal rates in stressed regions by 2030 without intervention [19] and U.S. data center analyses showing concentrated consumption in already water-stressed geographies [48]. [Evidence Level: Emerging—supported by 2 directly relevant reviewed studies; limited to forecasting rather than observed regulatory outcomes].
- Extended Producer Responsibility for E-waste. Establish take-back requirements for AI hardware manufacturers and infrastructure operators. Policies should incentivize design for longevity, component reuse, and material recovery rather than the current linear disposal model. Producer responsibility creates economic incentives for lifecycle extension and circular practices currently lacking competitive markets prioritizing performance over sustainability. Supported by semiconductor supply chain circularity analysis demonstrating that current linear disposal economics are the primary barrier to circular material flows [30] and healthcare AI lifecycle analysis documenting accelerated obsolescence cycles as the dominant e-waste driver [39]. [Evidence Level: Emerging—supported by 2 studies; policy mechanism has not been empirically evaluated in the reviewed corpus].
- Temporal Impact Assessment Requirements. Require environmental impact assessments for major AI deployments to project S-curve dynamics rather than static snapshots. Assessments should identify rebound timing, quantify mitigation strategies, and demonstrate a pathway to net environmental benefits. This prevents approval of deployments that appear sustainable based on Phase 1 analysis but create long-term environmental burdens through Phase 2 rebound. Supported by evidence that Phase 1 analyses systematically underestimate long-term environmental costs [3,16,35] and that rebound timing is predictable given infrastructure scaling data [3,16]. Phase 3 outcomes in any assessment should be labeled as conditional projections rather than forecasts. [Evidence Level: Emerging—rationale is empirically supported; regulatory implementation evidence is absent from the reviewed corpus].
5.6. Cross-Category Interactions and Trade-Offs
5.7. Governance and Equity Dimensions: Decision-Relevant Considerations Beyond Scope
5.8. Worked Lifecycle Scoring Example: AI-Optimized HVAC in a Mid-Sized Commercial Building
- Energy cost (C1): Two GPU servers running inference continuously consume approximately 10–15 MWh/year (based on typical server power draw of 1.2–1.7 kW per unit at continuous load). Net energy balance: 100 MWh saved minus ~12 MWh consumed = 88 MWh net annual energy reduction.
- Carbon cost (C1): Depends on grid carbon intensity at deployment site. Using EPA eGRID data for two regional scenarios:
- ◦
- Scenario A (New England ISO, ~170 gCO2e/kWh): Net 88 MWh × 0.170 = ~15 tCO2/year net reduction. AI hardware consumption adds ~2 tCO2/year. Net: ~13 tCO2/year reduction [Evidence Level: Established].
- ◦
- Scenario B (SERC Midwest, ~610 gCO2e/kWh): Gross savings 100 MWh × 0.610 = 61 tCO2/year, hardware consumption adds ~7.3 tCO2/year. Net: ~53.7 tCO2/year reduction—substantially larger in absolute terms but the same AI system represents a higher emissions cost in this context [Evidence Level: Established].
- Water cost (C2): GPU server cooling adds minimal direct water use if air-cooled (~0 L of direct withdrawal). The electricity consumed (12 MWh/year) generates indirect water consumption through power generation: at the U.S. average of ~1.7 L/kWh [19], this adds approximately 20,400 L/year of indirect water use—an order of magnitude less than the direct cooling needs of a data center and unlikely to constitute a meaningful burden at this scale.
- Infrastructure cost (C4): Edge deployment within an existing building adds negligible new construction footprint. No meaningful C4 burden at this scale.
- Supply chain cost (C5): Two GPU servers require an estimated 40,000–60,000 L of ultrapure water in fabrication [19,21] and generate upstream supply chain emissions. Amortized over the 4-year lifecycle, this represents approximately 12,500 L/year in upstream water use—smaller than the direct water savings in many building contexts.
- Scenario A (Low-Carbon Grid—e.g., New England ISO, ~170 gCO2e/kWh):
- ◦
- Net energy saved: 88 MWh/year
- ◦
- Net CO2 impact: approximately 13 tCO2/year reduction
- ◦
- Net water impact: minor indirect addition (~20,400 L/year through electricity generation)
- ◦
- E-waste: minor (~7.5 kg/year amortized)
- ◦
- Supply chain water: minor (~12,500 L/year amortized)
- ◦
- Recommendation: Deploy—net positive across all dimensions
- Scenario B (Mid-Carbon Grid—e.g., SERC Midwest, ~610 gCO2e/kWh):
- ◦
- Net energy saved: 88 MWh/year
- ◦
- Net CO2 impact: approximately 54 tCO2/year reduction—larger in absolute terms, though the AI hardware’s own carbon cost is proportionally higher in this grid context
- ◦
- Net water, e-waste, and supply chain impacts: identical to Scenario A (minor)
- ◦
- Recommendation: Deploy—net positive across all dimensions in both scenarios; the mid-carbon grid actually produces a larger absolute carbon benefit from the same optimization, underscoring that building-scale HVAC AI is low-risk even outside optimal grid contexts
6. Conclusions
6.1. Core Findings and Their Significance
6.2. Actionable Pathways Forward
6.3. Policy and Standardization Imperatives
6.4. Future Research Directions
6.5. Concluding Perspective
Author Contributions
Funding
Data Availability Statement
Conflicts of Interest
Abbreviations
| AI | Artificial Intelligence |
| ALES | AI Lifecycle Environmental Score |
| CEI | Carbon Emission Inequality |
| CO2 | Carbon Dioxide |
| CRM | Critical Raw Materials |
| EU | European Union |
| GHG | Greenhouse Gases |
| GPU | Graphics Processing Unit |
| HIC | High-Income Country |
| ISO | International Organization for Standardization |
| kWh | Kilowatt-hour |
| LLM | Large Language Model |
| ML | Machine Learning |
| MT | Metric Tons |
| MWh | Megawatt-hour |
| PRISMA | Preferred Reporting Items for Systematic Reviews and Meta-Analysis |
| PUE | Power Usage Effectiveness |
| R&D | Research and Development |
| TPU | Tensor Processing Unit |
| TWh | Terawatt-hour |
| U.S. | United States |
| WUE | Water Usage Effectiveness |
Appendix A. Codebook for Framework Coding
Appendix A.1. Purpose and Scope
Appendix A.2. Unit of Analysis
Appendix A.3. Asset Category Definitions and Decision Rules

| Category | Operational Definition | Inclusion Indicators | Exclusion Indicators |
|---|---|---|---|
| A1—Energy Optimization | The study reports measurable reduction in energy consumption achieved through AI-driven monitoring, control, or optimization of an energy-using system (e.g., electrical grid, HVAC, industrial process). | Quantified energy savings (%, kWh, MWh); AI as the active optimization mechanism; outcome measured at system or facility level. | Studies reporting only theoretical efficiency potential without measured outcomes; studies where energy reduction is incidental to a non-energy primary outcome. |
| A2—Production Enhancement | The study reports measurable improvement in output yield, quality, or resource efficiency in a production or agricultural context attributable to AI application. | Quantified yield improvement, waste reduction, or input efficiency gain (e.g., fertilizer, water, material); AI as the decision-support or control mechanism. | Studies focused solely on cost reduction with no environmental metric; studies where production improvement is projected rather than observed. |
| A3—Green Innovation Acceleration | The study reports AI’s role in accelerating the discovery, design, or development of environmentally beneficial technologies, materials, or processes. | Evidence of shortened R&D timelines, AI-assisted materials discovery, or AI-driven design optimization yielding sustainability outcomes. | Studies reporting AI use in general R&D without a sustainability-relevant output; studies measuring only patent counts without empirical environmental outcome data. |
| A4—Resource Conservation | The study reports measurable reduction in consumption or waste of a non-energy natural resource (e.g., water, minerals, raw materials) attributable to AI application. | Quantified reduction in water use, material waste, or resource extraction; AI-enabled circular economy outcomes (e.g., predictive maintenance extending hardware life, optimized reuse). | Studies where resource conservation is secondary and unquantified; studies focused only on energy as a resource (code under A1 instead). |
| A5—Precision Applications | The study reports AI-driven targeted interventions that reduce environmental burden through precision delivery of inputs or services—where specificity itself is the mechanism of environmental benefit. | Evidence of precision agriculture (targeted input application), precision medicine (reduced unnecessary procedures), or infrastructure monitoring (early leak/fault detection) with quantified environmental outcomes. | Studies where AI precision improves economic outcomes only; studies where precision is the delivery mechanism but the environmental benefit is energy-based (consider A1) or resource-based (consider A4). |
Appendix A.4. Cost Category Definitions and Decision Rules
| Category | Operational Definition | Inclusion Indicators | Exclusion Indicators |
|---|---|---|---|
| C1—Energy Consumption | The study reports empirical data on the energy demand of AI systems, including training, inference, or data center operations. | Quantified electricity consumption (kWh, MWh, TWh); power usage effectiveness (PUE) data; energy per inference or per training run. | Studies projecting future energy demand without empirical baseline data; studies reporting only relative efficiency without absolute consumption figures. |
| C2—Water Use | The study reports empirical data on the water consumption of AI infrastructure, including direct cooling use and indirect consumption through electricity generation. | Quantified water withdrawal or consumption (liters, cubic meters); water usage effectiveness (WUE) data; regional water stress analyses tied to data center siting. | Studies mentioning water use qualitatively without measurement; studies focused on water use in AI applications (e.g., irrigation optimization) rather than AI infrastructure. |
| C3—E-Waste Generation | The study reports empirical data on the volume, composition, or rate of electronic waste generated by AI hardware lifecycles, including accelerated obsolescence cycles. | Quantified hardware disposal rates; GPU/TPU lifecycle data; e-waste volumes or recycling rates associated with AI-specific hardware. | Studies reporting general ICT e-waste without AI-specific disaggregation; studies reporting only projected future e-waste without baseline measurement. |
| C4—Infrastructure Impacts | The study reports empirical data on the environmental burden of physical AI infrastructure construction, land use, or facility operations beyond energy and water (e.g., land transformation, habitat disruption, materials use in construction). | Quantified land footprint; construction materials data (steel, concrete, aluminum); biodiversity or ecosystem impact data linked to data center siting or expansion. | Studies reporting only energy or water impacts of infrastructure (code under C1 or C2); studies describing infrastructure qualitatively without measurement. |
| C5—Supply Chain Extraction | The study reports empirical data on the upstream environmental burdens of AI hardware manufacturing, including rare earth and critical mineral mining, semiconductor fabrication, and associated pollution or land degradation. | Quantified mining impacts (water use, toxic waste generation, land disturbance); lifecycle assessment data covering manufacturing phase; supply chain carbon footprint data for AI chips or accelerators. | Studies reporting only end-of-life disposal (code under C3); studies covering general ICT supply chains without AI-specific hardware disaggregation. |
Appendix A.5. Decision Rules for Borderline Cases
Appendix B. Derivation of Key Quantitative Claims
| Figure | Location in Paper | Value | Unit | Source Study | Source Type | Basis/Assumptions |
|---|---|---|---|---|---|---|
| Global AI infrastructure investment | Abstract; Intro §1 | ~$500 billion annually | USD/year | [1] Lal & You 2025 | Contextual background | U.S. Stargate Plan allocation of $500B over 4 years; reported in [1] as policy context |
| Global data left electricity (2022 baseline) | Abstract; Intro §1; §2.3 | 460 TWh | TWh/year | [4] Kshetri 2024 | Contextual background | IEA 2022 estimate for data lefts, cryptocurrencies, and AI combined; reported in [4] |
| Data left electricity projection (2026) | Intro §1; §2.3 | 620–1050 TWh | TWh/year | [3] Chen et al., 2025; [4] Kshetri 2024 | Contextual background | IEA scenario range (low–high deployment rates); reported in [4] |
| Industrial energy savings from AI | Intro §1; §2.2; §4.3 | 30–50% reduction | % energy saved | [4] Kshetri 2024; [5] Dash 2025; [6] Ajagekar et al., 2023 | Mixed: [5,6] reviewed empirical; [4] contextual | Range across sectors; upper bound from optimized systems; lower from grid-level studies |
| LLM training energy (GPT-3) | §2.3; §4.4 | 1287 MWh/550 tCO2eq | MWh per training run; metric tons CO2eq | [49] Bolón-Canedo et al., 2024; [68] Liu & Yin 2024 | Contextual background | Patterson et al. 2021 (external) reported through [49,66]; CO2eq at U.S. average grid (~429 gCO2/kWh) |
| LLM training energy (GPT-4) | §2.3; §4.4 | 7200 MWh | MWh per training run | [4] Kshetri 2024; [49] Bolón-Canedo et al., 2024 | Contextual background | Industry modeling estimate; no direct empirical measurement available in corpus |
| Daily inference energy (major platforms) | §2.3; §4.4 | 260–500 MWh/day | MWh per day | [4] Kshetri 2024; [49] Bolón-Canedo et al., 2024; [68] Liu & Yin 2024 | Contextual background | Industry-scale inference estimates; reported through reviewed studies |
| AI data left vs. traditional energy ratio | §2.3; §4.4 | 3–5× more energy | Ratio | [4] Kshetri 2024; [15] Christensen 2025 | Contextual background | Comparison of GPU-accelerated vs. CPU-based data left PUE and hardware density; reported in [4,15] |
| Global AI data left electricity (2030) | §4.4 | 340–945 TWh/year | TWh/year | [3] Chen et al., 2025; [48] Jha et al., 2025 | Reviewed empirical (projection) | [3]: architectural carbon model for China scaled globally; [48]: U.S. regression model extrapolated to 2030 |
| Cooling water intensity | §2.3; §4.4 | 1.8–12 L/kWh | Liters per kWh | [4] Kshetri 2024; [19] Herrera et al., 2025; [48] Jha et al., 2025 | Mixed: [19] reviewed empirical; [4] contextual | Lower bound: air-cooled/closed loop; upper bound: evaporative cooling in warm climates; WUE range from [19] |
| Single LLM training water consumption | §2.3; §4.4 | ~700,000 L | Liters per training run | [19] Herrera et al., 2025 | Contextual background | Estimate for GPT-3-scale model; includes indirect (electricity generation) and direct cooling; [19] cites Hao 2024 and Bhaskar & Seth 2024 |
| U.S. data left water projection (2030) | §2.3; §4.4 | 1006 billion liters/year | Billion liters/year | [48] Jha et al., 2025 | Reviewed empirical (projection) | On-site water consumption; AI-related data left growth scenario; [48] regression model |
| Global AI water withdrawal (2027) | §2.3 | 4.2–6.6 billion m3 | Billion cubic meters/year | [4] Kshetri 2024; [19] Herrera et al., 2025; [32] Kocak et al., 2025 | Contextual background | Global AI infrastructure growth scenario; reported through reviewed studies from external industry projections |
| GPU lifespan vs. traditional servers | §2.3 | 2–3 years vs. 4–6 years | Years per hardware cycle | [39] Katirai 2024 | Reviewed empirical | Operational lifespans reported in [39] based on industry refresh cycle data |
| Toxic waste from rare earth processing | §2.3; §4.4 | 2000 tons waste per ton ore | Tons toxic waste/ton ore | [21] Le Goff 2025; [39] Katirai 2024 | Contextual background | Environmental assessment figure reported through reviewed studies [21,39]; original source: environmental impact studies of rare earth mining |
| Global e-waste (2022) | §4.4 | 62 million tons | Million metric tons | [13] Pouikli & Tsakalogianni 2025; [15] Christensen 2025 | Contextual background | Global E-waste Monitor 2023 data reported through reviewed studies |
| Global e-waste recycling rate | §2.3 | ~20% properly recycled | % of e-waste volume | [13] Pouikli 2025; [15] Christensen 2025; [39] Katirai 2024 | Contextual background | Global E-waste Monitor reported through reviewed studies |
| Semiconductor manufacturing CO2 (2021) | §4.4 | 76.5 million tCO2eq | Million metric tons CO2eq | [30] Schröder et al., 2025 | Contextual background | Pelcat 2023 estimate reported in [30]; ~79% attributable to scope 3 (supply chain) emissions |
| Ultrapure water per GPU | §2.3; §4.4 | 20,000–30,000 L | Liters per unit | [19] Herrera et al., 2025; [21] Le Goff 2025 | Contextual background | Semiconductor fabrication water intensity; reported through reviewed studies from industry sources |
| Geographic carbon intensity variation | §2.3; §4.2 | <20 vs. >800 gCO2e/kWh | gCO2eq per kWh | [49] Bolón-Canedo et al., 2024 | Reviewed empirical | Grid carbon intensity data: Norway/Switzerland vs. Australia/South Africa; from [49] citing IEA/Ember grid data |
| 10–60× geographic impact multiplier | §4.2 | 10–60× | Ratio | [49] Bolón-Canedo et al., 2024; [19] Herrera et al., 2025 | Framework synthesis | Carbon 40× from grid intensity [49]; compounded with water use multipliers 1.8–12 L/kWh [19]; overall lifecycle impact ratio across optimal vs. challenging contexts |
| China AI carbon trajectory | §4.1 | 82 Mt (2022) → 695 Mt (2038) → 474 Mt (2050) | Million metric tons CO2eq | [3] Chen et al., 2025 | Reviewed empirical (projection) | Architectural carbon model; scenario: moderate grid decarbonization; unit: MtCO2eq/year |
| GPT-4 carbon footprint vs. GPT-3.5 | §4.1 | 21,660 tCO2eq; 12-fold increase | Metric tons CO2eq | [35] Yu et al., 2024 | Reviewed empirical | Measured/estimated training emissions for 79 AI systems (2020–2024); unit: tCO2eq per training run |
| AI service demand growth | §4.1 | 30–40% annually | % year-over-year | [35] Yu et al., 2024 | Reviewed empirical (projection) | Extrapolation from observed 2020–2024 AI adoption trends; [35] |
| U.S. data left CO2 share (2030) | §4.2 | 3–14% of U.S. power sector emissions | % of sector emissions | [48] Jha et al., 2025 | Reviewed empirical (projection) | State-level power mix scenarios; low (3%) = low demand growth; high (14%) = high demand + fossil-heavy grid; [48] |
| Greenhouse energy reduction from AI control | §4.3 | 57% | % energy reduction vs. baseline | [6] Ajagekar et al., 2023 | Reviewed empirical | Direct measurement vs. traditional control in Cornell greenhouse case study; DRL-based controller vs. CEMPC/RMPC baselines |
| Lifecycle carbon from construction/manufacturing | §4.4 | 10–18% of total lifecycle footprint | % of total lifecycle CO2 | [3] Chen et al., 2025 | Reviewed empirical | Architectural carbon model for AI data lefts; embodied carbon from construction and hardware manufacturing |
| ICT sector global GHG share | §2.3 | 3.9% of global GHG | % of global GHG emissions | [7] Handa 2025; [49] Bolón-Canedo et al., 2024 | Contextual background | Freitag et al., 2021 estimate reported through reviewed studies [7,49]; includes all ICT, not AI alone |
Appendix C. Standardized Study Summary
| Ref | First Author (Year) | System Boundary | Primary Unit | AI Workload Type | Geographic Location | Evidence Type | Framework Cells |
|---|---|---|---|---|---|---|---|
| [1] | Lal & You (2025) | AI infrastructure + energy systems | TWh, GtCO2 | LLM/data left infrastructure | Global (U.S. focus) | Review/projection | A1, A3, C1, C2, C5 |
| [2] | Chiroma (2025) | Supercomputer/HPC systems | FLOPS/watt, PUE | HPC/AI training | Global | Observed cross-sectional | C1, C4 |
| [3] | Chen et al. (2025) | AI data lefts (China) | MtCO2eq/year | Data left operations | China | Computational model | C1, C2 |
| [4] | Kshetri (2024) | AI systems lifecycle | TWh, liters/kWh | LLM training & inference | Global | Review/contextual | A1, C1, C2, C3, C5 |
| [5] | Dash (2025) | Enterprise AI systems | % energy reduction, kWh | Enterprise ML inference | Global (U.S.) | Observed empirical | A1, C1 |
| [6] | Ajagekar et al. (2023) | Greenhouse facility | kWh, % reduction | Deep reinforcement learning control | U.S. (Cornell) | Observed empirical | A1, A2, C1 |
| [7] | Handa (2025) | AI systems + climate applications | GtCO2, liters | Climate AI + infrastructure | Global | Review/mixed | A1, A3, C1, C2, C3, C5 |
| [8] | Zhang et al. (2025) | National economy (62 countries) | CO2 emissions index | AI technology index | 62 countries, 1995–2023 | Econometric panel data | A1, C1 |
| [9] | Gandía et al. (2025) | Corporate operations | % efficiency gain | Enterprise AI applications | Spain/Global | Cross-sectional survey | A1, A2, A3, A4 |
| [10] | Nordgren (2023) | AI systems + climate | CO2, energy units | General AI applications | Global | Conceptual/review | A1, A3, C1, C3 |
| [11] | Ranpara (2025) | AI architecture lifecycle | % resource reduction | Circular economy AI | Global | Framework/simulation | A4, C1 |
| [12] | Parimal S. et al. (2025) | AI in mining sector | % efficiency, waste reduction | Predictive maintenance, monitoring AI | Global (mining) | Review/cross-sectional | A4, A5 |
| [13] | Pouikli & Tsakalogianni (2025) | AI systems (EU) | CO2, e-waste volume | General AI deployment | EU | Legal/policy review | C1, C2, C3 |
| [14] | Orrù (2025) | AI model development | Energy per parameter, CO2 | Small data vs. large data AI | Global | Conceptual/review | C1 |
| [15] | Christensen (2025) | Generative AI lifecycle | CO2, e-waste, liters | Generative AI (ChatGPT-3) | Global | Review/conceptual | C1, C2, C3 |
| [16] | Alnafrah (2025) | National AI deployment | CO2 emissions index | AI technology intensity | Global (multi-country) | Econometric panel data | A1, C1 |
| [17] | Ibrahim Alzoubi et al. (2025) | Healthcare AI systems | Energy per inference, CO2 | Diagnostic/clinical AI | Global | Systematic review | A5, C1 |
| [18] | Castellanos-Nieves & García-Forte (2024) | AutoML model development | kWh per model, CO2 | AutoML/hyperparameter optimization | Spain | Observed empirical | A1, C1 |
| [19] | Herrera et al. (2025) | AI data left infrastructure | Liters/kWh, billion m3/year | Data left cooling systems | Global (scenario-based) | Computational model | C2 |
| [20] | Van Der Ven et al. (2024) | Generative AI + social media | CO2 (indirect/behavioral) | Generative AI (indirect impacts) | Global | Conceptual/review | C1 |
| [21] | Le Goff (2025) | AI systems (regulatory lens) | CO2, liters, e-waste | General AI deployment | EU/Global | Legal/policy review | C1, C2, C3 |
| [22] | Chen et al. (2023) | AI/ML development lifecycle | CO2, kWh per model | General ML models | Global | Systematic review | A1, A3, C1 |
| [23] | Alaagib et al. (2025) | AI in agriculture | CO2, % input reduction | Precision agriculture AI | Global (agriculture) | Review/cross-sectional | A2, A5, C1 |
| [24] | Naveed et al. (2025) | Plant disease classification AI | Accuracy/kWh, CO2 per inference | Few-shot learning (ResNet18) | Pakistan/Global | Observed empirical | A2, A5, C1 |
| [25] | Jegadeeswari & Rathipriya (2025) | ML model training | kWh, CO2 per run | Hyperparameter optimization | India | Observed empirical | C1 |
| [26] | Budennyy et al. (2022) | ML model training | kgCO2eq per training run | General ML training | Russia/Global | Observed empirical | C1 |
| [27] | Tabbakh et al. (2024) | AI model lifecycle | kWh, CO2 per model | General AI (Green AI framework) | Global | Framework/review | A1, C1 |
| [28] | Masciari & Napolitano (2025) | AI task execution | CO2eq per task | General AI tasks | Italy/Global | Computational framework | C1 |
| [29] | Zhang et al. (2025) | Petroleum coke processing | CO2, lifecycle sustainability score | ML for chemical process optimization | China | LCA + observed empirical | A2, A3 |
| [30] | Schröder et al. (2025) | Semiconductor chip value chains | MtCO2eq, circularity metrics | AI chip manufacturing & reuse | Global | Review/cross-sectional | A4, C5 |
| [31] | Rizzo (2025) | AI energy lifecycle (LCA) | kWh, CO2, LCA score | AI in energy transition | Italy/Global | LCA/observed empirical | A1, A3, C1 |
| [32] | Tamburrini (2022) | AI carbon footprint | CO2, kWh per model | General AI/ML training | Global | Conceptual/ethical review | C1, C4 |
| [33] | Zhang et al. (2025) | National economy (35 OECD) | CO2 emissions | AI technology index | 35 OECD countries, 1990–2020 | Econometric panel data (AAH) | A1, C1 |
| [34] | Ren et al. (2024) | LLM lifecycle vs. human labor | CO2, kWh, liters, cost | LLM inference vs. human tasks | U.S./India | Lifecycle assessment (LCA) | C1, C2, C3 |
| [35] | Yu et al. (2024) | AI systems (79 models, 2020–2024) | tCO2eq per training run | LLMs and other AI models | Global | Observed cross-sectional | C1, C3, C4 |
| [36] | Onder (2025) | Healthcare AI (planetary health) | CO2, energy, waste | Clinical/diagnostic AI | Global | Conceptual/ethical review | A5, C1 |
| [37] | Girdhar et al. (2025) | Frugal AI systems | Energy per parameter, CO2 | Frugal/edge AI | Global | Review/cross-sectional | A1, C1 |
| [38] | Kocak et al. (2025) | Radiology AI systems | CO2, kWh, e-waste | Deep learning diagnostic AI | Global (radiology) | Review/cross-sectional | A5, C1, C2, C3 |
| [39] | Katirai (2024) | Healthcare AI lifecycle | CO2, liters, e-waste, rare earth | Clinical AI systems | Global (healthcare) | Review/cross-sectional | A5, C1, C2, C3, C5 |
| [40] | Mishra et al. (2025) | LLM supply chain | CO2, energy, supply chain score | Large language models | Global | Delphi/mixed methods | C1, C5 |
| [41] | Leon (2024) | LLM energy demand | kWh, CO2 per model | LLM training & inference | U.S./Global | Review/conceptual | C1 |
| [42] | Hassan & Ibrahim (2025) | National economy (U.S.) | CO2 emissions | AI technology shocks | U.S., 1996–2020 | Econometric (NARDL) | A1, C1 |
| [43] | Mekouar et al. (2025) | Data pipeline operations | CO2 per pipeline run, kWh | Data processing frameworks | Morocco/France | Observed empirical | C1 |
| [44] | Andreou et al. (2025) | Cloud-edge computing | Energy per inference, CO2 | Quantum-inspired optimization AI | Cyprus/Global | Simulation/observed | A1, C1 |
| [45] | Li et al. (2023) | TinyML/edge AI (patents) | CO2, energy per inference | TinyML edge deployment | China/Global | Cross-sectional/patent analysis | A3, C1 |
| [46] | Huang (2024) | Entertainment AI | CO2, kWh per inference | Movie image classification AI | Global | Observed empirical | C1 |
| [47] | Ollivier et al. (2023) | Edge AI hardware | Energy per inference, embodied CO2 | CNN inference at edge | U.S. (Pittsburgh) | Observed empirical | C1, C4 |
| [48] | Jha et al. (2025) | U.S. data lefts | Billion liters/year, MtCO2/year | Data left operations | U.S. | Econometric projection | C1, C4 |
| [49] | Bolón-Canedo et al. (2024) | AI/ML systems lifecycle | gCO2e/kWh, kWh per model | General ML models | Global | Systematic review | A1, C1 |
| [50] | Freihat (2025) | AI in eco-innovation | Eco-innovation index, % improvement | AI-driven green innovation | Global | Systematic review | A3 |
| [51] | Richie (2022) | Healthcare AI lifecycle | CO2, kWh, liters, e-waste | Clinical AI systems | Global (healthcare) | Conceptual/review | A5, C1, C2, C3 |
| [52] | Gaur et al. (2023) | AI for carbon emissions | CO2 reduction, kWh | AI-driven carbon monitoring | Global | System of systems review | A1, A3, C1 |
| [53] | Leuthe et al. (2024) | ML development lifecycle | kWh, CO2 per project | Sustainable ML development | Germany | Interview + case study | A1, C1 |
| [54] | Hasan et al. (2025) | ML model training/inference | kgCO2eq per run | General ML models (2014–2024) | Global | Systematic review | C1 |
| [55] | Borraccia et al. (2025) | AI task execution | CO2eq per task (hybrid metric) | General AI tasks | Italy | Hybrid framework/empirical | C1 |
| [56] | Kindylidi & Cabral (2021) | AI consumer information systems | CO2, kWh | Consumer-facing AI | EU/Global | Legal/conceptual review | A1, C1 |
| [57] | Paula et al. (2025) | Transformer model compression | kWh, CO2 per inference | BERT/transformer compression | U.S. | Observed empirical | C1 |
| [58] | Ali & Al-Boridi (2025) | Green building construction AI | % energy reduction, CO2 | AI-assisted building design | Iraq/Australia | Observed/case study | A1, A2 |
| [59] | Yenugula et al. (2023) | Sustainable AI cloud systems | Energy efficiency score, CO2 | Cloud AI operations | U.S./IT industry | MCDM framework/survey | C1, C4 |
| [60] | Muhammad et al. (2025) | Public sector AI (Nigeria) | Digital infrastructure index | Public sector digital AI | Nigeria | Fuzzy DEMATEL survey | C4 |
| [61] | Richie et al. (2025) | Healthcare AI lifecycle | CO2, kWh, liters, e-waste | Clinical/diagnostic AI | Global (healthcare) | Review/cross-sectional | A5, C1, C2, C3 |
| [62] | Iqbal et al. (2025) | National economy (36 countries) | CO2 emissions | AI technology index | 36 countries, 2000–2021 | Econometric panel data | A1, A3, C1 |
| [63] | Huang et al. (2025) | Hydropower industry | MW output, % efficiency gain | CNN for production optimization | China | Observed empirical | A1, A2 |
| [64] | Ferro et al. (2023) | Decision tree training | kWh, CO2 per training run | Decision tree ML | Brazil | Observed empirical | A1, C1 |
| [65] | Mana et al. (2024) | Precision agriculture | % input reduction, CO2 | Precision agriculture AI | Morocco/Global | Review/cross-sectional | A2, A4, A5 |
| [66] | Martini et al. (2024) | Industry 5.0 AI systems | CO2, circular economy metrics | Human-lefted AI in manufacturing | Italy/Global | Conceptual/review | A3, A4, C1 |
| [67] | Doo et al. (2024) | Medical LLM inference | kWh per inference, CO2 | LLM for medical applications | U.S. (Maryland) | Observed empirical | A5, C1 |
| [68] | Liu & Yin (2024) | LLM training lifecycle | kWh, tCO2eq per training run | LLM training (GPT-scale) | Global | Review/analysis | C1 |
| [69] | Raman et al. (2024) | Green AI research landscape | Publication metrics, CO2 themes | General AI sustainability | Global | Bibliometric review | C1 |
| [70] | Wang et al. (2023) | AI carbon footprint (China) | CO2 emissions, game theory | AI carbon management | China | Evolutionary game model | C1 |
| [71] | Raper et al. (2022) | AI development lifecycle | CO2 budget units, kWh | General AI development | Global | Framework/conceptual | C1, C2 |
| [72] | Gitzel et al. (2024) | Deep learning AI models | CO2eq per training run | Deep learning model training | Germany | Theoretical + experimental | C1 |
| [73] | Kunkel et al. (2023) | AI system lifecycle | CO2, resource use | General AI systems | Germany/Global | Scoping review | C1 |
References
- Lal, A.; You, F. Advances and Challenges in Energy and Climate Alignment of AI Infrastructure Expansion. Adv. Appl. Energy 2025, 20, 100243. [Google Scholar] [CrossRef]
- Chiroma, H. Investigating Supercomputer Performance with Sustainability in the Era of Artificial Intelligence. Appl. Sci. 2025, 15, 8570. [Google Scholar] [CrossRef]
- Chen, Z.-M.; Xiong, Q.; Duan, J.; Ma, J.; Chen, Z.; Guo, S. AI Carbon Footprint in China Sets to Double Post-2030 Carbon Peaking. Energy Econ. 2025, 150, 108880. [Google Scholar] [CrossRef]
- Kshetri, N. The Environmental Impact of Artificial Intelligence. IT Prof. 2024, 26, 9–13. [Google Scholar] [CrossRef]
- Dash, S. Green AI: Enhancing Sustainability and Energy Efficiency in AI-Integrated Enterprise Systems. IEEE Access 2025, 13, 21216–21228. [Google Scholar] [CrossRef]
- Ajagekar, A.; Mattson, N.S.; You, F. Energy-Efficient AI-Based Control of Semi-Closed Greenhouses Leveraging Robust Optimization in Deep Reinforcement Learning. Adv. Appl. Energy 2023, 9, 100119. [Google Scholar] [CrossRef]
- Handa, M. The Double-Edged Sword of AI in Climate Change: Opportunities, Risks, and Responsible Governance. Int. J. Clim. Change Impacts Responses 2025, 17, 47–62. [Google Scholar] [CrossRef]
- Zhang, F.; Wang, Q.; Li, R. How Does Clean Energy Reshape the Relationship between Artificial Intelligence and Carbon Emissions? Evidence from Renewable and Nuclear Energy. Energy Econ. 2025, 149, 108785. [Google Scholar] [CrossRef]
- Gandía, J.A.G.; Ancillo, A.D.L.; Núñez, M.T.D.V. The Role of Artificial Intelligence and Knowledge in Enhancing Corporate Sustainability. J. Innov. Knowl. 2025, 10, 100792. [Google Scholar] [CrossRef]
- Nordgren, A. Artificial Intelligence and Climate Change: Ethical Issues. J. Inf. Commun. Ethics Soc. 2023, 21, 1–15. [Google Scholar] [CrossRef]
- Ranpara, R. Energy-Efficient Green AI Architectures for Circular Economies through Multi-Layered Sustainable Resource Optimization Framework. Discov. Sustain. 2025, 6, 1031. [Google Scholar] [CrossRef]
- Bhambare, P.S.; Kaulage, A.; Darade, M.M.; Murali, G.; Dixit, S.M.; Vali, P.S.N.M.; Chougule, S.M.; Kurhade, A.S.; Mali, C.N. Artificial Intelligence for Sustainable Environmental Management in the Mining Sector: A Review. Appl. Chem. Eng. 2025, 8, 1–22. [Google Scholar] [CrossRef]
- Pouikli, K.; Tsakalogianni, I. AI as an Environmental Challenge: Mapping Safeguards in EU Environmental and Climate Law to Address the ‘Silence’ in the EU AI Act. Eur. Energy Environ. Law Rev. 2025, 34, 25–37. [Google Scholar] [CrossRef]
- Orrù, E. Small Data AI as a More Sustainable Next-Wave AI? Exploring a Potential Sociotechnical Shift Away from the Voracity of Big Data. AI Soc. 2025, 41, 1035–1051. [Google Scholar] [CrossRef]
- Christensen, E. The Socio-Ecological Costs of AI: Toward Socially Responsible and Sustainable Communication Practices. Public Relat. Inq. 2025, 0, 2046147X251377853. [Google Scholar] [CrossRef]
- Alnafrah, I. The Two Tales of AI: A Global Assessment of the Environmental Impacts of Artificial Intelligence from a Multidimensional Policy Perspective. J. Environ. Manag. 2025, 392, 126813. [Google Scholar] [CrossRef]
- Ibrahim Alzoubi, Y.; Topcu, A.E.; Elbasi, E. A Systematic Review and Evaluation of Sustainable AI Algorithms and Techniques in Healthcare. IEEE Access 2025, 13, 139547–139582. [Google Scholar] [CrossRef]
- Castellanos-Nieves, D.; García-Forte, L. Strategies of Automated Machine Learning for Energy Sustainability in Green Artificial Intelligence. Appl. Sci. 2024, 14, 6196. [Google Scholar] [CrossRef]
- Herrera, M.; Xie, X.; Menapace, A.; Zanfei, A.; Brentan, B.M. Sustainable AI Infrastructure: A Scenario-Based Forecast of Water Footprint under Uncertainty. J. Clean. Prod. 2025, 526, 146528. [Google Scholar] [CrossRef]
- Van Der Ven, H.; Corry, D.; Elnur, R.; Provost, V.J.; Syukron, M. Generative AI and Social Media May Exacerbate the Climate Crisis. Glob. Environ. Politics 2024, 24, 9–18. [Google Scholar] [CrossRef]
- Le Goff, T. Environmental Law’s Principles Applied to Artificial Intelligence: A Path towards Regulation. Int. Rev. Law Comput. Technol. 2025, 40, 74–97. [Google Scholar] [CrossRef]
- Chen, Z.; Wu, M.; Chan, A.; Li, X.; Ong, Y.-S. Survey on AI Sustainability: Emerging Trends on Learning Algorithms and Research Challenges. IEEE Comput. Intell. Mag. 2023, 18, 60–77. [Google Scholar] [CrossRef]
- Alaagib, S.B.; Alamri, Y.; Alhashim, J.; M.Alduwais, A.A. The Ecological Footprint of AI: Informing Sustainable Development in Agriculture. J. Exp. Bio Ag. Sci. 2025, 13, 554–563. [Google Scholar] [CrossRef]
- Naveed, F.; Masih, A.; Mahmood, J.; Ahmed, M.; Ali, A.; Saddiqa, A.; Abdulnabi, M.S.H.; Agbozo, E. Sustainable AI for Plant Disease Classification Using ResNet18 in Few-Shot Learning. Array 2025, 26, 100395. [Google Scholar] [CrossRef]
- Jagannadharao, A.; Beckage, N.; Nafus, D.; Chamberlin, S. Timeshifting Strategies for Carbon-Efficient Long-Running Large Language Model Training. Innov. Syst. Softw. Eng. 2025, 21, 517–531. [Google Scholar] [CrossRef]
- Budennyy, S.A.; Lazarev, V.D.; Zakharenko, N.N.; Korovin, A.N.; Plosskaya, O.A.; Dimitrov, D.V.; Akhripkin, V.S.; Pavlov, I.V.; Oseledets, I.V.; Barsola, I.S.; et al. eco2AI: Carbon Emissions Tracking of Machine Learning Models as the First Step Towards Sustainable AI. Dokl. Math. 2022, 106, S118–S128. [Google Scholar] [CrossRef]
- Tabbakh, A.; Al Amin, L.; Islam, M.; Mahmud, G.M.I.; Chowdhury, I.K.; Mukta, M.S.H. Towards Sustainable AI: A Comprehensive Framework for Green AI. Discov. Sustain. 2024, 5, 408. [Google Scholar] [CrossRef]
- Masciari, E.; Napolitano, E.V. An Effective Measure for Evaluating the Environmental Impact of AI Tasks. Computing 2025, 107, 153. [Google Scholar] [CrossRef]
- Zhang, Z.; Wang, Y.; Zhu, M.; Zhao, Z.; Lv, L.; Zhu, H.; Zhang, X.; Zhou, X.; Yan, H.; Yang, C.; et al. Integrating Machine Learning and Life Cycle Sustainability Assessment for Systematic Optimization of Petroleum Coke Oxidation for Hydrogen Residues Processing. Comput. Chem. Eng. 2025, 201, 109231. [Google Scholar] [CrossRef]
- Schröder, P.; Charter, M.; Barrie, J. Circularity of Semiconductor Chip Value Chains: Advancing AI Sustainability Amid Geopolitical Tensions. J. Circ. Econ. 2025, 2. [Google Scholar] [CrossRef]
- Rizzo, S.A. To Be Artificial Intelligence for Sustainability or Not to Be Sustainable Artificial Intelligence. Renew. Sustain. Energy Rev. 2025, 223, 116063. [Google Scholar] [CrossRef]
- Tamburrini, G. The AI Carbon Footprint and Responsibilities of AI Scientists. Philosophies 2022, 7, 4. [Google Scholar] [CrossRef]
- Zhang, A.; Chen, R. The Paradox of Artificial Intelligence and Environmental Performance: The Critical Role of Energy Transition and Institutional Quality. J. Environ. Manag. 2025, 394, 127330. [Google Scholar] [CrossRef] [PubMed]
- Ren, S.; Tomlinson, B.; Black, R.W.; Torrance, A.W. Reconciling the Contrasting Narratives on the Environmental Impact of Large Language Models. Sci. Rep. 2024, 14, 26310. [Google Scholar] [CrossRef] [PubMed]
- Yu, Y.; Wang, J.; Liu, Y.; Yu, P.; Wang, D.; Zheng, P.; Zhang, M. Revisit the Environmental Impact of Artificial Intelligence: The Overlooked Carbon Emission Source? Front. Environ. Sci. Eng. 2024, 18, 158. [Google Scholar] [CrossRef]
- Onder, O. Planetary Health in the Age of Artificial Intelligence: A Structural–Ethical Inquiry into Sustainable AI in Healthcare. AI Soc. 2025. [Google Scholar] [CrossRef]
- Girdhar, N.; Raj, A.; Sharma, D.; Singh, V.; Doucet, A.; Renz, M. A Comprehensive Review of Frugal Artificial Intelligence: Challenges, Applications, and the Road to Sustainable AI. Soft Comput. 2025, 29, 4823–4856. [Google Scholar] [CrossRef]
- Kocak, B.; Ponsiglione, A.; Romeo, V.; Ugga, L.; Huisman, M.; Cuocolo, R. Radiology AI and Sustainability Paradox: Environmental, Economic, and Social Dimensions. Insights Imaging 2025, 16, 88. [Google Scholar] [CrossRef]
- Katirai, A. The Environmental Costs of Artificial Intelligence for Healthcare. Asian Bioeth. Rev. 2024, 16, 527–538. [Google Scholar] [CrossRef]
- Mishra, V.; Saxena, D.; Gupta, K.; Patni, S.; Singh, A.K. Sustainability in Large Language Model Supply Chains: Insights and Recommendations Using Analysis of Utility for Affecting Factors. Sci. Rep. 2025, 15, 33524. [Google Scholar] [CrossRef]
- Leon, M. The Escalating AI’s Energy Demands and the Imperative Need for Sustainable Solutions. WSEAS Trans. Syst. 2024, 23, 444–457. [Google Scholar] [CrossRef]
- Hassan, A.; Ibrahim, R.L. Driving Toward Carbon Neutrality in United States: Do Artificial Intelligence Shocks, Energy Policy Uncertainty, Green Growth, and Regulatory Quality Matter? SAGE Open 2025, 15, 21582440251359735. [Google Scholar] [CrossRef]
- Mekouar, Y.; Lahmer, M.; Karim, M. Optimizing Data Pipelines for Green AI: A Comparative Analysis of Pandas, Polars, and PySpark for CO2 Emission Prediction. Computers 2025, 14, 319. [Google Scholar] [CrossRef]
- Andreou, A.; Mavromoustakis, C.X.; Markakis, E.K.; Bourdena, A.; Mastorakis, G. Sustainable AI with Quantum-Inspired Optimization: Enabling End-to-End Automation in Cloud-Edge Computing. IEEE Access 2025, 13, 54622–54635. [Google Scholar] [CrossRef]
- Li, T.; Luo, J.; Liang, K.; Yi, C.; Ma, L. Synergy of Patent and Open-Source-Driven Sustainable Climate Governance under Green AI: A Case Study of TinyML. Sustainability 2023, 15, 13779. [Google Scholar] [CrossRef]
- Huang, P. Decoding Emotions: Intelligent Visual Perception for Movie Image Classification Using Sustainable AI in Entertainment Computing. Entertain. Comput. 2024, 50, 100696. [Google Scholar] [CrossRef]
- Ollivier, S.; Li, S.; Tang, Y.; Cahoon, S.; Caginalp, R.; Chaudhuri, C.; Zhou, P.; Tang, X.; Hu, J.; Jones, A.K. Sustainable AI Processing at the Edge. IEEE Micro 2023, 43, 19–28. [Google Scholar] [CrossRef]
- Jha, R.; Jha, R.; Islam, M. Forecasting US Data Center CO2 Emissions Using AI Models: Emissions Reduction Strategies and Policy Recommendations. Front. Sustain. 2025, 5, 1507030. [Google Scholar] [CrossRef]
- Bolón-Canedo, V.; Morán-Fernández, L.; Cancela, B.; Alonso-Betanzos, A. A Review of Green Artificial Intelligence: Towards a More Sustainable Future. Neurocomputing 2024, 599, 128096. [Google Scholar] [CrossRef]
- Freihat, L. The Relation between Artificial Intelligence (AI), Eco Innovation (EI) and Green Innovation (GI) and Effects on Sustainability. MATEC Web Conf. 2025, 413, 10004. [Google Scholar] [CrossRef]
- Richie, C. Environmentally Sustainable Development and Use of Artificial Intelligence in Health Care. Bioethics 2022, 36, 547–555. [Google Scholar] [CrossRef]
- Gaur, L.; Afaq, A.; Arora, G.K.; Khan, N. Artificial Intelligence for Carbon Emissions Using System of Systems Theory. Ecol. Inform. 2023, 76, 102165. [Google Scholar] [CrossRef]
- Leuthe, D.; Meyer-Hollatz, T.; Plank, T.; Senkmüller, A. Towards Sustainability of AI—Identifying Design Patterns for Sustainable Machine Learning Development. Inf. Syst. Front. 2024, 26, 2103–2145. [Google Scholar] [CrossRef]
- Hasan, S.M.; Islam, T.; Saifuzzaman, M.; Ahmed, K.R.; Huang, C.-H.; Shahid, A.R. Carbon Emission Quantification of Machine Learning: A Review. IEEE Trans. Sustain. Comput. 2025, 10, 1085–1102. [Google Scholar] [CrossRef]
- Borraccia, S.; Masciari, E.; Napolitano, E.V. Green Metrics for AI: A Hybrid Strategy for Environmental Impact Assessment. Array 2025, 28, 100528. [Google Scholar] [CrossRef]
- Kindylidi, I.; Cabral, T.S. Sustainability of AI: The Case of Provision of Information to Consumers. Sustainability 2021, 13, 12064. [Google Scholar] [CrossRef]
- Paula, E.; Soni, J.; Upadhyay, H.; Lagos, L. Comparative Analysis of Model Compression Techniques for Achieving Carbon Efficient AI. Sci. Rep. 2025, 15, 23461. [Google Scholar] [CrossRef]
- Ali, S.M.; Al-Boridi, O.A. Artificial Intelligence-Enhanced Green Building Design for Environmental Sustainability. Fusion Pract. Appl. 2025, 17, 197–210. [Google Scholar] [CrossRef]
- Yenugula, M.; Goswami, S.S.; Kaliappan, S.; Saravanakumar, R.; Alasiry, A.; Marzougui, M.; AlMohimeed, A.; Elaraby, A. Analyzing the Critical Parameters for Implementing Sustainable AI Cloud System in an IT Industry Using AHP-ISM-MICMAC Integrated Hybrid MCDM Model. Mathematics 2023, 11, 3367. [Google Scholar] [CrossRef]
- Muhammad, A.S.; Hammed, S.; Shishah, W.; Isiaku, L. Strategic Enablers of Sustainable AI-Driven Public Service Transformation in Nigeria: A Fuzzy DEMATEL-Based Model. Technol. Sustain. 2025, 4, 380–401. [Google Scholar] [CrossRef]
- Richie, C.; Hinrichs-Krapels, S.; Dobbe, R.; French, P.; Wei, J.C.J.; Diehl, J.C.; Kong, R. Environmental Impacts of Artificial Intelligence in Health Care: Considerations and Recommendations. Health Technol. 2025, 15, 1087–1093. [Google Scholar] [CrossRef]
- Iqbal, A.; Zhang, W.; Jahangir, S. Building a Sustainable Future: The Nexus Between Artificial Intelligence, Renewable Energy, Green Human Capital, Geopolitical Risk, and Carbon Emissions Through the Moderating Role of Institutional Quality. Sustainability 2025, 17, 990. [Google Scholar] [CrossRef]
- Huang, J.; Zheng, P.; Hu, X.; Chen, W.; Geng, Z.; Chu, C.; Han, Y. Power Generation Efficiency and Resources Saving of the Hydropower Industry Using the Extended Data Based Convolutional Neural Network. Renew. Energy 2025, 243, 122541. [Google Scholar] [CrossRef]
- Ferro, M.; Silva, G.D.; De Paula, F.B.; Vieira, V.; Schulze, B. Towards a Sustainable Artificial Intelligence: A Case Study of Energy Efficiency in Decision Tree Algorithms. Concurr. Comput. 2023, 35, e6815. [Google Scholar] [CrossRef]
- Mana, A.; Allouhi, A.; Hamrani, A.; Rehman, S.; el Jamaoui, I.; Jayachandran, K.; Mana, A.A.; Allouhi, A.; Hamrani, A.; Rehman, S.; et al. Sustainable AI-Based Production Agriculture: Exploring AI Applications and Implications in Agricultural Practices. Smart Agric. Technol. 2024, 7, 100416. [Google Scholar] [CrossRef]
- Martini, B.; Bellisario, D.; Coletti, P. Human-Centered and Sustainable Artificial Intelligence in Industry 5.0: Challenges and Perspectives. Sustainability 2024, 16, 5448. [Google Scholar] [CrossRef]
- Doo, F.X.; Savani, D.; Kanhere, A.; Carlos, R.C.; Joshi, A.; Yi, P.H.; Parekh, V.S. Optimal Large Language Model Characteristics to Balance Accuracy and Energy Use for Sustainable Medical Applications. Radiology 2024, 312, e240320. [Google Scholar] [CrossRef]
- Liu, V.; Yin, Y. Green AI: Exploring Carbon Footprints, Mitigation Strategies, and Trade-offs in Large Language Model Training. Discov. Artif. Intell. 2024, 4, 49. [Google Scholar] [CrossRef]
- Raman, R.; Pattnaik, D.; Lathabai, H.H.; Kumar, C.; Govindan, K.; Nedungadi, P. Green and Sustainable AI Research: An Integrated Thematic and Topic Modeling Analysis. J. Big Data 2024, 11, 55. [Google Scholar] [CrossRef]
- Wang, X.; Ji, K.; Xie, T. AI Carbon Footprint Management with Multi-Agent Participation: A Tripartite Evolutionary Game Analysis Based on a Case in China. Sustainability 2023, 15, 9013. [Google Scholar] [CrossRef]
- Raper, R.; Boeddinghaus, J.; Coeckelbergh, M.; Gross, W.; Campigotto, P.; Lincoln, C.N. Sustainability Budgets: A Practical Management and Governance Method for Achieving Goal 13 of the Sustainable Development Goals for AI Development. Sustainability 2022, 14, 4019. [Google Scholar] [CrossRef]
- Gitzel, R.; Platenius-Mohr, M.; Burger, A. Estimating the Sustainability of AI Models Based on Theoretical Models and Experimental Data. TechRxiv 2024. [Google Scholar] [CrossRef]
- Kunkel, S.; Schmelzle, F.; Niehoff, S.; Beier, G. More Sustainable Artificial Intelligence Systems through Stakeholder Involvement? GAIA—Ecol. Perspect. Sci. Soc. 2023, 32, 64–70. [Google Scholar] [CrossRef]

| COSTS | ||||||
|---|---|---|---|---|---|---|
| Energy Consumption | Water Use | E-Waste Generation | Infrastructure Impacts | Supply Chain | ||
| ASSETS | 1. Energy Optimization | AI-driven smart grids and demand response reduce energy use but require computational energy for model training and inference [9,15,36,37]. | Building Heating, Ventilation, and Air Conditioning (HVAC) optimization reduces energy and associated water for electricity generation, but AI infrastructure cooling consumes water [4,14,19,21,34]. | Smart grid optimization extends equipment life through predictive maintenance while requiring specialized hardware with short lifecycles [7,9,12,15,38,39,40,41,42]. | Distributed optimization reduces need for generation capacity but requires edge computing infrastructure deployment [1,5,7,12,17,25,37,38,43,44,45]. | Energy optimization reduces overall demand on supply chains while extraction of rare earth metals for GPUs and AI chip manufacturing creates upstream extraction burdens [7,9,11,12,14,39,40,41,46]. |
| 2. Production Enhancement | Increased computational demands in manufacturing optimization [2,6,29,35]. | Water use in cooling intensive computation for production AI. Precision agriculture cuts irrigation yet AI infrastructure for farm optimization uses cooling water [4,14,15,19,21,23]. | Process optimization extends equipment lifecycles through predictive maintenance while AI hardware faces rapid obsolescence [7,9,12,30,38]. | Production efficiency reduces industrial facility footprint but requires data center infrastructure for optimization algorithms [1,36,46,47,48,49,50]. | Manufacturing optimization reduces material extraction through waste reduction while AI chips require rare earth mining [9,11,14,15,23,39,46,51]. | |
| 3. Green Innovation | Energy consumed in Research and Development (R&D) and training of new AI models for sustainability. AI accelerates renewable energy tech development, but discovery process requires substantial computational energy [1,4,14,35,49,52]. | Materials discovery for water-efficient technologies proceeds faster with AI while discovery infrastructure consumes cooling water [4,13,19,31]. | AI accelerates circular economy solutions but creates waste from discarded experimental hardware [4,9,22,23,40,46]. | Clean tech R&D acceleration enabled by AI reduces long-term infrastructure needs but requires immediate research computing capacity [3,13,16,31,37,49,53,54]. | Supply chain impacts from new hardware fabrication [23,30,39,40,47]. | |
| 4. Resource Conservation | Energy for AI models optimizing natural resource use (e.g., water, minerals) [4,7,13,14,27,31,55]. | AI-enabled smart irrigation and leak detection reduces water system losses while infrastructure consumes electricity and associated water [19,37,49]. | AI optimizes refurbishment timing extending hardware life, yet AI systems themselves face rapid obsolescence [12,15,30,37,38,48,51,56,57]. | Infrastructure such as IoT sensor networks for resource monitoring [11,14,45,58,59,60]. | Supply chain optimization reduces transportation emissions while AI chip supply chains generate upstream burdens [4,9,37]. | |
| 5. Precision Applications | Medical AI reduces unnecessary procedures lowering healthcare energy footprint but requires diagnostic computing infrastructure [17,38,51]. | Infrastructure monitoring prevents water losses through early leak detection while monitoring systems require electricity and cooling [4,12,13,17,19,23,42,45,46]. | Precision medicine extends equipment life through optimal maintenance while medical AI systems face technology turnover [14,15,23,37,38,51,61]. | Targeted interventions reduce overall facility needs but require edge computing deployment for real-time analysis [9,36,44,47]. | Precision agriculture reduces fertilizer production demand through targeted application while agricultural AI requires chip manufacturing [9,23,24,46,62]. | |
| Phase | Study Type | Representative Studies | Time Horizon | Evidence Level |
|---|---|---|---|---|
| Phase 1: Initial Optimization | Cross-sectional empirical; econometric | [8,16,33,42,62] | 1990–2023 | Moderate |
| Phase 1: Initial Optimization | Observed sector-level | [6,63,65] | 2021–2025 | Moderate |
| Phase 2: Rebound Effect | Observed longitudinal | [3,34,35] | 2020–2024 | Moderate |
| Phase 2: Rebound Effect | Econometric projection | [8,16] | 1995–2023 | Moderate |
| Phase 3: Mature Optimization | Computational model/simulation | [3] | 2025–2050 | Indicative |
| Phase 3: Mature Optimization | Econometric projection (conditional) | [8,33] | 1990–2020 | Indicative |
| Geographic Context | Grid Carbon Intensity | Water Stress | Cooling Climate | Net Carbon Impact | Net Water Impact | Phase 3 Likelihood | Representative Region |
|---|---|---|---|---|---|---|---|
| High-renewable/water-abundant | <20 gCO2e/kWh | Low | Cool (free cooling viable) | Strongly positive | Minimal burden | High | Iceland, Norway, Pacific NW U.S. |
| Transitioning grid/moderate resources | 200–500 gCO2e/kWh | Moderate | Temperate | Variable—depends on procurement | Moderate | Moderate (conditional) | Eastern U.S., Central Europe |
| Fossil-heavy/water-stressed | >700 gCO2e/kWh | High | Hot (intensive cooling required) | Strongly negative | Acute burden | Low to none | Northern China, Arizona, parts of India |
| Dimension | Category | n | Key Supporting Studies (Selected) |
|---|---|---|---|
| Asset | A1: Energy Optimization | 25 | [1,4,5,6,7,8,9,10,16,18,22,27,33,37,42,44,49,52,53,56,58,62,63,64] |
| A2: Production Enhancement | 8 | [6,9,23,24,29,58,63,65] | |
| A3: Green Innovation Acceleration | 12 | [1,7,9,10,22,29,32,45,50,52,62,66] | |
| A4: Resource Conservation | 6 | [9,11,12,30,65,66] | |
| A5: Precision Applications | 11 | [12,17,23,24,36,38,39,51,61,65,67] | |
| Cost | C1: Energy Consumption | 63 | [1,2,3,4,5,6,7,8,10,11,13,14,15,16,17,18,20,21,22,23,24,25,26,27,28,35,36,38,39,40,41,42,43,44,45,46,47,48,49,51,52,53,54,55,56,57,59,61,62,64,66,67,68,69,70,71,72,73] |
| C2: Water Use | 14 | [1,3,4,7,13,15,19,21,34,38,39,51,61,71] | |
| C3: E-Waste Generation | 12 | [4,7,10,13,15,21,34,35,38,39,51,61] | |
| C4: Infrastructure Impacts | 7 | [2,32,35,47,48,59,60] | |
| C5: Supply Chain Extraction | 6 | [1,4,7,30,39,40] | |
| Total assignments | 164 | Average 2.2 categories per study |
| Metric | Unit | Monitoring Frequency | Measurement Approach | Public Data Sources | Alert Threshold |
|---|---|---|---|---|---|
| Energy consumption per inference unit | kWh per 1000 inferences | Monthly | Measure total data center electricity consumption; divide by inference volume from application logs | Utility smart meter data; cloud provider dashboards (AWS, Azure, GCP energy reports) | >10% increase month-over-month without corresponding inference volume growth signals rebound onset |
| Water use effectiveness (WUE) | Liters per kWh of IT load | Quarterly | Measure total cooling water withdrawal; divide by IT equipment energy load | Facility water utility bills; The Green Grid WUE benchmarks; EPA WaterSense data for regional baseline | WUE >2.0 L/kWh in water-stressed regions warrants cooling technology review |
| E-waste per replacement cycle | kg hardware retired per active server | Annually | Track hardware decommissioned vs. hardware deployed; calculate ratio | Asset management records; EPA Electronics Challenge data; manufacturer take-back program records | Hardware retirement cycles shorter than 48 months signal accelerating obsolescence |
| Grid carbon intensity at deployment site | gCO2eq per kWh | Monthly (or real-time where available) | Query regional grid operator for current carbon intensity of electricity supply | U.S.: EPA eGRID database; EU: Electricity Maps (electricitymaps.com); Global: IEA Electricity Data Explorer | >400 gCO2e/kWh warrants renewable procurement review; >700 gCO2e/kWh signals misalignment with net benefit deployment conditions |
| Efficiency gain per operational unit | % reduction in target resource (energy, water, fertilizer, etc.) vs. pre-AI baseline | Quarterly | Compare target resource consumption pre- and post-AI deployment; normalize for output volume changes | Application-specific operational records; industry benchmarks from sector associations | If efficiency gains fall below 10% while infrastructure energy/water costs rise, deployment has entered rebound territory |
| Section | Recommendation | Supporting Studies | Evidence Level |
|---|---|---|---|
| 5.1 | Deploy AI where asset optimization potential exceeds 20% in baseline-inefficient systems | [5,6,9,23,49,52,64,65] | Established |
| 5.1 | Evaluate grid carbon intensity (<200 g CO2/kWh favorable; >600 g CO2/kWh challenging) before deployment | [25,49] | Established |
| 5.1 | Evaluate water stress index and cooling technology options before deployment | [19,48] | Established |
| 5.1 | Plan for 5–7 year commitment including explicit rebound mitigation | [3,8,16] | Indicative (Phase 3 conditional) |
| 5.2 | Prioritize AI infrastructure in optimal regions (>70% renewable, water-abundant, cool climates) | [8,16,19,33,49] | Established |
| 5.2 | Delay AI infrastructure in challenging regions until grid decarbonization advances | [3,16,19,33,48] | Established |
| 5.2 | In transition regions, mandate renewable procurement and advanced cooling with deployment | [1,8,25] | Emerging |
| 5.3 | Couple AI infrastructure with new renewable capacity additions | [1,3,8,16,33] | Established (principle); Emerging (mechanism) |
| 5.3 | Implement absolute energy consumption caps to prevent rebound scaling | [3,16,35,71] | Emerging |
| 5.3 | Extend hardware lifecycles to 4–6 years through modular design | [11,30,39] | Emerging |
| 5.3 | Deploy zero-water or closed-loop cooling in water-stressed regions | [19,48] | Emerging |
| 5.3 | Integrate circular economy design from deployment onset | [11,30,66] | Emerging |
| 5.4 | Develop integrated AI Lifecycle Environmental Score (ALES) | [22,26,27,28,53,55,71] | Established (need); Emerging (construct) |
| 5.4 | Require temporal S-curve disclosure rather than point-in-time reporting | [3,16,35,53] | Emerging |
| 5.4 | Mandate geographic context reporting (grid intensity, water stress, renewable procurement) | [8,19,25,49] | Moderate |
| 5.5 | Location-based deployment incentives aligned with renewable grid availability | [16,33,49] | Emerging |
| 5.5 | Renewable procurement mandates with verified additionality | [1,3,8,33] | Emerging |
| 5.5 | Water withdrawal limits and zero-water technology requirements in stressed regions | [19,48] | Emerging |
| 5.5 | Extended producer responsibility for AI hardware e-waste | [30,39] | Emerging |
| 5.5 | Temporal impact assessment requirements for major AI deployments | [3,16,35] | Emerging |
Disclaimer/Publisher’s Note: The statements, opinions and data contained in all publications are solely those of the individual author(s) and contributor(s) and not of MDPI and/or the editor(s). MDPI and/or the editor(s) disclaim responsibility for any injury to people or property resulting from any ideas, methods, instructions or products referred to in the content. |
© 2026 by the authors. Licensee MDPI, Basel, Switzerland. This article is an open access article distributed under the terms and conditions of the Creative Commons Attribution (CC BY) license.
Share and Cite
Wheeler, M.R.; Everett, B.; Prybutok, V. Navigating the Environmental Paradox of AI: A Decision Framework for Clean Technology Practitioners. Clean Technol. 2026, 8, 51. https://doi.org/10.3390/cleantechnol8020051
Wheeler MR, Everett B, Prybutok V. Navigating the Environmental Paradox of AI: A Decision Framework for Clean Technology Practitioners. Clean Technologies. 2026; 8(2):51. https://doi.org/10.3390/cleantechnol8020051
Chicago/Turabian StyleWheeler, Megan Rand, Brandi Everett, and Victor Prybutok. 2026. "Navigating the Environmental Paradox of AI: A Decision Framework for Clean Technology Practitioners" Clean Technologies 8, no. 2: 51. https://doi.org/10.3390/cleantechnol8020051
APA StyleWheeler, M. R., Everett, B., & Prybutok, V. (2026). Navigating the Environmental Paradox of AI: A Decision Framework for Clean Technology Practitioners. Clean Technologies, 8(2), 51. https://doi.org/10.3390/cleantechnol8020051