3.1. Adhesive Raw Materials Characterization
Raw material characterization was conducted to identify the relationship between raw materials and the combination of tannin extracts used for adhesive manufacturing. Raw materials tested for characteristics included MDI, polyols, and PVOH/tannin.
Table 3 shows an analysis of the essential characteristics of the adhesive raw materials.
The types of tannins in this study include condensed tannins, with an extraction yield of 30% from two extraction processes. The tannin liquid extract, obtained using distilled water as solvent, is dark brown. Therefore, when colorless PVOH is mixed with tannin extract, the resulting color is also dark brown [
13].
PU is a polymer that contains a thermosetting functional urethane group [
14]. Urethane groups are formed by the reaction between isocyanate and hydroxyl groups [
15]. Polyols and MDI are standard materials used to form urethane functional groups in PU [
16]. Polyol is an organic compound containing multiple hydroxyl groups and is commonly used as a base material in polyurethane production. Meanwhile, MDI is a diisocyanate compound widely used in commercial applications due to its high reactivity. The viscosity values of standard materials indicate their ability to flow on a surface, meaning that even slight variations in viscosity can influence the properties of the resulting adhesive [
17].
Table 3 shows the viscosity data for MDI, polyol, and PVOH/tannin, which are 200.356 mPa·s, 126.916 mPa·s, and 1185.35 mPa·s, respectively.
Viscosity plays a crucial role in the bonding process. High viscosity allows better penetration into the wet and deep pores of the wood surface. Conversely, if the viscosity of the material or adhesive is too low, it may penetrate excessively into the pores, reducing bonding strength [
18]. PVOH/tannin material hardens more quickly than MDI and polyols. This occurs because the viscosity of the PVOH/tannin mixture is significantly higher than that of MDI and polyol. Adhesives with high viscosity tend to have a shorter shelf life due to their fast hardening process, which can negatively affect their overall quality [
19].
Raw Materials Functional Group Analysis
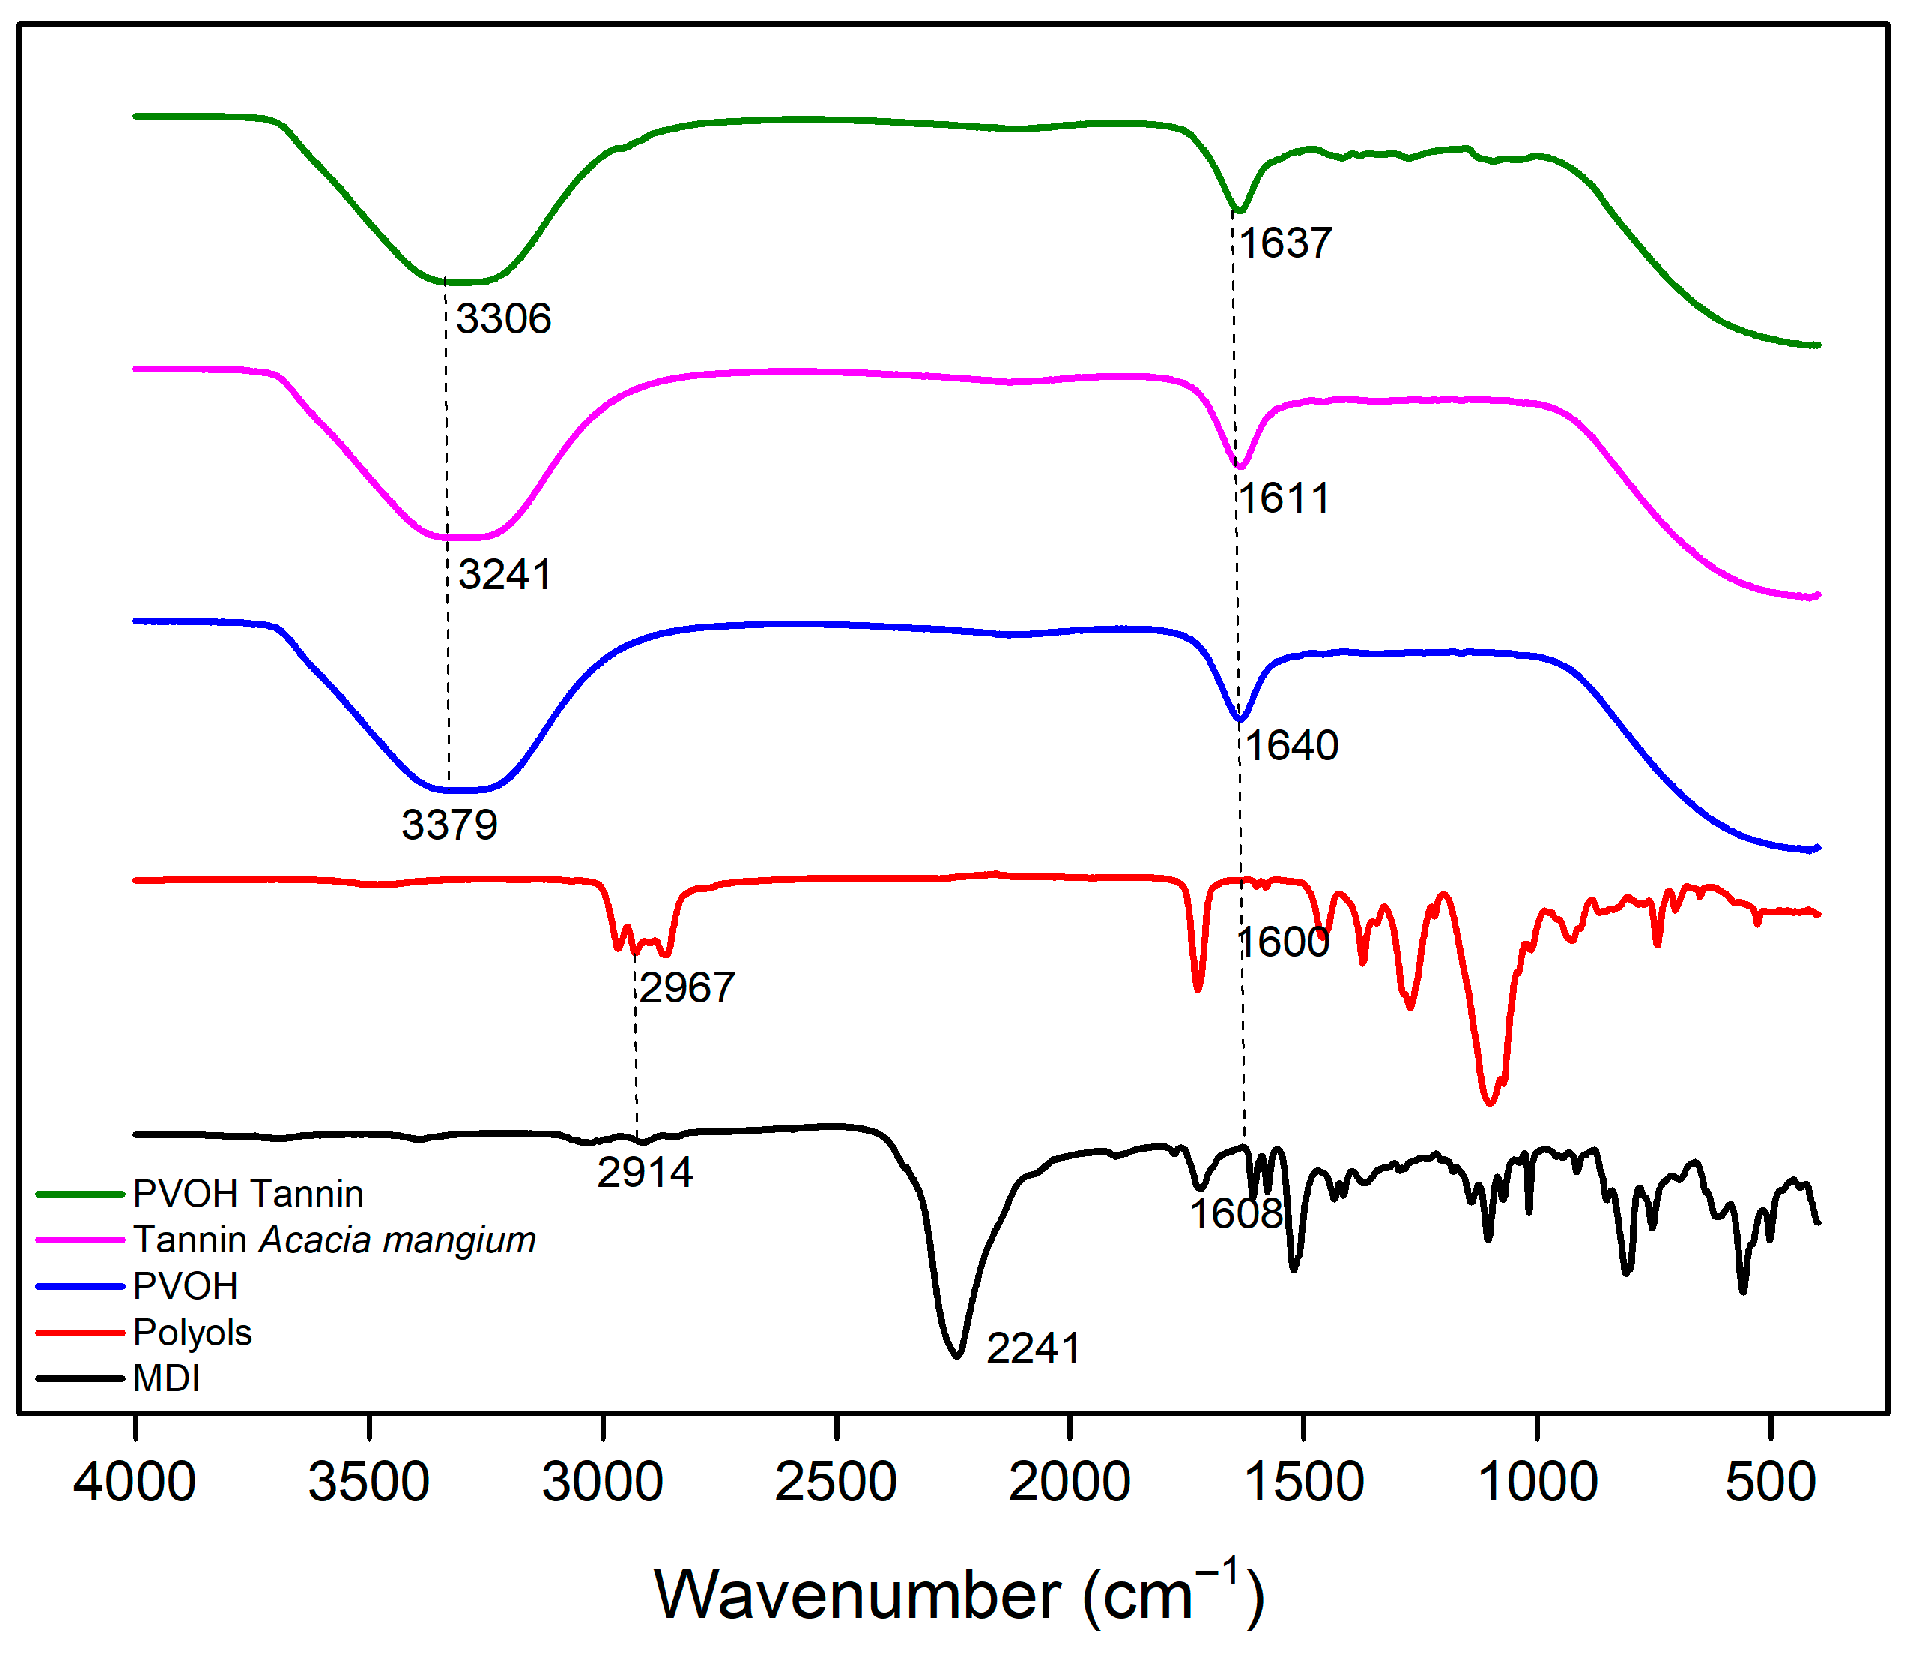
Each adhesive material has different functional groups, including MDI, polyols, PVOH, PVOH/tannins, and tannins mangium (
Figure 1). MDI has a characteristic peak at 2241 cm
−1, indicating the presence of isocyanate (N=C=O). PVOH, polyols, tannins, and PVOH/tannins exhibit characteristic peaks in the 3200–3500 cm
−1, which correspond to the hydroxyl (OH) functional groups present in the material. The peak between 3550–3200 cm
−1 confirmed the presence of hydroxyl groups in the tannin extract, indicating that the adhesive contains tannin. Additionally, the peak observed in the 3000–2840 cm
−1 corresponded to C–H stretching vibrations, while the peak in the 2275–2240 cm
−1 confirmed the presence of isocyanate (N=C=O) groups. The peak observed in the 1650–1580 cm
−1 corresponded to the NH functional group [
20].
3.2. Tannin-Based Polyurethane Adhesive Characterization
Characterization of adhesives is essential to ensure proper adhesive selection, practical use in specific applications, and identification of physical, mechanical, and chemical properties from the combination of adhesive materials. The average value of TPU adhesives’ properties with various tannin contents is shown in
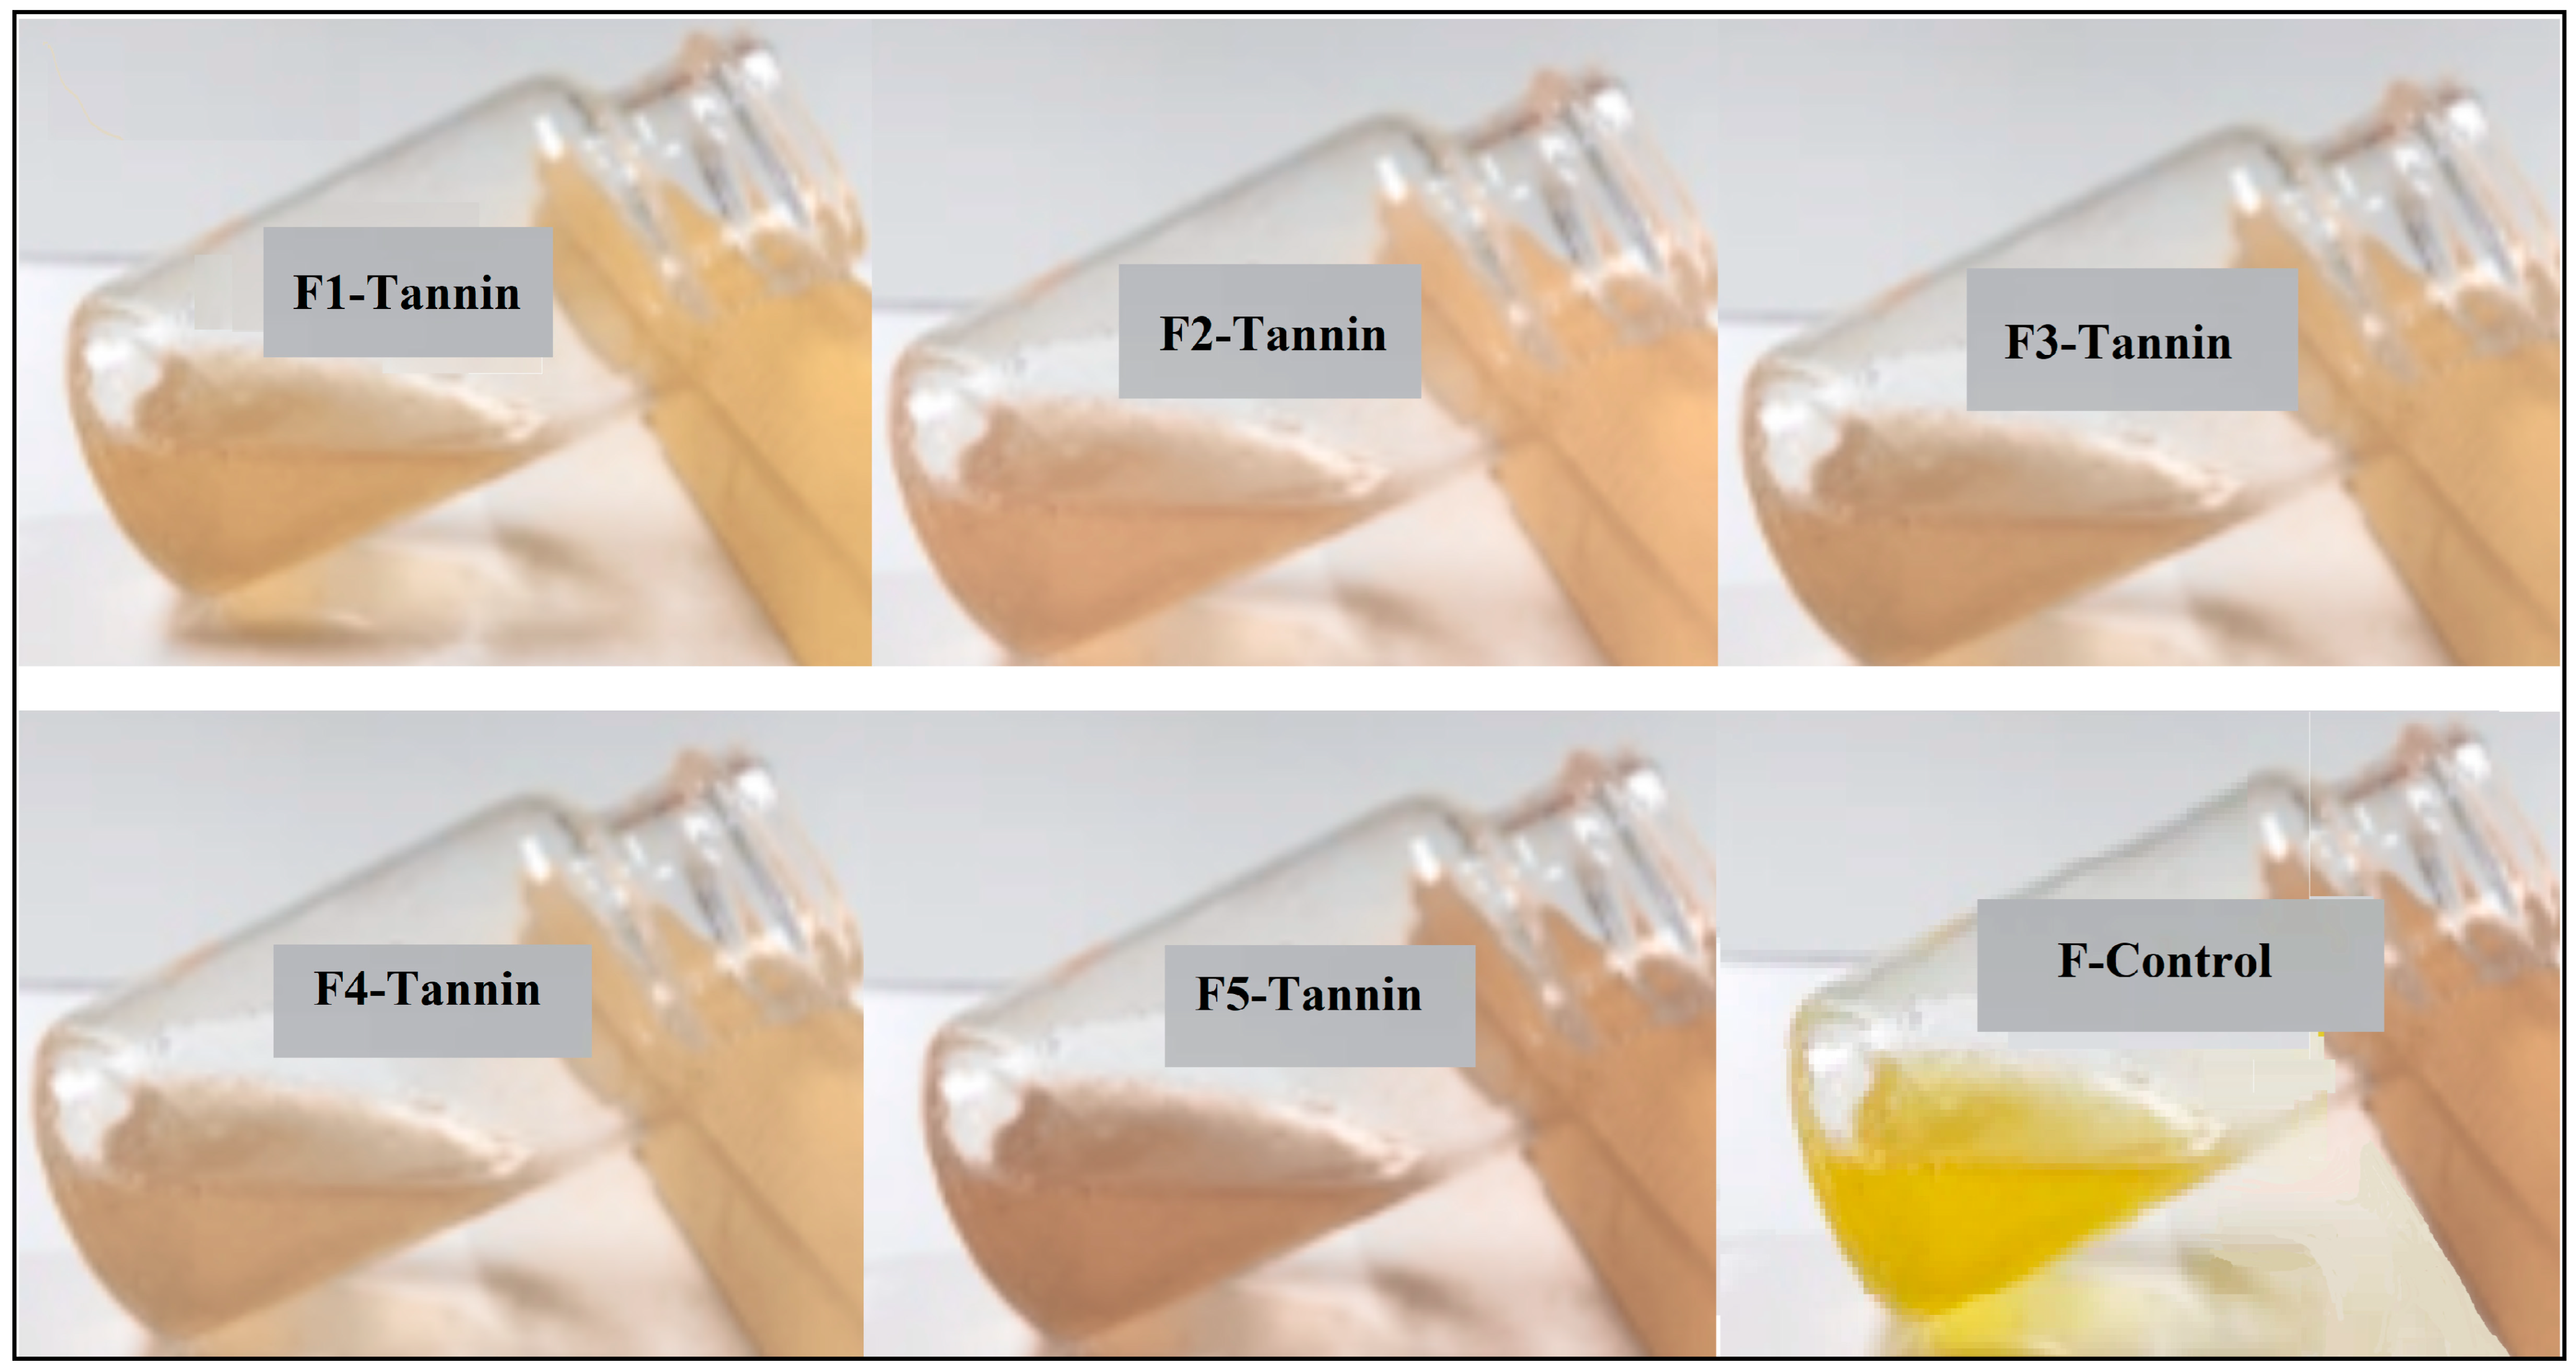
Table 4. TPU adhesives produced in this study were liquid (
Figure 2). The control formula exhibited a yellow, thick adhesive appearance. Formulas F1, F2, F3, F4, and F5 showed a change in adhesive color to blackish brown. This was due to the addition of tannin to the adhesive formula.
The adhesive liquid labeled F1–F5-Tannin and F-Control can also be interpreted using the Munsell Color System. Visually, the F1-Tannin sample appears as a pale beige with a subtle yellow tint. This can be assigned to a hue of approximately 10YR (yellow-red), with a high value around 8 and low chroma near 2–3, reflecting its light, slightly tinted appearance. F2-Tannin is somewhat darker and more saturated, likely maintaining the same hue (10YR), but with a somewhat lower value around 7.5 and chroma around 3–4. F3-Tannin presents a more noticeable beige or light brown tone, suggesting a further drop in value to about 7 and increased chroma (around 4–5), indicating stronger coloration due to tannin presence or reaction. F4-Tannin maintains a similar hue and tone to F3, though it appears slightly duller or more muted. Its estimated Munsell value is around 6.5–7, and chroma about 3–4, perhaps due to sedimentation or less color uniformity. F5-Tannin shows the most pronounced color change among the tannin-treated samples, likely with a hue still in the 10YR range but with a lower value around 6 and higher chroma (5–6). This deep yellow-brown appearance suggests stronger tannin-polymer interaction or oxidation, leading to a darker and more vivid coloration. In contrast, the F-Control sample is a bright, vivid yellow and distinctly different from the tannin-treated samples. Its hue is closer to 5Y (pure yellow), with a very high value (~9) and high chroma (8–10), indicating a clean, saturated yellow without any browning effects. This suggests that the F-Control sample is free from tannin, as the incorporation of tannin typically darkens the mixture and alters its chromatic characteristics. Overall, the Munsell analysis reveals a progressive shift from a light yellowish-beige (F1-Tannin) to a deep brownish-yellow (F5-Tannin) within the 10YR hue family, while the F-Control stands apart with a vivid 5Y yellow hue. This pattern underscores the role of tannin in reducing lightness and increasing chromatic saturation in adhesive formulations, a phenomenon consistent with known effects of phenolic compound polymerization and oxidation. Therefore, the color adhesive is influenced by a large amount of mangium bark tannin formulated in the adhesive. Results from mangium bark tannin extract, the resulting product is light yellowish brown [
21]. The adhesive is produced as a liquid at all variations in shaped tannin levels and does not contain foreign objects such as dirt or dust. This is because the results are filtered extracts during the tannin preparation process.
Viscosity influences the bonding process, specifically the ability of the adhesive to flow from surface to surface and penetrate wood pores. Additionally, viscosity determines the quality and shelf life of the adhesive. As presented in
Table 4, the highest viscosity value was obtained in tannin 50% (699.61 mPa·s), and the lowest was tannin 10% (308.86 mPa·s). Based on an ANOVA analysis of the viscosity test, the result was a
p-value < 0.05, so the concentration of PVOH/tannin influenced the viscosity of the adhesive. High- and low-viscosity adhesives influence the stickiness and tacking properties. TPU adhesives with 10% tannin have a viscosity that is not as high; however, they are more significant than the polyurethane adhesive control. High-viscosity adhesives can occur due to the influence of viscosity with a sufficient PVOH/tannin standard height. Therefore, when the amount of PVOH/tannin increases, the viscosity becomes significant. Materials’ rawness influences the viscosity of the adhesive, and the increase in viscosity creates a faster lifespan of adhesive [
19]. High-viscosity adhesives will be challenging to apply to plywood; however, adhesives that are too liquid can result in low adhesion in tensile-strength plywood. Cohesion strength is the force of attraction between molecules in the adhesive [
5]. Based on an ANOVA analysis of the cohesion strength test, the result was a
p-value < 0.05, so the concentration of PVOH/Tannin influenced the cohesion strength of the adhesive. The cohesion strength is directly proportional to the adhesive’s viscosity, implying that cohesion strength increases with increasing amounts of tannin and MDI. High cohesion strength has a positive effect on the adhesive’s viscosity.
Solids content influences the characteristics of adhesive [
22]. Solids content adhesive identifies the number of particles in adhesive, at increasingly high solids, so the amount of molecules in polymers is essential in the reaction between adhesive getting high [
19]. Many reactions between molecules important to wood during the gluing process indicate that quality adhesiveness and tensile strength continue to increase [
23]. As presented in
Table 4, an increased percentage of tannin tends to decrease the solids content of TPU adhesive. PU control has the highest solids content, followed by adhesive polyurethane with tannin addition at 10%, 20%, 30%, and 40%. Based on an ANOVA analysis of the solids content, the result was a
p-value < 0.05, so the concentration of PVOH/Tannin influenced the solids content of the adhesive. The TPU solids content with the addition of 50% tannin was 72.74%. This can happen because the rate of solids extract thick tannin of about 90%, which indicates that 10% constitutes other ingredients, including water, so with an increase in PVOH/tannin composition, then the water contained in it also increases and results in the rate at which solids become reduced, the value of solids are also influenced by the type solvent. Water has limitations in penetrating wood, so the tannins and other dissolved substances are also limited, and the resulting solids tend to have low levels [
24]. Solid content is influenced by the material composition, level of solids, and yield of tannin [
25].
pH measurement is vital for identifying characteristic alkalinity from the adhesive. Adhesive pH test results for TPU with various treatments are served in
Table 4. Based on an ANOVA analysis of the pH test, the result was a
p-value < 0.05, so the concentration of PVOH/Tannin influenced the pH of the adhesive. The addition of extract tannin influences the pH of the TPU adhesive; this is expected because the adhesive’s composition is polyols, MDI, and PVOH/tannins. The pH of polyol was 8.44, MDI was 3.22, and PVOH/tannin was 11.07 (alkaline). TPU adhesive 10% and 20% polyurethane differ from others with adhesive pH polyurethane-based tannin 10–50% provides pH of 7–8. The pH of the raw material and its composition will affect the pH of the adhesive, as well as the optimal performance of the adhesive. This indicates that when the standard material has a sufficiently large amount of alkaline pH.
3.2.1. Tannin-Based Polyurethane Adhesive Functional Group
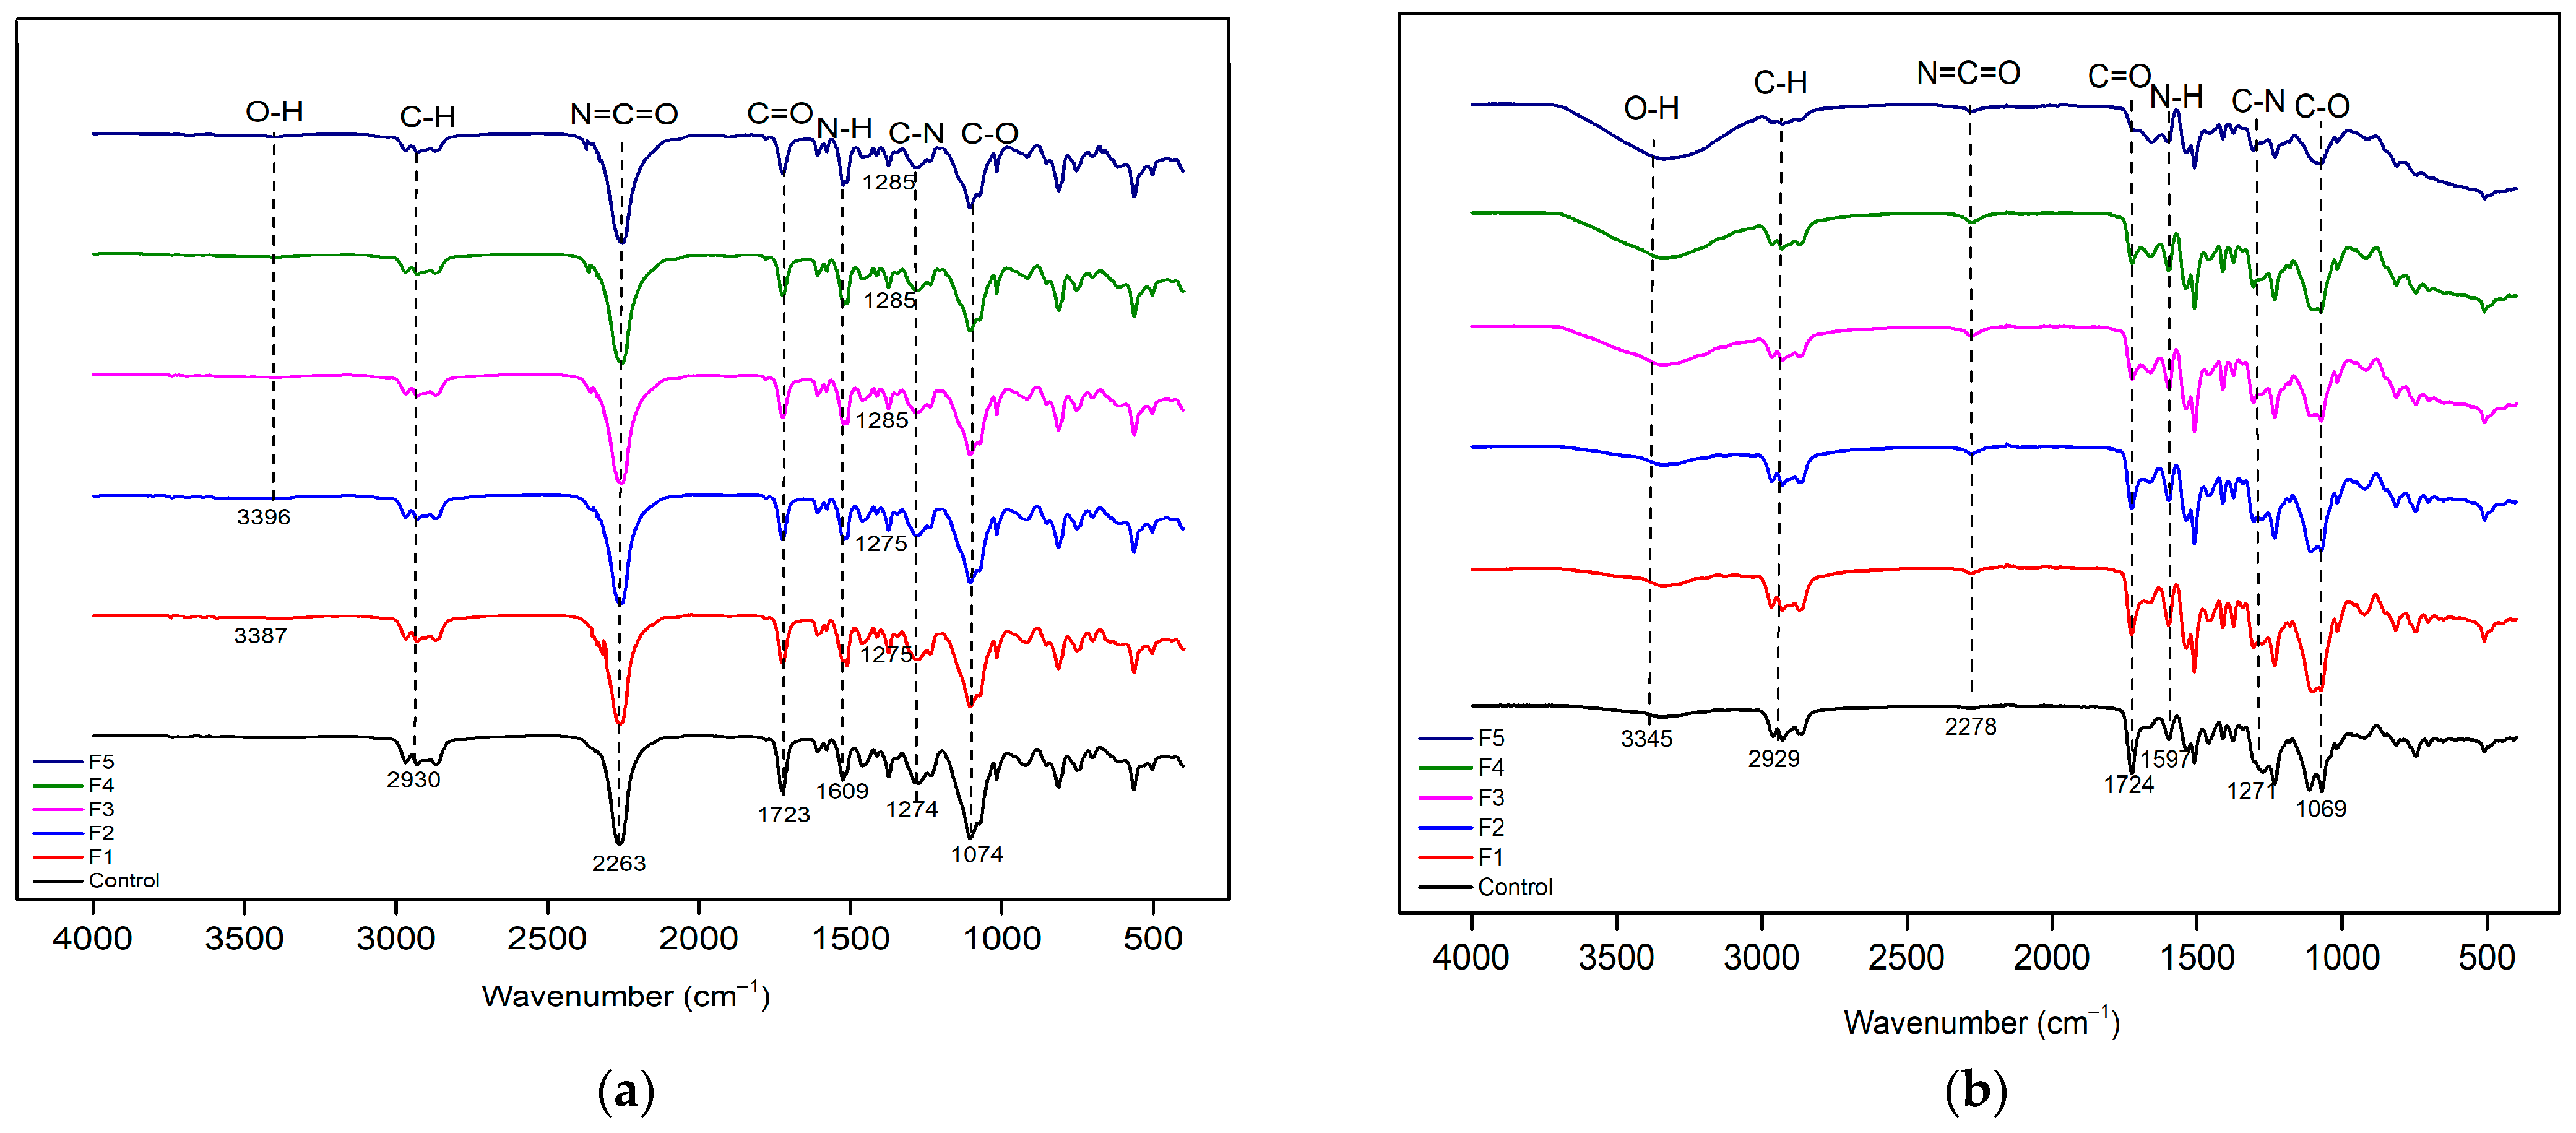
Functional group analysis (FTIR) was carried out to determine the presence of functional groups in each adhesive formula and identify reactions that occurred in the polyurethane adhesive. The results of functional group analysis (FTIR) of liquid adhesives are shown in
Figure 3a, while those of solid adhesives are shown in
Figure 3b. Based on functional group analysis (FTIR) testing of polyurethane adhesives with a variety of tannin extracts, several functional groups indicate the presence of MDI, polyol, PVOH, PVOH/tannin, mangium wood tannin, and, most importantly, the presence of a urethane group. There are differences in the isocyanate group in liquid and solid adhesives; this indicates that the isocyanate group bonds with the hydroxyl (OH) group.
The wavenumber between 3550 and 3200 cm
−1 indicates the presence of hydroxyl functional groups in the tannin extract, indicating that the adhesive contains tannins. Another peak at 2840 cm
−1 can be attributed to a C–H group. The peak at 2275–2240 cm
−1 can be attributed to the presence of an isocyanate group (N=C=O). The point peak at 1750–1735 cm
−1 indicates the C=O group function. The peak at 1650–1580 cm
−1 can be attributed to the NH group. Then, the peak 1085–1050 cm
−1 indicated the CO group [
17]. The difference between the liquid adhesive graph and the solid adhesive is in the peak of the N=C=O group, which indicates that adhesive molecules react with increasing curing time, transitioning from liquid to solid adhesives.
3.2.2. Dynamic Mechanical Analysis (DMA)
DMA is a sensitive thermal analysis technique used to identify the viscoelastic behavior of polymers. DMA usually provides gelatinization, adhesive hardening, and decomposition information that is important for adhesive modification and application [
26].
Figure 4 presents the results for the storage modulus, loss modulus, and tan δ of TPU adhesives.
Storage modulus (E′) describes the elastic energy stored in a material, loss modulus (E″) describes the energy lost as heat in the material under deformation. In contrast, tan describes the viscoelastic characteristics of a material. When the value (E′ > E″, tan < 1), it shows the material tends to be elastic, and when the value (E′ < E″, tan > 1), it shows the material tends to be dense. Mark E′ is the maximum highest found in polyurethane treatment tannin 50% (685.92 GPa), then tannin 20%, tannin 40%, tannin 30%, and finally tannin 10%. Low E′ shows low and weak elasticity in keeping energy elastic. Temperature softening was at 80–120 [
26]. Hence, the sixth trend is decreased because stored energy is reduced more. The smaller storage modulus signifies that the adhesive has more elasticity, whether low or weak, in retaining energy elastically. The storage modulus value shows a decreasing value along with an increasing temperature until it reaches a temperature of 300 °C. This can happen because, at high temperatures, adhesive and tannin molecules experience more significant movement and vibration. This can reduce the time of contact between tannin molecules and adhesive molecules, thereby limiting the interaction between tannins and polyols and MDI. As a result, the effect of strengthening/increasing the storage modulus of PU is not significant enough at high temperatures; apart from that, a decrease occurs because of dissolved/degraded tannins from the adhesive at high temperature, so tannin does not contribute again to the structured adhesive in a way that is practical and effective its storage modulus decreases.
The storage modulus of an adhesive typically decreases with increasing temperature due to the softening and enhanced molecular mobility of the polymer matrix. As temperature rises, polymer chains gain thermal energy, which increases their segmental motion and reduces intermolecular forces such as van der Waals interactions and hydrogen bonding. This transition weakens the material’s stiffness, especially when the adhesive approaches its glass transition temperature (
Tg), where it shifts from a rigid, glassy state to a more flexible, rubbery state. However, in thermosetting adhesives, curing can counterbalance this effect by forming cross-links between polymer chains, which restricts molecular mobility and reinforces the structure, thereby increasing the storage modulus. The overall trend of the storage modulus depends on the competition between these two processes—softening and curing. In the early stages of curing, the storage modulus may rise as cross-linking progresses, but eventually decreases at higher temperatures if the adhesive undergoes thermal degradation or exceeds its service temperature. The interplay between temperature, molecular structure, and curing dynamics ultimately determines the adhesive’s mechanical behavior [
27].
The maximum E″ value was found in polyurethane treated with 50% tannin, then 40% tannin, 30% tannin, 10% tannin, and 20% tannin (21.02 GPa). The smaller the loss modulus, the less viscoelastic energy is lost, so that the adhesive can retain elastic energy better. 20% tannin polyurethane adhesive has the lowest loss modulus value compared to the other five treatments. Adhesives with a more minor loss modulus exhibit better elastic properties and less energy loss. This can produce a stronger bond and be more deformation-resistant when the adhesive is applied [
28]. The loss modulus value shows an increasing value at a temperature of 50–100 °C. This can happen because tannin tends to become more active and increases interaction with the adhesive at a temperature of 80–100 °C, thereby increasing the ability of the tannin to form bonds with adhesive molecules, which increases the loss modulus value. However, after reaching a temperature of 100 °C, the loss modulus value decreases. This is thought to be the softening of the adhesive.
Maximum tan delta value for tannin 10% 0.2 at a temperature of 279.74 °C; tan delta tannin 20% 0.23 at a temperature of 289.24 °C; tannin 30% 0.21 at 296.04 °C; tannin 40% 0.25 at 293.39 °C; and tannin 50% 0.4 at a temperature of 299.89 °C. The resulting tan delta value is not enough to 1. This can happen because the storage modulus is far taller than the loss modulus, so with the tan delta calculation, i.e., the comparison between the loss modulus and the result, the tan delta value is less than 1. Tan delta maximum is found in polyurethane treatment, with tannin 50%, then tannin 40%, tannin 20%, tannin 30%, and last tannin 10%. There is a connection between storage modulus, loss modulus, and tan delta. Based on the results, the study shows that storage modulus (E′) > loss modulus (E″) value with tan delta value < 1, so adhesive polyurethane tannin has its characteristic elasticity. Increased tan delta shows continuous adhesive experience compaction and improvement of crosslinking in polymers that changed from fluid to solids along with increased temperature [
28]. In this transition, the storage and loss modulus decrease; however, tan delta increases allegedly because the material experiences a change, reducing microstructure stiffness.
3.3. Plywood Characterization
Plywood characterization aims to see the mechanical properties of plywood and compare the properties with plywood standards. The characterization of plywood includes moisture content, density, delamination, and tensile strength. Functional group analysis was also conducted to see the groups in the plywood applied with tannin polyurethane adhesive.
Moisture content is an essential factor that can determine the strength value of plywood [
9]. Moisture content (MC) testing aims to determine the amount of water in plywood. The highest MC of plywood is control PU (7.5%), while the lowest MC is tannin 50% (5.81%). Based on the ANOVA analysis of the moisture content test, the
p-value > 0.05, indicating that the concentration of PVOH/tannin did not significantly affect the moisture content (
Table 5). The difference in MC occurs allegedly because of different polyol compositions, MDI, and PVOH. The MC test results meet the SNI 8916.2:2023 standard, which states that the maximum MC value in making plywood is 14%. The moisture content of plywood can influence the penetration and distribution of adhesive between wood fiber. Suppose the plywood’s moisture content is too high. In that case, the ability of the adhesive to penetrate and adhere to the wood fiber can be hampered, reducing the rate of effective adhesive for solids [
9]. Tannin can have a relatively low trend in response to changes in plywood moisture content compared with several types of adhesives. When there is bound water with fiber wood, the moisture content is not so affected by the addition of tannin [
9]. Tannin’s characteristic possible chemistry is that tannin forms a bond with wood fiber, even in conditions with fluctuating water levels, so tannin hinders the inward movement of water in wood fiber and reduces water absorption by plywood.
The density of plywood with adhesive polyurethane control is lower than adhesive polyurethane-based tannin by 20%, but its density is no different from adhesive polyurethane-based tannin, which is 10% tannin, 30% tannin, and 40% tannin (
Table 5). Density adhesive polyurethane is based on the lowest and most distinct 50% tannin natural, with the addition of other tannins. High-density plywood indicates high strength, durability, stability, and structural dimensions. Based on an ANOVA analysis of the density test, the result was a
p-value < 0.05, so the concentration of PVOH/tannin influenced the density of the adhesive. Density plywood is different, although not too significant, because different tannin compositions in adhesive can influence the bond with wood, which makes the wood solid; apart from that, the choice of the core also influences the density of the layer. The density of plywood is determined by the material adhesive, the type of wood used for veneer, core, and glue spread [
29]. The standard of plywood density based on sengon plywood is in the range of 0.5–0.7 g·cm
−3.
Wood delamination indicates whether the layers of wood are still strong enough to stick to each other [
10]. Wood that experiences low delamination tends to be stable, able to withstand loads, and sturdier. Based on JAS standards No. 233 for Plywood in 2003, the plywood delamination value was less than 33%. The results of the wood delamination test are presented in
Table 5. Delamination obtained from control polyurethane plywood, 10% tannin, 20% tannin, 30% tannin, and 40% tannin all have a value below 0.1%. Delamination of 50% tannin has a value of 100% because when the sample is heated to a temperature of 100 °C, the sample cracks, and the inner layer of the plywood is damaged before being oven-treated. The fourth delamination of the tannin extract treatment meets JAS No. Standards. 233 for Plywood. Factors affecting delamination include field shift, type of adhesive, and interaction. Additionally, based on an ANOVA analysis of the density test, the result showed a
p-value < 0.05, indicating that the concentration of PVOH/tannin significantly influenced the density of the adhesive, which in turn can affect the bonding strength and resistance to delamination. The higher solids content signifies that the interaction between urethane and wood is stronger [
30].
3.3.1. Tensile Strength
Plywood quality is directly proportional to plywood tensile strength. The quality of plywood adhesive is determined by the value of its tensile strength [
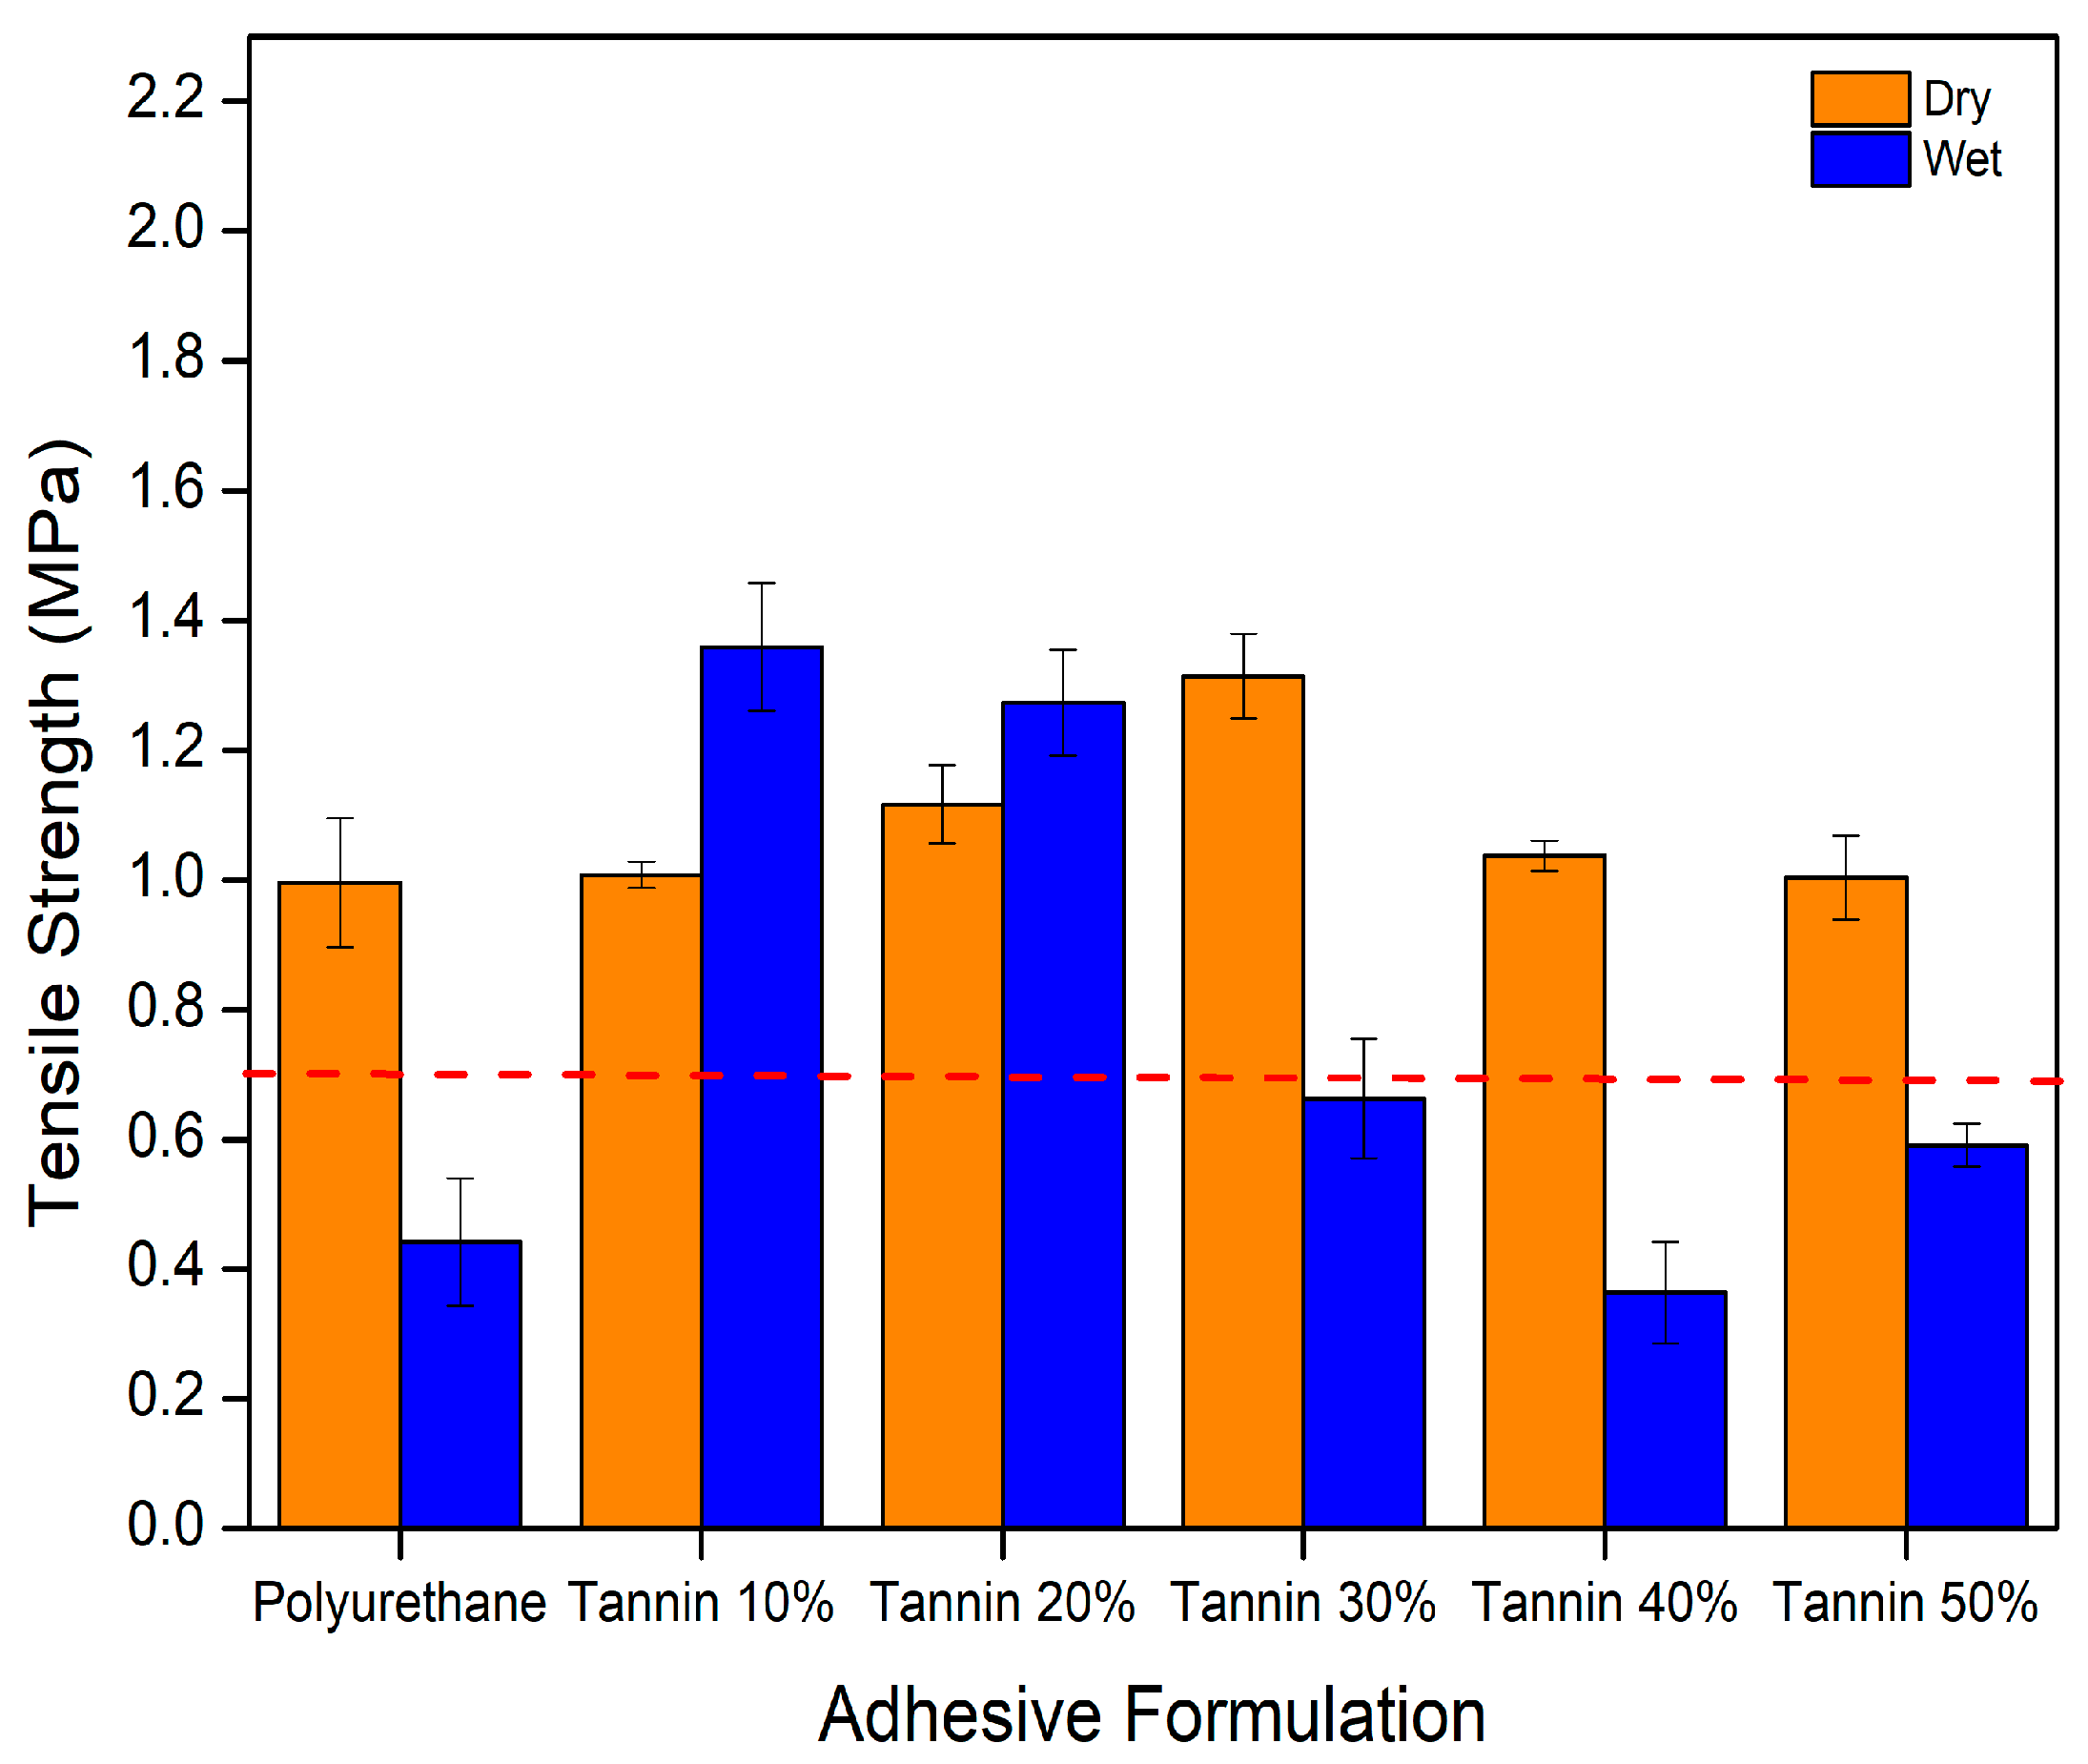
30]. The strength of the wood adhesive is directly related to the solids content of the adhesive; the higher the solids content, the higher the tensile strength of the wood. The dry and wet condition tensile strength test results are presented in
Figure 5. The dry condition value with tannin extract was the highest, ranging from 30% tannin to 1.31 MPa and 50% tannin to 1.12 MPa. Meanwhile, the wet condition value with the addition of tannin extract was the highest; 10% tannin is 1.36 MPa, and 20% tannin is 1.27 MPa. Adhesive polyurethane extract with 20% tannin exhibits an average tensile strength and the highest adhesive properties from two types of testing (dry and wet) with a higher tannin substitution amount. In contrast, the polyurethane with 30% tannin on the test wet did not fulfill the standard SNI 8916.2:2023 [
11].
According to SNI 8916.2:2023 and JAS N0 233-2003 standard, the standard tensile strength value is a minimum of 0.7 MPa [
11,
12]. All plywood bonded with TPU adhesive on the tensile strength test in dry conditions fulfils SNI standards. In contrast, only polyurethane extracts with 10% and 20% tannins meet the SNI standards in wet conditions. A polyurethane-based 20% tannin formula is the best for testing the tensile strength of plywood. The tensile strength of plywood’s connection with the rate of solids content is high, and the tensile strength value was higher, too. A low solids content adhesive indicates the number of particles that reduce the strength possible between the adhesive and the wood. As a result, the tensile strength of the plywood is low [
19]. The high value of tensile strength and wetness can indicate that adhesive polyurethane-based tannin can be used in exterior applications.
3.3.2. Functional Group of Plywood
FTIR testing of plywood was carried out to see if there is or is no group function urethane inside the plywood so adhesive can penetrate inside plywood. The result of FTIR analysis of plywood shows OH, CH, C=O, NH, and CN groups.
Figure 6 shows several functional groups in plywood bonded with TPU adhesive. The peak of the OH group of plywood ranges from 3342–3337 cm
−1, CH group of plywood ranges from 2920–2917 cm
−1, C=O group of tannin polyurethane ranges from 1734–1729 cm
−1, NH group of tannin polyurethane ranges between 1593–1594 cm
−1, C-N polyurethane tannin group ranges from 1106–1104 cm
−1. The test results prove that group urethane exists in plywood, indicating that the fifth treatment allows urethanes to penetrate the plywood. There is also an OH group from tannins, PVOH, and reacting polyols, as well as the group isocyanate. The isocyanate group, which already reacts, produces the urethane group in adhesive polyurethane plywood.
3.3.3. Wood Failure Analysis
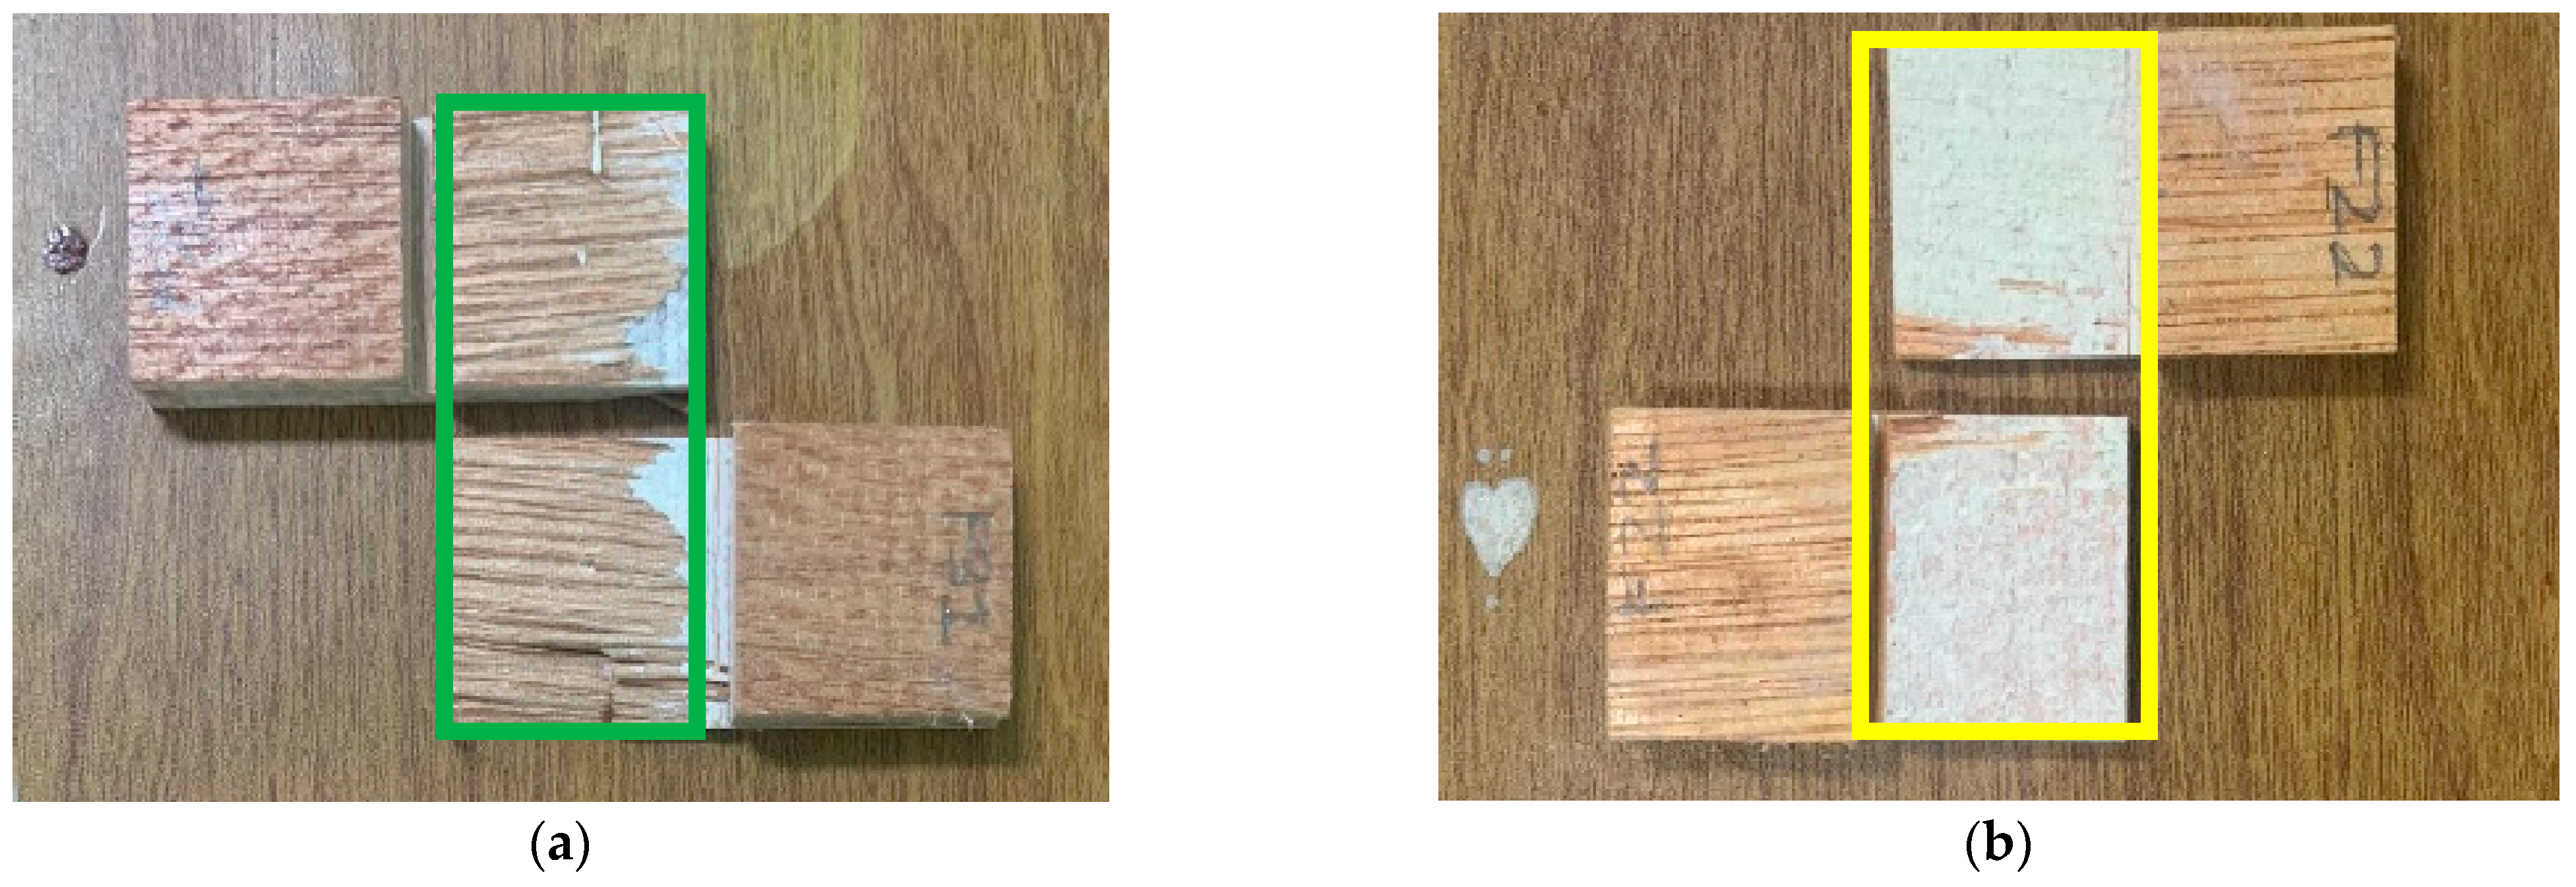
A tested wood failure is divided into 3, i.e., the damage of bonds between wood and adhesive (wood failure), damage to the adhesive (adhesive failure), and damage to the wood veneer (structural failure). Test results of wood failure in dry and wet conditions are shown in
Table 6 and
Figure 7. A good result of the wood failure test is that there is high damage to the wood (wood failure) because the adhesive can penetrate the wood, not adhesive damage or high structural damage. In the wood failure test, the tannin-based polyurethane adhesive with a 20% formula is the best, as it exhibits the highest value in terms of wood failure, rather than structural or adhesive failure. Wood failure F1–F3 in a dry condition almost fulfils the standard, while F2 almost fulfils the standard in wet conditions. This result revealed that TPU with F2 formulation can be used as a semi-exterior adhesive. Wood failure can occur due to the low rate of solid adhesive, resulting in a weak bond between the adhesive and the wood.
