Article

Real-Time Sensor-Controlled Coagulant Dosing and Pressure in a Novel Sludge Dewatering System

1
Hydrogen Energy Solution Center, Institute for Advanced Engineering, Yongin-si 17180, Gyeonggi-do, Republic of Korea
2
Bio Resource Recirculation Center, Institute for Advanced Engineering, Yongin-si 17180, Gyeonggi-do, Republic of Korea
*
Authors to whom correspondence should be addressed.
Clean Technol. 2025, 7(3), 82; https://doi.org/10.3390/cleantechnol7030082
Submission received: 25 July 2025 / Revised: 23 August 2025 / Accepted: 1 September 2025 / Published: 12 September 2025

Abstract

Sludge dewatering remains a resource-intensive process, often constrained by high residual moisture content and inefficient chemical conditioning. Conventional systems typically rely on fixed polymer dosages and predetermined filtration pressures, which are unable to respond to variations in sludge characteristics, resulting in inconsistent and suboptimal performance. In this study, a real-time control system for municipal wastewater sludge dewatering was developed to dynamically regulate coagulant dosing and filtration pressure based on continuous monitoring of critical sludge parameters, including total solids (TS), viscosity, sludge temperature, and pH change following coagulant addition. The control logic, derived from empirical correlations between sludge dewaterability metrics such as time-to-filter (TTF) and capillary suction time (CST) and operational variables, enables adaptive adjustment of polyoxyethylene alkyl ether (POAE) injection and pressing conditions. Implementation of this system achieved a final cake moisture content of approximately 63% after 60 min of filtration, substantially lower than the ~84% moisture observed under static conditions. Real-time flux feedback facilitated timely pressure escalation (from 15 to 20 bar to 25–30 bar), improving water removal efficiency while avoiding premature cake blinding. The pH drop (~0.7 units) post-polymer addition served as a practical indicator of adequate flocculation, supporting dose optimization and minimizing chemical waste. The proposed system demonstrated enhanced dewatering performance, reduced polymer consumption, and greater operational robustness compared to conventional approaches. These findings highlight the potential of integrated sensor-based control to advance sludge treatment technologies by promoting smarter, adaptive, and resource-efficient dewatering operations.

1. Introduction

Sludge dewatering is a critical step in wastewater treatment that directly affects the volume, handling, and disposal cost of biosolids. Despite the removal of a significant portion of free water, conventional mechanical dewatering processes often yield sludge cakes with moisture contents of approximately 80–85% [1,2]. This high residual moisture contributes substantially to the mass and volume of dewatered sludge, accounting for up to 70% of overall sludge management costs [3]. Accordingly, reducing sludge moisture content is a key objective for enhancing the sustainability and economic efficiency of sludge treatment. However, bound water—retained within floc structures and sludge microenvironments—remains difficult to remove through mechanical pressure alone [4,5,6].
To improve water release, chemical conditioners such as coagulants and flocculants, including iron salts, lime, and synthetic polymers, are commonly applied. These agents aid in destabilizing particle charges and promoting floc formation, thereby facilitating filtrate release and reducing clogging of filtration media [7,8]. The effectiveness of these additives, such as polyacrylamides and ferric chloride, depends heavily on precise dosage; both insufficient and excessive dosing can impair dewatering performance, either by leaving residual colloids or by forming impermeable gel layers [9,10]. Moreover, sludge composition (e.g., the fraction of organic vs. inorganic matter and the presence of extracellular polymers) strongly influences chemical conditioning requirements; organic-rich sludges often demand higher coagulant doses to achieve effective flocculation due to their greater colloidal and polymeric content.
In practice, polymer dosing is typically guided by jar tests or operational heuristics and remains fixed throughout each dewatering cycle. Similarly, filter press operations often rely on static pressure schedules, consisting of an initial low-pressure fill followed by high-pressure squeezing. These static regimes are not designed to respond to real-time changes in sludge characteristics, such as solids content, temperature, or viscosity, which can vary significantly over time. Consequently, the use of fixed setpoints frequently results in over- or under-conditioning, polymer wastage, and reduced dewatering performance. This inefficiency not only hampers performance but also increases operational costs, given that conditioning chemicals (polymers) can constitute a significant expense in large wastewater treatment plants (WWTPs).
Recent developments in automation have enabled the use of sensor-integrated control systems capable of real-time monitoring of sludge parameters. Commercial technologies—for example, systems such as RTC-SD (Hach Company, Loveland, CO, USA) and RheoScan (ANDRITZ AG, Graz, Austria)—adjust polymer dosage dynamically based on continuous measurements of solids content, apparent viscosity, or floc clarity zones [11,12,13]. These systems have demonstrated improved polymer utilization and enhanced consistency in cake dryness. Nevertheless, most applications are limited to continuous operations, such as belt thickeners or centrifuges, and are primarily focused on chemical dosing. Integrated feedback systems that simultaneously govern both chemical and mechanical dewatering parameters, including filtration pressure, remain underexplored.
Concurrently, research into advanced conditioning agents has identified polyoxyethylene alkyl ether (POAE) as an effective non-ionic surfactant for sludge dewatering enhancement. Experimental studies have shown that when used in conjunction with conventional coagulants, POAE significantly reduces filtration time and enhances bound water release, largely due to charge neutralization mechanisms and improvements in floc structure [3,14]. Notably, zeta potential and pH variation have been identified as useful indicators for estimating the optimal polymer dose, offering potential integration points for real-time feedback control. However, such insights have yet to be translated into adaptive control systems that dynamically manage both chemical dosing and mechanical dewatering in response to changing sludge properties.
In this study, a real-time control system for sludge dewatering was developed and evaluated. The system integrates sensor-based monitoring of sludge properties with automated adjustments to coagulant dosing and filtration pressure. Key sludge characteristics affecting dewatering performance—such as total solids, viscosity, temperature, and pH variation—were systematically investigated to establish optimal control parameters. System performance was assessed based on filtrate flux and final cake moisture content, and benchmarked against conventional fixed-operation methods. This work is, to our knowledge, the first demonstration of a sludge dewatering system that simultaneously optimizes both chemical dosing and filtration pressure in real time, bridging a gap in previous studies that addressed these factors separately. The findings highlight the potential of smart control strategies to enhance sludge treatment efficiency and consistency.

2. Materials and Methods

2.1. Sludge Characteristics and Conditioning Agents

All experiments were conducted using wastewater sludge collected from a municipal sewage treatment facility. This was anaerobically digested sludge from a large municipal WWTP (~500,000 PE) treating primarily domestic wastewater. The sludge comprised anaerobically digested biosolids and exhibited typical characteristics of municipal waste, including a total solids (TS) content ranging from 2% to 4% by weight (corresponding to 96–98% moisture) and a high organic content (~65% volatile solids). To reflect variability in operational conditions, the TS and rheological properties of the sludge were adjusted through dilution or pre-thickening via gravitational settling. Viscosity measurements were performed at 20 °C using a rotational viscometer operated at a shear rate of 100 s−1, yielding values between approximately 4.5 and 6.0 mPa·s. These low-shear viscosity values are indicative of flow behavior during pumping and dewatering and are positively correlated with solids concentration and extracellular polymeric substance content.
The coagulant used was polyoxyethylene alkyl ether (POAE) (Solenis, Wilmington, DE, USA), a non-ionic polymeric surfactant previously reported to improve sludge dewatering performance [3]. Analytical-grade POAE was used in its as-received liquid form without further purification. Prior studies have demonstrated the synergistic effects of POAE when applied alongside metal-based coagulants; however, this study focused on POAE alone in order to isolate and evaluate its independent influence on dewatering behavior. Dosages were expressed in milligrams per liter of sludge to align with dosing by volume; for context, 100 mg/L ≈ 5 kg of polymer per dry ton of sludge at 2% TS. In full-scale practice, polymer conditioning usually requires several kilograms of polymer per ton of dry solids (approximately 5–10 kg/TD), so the dosing levels explored here are within practical ranges. Preliminary jar tests and supporting literature suggest that an effective dose range for POAE lies between several tens and a few hundred mg/L. It was hypothesized that within this range, POAE can effectively disrupt water binding within sludge matrices without inducing adverse effects such as foaming or emulsification.

2.2. Sensor-Integrated Filter Press System

Dewatering trials were performed using a bench-scale filter press designed to replicate the operating characteristics of full-scale plate-and-frame units. The apparatus had an effective chamber volume of approximately 0.5 L and was fitted with a 5 μm pore size filter cloth suitable for sludge filtration. A hydraulic pump provided adjustable pressure up to 30 bar. To enable dynamic control, the system incorporated the following instrumentation.
  • Total Solids (TS) Sensor (Valmet, Espoo, Finland): An inline microwave absorption sensor, calibrated via gravimetric methods, was used to measure feed sludge solids content in real time prior to each run.
  • Viscosity Assessment (Brookfield, Middleboro, MA, USA): Offline viscosity measurements were conducted on ~100 mL sludge samples using a rotational viscometer (20 °C, shear rate 100 s−1). The results were used to categorize sludge as low, medium, or high viscosity in the control logic.
  • Temperature Sensor (Hanna Instruments, Woonsocket, RI, USA): A Pt-100 resistance thermometer measured sludge temperature, ensuring the reading reflected the sludge itself. The sensor was immersed in the sludge to record the actual sludge temperature. Cold sludge conditions were simulated via pre-cooling.
  • pH Sensor (Endress+Hauser, Greenwood, IN, USA): A glass electrode pH probe installed in the mixing tank provided continuous monitoring during coagulant dosing. The resulting pH change (ΔpH) was used to evaluate charge neutralization effectiveness.
  • Filtrate Mass Sensor (Flow Monitoring) (Mettler Toledo, Greifensee, Switzerland): An electronic balance placed below the press outlet recorded filtrate mass continuously. These data were used to calculate instantaneous filtration flux (L/m2·h), serving as a decision variable for pressure modulation.
  • Pressure Sensor (WIKA, Klingenberg am Main, Germany): Hydraulic pressure was monitored using a transducer to verify target pressures and ensure operational safety.
All sensors interfaced with a programmable logic controller (PLC) or data acquisition unit linked to custom-developed software. This system enabled real-time execution of the control algorithm governing both polymer dosing and filter press operation.

2.3. Control Algorithm for Real-Time Dosing and Pressure Adjustment

The control strategy is summarized in the flowchart (Figure 1), which outlines the sequential decision steps from initial sludge characterization to the end of dewatering. Key elements of the algorithm include
The algorithm takes sensor inputs (TS, viscosity, temperature, pH change, filtrate flux, etc.) to determine coagulant dosing and filter press pressure adjustments at different stages.

2.3.1. Initial Sludge Assessment

Each sludge batch undergoes initial characterization, including total solids (TS), viscosity, and temperature evaluation to determine the appropriate initial coagulant dose. Empirical threshold values, established through preliminary experiments, indicate favorable dewatering conditions as follows: TS > 2.5%, viscosity ≤ 5 mPa·s, and temperature > 5 °C. Under these conditions, sludge is considered adequately concentrated, manageable in viscosity, and suitably warm, warranting a medium-range coagulant dose. Accordingly, the control algorithm administers an initial polyoxyalkylene ether (POAE) dose of 80–120 mg/L, typically around 100 mg/L.
Sludge conditions deviating from these thresholds (e.g., TS < 2.5%, viscosity > 5 mPa·s, or low temperature) require alternative dosing strategies:
  • Low-viscosity sludge (viscosity < 5 mPa·s), typically associated with low solids and high water content, receives an initial reduced POAE dose of 40–60 mg/L. The rationale is to prevent overdosing while sufficiently destabilizing fewer suspended solids.
  • High-viscosity sludge (viscosity ≥ 5 mPa·s), often characterized by higher solids or increased colloidal content, initially receives a higher POAE dose (120–180 mg/L) to ensure effective flocculation.
These dosing ranges (40–60, 80–120, 120–180 mg/L) derive from dose–response analyses, where reductions in time to filter (TTF) plateau beyond approximately 150 mg/L POAE. Therefore, a conservative upper limit of 180 mg/L prevents unnecessary overdosing.

2.3.2. Polymer Injection and Mixing

Once the initial dose is selected, the corresponding volume of POAE solution is injected into the sludge mix tank. A rapid mixing (at ~100 rpm for 30 s) followed by slow stirring (20 rpm for 2 min) is conducted to disperse the coagulant and allow floc formation. During this conditioning period, the pH of the sludge is monitored. The difference in pH between the conditioned sludge and the original sludge (ΔpH = pH_after − pH_before) is computed. We observed that as POAE doses approach optimal flocculation levels, the sludge pH tends to drop modestly (on the order of 0.5–1.0 units). In this system, a threshold ΔpH > 0.7 was chosen as an indicator that sufficient coagulant has been added. The likely explanation is that POAE (a surfactant) interacts with sludge colloids, releasing some acidity or CO2 from the sludge matrix, thus lowering pH. A significant pH change suggests active destabilization of sludge particles. If the measured ΔpH is less than 0.7 after the initial dose, the control logic interprets this as potentially insufficient conditioning. It then triggers an additional incremental dose of POAE (approximately 40 mg/L at a time) and repeats the mixing and pH check. This loop continues until ΔpH exceeds 0.7 or until a set maximum total dose (in practice, we capped at ~200 mg/L to avoid excess). In our experiments, typically one additional dose was enough in cases of initial under-dosing; more than two iterations were rarely needed as ΔpH responded clearly once near-optimal polymer had been added. This adaptive dosing approach ensures that even if the initial dose guess was slightly off (due to unusual sludge composition), the system corrects itself by observing a real-time reaction parameter (pH change).

2.3.3. Filtration Initiation

After conditioning, the flocculated sludge is pumped into the filter press chamber. The initial filtration pressure is set to 15–20 bar (we selected 18 bar as a nominal starting point). This relatively high fill pressure is used to quickly establish flow through the cake; however, it is still moderate enough to avoid immediate over-compression of the forming cake. The filtrate starts to drain, and its weight is recorded by the balance.

2.3.4. Flux Monitoring and Pressure Adjustment

The controller continuously calculates the filtration flux (in L/m2·h) from the rate of increase in filtrate mass. At the beginning of filtration, fluxes are generally high since the cake is thin and the resistance is low. In our system, we set a flux threshold of 100 L/m2·h as a trigger point. This value was chosen based on typical initial fluxes observed and the desire to maximize throughput: if the flux is still above 100 L/m2·h, it indicates that the slurry is flowing relatively freely. In such a case, the control logic will increase the press pressure to 25–30 bar (we used 30 bar in practice) to capitalize on the easy dewatering—the higher pressure can push water out faster while the cake is not yet very resistant. On the other hand, if flux had already dropped below 100 L/m2·h early in the run (which might happen with very viscous sludge or suboptimal conditioning), the system would hold off on raising pressure, continuing at 18 bar to allow more gradual cake buildup and avoid compacting a low-permeability cake too soon. In essence, this step implements a feedback control on pressure: pressurization is advanced from a low stage to a high stage not by a fixed schedule, but by the measured ability of the system to still pass water (the flux). This approach is intended to prevent scenarios of either (i) applying high pressure too early (which can “lock” water into an incompressible cake) or (ii) waiting too long to increase pressure.

2.3.5. Cake Moisture Calculation and Termination

During the filtration process, cumulative filtrate mass ( W t ( t ) ) was continuously recorded. The wet cake mass ( W c ( t ) ) at a given time, t was calculated by subtracting the filtrate mass from the initial wet sludge mass ( W i ). Using the known initial dry solids mass ( X s = W i   × T S / 100 ), cake moisture content was calculated using the following equations (assuming negligible solids loss during filtration):
Cake solids fraction = X s W c ( t )
Moisture content % = 100 × 1 X s W c ( t )
When this computed cake moisture content falls below 65%, the system considers the dewatering target achieved and stops the process (ending the press cycle and opening the press to discharge the cake). In our implementation, the condition was effectively to stop when cake moisture ≤ 65%. This cutoff was set based on a desired cake dryness of ~35% solids, which is significantly drier than typical untreated cake and approaches the maximum achievable by mechanical means for digested sludge. If the time limit for a cycle is reached before 65% moisture is attained, the cycle would stop regardless (to avoid endless pressing), but in our experiments, the moisture threshold was reached within the set time limit (60 min) in the controlled runs.
In summary, the control algorithm uses multi-parameter sensing to adjust two main actuators: the coagulant pump (dosing amount) and the hydraulic press (pressure level and duration). The flowchart in Figure 1 illustrates these decision points (green diamonds for checks like TS/viscosity conditions, pH change, flux, and moisture content) and the resulting actions (blue boxes for dosing or pressure changes). This forms a closed-loop control system for each batch of sludge dewatering.

2.4. Experimental Procedure

To evaluate the system, a series of dewatering tests was performed. It is acknowledged that key sludge properties such as total solids (TS), viscosity, and temperature are often interdependent. The objective of the single-factor characterization tests was therefore not to achieve perfect statistical isolation of each variable, but rather to establish the dominant empirical relationships and sensitivities that inform the control algorithm. To this end, experiments were designed to systematically vary one primary parameter while keeping other conditions as constant as possible.
First, characterization tests were performed without the active control system engaged (i.e., under static conditions with only manual adjustments) to understand how each sludge parameter influences dewatering outcomes. These tests provided the empirical basis for the control thresholds described above. For example, sludge samples of varying TS (from ~2.3% to 3.8%) were conditioned with a standard dose of polymer and filtered under identical conditions to measure the TTF and final moisture; similarly, viscosity and temperature were varied, and their impact on TTF/CST was recorded. Separate jar tests were conducted to examine the effect of POAE dose on dewatering metrics and to observe pH and zeta potential changes. In each jar test, a known dose of POAE was mixed into 200 mL of sludge; after flocculation, a standard CST (capillary suction time) test and a TTF test (time to filter a fixed volume through lab filter paper) were performed, and samples of supernatant were taken for zeta potential measurement (using a Zetasizer instrument (Malvern Panalytical, Malvern, UK)).
After establishing the parameter effects, the integrated control runs were carried out using the full apparatus and PLC control. Each run used ~0.5 L of sludge in the filter press. We tested the system under different initial sludge conditions to challenge the control logic: (1) a baseline condition (~3.0% TS, ~4.8 mPa·s viscosity, ~20 °C) expected to trigger the medium dose pathway; (2) a low-solids condition (~2.3% TS, viscosity ~4.5 mPa·s, 22 °C) expected to trigger the low-dose pathway; (3) a high-viscosity condition (achieved by using a 3.5% TS sludge that was cold at ~4 °C, yielding viscosity ~5.5 mPa·s) expected to trigger the high-dose pathway; and (4) an intermediate case (~2.7% TS but relatively cold at 5 °C, viscosity ~5 mPa·s) to test mixed conditions. In each run, the system’s decisions (doses added, pressure change time) and outputs (filtrate flow, cake moisture trend) were recorded. For comparison, static control runs (without real-time adjustments) were also performed for selected cases: e.g., using a fixed 100 mg/L dose and a fixed two-stage pressing (15 bar for 30 min then 30 bar for 30 min) irrespective of feedback, to serve as a baseline for performance evaluation.
All experiments were repeated at least twice to ensure reproducibility. The results reported below focus on representative runs and the overall trends observed.

3. Results and Discussion

3.1. Influence of Sludge Properties on Dewaterability

At the outset, we investigated how individual sludge properties affect dewatering by varying one factor at a time (TS, viscosity, or temperature) while keeping other conditions constant as far as possible. The key dewatering metrics considered were time-to-filter (TTF) and capillary suction time (CST), measured as described in Section 2.4. Specifically, TTF refers to the time required to filter a fixed volume of conditioned sludge through a standard filter paper, and CST was measured using a standard CST apparatus. Threshold values of these sludge properties with respect to TTF and CST are summarized in Table 1.

3.1.1. Total Solids (TS)

The initial solids content of sludge has a pronounced effect on dewatering behavior. Figure 2 shows the relationship between sludge total solids (TS, 2.2–3.9%) and two critical dewatering metrics: time-to-filtration (TTF) and capillary suction time (CST), both measured under standard conditions for fixed-volume sludge samples. A notable reduction in TTF was observed as TS exceeded approximately 2.5%. Sludges with TS < 2.5%, characterized by high dilution, exhibited prolonged filtration times exceeding 2000 s (≈33 min). In contrast, sludges in the TS range of 3.0–3.5% showed significantly reduced filtration durations of approximately 500–800 s (≲15 min). These observations were consistent with previous studies reporting a critical threshold around 2.5–3.0% TS, below which filtration performance sharply deteriorates [15,16].
Similarly, CST exhibited a distinct decrease as TS increased above approximately 2.5%. Specifically, sludge with TS below 2.5% displayed CST values exceeding 130 s, indicating poorer filterability. As TS increased above this threshold, CST values substantially decreased to approximately 50–80 s, further confirming improved dewaterability at higher TS concentrations. These results align closely with earlier findings that CST values significantly increase at lower solids concentrations due to poor cake structure and flocculation properties [17].
These nonlinear improvements in both TTF and CST suggest that even moderate increases in solids concentration significantly enhance sludge dewatering efficiency, up to an optimal concentration range. Two primary factors explain this phenomenon: (1) a reduced water volume per unit solids mass that must be removed at higher TS levels, directly lowering filtration and suction times, and (2) enhanced formation of a permeable filter cake structure at elevated TS, effectively facilitating water removal. At very low TS, insufficient particle density results in a poorly structured cake, impeding water release and increasing filtration resistance.
Interestingly, a subtle increase in TTF was noted at the highest TS range tested (~3.8–4.0%), possibly attributable to increased sludge viscosity or pumping difficulty that counteracts some dewatering advantages. Nevertheless, a clear threshold at approximately 2.5–3.0% TS exists, below which both TTF and CST significantly deteriorate. These observations substantiate the selection of a 2.5% TS breakpoint within the control algorithm, guiding normal polymer dosing conditions for sludge above this level and necessitating enhanced dosing or handling strategies for sludge below this threshold.
Higher initial TS (up to ~3–3.5%) greatly reduces the TTF and CST compared to low-TS sludge. Each point represents a batch filtration test under identical conditioning (fixed polymer dose) and pressure. Error bars (±1 SD) are shown for duplicate tests at select points. Interpretation: Sludges above ~3% TS filter much faster, while those below ~2.5% TS exhibit dramatically longer filtration times due to the large volume of water that must be removed and poorer cake formation.

3.1.2. Volatile Solids (VS)

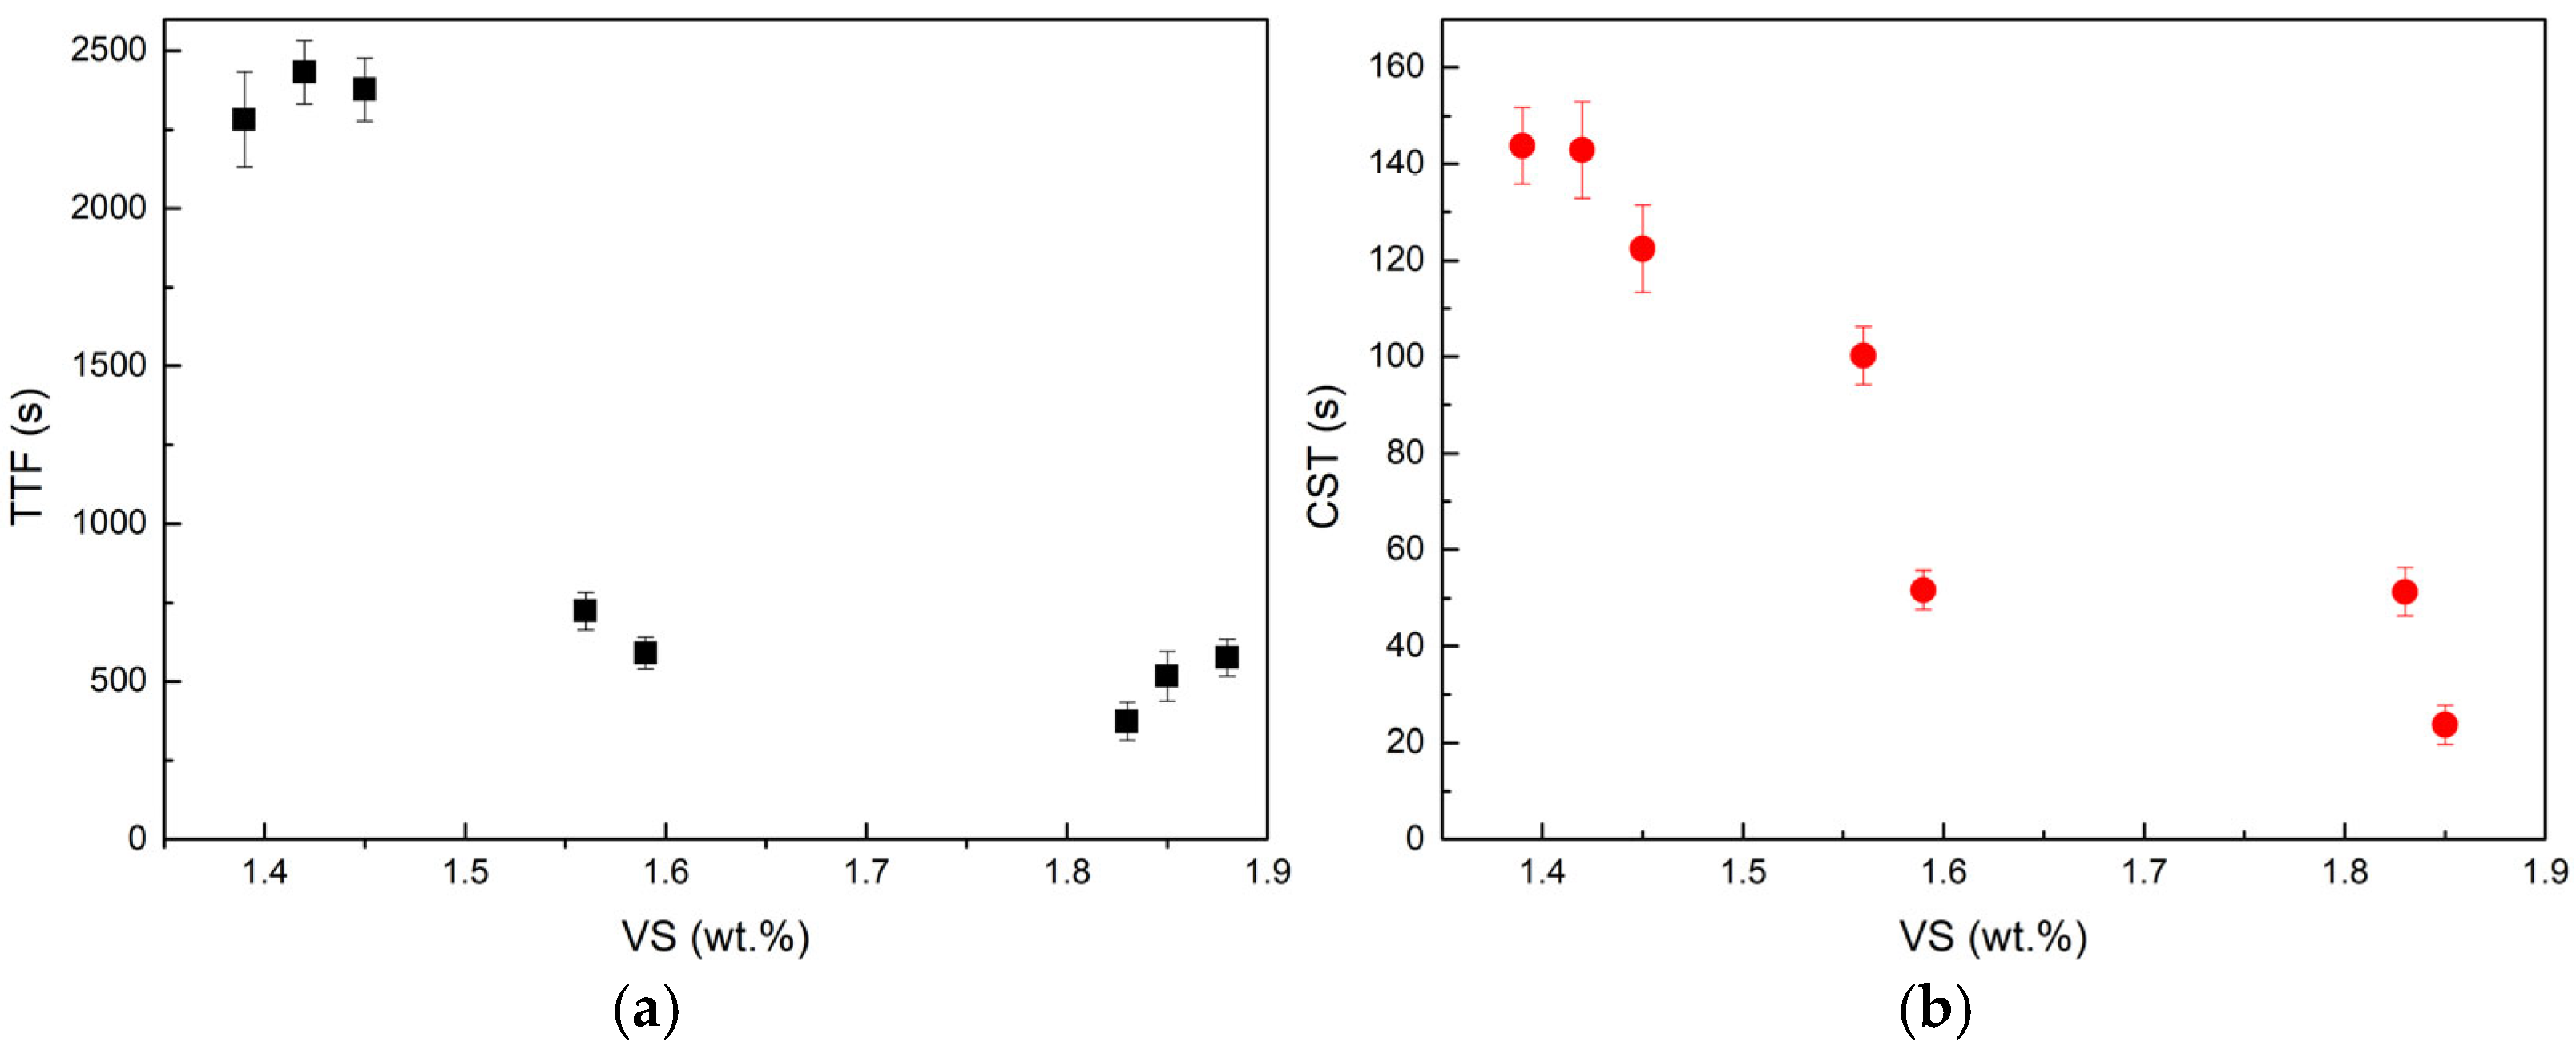
The volatile solids (VS) content of sludge directly reflects the proportion of organic matter, which is closely associated with viscosity and capillary suction time (CST). Figure 3 shows the relationship between VS. (1.3–1.9 wt.%) and dewatering metrics (TTF and CST).
A pronounced reduction in TTF was observed as VS. an increased above approximately 1.6 wt.% (Figure 3a). Sludges with VS < 1.6 wt.% exhibited prolonged filtration times exceeding 2000 s, indicating poor dewaterability. In contrast, sludges with higher organic fractions (VS > 1.8 wt.%) showed significantly shorter TTF values of less than 500 s. This suggests that insufficient organic matter leads to weak cake structures and higher filtration resistance, whereas adequate VS content stabilizes floc structure and facilitates water release.
CST followed a similar trend (Figure 3b). Low VS sludges (~1.4 wt.%) exhibited CST values greater than 140 s, whereas sludges with VS above 1.8 wt.% showed CST values below 60 s. These results imply that organic-rich sludges, with higher levels of extracellular polymeric substances (EPS), are more amenable to polymer conditioning and produce improved flocculation and permeability during dewatering.
Taken together, VS serves as a key indicator of sludge dewaterability alongside TS. The high organic fraction of the sludge used in this study (~65% VS in dry solids) explains the strong relationship between viscosity, CST, and TTF observed in our results. These observations highlight the importance of considering sludge composition when evaluating dewatering behavior and optimizing control algorithms.

3.1.3. Viscosity

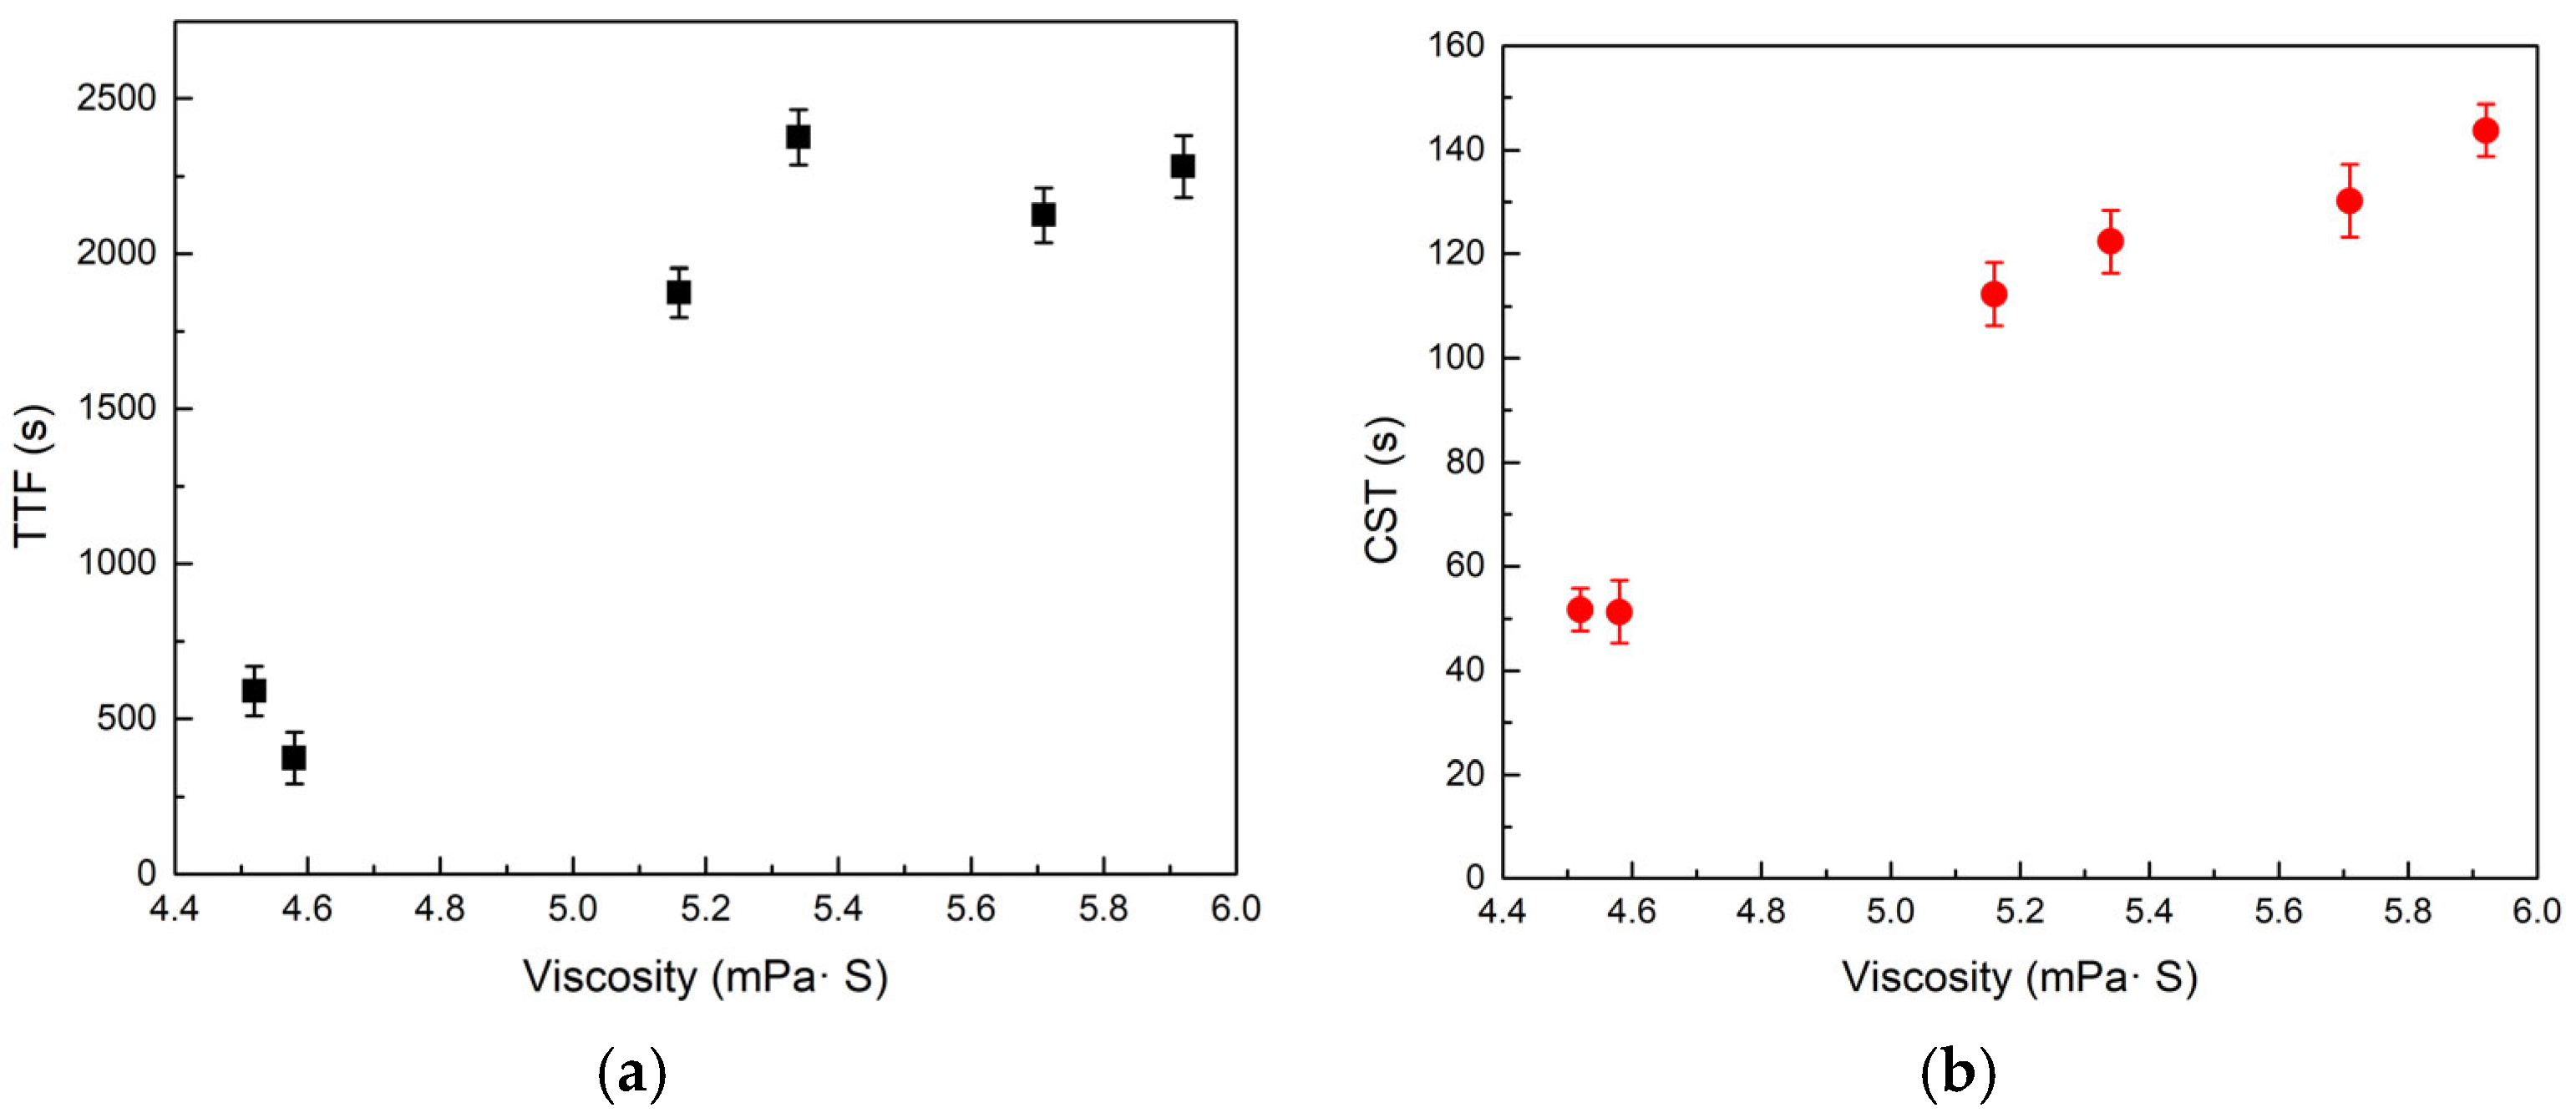
Sludge viscosity closely correlates with TS while also reflecting influences from temperature and extracellular polymeric substances. It functions as an aggregate indicator of sludge consistency and resistance to flow. Experimental results revealed a strong correlation between viscosity and key dewaterability metrics such as time-to-filter (TTF) and capillary suction time (CST). Figure 4 illustrates that sludge viscosities ranging approximately from 4.5 to 6 mPa·s corresponded to TTF values spanning several hundred seconds to nearly 2500 s. An exponential-like increase in TTF occurred once viscosity surpassed approximately 5 mPa·s; for instance, sludge with viscosity around 4.6 mPa·s exhibited TTF values of approximately 300–500 s, whereas viscosity levels of 5.5–6.0 mPa·s resulted in TTF values of 2000–2400 s. Similarly, Figure 4 demonstrates that CST rose from roughly 50–60 s at a viscosity of 4.5 mPa·s to over 130 s at 5.8 mPa·s.
These findings highlight a critical viscosity threshold near 5 mPa·s, beyond which sludge dewaterability sharply deteriorates. Therefore, a viscosity of 5 mPa·s was selected as a significant breakpoint in the proposed control logic: sludge exhibiting viscosity at or above this threshold is classified as high-viscosity sludge, necessitating increased coagulant dosing or additional interventions to improve filtration performance. Conversely, sludge below this threshold presents comparatively lower dewatering resistance and responds adequately even to reduced polymer doses. Elevated sludge viscosity typically signifies higher solids concentrations or greater bound water content, often resulting from extracellular polymeric substances and bio-floc proteins—both substantially elevating filtration resistance. Practically, viscosity measurements rapidly characterize sludge properties beyond what TS measurements alone convey, as sludges of identical TS levels may exhibit varying viscosities due to differences in filamentous bacteria or extracellular polymer content. The data confirm that viscosity effectively predicts the required dewatering effort, consistent with its integration in advanced control systems such as RheoScan, which utilize optical viscosity measurements for polymer dose optimization. Given the high organic fraction of our sludge (~65% volatile solids), such EPS-related effects are pronounced: the abundance of biopolymers likely amplified the viscosity increase and corresponding decline in dewaterability observed.
TTF increases dramatically with slight increases in viscosity above ~5 mPa·s. Each point is an average of duplicate runs. The steep rise beyond 5 mPa·s (vertical dashed line) highlights the threshold used in the control algorithm for distinguishing low VS, high viscosity sludge. Higher viscosity correlates with longer CST (slower initial dewatering rate). Sludges below ~4.8 mPa·s had CST around 50–60 s, whereas those above ~5.5 mPa·s showed CST near 140–150 s. This trend parallels the TTF behavior and underscores that viscosity strongly affects how readily water is removed from sludge. This relationship is similar to previous research results, which also reported that increasing sludge viscosity is associated with poorer dewaterability metrics [18,19].

3.1.4. Temperature

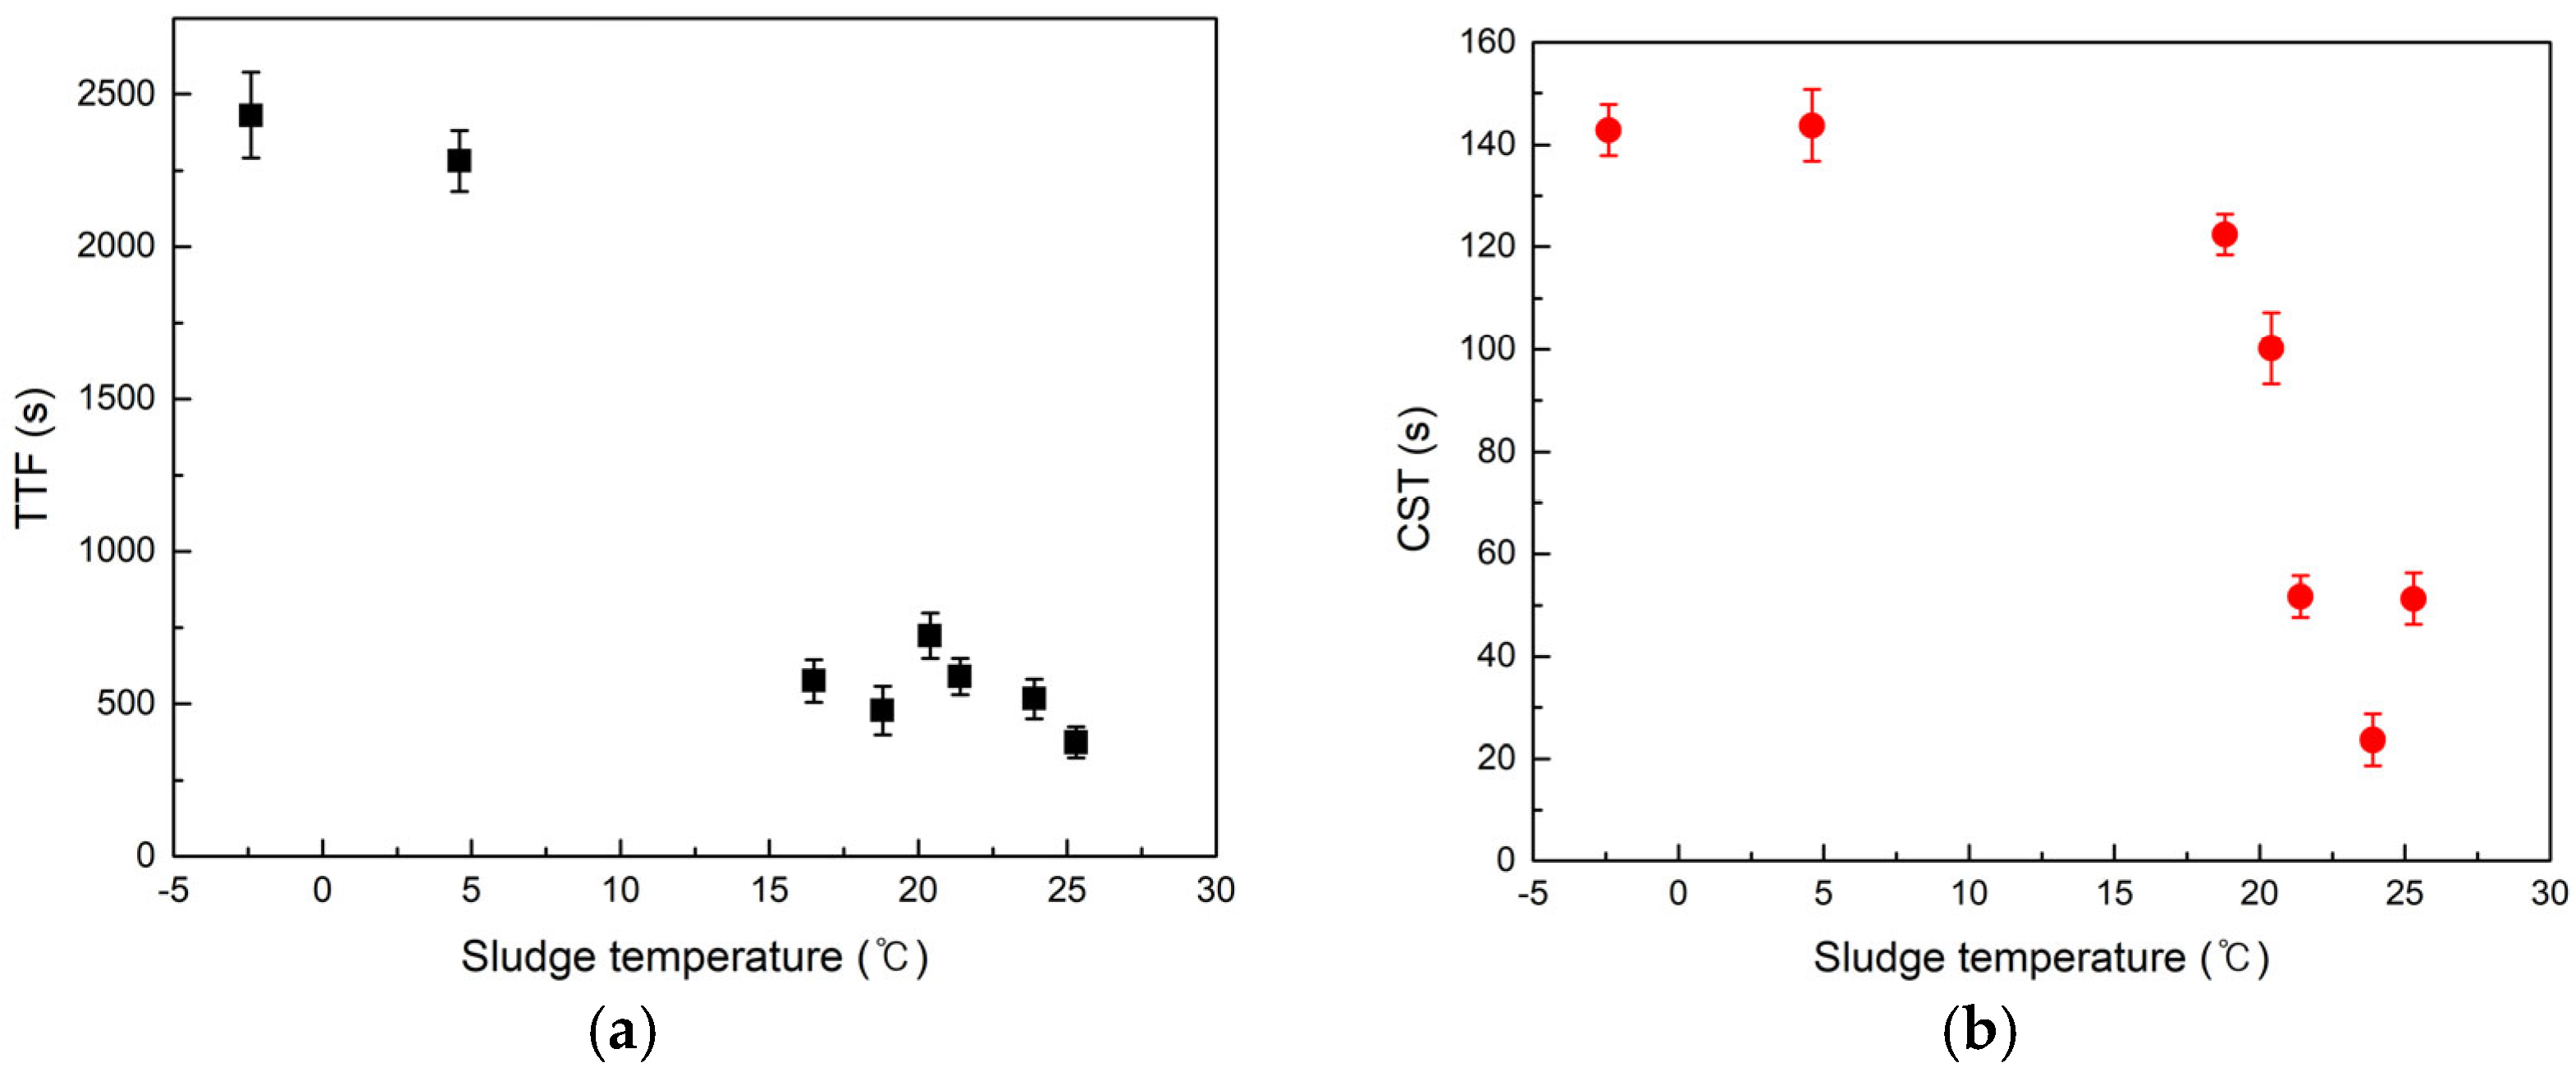
Sludge temperature strongly influences dewatering by altering fluid viscosity and polymer conditioning kinetics. Colder temperatures increase sludge viscosity and slow flocculation reactions, leading to poorer dewatering [20,21,22]. Our experiments (spanning cool winter field conditions and warmer lab tests) confirm this effect.
Figure 5a shows TTF results for sludge dewatered at different temperatures (~–2 °C up to ~25 °C). There is a clear trend of improving dewatering with higher temperature, a similar trend to previous studies [23]. At near-freezing (~0 ± 2 °C), TTF values were extremely high (~2200–2400 s), indicating very slow dewatering (in fact, sludge dewatering performance is known to deteriorate drastically at such low temperatures [20]). In contrast, by ~20–25 °C, TTF dropped to ~400–700 s. The relationship is nonlinear: the most dramatic improvements occur in the lower range (e.g., warming from 5 °C to 15 °C yields a far larger TTF reduction than going from 15 °C to 25 °C). This suggests that cold sludge suffers greatly in dewatering efficiency, likely because (1) water viscosity increases by roughly 30–50% when cooling from 20 °C to 5 °C, directly reducing filtration rates; (2) polymer/coagulant efficacy is lower at low temperatures (slower floc formation and reduced polymer chain flexibility) [24,25]; and (3) the sludge flocs’ physical structure can trap more water at low temperature (the floc network becomes less pliable), which is consistent with the notion that floc properties strongly determine dewaterability [4,26].
Figure 5b reinforces this pattern: CST was ~140–150 s at ~2–4 °C, improving to ~50–60 s by ~25 °C. Notably, even a minor temperature rise in the near-freezing range had an outsized effect. For instance, in one winter field test, increasing the sludge temperature from 2.4 °C to 3.7 °C (only +1.3 °C) nearly halved the CST (from ~125 s to ~60 s), as highlighted by the data in Figure 6 (inset). This dramatic improvement at ~0–5 °C underscores how critical it is to account for temperature in any dewatering operation—even small increases can significantly enhance dewatering performance [27]. Colder temperatures thus dramatically increase filtration time: at ~0–5 °C, TTF was on the order of four to five times longer than at ~20 °C, whereas warmer sludge exhibits much faster dewatering onset (lower CST). The curve also suggests diminishing returns at the high end (the difference between 20 °C and 25 °C is relatively small), indicating an asymptotic approach to an optimum as temperature rises (similarly, some studies found little benefit beyond a certain optimal temperature range) [23]. Overall, these observations echo earlier research findings that sludge dewaterability is highly temperature-sensitive, especially in the near-freezing range [20]. Error bars in Figure 4 indicate ±1 SD for replicate tests at select points, illustrating the consistency of these trends.

3.2. Coagulant (POAE) Dose and Indicators

The effect of POAE (polyoxyethylene alkyl ether) dosage on sludge dewatering was investigated through time-to-filter (TTF), pH variation, and zeta potential measurements. These parameters are widely used indicators of polymer conditioning performance and provide real-time feedback for optimizing dosage during filter press operations.
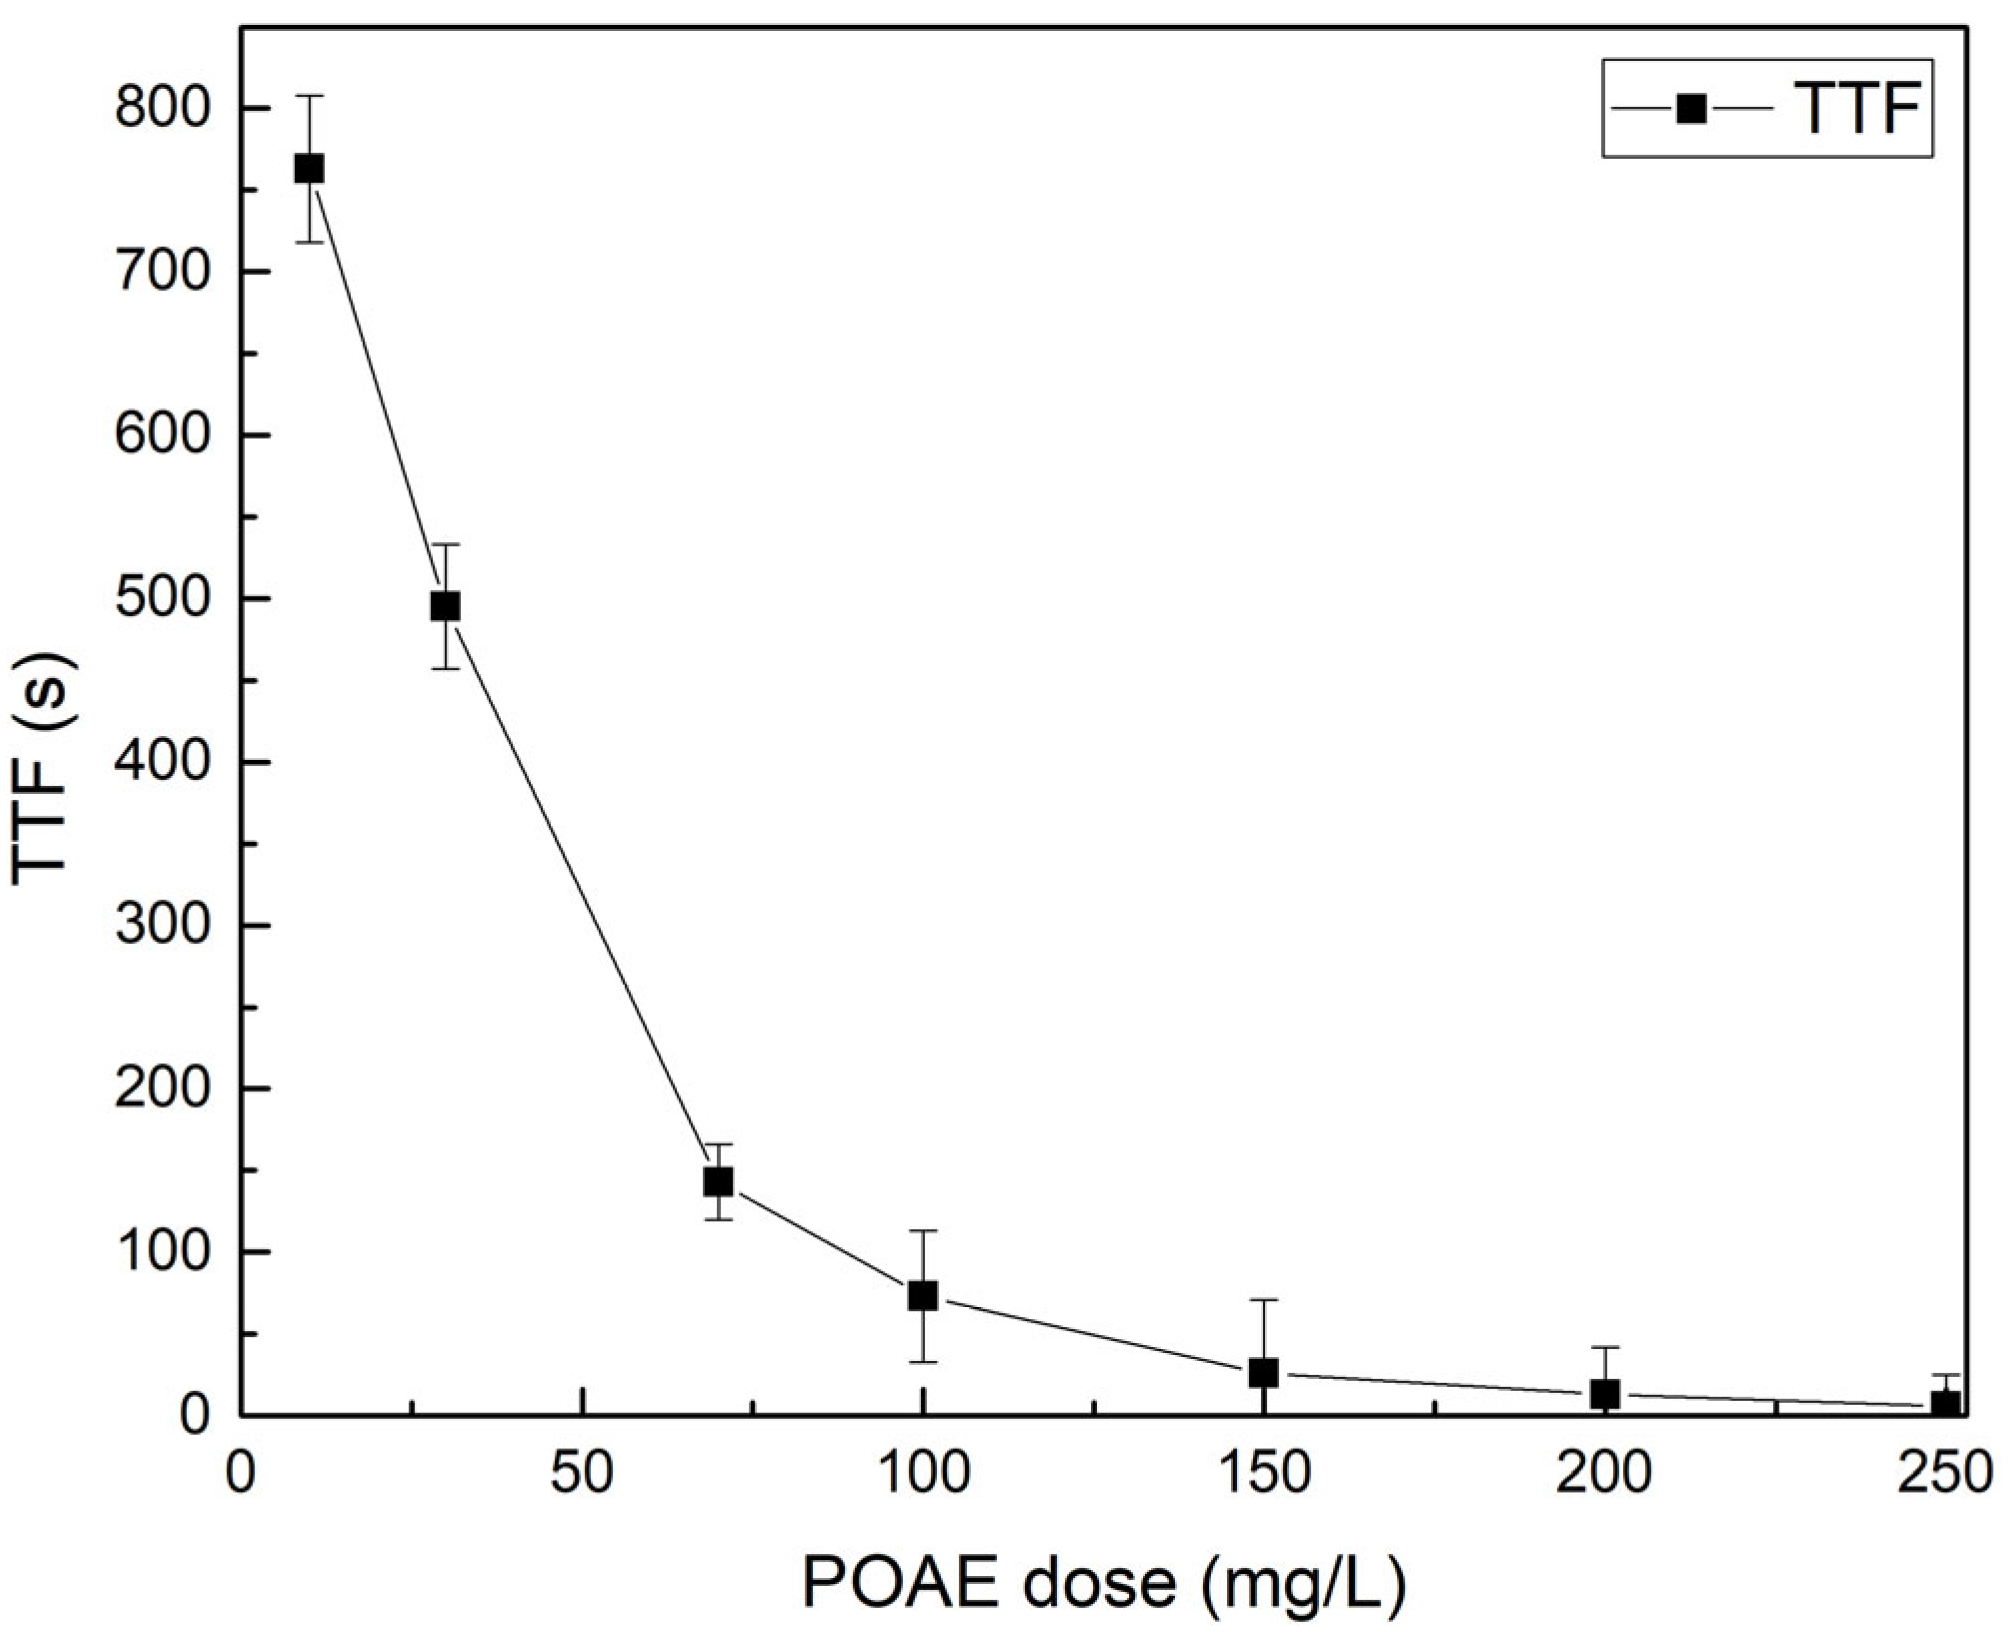
Increasing the dosage of POAE markedly improves sludge dewatering efficiency up to an optimal range. As shown in Figure 6, the TTF of conditioned sludge drops sharply with rising POAE dose, indicating faster water release and better dewaterability. For example, increasing a cationic polymer dose from 0 to 25 mg/L was reported to shorten CST (capillary suction time, analogous to TTF) from ~21 s to ~15 s, with an optimal dose around 15 mg/L, beyond which no further gains were observed [28]. Such behavior is typical of polymer conditioning: insufficient dose leaves many colloids unflocculated, whereas an adequate dose neutralizes particle charges and forms large flocs, dramatically reducing filtration resistance [28]. Indeed, at optimum polymer dosing, studies have noted >90% reductions in dewatering indices like CST and SRF (specific resistance to filtration) compared to untreated sludge [29]. Beyond the optimal (~100–150 mg/L POAE in this study), TTF plateaued, consistent with diminishing returns or even slight restabilization when overdosing occurs.
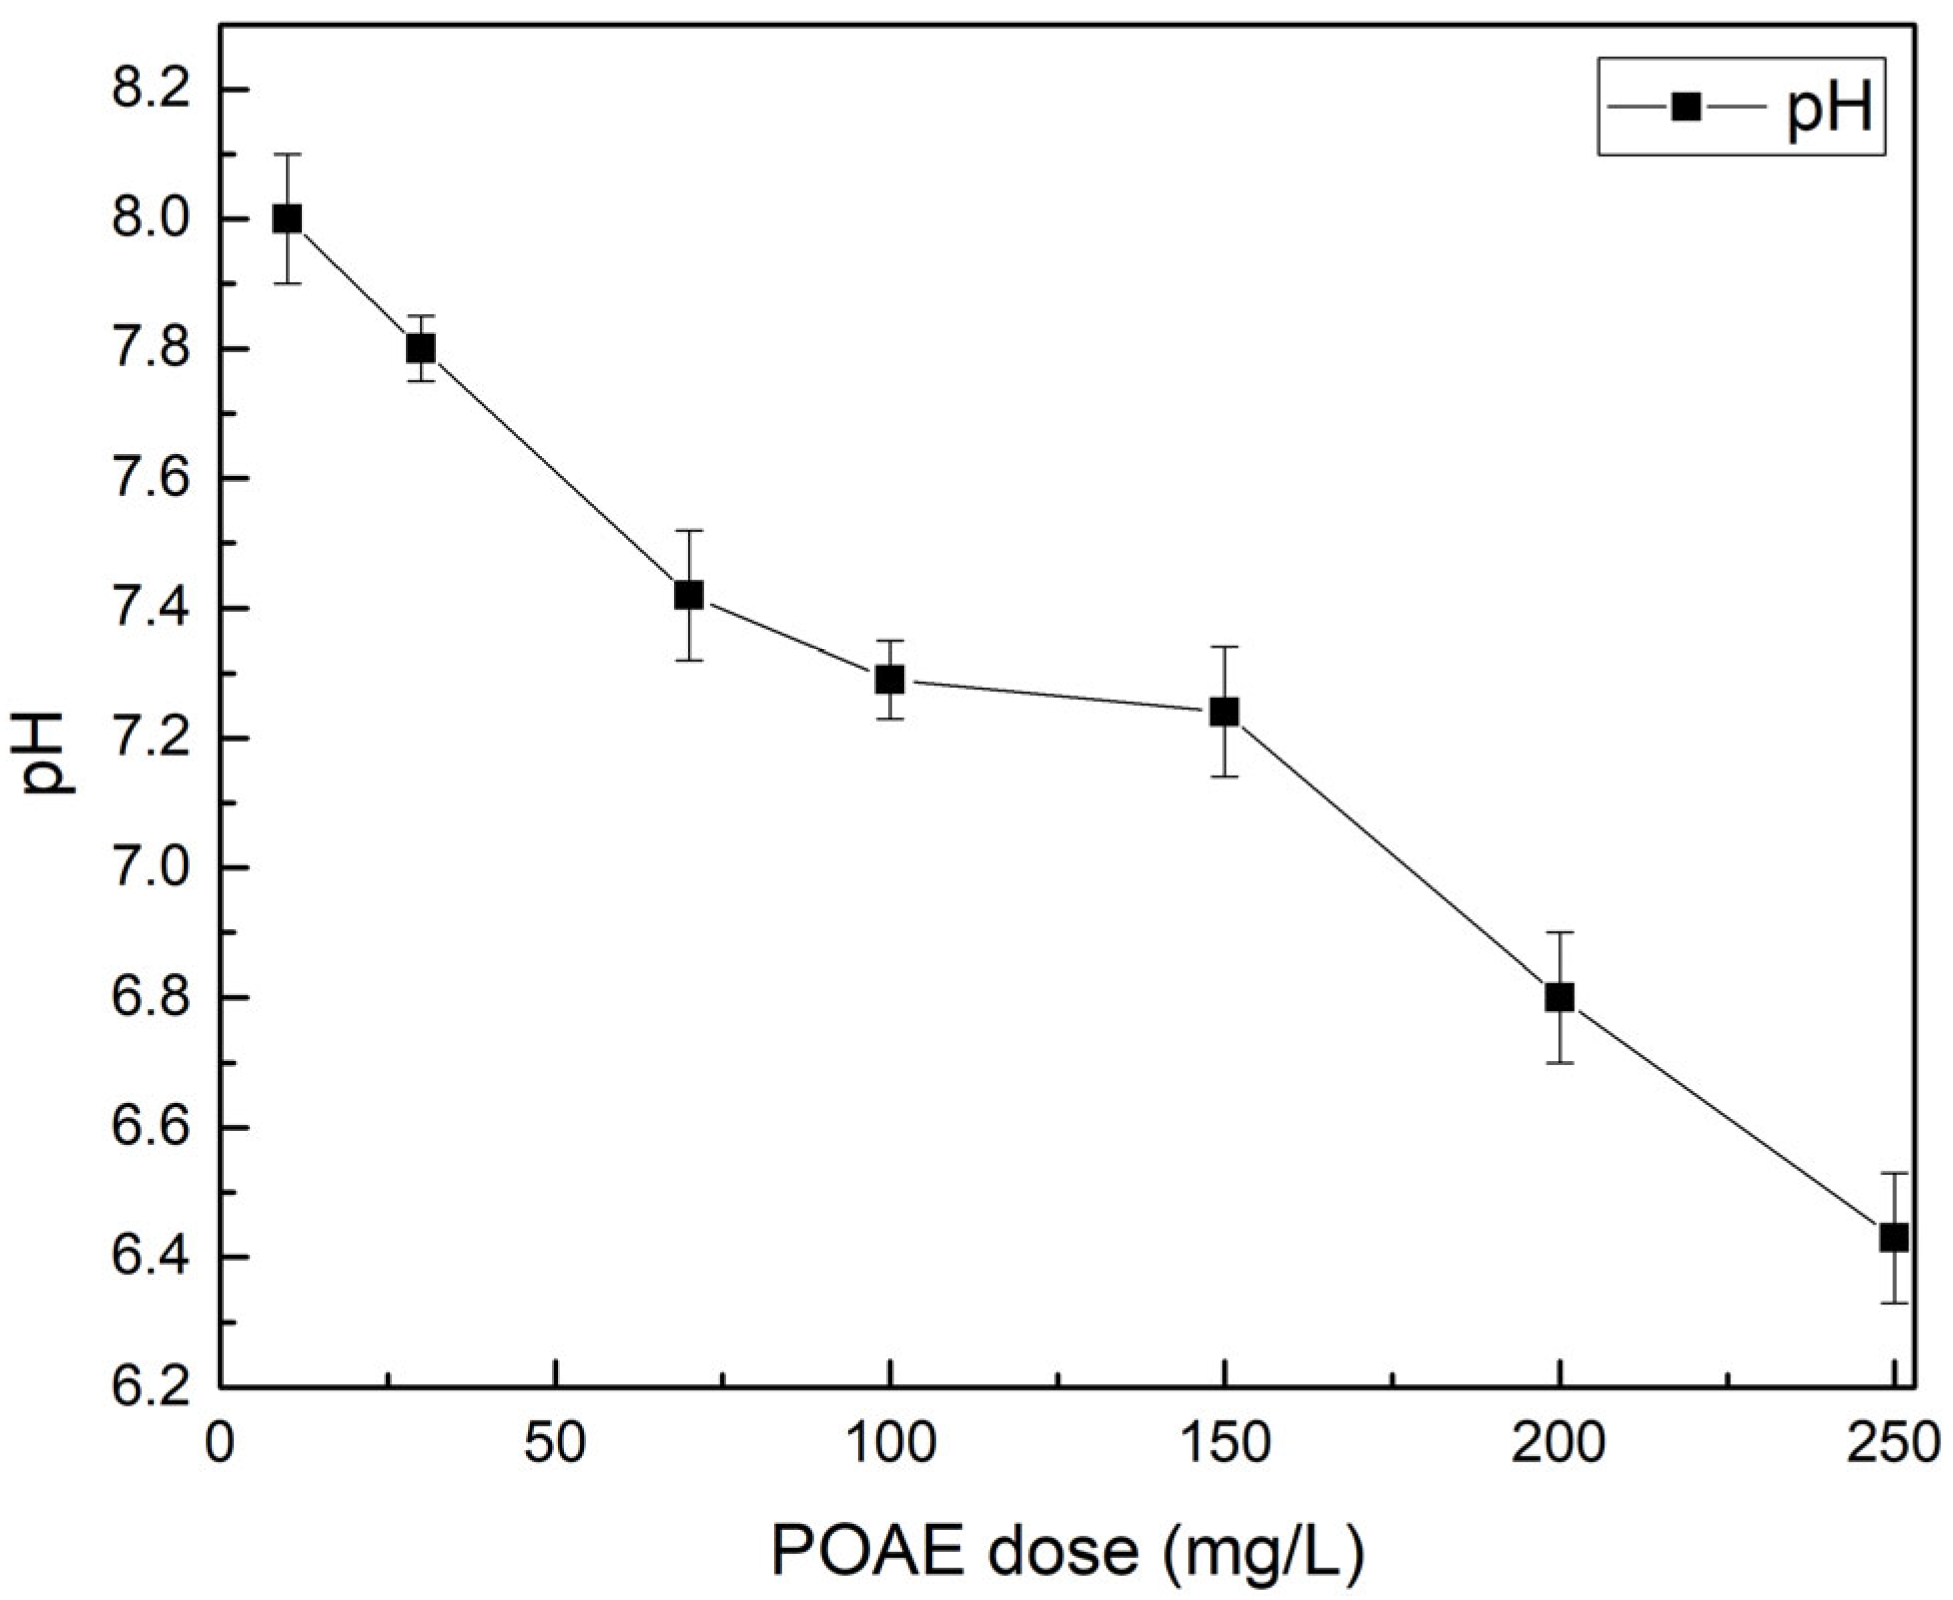
POAE addition was also found to affect sludge pH significantly (Figure 7). As the coagulant dose increased, the filtrate pH decreased measurably, indicating acidification of the sludge system. This pH drop (ΔpH) provides a convenient operational proxy for coagulant action: a larger ΔpH implies more polymer has reacted with the sludge. Prior research confirms that adding cationic coagulants can consume alkalinity and lower the sludge pH in proportion to dose [30]. For instance, Wang et al. observed that higher doses of metal coagulants drove sludge pH progressively lower, evidencing an ongoing hydrolytic acidification during charge neutralization [30]. In practical terms, the magnitude of pH depression can serve as a real-time indicator of dosing adequacy—once the pH has dropped into a target range, the polymer dose is likely sufficient. This approach could enable operators to move away from trial-and-error dosing; instead, monitoring ΔpH online offers immediate feedback to fine-tune polymer addition.
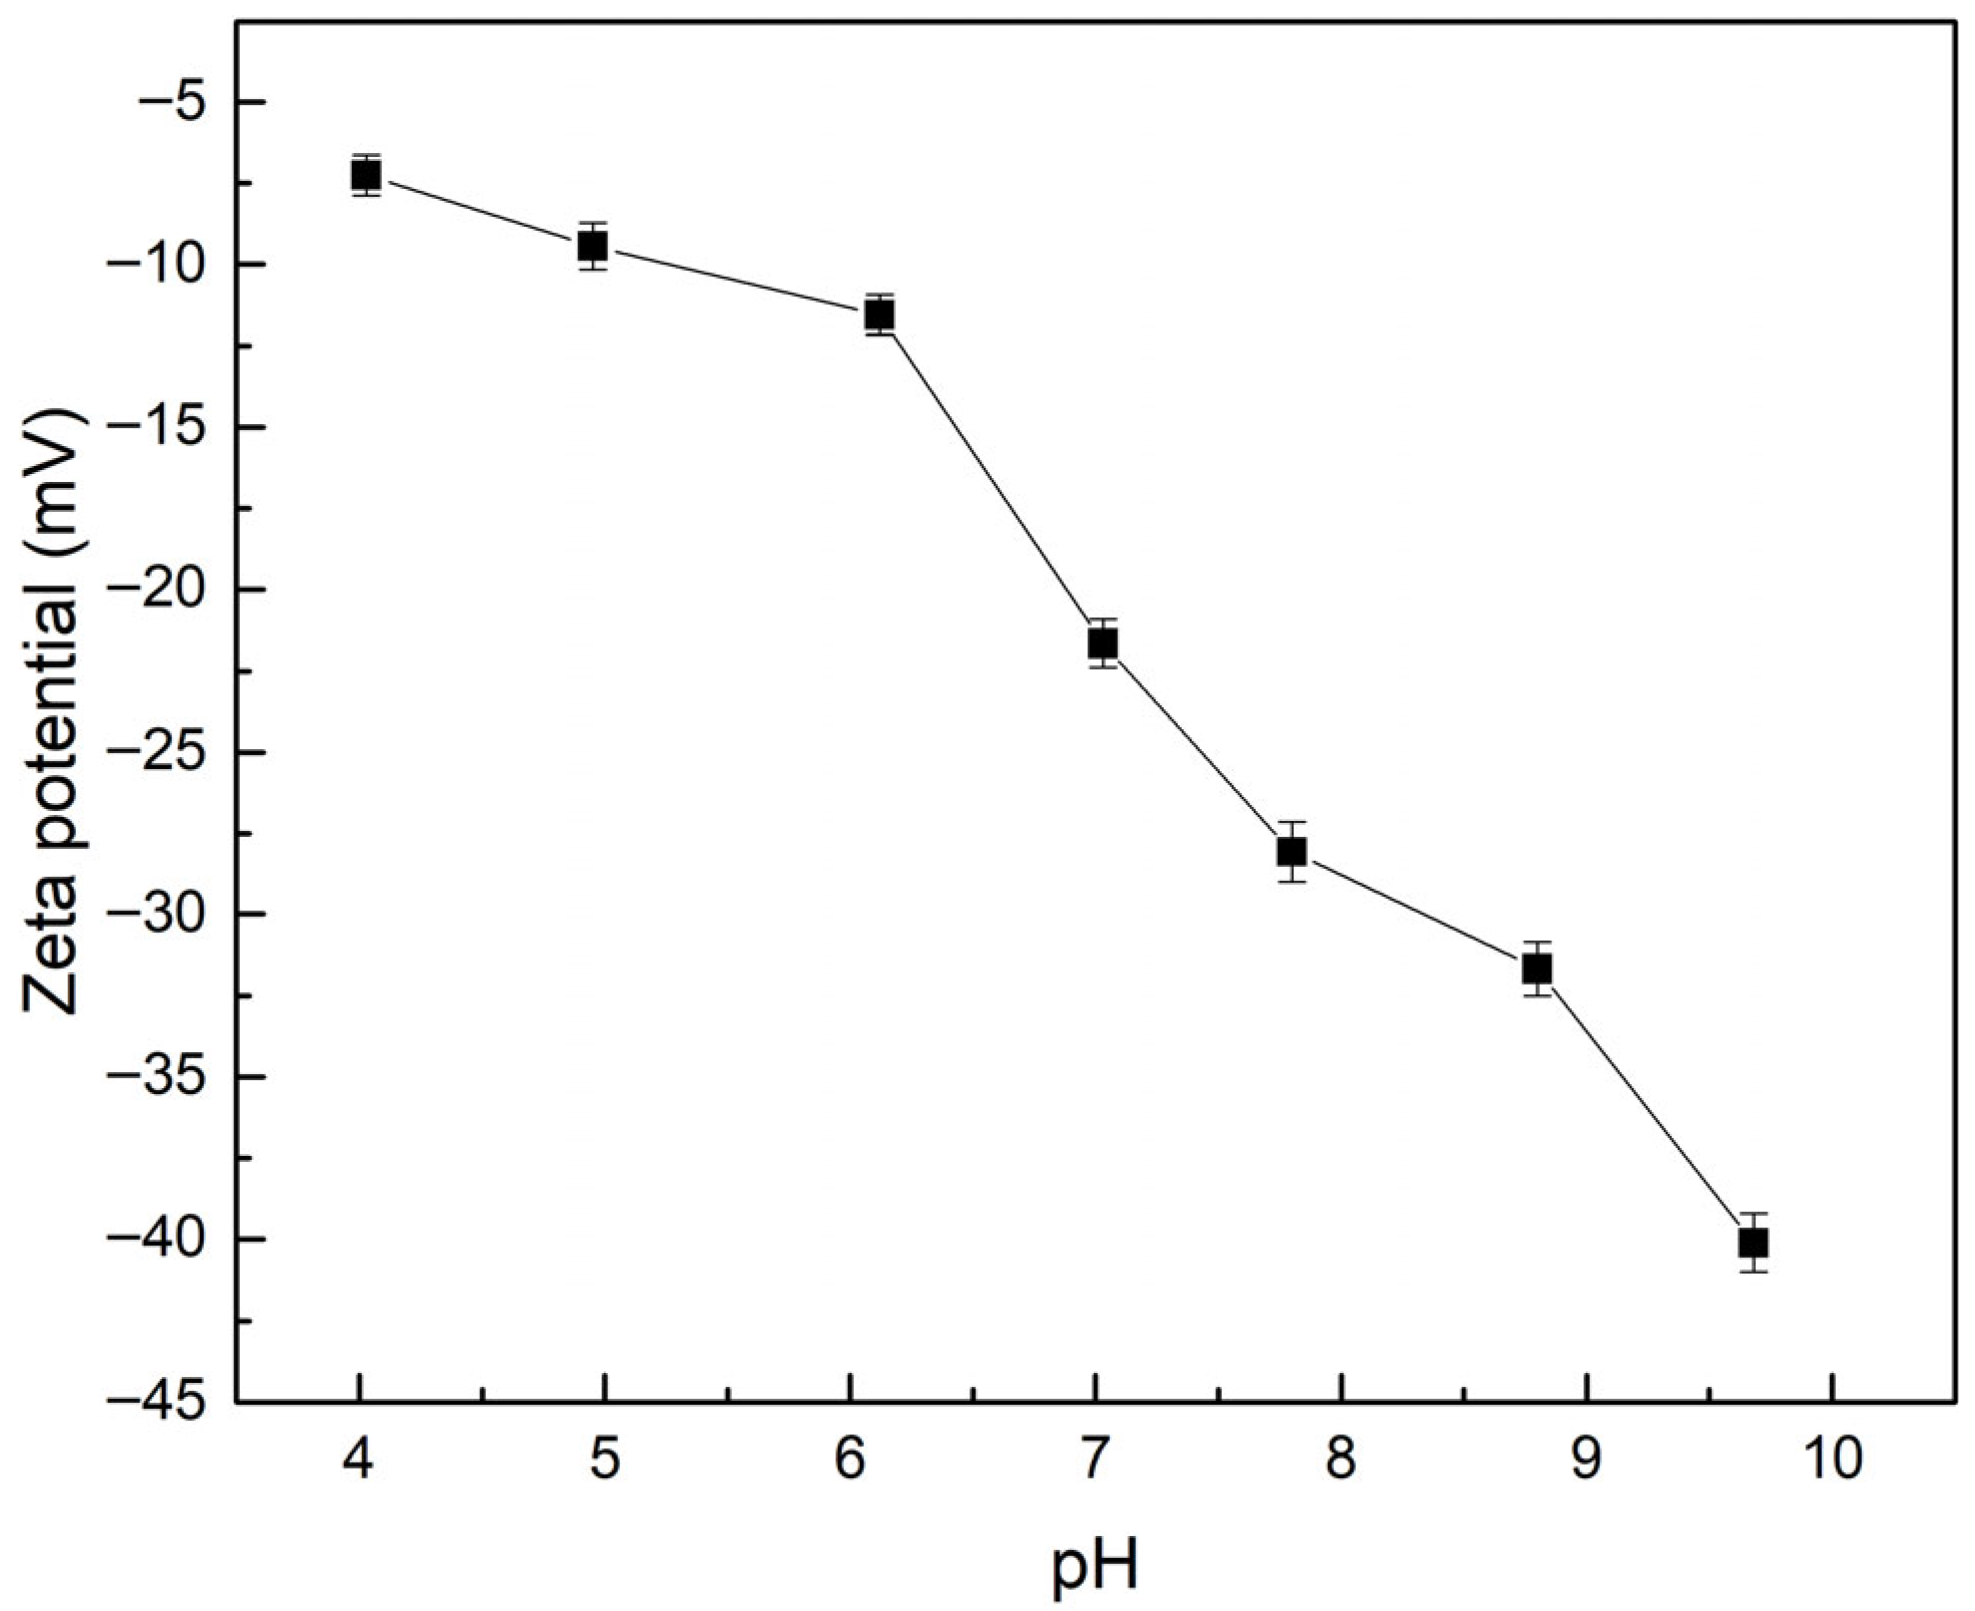
The improvement in dewatering at optimal POAE dose is closely tied to changes in sludge zeta potential. Figure 8 shows that as POAE dosing increases (and pH falls), the zeta potential of sludge flocs shifts from highly negative toward zero. Initially, raw sludge has a negative surface charge (e.g., −10 to −30 mV range is common), which stabilizes colloids and impedes dewatering [31]. POAE being cationic will neutralize these charges. At the optimal dose, the sludge zeta potential was observed to approach ~0 mV, corresponding to maximal charge neutralization and flocculation. This trend agrees with colloidal destabilization theory: when zeta potential is near zero, electrostatic repulsion is minimized and particles aggregate most effectively, yielding larger, faster-settling flocs. Numerous studies have documented that the best dewatering occurs at or near the isoelectric point of the sludge particles [14,31]. For example, Yousefi et al. identified an optimum polymer dose by the point at which zeta potential plateaued and turbidity removal peaked, noting that beyond this dose, further polymer made zeta potential positive and provided no additional benefit [14]. Overdosing can actually reverse the charge (making sludge positively charged) and re-stabilize the suspension, which explains the plateau or slight increase in TTF observed at very high POAE doses (a phenomenon also reported with other coagulants) [32].
From a mechanistic standpoint, the efficacy of POAE stems from a combination of charge neutralization and polymer–particle interactions. The cationic POAE adsorbs onto negatively charged sludge particles, neutralizing their surface charge and compressing the electric double layer [31]. This reduces electrostatic repulsion so that particles can approach and bind. Additionally, the polymer chains may bridge between particles (especially if POAE has sufficient molecular size), forming larger flocs through inter-particle linkages [14]. At the optimal pH (~5–7 in many cases) and dose, both mechanisms act in concert: charge neutralization brings zeta potential to ~0, and polymer bridging yields dense, rapid-settling flocs [32]. The net result is a sludge floc network that releases water readily under filtration or centrifugation. If the dose is too low, charge neutralization is incomplete (zeta remains strongly negative) and sludge colloids stay dispersed; if too high, charge reversal can occur, introducing new positive–positive repulsion and excessive polymer residual, which can trap water [14]. Thus, there exists a clear optimum dose where sludge charge is best neutralized without significant overshoot.
Operationally, these findings suggest that real-time monitoring of pH and/or zeta potential can guide polymer dosing in full-scale dewatering processes. Rather than relying on fixed dosages or periodic jar tests, a plant could target a specific filtrate pH drop (for instance, a ΔpH that historically corresponds to optimal conditioning) as a trigger to adjust POAE feed. This is analogous to practices in water treatment, where reaching a certain pH or streaming current setpoint signifies optimal coagulant dose [33]. In fact, full-scale trials with streaming current detectors (which effectively measure charge neutralization status of sludge filtrate) have successfully automated polymer dosage control by maintaining a slight negative charge residual. By the same token, maintaining sludge zeta potential near zero (within a few millivolts of neutrality) can serve as a direct indicator of optimal charge neutralization and coagulation efficiency [31]. Implementing such feedback control—using pH as a surrogate measure and/or online zeta potential/streaming current measurements—would allow continuous optimization of POAE dosing. This approach ensures consistently low TTF (or CST) and improved cake solids, without the need for constant manual re-optimization. In summary, the dose–response relationships (POAE, VS, TTF, pH, pressure, and zeta potential) demonstrate that monitoring simple parameters like pH and zeta potential can reliably indicate sludge conditioning performance, enabling more responsive and efficient polymer dosing in dewatering operations.

3.3. System Performance Under Integrated Real-Time Control

The overall performance of real-time controlled dewatering compared with static operation is summarized in Table 2, highlighting improvements in final cake moisture, filtrate recovery, coagulant dosing strategy, and pressure application. These results demonstrate that dynamic control provides substantial benefits relative to fixed operating conditions.
As summarized in Table 2, real-time pressure control resulted in lower final cake moisture (<65%) and higher filtrate recovery (>450 g) compared with static operation. These performance gains can be explained by the underlying filtration dynamics. The fluid dynamics of sludge compression filtration can be interpreted through Darcy’s law and the concept of filter cake compressibility. According to Darcy’s law, the filtration flux is directly proportional to the pressure gradient and inversely proportional to the overall filtration resistance [34]. In the early phase of filtration, only the medium resistance (e.g., filter cloth) is dominant, allowing high initial flux. As filtration progresses, suspended sludge solids accumulate on the filter surface and form a thickened cake layer, leading to increased resistance and a corresponding decline in flux. For compressible cakes, such as those formed by sewage sludge, an increase in applied pressure results in denser packing of particles, which further increases the specific resistance of the cake. This behavior offsets the theoretical gain in flux expected from pressure increment, and in some cases, may even reduce flux [35]. This phenomenon has been previously reported in filtration studies involving activated sludge, where excessive pressure was shown to densify the cake without improving filtrate yield. Once highly compacted, the filter cake exhibits irreversible structural deformation, making it impossible to recover its original permeability by subsequent pressure reduction. This pressure history effect causes long-term deterioration in filtration efficiency. Hence, pressure management is critical in sludge dewatering systems, and stepwise pressurization is often recommended to avoid early over-compression.
Experimental observation under real-time pressure control revealed behavior consistent with compressible cake theory. As shown in Figure 9, cumulative filtrate mass increased over time in a parabolic fashion. Approximately 100 g of filtrate was collected within the first 5 min, and around 300 g by 30 min. The rate of accumulation gradually declined and plateaued near 450 g at the 60 min mark. This trend indicates an initially high flux that decreased as the cake thickened, in agreement with classical compressible filtration theory [34].
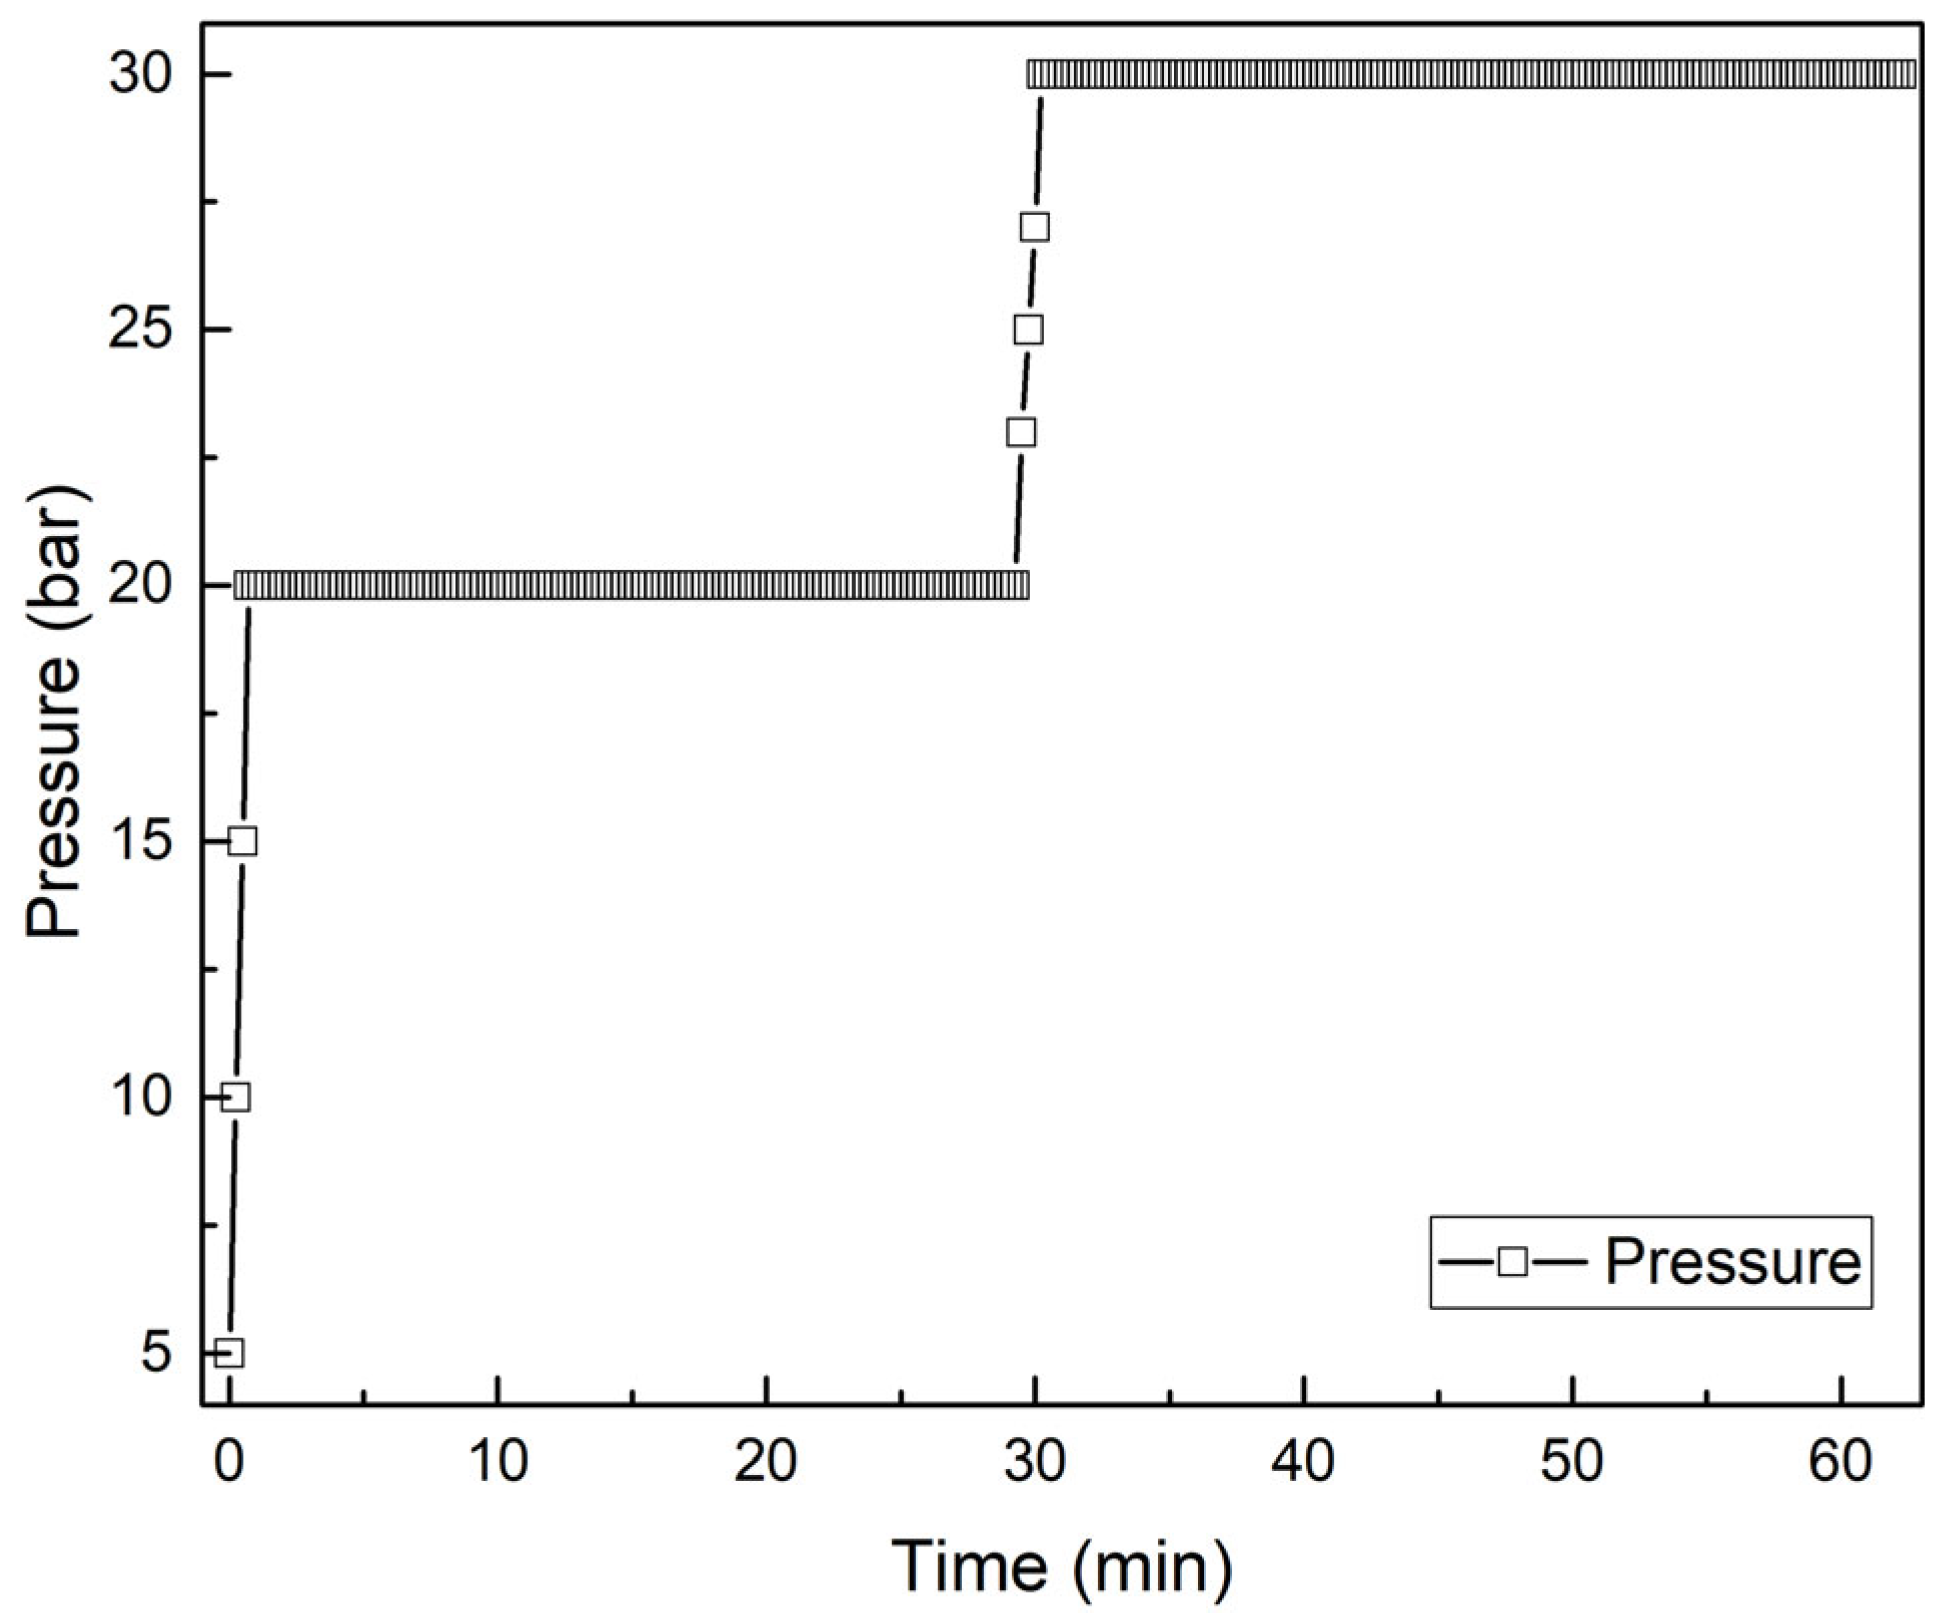
Notably, when dynamic pressure control was applied, the total filtrate recovery (~450 g) exceeded that achieved under a constant-pressure regime (e.g., 20 bar throughout). Literature reports that even doubling pressure from 0.3 MPa to 0.6 MPa often results in only marginal additional filtrate volume (e.g., moisture content reduction from 82.6% to 80.4%) [36]. In contrast, in the present study, increasing pressure from 20 bar to 30 bar after 30 min enabled an additional reduction in cake moisture content by more than 10 percentage points, indicating a significantly enhanced dewatering effect through pressure staging (Figure 10). This performance enhancement aligns with the dual-phase filtration–compression strategy described by La Heij et al. [37], where a first filtration stage at 0.3–0.4 MPa achieved 60–65% cake moisture, while reaching below 40% moisture required extremely high pressures (6–10 MPa). In the present work, final cake moisture reached approximately 65% using a maximum pressure of 3 MPa, representing optimal dewatering within practical pressure limits. Similar trends were reported by Zhao and Bache, who observed diminishing returns in dewatering efficiency beyond certain pressure and time thresholds [38]. Wu et al. [39] also identified critical pressure limits beyond which further pressurization negatively impacted dewatering kinetics. These findings corroborate the effectiveness of pressure step-up strategies to maximize dewatering performance.
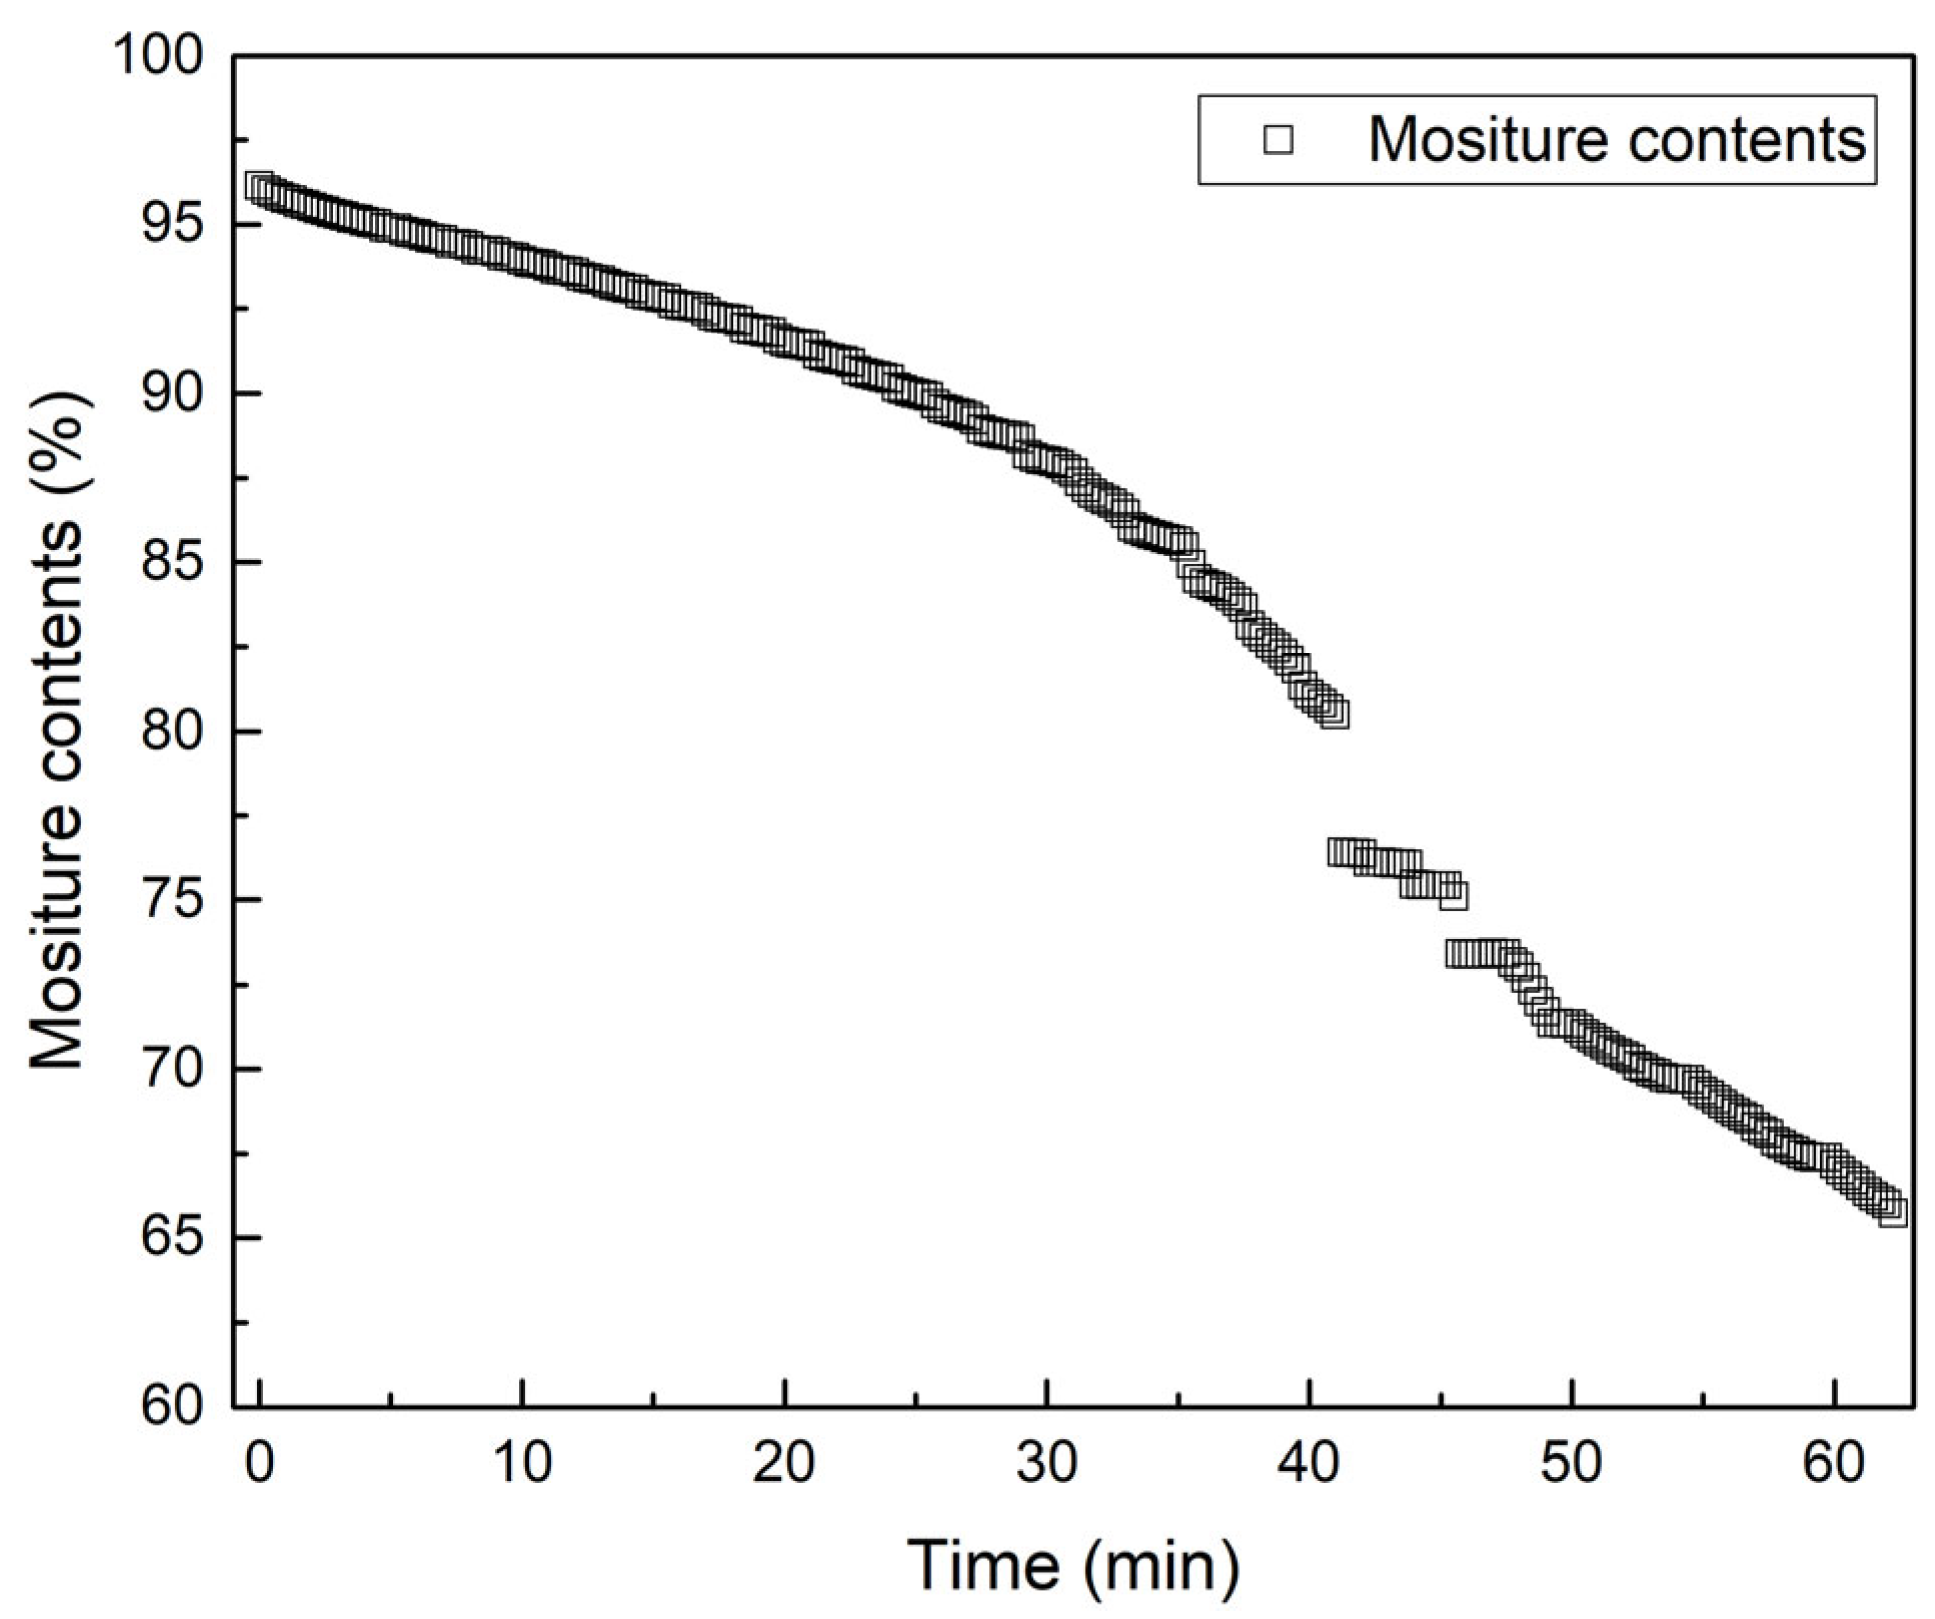
As shown in Figure 11, cake moisture content gradually decreased from ~95% to ~85% during the initial 30 min filtration period under 20 bar pressure. Upon increasing pressure to 30 bar, the rate of moisture reduction accelerated, with final moisture content reaching ~65% by the end of 60 min. In comparison, a fixed-pressure test at 20 bar yielded only ~75–80% moisture, confirming that real-time pressure adjustment significantly enhanced dewatering efficiency [37,38]. The resulting cake dryness (~65% moisture) exceeds the typical performance of centrifuge or vacuum filtration, which often yields 80% or higher moisture, and thereby reduces energy demand in downstream processes such as thermal drying or incineration [40].
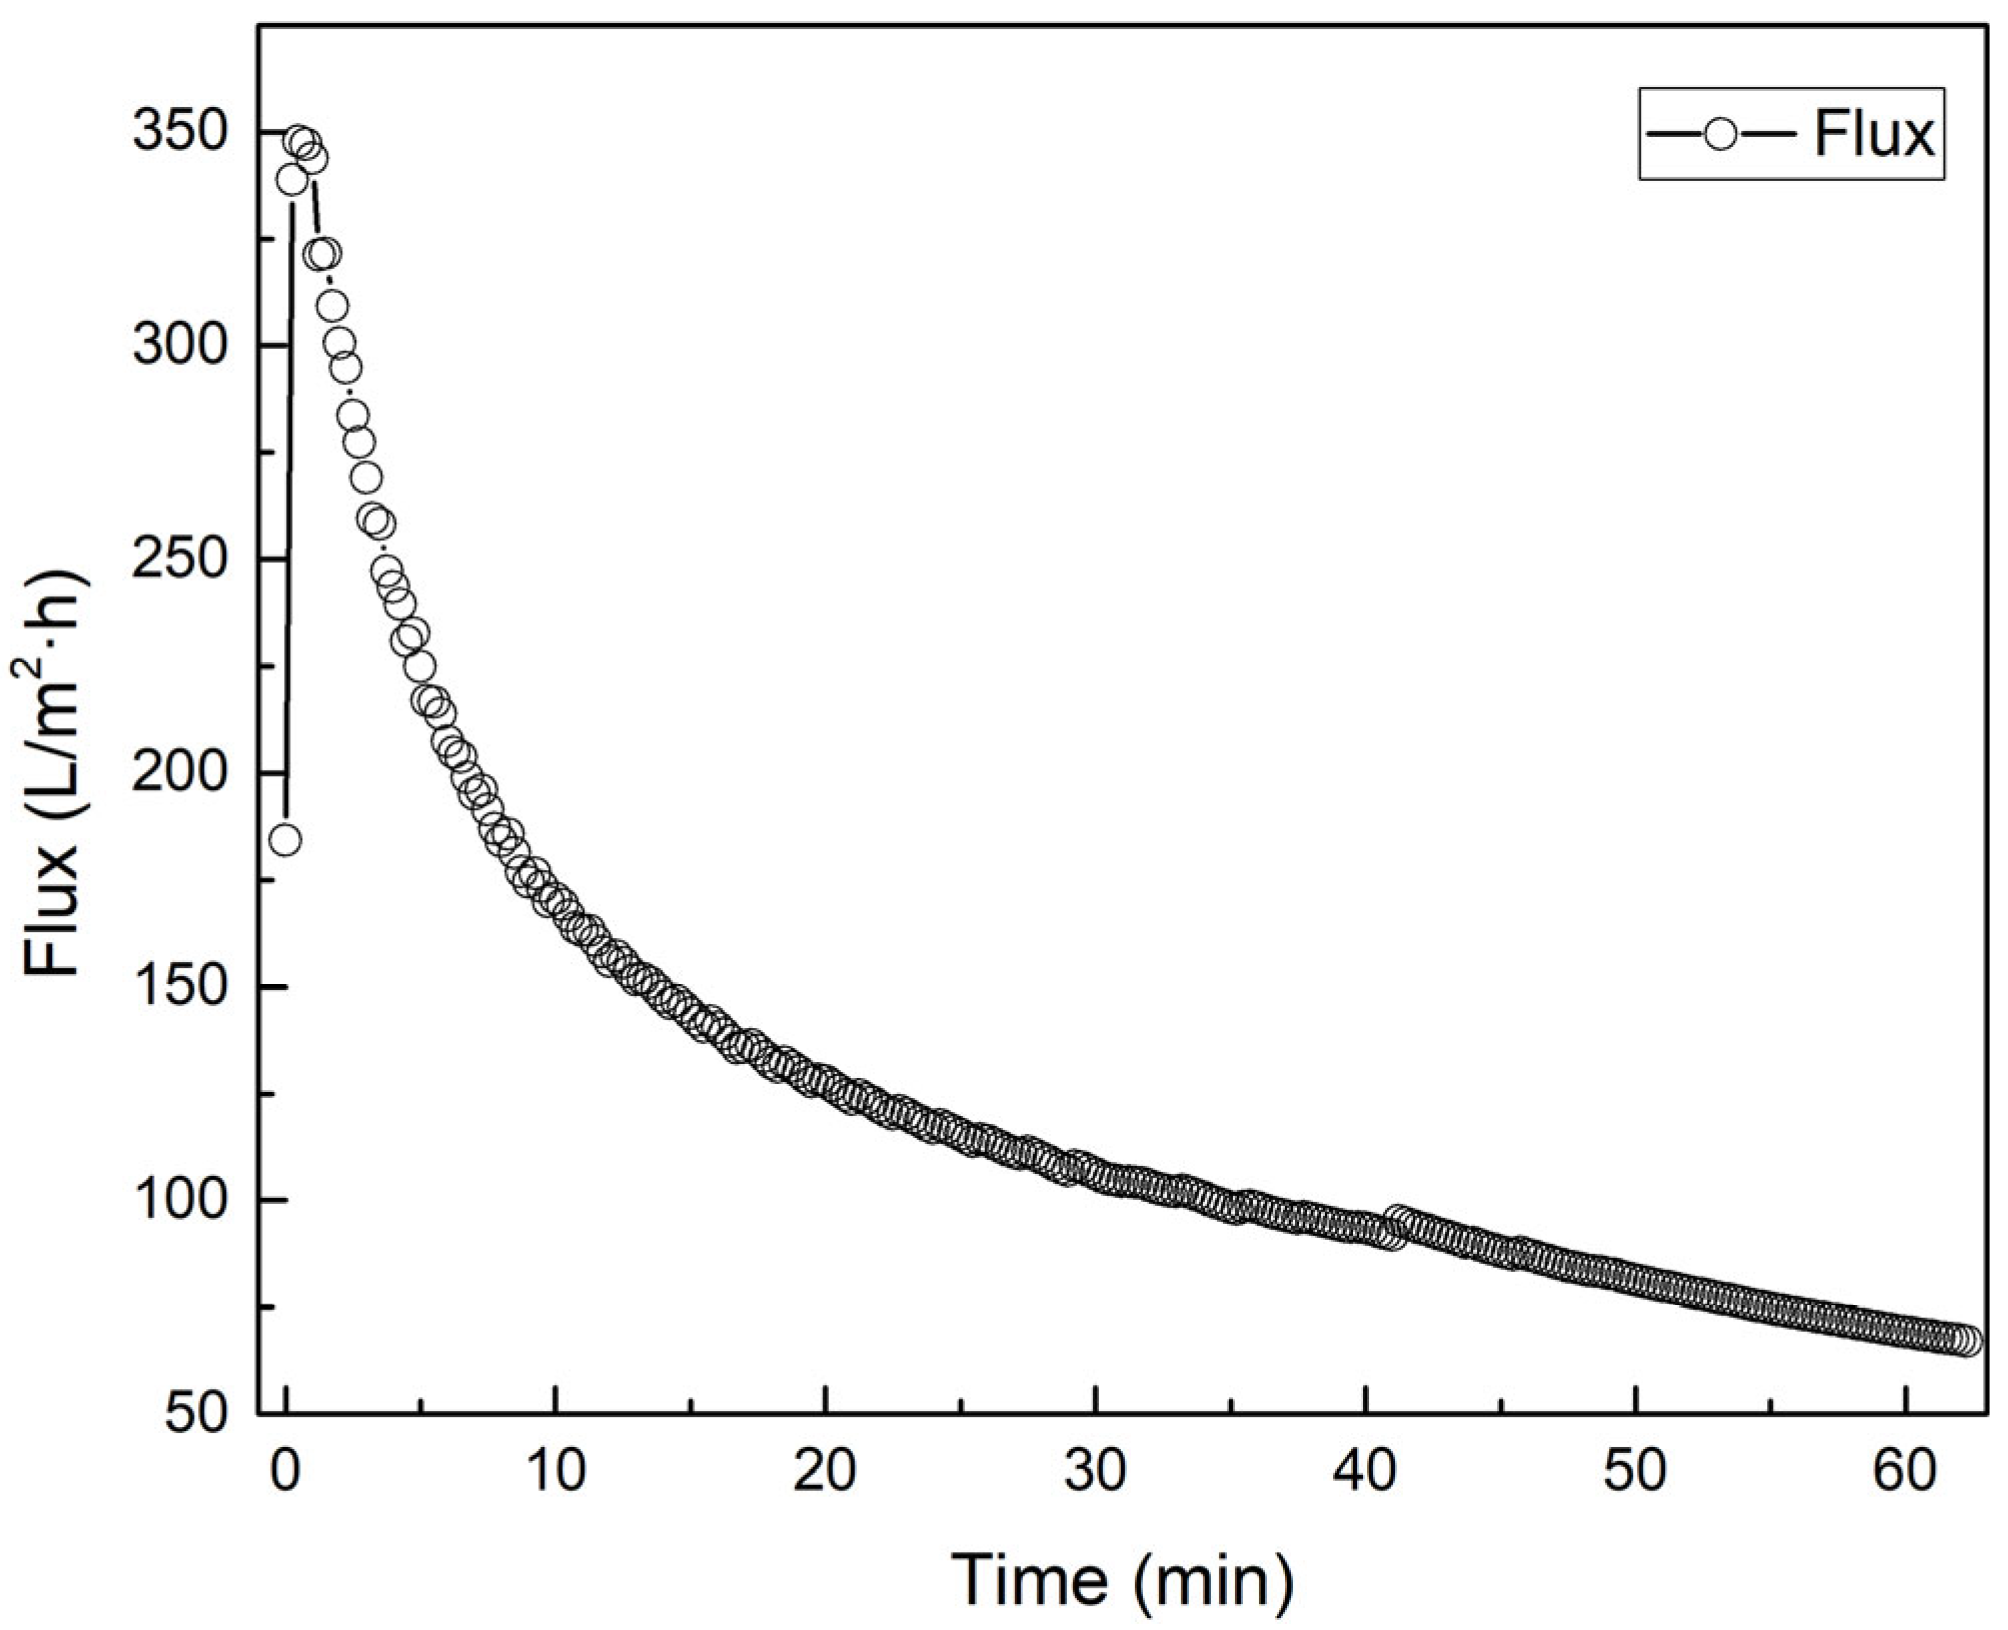
The variation in instantaneous filtration flux under real-time pressure control exhibited a characteristic decline over time, as illustrated in Figure 12. At the beginning of filtration, the flux was approximately 350 L/m2·h, but it rapidly dropped to below 200 L/m2·h within the first 5 min. Between 10 and 20 min, the flux further decreased to the range of 100–150 L/m2·h, followed by a more gradual decline to approximately 60 L/m2·h by the end of the 60 min operation. This flux behavior is typical of compressible cake filtration [34]. Initially, when no substantial cake layer has formed, the hydraulic resistance is low, allowing high permeate flow. As time progresses, accumulated sludge particles form a dense cake on the filter medium, increasing the filtration resistance and resulting in reduced flow rate. The sharp flux decline during the first 5 min is attributable to early-stage cake formation, involving fine particle penetration and structural rearrangement that causes hydraulic compression. During the first 30 min, while pressure was maintained at 20 bar, the flux consistently declined. After pressure was increased from 20 to 30 bar at the 30 min mark, a temporary reduction in the rate of flux decline was observed. This effect can be attributed to the increased driving force (ΔP) across the filter, which temporarily enhanced water permeability before resistance due to further cake compaction again dominated. By the end of filtration, the flux stabilized at approximately 60 L/m2·h. In the absence of pressure increase, the final flux is expected to be lower due to continued cake consolidation. Literature reports confirm that, under constant pressure, the flux tends to approach a quasi-steady-state with minimal flow in the late stage of filtration [35]. By contrast, the application of stepwise pressure increase in this study successfully mitigated late-stage flux deterioration, allowing greater total filtrate recovery within the same operational timeframe. Compared to filtration behavior in systems using incompressible particles, the observed flux decay was substantially more pronounced, suggesting that the sludge cake exhibited a high degree of compressibility. Based on the filtration characteristics, a cake compressibility index in the range of n ≈ 0.5–0.7 can be inferred [41]. In incompressible systems, flux typically increases linearly with applied pressure. However, in highly compressible cakes such as sludge, pressure increments concurrently induce cake densification, leading to minimal or even negative gains in flux.
In certain studies, an inverse relationship between applied pressure and flux has been documented, where excessive compression at high pressures resulted in reduced filtrate yield. This phenomenon is interpreted as the result of irreversible compression of the cake structure, which restricts further water passage. The present findings, therefore, align with theoretical models of compressible cake filtration and underscore the importance of optimizing applied pressure profiles to balance driving force and structural resistance [34,35].
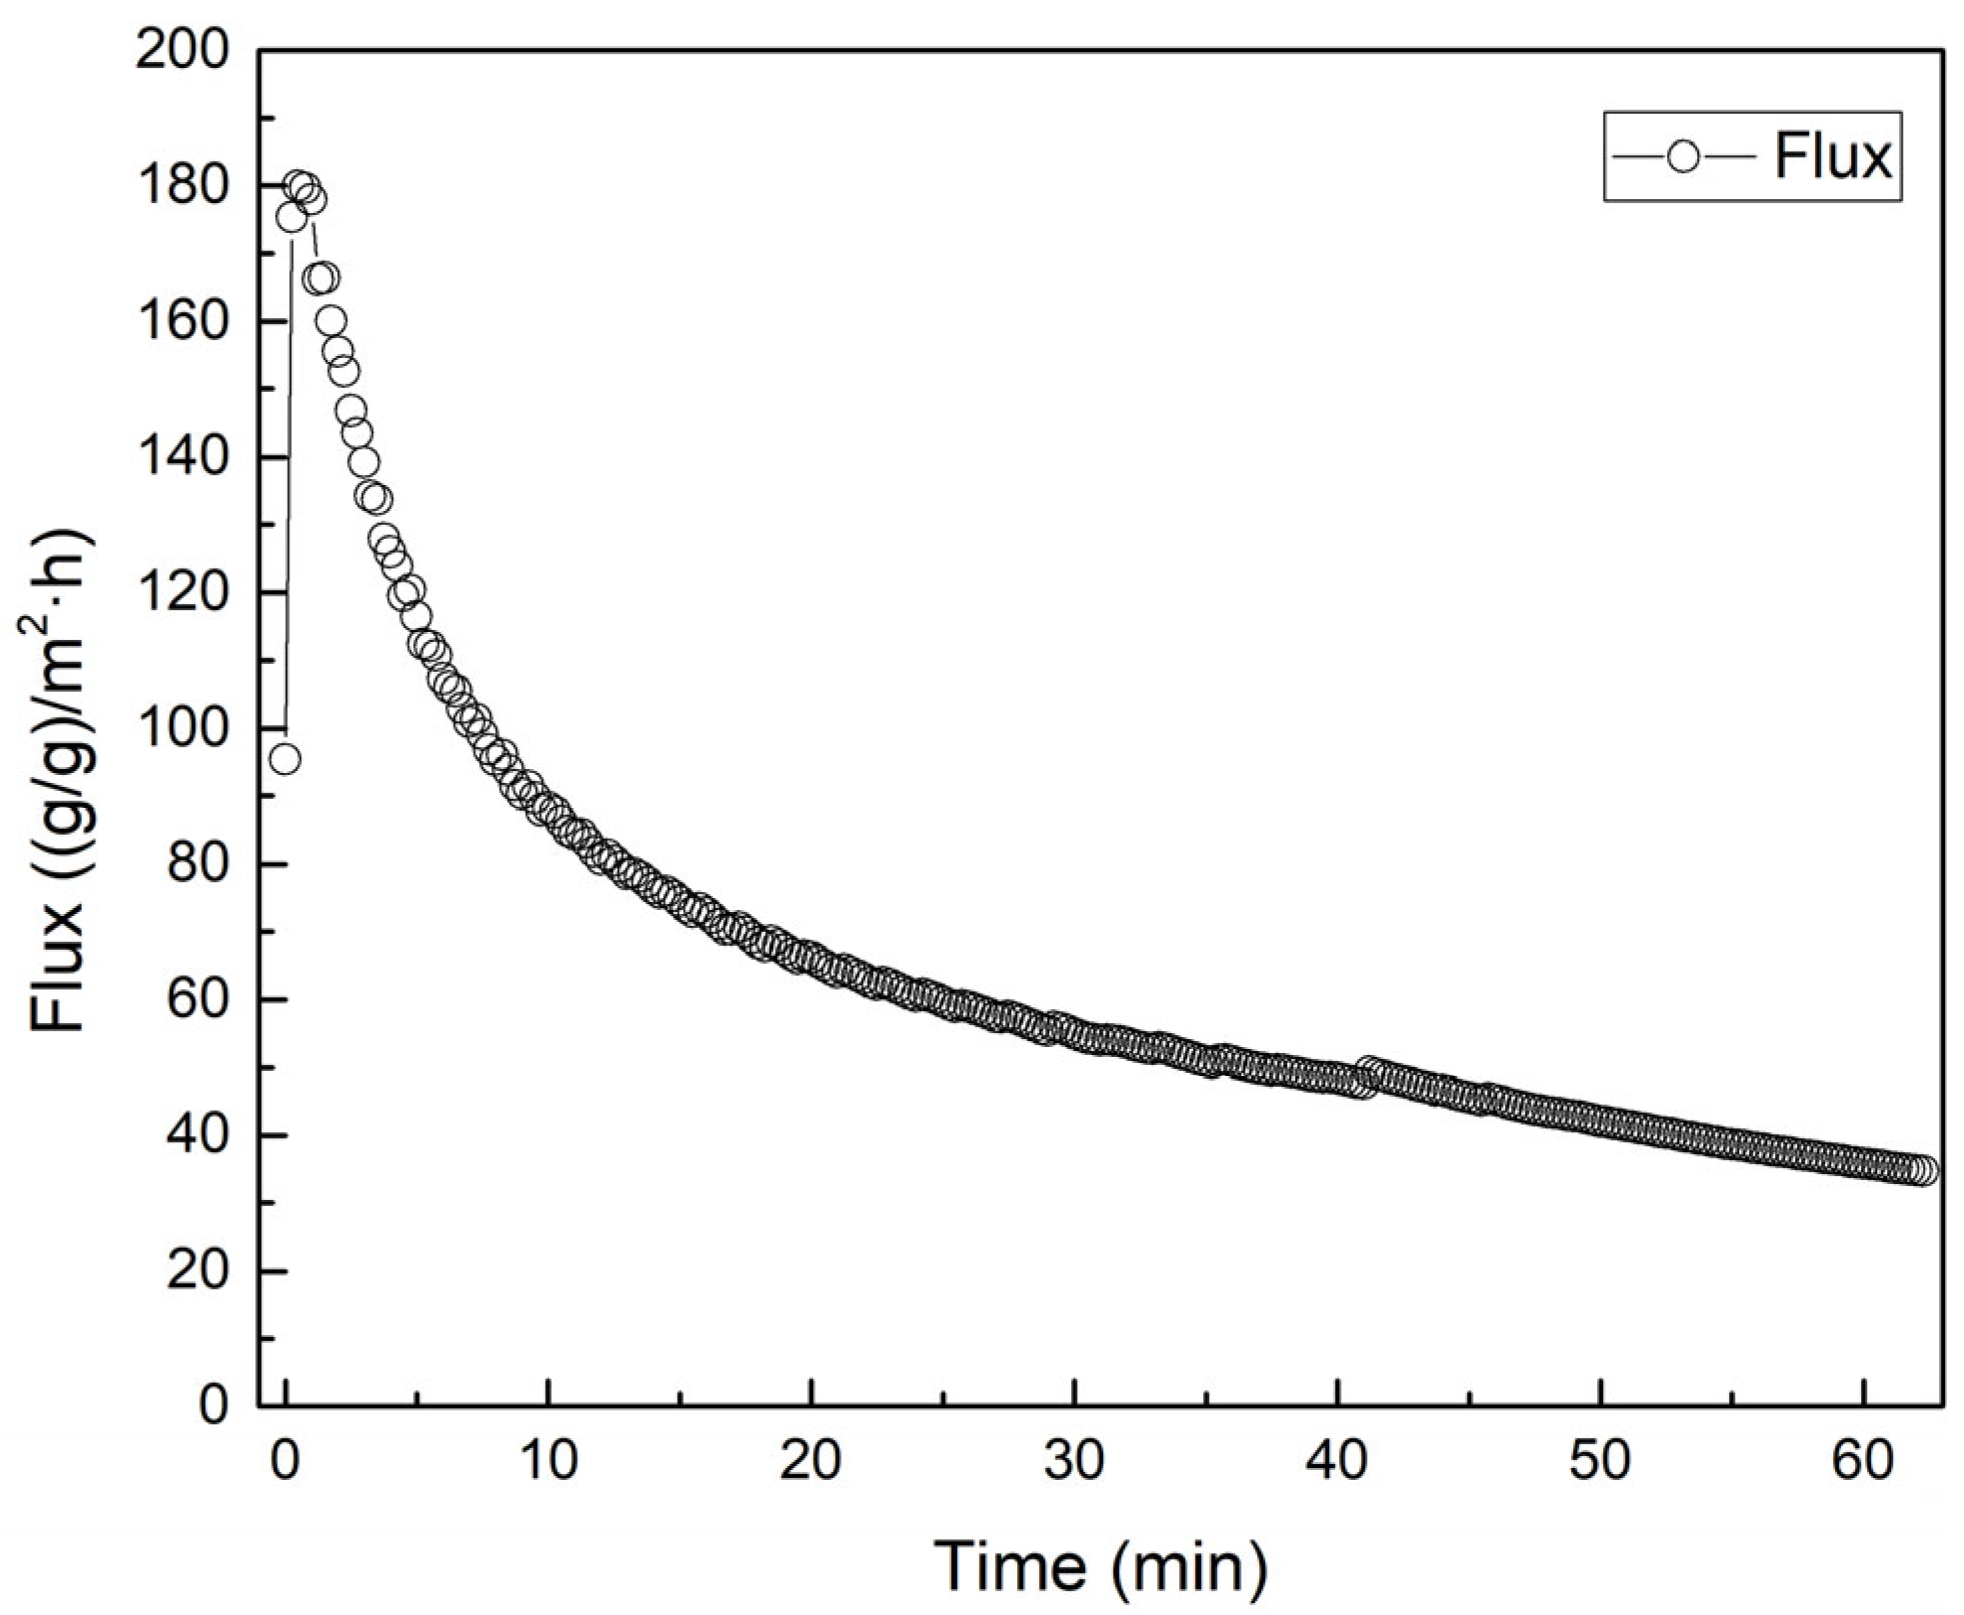
Figure 13 presents the normalized filtration flux as a function of time, based on the data from Figure 11. In this context, the normalized flux is defined as the volume of water removed per unit of dry sludge solids and filtration area, expressed in (g/g)/m2·h. The initial value was normalized to 100% to facilitate relative comparison. At the beginning of filtration, the normalized flux reached approximately 180 (g/g)/m2·h, indicating high initial water removal per unit solids. The flux then declined rapidly, dropping to 50% of its original value within the first 10 min, and further decreasing to approximately 35–40% by 30 min. At the end of the 60 min cycle, the normalized flux stabilized at around 30–33% of the initial value (~60 (g/g)/m2·h). This reduction indicates a significant decline in water removal efficiency per unit of cake mass over time, primarily due to cake thickening and increased resistance associated with compressive consolidation. During the early stages of filtration, each gram of dry sludge could release up to 180 g of water per hour per unit area. However, in the latter stages, only about 60 g of water was removed per hour under the same conditions, reflecting reduced filtration performance due to cake compaction. The observed flux decay trend in Figure 13 corresponds closely to the absolute flux behavior shown in Figure 12 [35,39]. Additionally, the slope of the normalized flux curve became shallower after the pressure increase at the 30 min mark, indicating that pressure augmentation helped delay further deterioration in specific dewatering efficiency. Such results are consistent with previous studies reporting that compressible sludge cakes exhibit a sharp initial decline in flux, followed by stabilization at lower rates. Mahmoud et al. [42], for example, demonstrated that in wastewater sludge filtration, flux dropped rapidly within the first several minutes and stabilized thereafter, emphasizing the importance of optimizing early-stage operating conditions to maintain higher dewatering rates. The present findings reinforce this recommendation, highlighting that adaptive pressure control strategies can effectively mitigate the decline in normalized flux, thereby improving overall process efficiency in sludge dewatering operations.

4. Conclusions

  • A sensor-integrated feedback control system was developed to adapt coagulant dosing and filter press pressure in real time, significantly improving sludge dewatering performance over conventional static operation.
  • Optimal polymer dosing was achieved in the range of ~100–150 mg/L POAE; within this range, the sludge pH dropped by ~0.7 units and zeta potential approached neutral, indicating effective charge neutralization and flocculation.
  • Dynamic pressure control (stepping from 20 to 30 bar based on filtrate flux feedback) produced a final cake moisture of ~65%, markedly drier than the ~75–80% achieved under constant-pressure conditions. The adaptive pressure ramp prevented premature cake compression and maintained higher filtration rates.
  • Combining chemical and mechanical control minimized polymer waste while avoiding excessive cake compaction. The result was more consistent and efficient dewatering, with lower chemical consumption (thus reduced operating cost) compared to a fixed-dose, fixed-pressure approach.
  • The study demonstrates the potential for closed-loop, sensor-based dewatering systems to replace static, heuristic operations in wastewater treatment. This approach can lead to more sustainable and cost-effective biosolids management; future work should explore full-scale implementation and additional control parameters (e.g., streaming current or turbidity sensors).

Author Contributions

Conceptualization—E.S.; methodology—E.S. and S.K.H.; validation—E.S.; formal analysis—E.S. and S.K.H.; investigation—E.S.; resources—S.K.H.; data curation—E.S.; writing and original draft preparation—E.S.; writing, review, and editing—E.S.; supervision—S.K.H.; project administration—S.K.H. All authors have read and agreed to the published version of the manuscript.

Funding

This work was supported by the Water and Wastewater Innovation Technology Development Project (2021002690009) funded by the Korea Environmental Industry & Technology Institute (KEITI) and the Ministry of Environment (ME) of the Republic of Korea (No. 2480000177).

Data Availability Statement

The data presented in this study are available on request from the corresponding author due to an ongoing patent application.

Conflicts of Interest

The authors declare no conflicts of interest. The funders had no role in the design of the study; in the collection, analyses, or interpretation of data; in the writing of the manuscript; or in the decision to publish the results.

Abbreviations

The following abbreviations are used in this manuscript:
WWTPWastewater Treatment Plant
TSTotal Solids
TTFTime-to-Filter
CSTCapillary Suction Time
EPSExtracellular Polymeric Substances
PEPopulation Equivalent
POAEPolyoxyethylene Alkyl Ether
PLCProgrammable Logic Controller
VSVolatile Solids
SRFSpecific Resistance to Filtration

References

  1. Neyens, E.; Baeyens, J. A review of classic Fenton’s peroxidation as an advanced oxidation technique. J. Hazard. Mater. 2003, 98, 33–50. [Google Scholar] [CrossRef]
  2. Lee, J.; Kim, Y.M. Enhanced dewaterability of digested sludge using Fenton oxidation and cationic polymer. Chemosphere 2019, 222, 695–702. [Google Scholar]
  3. Song, E.; Kim, E.; Kim, G.W.; Jeong, C.J.; Lee, W.; Han, S.K. Dewaterability Enhancement of Anaerobic Sludge Using Polymeric Aluminum Chloride and Polyoxyethylene Alkyl Ether Surfactants. Water 2024, 16, 2303. [Google Scholar] [CrossRef]
  4. Jin, B.; Wilén, B.M.; Lant, P. Impacts of morphological, physical and chemical properties of sludge flocs on dewaterability of activated sludge. Chem. Eng. J. 2004, 98, 115–126. [Google Scholar] [CrossRef]
  5. Novak, J.T.; Sadler, M.E.; Murthy, S.N. Mechanisms of floc destruction during anaerobic and aerobic digestion and the effect on conditioning and dewatering of biosolids. Water Res. 2003, 37, 3136–3144. [Google Scholar] [CrossRef] [PubMed]
  6. Wang, W.; Luo, Y.; Qiao, W. Possible solutions for sludge dewatering in China. Front. Environ. Sci. Eng. China 2010, 4, 102–107. [Google Scholar] [CrossRef]
  7. Liu, H.; Yang, J.; Zhu, N.; Zhang, H.; Li, Y.; He, S.; Yang, C.; Yao, H. A comprehensive insight into the combined effects of Fenton’s reagent and skeleton builders on sludge deep dewatering performance. J. Hazard. Mater. 2013, 258, 144–150. [Google Scholar] [CrossRef] [PubMed]
  8. Ke, M.Y. Probe into advanced sludge dewatering technology in Jimei Wastewater Treatment Plant. Water Wastewater 2011, 37, 40–43. [Google Scholar]
  9. Cao, B.; Zhang, W.; Wang, Q.; Huang, Y.; Meng, C.; Wang, D. Wastewater sludge dewaterability enhancement using hydroxyl aluminum conditioning: Role of aluminum speciation. Water Res. 2016, 105, 615–624. [Google Scholar] [CrossRef] [PubMed]
  10. Sorensen, P.B.; Christensen, J.R.; Bruus, J.H. Effect of small-scale solids migration in filter cakes during filtration of wastewater solids suspensions. Water Environ. Res. 1995, 67, 25–32. [Google Scholar] [CrossRef]
  11. Hach, RTC Sludge Dewatering Improves Efficiency, Optimizes Polymer Feed at Bowling Green. Available online: www.at.hach.com/cms/documents/Claros/DOC043.53.30393.Apr17.pdf#:~:text=Solution%20The%20plant%20installed%20the,Benefits%20Continuous%20analysis%20provided%20by (accessed on 24 July 2025).
  12. Fukasawa, A.; Yamato, T.; Watanabe, S. Automatic control of polymer dosage using floc images in sludge dewatering plant. Environ. Process. 2024, 11, 29. [Google Scholar] [CrossRef]
  13. Novak, J.; Knocke, W.; Burgos, W.; Schuler, P. Predicting the dewatering performance of belt filter presses. Water Sci. Technol. 1993, 28, 11–19. [Google Scholar] [CrossRef]
  14. Yousefi, S.A.; Nasser, M.S.; Hussein, I.A.; Judd, S. Influence of polyelectrolyte architecture on the electrokinetics and dewaterability of industrial membrane bioreactor activated sludge. J. Environ. Manag. 2019, 233, 410–416. [Google Scholar] [CrossRef] [PubMed]
  15. Parker, D.G. Factors Affecting the Filtration Characteristics of Aerobically Digested Sludge; Virginia Polytechnic Institute and State University: Blacksburg, VA, USA, 1970. [Google Scholar]
  16. Lousada-Ferreira, M.; van Lier, J.B.; van der Graaf, J.H. Impact of suspended solids concentration on sludge filterability in full-scale membrane bioreactors. J. Membr. Sci. 2015, 476, 68–75. [Google Scholar] [CrossRef]
  17. Gray, N.F. Capillary suction time (CST). In Progress in Filtration and Separation; Academic Press: Cambridge, MA, USA, 2015; pp. 659–670. [Google Scholar]
  18. Capodici, M.; Mannina, G. The sludge dewaterability in membrane bioreactors. In Proceedings of the SIDISA: X International Symposium on Sanitary and Environmental Engineering, Rome, Italy, 19–23 June 2016; pp. 19–23. [Google Scholar]
  19. Hyder, U.S.; Kakar, F.; Okoye, F.; Elbeshbishy, E. Management of digestate from anaerobic digestion of municipal sludge. In Anaerobic Digestate Management; Tyagi, V.K., Aboudi, K., Eskicioglu, C., Eds.; IWA Publishing: London, UK, 2022; pp. 75–110. [Google Scholar]
  20. Yan, C.; Zhan, M.; Xv, K.; Zhang, S.; Liang, T.; Yu, R. Sludge dewaterability enhancement under low temperature condition with cold-tolerant Bdellovibrio sp. CLL13. Sci. Total Environ. 2022, 820, 153269. [Google Scholar] [CrossRef]
  21. Duan, J.; Gregory, J. Coagulation by hydrolysing metal salts. Adv. Colloid Interface Sci. 2003, 100, 475–502. [Google Scholar] [CrossRef]
  22. Gao, B.Y.; Chu, Y.B.; Yue, Q.Y.; Wang, B.J.; Wang, S.G. Characterization and coagulation of a polyaluminum chloride (PAC) coagulant with high Al13 content. J. Environ. Manag. 2005, 76, 143–147. [Google Scholar] [CrossRef]
  23. Fitria, D.; Scholz, M.; Swift, G.M.; Al-Faraj, F. Impact of temperature and coagulants on sludge dewaterability. Int. J. Technol. 2022, 13, 596–605. [Google Scholar] [CrossRef]
  24. Rodrigues, A.C.; Boroski, M.; Shimada, N.S.; Garcia, J.C.; Nozaki, J.; Hioka, N. Treatment of paper pulp and paper mill wastewater by coagulation–flocculation followed by heterogeneous photocatalysis. J. Photochem. Photobiol. A Chem. 2008, 194, 1–10. [Google Scholar] [CrossRef]
  25. Inam, M.A.; Khan, R.; Lee, K.H.; Wie, Y.M. Removal of arsenic oxyanions from water by ferric chloride—Optimization of process conditions and implications for improving coagulation performance. Int. J. Environ. Res. Public Health 2021, 18, 9812. [Google Scholar] [CrossRef]
  26. Verrelli, D.I.; Dixon, D.R.; Scales, P.J. Effect of coagulation conditions on the dewatering properties of sludges produced in drinking water treatment. Colloids Surf. A Physicochem. Eng. Asp. 2009, 348, 14–23. [Google Scholar] [CrossRef]
  27. Ahmed, T.; Kanwal, R.; Hassan, M.; Ayub, N.; Scholz, M.; McMinn, W. Coagulation and disinfection in water treatment using Moringa. In Proceedings of the Institution of Civil Engineers-Water Management; Thomas Telford Ltd.: London, UK, 2010; Volume 163, pp. 381–388. [Google Scholar]
  28. Chia-Hung, H.; Kung-Cheh, L. Assessment of sludge dewaterability using rheological properties. J. Chin. Inst. Eng. 2003, 26, 221–226. [Google Scholar] [CrossRef]
  29. Buyukkamaci, N.; Kucukselek, E. Improvement of dewatering capacity of petrochemical sludge. J. Hazard. Mater. 2006, 144, 323–327. [Google Scholar] [CrossRef] [PubMed]
  30. Wang, H.F.; Qi, H.Y.; Du, K.; Ran, D.D.; Liu, W.H.; Shen, X.F.; Zeng, R.J. Reinterpretation of the mechanism of coagulation and its effects in waste activated sludge treatment. Sep. Purif. Technol. 2022, 291, 120958. [Google Scholar] [CrossRef]
  31. Liang, Y.; Wang, R.; Sun, W.; Sun, Y. Advances in chemical conditioning of residual activated sludge in China. Water 2023, 15, 345. [Google Scholar] [CrossRef]
  32. Sun, Y.; Fan, W.; Zheng, H.; Zhang, Y.; Li, F.; Chen, W. Evaluation of dewatering performance and fractal characteristics of alum sludge. PLoS ONE 2015, 10, e0130683. [Google Scholar] [CrossRef]
  33. Abu-Orf, M.M.; Dentel, S.K. Automatic control of polymer dose using the streaming current detector. Water Environ. Res. 1998, 70, 1005–1018. [Google Scholar] [CrossRef]
  34. Sørensen, P.B.; Moldrup, P.; Hansen, J. Filtration and expression of compressible cakes. Chem. Eng. Sci. 1996, 51, 967–979. [Google Scholar] [CrossRef]
  35. Sveegaard, S.G.; Keiding, K.; Christensen, M.L. Compression and swelling of activated sludge cakes during dewatering. Water Res. 2012, 46, 4999–5008. [Google Scholar] [CrossRef] [PubMed]
  36. Kowalczyk, M. The Influence of the Addition of Cement and Zeolite on the Increase in the Efficiency of Sewage Sludge Dewatering in the Pressure Filtration Process. Energies 2024, 17, 685. [Google Scholar] [CrossRef]
  37. La Heij, E.; Kerkhof, P.; Herwijn, A.; Coumans, W. Fundamental aspects of sludge filtration and expression. Water Res. 1996, 30, 697–703. [Google Scholar] [CrossRef]
  38. Zhao, Y.; Bache, D. Integrated effects of applied pressure, time, and polymer doses on alum sludge dewatering behaviour. Waste Manag. 2002, 22, 813–819. [Google Scholar] [CrossRef]
  39. Wu, R.; Lee, D.; Wang, C.; Chen, J.; Tan, R. Novel cake characteristics of waste-activated sludge. Water Res. 2001, 35, 1358–1362. [Google Scholar] [CrossRef]
  40. Rashmi, H.R.; Devatha, C.P. Review on solid-liquid separation using various conditioning methods. IOP Conf. Ser. Mater. Sci. Eng. 2021, 1166, 012002. [Google Scholar] [CrossRef]
  41. Lee, C.; Liu, J. Enhanced sludge dewatering by dual polyelectrolytes conditioning. Water Res. 2000, 34, 4430–4436. [Google Scholar] [CrossRef]
  42. Mahmoud, A.; Olivier, J.; Vaxelaire, J.; Hoadley, A.F. Electro-dewatering of wastewater sludge: Influence of the operating conditions and their interactions effects. Water Res. 2011, 45, 2795–2810. [Google Scholar] [CrossRef] [PubMed]
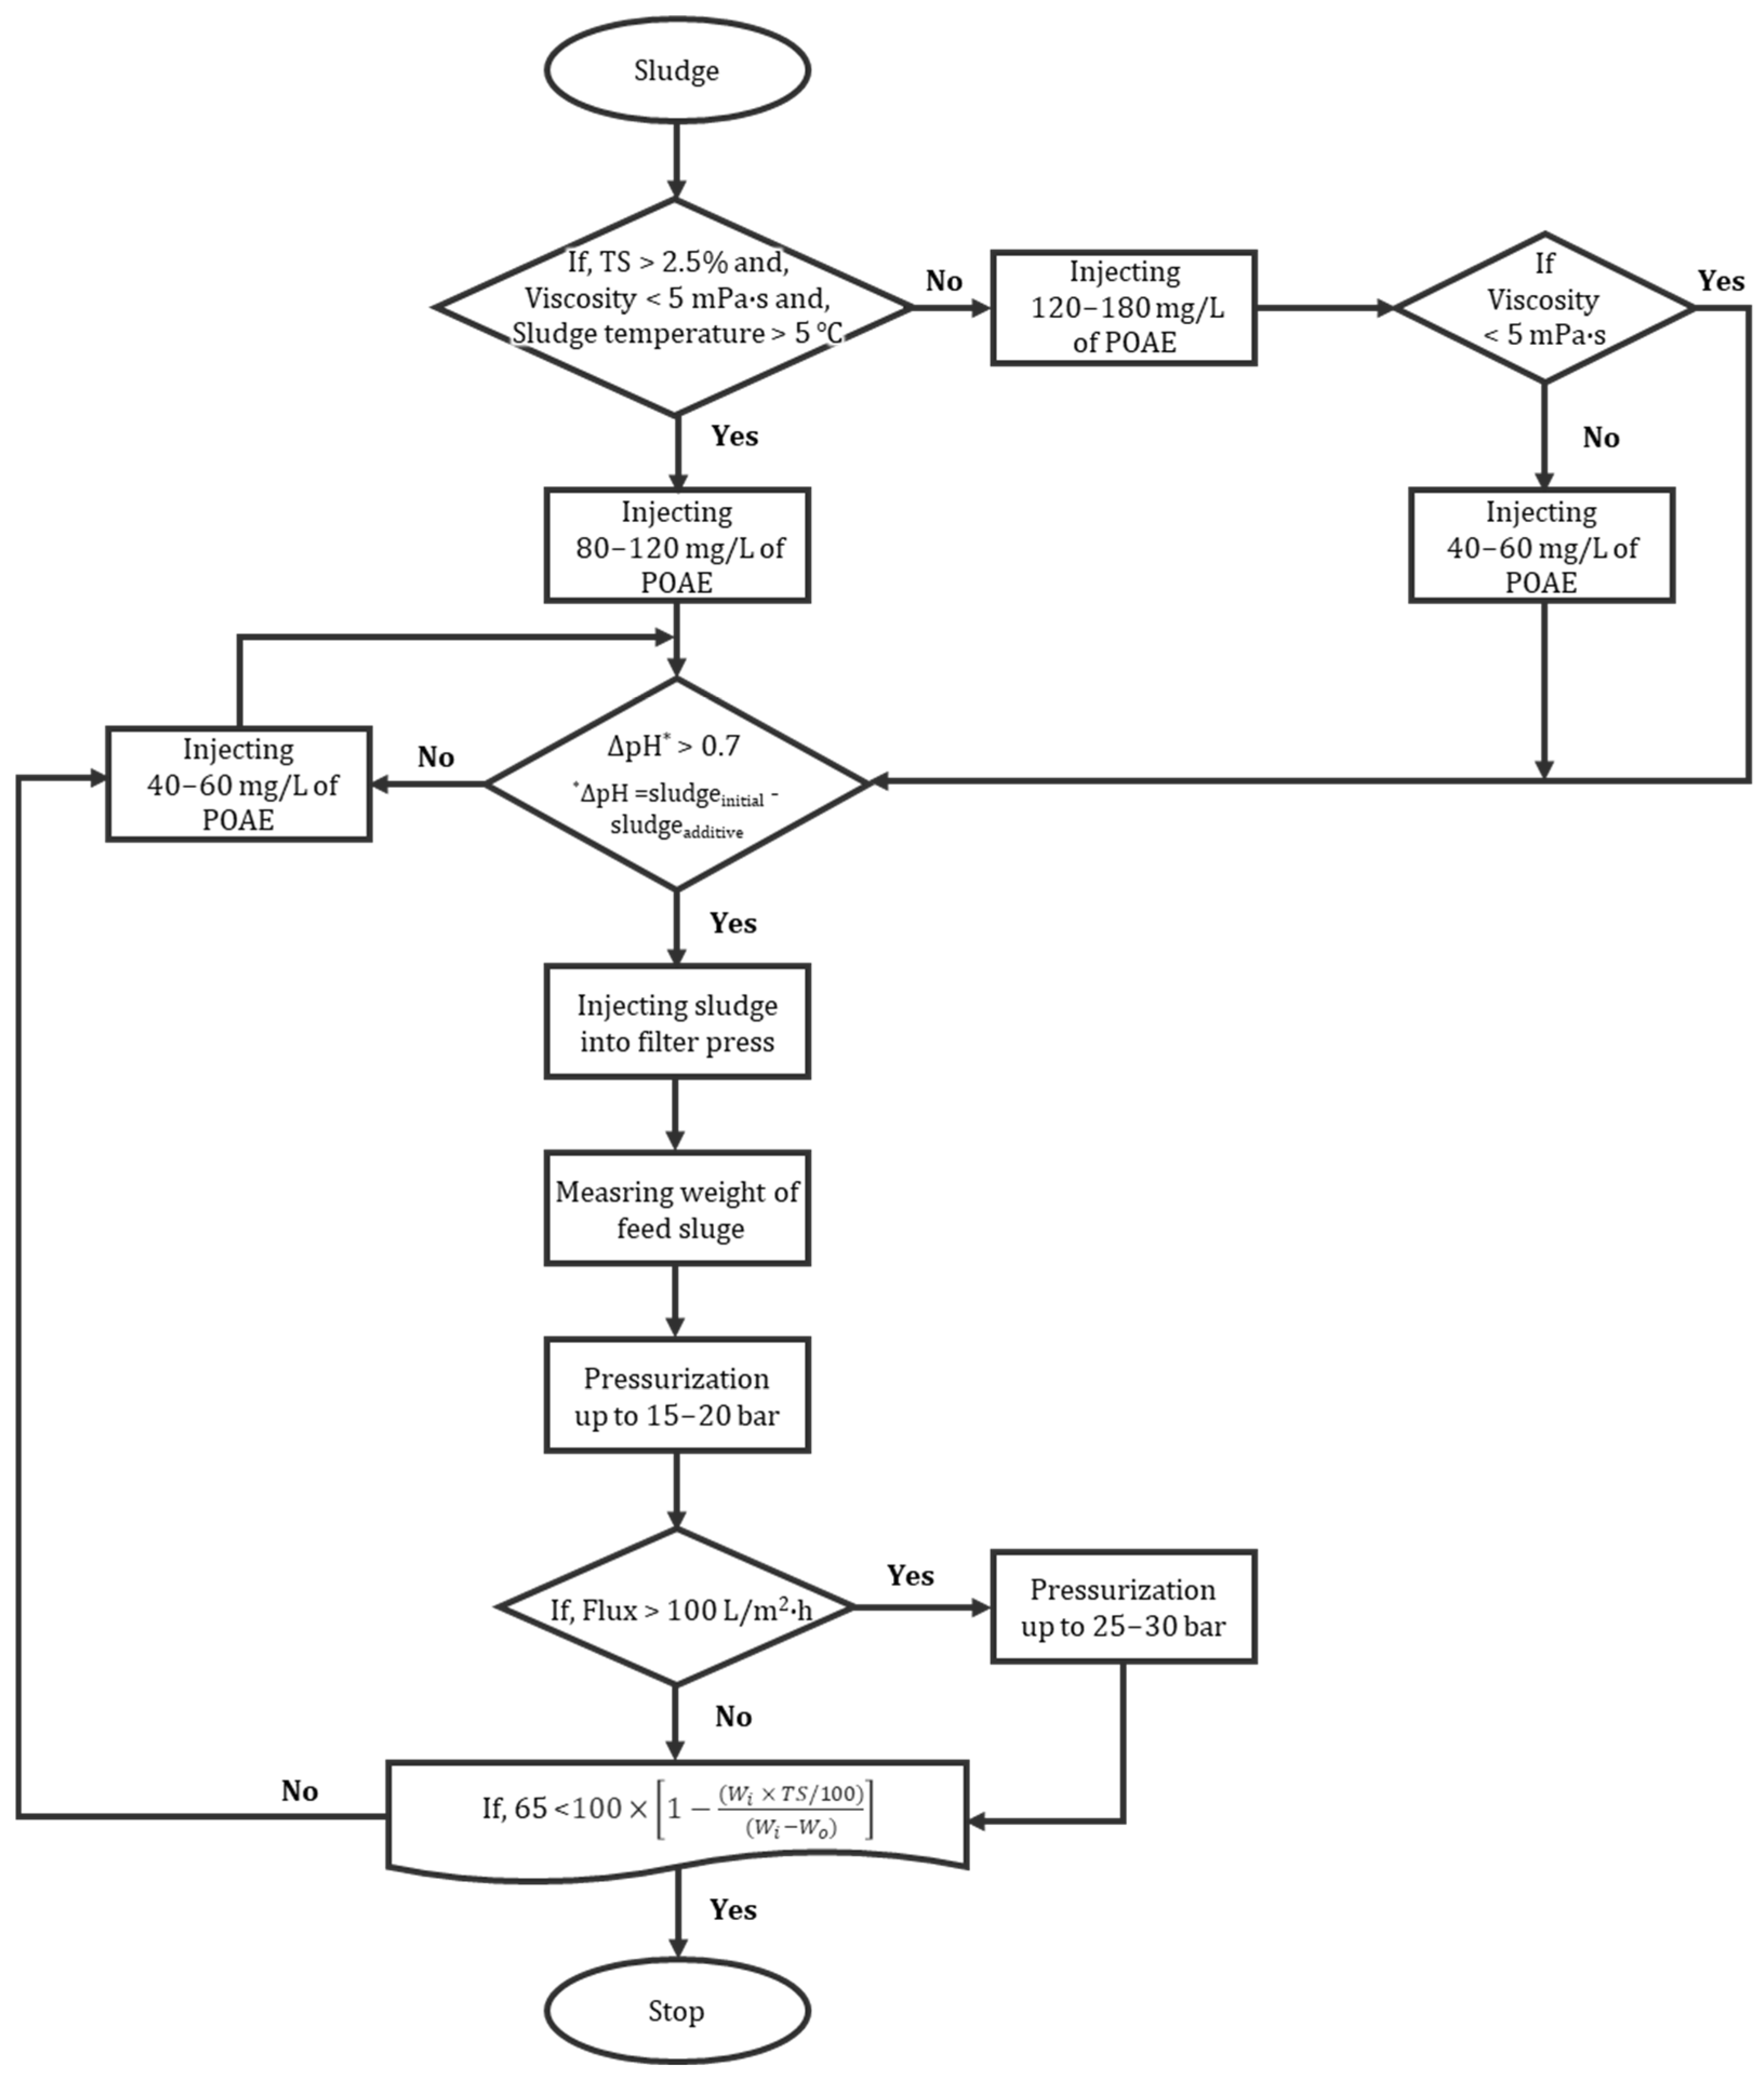
Figure 1. Flowchart of the real−time control logic for the sludge dewatering system.
Cleantechnol 07 00082 g001
Figure 2. Effect of sludge total solids (TS) on dewatering time; (a) TTF, (b) CST.
Cleantechnol 07 00082 g002
Figure 3. Effect of sludge volatile solids (VS) on dewatering time; (a) TTF, (b) CST.
Cleantechnol 07 00082 g003
Figure 4. Effect of viscosity on dewatering time; (a) TTF, (b) CST.
Cleantechnol 07 00082 g004
Figure 5. Effect of outdoor temperature on dewatering time; (a) TTF, (b) CST.
Cleantechnol 07 00082 g005
Figure 6. Effect of POAE dose on time-to-filter (TTF).
Cleantechnol 07 00082 g006
Figure 7. Sludge pH as a function of POAE dosage.
Cleantechnol 07 00082 g007
Figure 8. Zeta potential of sludge as a function of pH.
Cleantechnol 07 00082 g008
Figure 9. Cumulative filtrate mass collected over time during a representative dewatering run under real-time control.
Cleantechnol 07 00082 g009
Figure 10. Applied pressure profile over time during real-time filtration control.
Cleantechnol 07 00082 g010
Figure 11. Reduction in sludge cake moisture content over the filtration time under real-time control.
Cleantechnol 07 00082 g011
Figure 12. Instantaneous filtration flux over time under real-time pressure control.
Cleantechnol 07 00082 g012
Figure 13. Normalized filtration flux over time.
Cleantechnol 07 00082 g013
Table 1. Summary of sludge property effects on dewaterability metrics (TTF and CST).
Sludge ParameterThresholdLow Condition
(Poor Dewatering)
TTF: >2000 s
CST: >130 s
High Condition
(Much Faster)
TTF: <800 s
CST: <80 s
Total solids2.5%At belowAt above
Volatile solids1.6%At belowAt above
Viscosity5 mPa·SAt aboveAt below
Temperature5 °CAt belowAt above
Table 2. Comparison of dewatering performance under real-time control and static operation.
MetricReal-Time ControlStatic Operation
Final cake moisture<65%>75–80%
Total filtrate collected>450 g300–400 g
Coagulant doseAdaptiveFixed
Pressure applicationStepped: 2030 bar at 30 min
(flux-triggered)
Constant
(20 or 30 bar)
Disclaimer/Publisher’s Note: The statements, opinions and data contained in all publications are solely those of the individual author(s) and contributor(s) and not of MDPI and/or the editor(s). MDPI and/or the editor(s) disclaim responsibility for any injury to people or property resulting from any ideas, methods, instructions or products referred to in the content.