
Status of Concentrated Solar Power Plants Installed Worldwide: Past and Present Data


Abstract
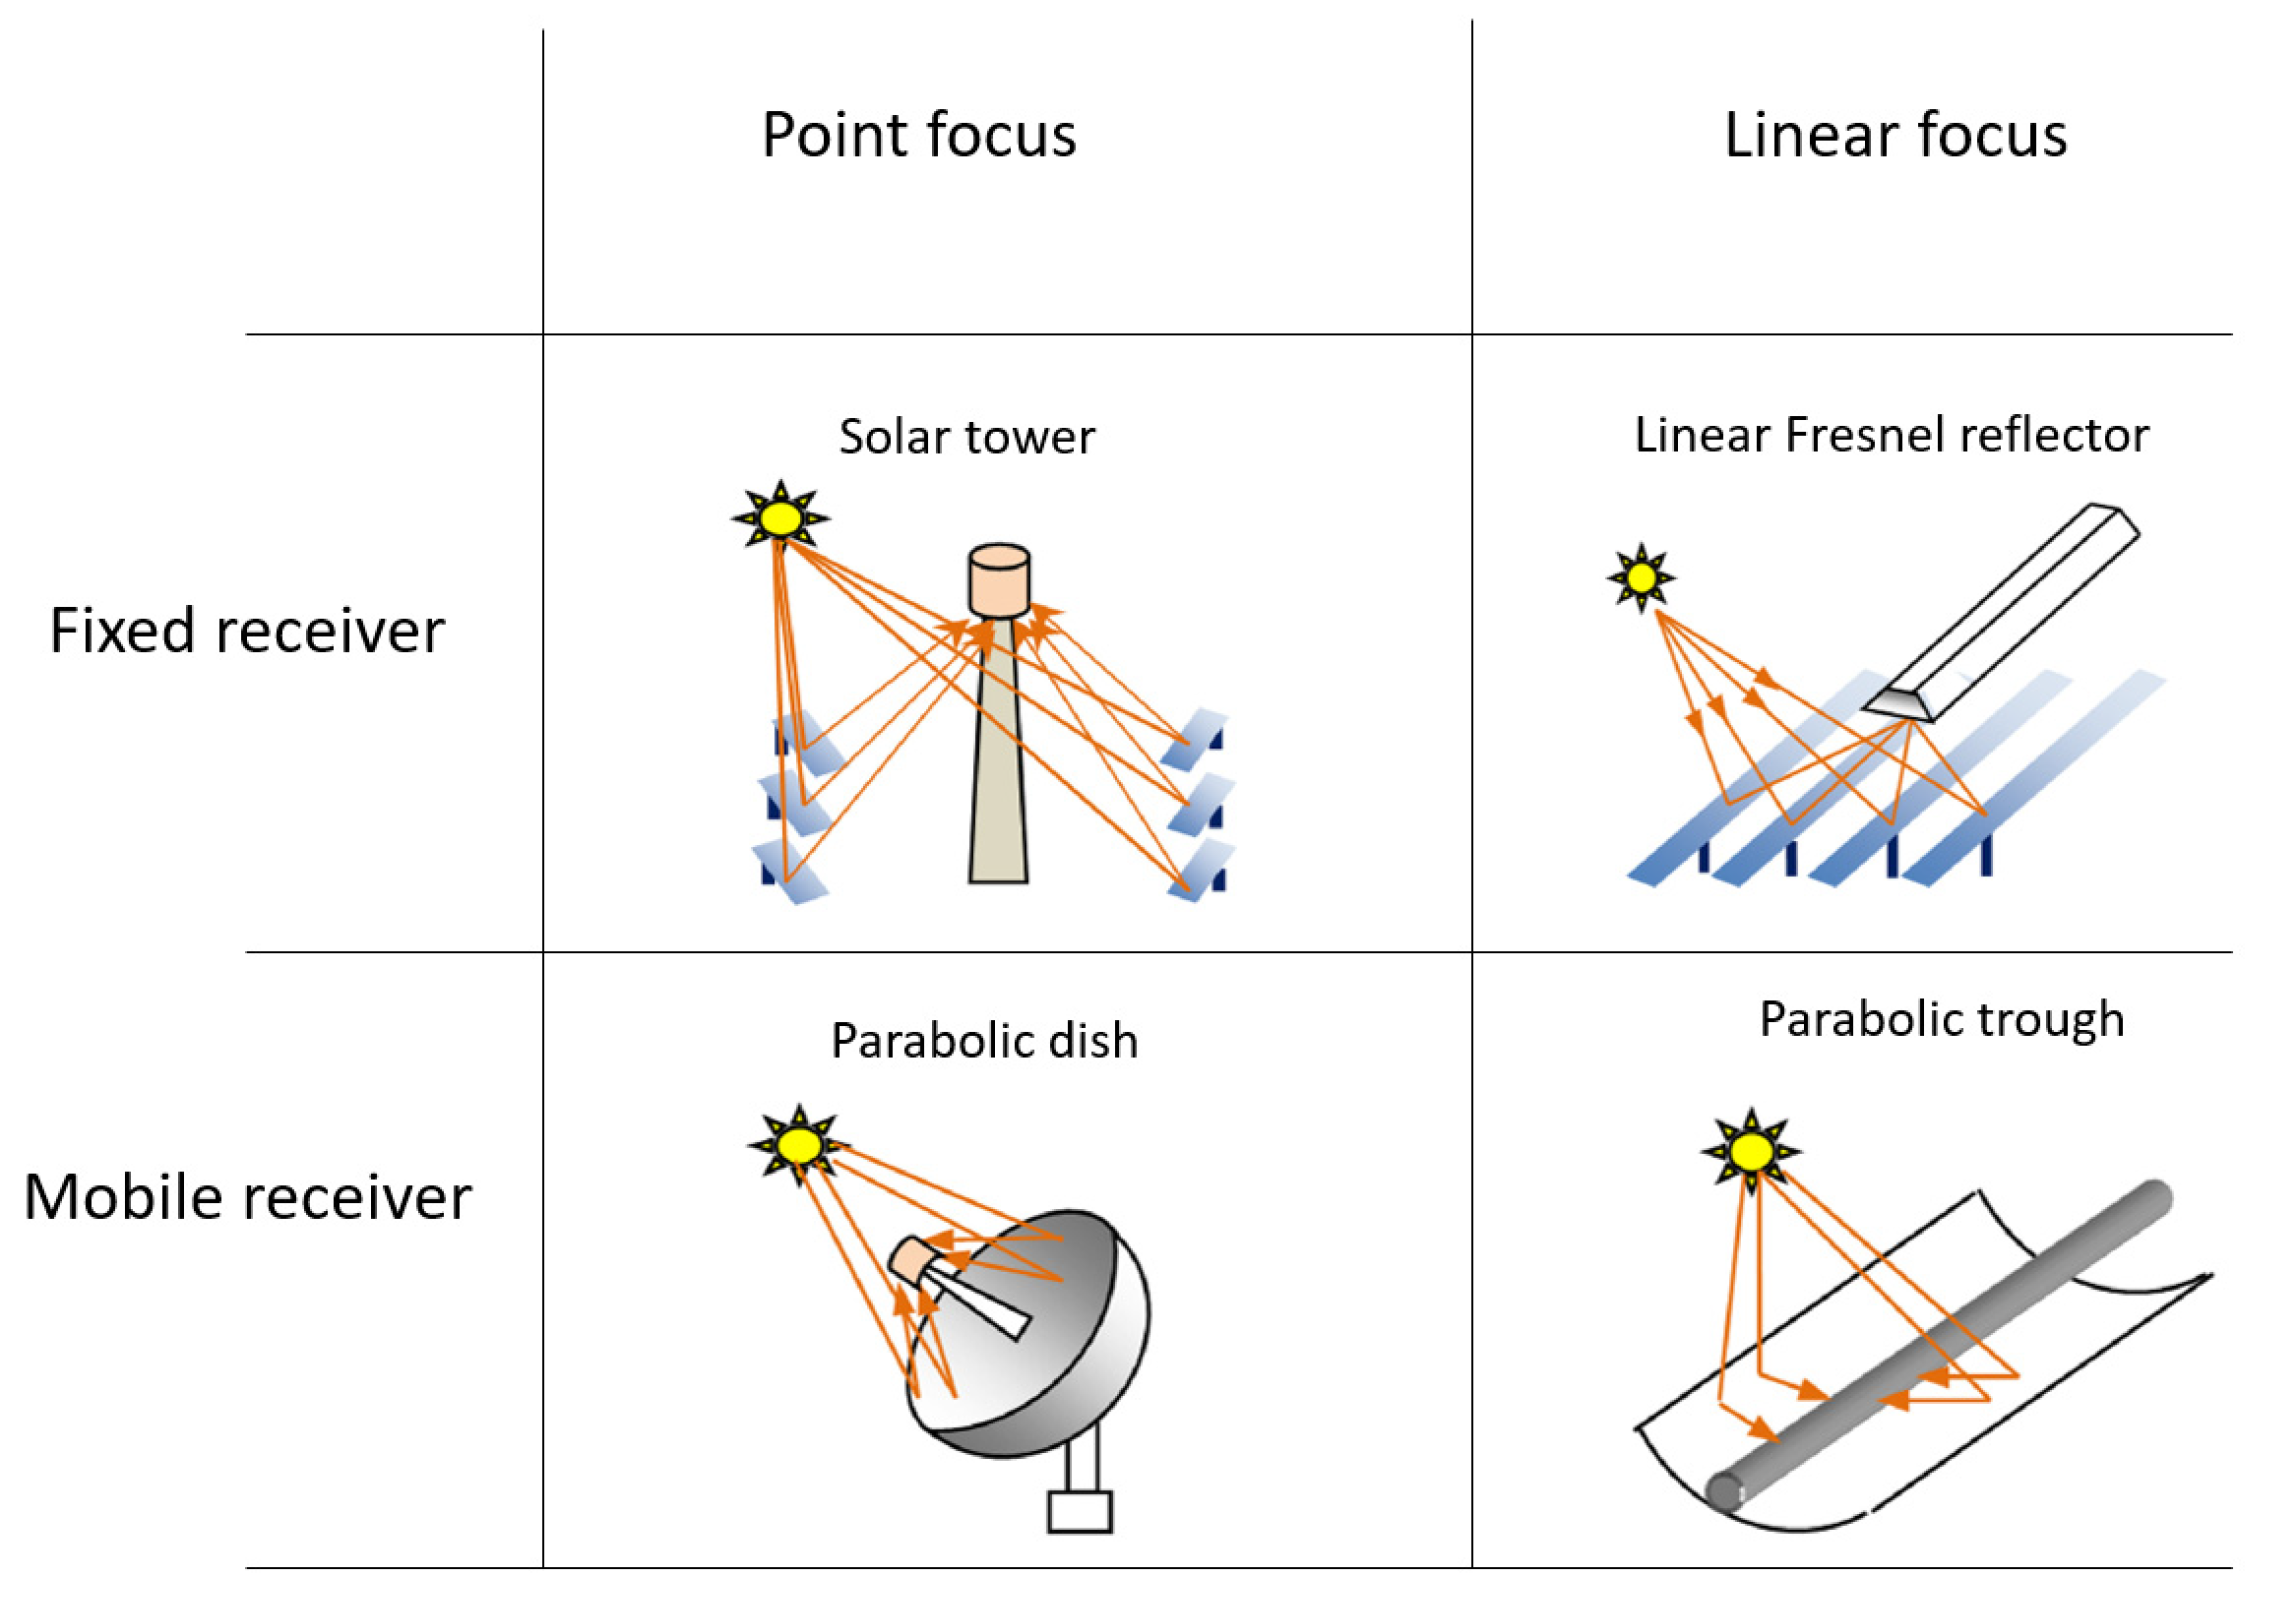
1. State of the Art
2. Global CSP Deployment
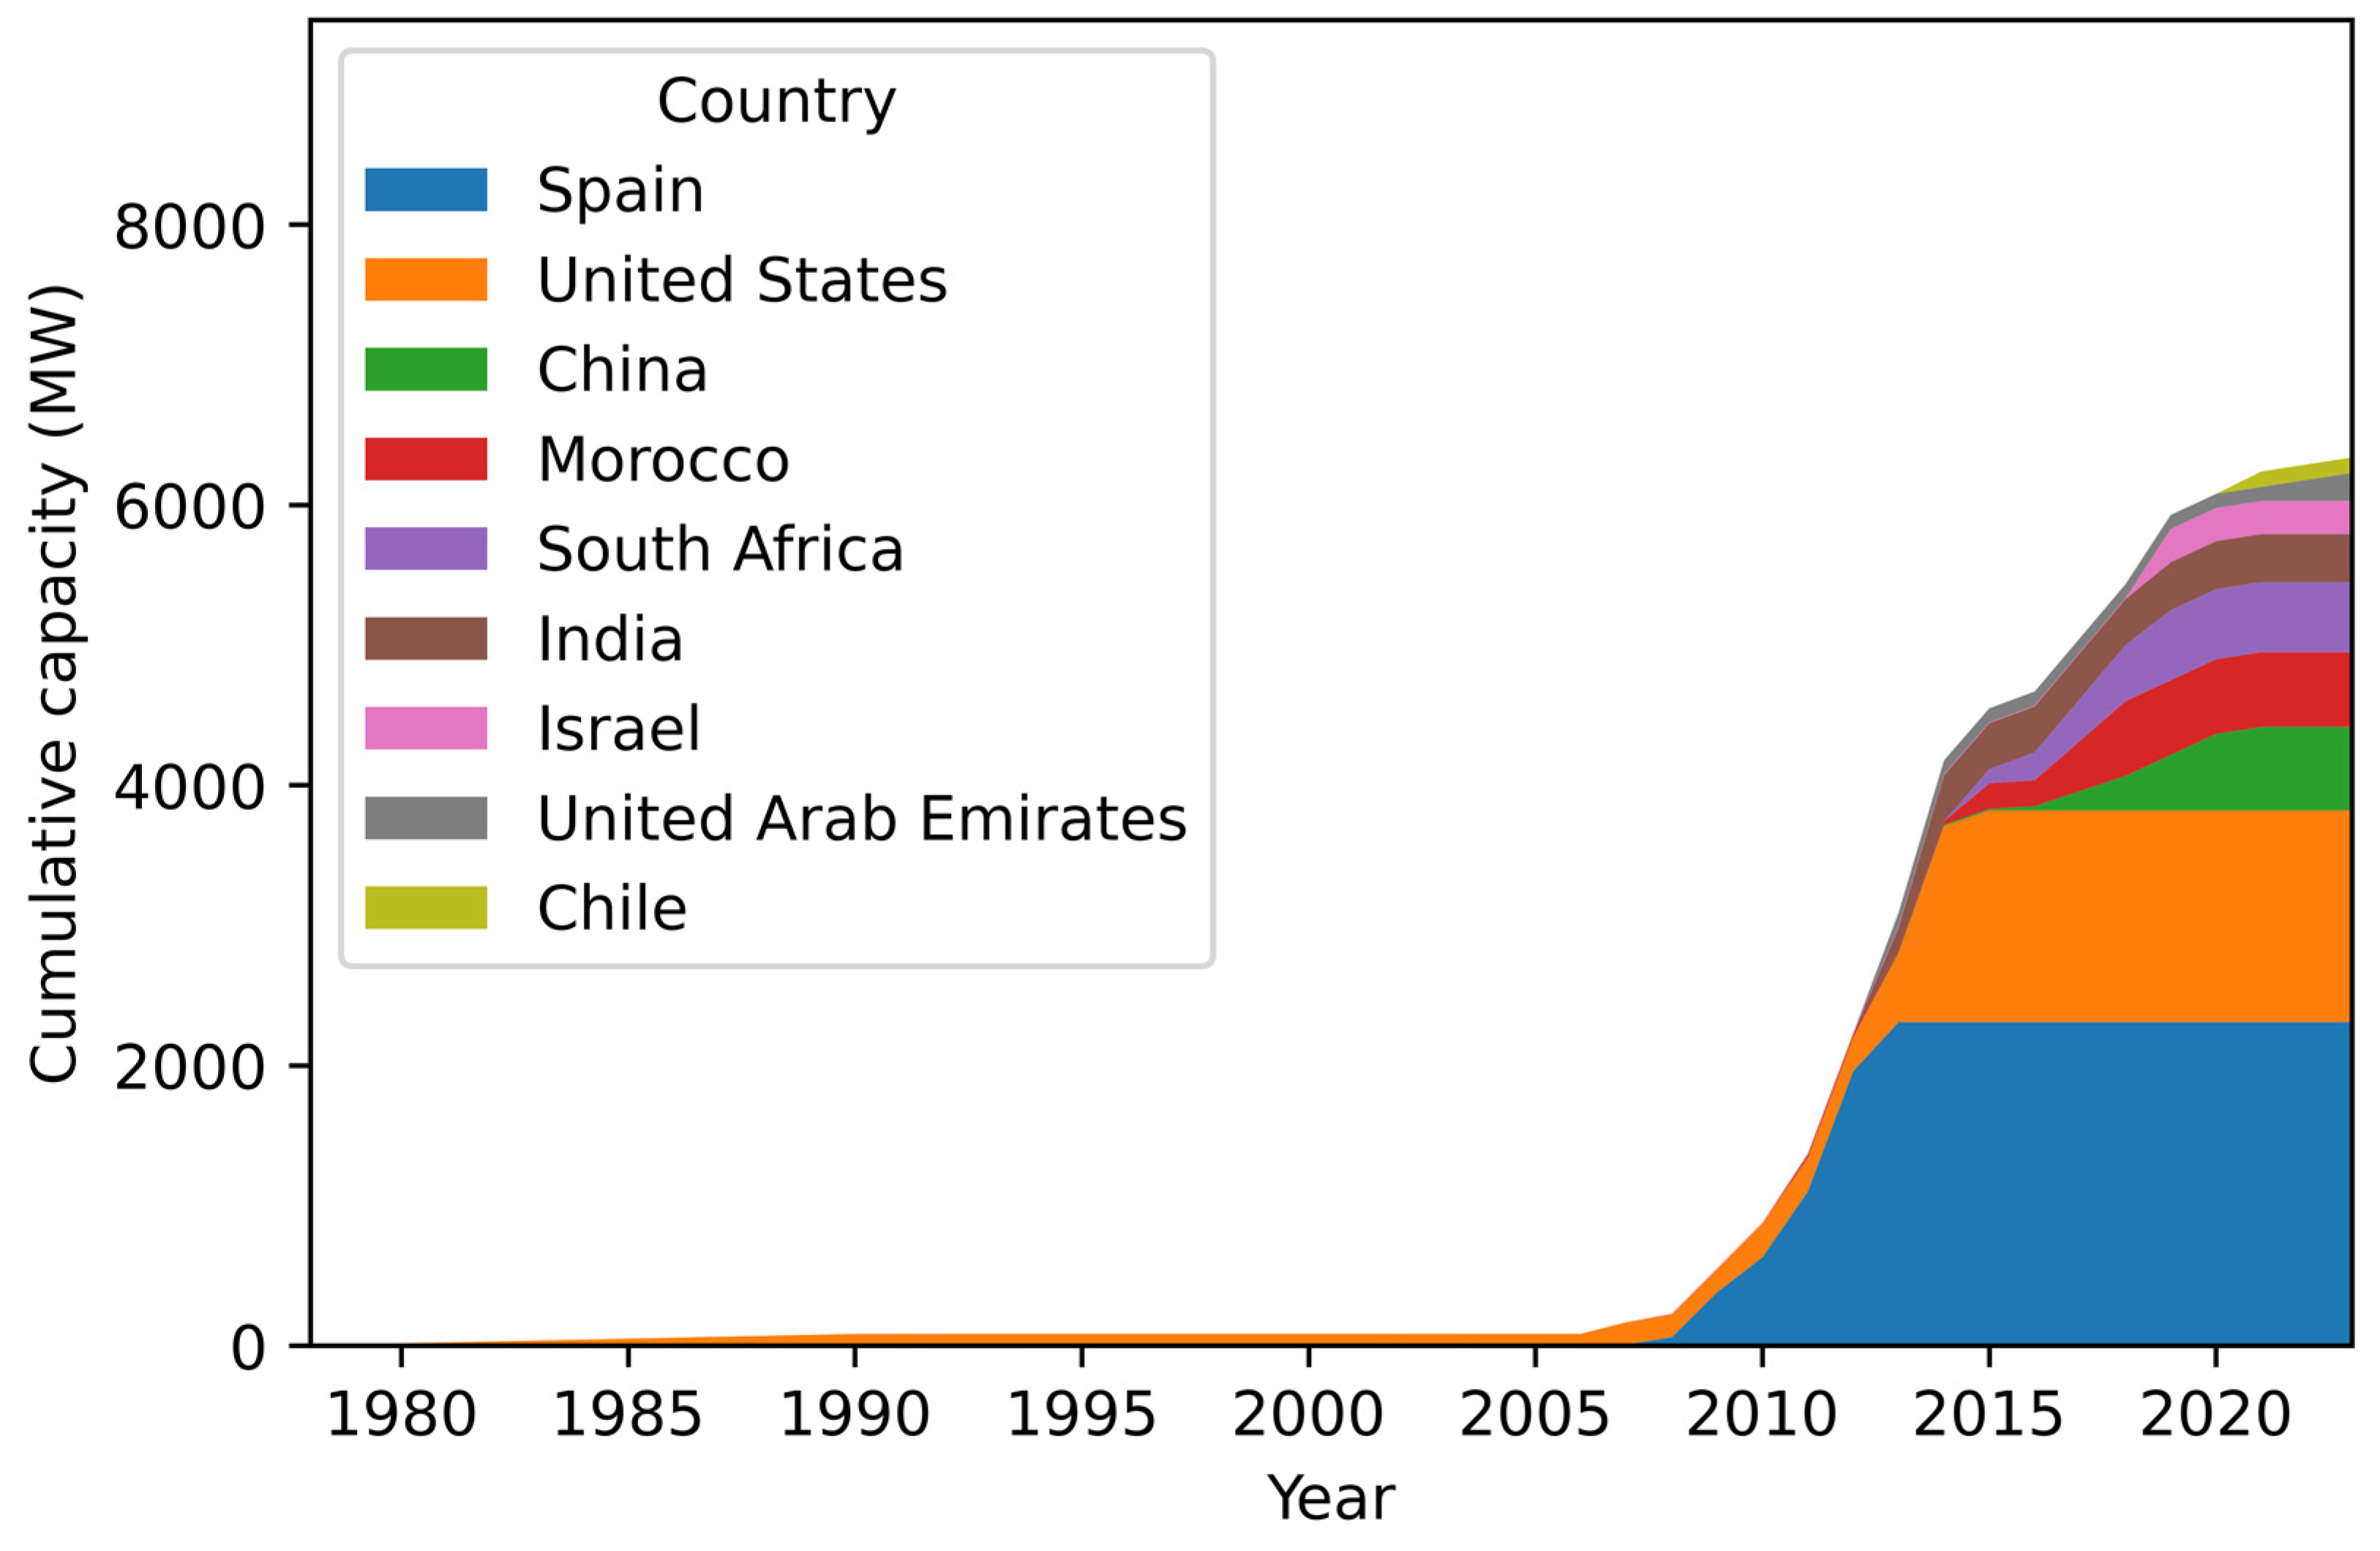
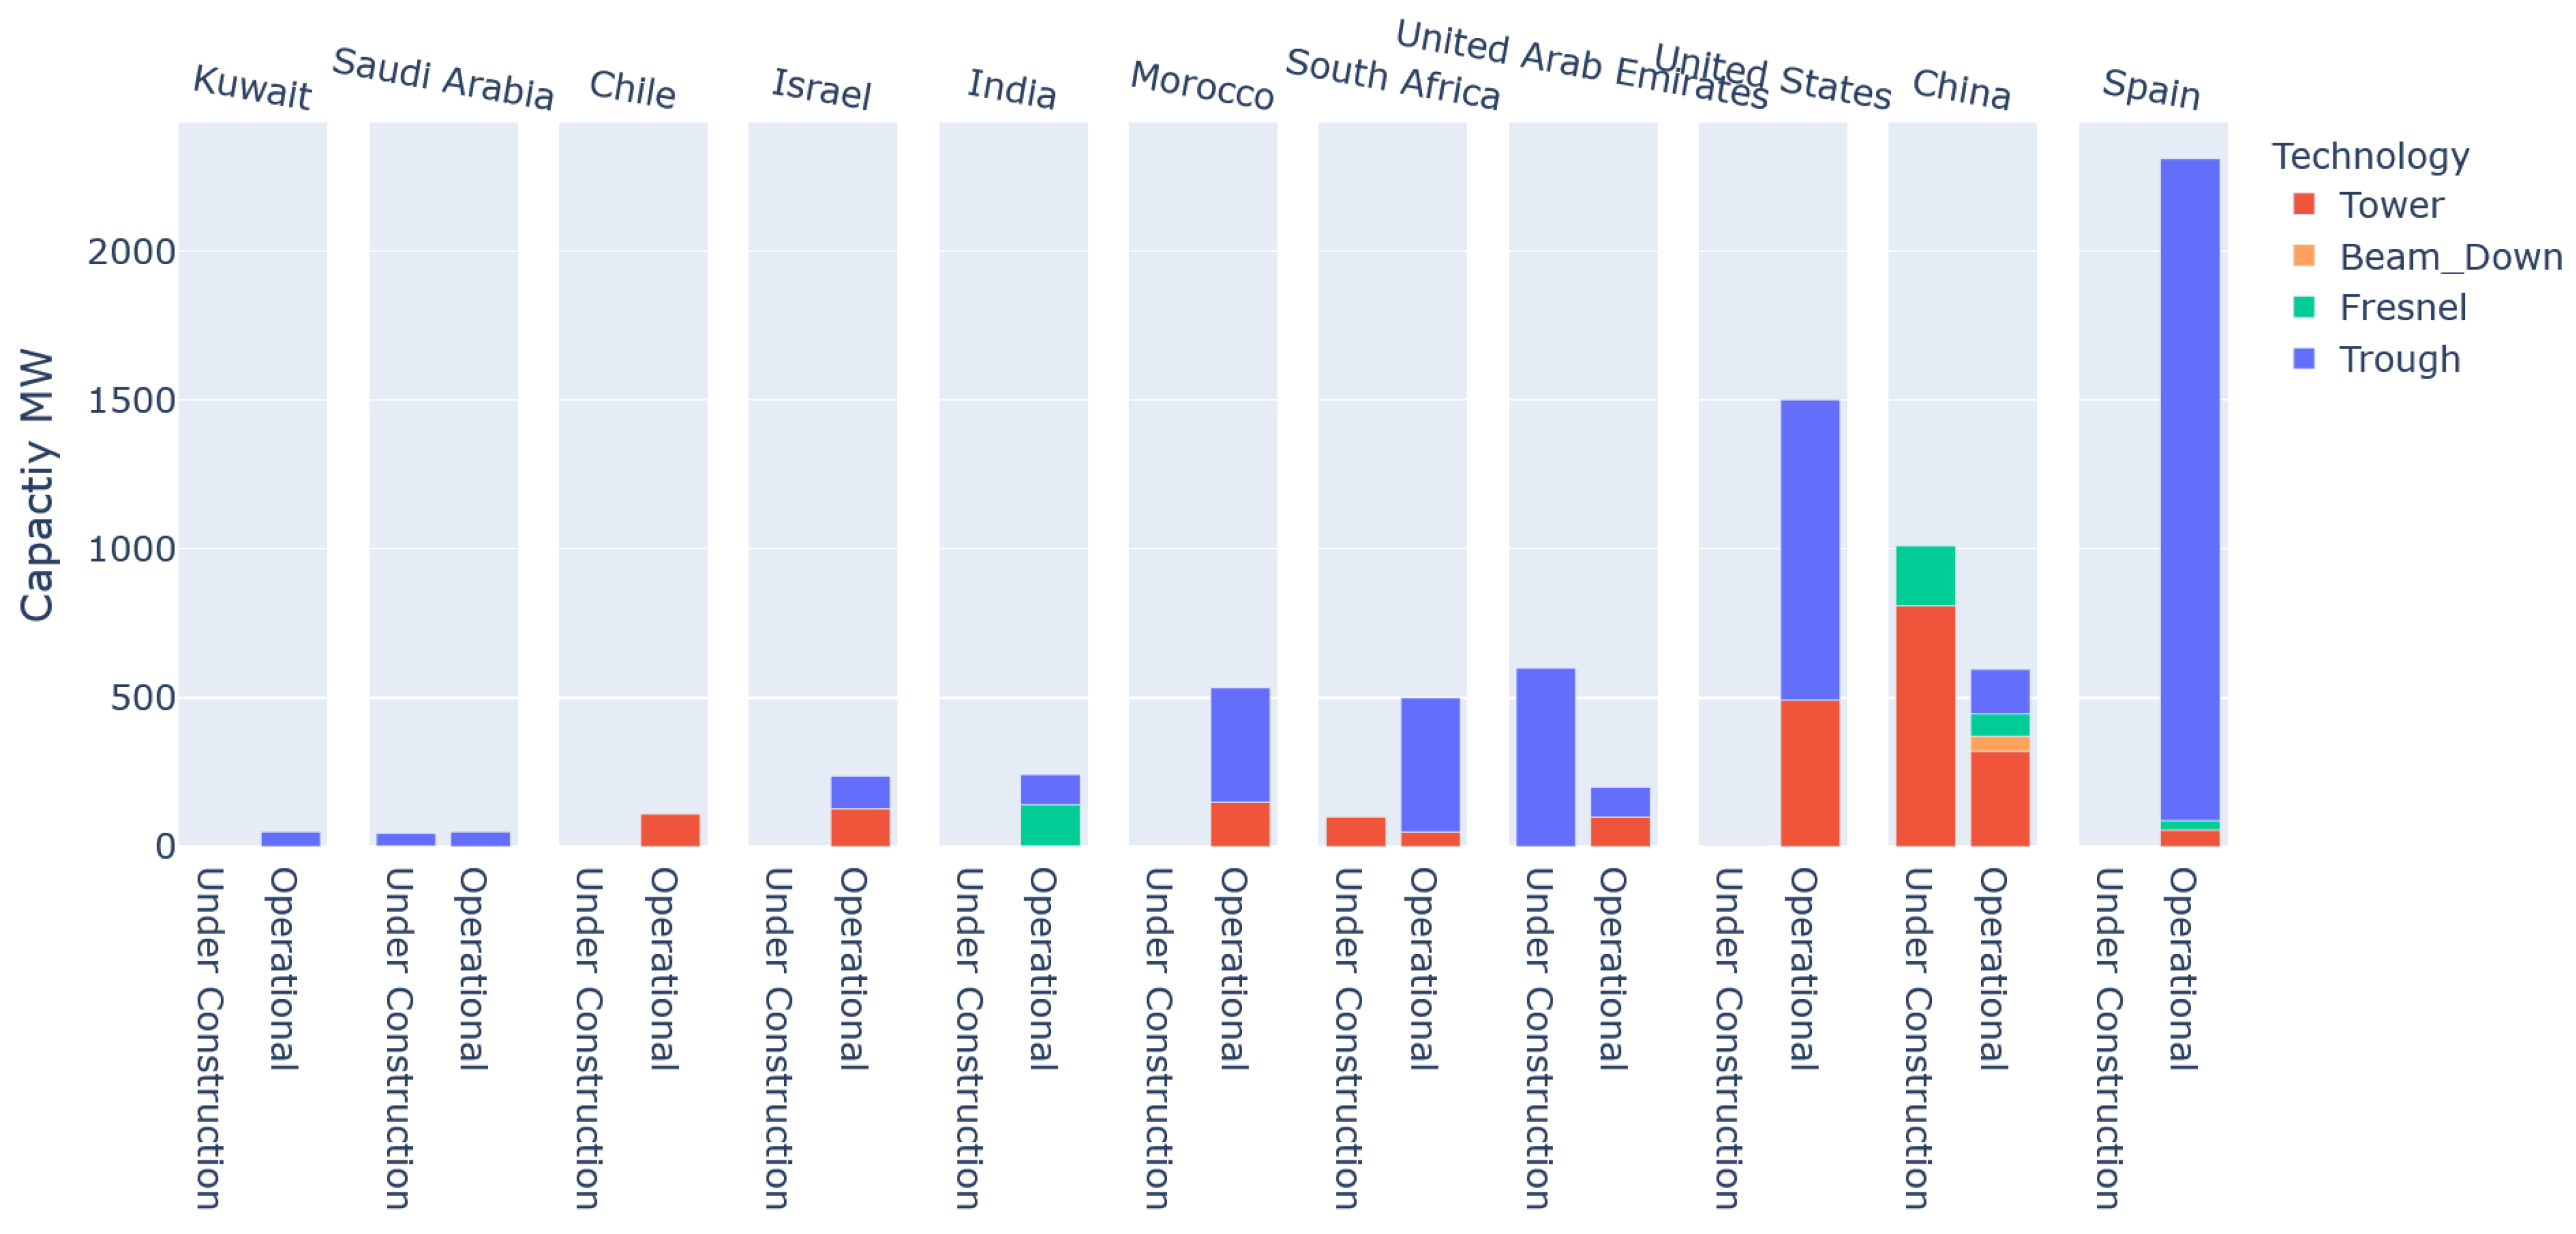
2.1. Worldwide Capacity
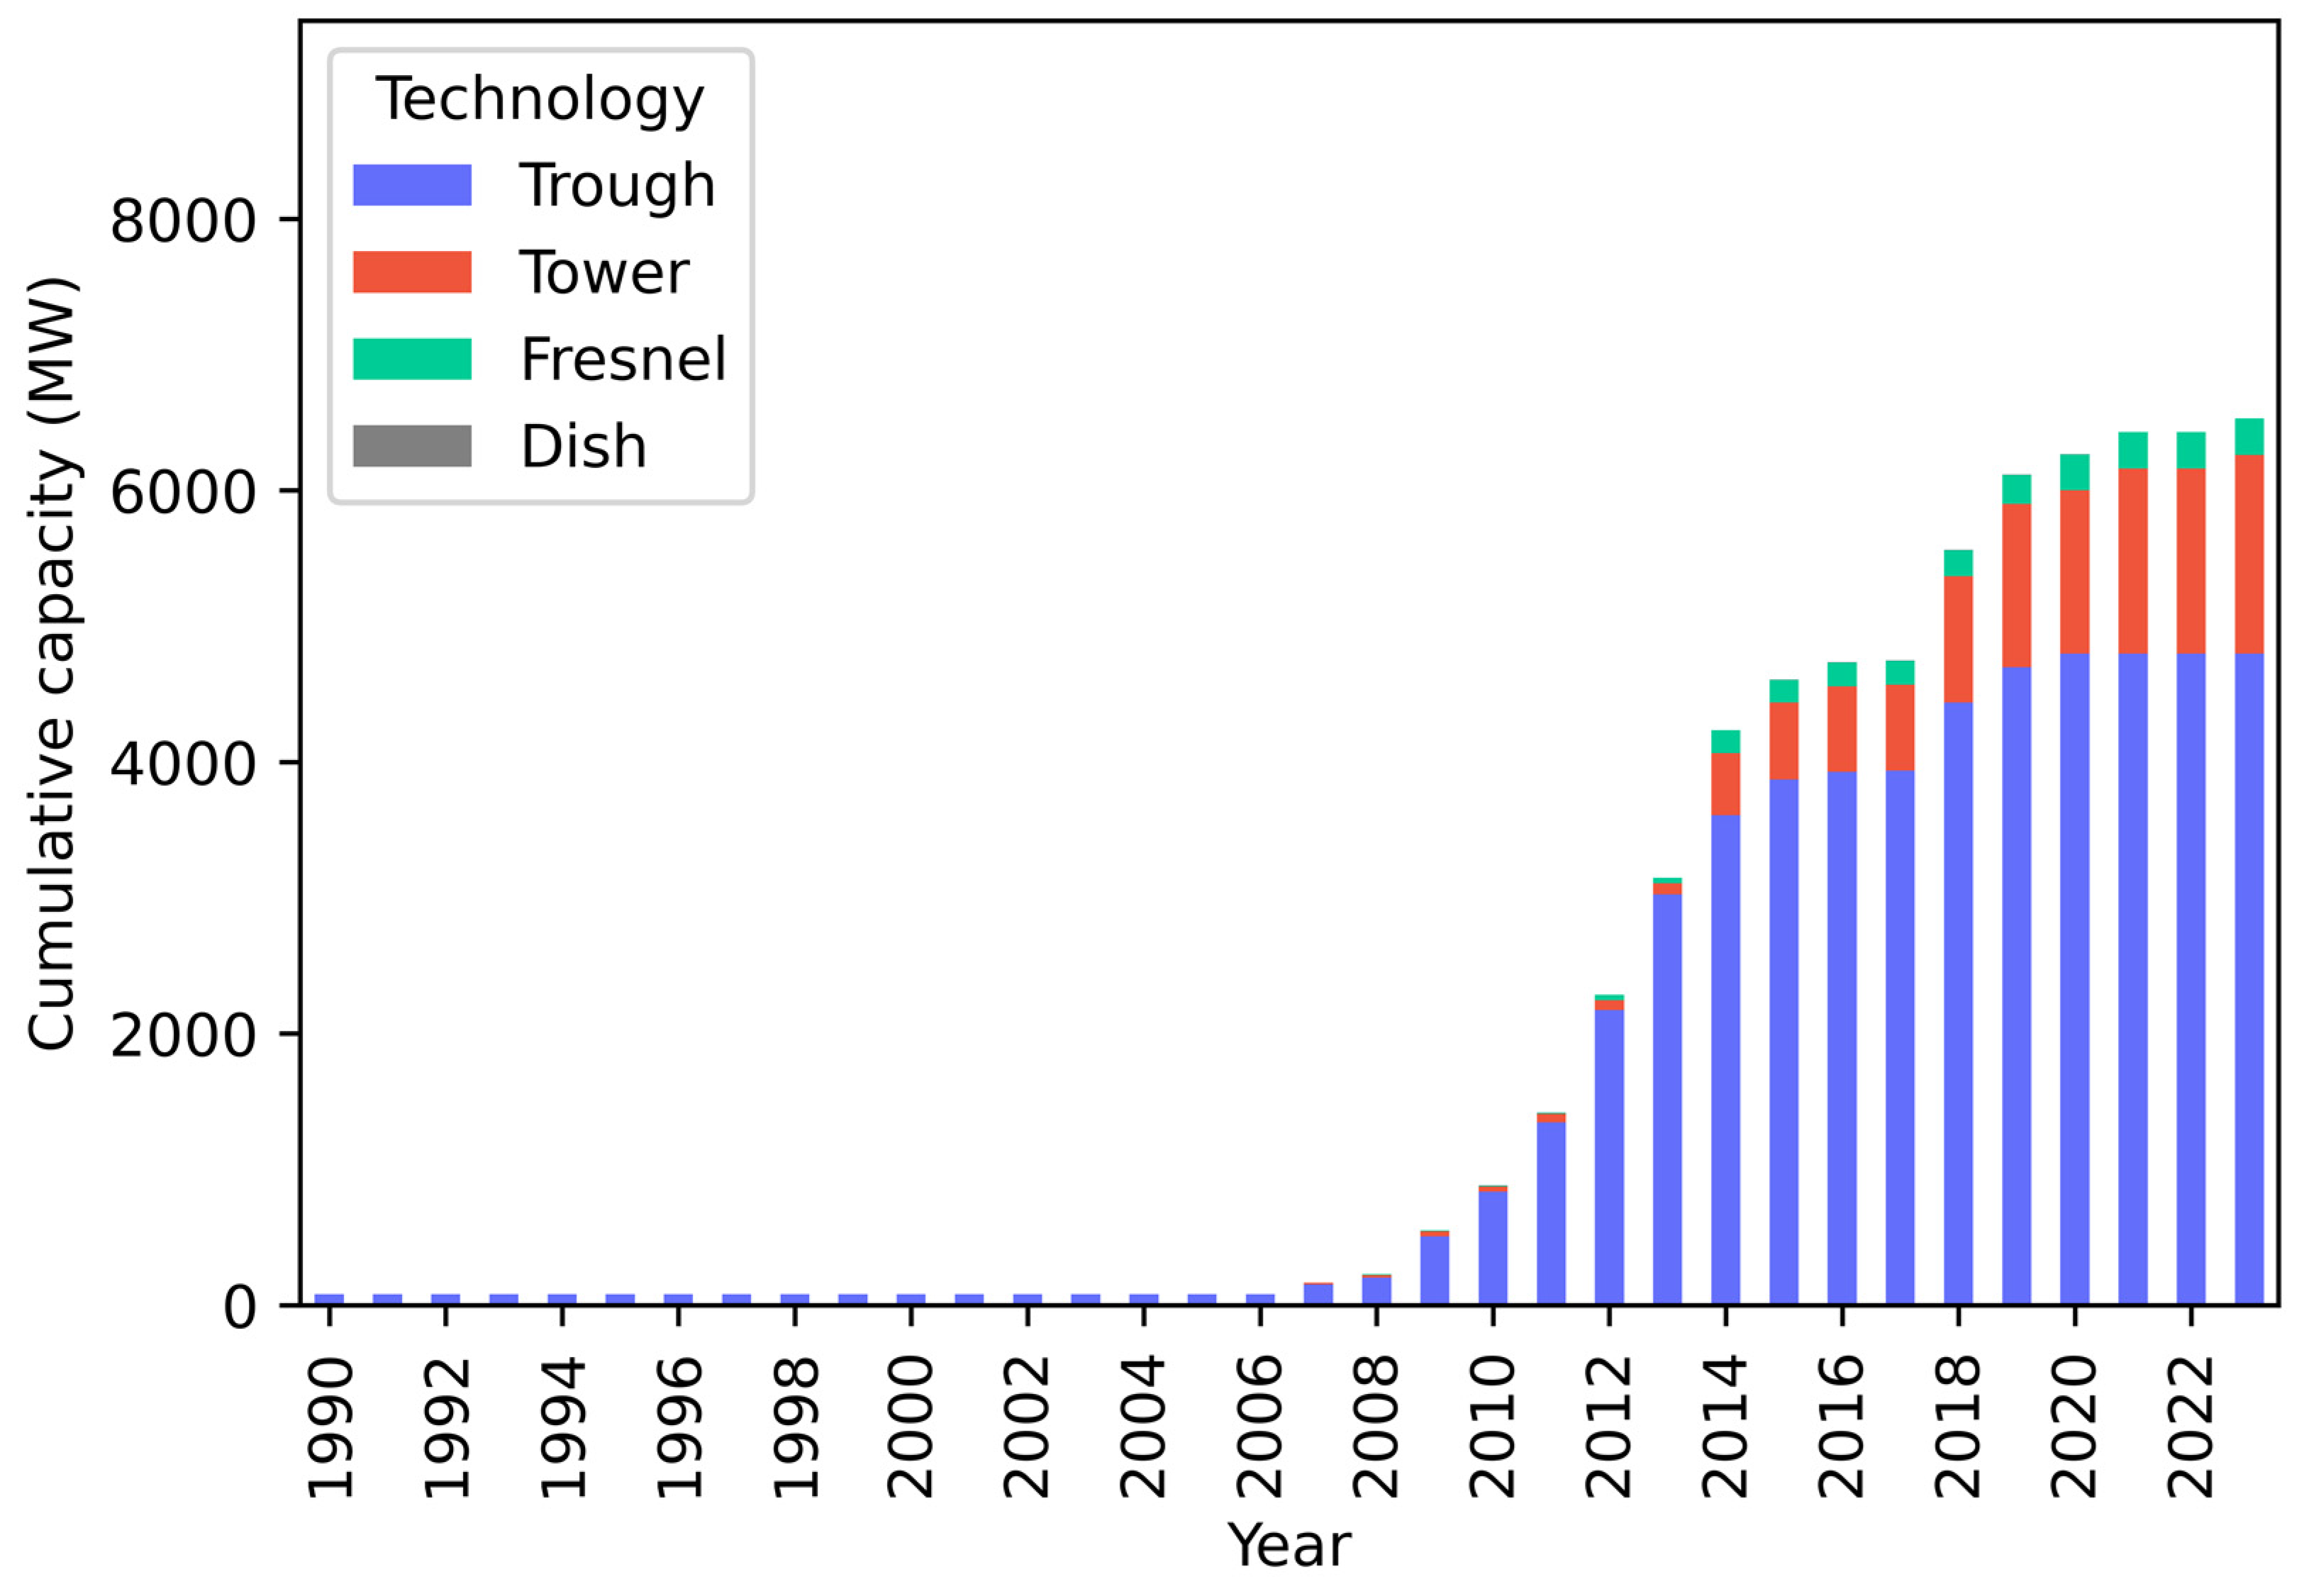
2.2. Technology Repartition
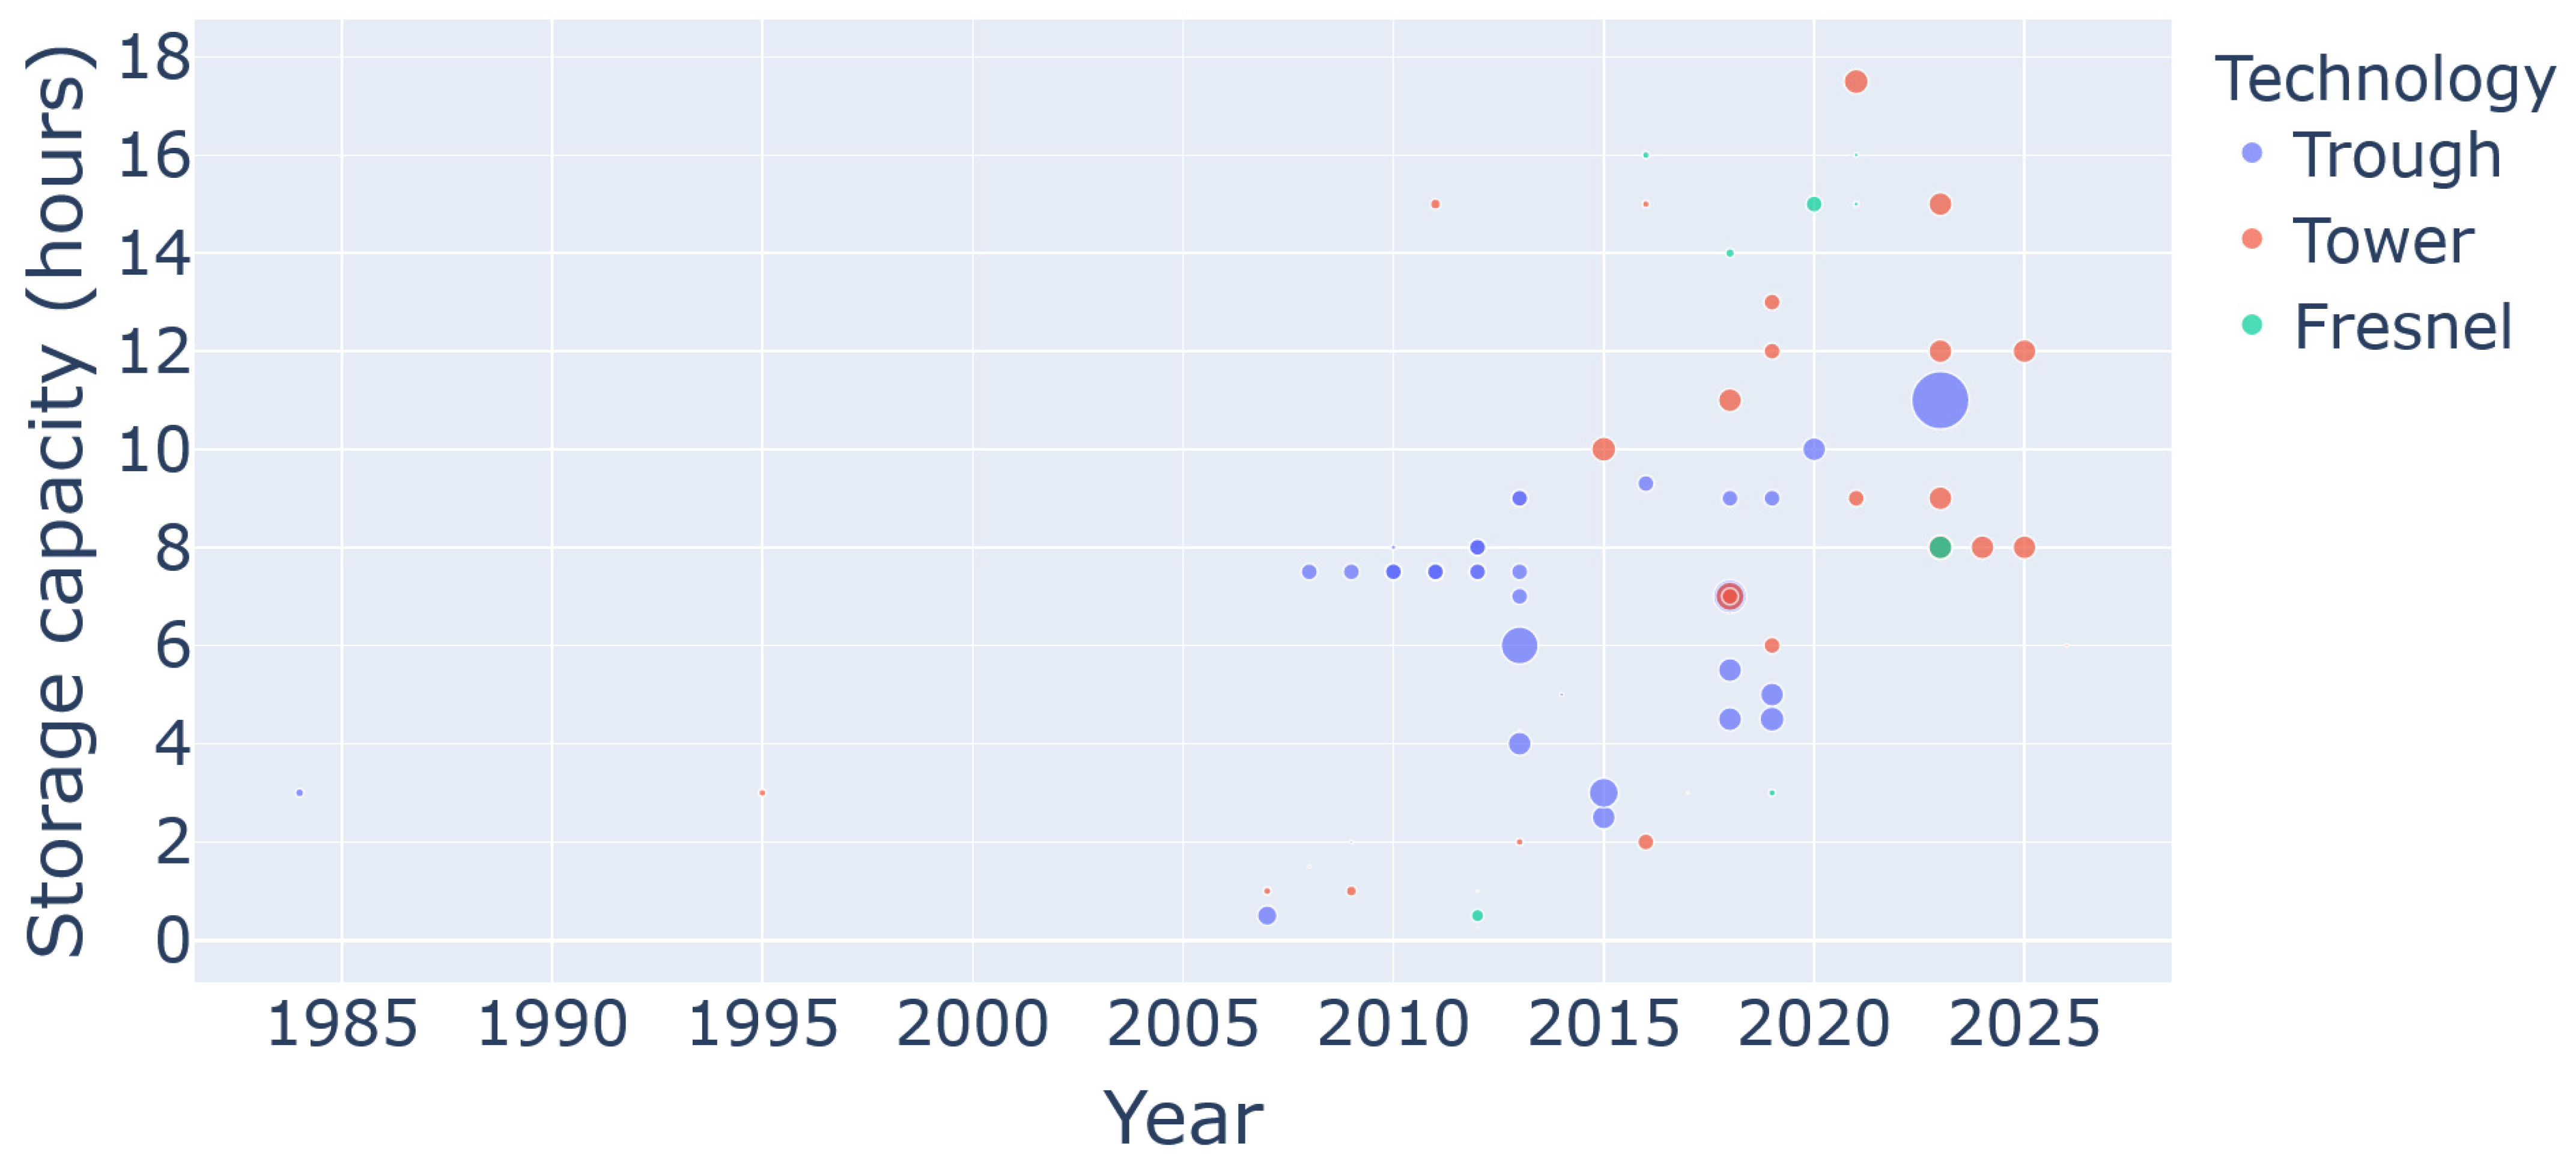
2.3. Storage Capacity
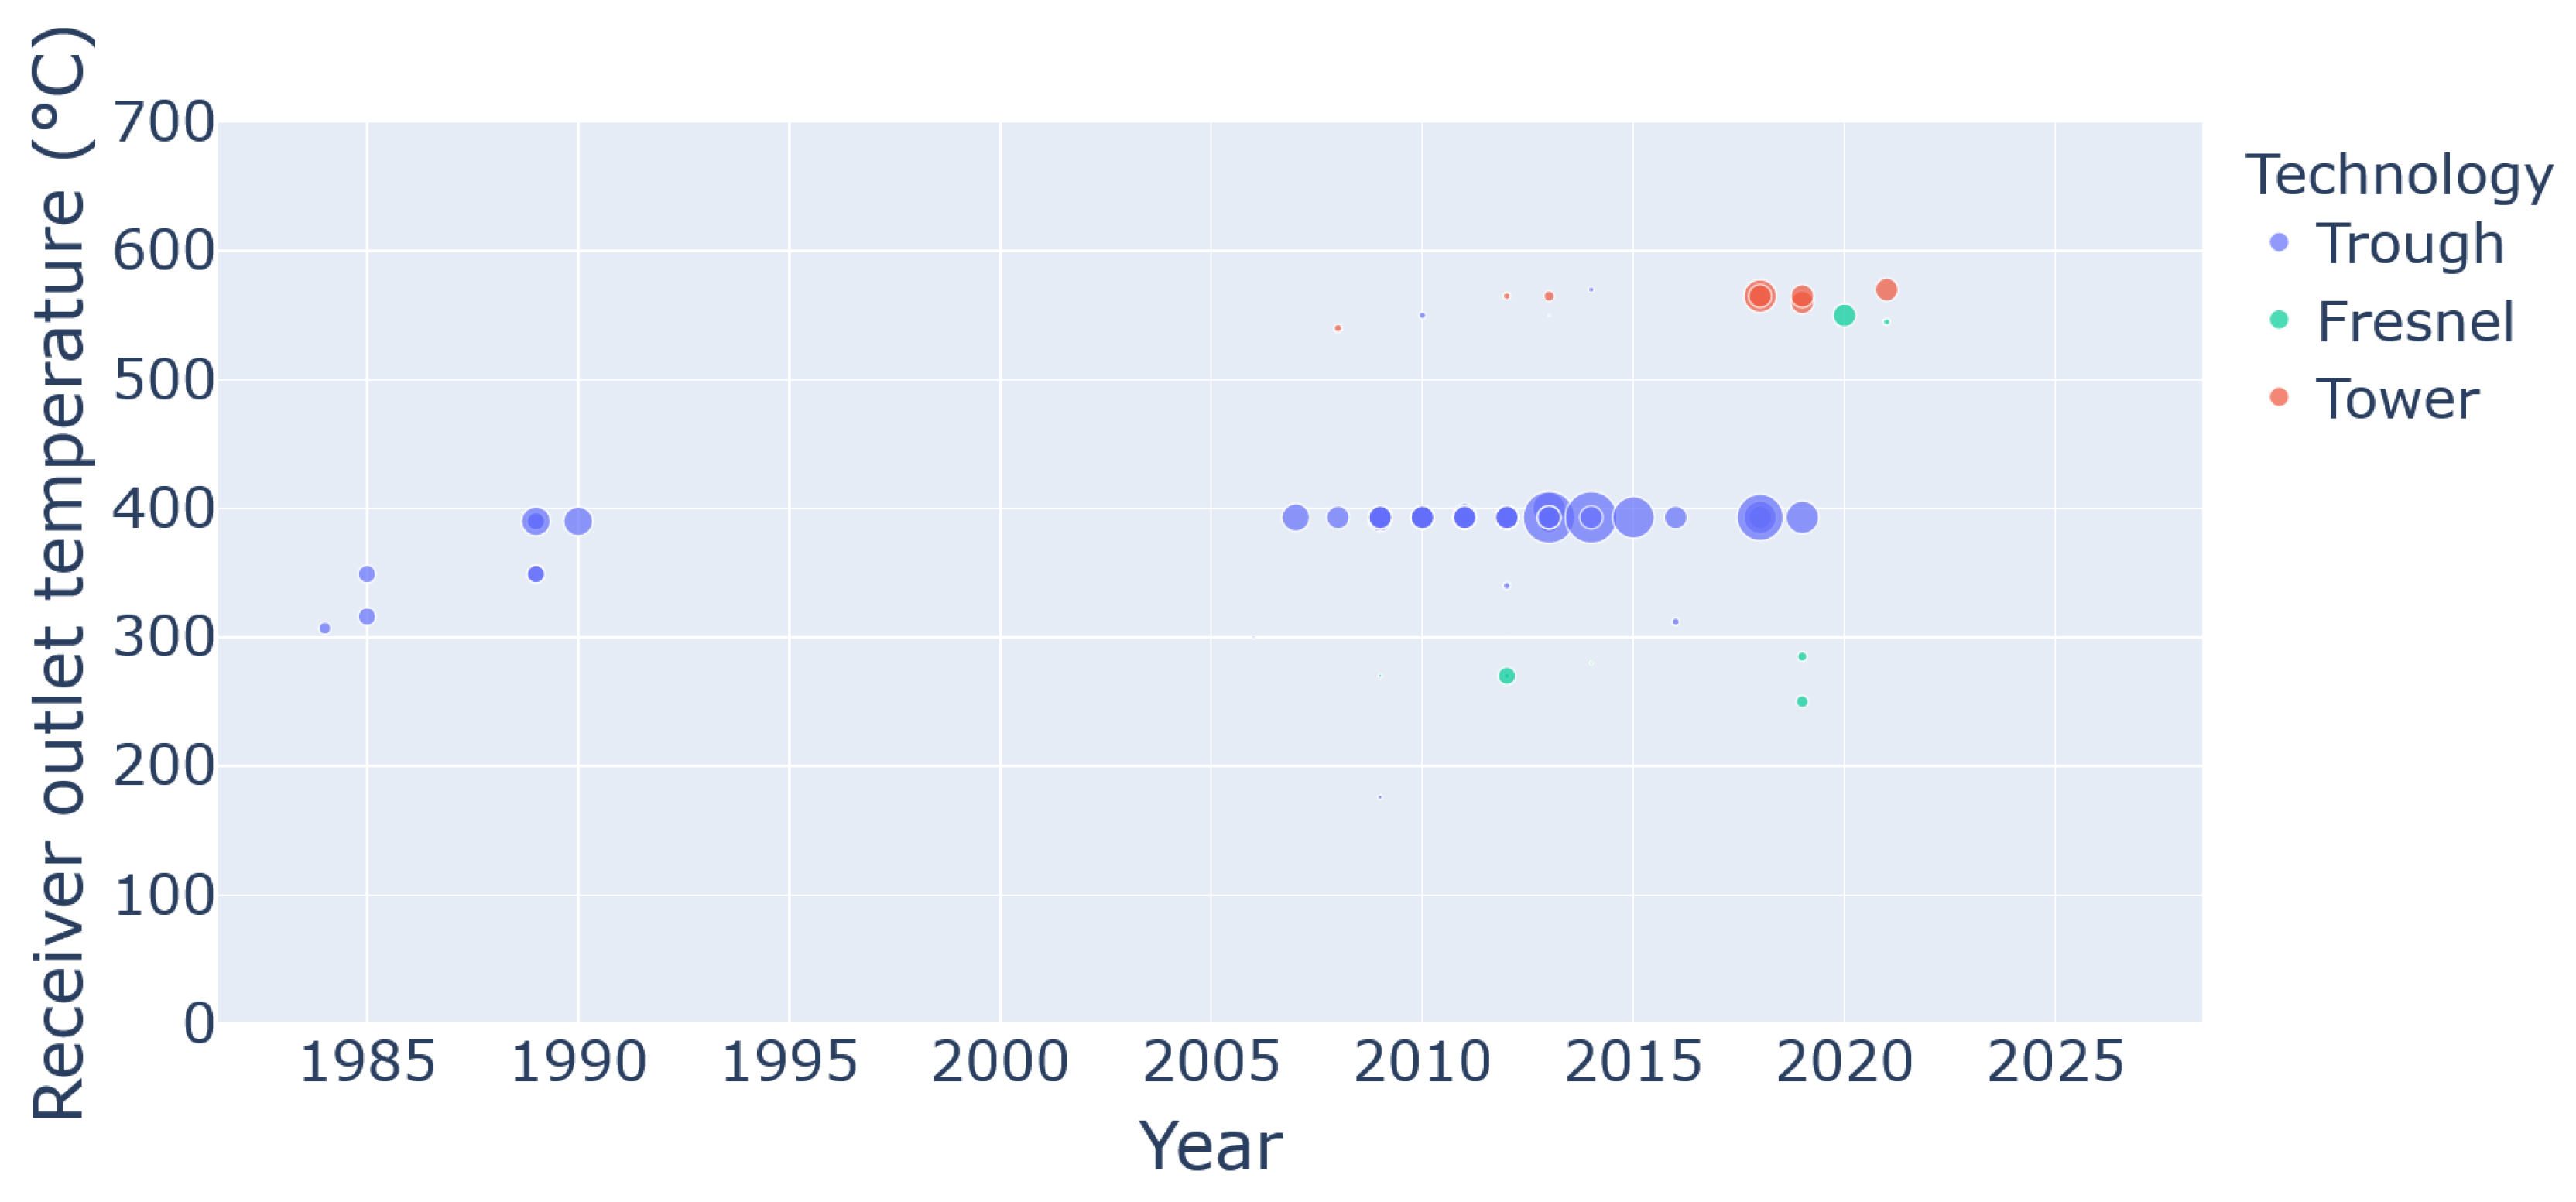
2.4. Operating Temperatures
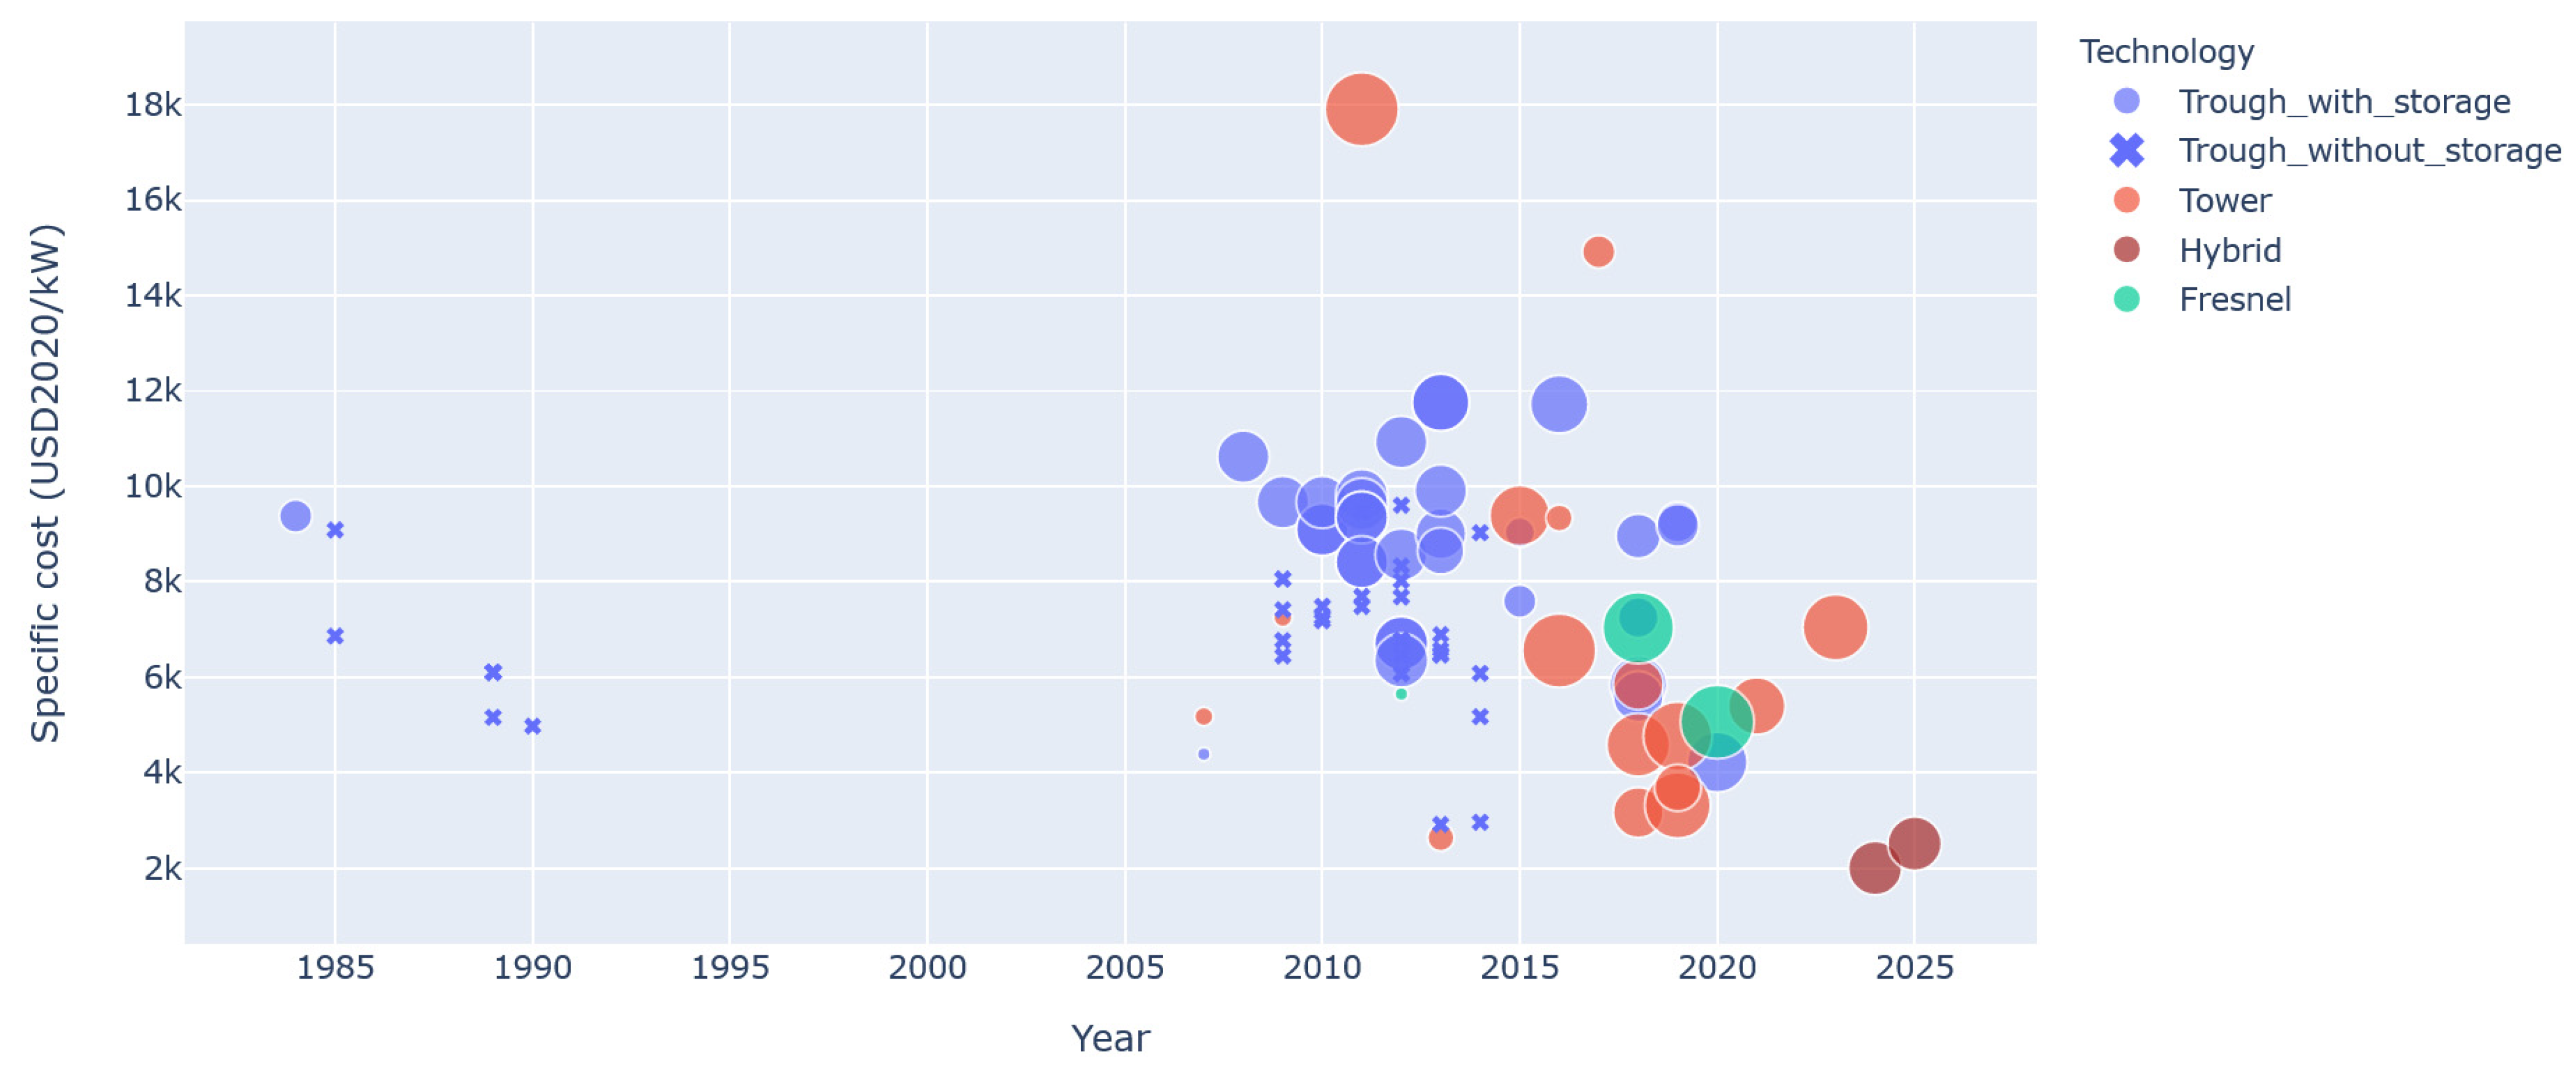
2.5. Investment Costs
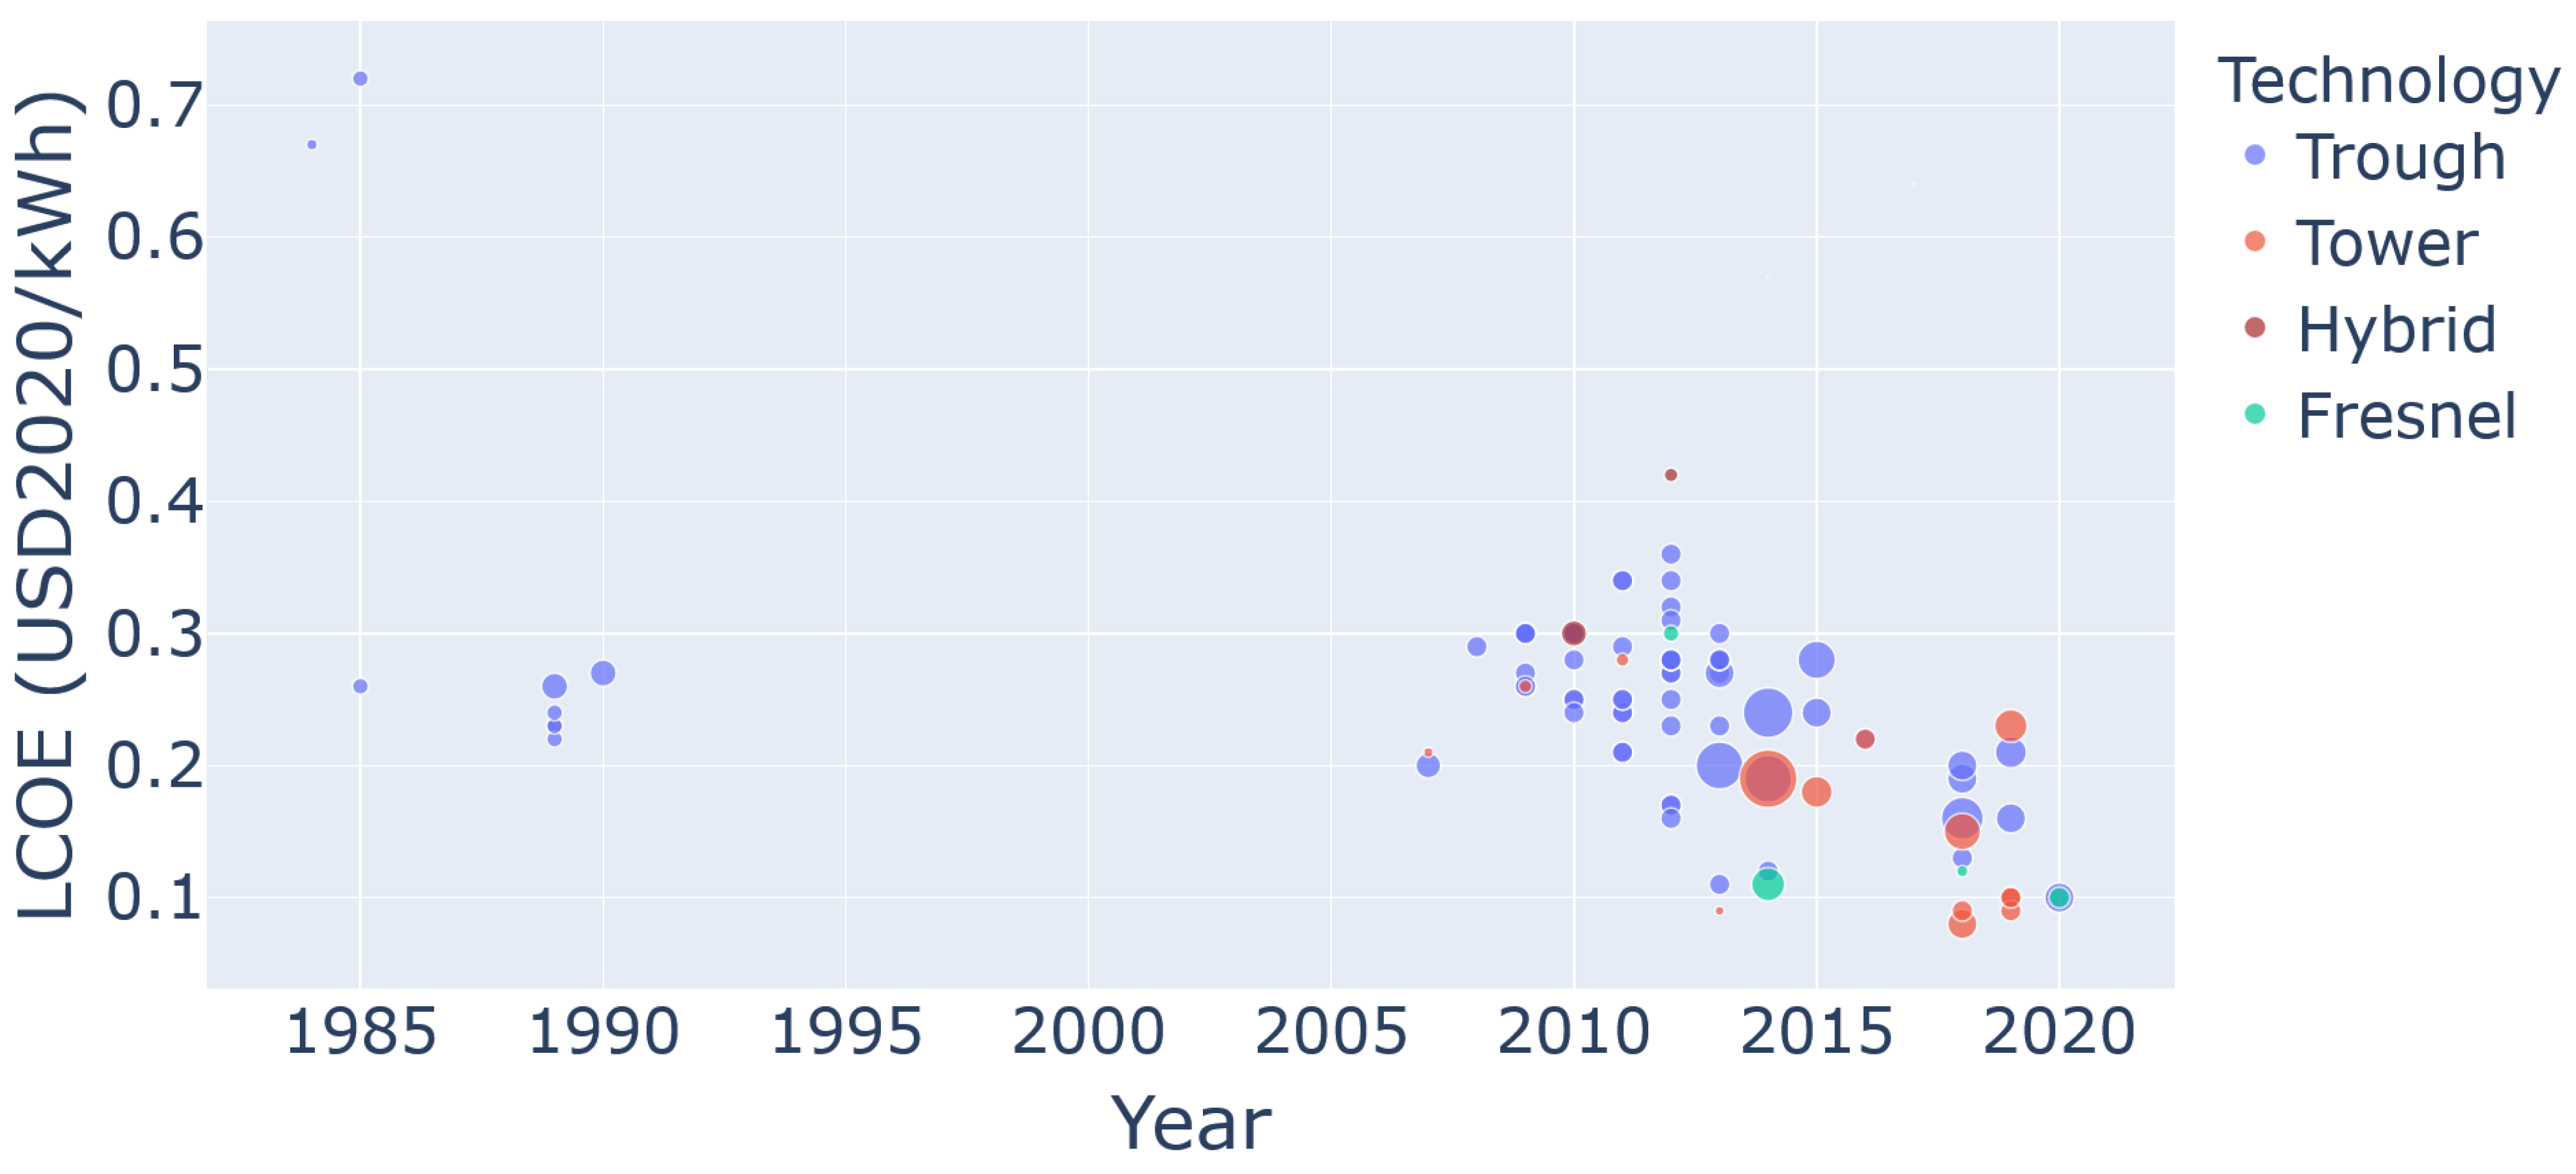
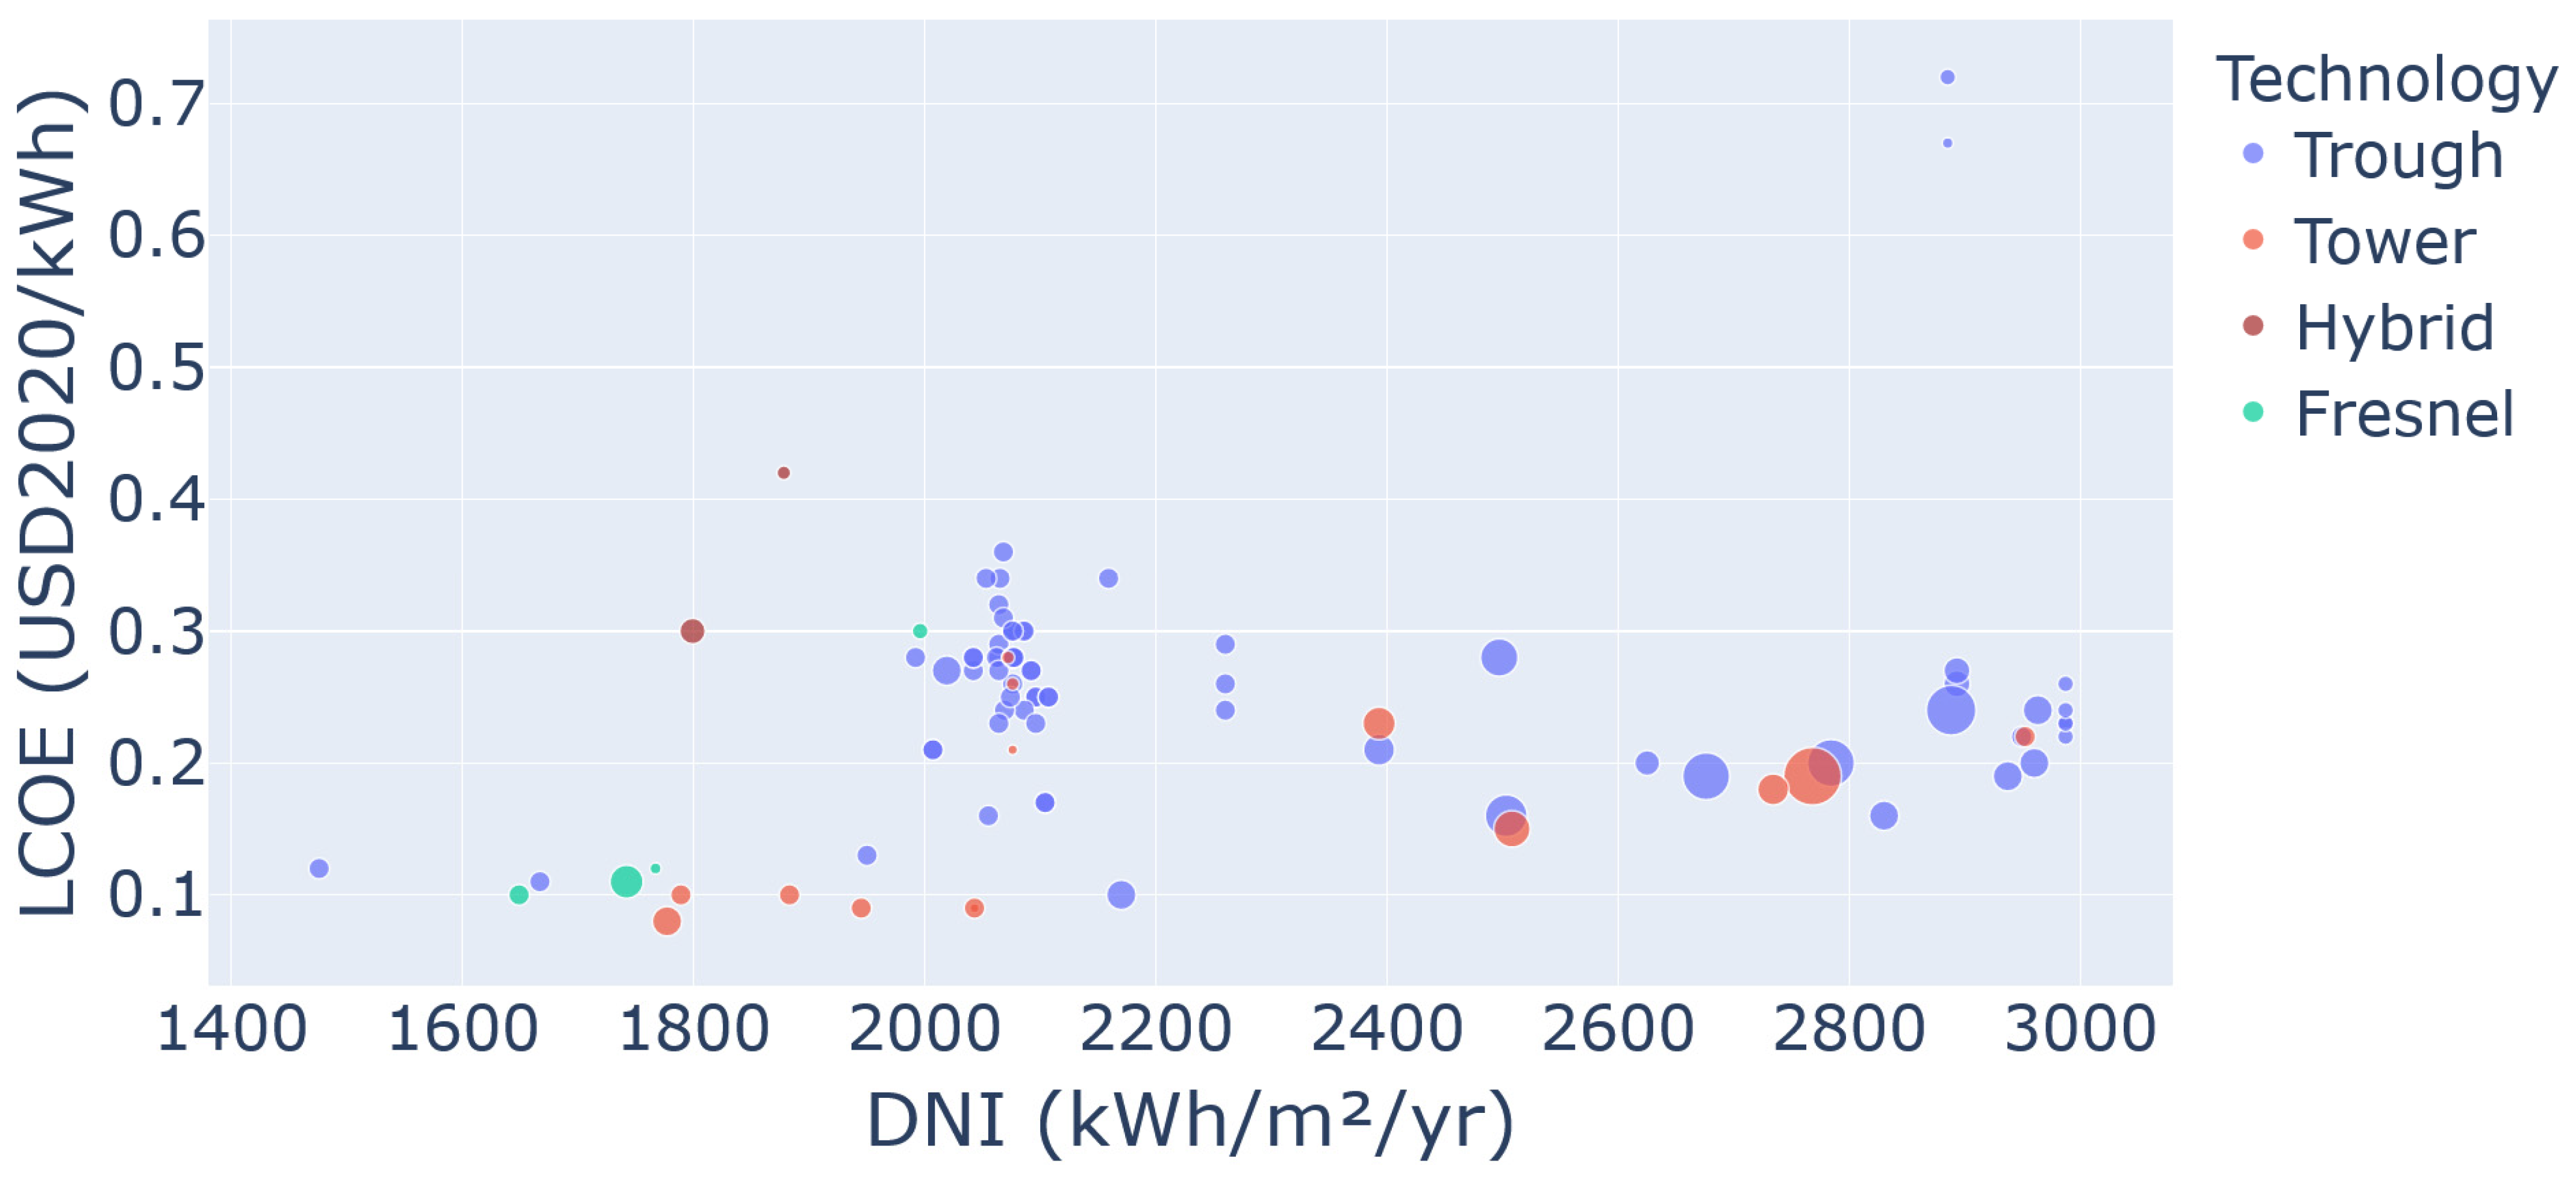
2.6. Levelized Cost of Electricity
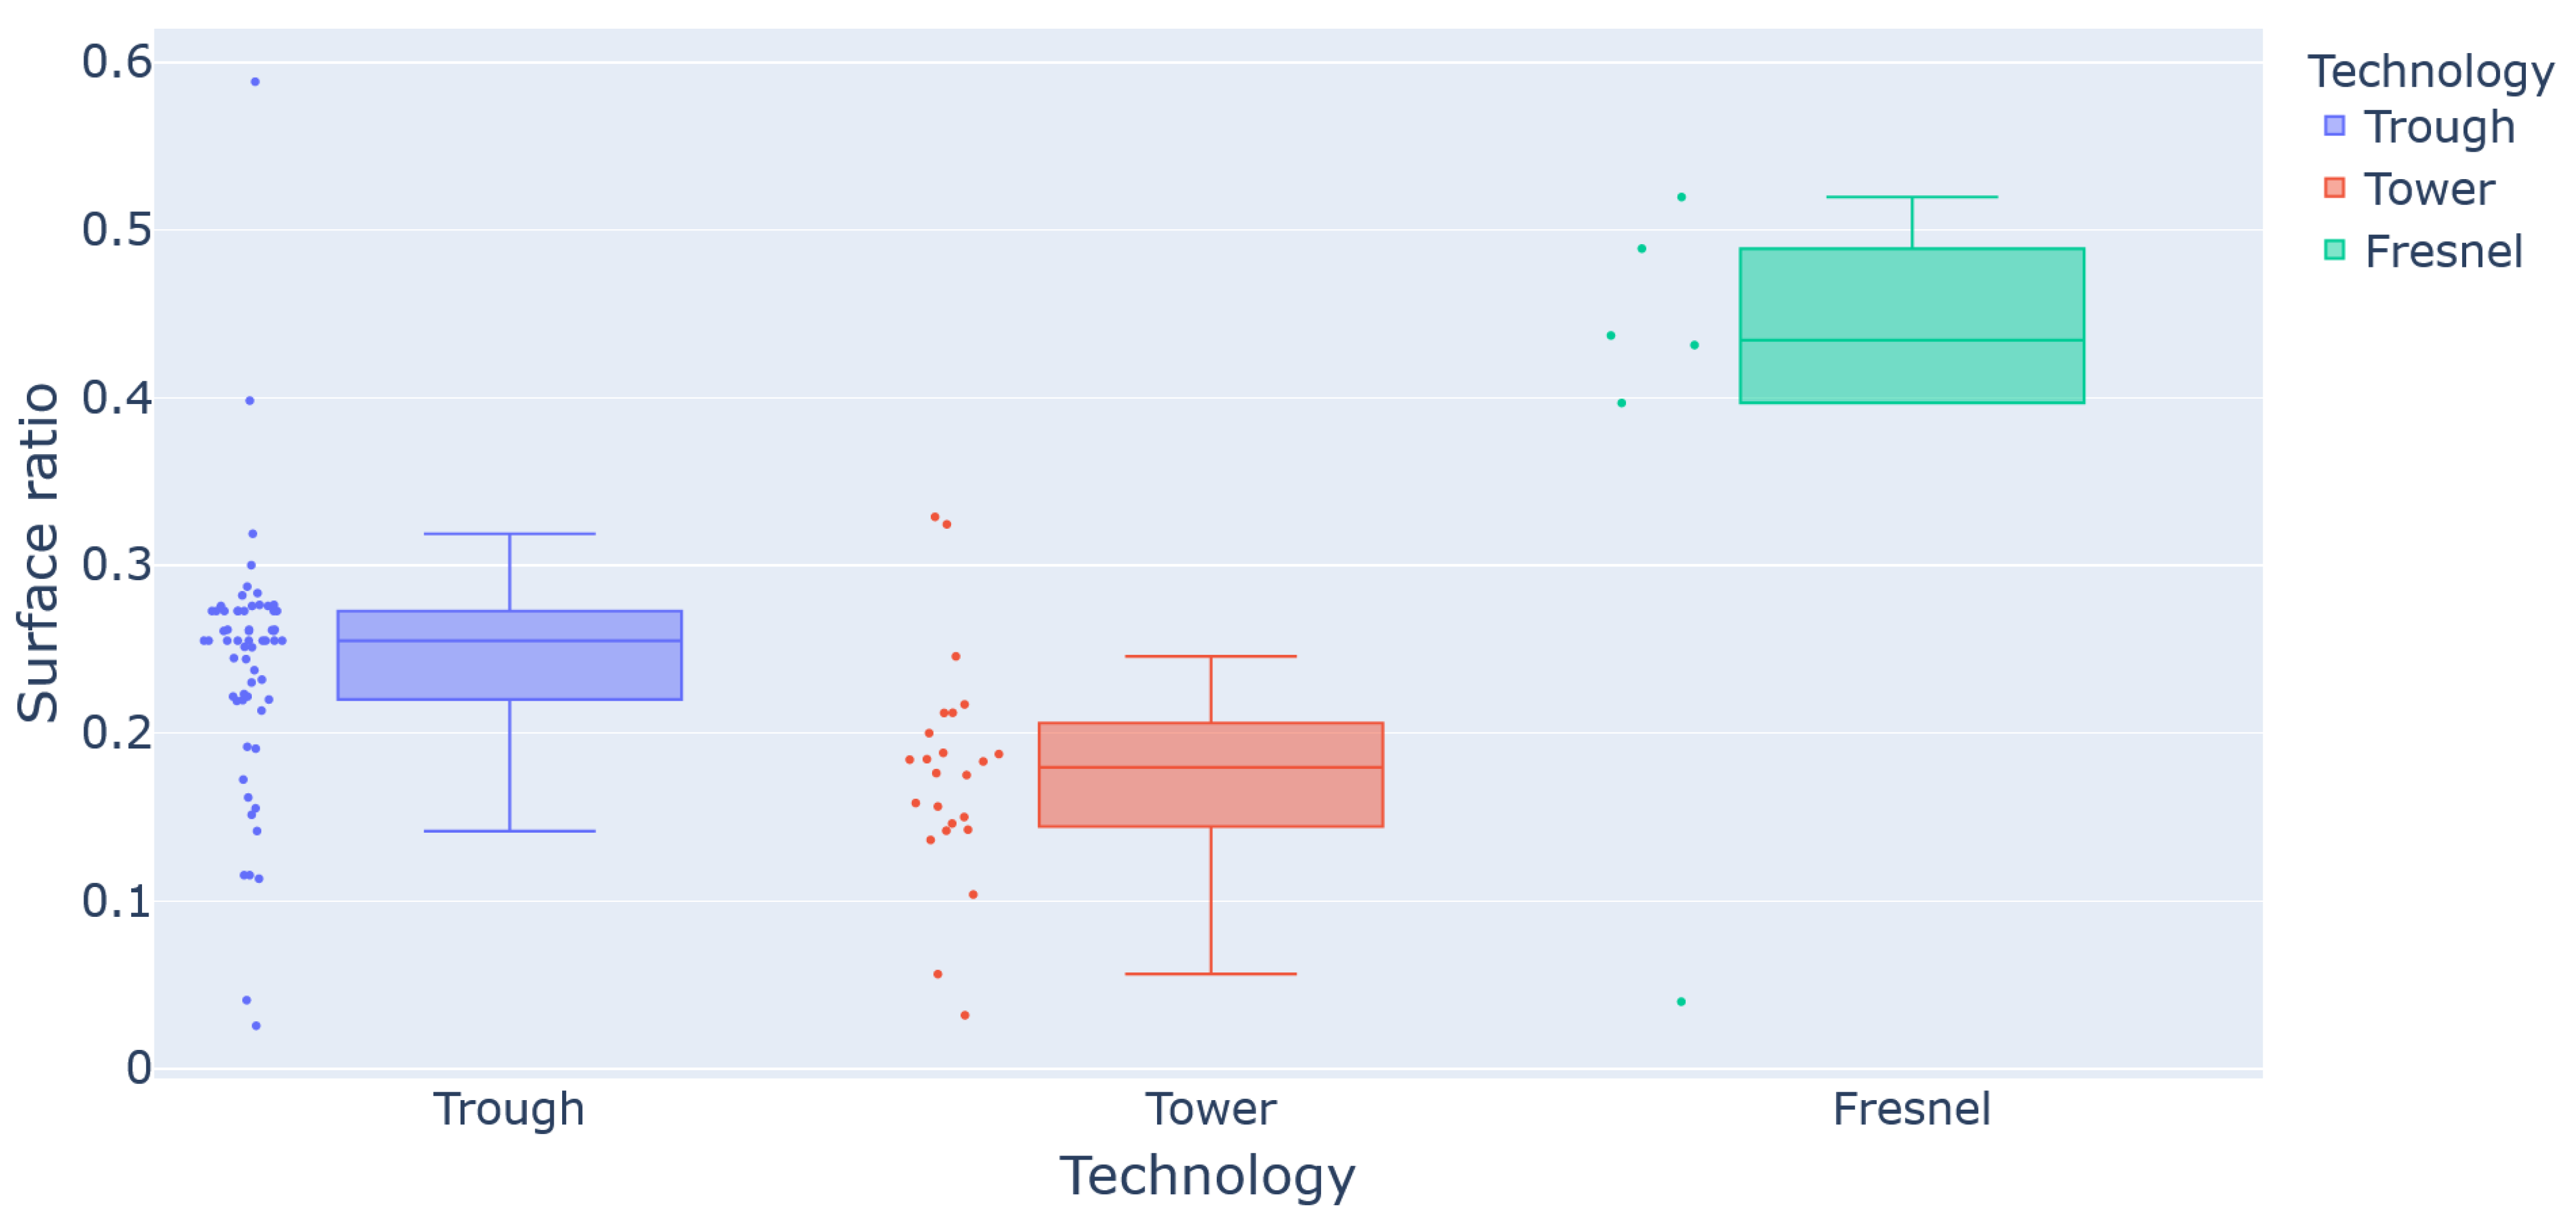
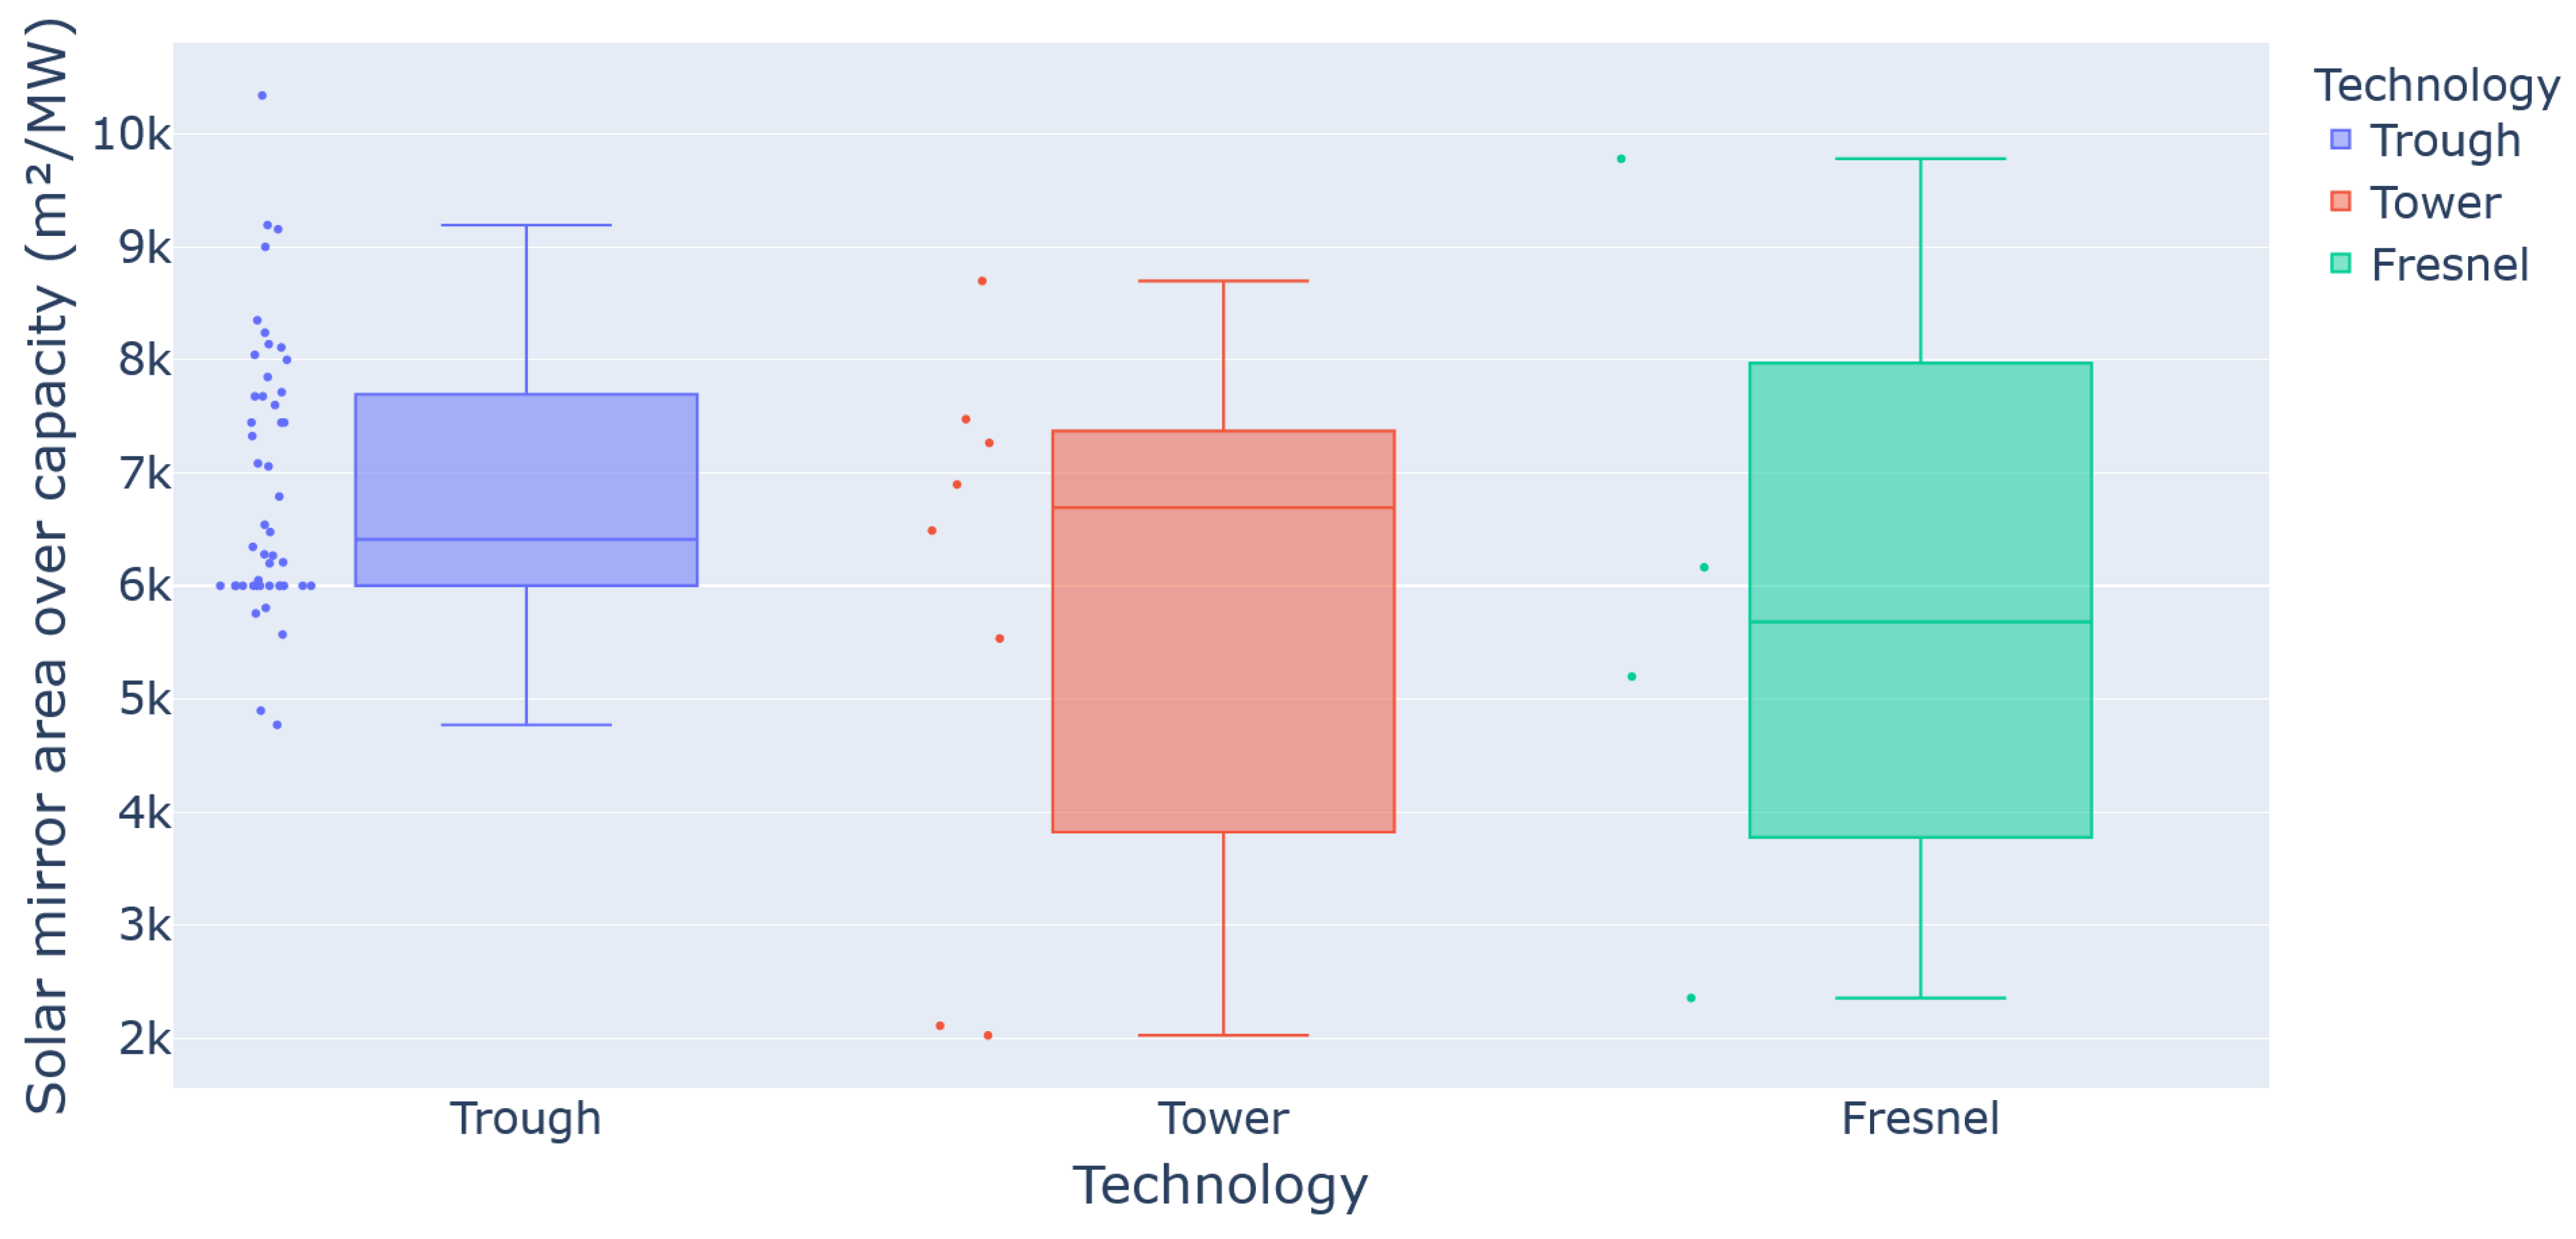
2.7. Land Requirements
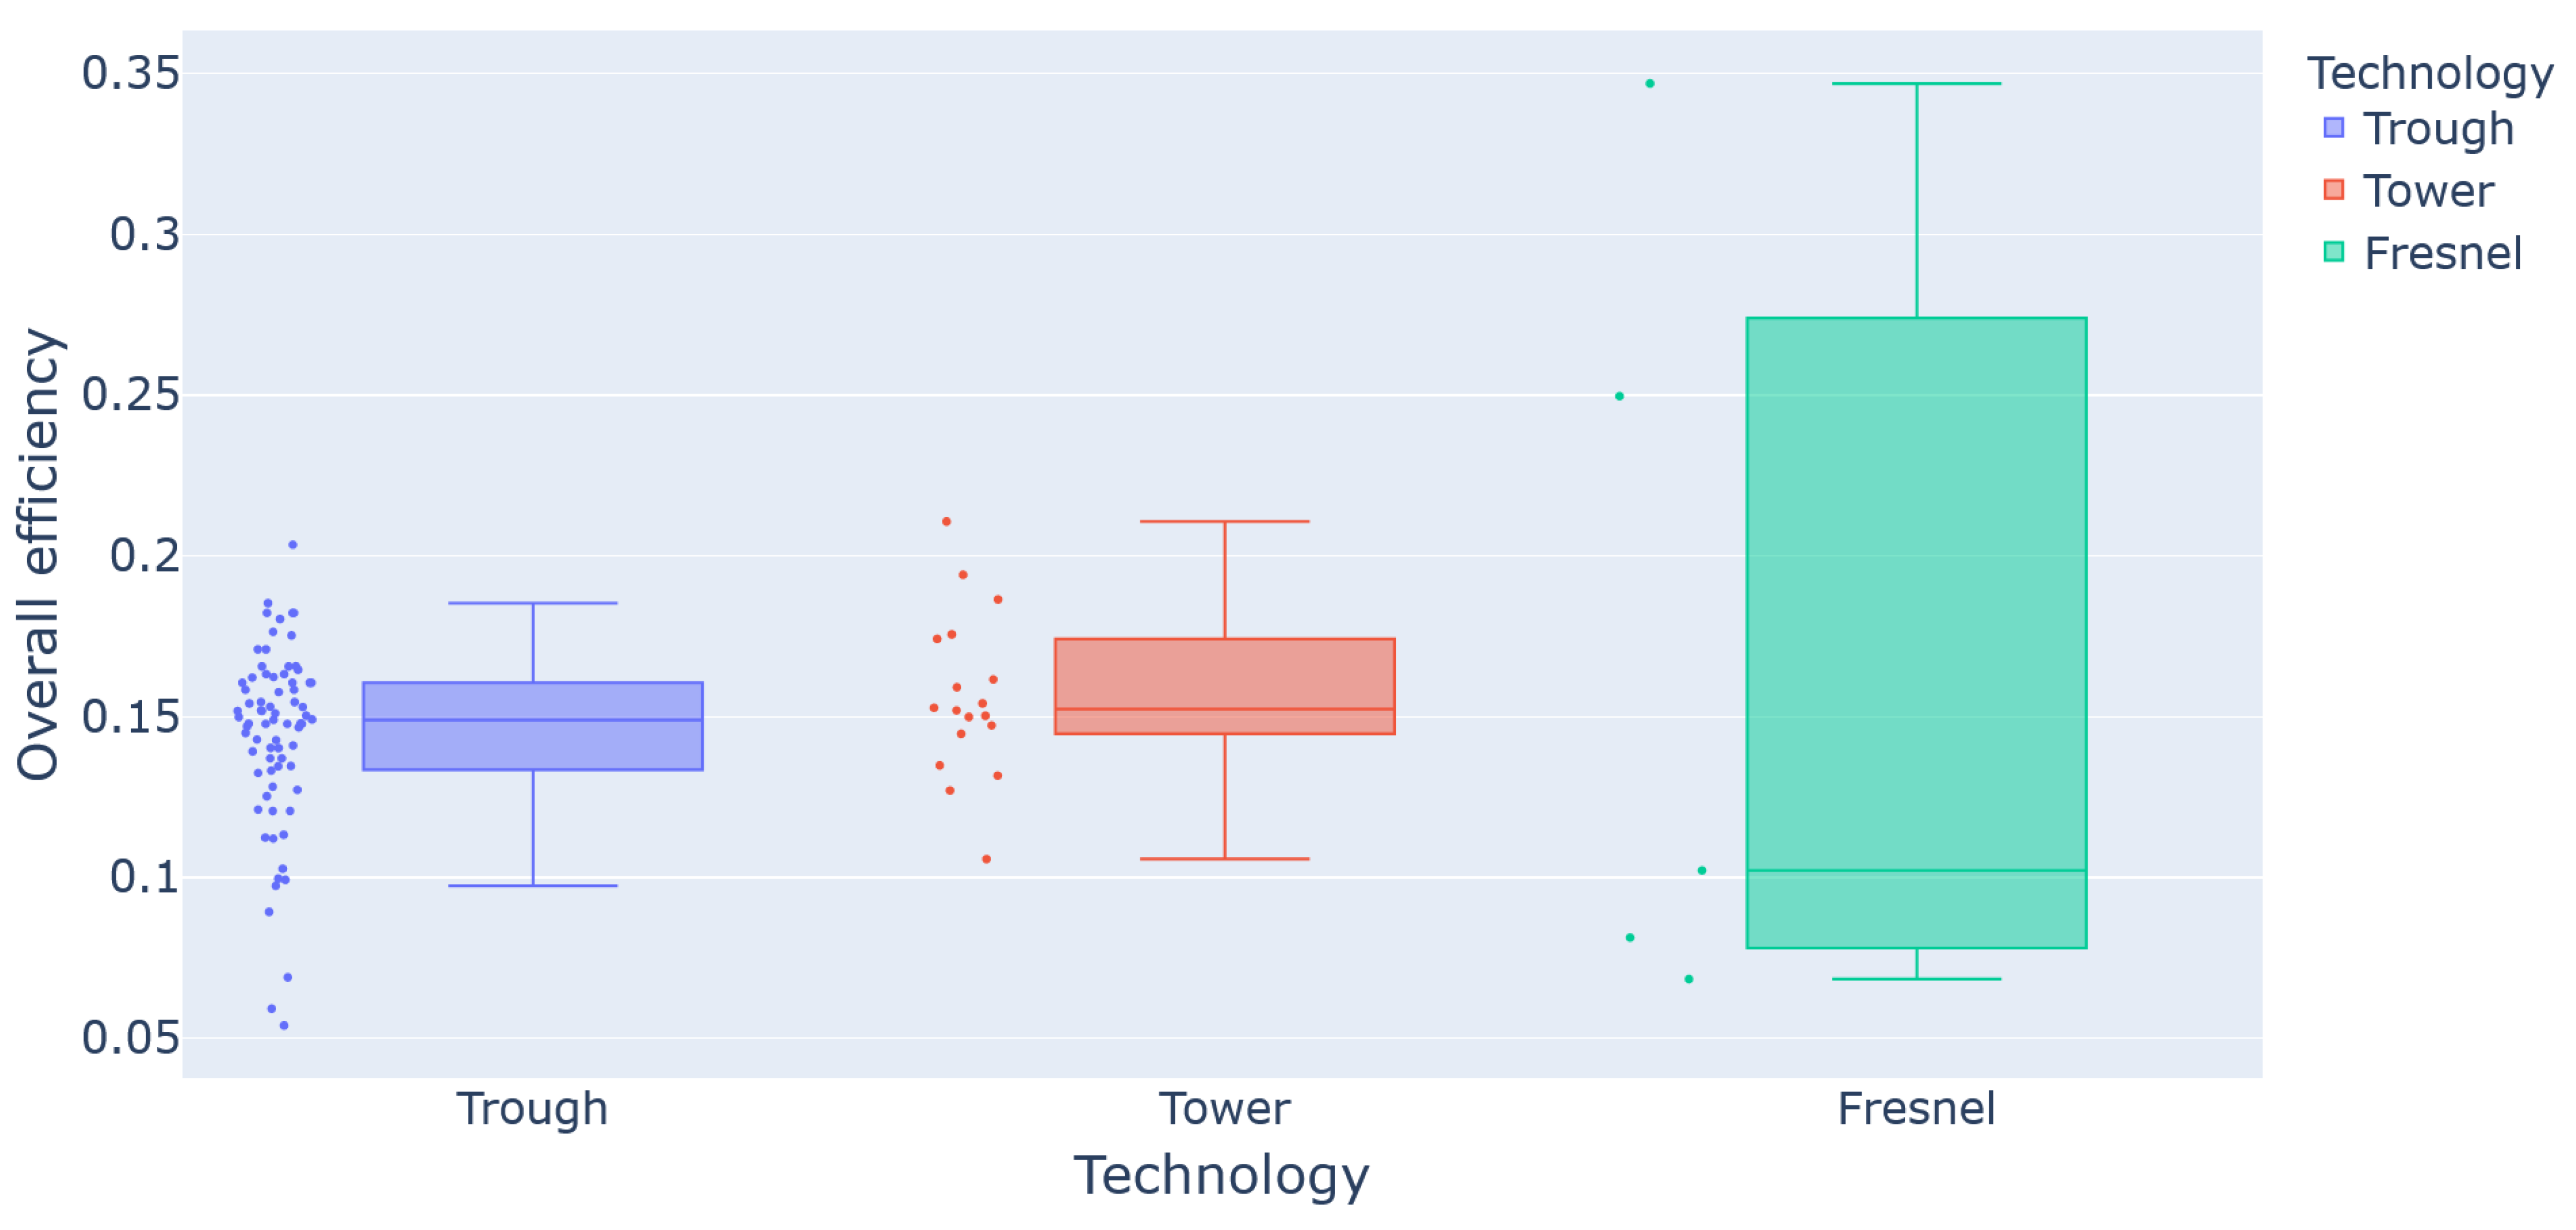
2.8. Overall Efficiency
3. Conclusions, Discussion and Perspectives
Supplementary Materials
Author Contributions
Funding
Data Availability Statement
Conflicts of Interest
References
- Jäger-Waldau, A. Snapshot of Photovoltaics—May 2023. EPJ Photovolt. 2023, 14, 23. [Google Scholar] [CrossRef]
- Miron, D. The Cost-Competitiveness of Concentrated Solar Power with Thermal Energy Storage in Power Systems with High Solar Penetration Levels. J. Energy Storage 2023, 72, 108464. [Google Scholar] [CrossRef]
- Giaconia, A.; Tizzoni, A.C.; Sau, S.; Corsaro, N.; Mansi, E.; Spadoni, A.; Delise, T. Assessment and Perspectives of Heat Transfer Fluids for CSP Applications. Energies 2021, 14, 7486. [Google Scholar] [CrossRef]
- Steinfeld, A.; Meier, A. Solar Fuels and Materials. In Encyclopedia of Energy; Elsevier: Amsterdam, The Netherlands, 2004. [Google Scholar]
- Islam, M.T.; Huda, N.; Abdullah, A.B.; Saidur, R. A Comprehensive Review of State-of-the-Art Concentrating Solar Power (CSP) Technologies: Current Status and Research Trends. Renew. Sustain. Energy Rev. 2018, 91, 987–1018. [Google Scholar] [CrossRef]
- Imran Khan, M.; Asfand, F.; Al-Ghamdi, S.G. Progress in Research and Technological Advancements of Commercial Concentrated Solar Thermal Power Plants. Sol. Energy 2023, 249, 183–226. [Google Scholar] [CrossRef]
- Hachicha, A.A.; Yousef, B.A.A.; Said, Z.; Rodríguez, I. A Review Study on the Modeling of High-Temperature Solar Thermal Collector Systems. Renew. Sustain. Energy Rev. 2019, 112, 280–298. [Google Scholar] [CrossRef]
- Alami, A.H.; Olabi, A.G.; Mdallal, A.; Rezk, A.; Radwan, A.; Rahman, S.M.A.; Shah, S.K.; Abdelkareem, M.A. Concentrating Solar Power (CSP) Technologies: Status and Analysis. Int. J. Thermofluids 2023, 18, 100340. [Google Scholar] [CrossRef]
- Flamant, G. Solar Power Plants: State of the Art. Concentrating Solar Thermal Energy: Fundamentals and Applications; Wiley: Hoboken, NJ, USA, 2022; p. 1. [Google Scholar]
- Pourasl, H.H.; Barenji, R.V.; Khojastehnezhad, V.M. Solar Energy Status in the World: A Comprehensive Review. Energy Rep. 2023, 10, 3474–3493. [Google Scholar] [CrossRef]
- Thonig, R.; Gilmanova, A.; Lilliestam, J. CSP.Guru 2023-07-01 (2023-07-01) [Data Set]. 2023. Zenodo. Available online: https://zenodo.org/records/8191855 (accessed on 22 February 2024).
- Lilliestam, J.; Ollier, L.; Labordena, M.; Pfenninger, S.; Thonig, R. The Near- to Mid-Term Outlook for Concentrating Solar Power: Mostly Cloudy, Chance of Sun. Energy Sources Part B Econ. Plan. Policy 2021, 16, 23–41. [Google Scholar] [CrossRef]
- Lilliestam, J.; Labordena, M.; Patt, A.; Pfenninger, S. Empirically Observed Learning Rates for Concentrating Solar Power and Their Responses to Regime Change. Nat. Energy 2017, 2, 17094. [Google Scholar] [CrossRef]
- Lilliestam, J.; Pitz-Paal, R. Concentrating Solar Power for Less than USD 0.07 per kWh: Finally the Breakthrough? Renew. Energy Focus 2018, 26, 17–21. [Google Scholar] [CrossRef]
- Bonilla, J.; Thonig, R.; Carballo, J.A.; Lilliestam, J.; Alarcón-Padilla, D.C.; Zarza, E. CSP Data: A Data Discovery Web Application of Commercial CSP Plants. 2023. Available online: https://javier.solar/assets/docs/conf_int/SolarPACES_CSP_Data.pdf (accessed on 22 February 2024).
- Staff Writer Dubai Inaugurates World’s Largest Concentrated Solar PV Project. Available online: https://www.Constructionweekonline.Com/News/Dubai-Worlds-Largest-Concentrated-Solar-Pv-Project (accessed on 18 January 2024).
- Maia, C.B.; Rodrigues Neumann, L.; de Andrade Oliveira, G.; Marques Alves, Í.; Walczak, M.M.; Paiva Brito, P. A Comprehensive Review of Solar Tower CSP Systems Using TES and Molten Salts. Int. J. Ambient Energy 2023, 44, 1733–1747. [Google Scholar] [CrossRef]
- Gamarra, A.R.; Banacloche, S.; Lechon, Y.; Del Río, P. Assessing the Sustainability Impacts of Concentrated Solar Power Deployment in Europe in the Context of Global Value Chains. Renew. Sustain. Energy Rev. 2023, 171, 113004. [Google Scholar] [CrossRef]
- Morin, G.; Dersch, J.; Platzer, W.; Eck, M.; Häberle, A. Comparison of Linear Fresnel and Parabolic Trough Collector Power Plants. Sol. Energy 2012, 86, 1–12. [Google Scholar] [CrossRef]
- Burgaleta, J.I.; Arias, S.; Ramirez, D. Gemasolar, the first tower thermosolar commercial plant with molten salt storage. In Proceedings of the SolarPACES, Granada, Spain, 20–23 September 2011; pp. 20–23. [Google Scholar]
- Schöniger, F.; Thonig, R.; Resch, G.; Lilliestam, J. Making the Sun Shine at Night: Comparing the Cost of Dispatchable Concentrating Solar Power and Photovoltaics with Storage. Energy Sources Part B Econ. Plan. Policy 2021, 16, 55–74. [Google Scholar] [CrossRef]
- Weinstein, L.A.; Loomis, J.; Bhatia, B.; Bierman, D.M.; Wang, E.N.; Chen, G. Concentrating Solar Power. Chem. Rev. 2015, 115, 12797–12838. [Google Scholar] [CrossRef]
- Merchán, R.P.; Santos, M.J.; Medina, A.; Calvo Hernández, A. High Temperature Central Tower Plants for Concentrated Solar Power: 2021 Overview. Renew. Sustain. Energy Rev. 2022, 155, 111828. [Google Scholar] [CrossRef]
- Shahabuddin, M.; Alim, M.A.; Alam, T.; Mofijur, M.; Ahmed, S.F.; Perkins, G. A Critical Review on the Development and Challenges of Concentrated Solar Power Technologies. Sustain. Energy Technol. Assess. 2021, 47, 101434. [Google Scholar] [CrossRef]
- Thonig, R.; Gilmanova, A.; Zhan, J.; Lilliestam, J. Chinese CSP for the World? In Proceedings of the AIP Conference Proceedings, Freiburg, Germany, 28 September–2 October 2020; p. 050007. [Google Scholar]
- He, Y.-L.; Qiu, Y.; Wang, K.; Yuan, F.; Wang, W.-Q.; Li, M.-J.; Guo, J.-Q. Perspective of Concentrating Solar Power. Energy 2020, 198, 117373. [Google Scholar] [CrossRef]
- 2023 Electricity ATB Technologies. Available online: https://atb.nrel.gov/electricity/2023/technologies (accessed on 6 March 2024).
- Bošnjaković, M.; Tadijanović, V. Environment Impact of a Concentrated Solar Power Plant. Teh. Glas. (Online) 2019, 13, 68–74. [Google Scholar] [CrossRef]
- Bourdon, D.; Wolfertstetter, F.; Fernández-García, A.; Sansom, C.; Azpitarte, I.; Bouaddi, S.; Perez, G.; Maccari, A.; Nijnatten, P.V.; Surquin, E.; et al. Saving Water on Concentrated Solar Power Plants: The Holistic Approach of the WASCOP Project. In Proceedings of the AIP Conference Proceedings, Daegu, Republic of Korea, 1–4 October 2019; p. 210002. [Google Scholar]
- Damerau, K.; Williges, K.; Patt, A.G.; Gauché, P. Costs of Reducing Water Use of Concentrating Solar Power to Sustainable Levels: Scenarios for North Africa. Energy Policy 2011, 39, 4391–4398. [Google Scholar] [CrossRef]
- Mehos, M.; Turchi, C.; Vidal, J.; Wagner, M.; Ma, Z.; Ho, C.; Kolb, W.; Andraka, C.; Kruizenga, A. Concentrating Solar Power Gen3 Demonstration Roadmap; No. NREL/TP-5500-67464; National Renewable Energy Lab.(NREL): Golden, CO, USA, 2017; p. 1338899.
- International Energy Agency. Technology Roadmap: Concentrating Solar Power; IEA Technology Roadmaps; OECD Publishing: Paris, France, 2010; ISBN 978-92-64-08813-9. [Google Scholar]
- Solar Energy: Mapping the Road Ahead, IEA. 2019. Available online: https://www.iea.org/reports/solar-energy-mapping-the-road-ahead (accessed on 22 February 2024).
- REN21. Renewables 2023 Global Status Report Collection, Renewables in Energy Supply; REN21 Secretariat: Paris, France, 2023. [Google Scholar]
- Del Río, P.; Peñasco, C.; Mir-Artigues, P. An Overview of Drivers and Barriers to Concentrated Solar Power in the European Union. Renew. Sustain. Energy Rev. 2018, 81, 1019–1029. [Google Scholar] [CrossRef]
- Xu, Y.; Pei, J.; Yuan, J.; Zhao, G. Concentrated Solar Power: Technology, Economy Analysis, and Policy Implications in China. Environ. Sci. Pollut. Res. 2022, 29, 1324–1337. [Google Scholar] [CrossRef] [PubMed]
- David, B.R.; Spencer, S.; Miller, J.; Almahmoud, S.; Jouhara, H. Comparative Environmental Life Cycle Assessment of Conventional Energy Storage System and Innovative Thermal Energy Storage System. Int. J. Thermofluids 2021, 12, 100116. [Google Scholar] [CrossRef]
- Lilliestam, J.; Du, F.; Gilmanova, A.; Mehos, M.; Wang, Z.; Thonig, R. Scaling up CSP: How Long Will It Take? In Proceedings of the AIP Conference Proceedings, South Tangerang, Indonesia, 27 September–1 October 2021; p. 050003. [Google Scholar]
- AEE INTEC. SHIP Plants Database. 2023. Available online: https://ship-plants.info (accessed on 22 February 2024).
- Brochure Solar Heat for Industry, Editors Bärbel Epp, Marisol Oropeza. Available online: https://www.solar-payback.com/download/solar-heat-for-industry-april-2017 (accessed on 22 February 2024).


Disclaimer/Publisher’s Note: The statements, opinions and data contained in all publications are solely those of the individual author(s) and contributor(s) and not of MDPI and/or the editor(s). MDPI and/or the editor(s) disclaim responsibility for any injury to people or property resulting from any ideas, methods, instructions or products referred to in the content. |
© 2024 by the authors. Licensee MDPI, Basel, Switzerland. This article is an open access article distributed under the terms and conditions of the Creative Commons Attribution (CC BY) license (https://creativecommons.org/licenses/by/4.0/).
Share and Cite
Rodat, S.; Thonig, R. Status of Concentrated Solar Power Plants Installed Worldwide: Past and Present Data. Clean Technol. 2024, 6, 365-378. https://doi.org/10.3390/cleantechnol6010018
Rodat S, Thonig R. Status of Concentrated Solar Power Plants Installed Worldwide: Past and Present Data. Clean Technologies. 2024; 6(1):365-378. https://doi.org/10.3390/cleantechnol6010018
Chicago/Turabian StyleRodat, Sylvain, and Richard Thonig. 2024. "Status of Concentrated Solar Power Plants Installed Worldwide: Past and Present Data" Clean Technologies 6, no. 1: 365-378. https://doi.org/10.3390/cleantechnol6010018
APA StyleRodat, S., & Thonig, R. (2024). Status of Concentrated Solar Power Plants Installed Worldwide: Past and Present Data. Clean Technologies, 6(1), 365-378. https://doi.org/10.3390/cleantechnol6010018