Article

Ammonium Removal in Wastewater Treatments by Adsorbent Geopolymer Material with Granite Wastes: Full-Scale Validation

AIMEN Technology Centre, 36410 O Porriño, Spain
*
Author to whom correspondence should be addressed.
Clean Technol. 2024, 6(1), 339-364; https://doi.org/10.3390/cleantechnol6010017
Submission received: 13 November 2023 / Revised: 29 December 2023 / Accepted: 28 February 2024 / Published: 7 March 2024
(This article belongs to the Collection Water and Wastewater Treatment Technologies)

Abstract

:
Elevated ammonium (NH4+) concentrations in untreated waterways contribute to eutrophication and dissolved oxygen depletion. Geopolymer (GP) materials are introduced as sustainable, straightforward operation and low-cost option for pollutant adsorption through ion exchange mechanism. In the present study, a porous metakaolin-based geopolymer with granite waste additions was synthetized, characterised and validated as adsorbent material for NH4+ pollution in water. At this point, treatments to reduce GP alkalis leaching were also considered to comply with the water discharge regulations. The adsorption mechanism was analysed by Redlich-Peterson isotherm model concluding that NH4+ was disposed on the GP surface as a monolayer with strong physical-chemical attraction between molecules. Kinetics of the process followed the Weber-Morris rate equation being the intraparticle diffusion the limiting process. Continuous experiments at lab-scale suggested a maximum removal of 97% during the first hours and an adsorption capacity (q) of 25.24 mg/g. Additionally, as a main novelty of the work, the GP was validated in a full-scale pilot plant monitoring pH, electrical conductivity and NH4+ concentration. The obtained data revealed that the GP is high selective in a real wastewater stream and removed 81% of NH4+, higher adsorption values than those reported for natural and some synthetic zeolites.

1. Introduction

Geopolymer (GP) is one of the most viable candidates for sustainable replacement of traditional Ordinary Portland Cement, OPC (>50% less CO2 emissions than a produced ton of OPC [1]). This binder can be synthesized from the chemical reaction between a low-calcium aluminosilicate precursor and an alkaline activating solution (mainly Na or K silicates). The result is an inorganic polymer with improved mechanical and physical properties with great potential to replace OPC, especially in the building sector.
Additionally, GP can also be applied in environmental applications. Some of the most innovative uses in this field include solar energy storage [2,3], radioactive waste management [4,5], and water or wastewater treatments. In this latter application, a larger number of investigations have been carried out, including the use of GP materials as adsorbents [6,7], as membrane materials [8], as photocatalysts [9], as buffer materials [10], or as functional materials [11], among others. In most of these applications, the promising results are a consequence of its zeolite-like structure which provides excellent adsorbent properties and a high cation exchange capacity through the porous GP matrix.
This cation exchange ability is a consequence of the GP framework consisting of a three-dimensional network called sialate and composed by tetrahedral AlO4 and SiO4 alternatively bonded by O atoms. The presence of cations such as Na+ and/or K+ coming from the activating solution balances the negative charge of the AlO4 groups which can be completely hydrated and mobilized [12,13,14]. This provides a lower bonding strength in comparison with zeolites and an ease for ions to be exchanged when they are in contact with solutions of a desired cation. The previous studies confirmed that GP structure is not modified when the exchangeable ion is replaced with another atom.
The porous structure of GPs provides available binding sites, increases permeability, mass transfer and, in consequence, the adsorption capacity, as reported in literature [14]. In this sense, GPs can be tailored to increase or modify the porous network and thus, the physical adsorption capacity to assimilate pollutants on their surface due to physical forces such as Van der Waals, hydrogen bonding, hydrophobic interactions, polarity and space forces. Increases in the porosity and surface area promote an increment of the active sites for cationic exchange [13,14].
The most common route to produce porous GPs is the direct foaming by the incorporation of a chemical agent in the admixture [15,16,17,18]. This process generates gas bubbles due to the reaction with the alkaline species which are trapped inside the binder matrix during setting resulting in the formation of air voids in the hardened body. The most widely used chemical foamier is the hydrogen peroxide (H2O2). H2O2 decomposes in alkaline medium at a very slow rate to form water and oxygen gas promoting voids formation while geopolymer is consolidating, according to reactions (a) and (b).
(a)
H2O2 + OH →HO2 + H2O
(b)
H2O2 + HO2 → O2 + OH + H2O
Ammonium (NH4+) is the most dominant form of nitrogen pollution in the aquatic environment. Elevated NH4+ concentrations in untreated waterways contribute to eutrophication and dissolved oxygen depletion, which causes severe degradation of water quality. Untreated wastewater containing high nitrogen contents poses serious environmental problems if those pollutants are improperly managed. High NH4+ loading has been observed to cause stress on invertebrates, fish, macrophytes and algae [19,20,21].
The methods commonly used for NH4+ removal include adsorption, air stripping, reverse osmosis, chemical precipitation and biological treatments [22,23]. The most reported approaches are based on biological treatments and air stripping technology [22,23,24]. The first one consists of microbial nitrification-denitrification reactions, being temperature dependent [25] and expensive [23,24]. Moreover, this methodology converts all the treated NH4+ into N2 which is incompatible with EU transition to neutral emissions targets. The second approach consumes chemical reagents to maintain the desired pH and is high energy demanding [23]. Minor technologies such as chemical precipitation or reverse osmosis present other disadvantages. The former originates new contaminants and requires special leaching conditions, while the latter shows regular membrane maintenance [22,23].
In this scenario, ion exchange/adsorption technology provided by porous materials emerges to address those drawbacks through strong NH4+ affinity, high removal efficiency, low-cost and simple application, becoming in a competitive methodology to scale-up for industrial operation.
Zeolites or clays, ion exchange resins, biochar, activated carbon and MOFs (Metal Organic Framework) are common examples of adsorbent materials for wastewater treatments. Ion exchanger adsorbents as zeolites present higher efficiency and selectivity [26,27], however, require elevated processing temperatures (50 °C–150 °C). On the other hand, MOFs [28] and activated carbon [29] have a superior performance but with a higher price, especially in case of MOFs, which are currently limited to laboratory scale applications.
The zeolite-like structure of GPs provides them an enhanced ionic removal ability by cation exchange as previously mentioned adsorbents do, but involving simpler manufacturing procedures, lower costs and a reduced environmental impact. These features make GPs as a promising alternative for sustainable adsorption applications in wastewater treatments. One of the critical issues of GPs to be considered is the pH increase (>12) [10,30] produced in aqueous media due to alkali leaching. This phenomenon is caused by unreacted or weakly bound M-OH (M = Na,K) on the GP sialate structure [30,31]. Initial alkali leaching supposes a bottleneck to implement the material in industrial wastewater treatments since legislation pH limits (pH between 5.5 and 9) represent a fundamental requirement for waste-derived streams.
In spite of this, the utilization of porous GP as adsorbent has been already reported in the literature mainly for the remedy of heavy metals [32,33,34,35,36,37] and dyes [38,39,40,41]; however, references regarding NH4+ removal are scarcer [42]. Sanguanpak et al. [43] and Lukkonen et al. [44] published recently detailed research regarding the effectiveness of pure metakaolin-based GPs in pretreated wastewater, obtaining adsorption efficiency up to 85% for NH4+. Nevertheless, the data published by these authors is limited to laboratory scale testing by controlled experiments.
In this work, porous GP was synthetized from the alkaline activation of metakaolin (MK). Granite waste (GW) was incorporated into the admixture as filler to increase the sustainability of the final product. The material was characterized at lab-scale and the suitability of different treatments to reduce alkali leaching was tested. Different adsorption isotherm models and kinetic equations were evaluated to better understand the adsorption mechanism. Finally, the selected GP formulation was scaled-up in a real industrial wastewater treatment. 125 L of adsorbent GP was deposited in the pilot-plant to assess the adsorption ability under the effect of the real-time leachate composition changes, pH, temperature and the interference of competing ions.

2. Materials and Methods

2.1. Materials

GPs were manufactured combining commercial MK as main raw material, GW additions from the granite industry and sodium silicate (Na2SiO3) as alkaline activating solution. MK was provided by Arciresa S.A. (54% SiO2, 41.1% Al2O3 and D50 = 8 µm) and GW (66.73% SiO2, 17.51% Al2O3 and D50 = 8 µm) was supplied by Godoy Maceira S.L. The aim is to maximize the amount of filler in the final formulation reducing the environmental impact and the cost per volume of the material. Commercial Na2SiO3 solution from Quimipur, containing 25.6% SiO2, 7.9% Na2O, and 66.5% H2O, and sodium hydroxide pellets (NaOH, 99% purity) from Scharlau were mixed to produce the activating solutions. The alkaline solutions were prepared 24 h before using with different silicate modulus (SiO2/Na2O, Ms). H2O2 was added to the admixture as a foaming agent. A systematic study was performed to optimize the binder. Some parameters were fixed after preliminary tests (not shown in this paper). Table 1 summarizes these parameters and the variables analyzed in this work (foaming agent content and GW additions).

2.2. Samples Preparation

The mixing process was carried out in a concrete laboratory mixer, adding firstly the solids (MK + GW) and mixing for 5 min. The alkaline solution was then added and stirred for 15 min to achieve the complete dissolution of the species. Finally, H2O2 was added (wt%) to foam the GP. The admixtures were molded to obtain prismatic samples with standard dimensions (4 × 4 × 16 cm3) for testing. The specimens were cured under room temperature and moisture saturation conditions for 28 days.

2.3. Geopolymer Characterization

Selection of the optimal GP formulation for adsorption was based on the analysis of chemical tests (FTIR, SEM-EDX and DRX), mechanical strength (flexural and compressive tests), physical properties (bulk and true density, pore size distribution and total porosity) and behavior in aqueous media (chemical integrity, leaching, pH).

2.3.1. Chemical and Microstructural Testing

Fourier transform infrared spectroscopy (FTIR) studies were performed on GP powder by using a Nicolet™ iS™ 50 FTIR from ThermoFisher (Waltham, MA, USA). The spectra were collected in transmittance mode with a resolution index of 4 and 24 numbers of scan.
A qualitative morphological evaluation of the raw materials and final GP samples was performed via scanning electron microscopy (SEM) in order to assess the microstructural homogeneity. EDX patterns were obtained on Oxford Xmax50 EDS at 15 kV accelerating voltage and X-ray count of 5200 cps.
The mineralogical analysis was conducted by X-Ray diffraction (XRD) on powdered samples with a Siemens D5000 Diffractometer equipped with a Cu cathode ray tube through an evaluation in a 2ϴ range from 3° to 85°, at a scanning speed of 5°/min and a step of 0.020°.

2.3.2. Mechanical Testing

The compressive and flexural strength of prismatic samples were measured by using a universal testing machine (Zwick Roell, Ulm, Germany Series Z050) with a load speed of 0.5 mm/min. A minimum of 3 samples for each batch was tested after 28 days-age following the standard UNE-196-1 [45] for OPC.

2.3.3. Physical Testing

The true density was measured by using a pycnometer (Micromeritics AccuPyc 1330, Norcross, GA, USA), operating on finely crushed samples. Geometric (apparent) density was evaluated by considering the mass to volume ratio of samples and bulk density was measured through the Archimedes method. The three density values were used to compute the amounts of open and closed porosity, according to UNE-EN 12390-7 [46]. Pore size distribution data were obtained with a Micromeritics AutoPore IV 9500 Series mercury porosimeter.

2.3.4. Behavior in Aqueous Media

In order to assess the chemical resistance of the GP and their stability in aqueous environment, integrity test was performed. A sample of 5 g was immersed in 250 mL of distilled water at room temperature for 24 h. The compactness of the GP confirmed the occurring of efficient consolidation reaction after 28 days of aging [47].
The determination of leached ions was carried out using Methrom Compact IC plus ion chromatograph. Granules with 3–4 mm sizes were immersed in distilled water (10 g/L). Ion identification, pH and electrical conductivity were monitored at different contact times for 24 h.
A more thorough pH monitoring was performed in an aqueous GP solution (120 g/L) for 60 days. At this point, chemical GP treatments with water, 1 M HCl or 0.1 N glacial acetic were considered to reduce the leachate pH.

2.4. Adsorption Testing

The selected formulation was crushed and sieved up to 4 to 12 mm size for batch and continuous laboratory tests to assess the most favorable adsorption conditions.
In one hand, batch experiments were carried out in 250 mL erlenmeyer flasks using deionized water at 22 °C under 125 rpm on Orbital Shaker (IKA KS 4000 IC Control) with the following fixed conditions: contact time of 24 h, pH = 6, [NH4+] = 65 mg/L and 5 g/L of GP. The effect of the initial pH, adsorbent dose, contact time and initial adsorbate concentration were evaluated.
The data obtained in the batch tests were used to fit different equations to obtain the most representative isotherm and the kinetics models.
In isotherm models, the pollutant concentration at the equilibrium (c) is plotted vs. the mass adsorbed per mass of adsorbent (q). Most of parameters, summarized in Table 2, are common among the different equation models.
Five types of isotherm models were evaluated by RSME (error measure) and by R2 (goodness) using the iteration method:
(1)
Langmuir [48]:
q = q m × b × c 1 + b × c
(2)
Freundlich [49]:
q = K × c n
(3)
Langmuir-Freundlich [50]:
q = q m × b × c n 1 + b × c n
(4)
Redlich-Peterson [51]:
q = q m × b × c 1 + b × c n
(5)
Tóth [52]:
q = q m × b × c 1 + b × c n 1 n
In case of the kinetic studies, the common parameters are the following: qe (mg/g), mass adsorbed per mass of adsorbent at equilibrium; qt (mg/g), mass adsorbed per mass of adsorbent for a given time t. Four types of kinetic equations were evaluated:
  • Pseudo first-order [53]:
    L n q e q t = L n q e k 1 × t
    • k1 (1/min) = constant of the pseudo-first order equation.
  • Pseudo second order [54]:
    t q t = t k p 2 × q e 2 + t   q e
    • Kp2 (g/(mg × min)) = constant of the pseudo-second order equation.
  • Elovich [55]:
    q t = ln α × ß ß   + l n t   ß  
    • α (mg/(mg × min)) = constant associated with the rate of adsorption on the uncoated surface.
    • ß (g/mg) = constant related to the extension of the surface.
  • Weber-Morris [56]:
    q t = k i × t 0.5 + C
    • ki (mg/(mg × min )) = intraparticle diffusion rate constant
    • C = value of the equation for t = 0
Additionally, column tests with 89.33 g of GP granules were carried out under a continuous flow of 6 mL/min, [NH4+] = 250 mg/L and pH = 6 for 160 h to determine the NH4+ adsorption capacity of the produced GP.

2.5. Scale-Up in a Wastewater Pilot Plant

As final validation, the selected GP formulation was scaled-up in a pilot plant for wastewater treatment located at Xiloga S.L. landfill site (As Somozas, Galicia, Spain). The plant consists of 3 key locations:
(a)
Tank containing the raw leachate. The composition of the leachate was monitored for 9 months.
(b)
Two stripping columns convert part of the NH4+ to NH3 with the addition of NaOH. The gas phase is transferred to a trickling filter where is purified by the action of bacteria. At the overflow, the fluid is conveyed by gravity to a pump.
(c)
The leachate is pumped by vertical flow to the wetland containing 125 L of adsorbent GP granules.
Data collected from [NH4+], pH and electrical conductivity allowed to validate the GP under real operating conditions.

3. Results

3.1. Geopolymer Characterization

GP samples were prepared following the procedure described in the experimental section. The following amount of binder was used for the preparation of 4 prismatic samples (4 × 4 × 16 cm3): 517.5 g MK, 899.3 g Na2SiO3 and 107 g 10 M NaOH. Different GW additions were considered in the study as shown in Table 3. The GP were named as G (without H2O2 addition) and P (with 1% H2O2 addition).

3.1.1. Chemical and Microstructural Testing

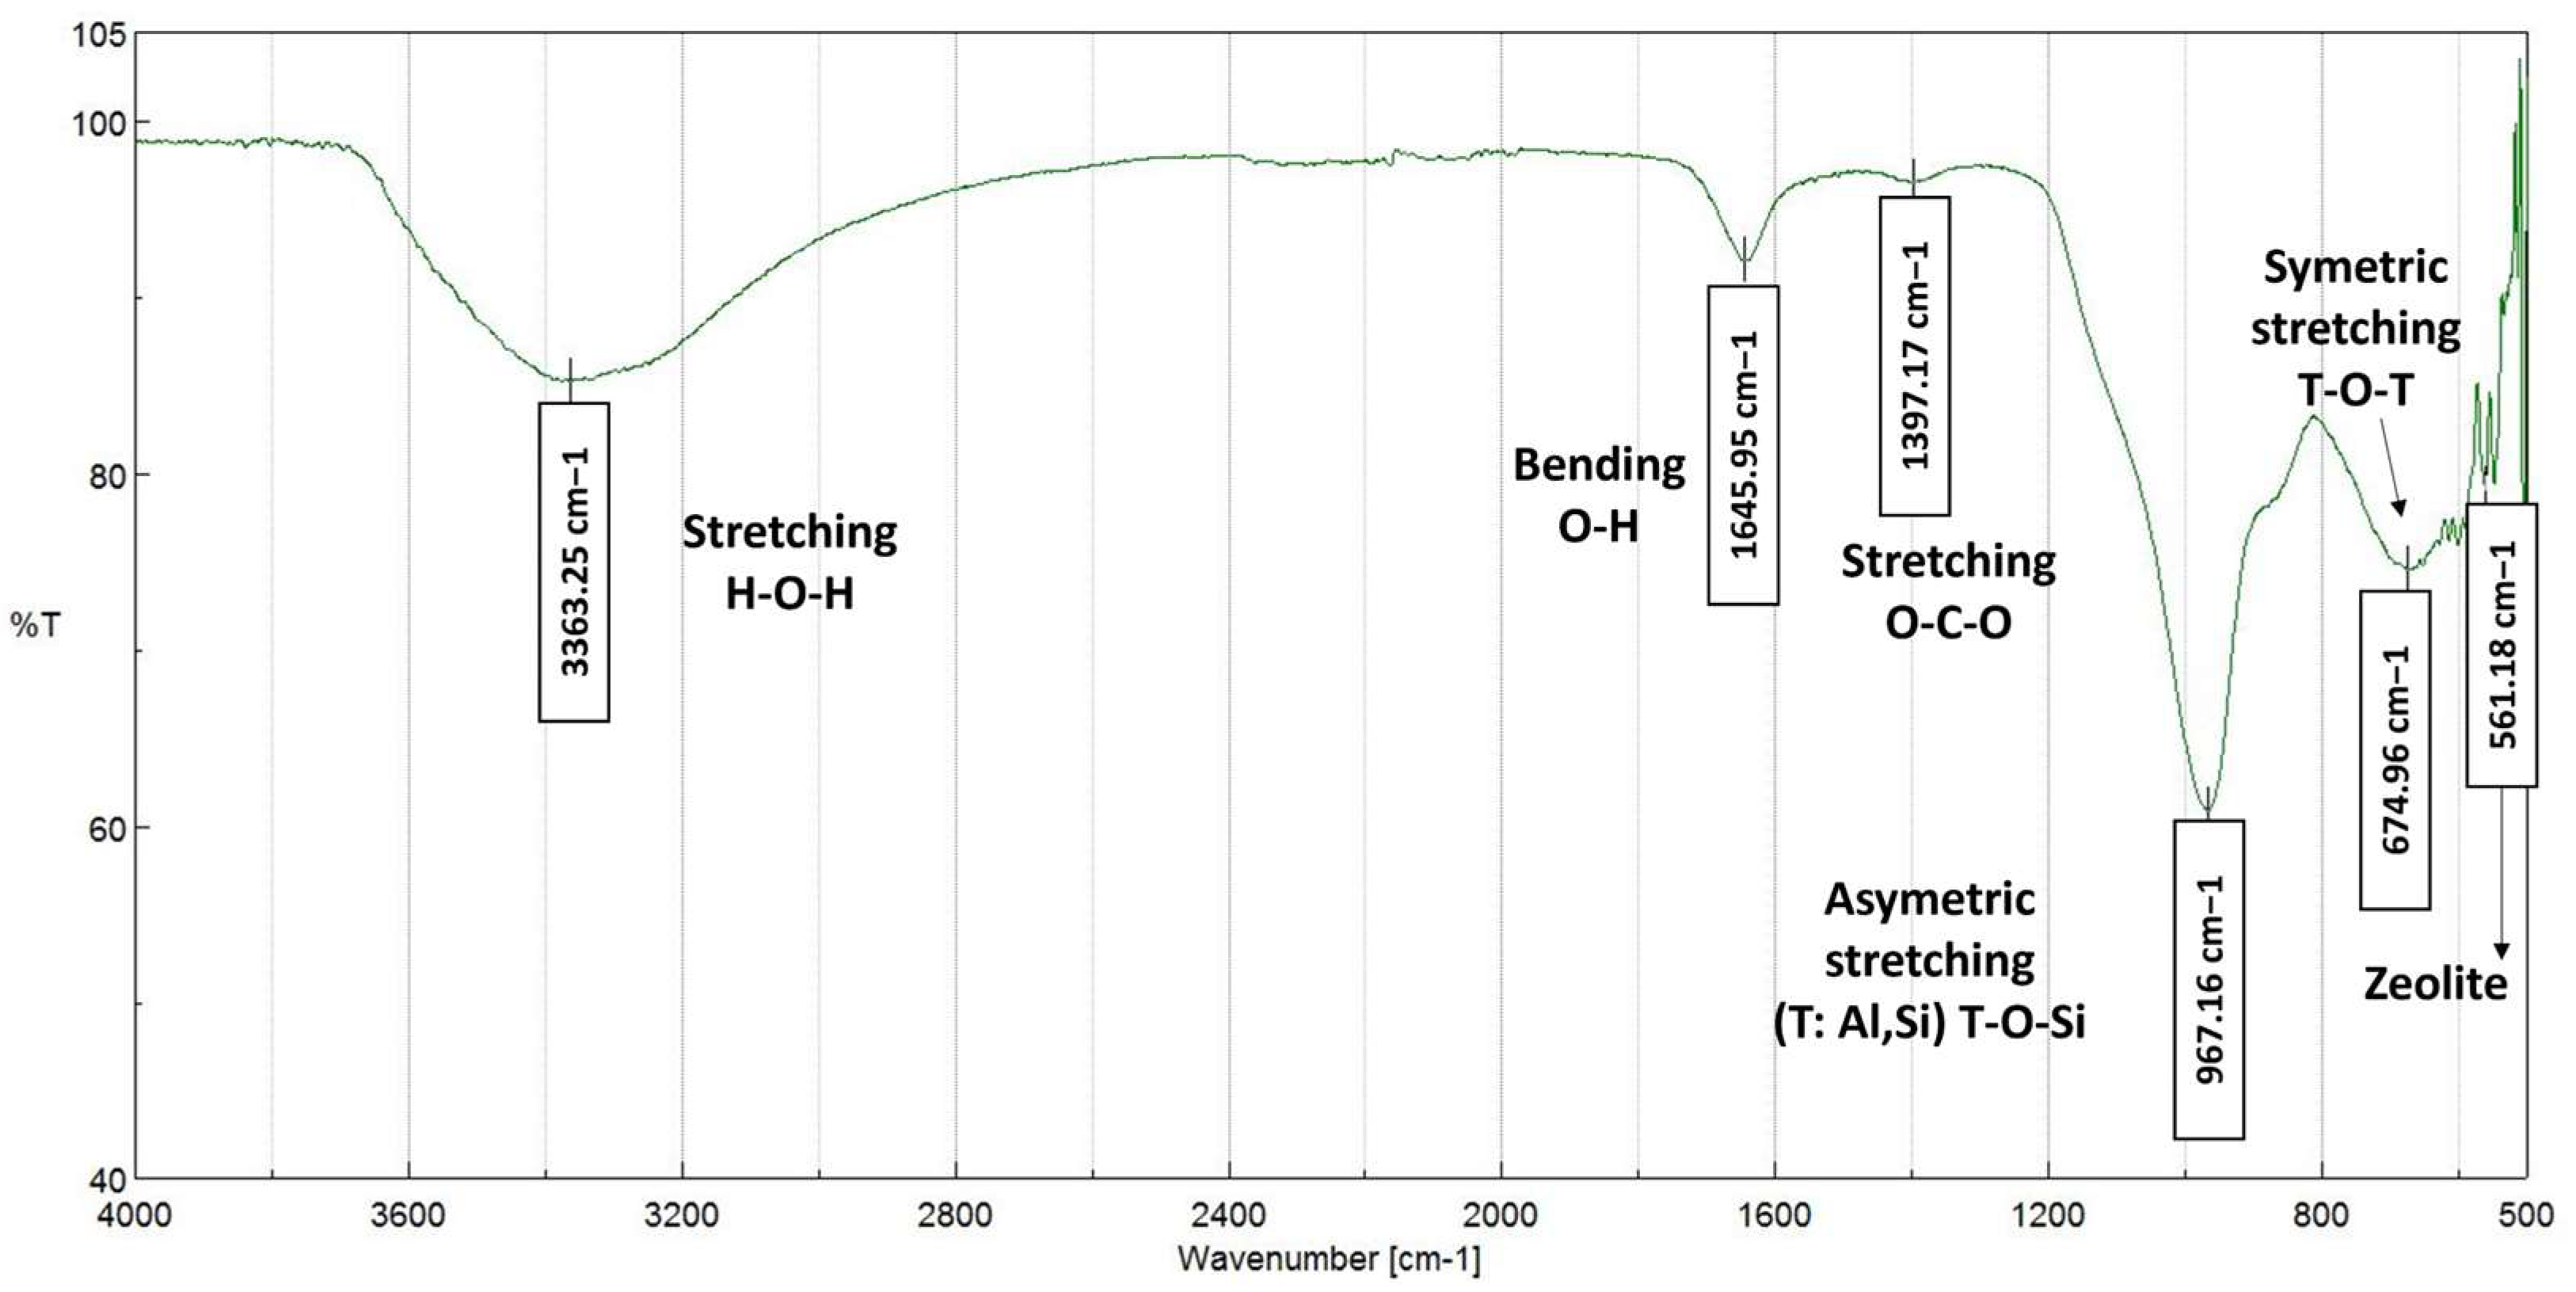
Figure 1 shows FTIR spectra of geopolymer G-0, used as reference. The test was performed to assure the proper alkaline activation of the MK.
According to the literature, the band identified at 3363 cm−1 was assigned to stretching vibration of O-H groups, and that 1645 cm−1, were attributed to O-H bending, the water molecules presented in the chemical structure of the geopolymer [57]. The presence of weak carbonate traces at 1397.17 cm−1 was identified by the C-O bond stretching. [58]. Unreacted Na+ ions from the alkaline activator react with atmospheric CO2 to produce NaCO3 in a process known as carbonation. The spectra showed as well a strong band at 967 cm−1 associated with T–O–Si (T:Al or Si) asymmetric stretching vibrations typical of geopolymer reaction [57,59,60]. The feature at 674 cm−1 were characteristic symmetric stretching vibrations of T-O-T bonds [57,60]. Additionally, the band positioned around 561 cm−1 was a characteristic feature attributed to the formation of double four-membered rings in zeolite structure demonstrating the formation of this aluminosilicate as other reaction products [56,61].
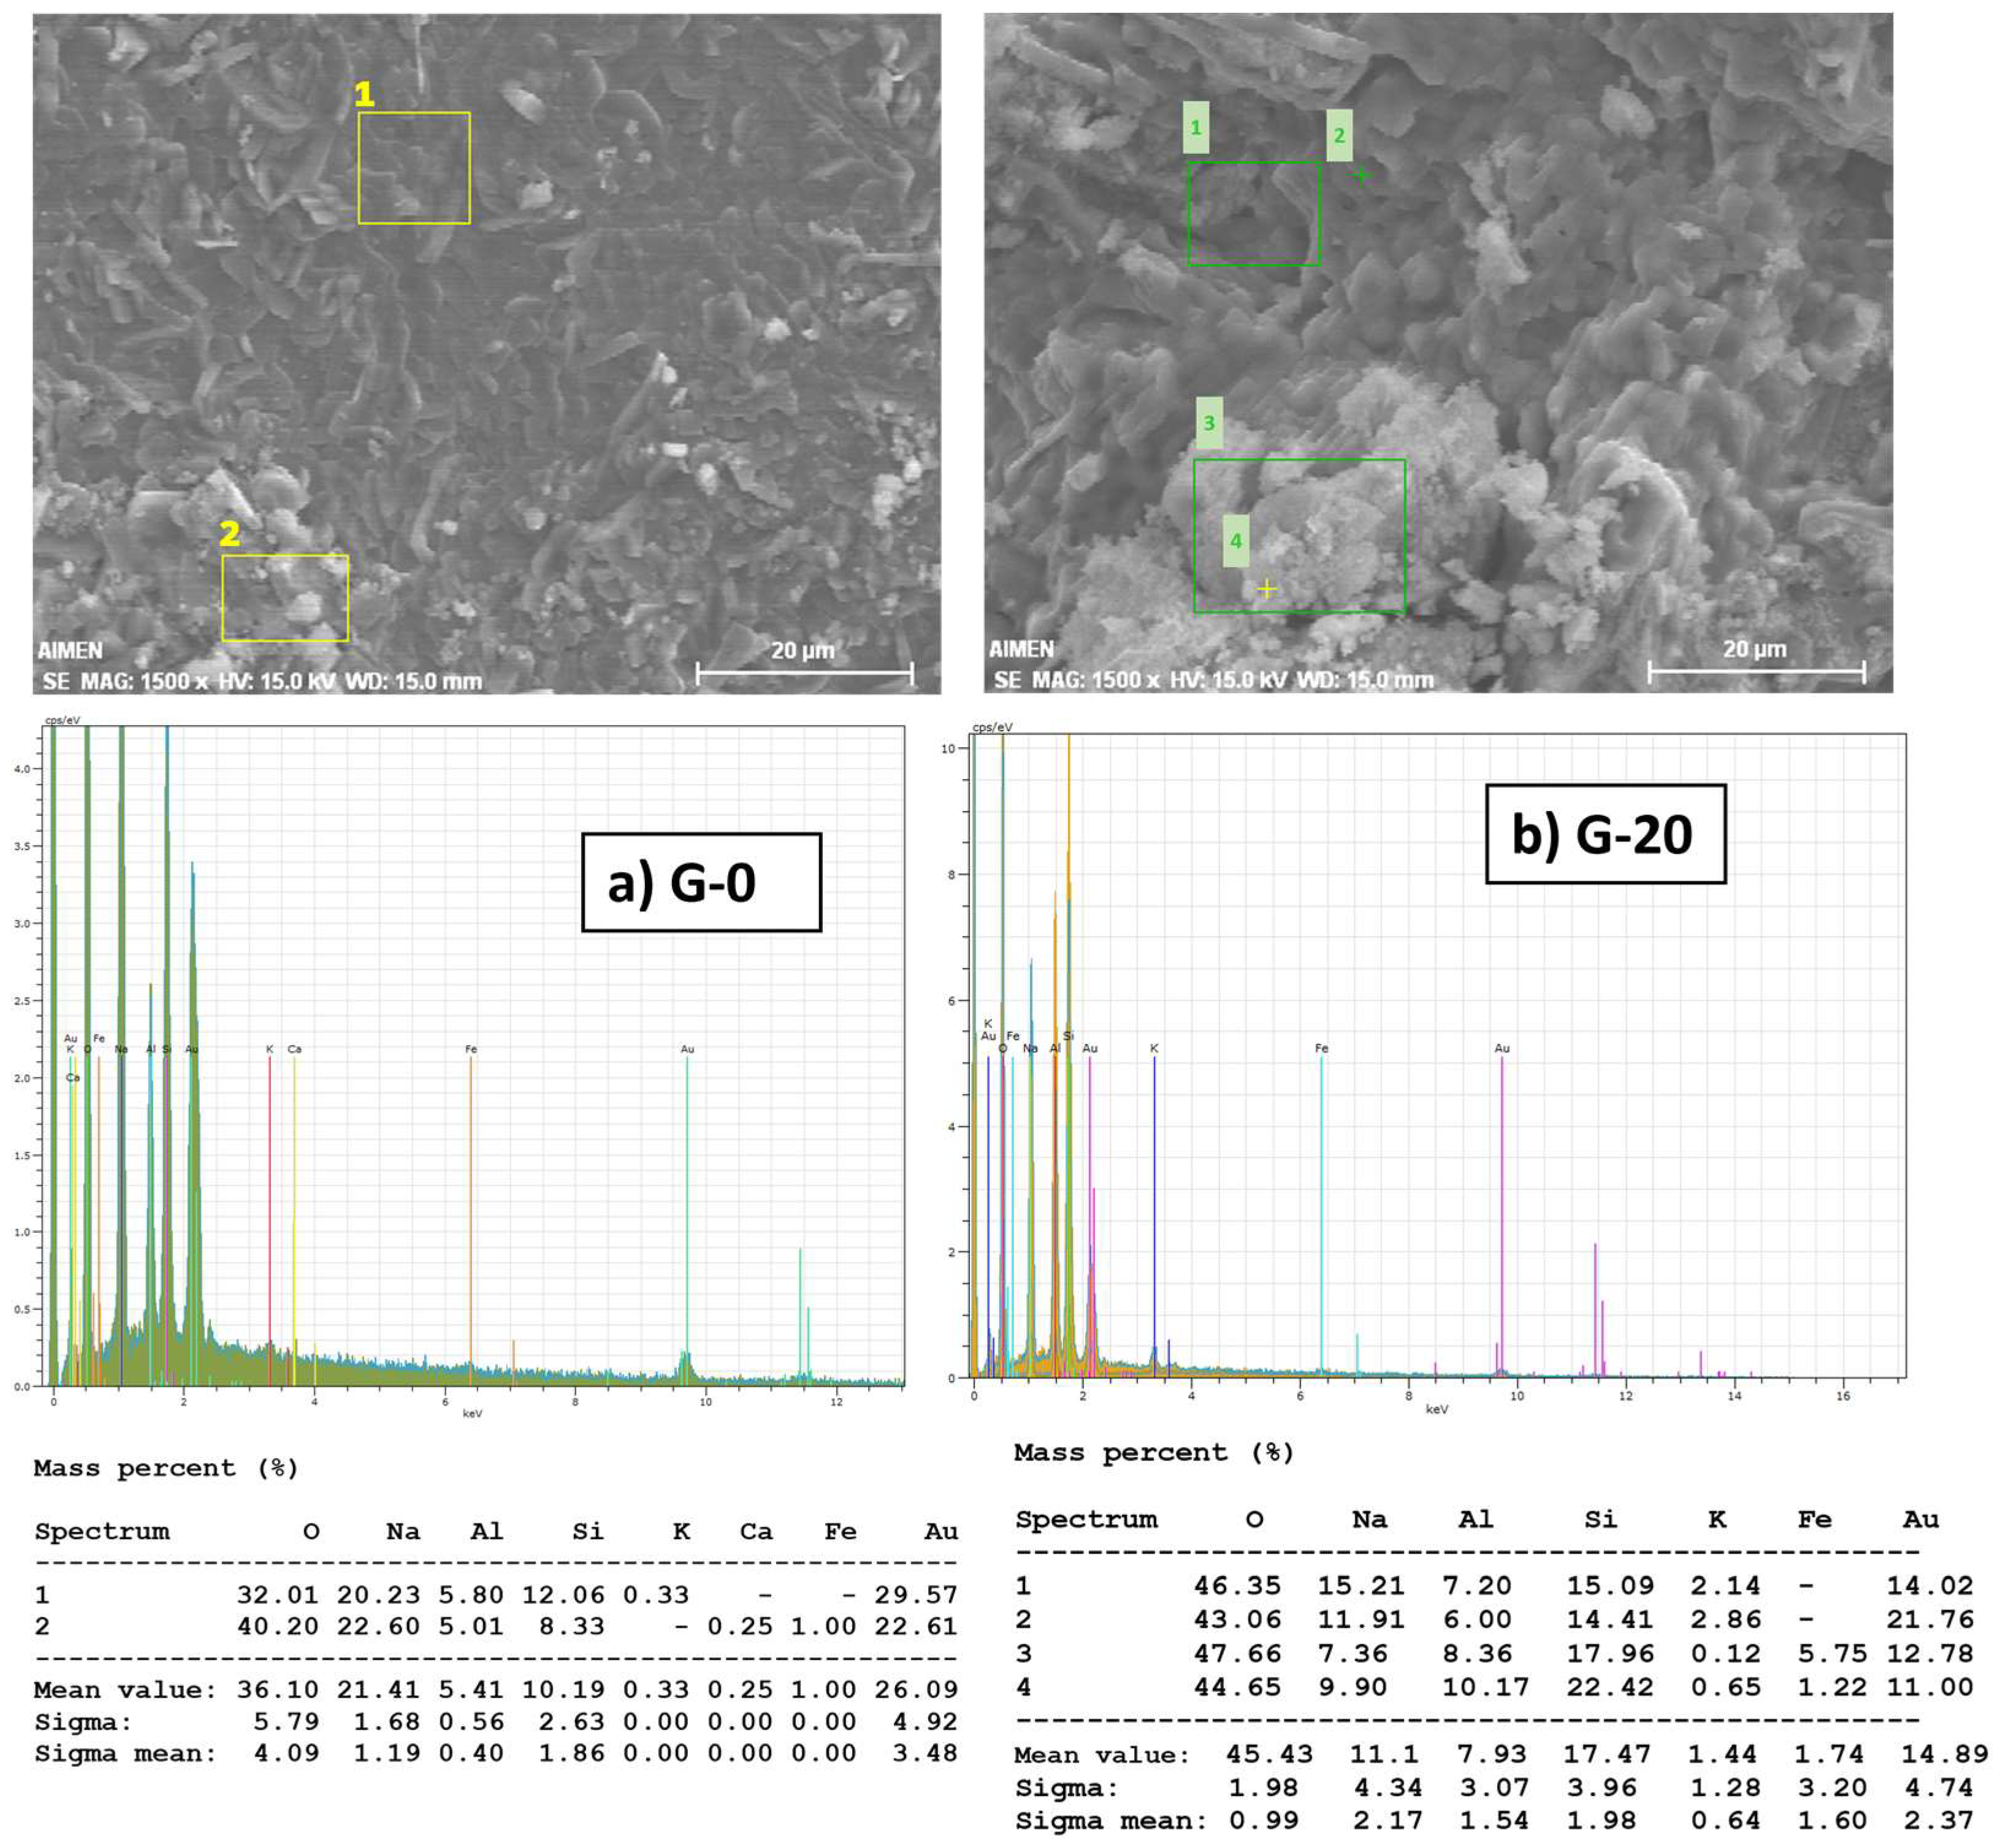
Figure 2 shows the SEM/EDX spectra for G-0 and G-20 formulations after 28 curing days. There are no significant changes in the microstructure and composition of the GP with the addition of GW. The actual composition of the geopolymer gel could not be measured but the silicon to aluminum molar ratio can be estimated to be in the range between 1 and 3, as expected from the formation of a geopolymer material [62]. The results obtained were Si/Al = 1.88 and Si/Al= 2.2 respectively for G-0 and G-20. The increment in G-20 is due to the presence of GW particles, quartz-enriched, that are not part of the gel.
The uniformity of the geopolymer matrix is clearer in G-0 whereas unreacted GW irregular and sharp angle particles appear accumulated in the amorphous for G-20 (points 1 and 2). These heterogeneities inside the microstructure reasonably are expected to cause a strength decrease for this material. EDX spectrum collected from these particle aggregations (point 3 and 4) confirmed the attribution to GW, according to the higher Si and Al content and the presence of Fe.
EDX also confirms the presence of Na in both materials coming from the alkaline activator, which is the main responsible for the ion exchange process. Na concentration is slightly reduced in G-20 possibly due to a slower reaction progress and a higher amount of unreacted NaOH, promoting the formation of NaCO3 (efflorescence) which is easily removed through the open pores of the material [58].
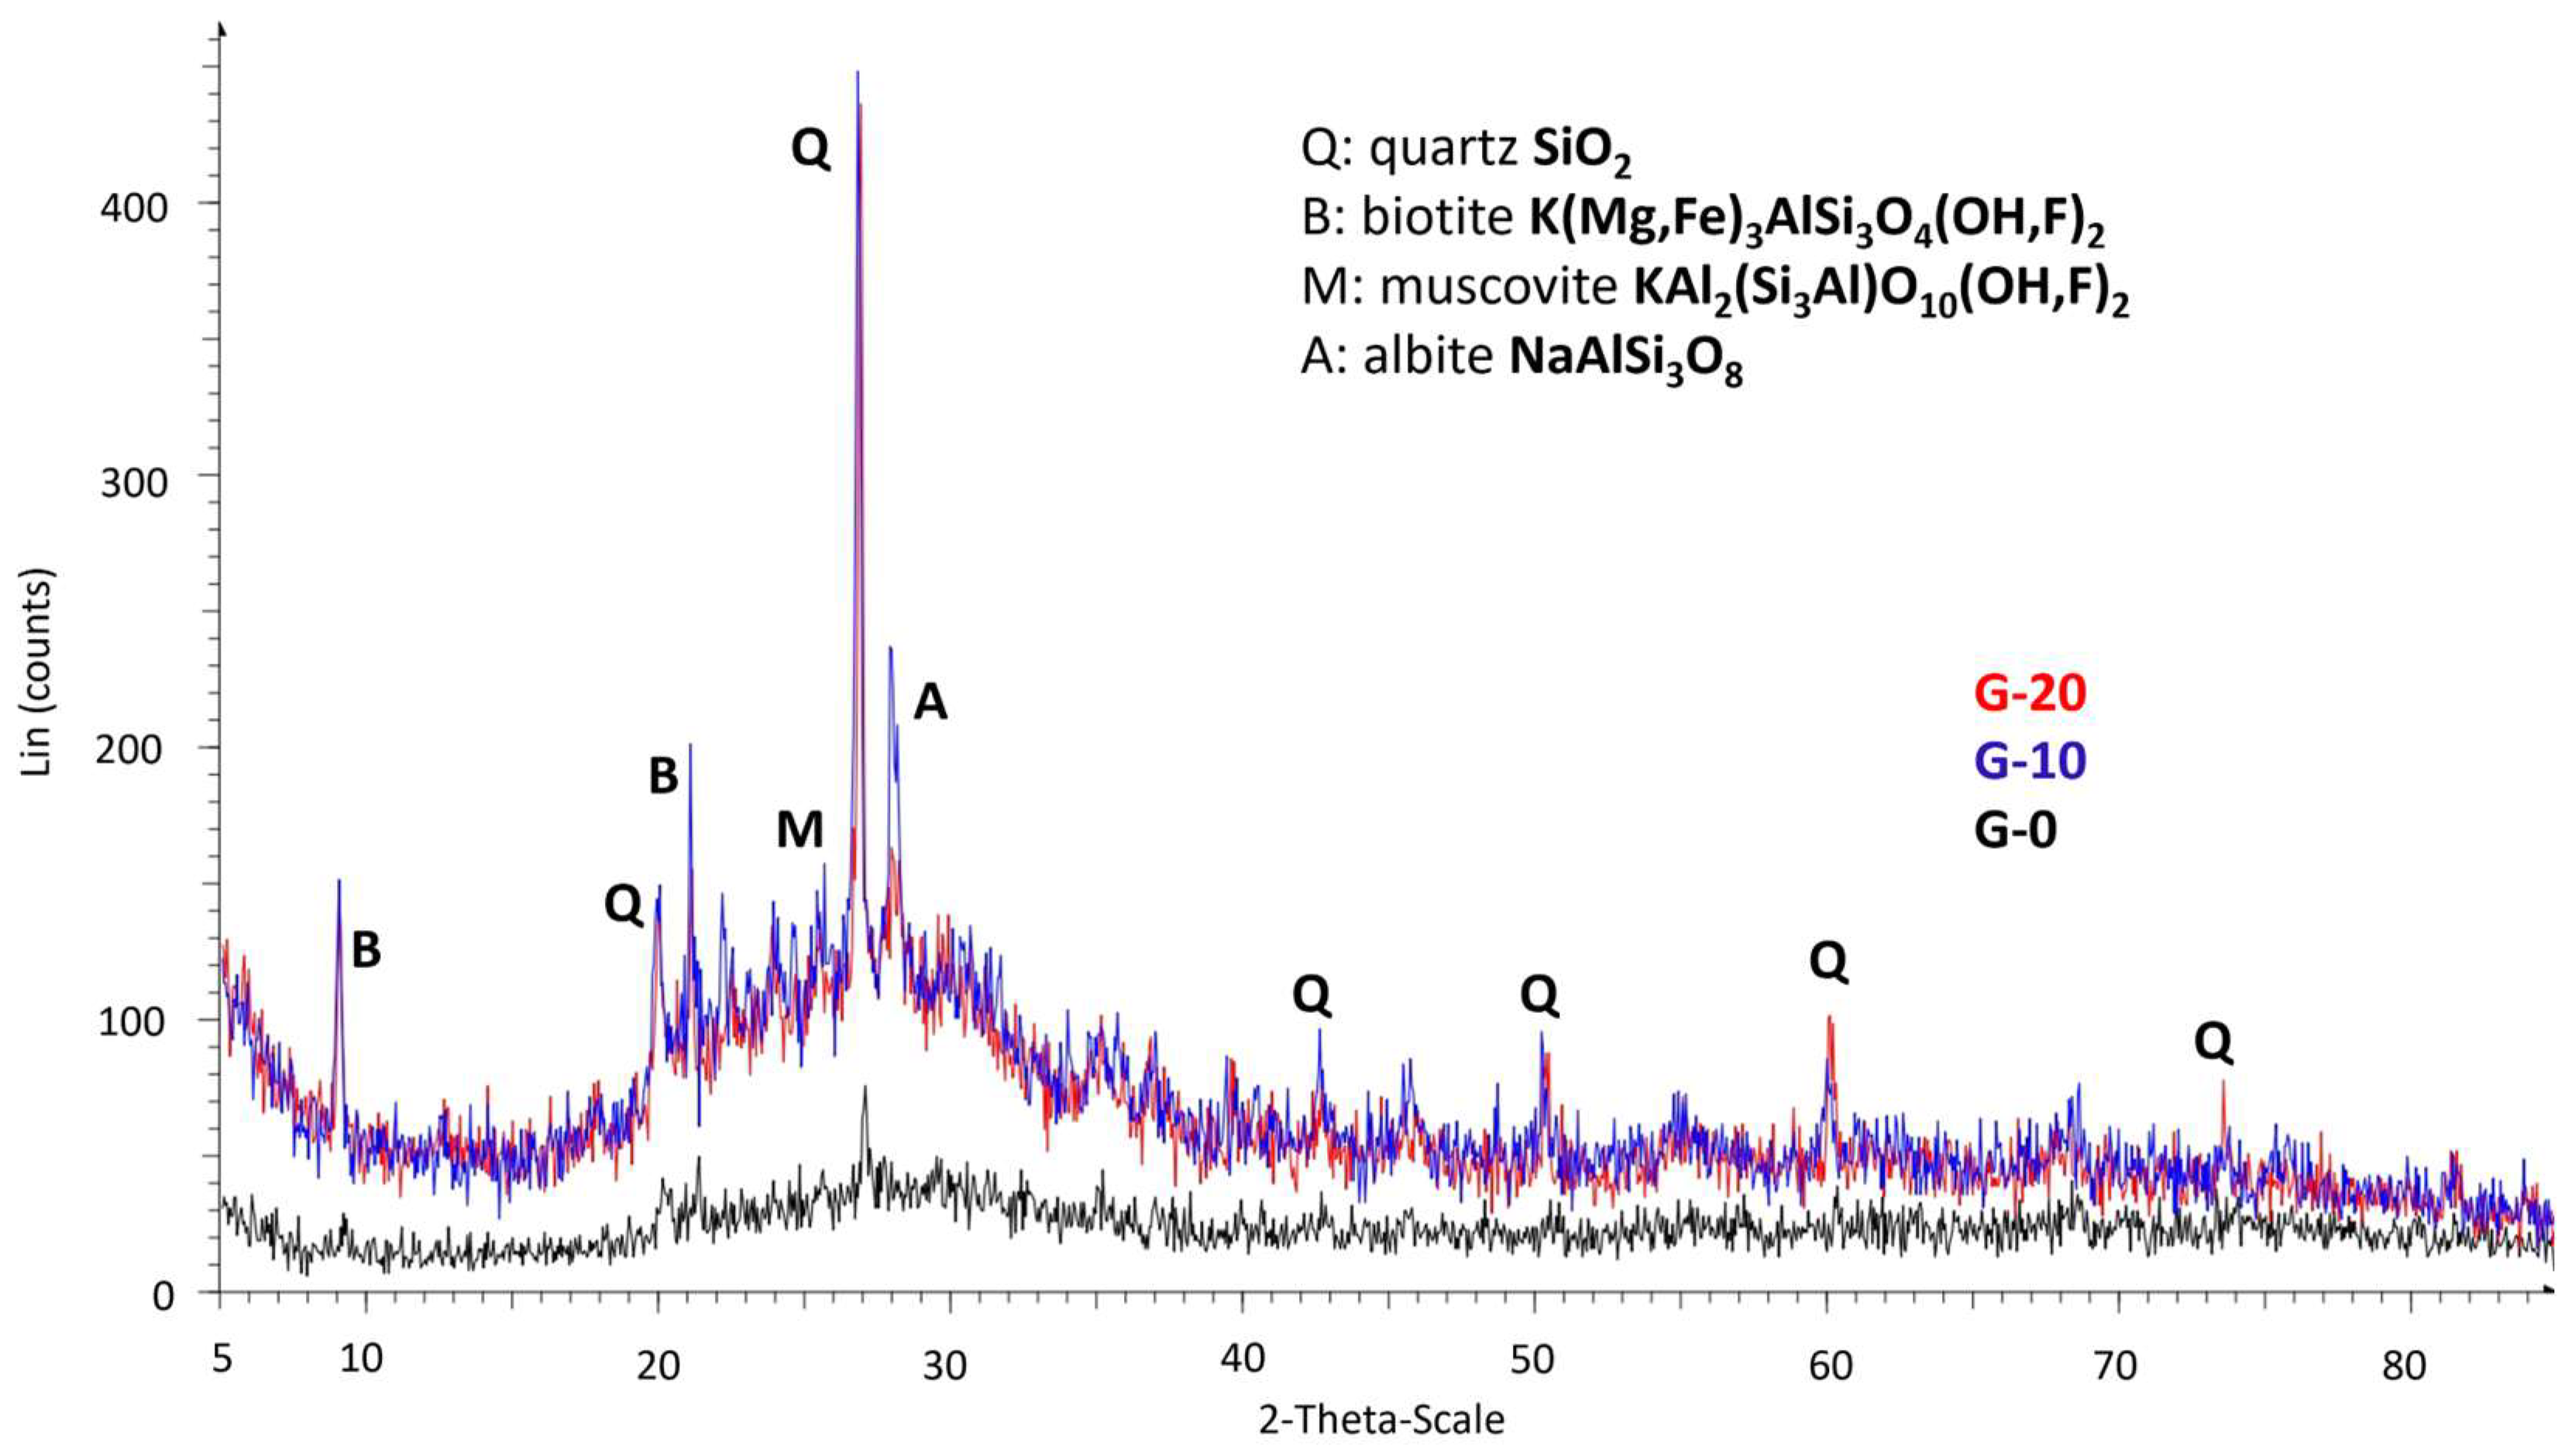
DRX patterns for G-0, G-10 and G-20 are depicted in Figure 3. The microstructure of G-0 is mainly amorphous, presenting the typical hump located between 20–35° 2θ which corresponds to the aluminosilicate gel that forms the main binding phase of the GP matrix, responsible for the mechanical strength. A crystalline peak is clearly revealed when GW is introduced in the mixture, at a 26° 2θ. This sharp peak is the main signal of quartz (SiO2) which intensity increases with GW incorporation, affecting the GP gel microstructure and, in consequence, the mechanical strength as will be seen in the following section. Other mineral phases identified with the introduction of GW are biotite (K(MgFe)3AlSi3O10(OH,F)2), muscovite (KAl2(Si3Al)O10(OH,F)2) and albite (NaAlSi3O8), typically found in granitic rocks.

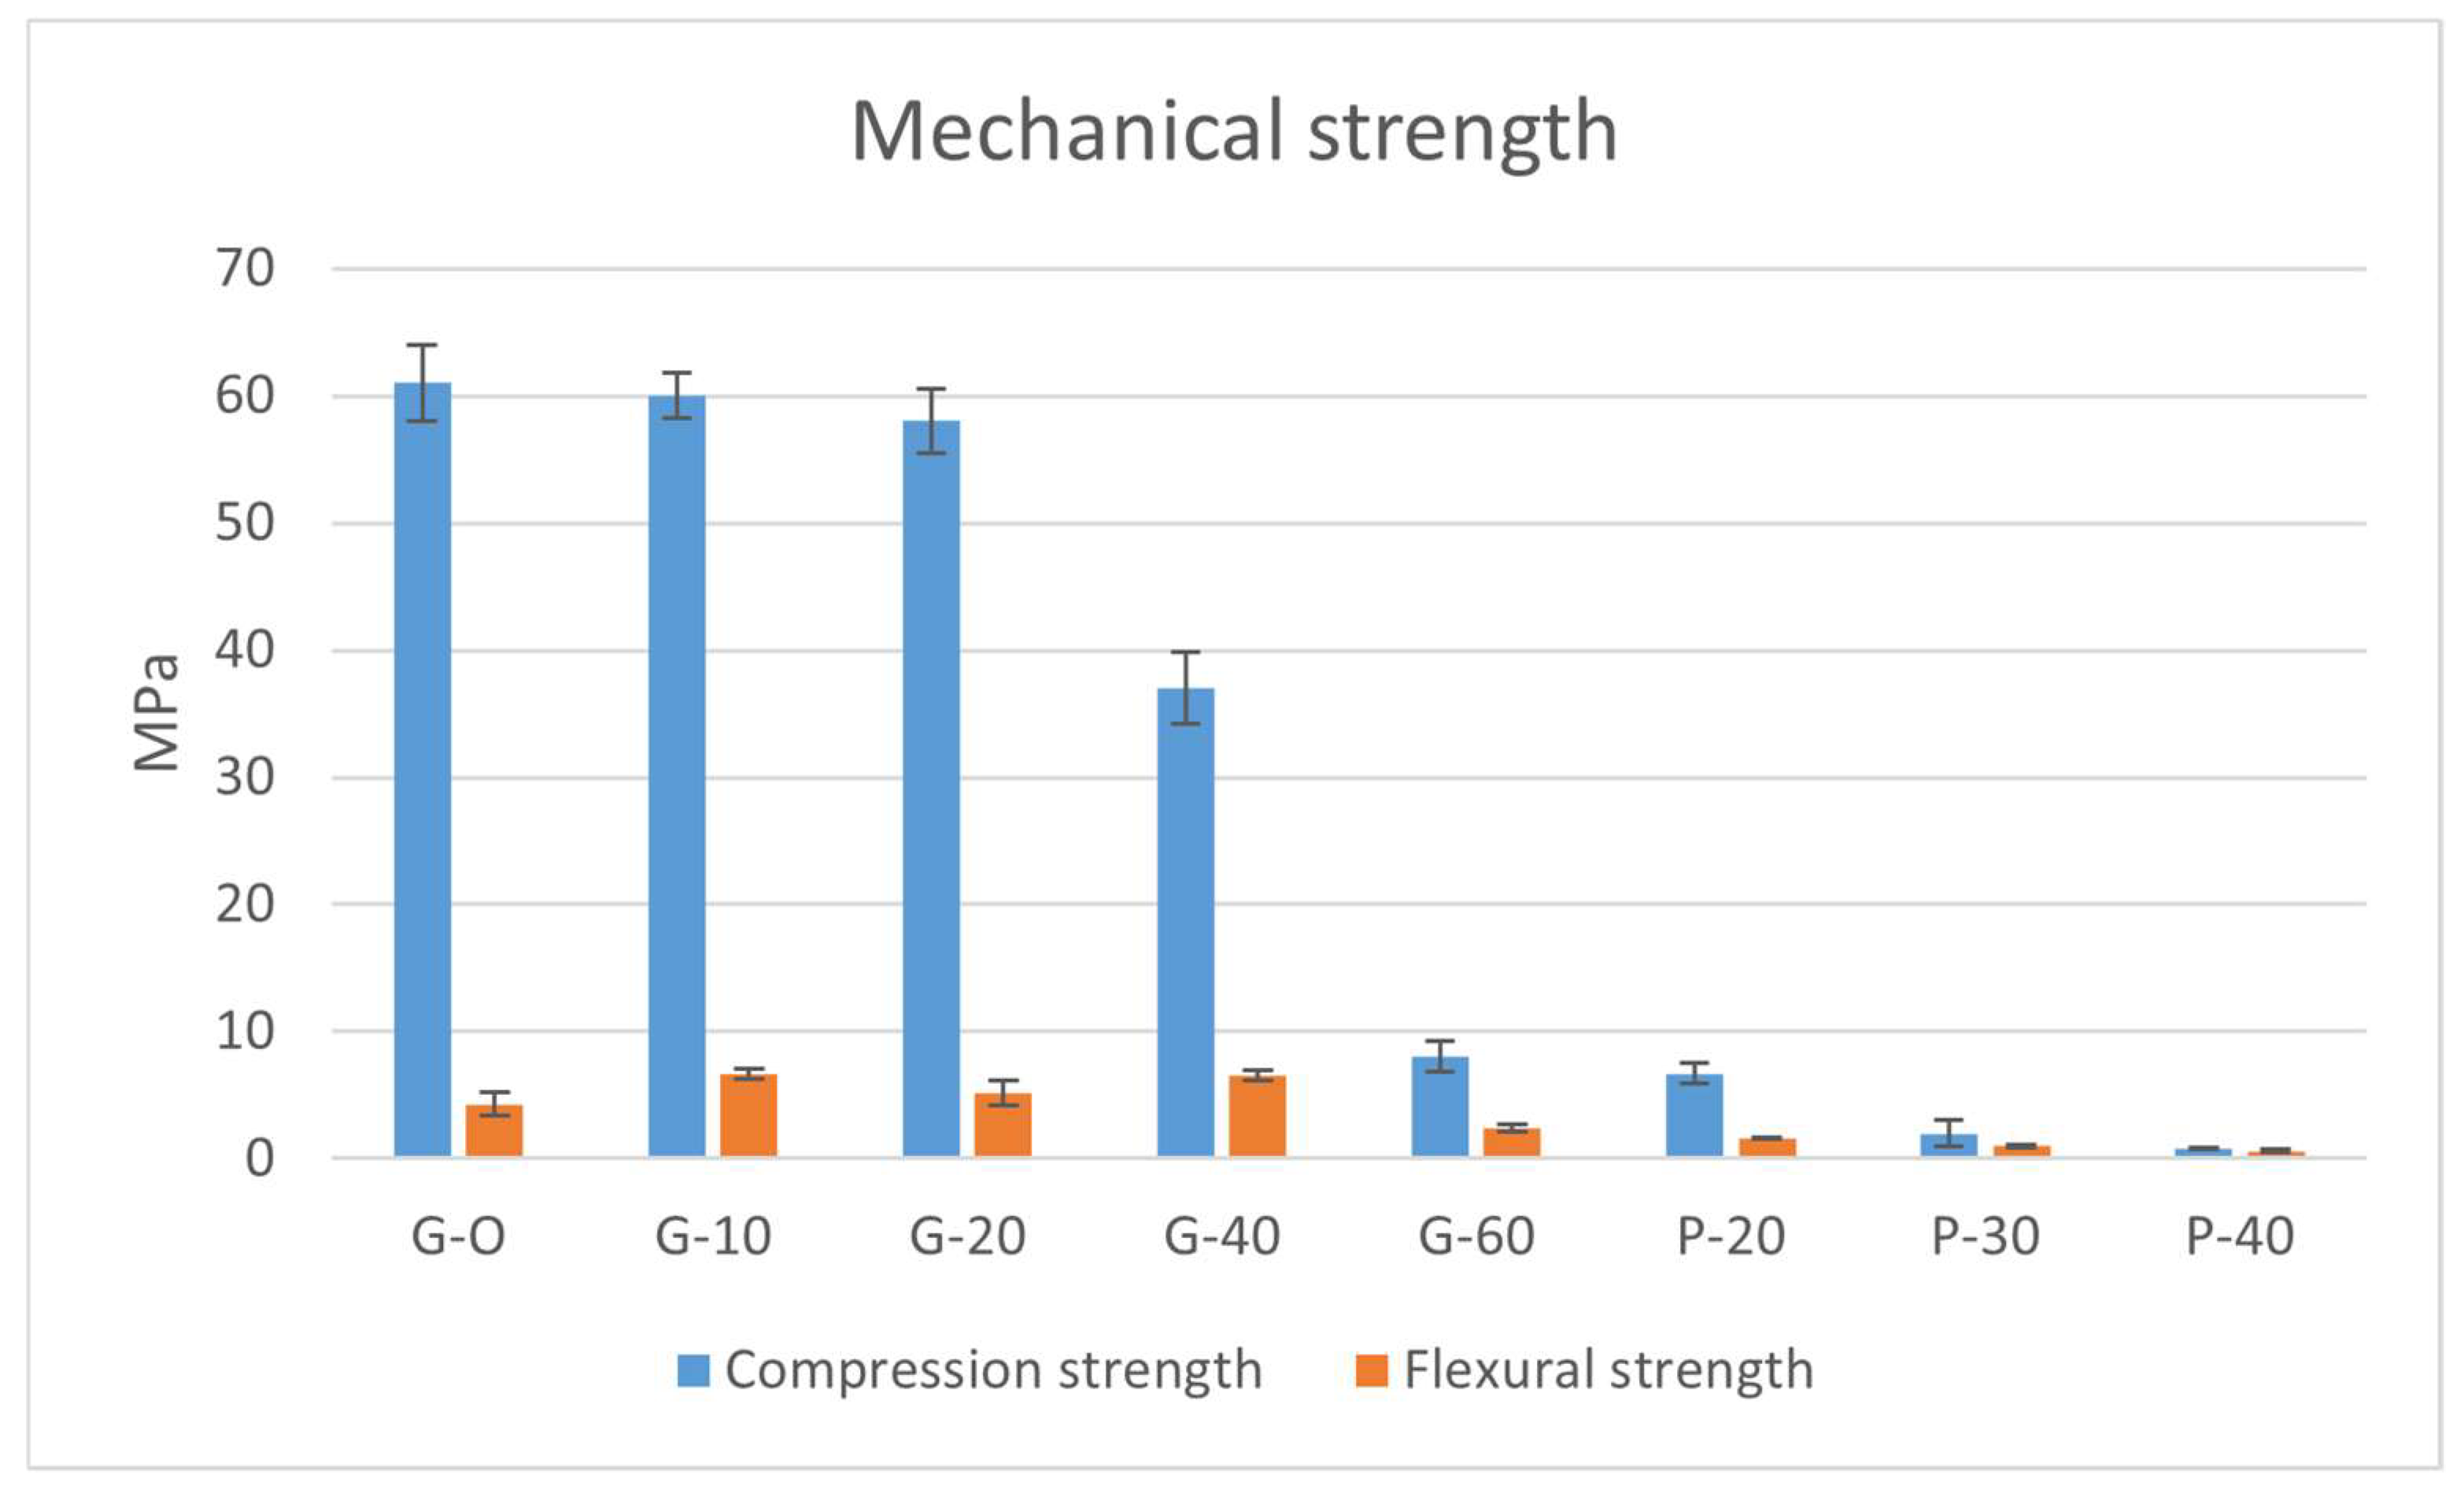
3.1.2. Mechanical Testing

Figure 4 shows the compressive and flexural strengths obtained for the different GPs after 28 days-age. The results revealed that GW additions do not significantly affect the mechanical strength of the GP up to 20% of additions. The mechanical strength is reduced by 5%, according to the slight structural changes observed by SEM. Particularly noteworthy is the value reached with 20% of GW (58 MPa) for the compressive resistance.
However, the decrease is dramatic with additions of 40% and 60% (39% and 87% respectively). The presence of unreacted GW particles and the consequent reduction of the amorphous gel fraction led to lower mechanical strengths.
As expected, the foaming agent addition promoted a dramatic drop of the mechanical strength as well. Porous samples presented smaller values of both flexural and compressive resistance. For the case of 20% of GW, the compressive strength decreases down to 6.7 MPa (P-20), 93% lower than the non-porous G-20. The pores act as the stress concentration points and are prone to failure when load is applied [63]. Therefore, it is expected a strong linking between mechanical performance and density and porosity depicted in Table 4.

3.1.3. Physical Testing

Bulk density increased with GW additions; the filler occupied the empty voids and promoted a decrease in the porosity values. In contrast, with the 1% introduction H2O2, the porosity % increased by a factor of 10 and the bulk density decreased due to the air voids formation obtaining a lighter material [64].
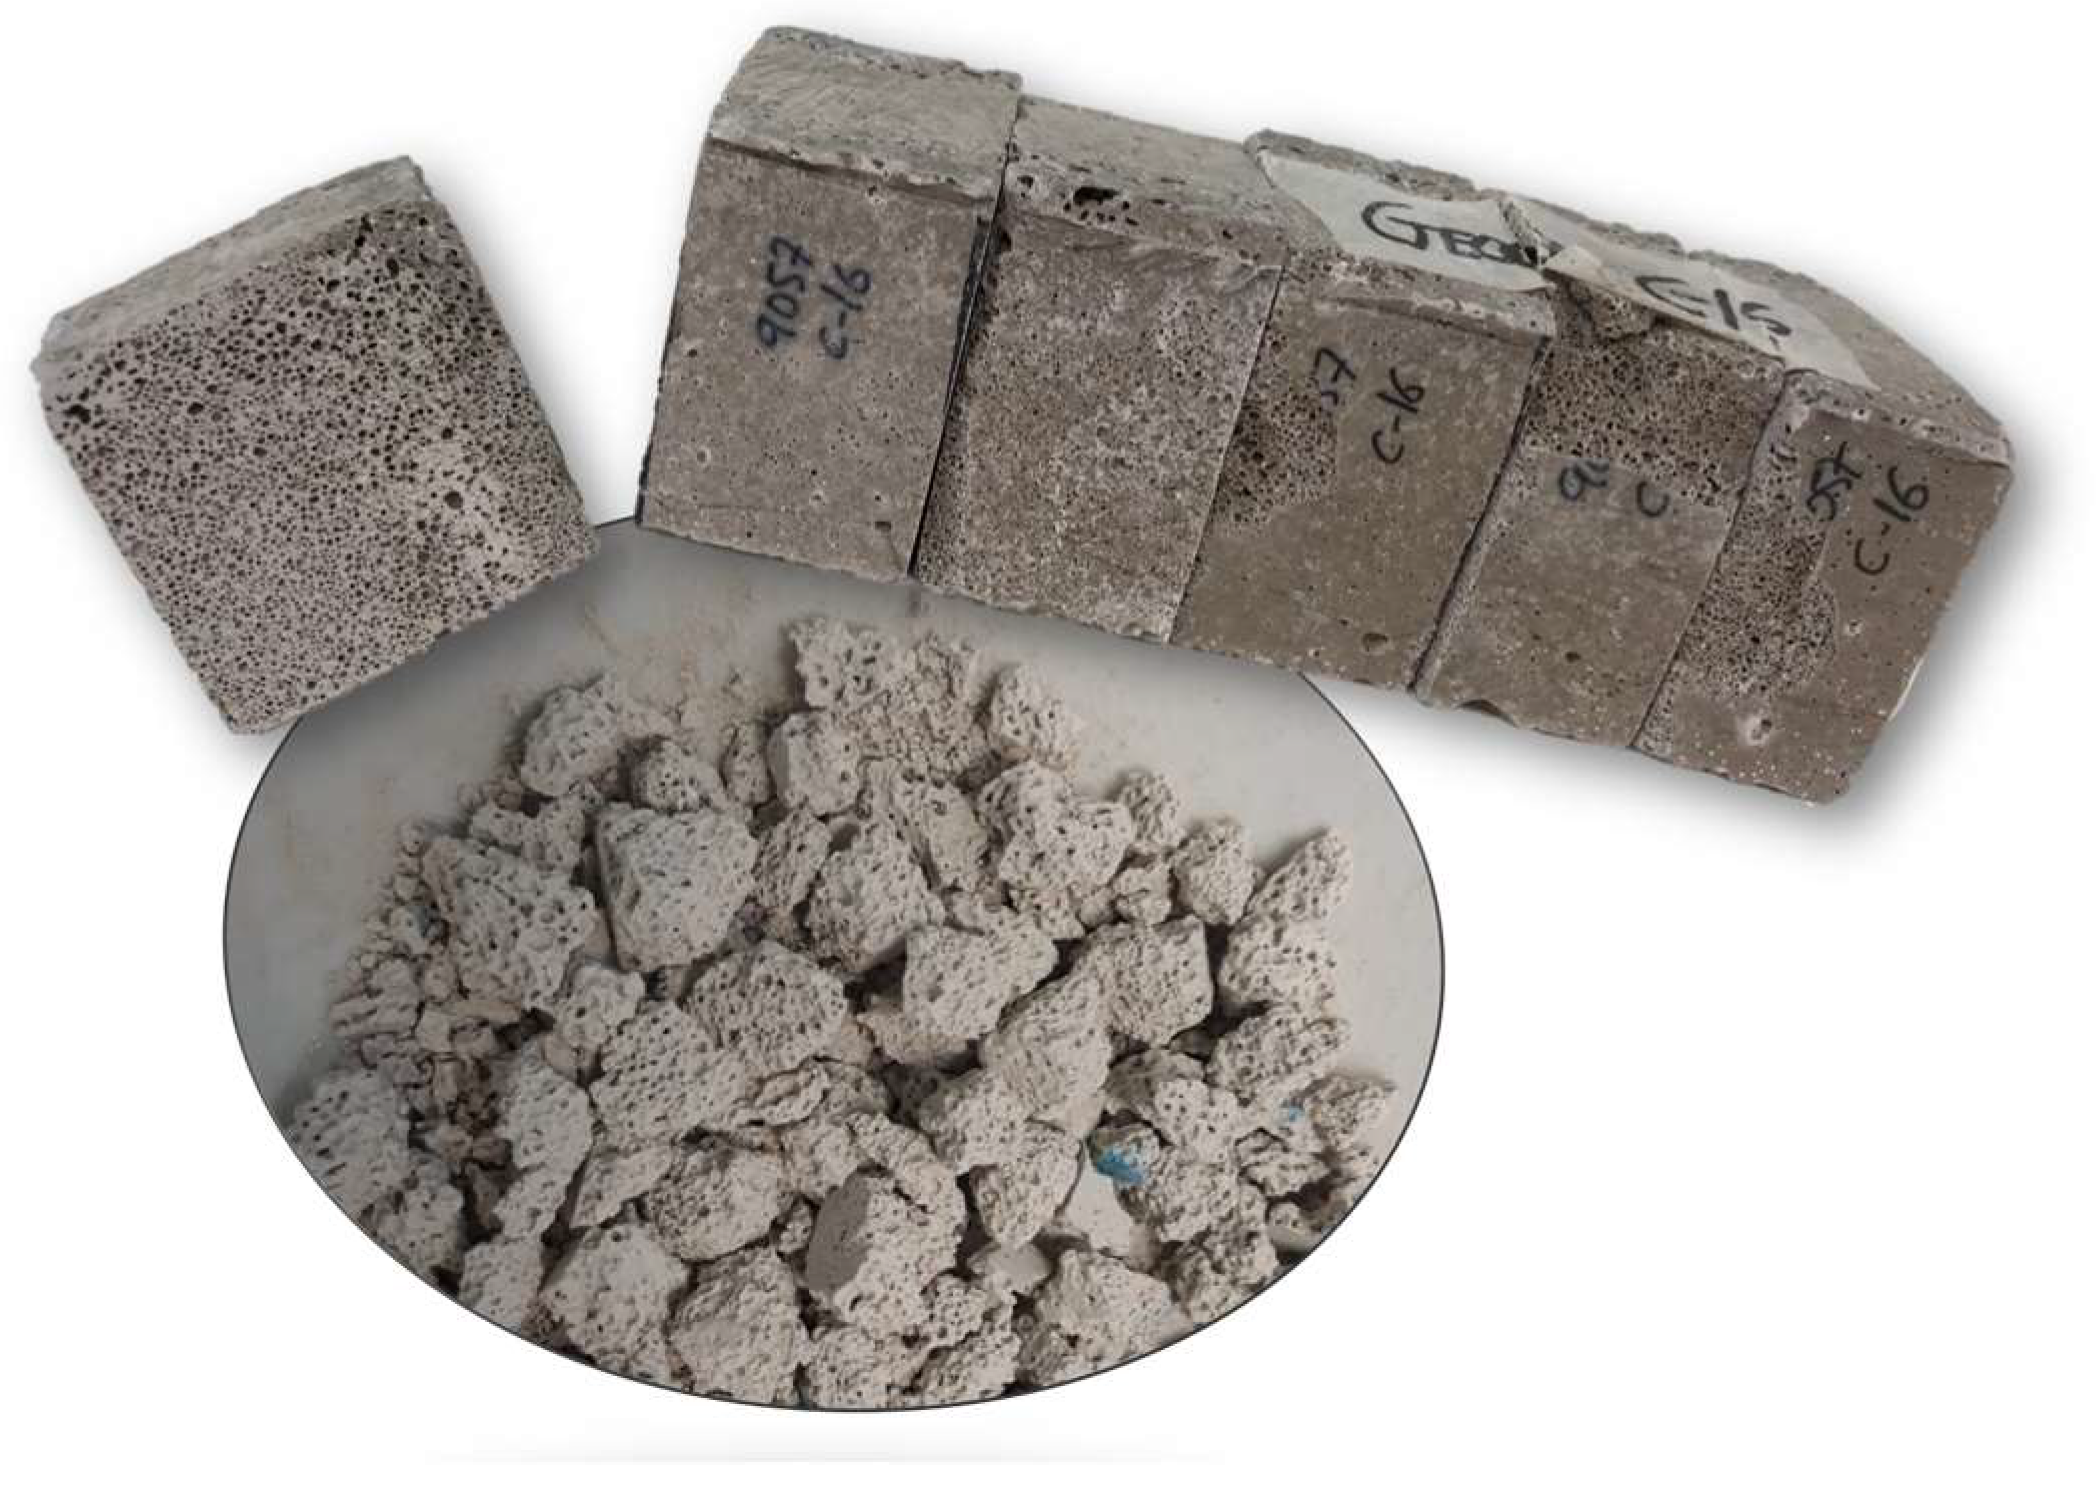
Additionally, porous GPs with different GW additions were immersed in water for 24 h to validate the chemical integrity of the formed gel matrix. This test allowed to confirm that GP (non-porous and porous) with GW additions up to 20% maintained the consolidation after the immersion time. On the contrary, GPs with higher GW content (>20%) were turned into dust after testing revealing a non-acceptable GP gel reaction due to the high crystalline contribution of the GW. Therefore, they were discarded, and P-20 formulation was selected as the material for further adsorption studies.
Figure 5 presents the aspect of the GP P-20 and Table 5 summarizes the synthesis parameters and their properties.
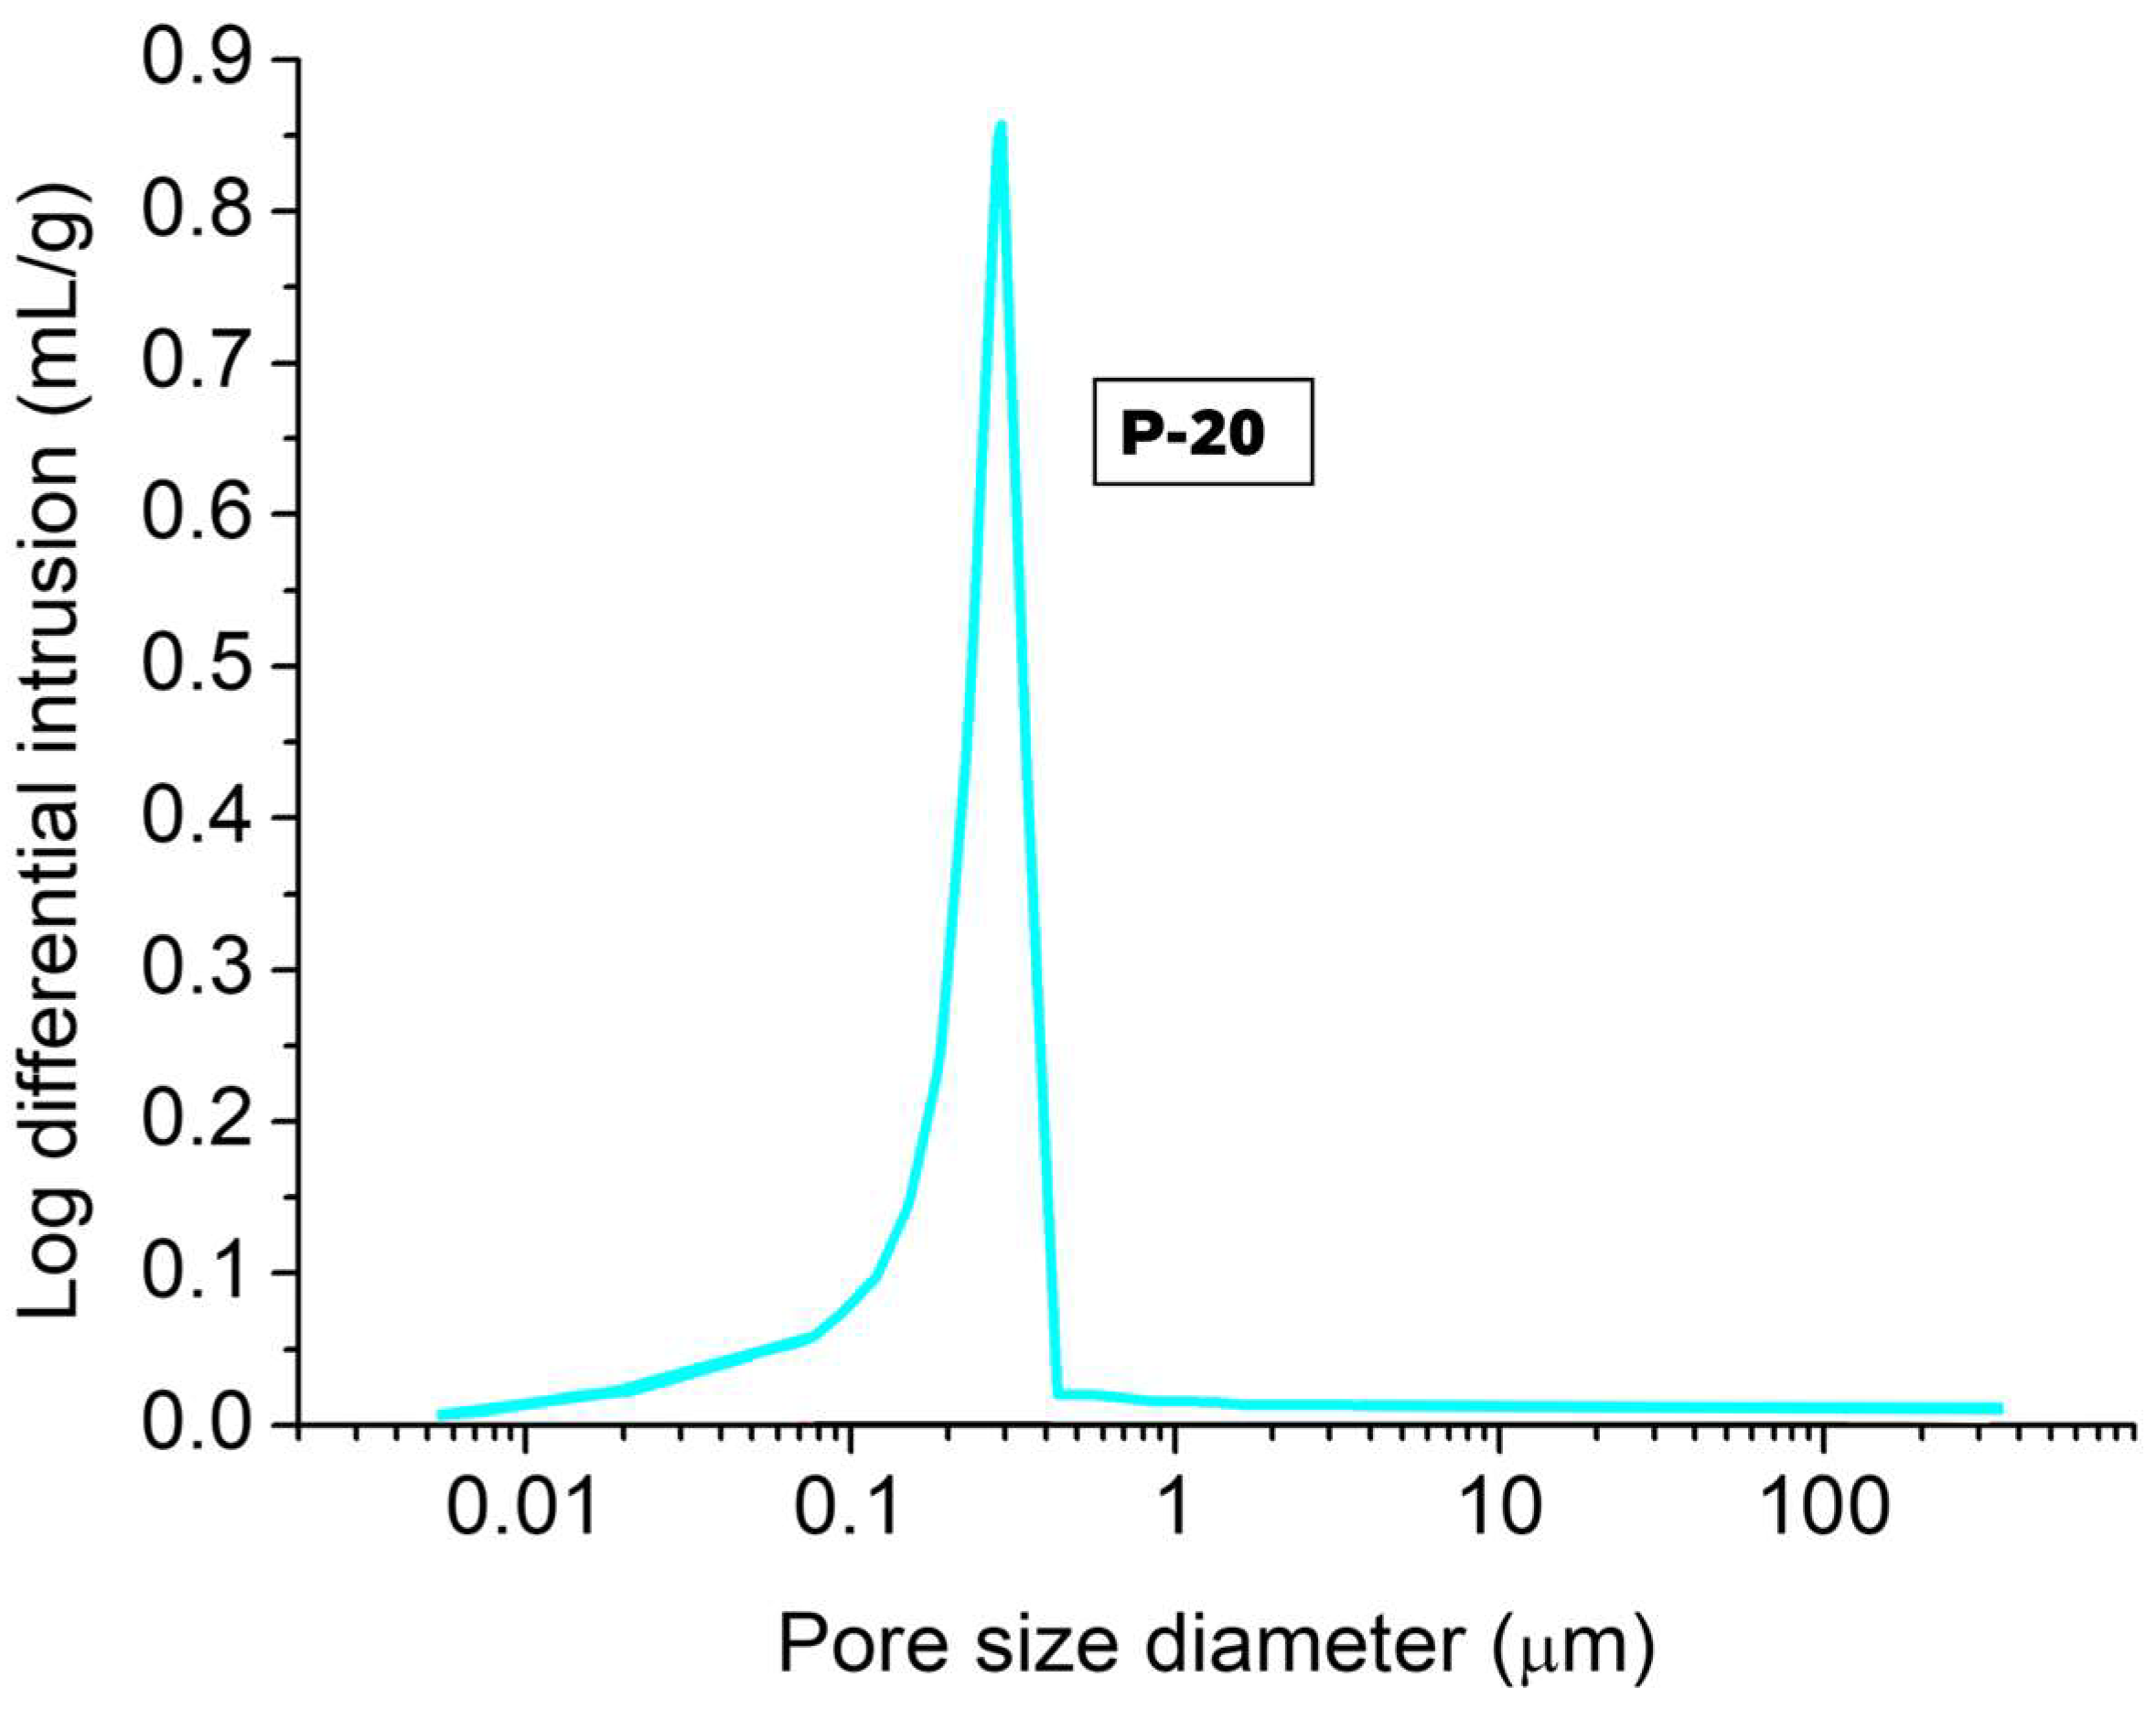
The pore size distribution of P-20 is illustrated in Figure 6 by a differential volume intrusion graph with the corresponding critical pore size. The critical pore size is located between 0.1–0.4 µm for this material at 28 days-age. The results indicated that mesopores (6–50 nm), macropores (0.05–5 µm) and air voids (>5 µm) [65] dominated the pore distribution, resulting in an average pore size of 0.27 µm.
Larger pores (air voids) were microscopically identified formed by a phenomenon called coalescence. With the introduction of oxygen bubbles by chemical foaming, the nucleation particles become weaker, and the bubbles start to coalesce, thus increasing the overall pore size and interconnectivity [66].

3.1.4. Behavior in Aqueous Media

Leaching tests of P-20 (10 g/L) were performed to determine the release of ionic species in aqueous solution. The aim is to guarantee the absence of NH4+ over time and identify the potential pH increase due to the alkalinity (OH release) of the material. The results are detailed in Table 6.
It can be observed that within the first hour of contact there was a considerable increase in pH from 5.6 (initial condition) to 9.1. This was due to the unreacted NaOH which was physically adsorbed or weakly bonded and easily leached through the GP microstructure [10,30]. pH increased over time until it reached a value of 10.1 after 24 h of immersion. Alkalis leaching could also be demonstrated by the increase of [Na+] over time. Same time-dependent behavior was verified by Aly et al. [67]. As expected, an increase in the electrical conductivity was also obtained due to the leaching of ions, especially the Na+. Small traces of Cl and SO4−2 were also found in this test, but NH4+ ion leaching was not detected.
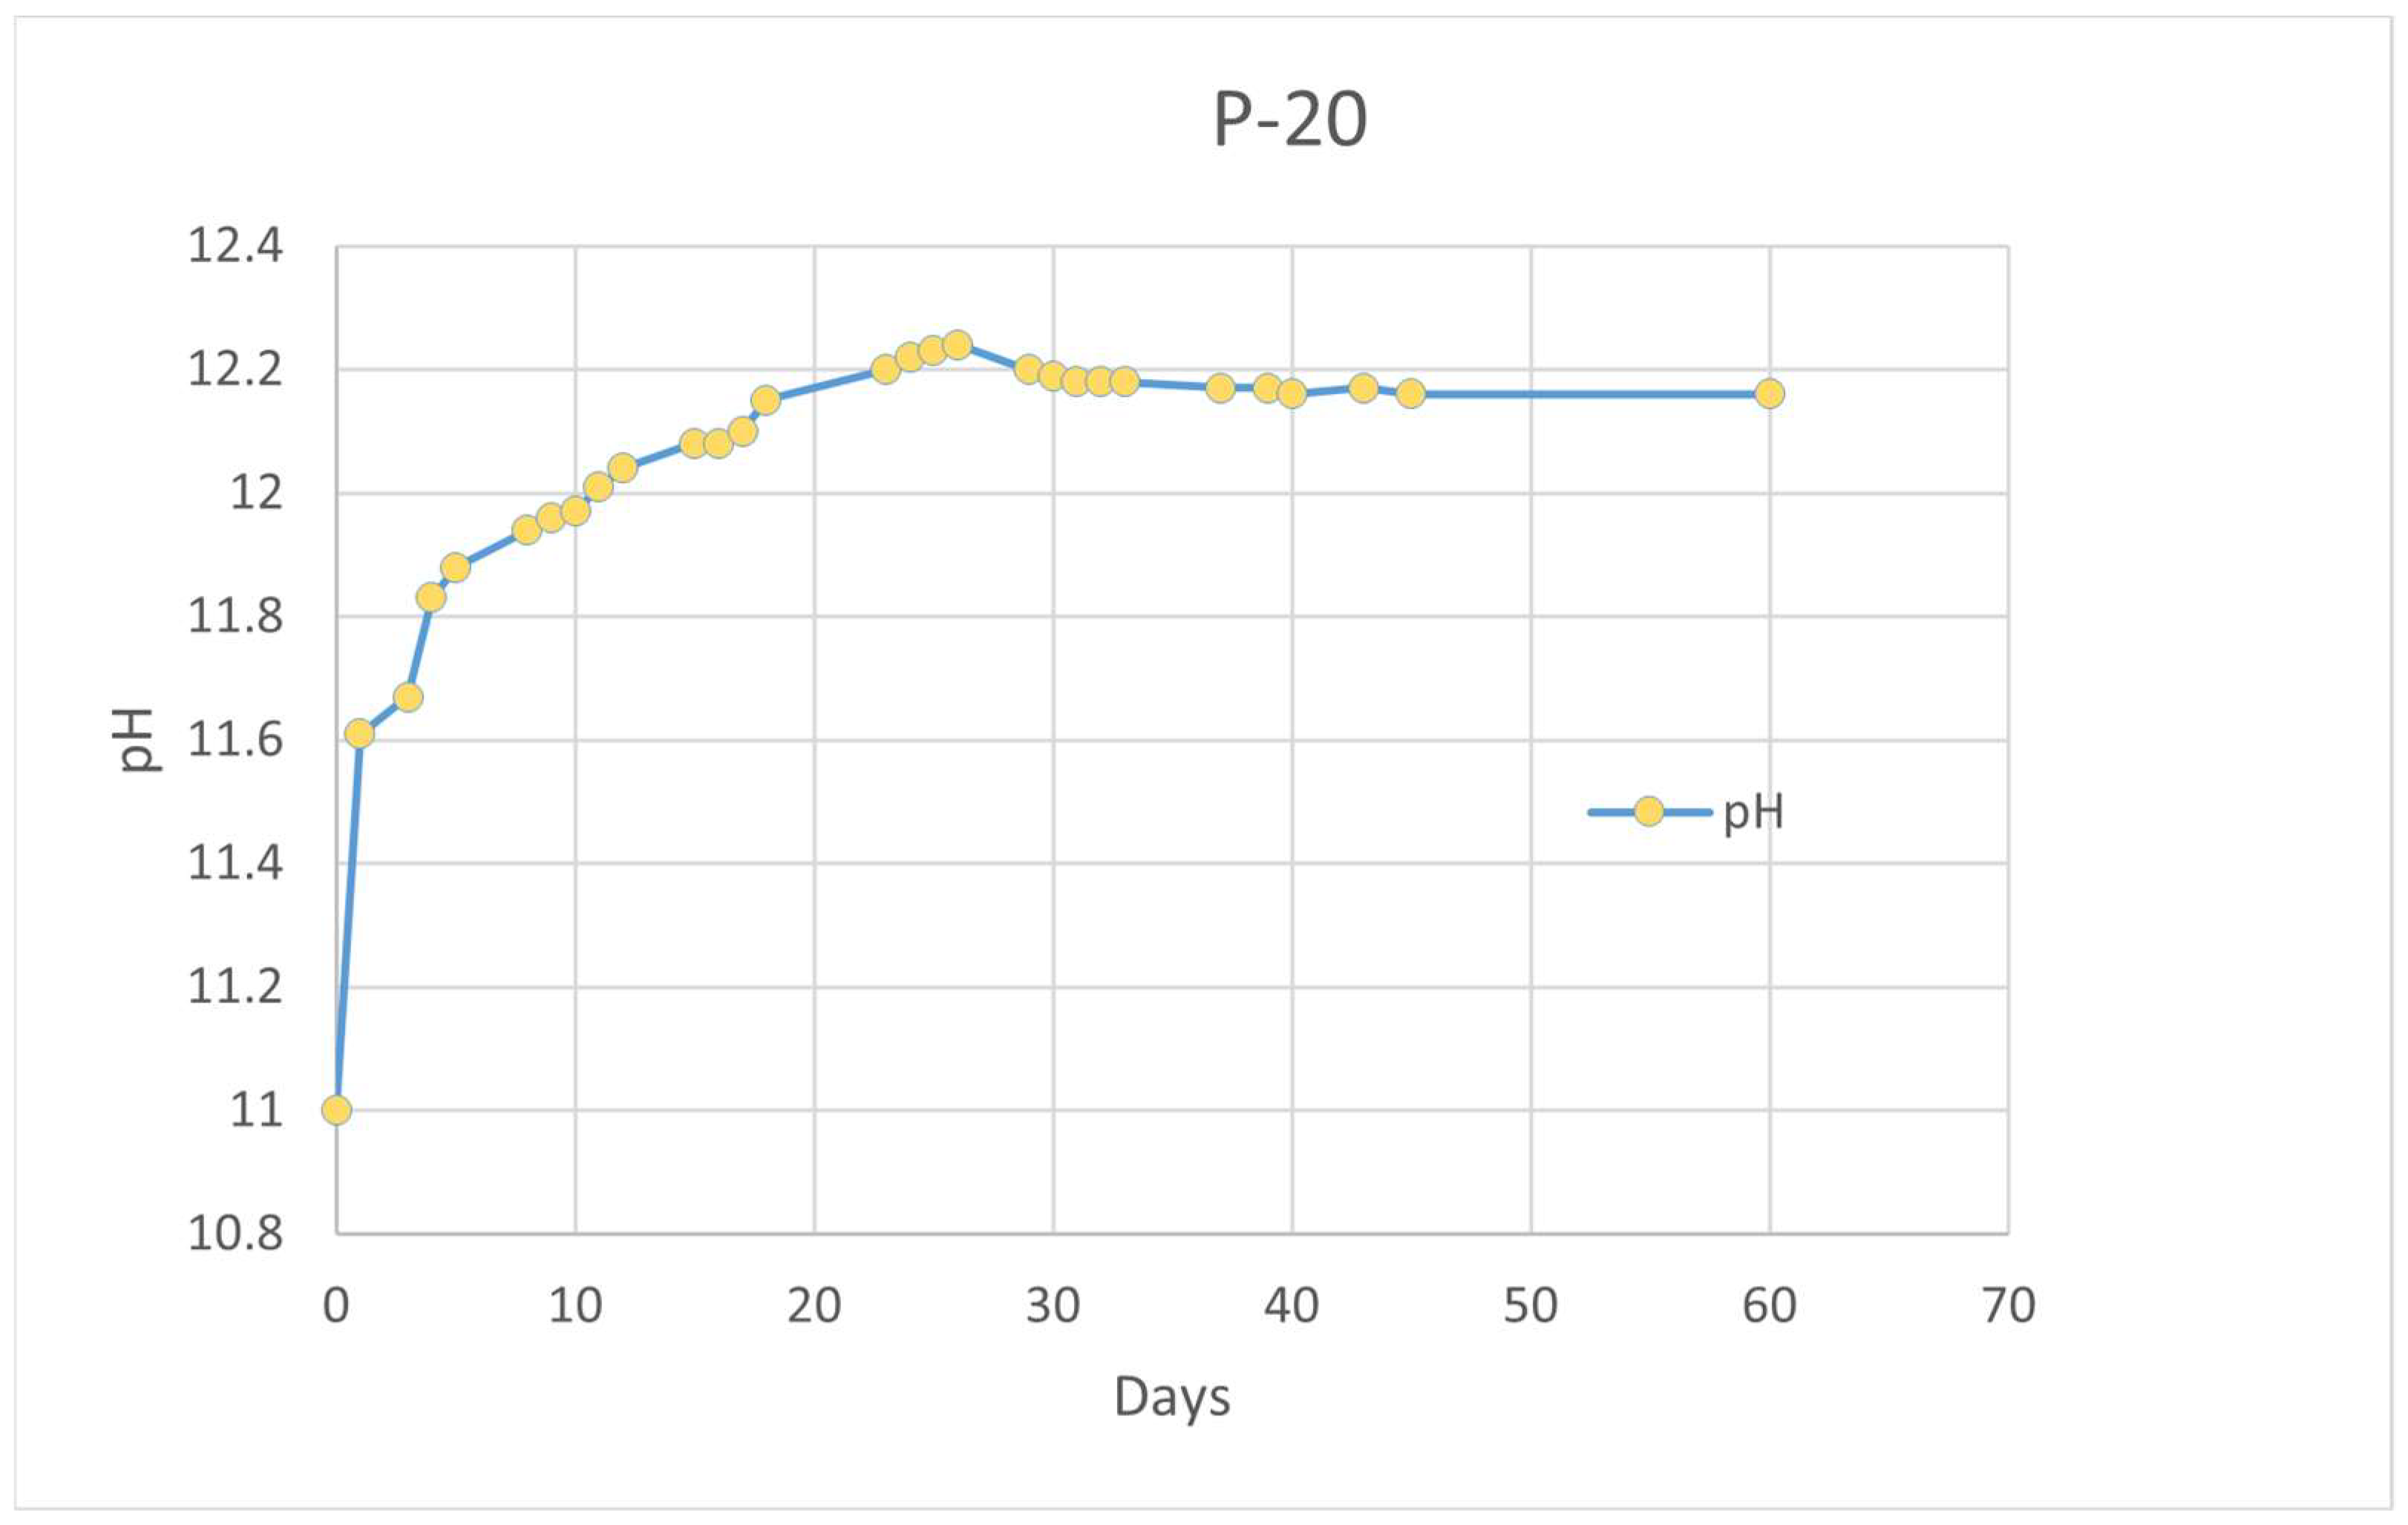
A pH control test was carried out in deionized water in a solution with 120 g/L of P-20 and for 60 days. The results are shown in Figure 7.
The initial pH was 11 according to the higher concentration of P-20 in comparison with the previous test (10 g/L). A significant increase was detected during the first 24 h up to pH = 11.6. The trend continued to increase until 25 days, where a maximum of pH = 12.27 was reached. In good agreement with the previous leaching tests, the initial increment can be explained due to the presence of unreacted NaOH release.
Then, an asymptotic behavior was achieved up to 60 days. A similar tendency was found by Novais et al. [10,68] suggesting the potential pH-buffering effect of the porous MK-based GP since they could enclose free leachable alkalis in the pores. The mechanical integrity of P-20 remained intact after 60 days.
It is clear that this increasing pH trend is going to be dependent on factors such as the nature and concentration of the activator [69], geopolymers porosity [68], H2O2 content [68] and liquid-to-solid ratio [70].
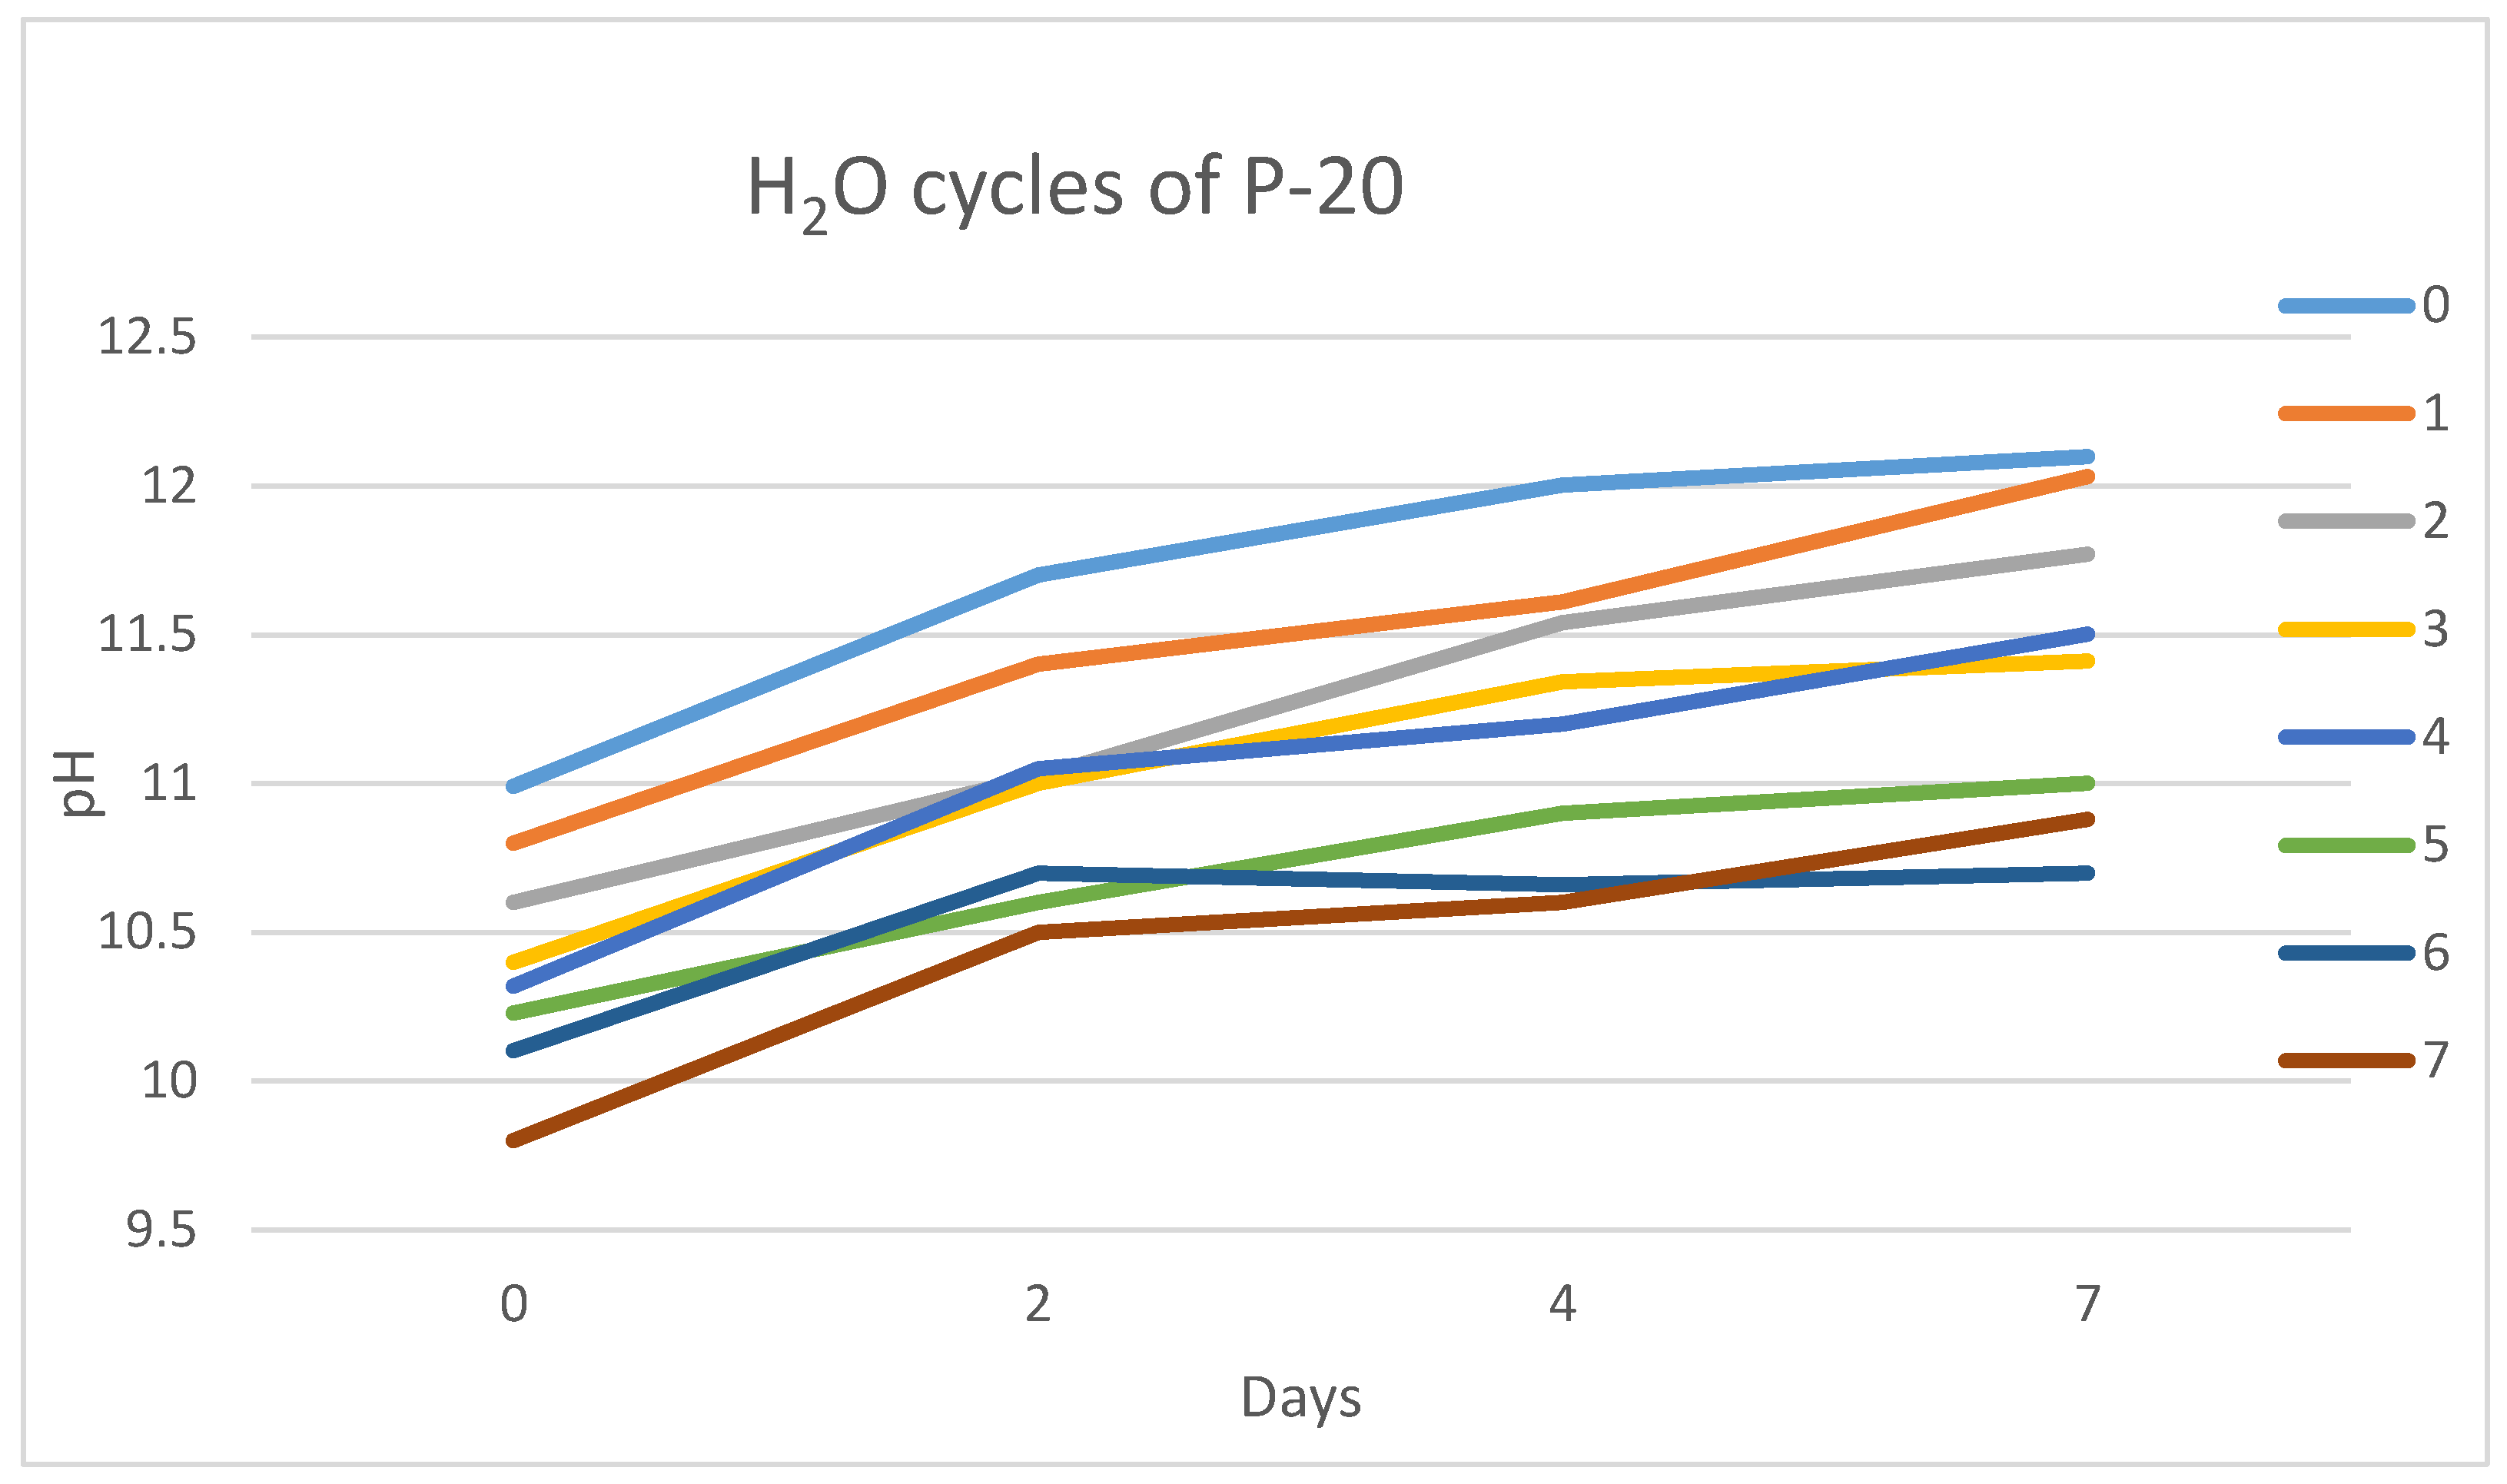
However, initial alkali leaching supposes the most critical issue to implement the material in wastewater treatments since legislation pH limits (pH between 5.5 and 9) represent a fundamental requirement for waste-derived products. Thus, rinsing treatments for pH decreasing were evaluated before the material implementation.
Figure 8 shows the effect of the cyclic immersion of P-20 granules in water.
The proposed cleansing treatment induced a slow pH drop after each cycle. The pH value was reduced by one unit each monitored day (0, 2, 4 and 7). However, the tendency is increasing over time (from 0 to 7 days), so P-20 continued to leach alkalis at lower concentrations.
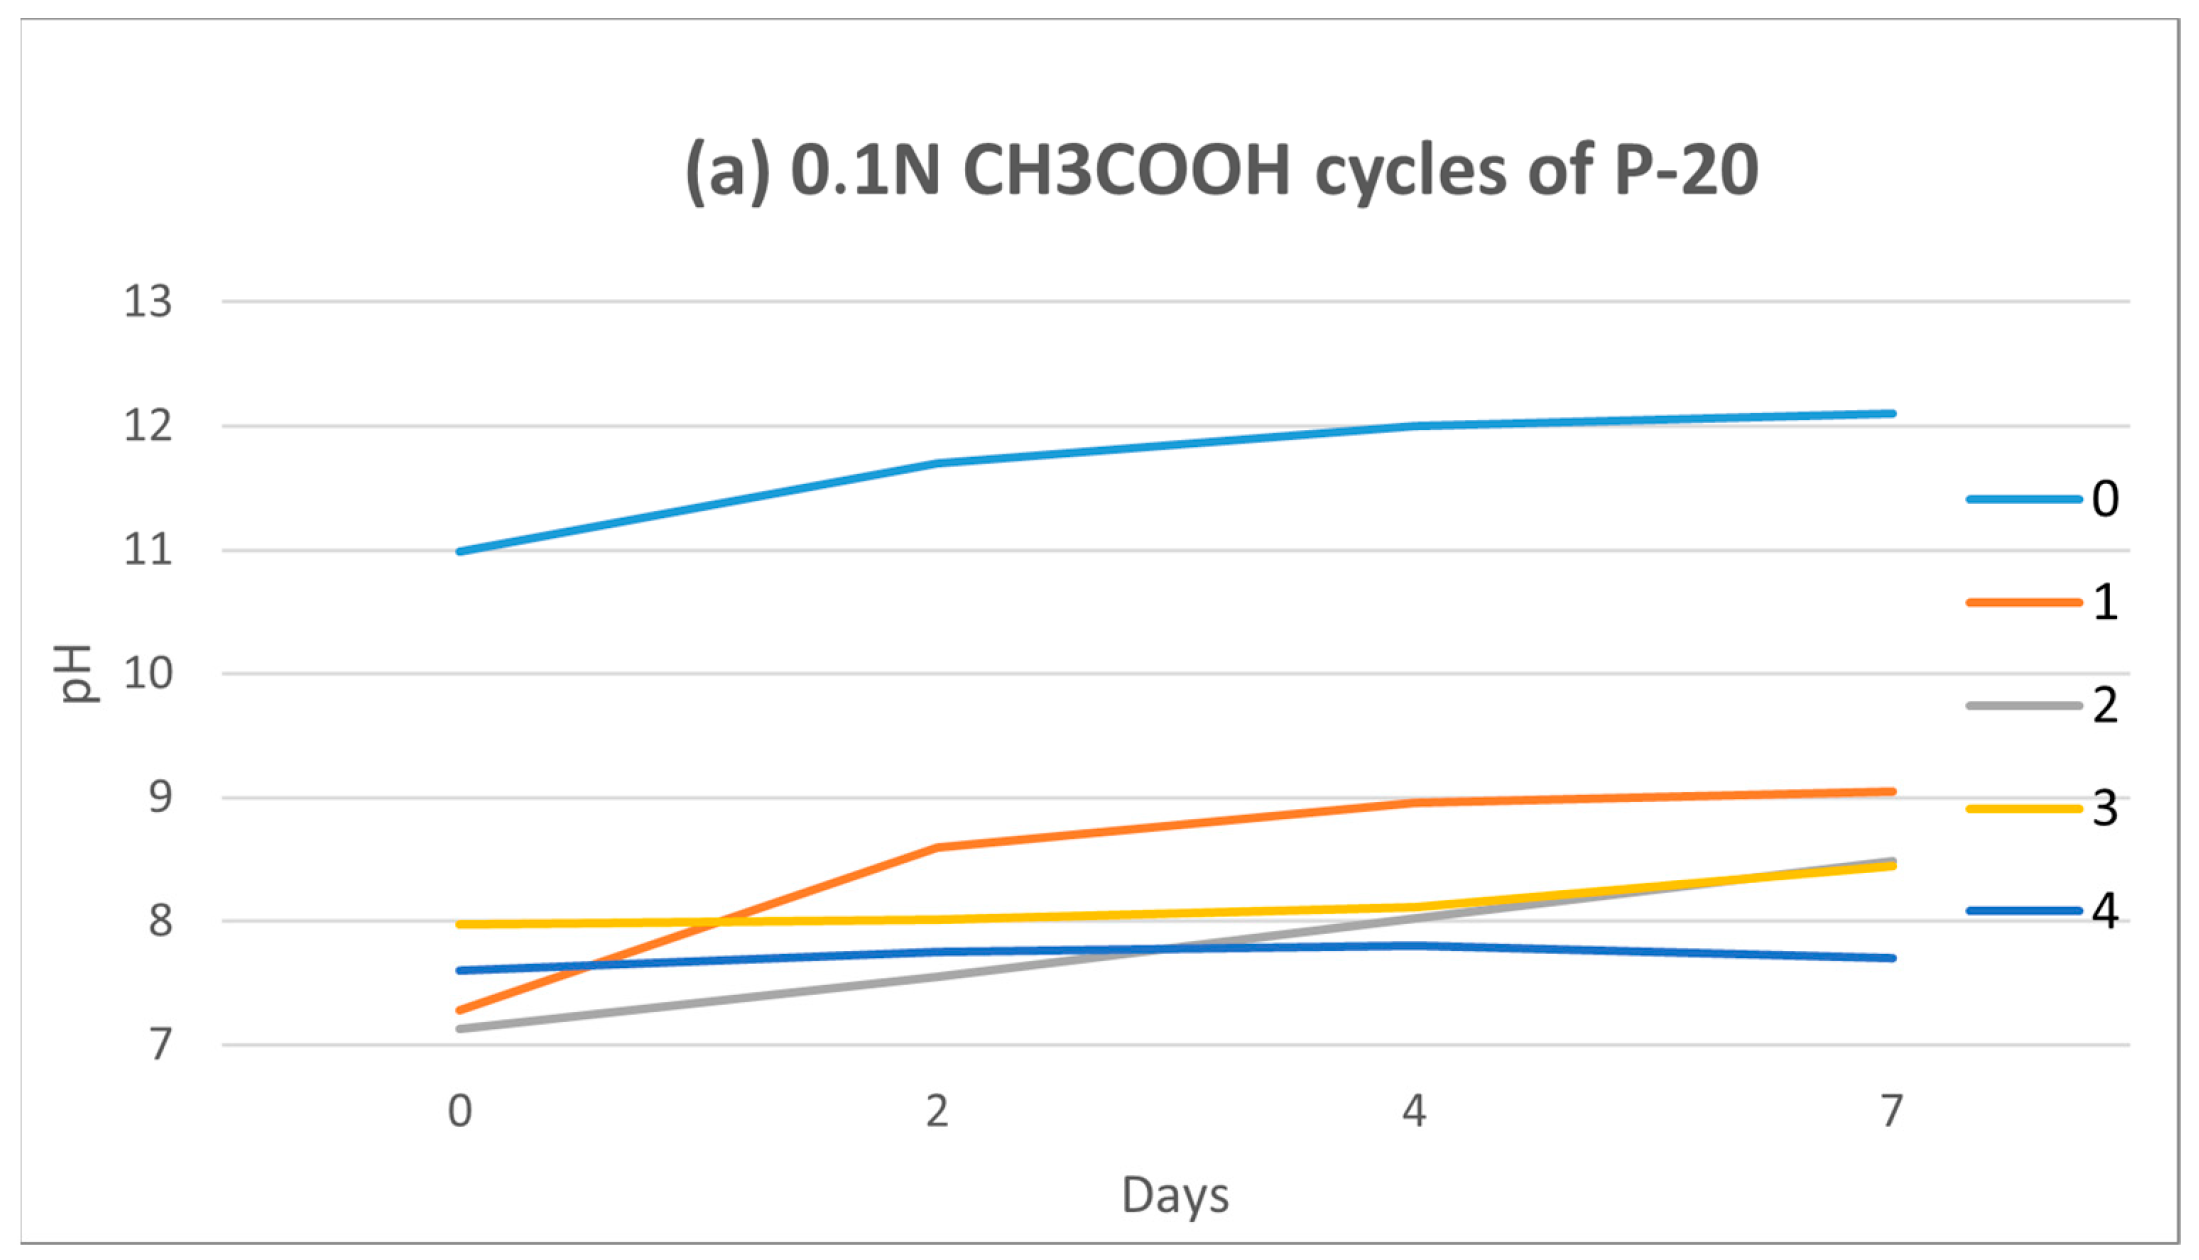
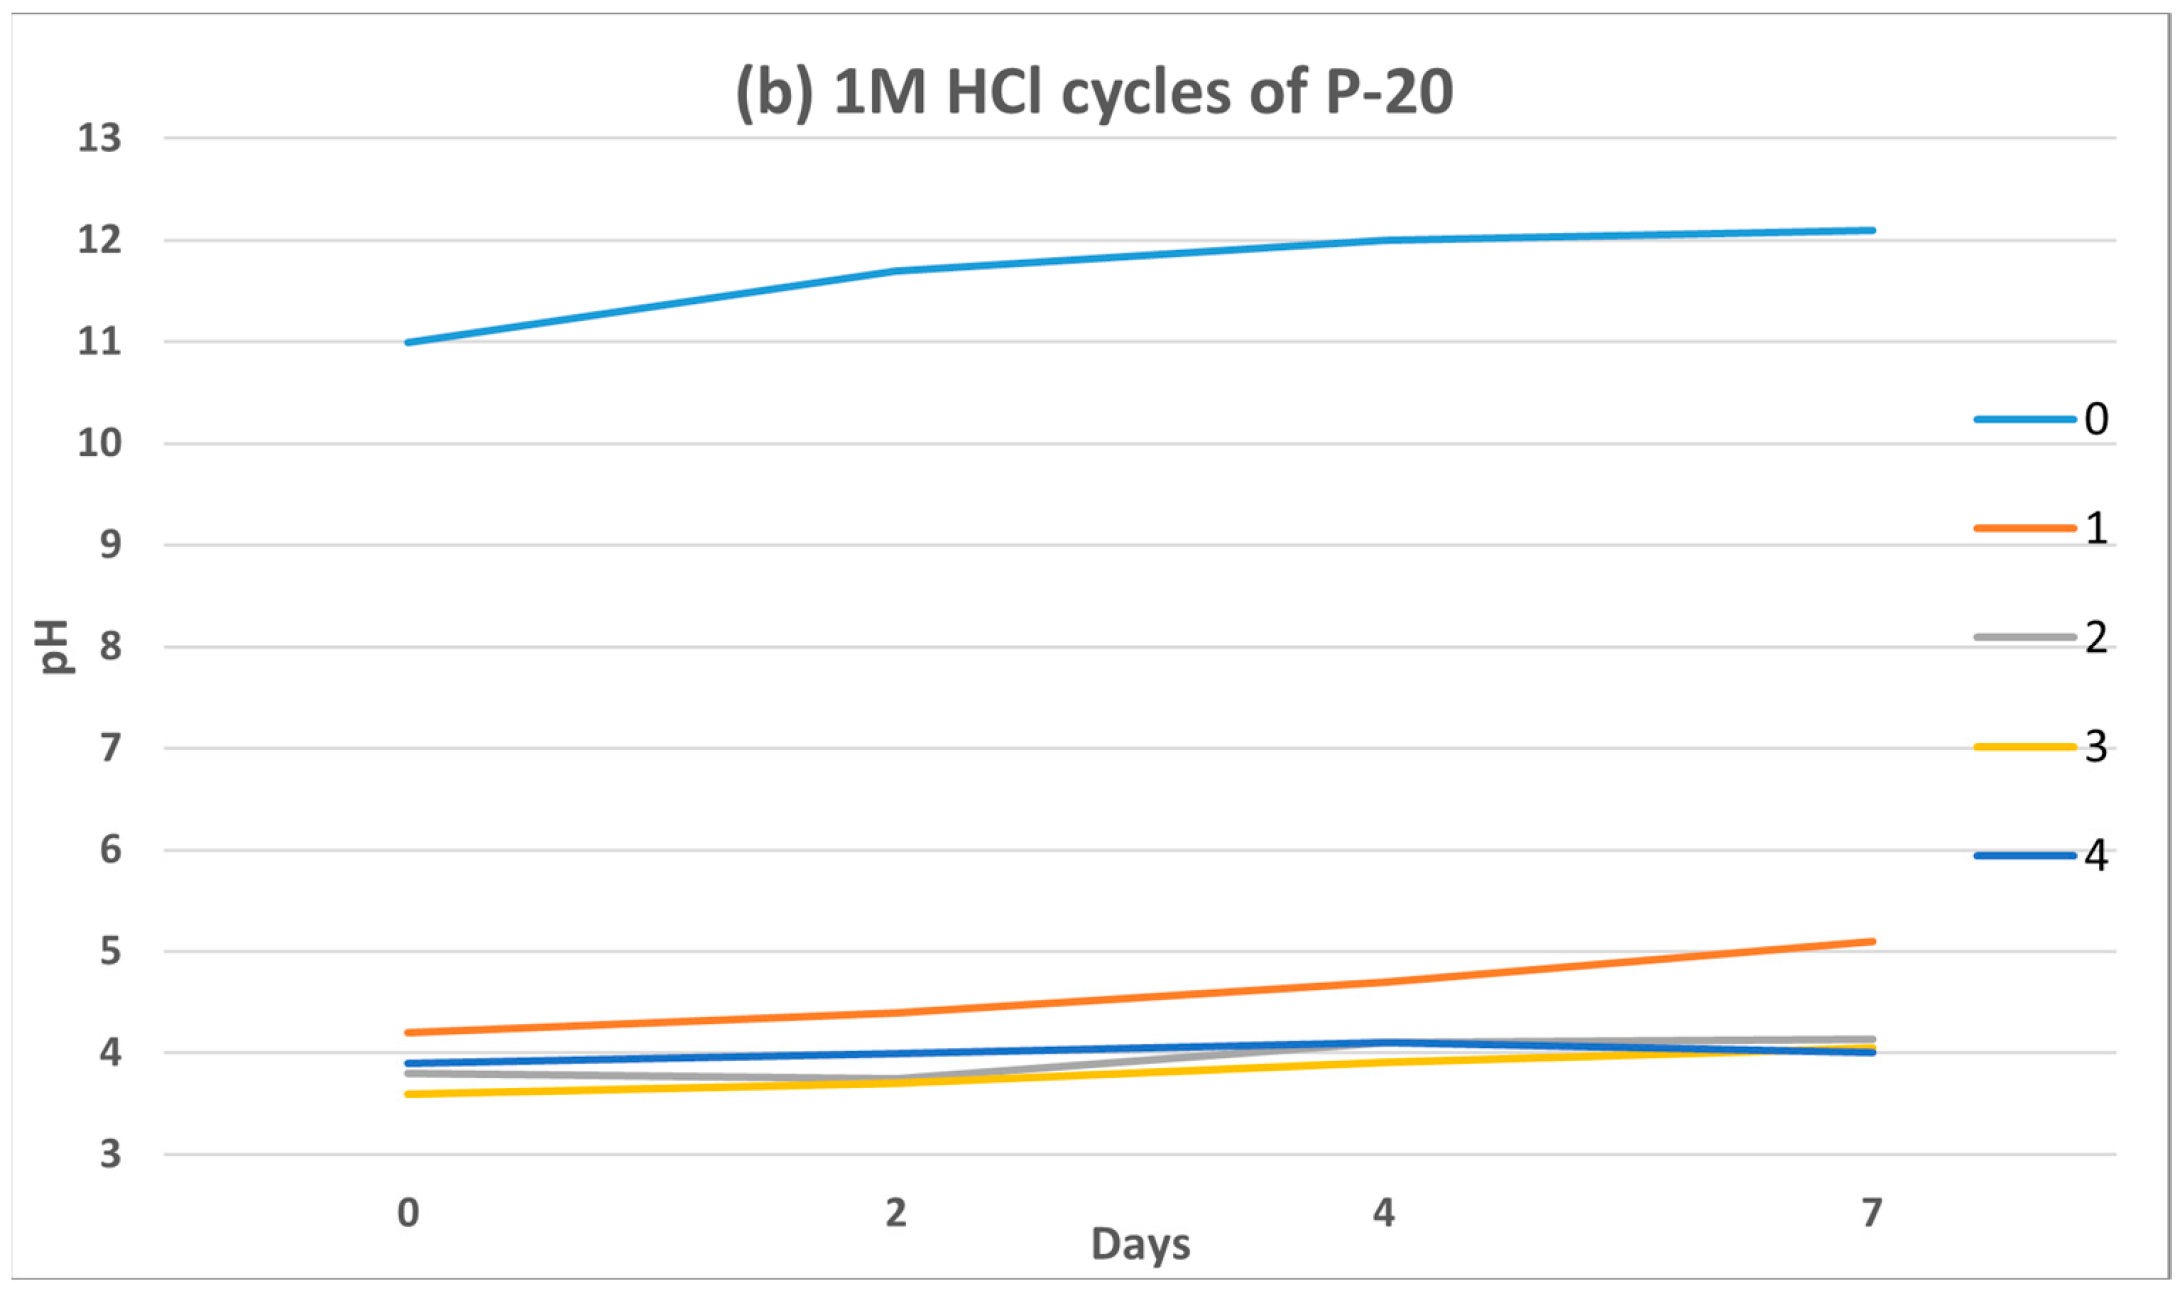
In order to diminish the P-20 effect on the leachate pH, two alternative acid treatments have been considered. It is well-known the good acid resistance properties of GP [71], maintaining their consistency and mechanical integrity after acid attack. Based on this, P-20 was immersed for 2 h in (a) 0.1 N glacial acetic acid (weak acid) and (b) 1 M hydrochloric acid (strong acid) during 4 cycles. Results obtained after 7 days are depicted in Figure 9.
The acetic acid (pH = 2.9) produced a complete neutralization of the structure from the beginning of the test, reaching a pH close to 7. In the case of 1 M HCl (pH = 0) the drop was even more appreciable. According to Aly et al. [67], when GP is introduced into an strong acid solution (pH = 0), almost the 100% of the Na+ ions are released. It is possible to promote an ion exchange between Na+ and H+, and the protons to become part of the sialate structure of P-20. However, it is observed that the predominant trend over time (0→7 days) is an increase in pH for both acids, so alkalis leaching is still present. As demonstrated by Zechynska-Hebda et al. [72], one month after hydrochloric acid immersion is required to stabilize at pH~7.
The results suggested that P-20 can be rinsed to drop the leachate pH without GP degradation in line with the environmental regulations for different wastewater streams, although further studies will be carried out on this regard.

3.2. Adsorption Testing

The effect of different variables in the adsorption process was measured, including the initial water pH, adsorbent dose, contact time and initial adsorbate concentration. 
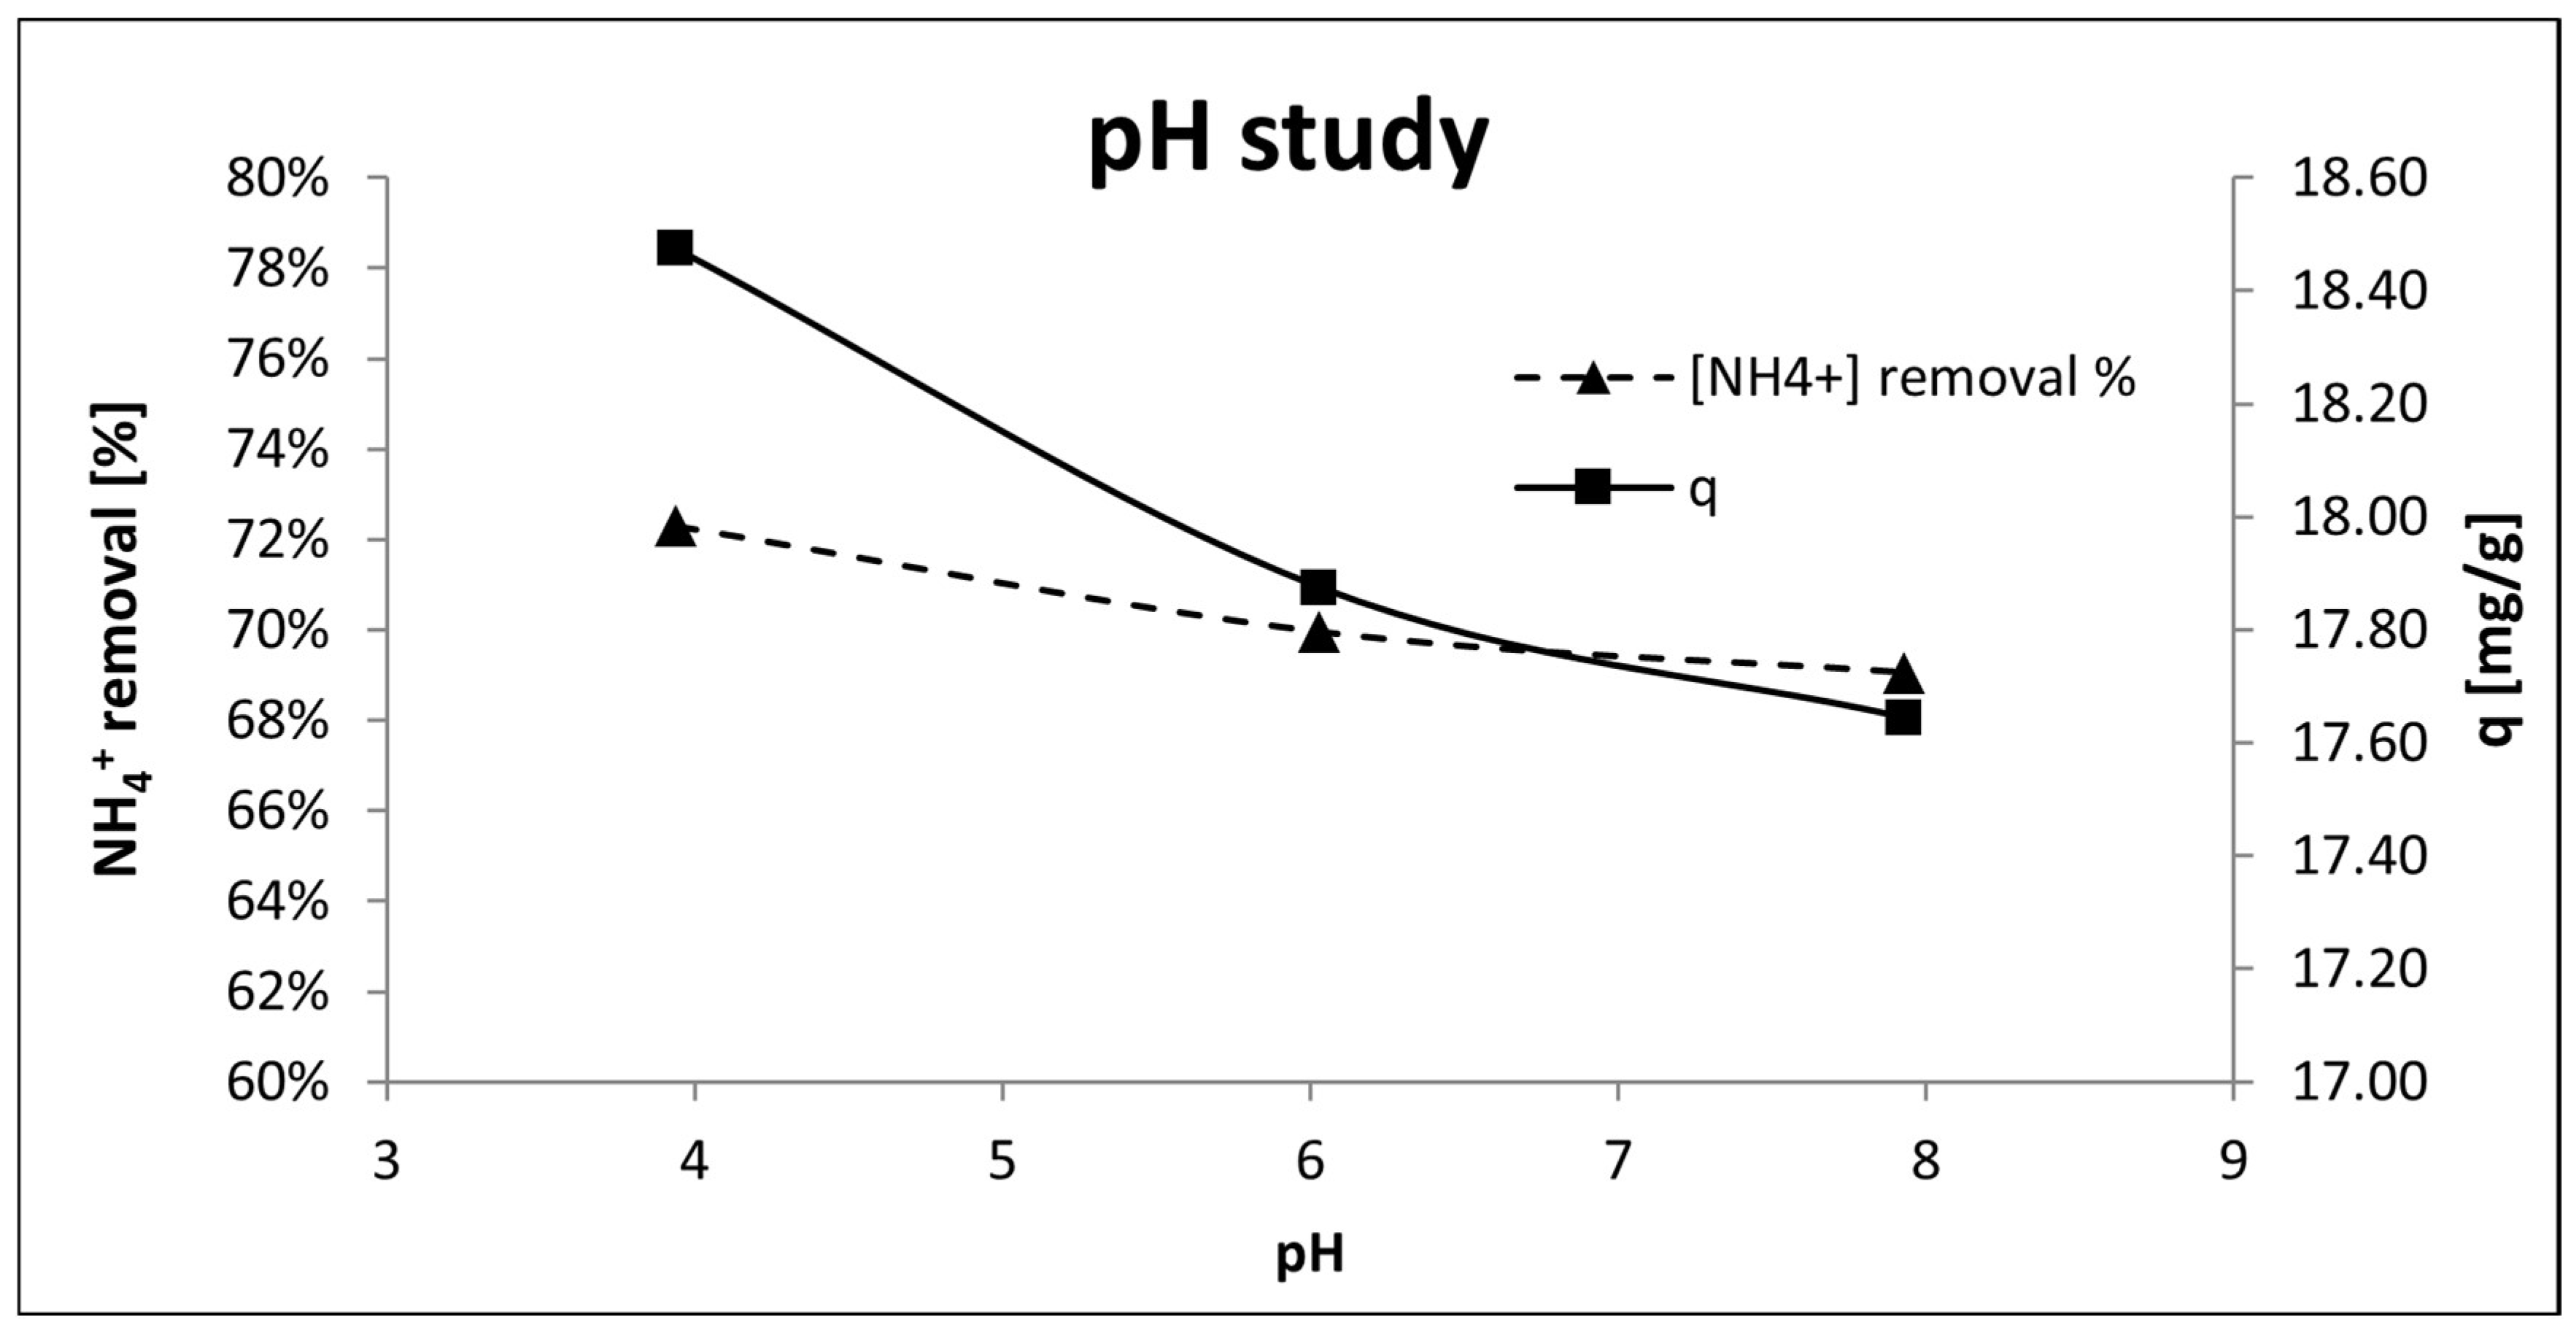
Figure 10 illustrates the initial pH effect on the adsorption capacity of P-20. There were no significant differences between the range of study (pH 4 to pH 8), however the more acid media suggested a slight improvement in the adsorption capacity (q) and NH4+ removal. There was a twofold explanation for this phenomenon: firstly, the more acidic medium promoted the greater Na+ release and thus, the more active sites available for NH4+ adsorption [67]. Secondly, the equilibrium ammonium-ammonia (NH3 ⇌ NH4+) is pH-dependent. A decrease in pH caused a displacement of the equilibrium favoring ammonium production generating a higher amount of adsorbate available for the adsorption process. However, it should not be ruled out that H+ ions may also act as competing cations, as Yi Liu et al. [73] showed with a phosphoric acid-based geopolymer that decreased its efficiency in acidic medium to remove Pb(II), Cd(II) and Ni(II). Therefore, further studies are needed to clarify the effect of pH on NH4+ removal.
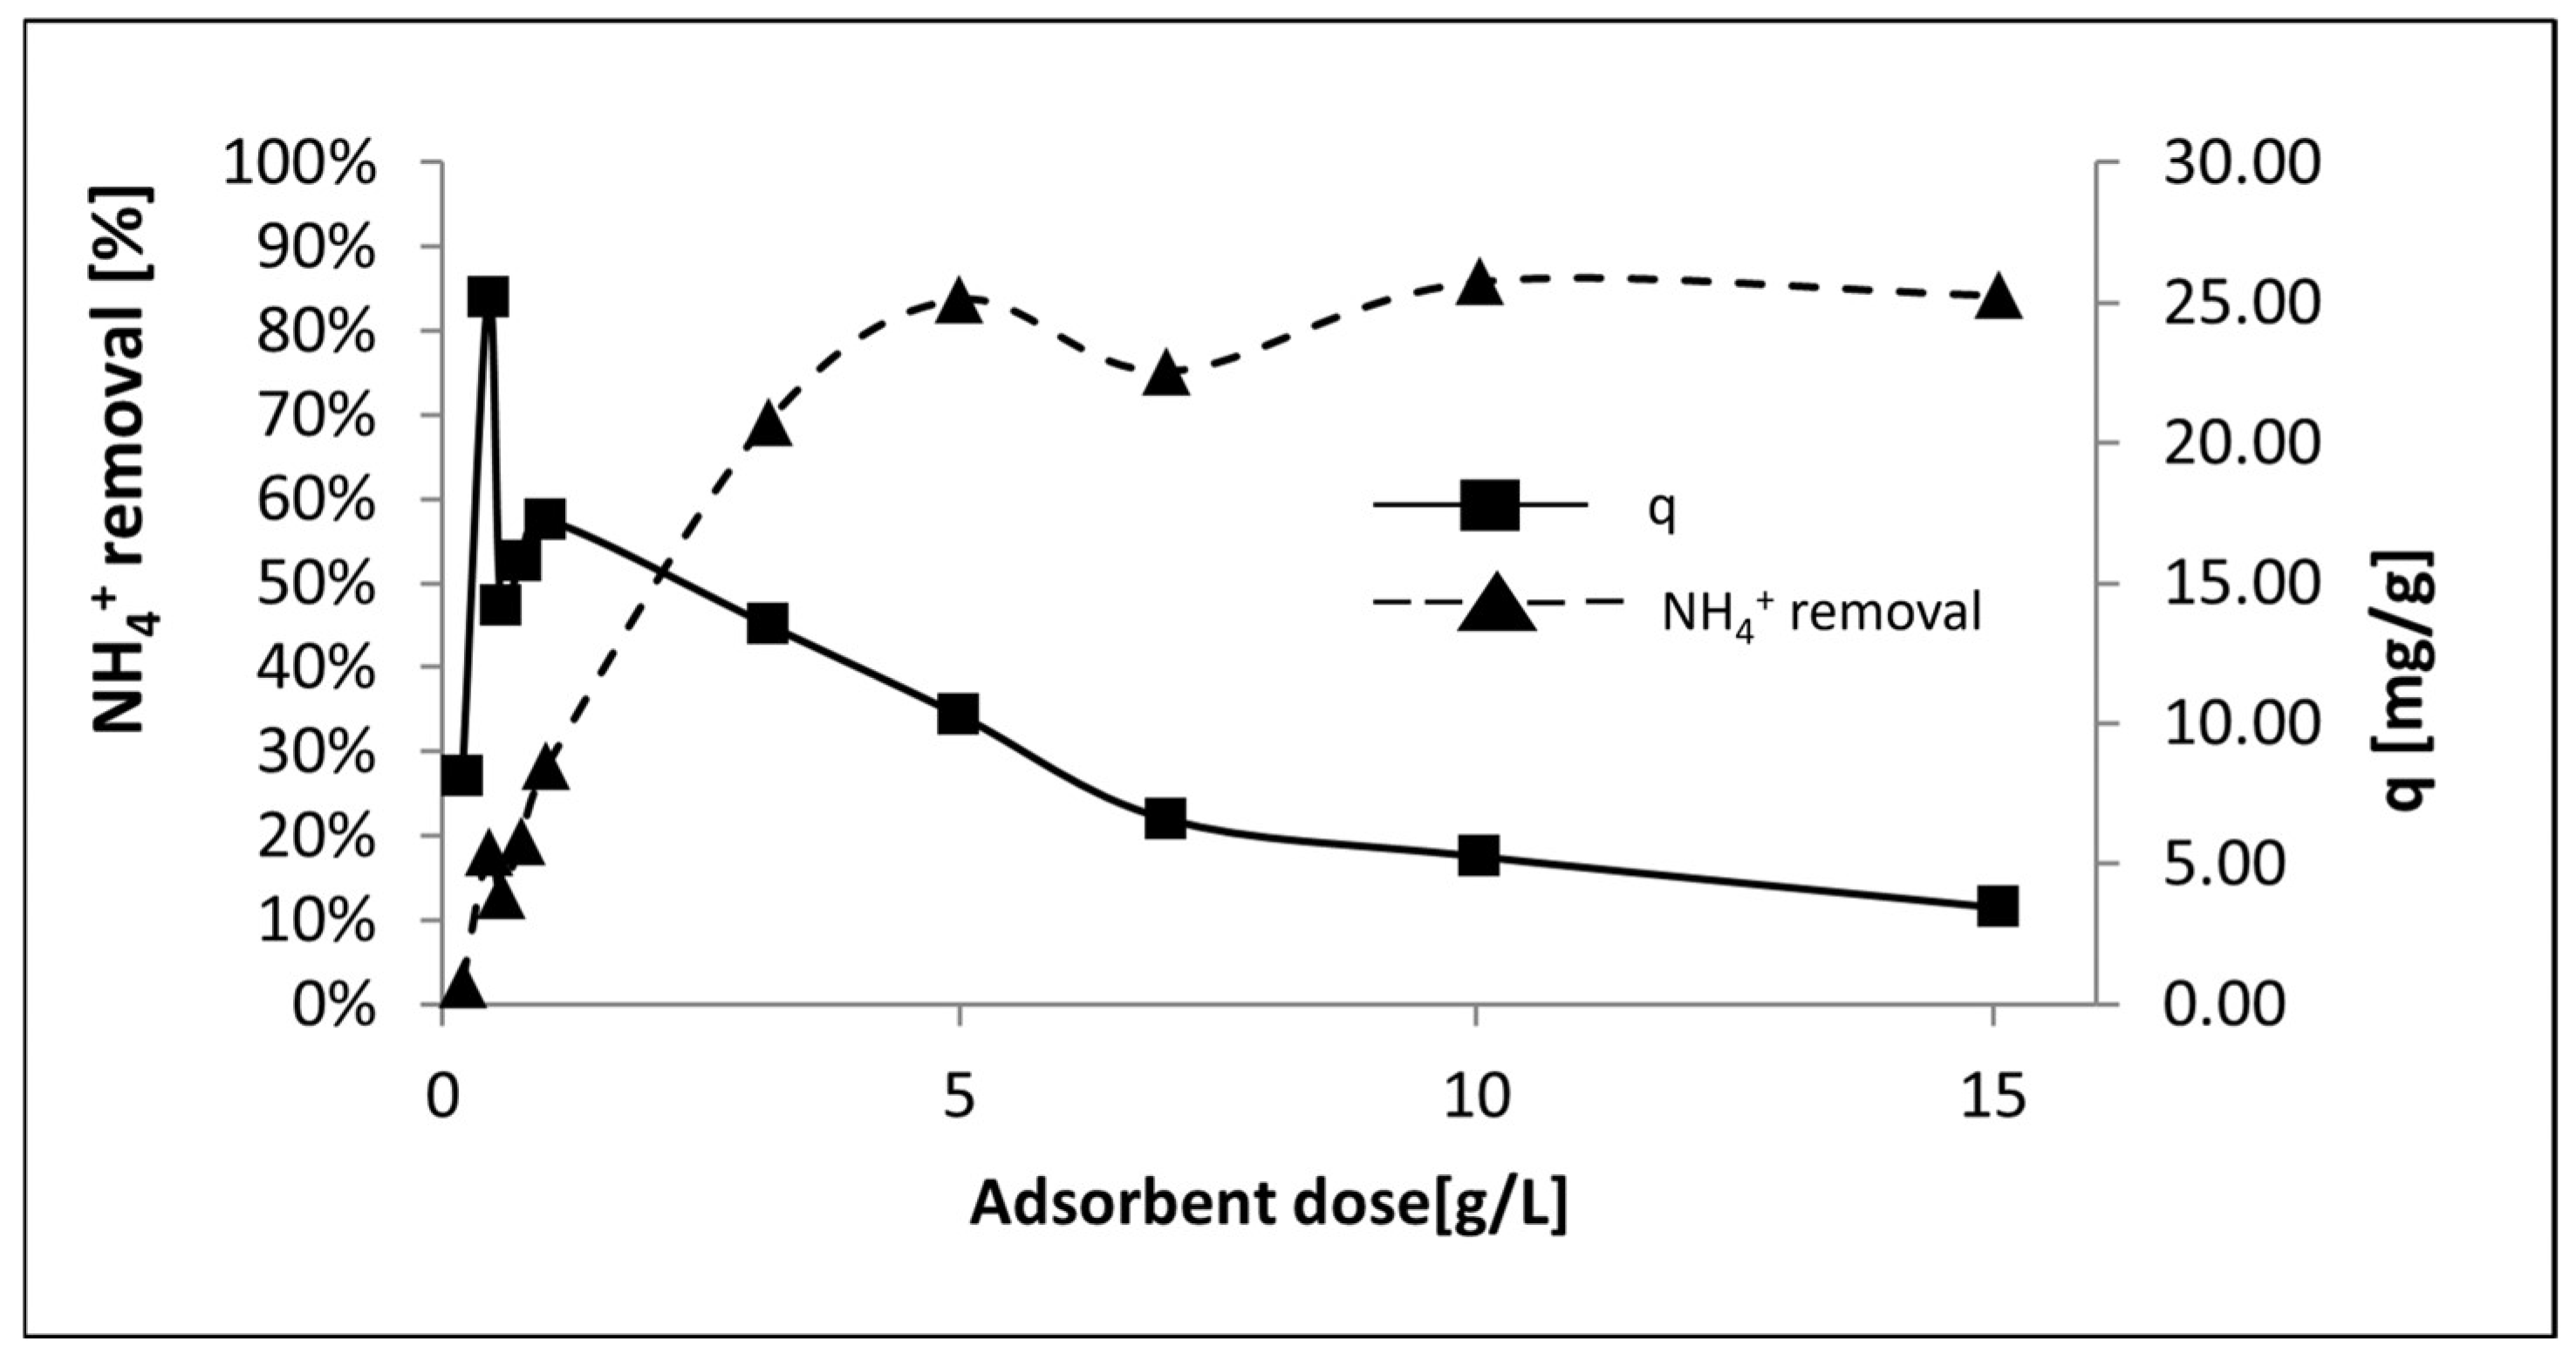
The optimal adsorbent dose (g P-20/ L) was also evaluated in Figure 11. On one hand, the results showed that the increase of the adsorbent dose up to 5 g/L promoted an increment of the NH4+ removal up to 80%. From this point, at higher GP dose, the removal levels kept similar according to Luukkonen et al. [44]. On the other hand, adsorption capacity reached a maximum of 25.17 mg/g at 0.44 g/L and then decreased gradually. This trend was attributable to over-crowding of the adsorption sites and more unsaturated active sites on the adsorbent surface as the adsorbent dose increased [74].
The effect of the contact time (1→1000 min) between the adsorbent and the adsorbate is depicted in Figure 12. The removal efficiency and adsorption capacity increased rapidly in the first 200 min obtaining 65.5% of NH4+ removal and q = 24 mg/g. Thereafter, the adsorption efficiency increased slowly reaching maximum adsorption capacity of 28.18 mg/g at 1000 min. Therefore, the general trend was growing, being faster at the beginning of the procedure. These results improved the results reported in [43,44] reaching a stabilization/saturation at 30–90 min and 120 min respectively whereas P-20 started to partially saturate after 200 min.
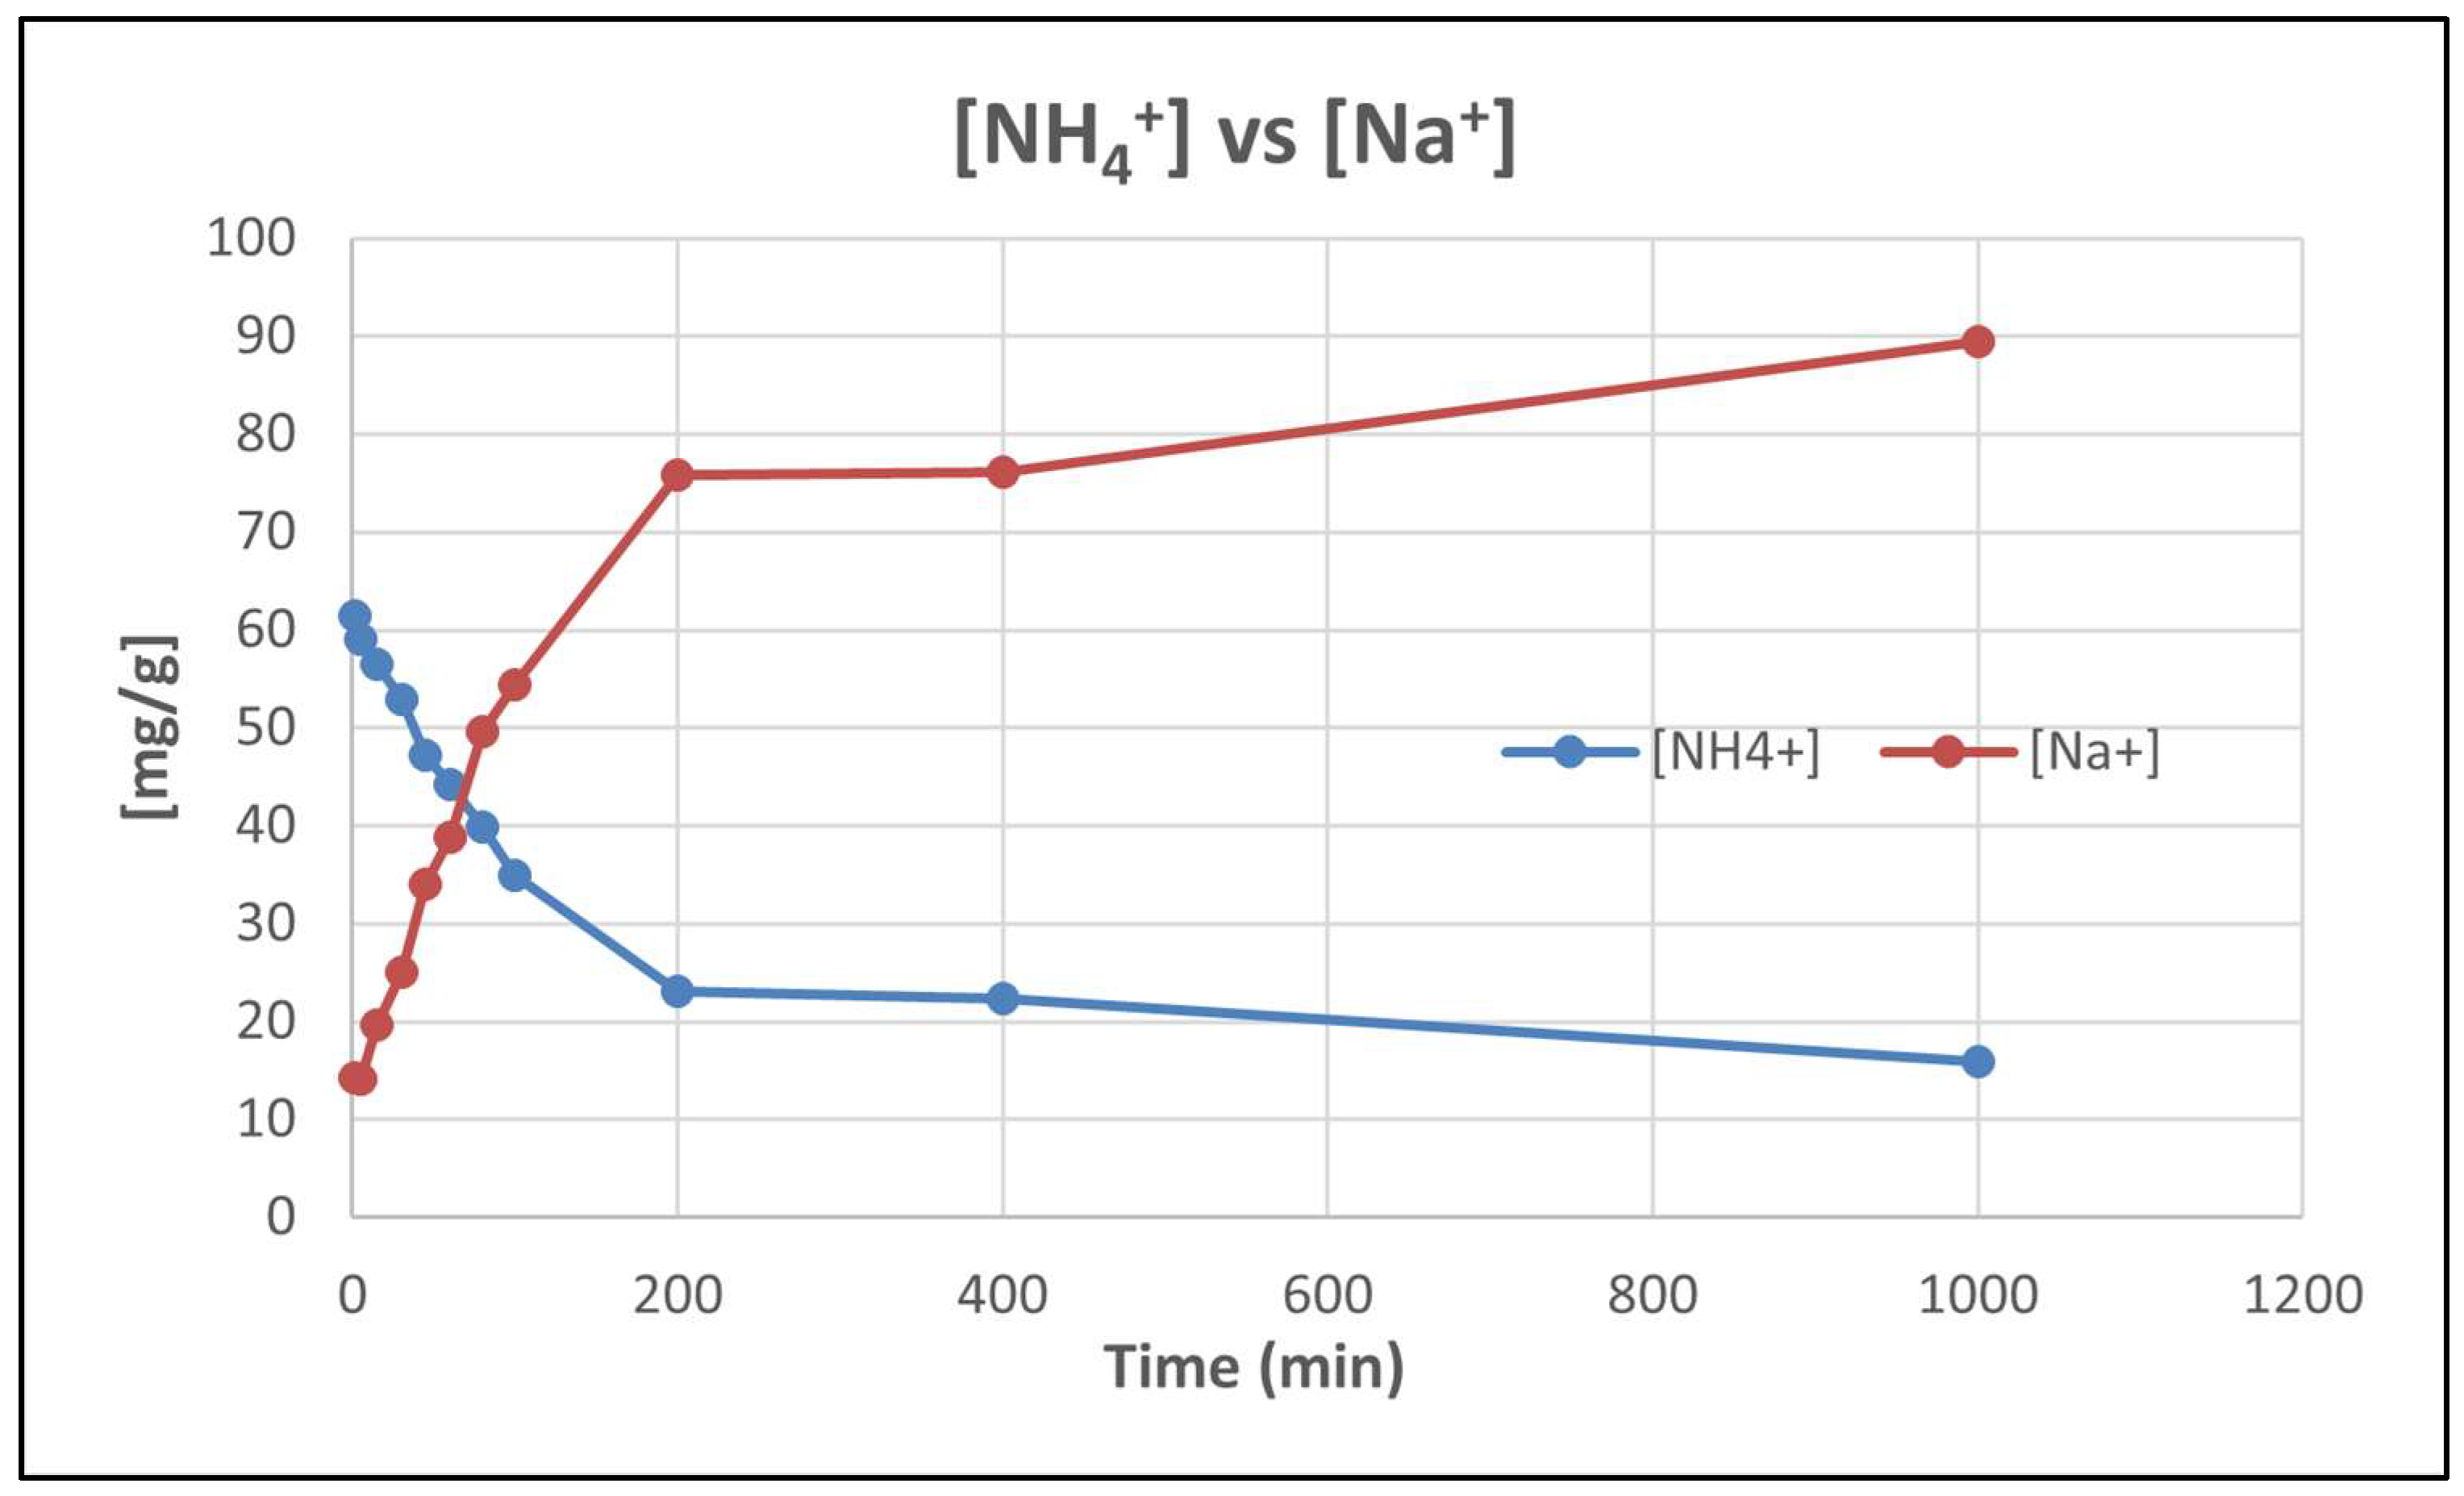
In the same experiment, the drop in [NH4+] and the increase in [Na+] were monitored (Figure 13). The NH4+ concentration decreased from the initial 65 mg/g to 15.9 mg/g whereas [Na+] increased from 14.3 to 89.50 mg/g following a similar correlation. These results clearly showed that the ion exchange process between NH4+ and Na+ was taking place.
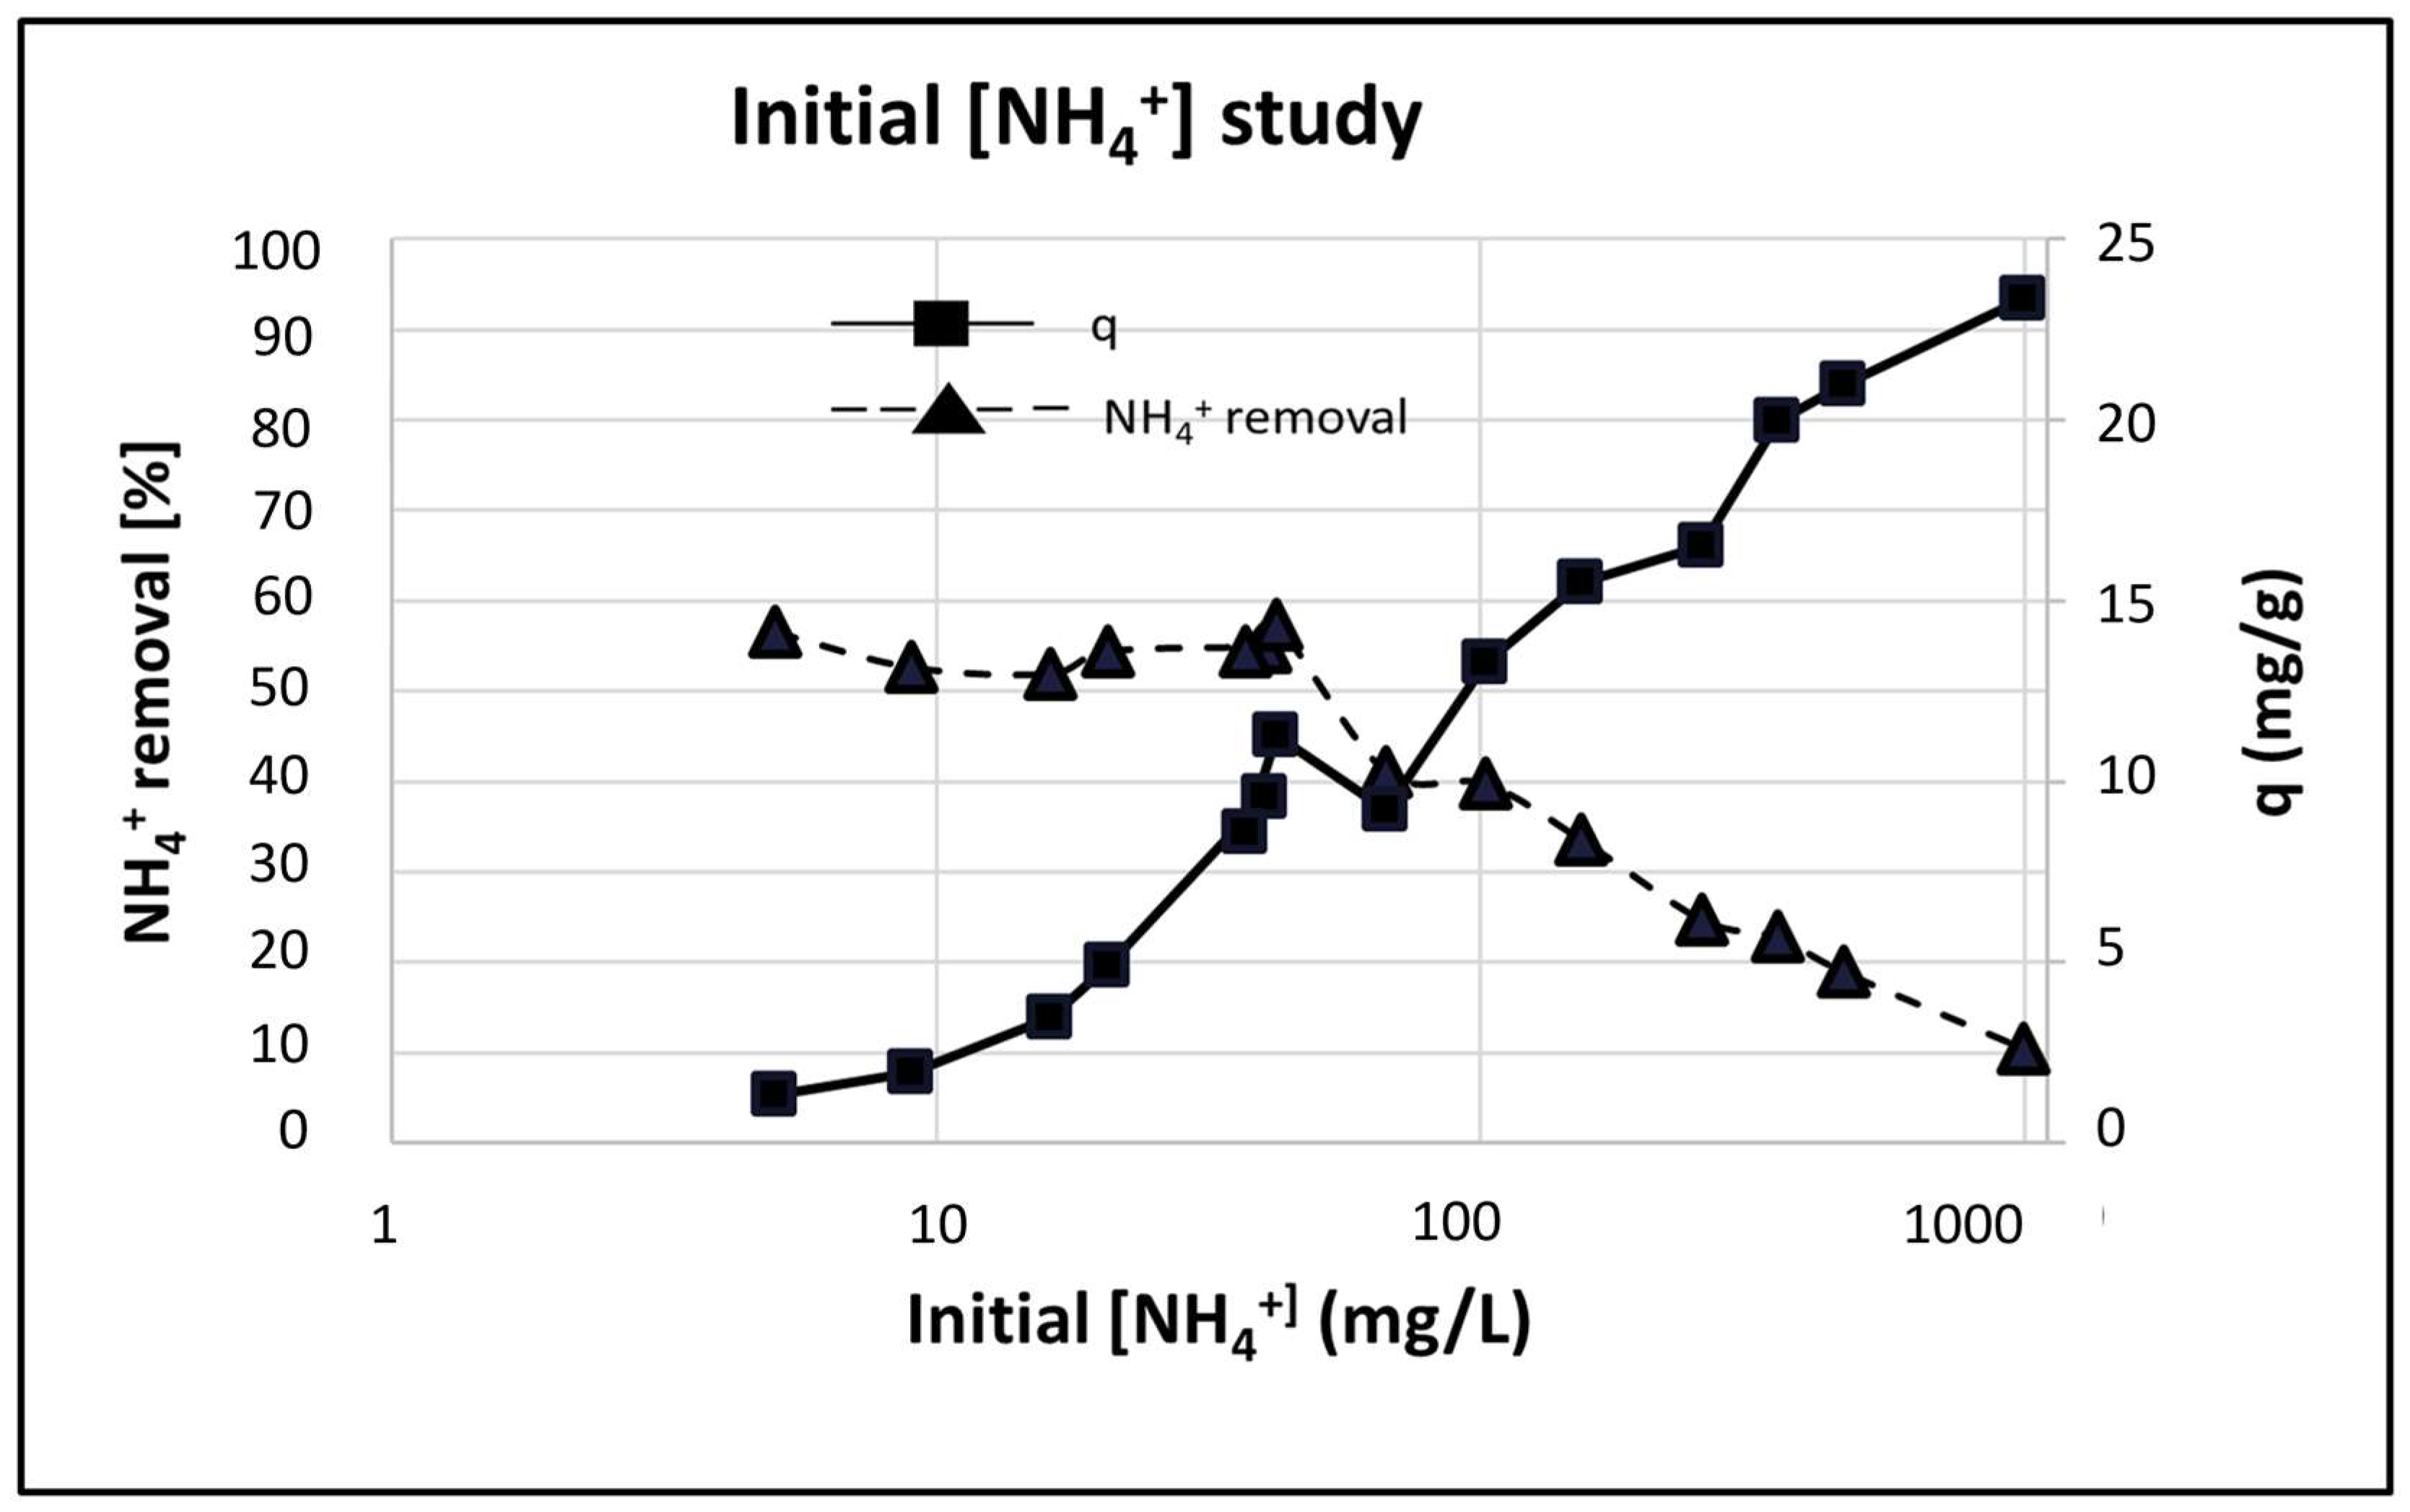
Adsorbent characteristics of P-20 were measured by varying the initial ammonium concentration from 10 mg/L to 1000 mg/L and was represented in logarithmic scale in Figure 14. When the initial NH4+ concentration increased, the NH4+ removal efficiency decreased from 60 to 10%. However, the adsorption capacity increased from 1 to 24.8 mg/g as the initial NH4+ concentration increased. Sanguanpak et al. [43] obtained the same effect and determined that higher initial NH4+ concentrations enhanced the adsorption uptake as the mass transfer driving force of NH4+ between the geopolymer adsorbent and the aqueous solution increased.
These experimental data were used to carry out the adsorption mechanism characterization (isotherm and kinetics).
Typically, adsorption processes are studied from equilibrium equations denominated adsorption isotherms. These equations allow to know, at equilibrium, the amount of adsorbed ion, as a function ion concentration at a constant temperature. The data from the initial contaminant concentration effect test will be used to fit the different isothermal models using the iteration method. Five isotherm models (two parameters: Langmuir [48] and Freundlich [49]; three parameters: Langmuir-Freundlich [50], Redlich-Peterson [51] and Tóth [52]) were tested for modelling the adsorption mechanisms of P-20. The parameters shown in these isotherms are mostly common to the different models: (a) the maximum capacity (qm), (b) the dimensionless parameter b, indicative of the adsorption energy and (c) the dimensionless parameter n which represents the heterogeneity of the adsorbent surface.
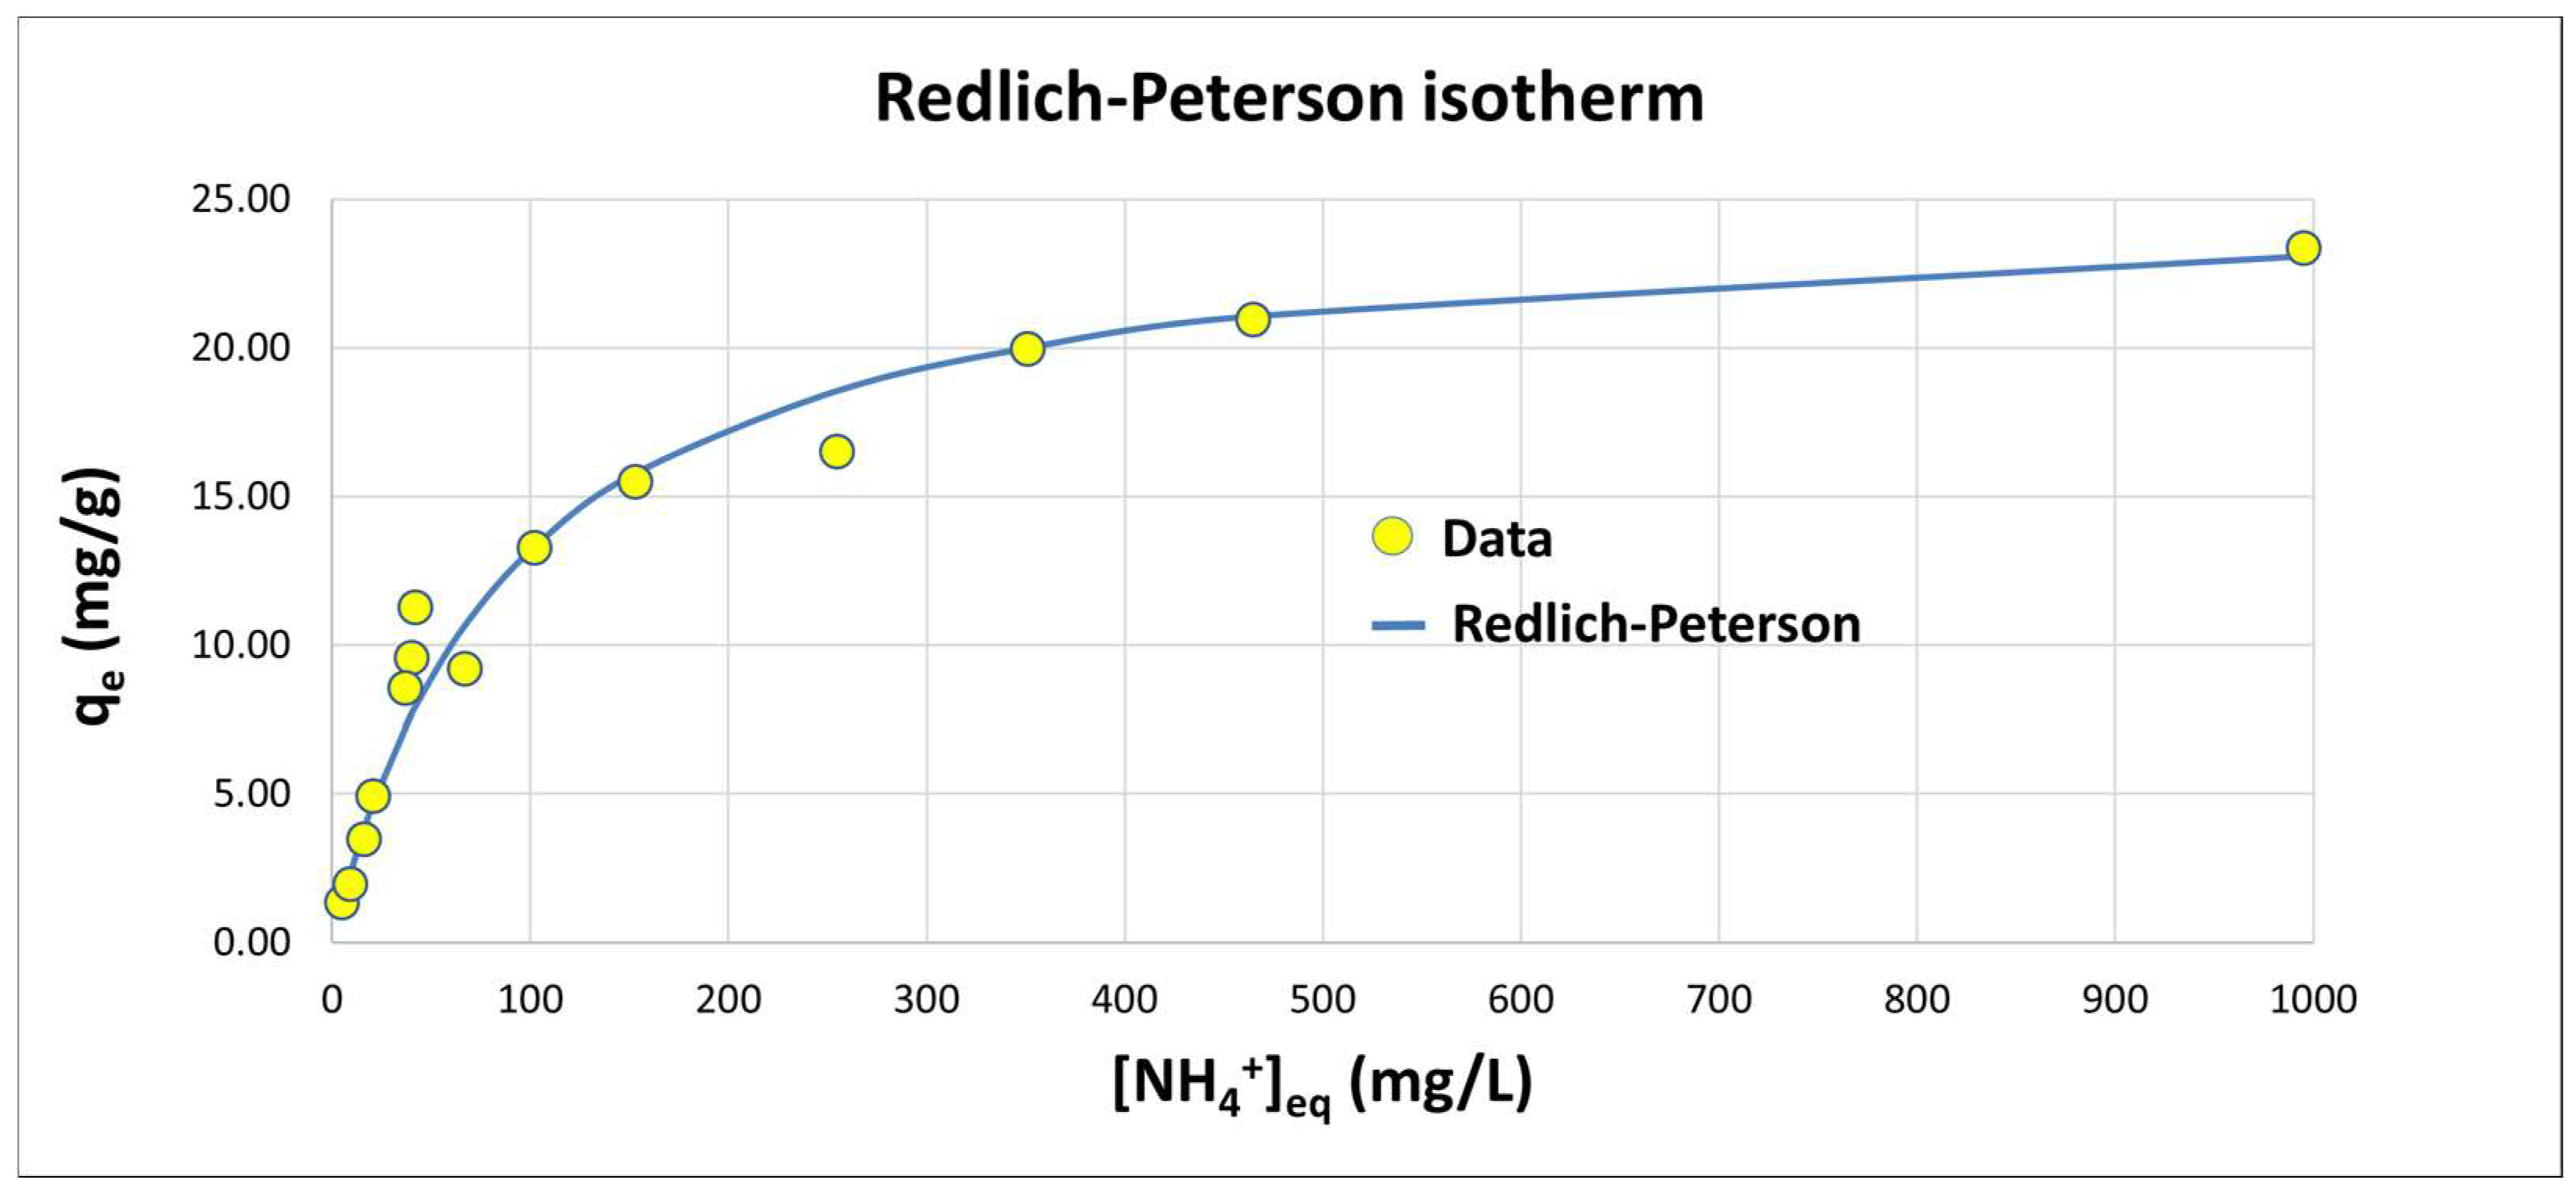
The isotherms models were evaluated by RSME (error measure) and by R2 (goodness). The best fit was achieved with the Redlich-Peterson (RP) equation according to the high value of correlation coefficient as detailed in Table 7 and Figure 15.
RP is an empirical isotherm incorporating three parameters and combines elements from both Langmuir and Freundlich equations; therefore, the mechanism of adsorption is a mix and does not follow ideal monolayer adsorption. With this model, equation number 10 was obtained with the following values for the parameters: qm = 18.35 mg/g, lower than if compared to the experimental data (28.18 mg/g and 24.8 mg/g in contact time and initial [NH4+] experiments respectively); b = 0.02, indicative of the affinity of the binding sites, and n = 0.9 (this value, close to 1, indicated that the adsorption on the surface was homogeneous which supported Langmuir assumption [75]).
q = 18.35     0.02 c 0.9 1 + 0.02 c 0.9
Previous reported works on heavy metal adsorption with GPs [34,76] have shown the good fit of the RP isotherm to explain the adsorption process.
These results contrast with those reported by Sanguanpak et al. [43] and Luukkonen et al. [44]. The former obtained that the best isotherm was the Freundlich model while P-20 did not show an acceptable fit. The latter obtained the best fit with the Langmuir-Freundlich (i.e., Sips) model. In this work, Sips isotherm could also explain the adsorption process, as well as Tóth. With these two models, qm = 26.098 mg/g and 27.645 mg/g were obtained respectively, as summarized in Table 8. These values were higher than the capacity obtained with RP model and closer to the experimental data. The shape of the curve in the three best models (RP, Toth and Sips) indicated that the NH4+ was disposed on the GP surface as a monolayer and with strong attraction between molecules. However, it did not become asymptotic at high concentrations, so a physical-chemical adsorption mechanism was suggested [77].
The value of qm obtained with the RP isotherm model was higher than that of most natural zeolites: clinoptilolite (2.27 mg/g and 6.96 mg/g) [78,79], clinoptilolite-morderite (1.65 mg/g) [80], clinoptilolite-heulandite zeolite (14.42 mg/g) [42] and morderite (14.56 mg/g) [81] and some of synthetic zeolites: gismondite (3.17 mg/g) [82], NaP1, K–F and K-phillipsite/K-chabazite (7.02 mg/g) [83], zeolite 13× (8.61 mg/g) [84], thermal-treated clinoptilolite (10.61 mg/g) [79], microwave-treated clinoptilolite (11.59 mg/g) [79] and Na–P zeolite (16.36 mg/g) [85].
The equilibrium obtained with the above isotherm requires some time to be reached. The ions go through a series of processes until they reach the adsorbent surface, and the slowest ones determined the kinetics of the reaction. Adsorption kinetics provide insight into the reaction rate and the sorption mechanism involving mass transfer, diffusion, and reaction on the adsorbent surface during adsorption. The adsorption kinetics include 3 mass transfer processes [86,87,88]:
(1)
External diffusion (or film diffusion): the transfer of adsorbate in the liquid film around the adsorbent.
(2)
Internal diffusion (or intraparticle diffusion): the transfer of adsorbate (NH4+) through the pores of the adsorbent.
(3)
Adsorption onto active sites.
Various adsorption kinetic models such as pseudo-first-order, pseudo-second order, Elovich and Weber-Morris [53,54,55,56] were tested in this case.
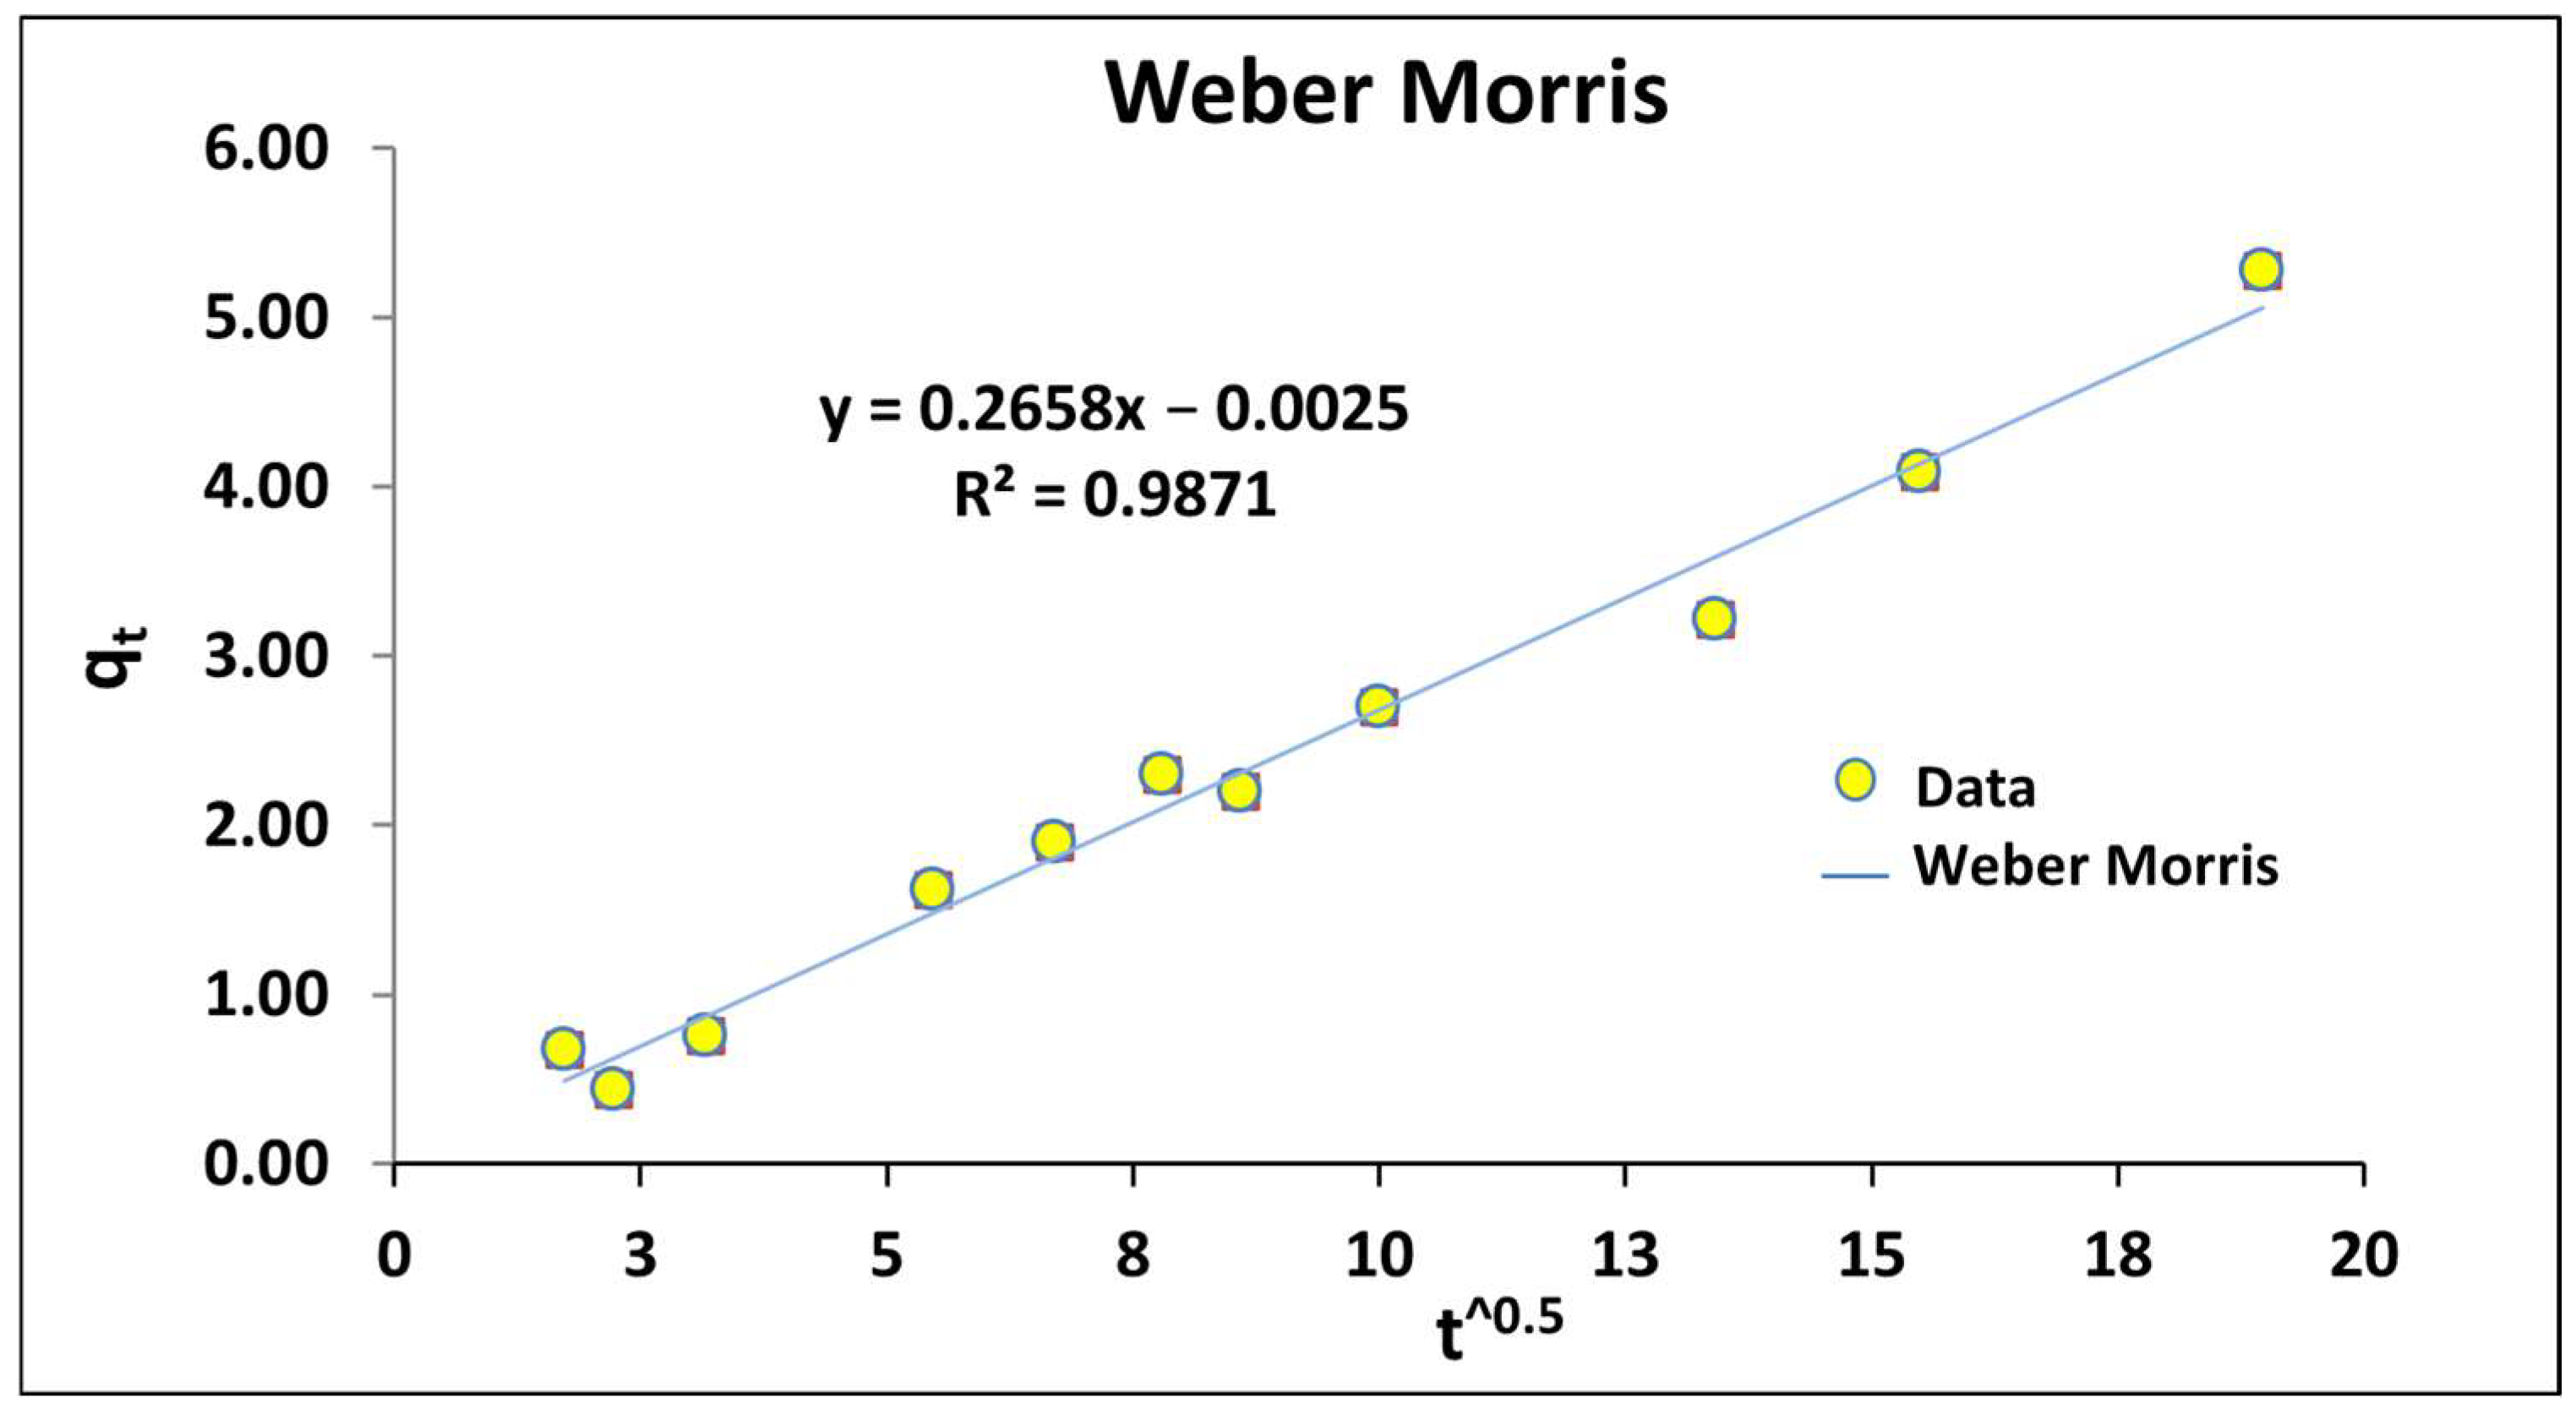
 Figure 16 and Table 8 detail the R2 of the fit with Weber Morris equation presenting the best results.
The Webber-Morris equation is the following:
qt = kit0.5 + C
According to the data of this study, the Equation (12) is obtained:
q = 0.2658 ∗ t0.5 − 0.003
The value of C (value of the equation for t = 0) close to 0 revealed that the limiting process was the intraparticle diffusion. Furthermore, the fit of the data did not present multilinearity. Considering the high porosity identified in P-20, the internal diffusion through porosity was identified as the limiting process [86,88].
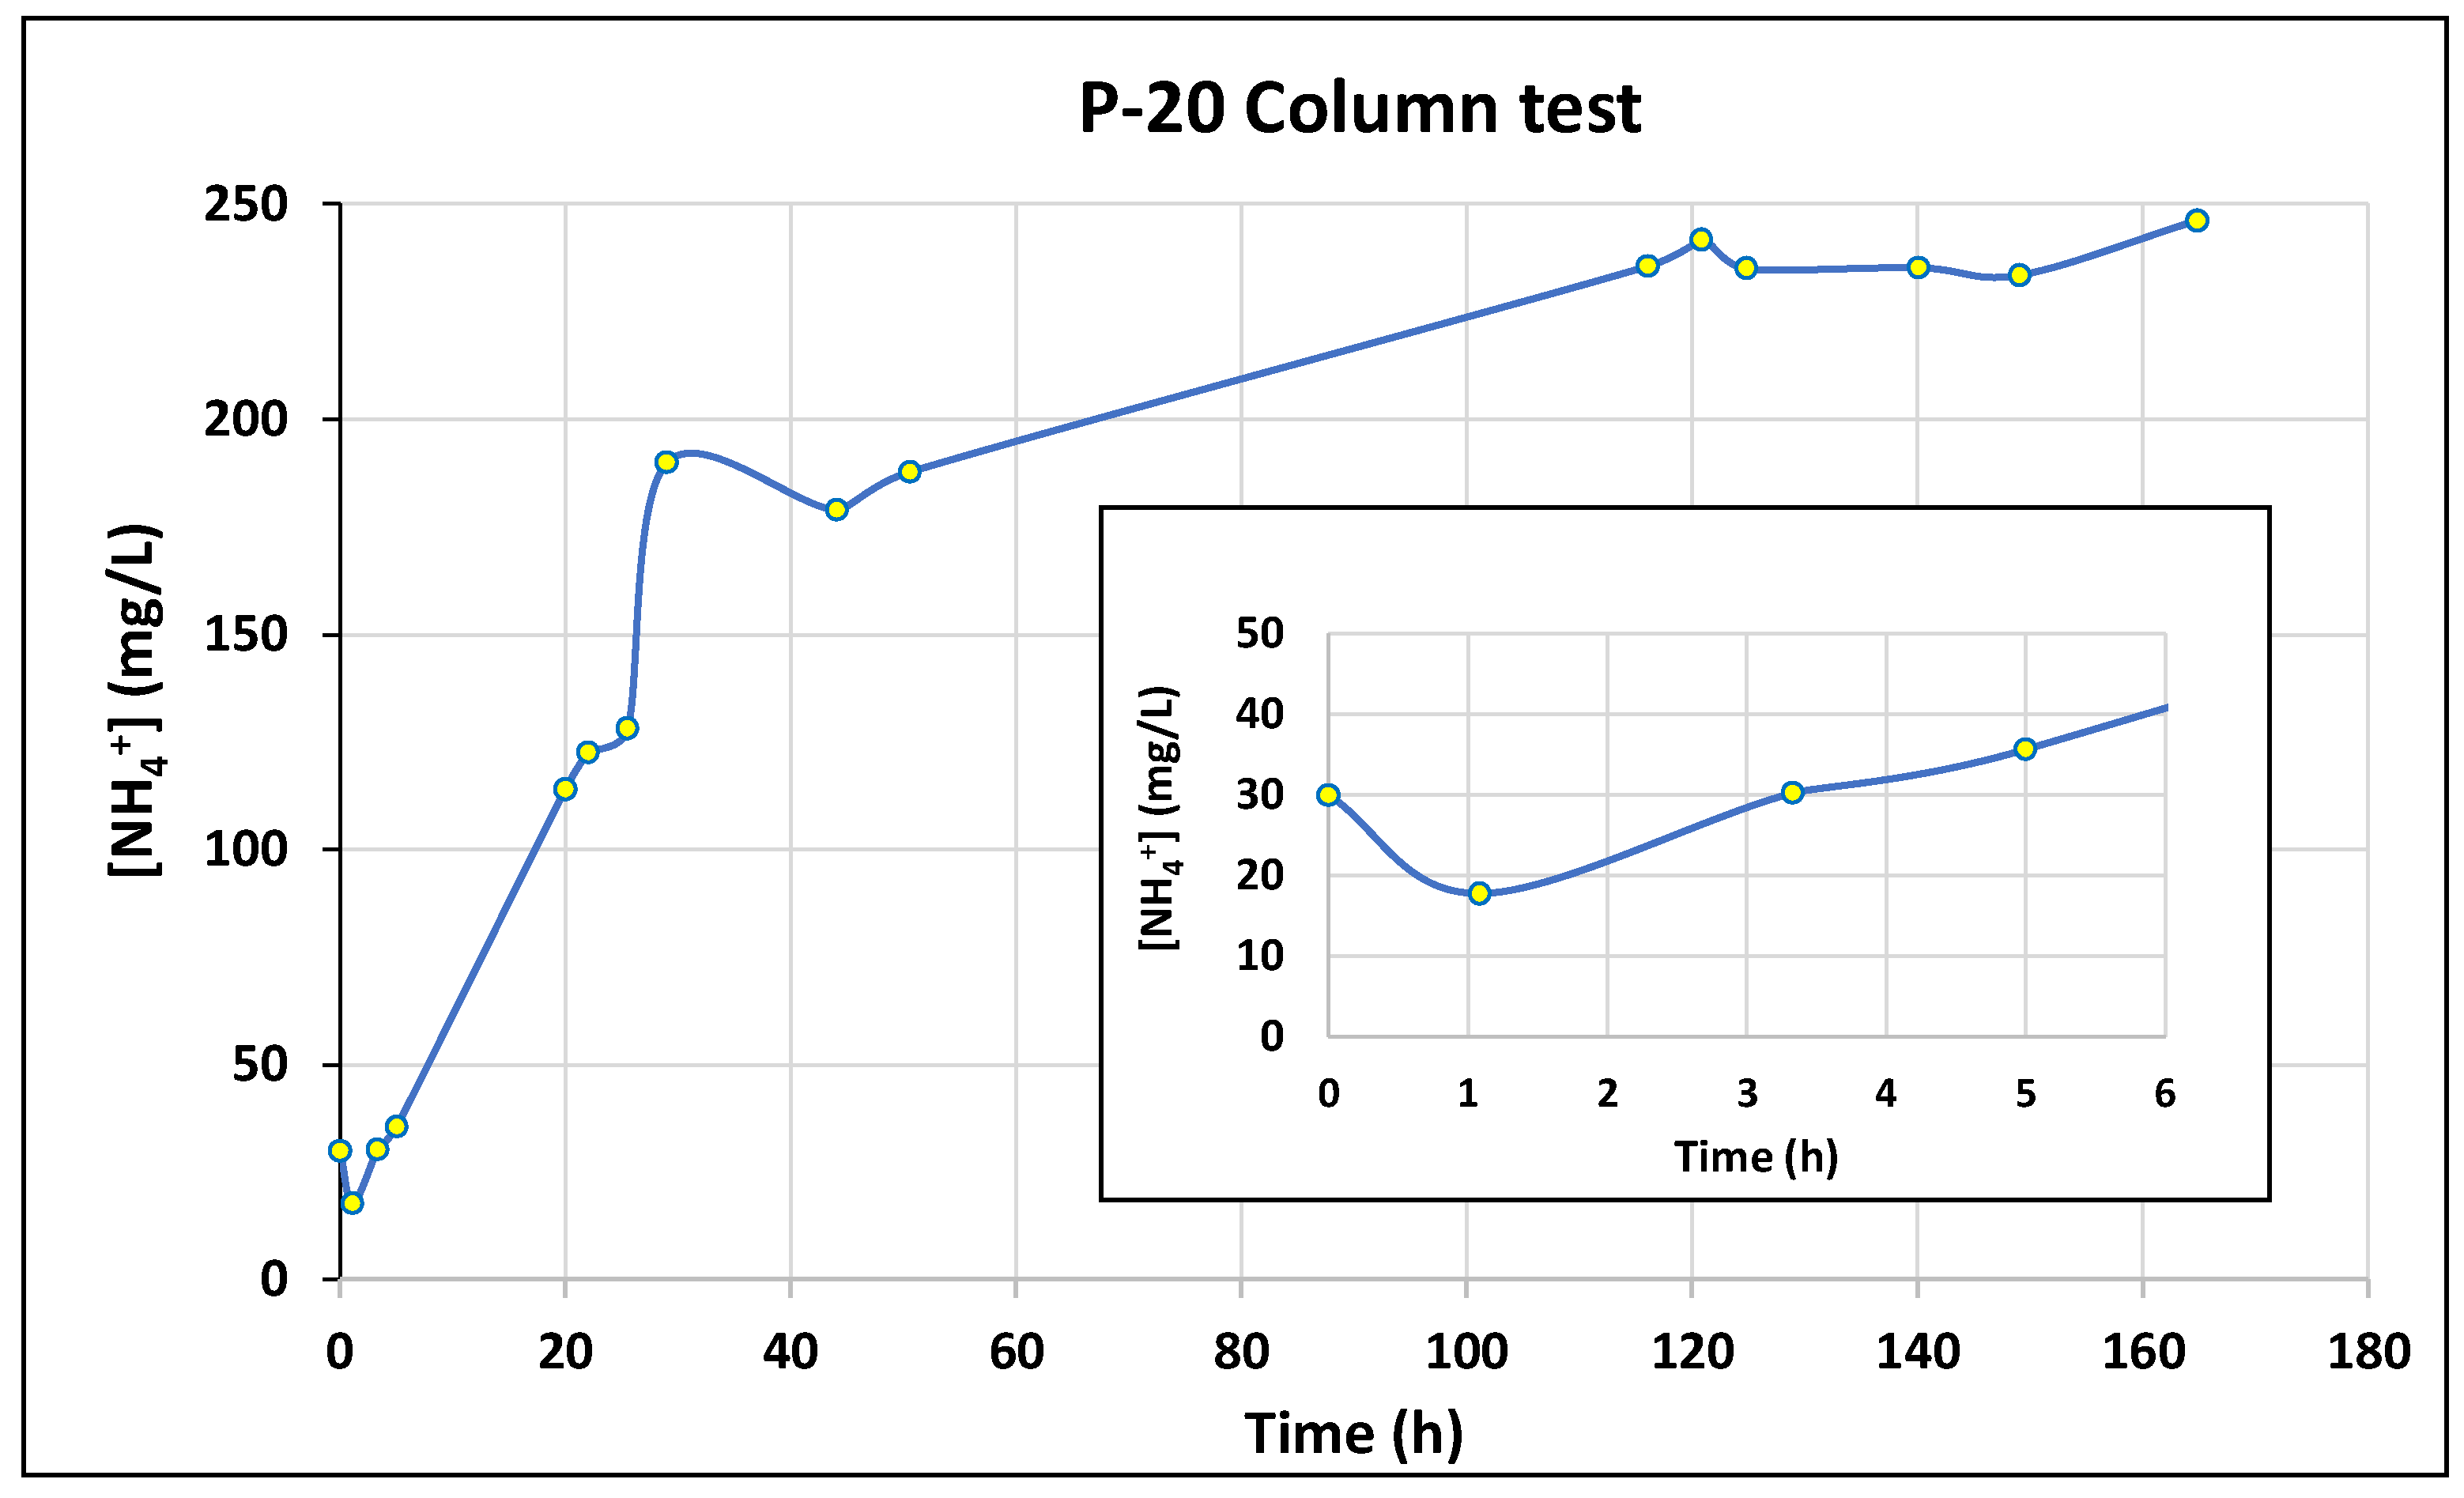
Figure 17 shows the results obtained of the column test carried out for 160 h with an initial concentration of 250 mg/L of NH4+. It can be observed that the concentration of NH4+ ions dropped sharply at the beginning of the test, around 17 mg/L, obtaining an outstanding NH4+ removal of 93% during the first hours. However, this value grew up to 123 mg/L at 25 h, being 50% the NH4+ removal. From then on, the output solution had an increasing concentration of contaminant, reaching almost an asymptote at 110 h indicating that the GP hardly retained NH4+ from the solution becoming saturated. Therefore, a regeneration process of P-20 for reuse should be considered after 110 h of adsorption treatment. The adsorption capacity obtained in this experiment was 25.24 mg/g similar to Langmuir-Freundlich and Tóth isotherms.

3.3. Validation in a Real Wastewater Pilot Plant

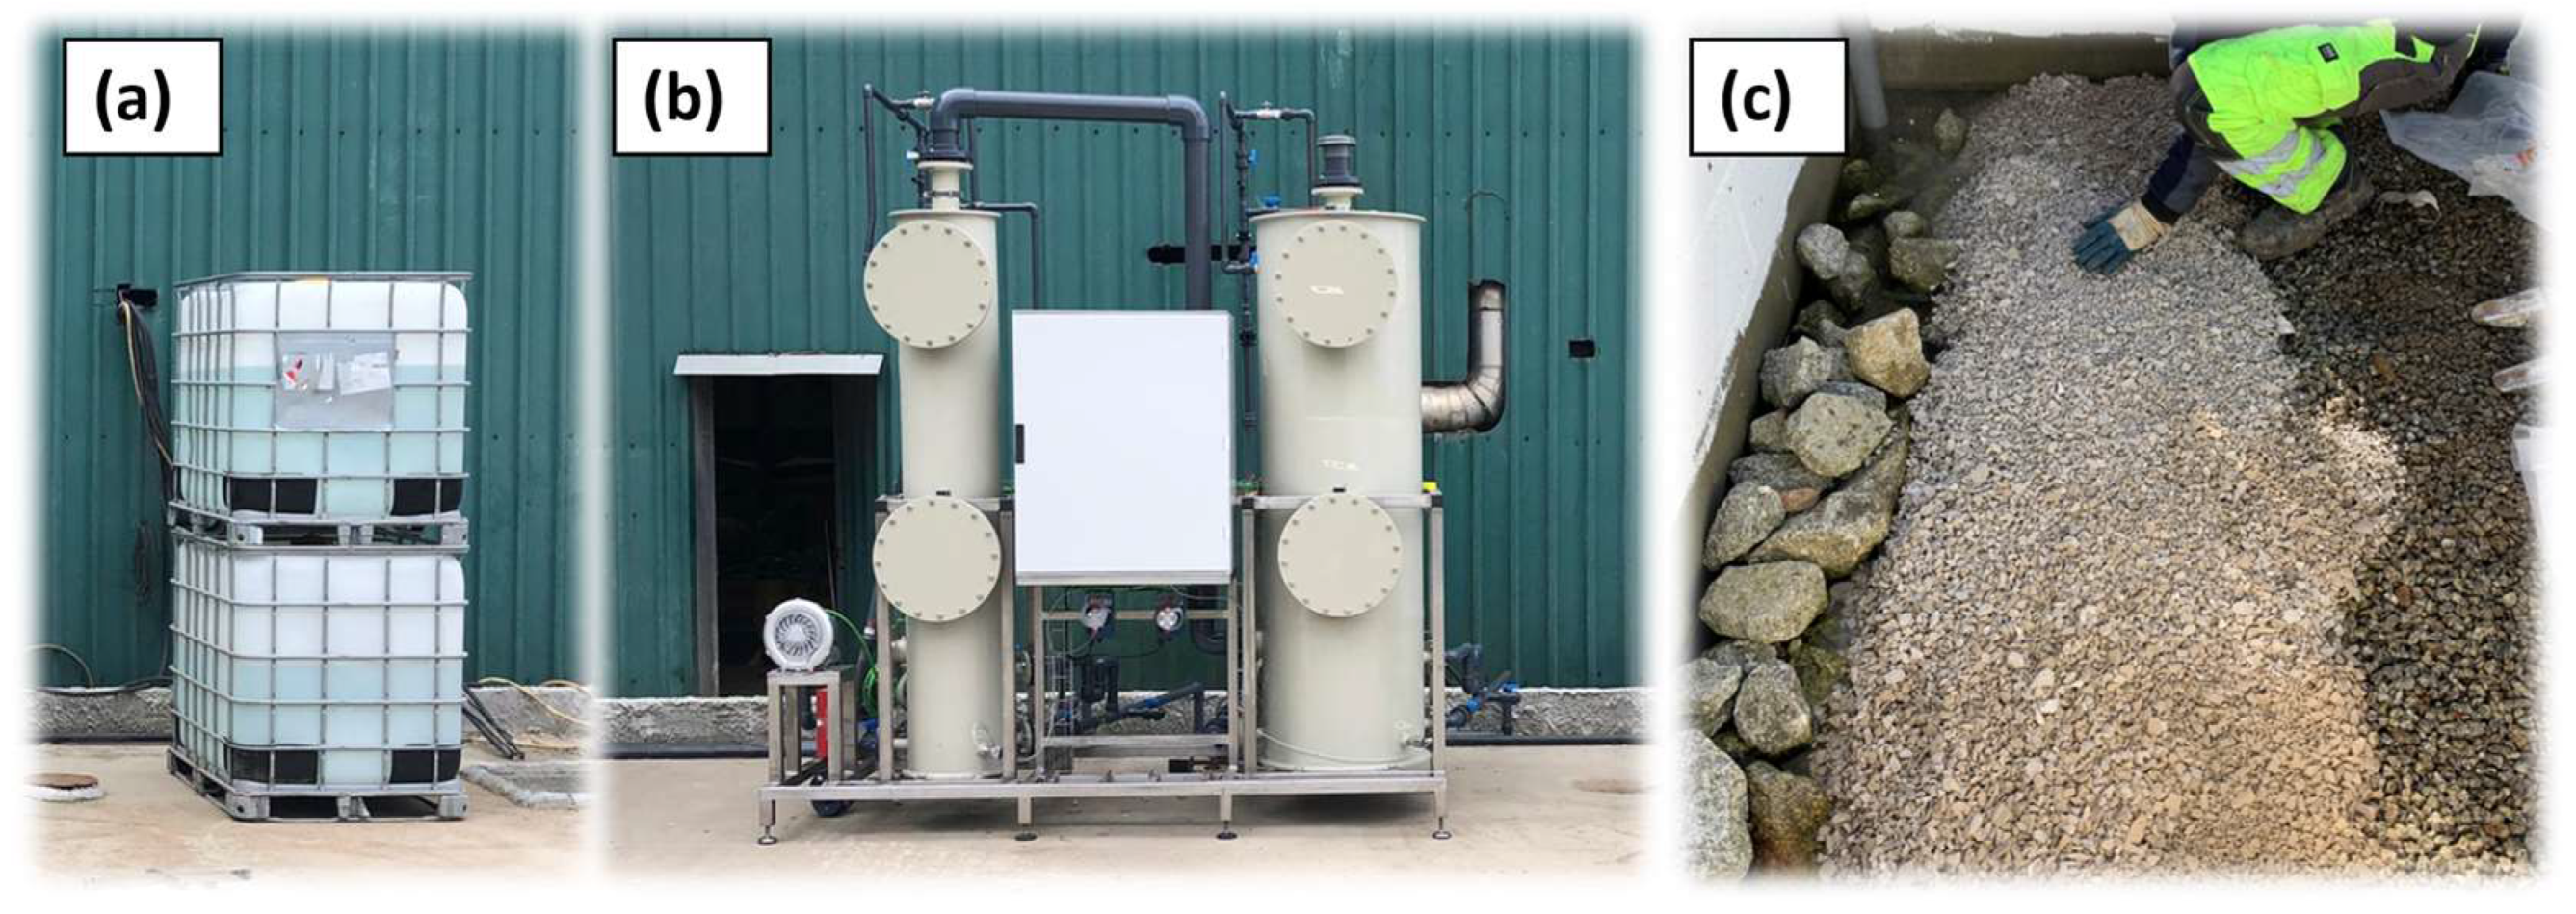
The pilot plant for wastewater treatment was designed at Xiloga S.L. landfill. The plant consisted of three key points as it can be seen in Figure 18.
The pilot plant started from the (a) tank containing the leachate detailed in Table 9. The composition presented a large content of suspended solids, organic matter and possible competitive ions. The temperature, pH and EC conditions were also very changeable as shown by the high standard deviation. The [NH4+] was high and variable with a mean value of 1978 mg/L. The (b) Air stripping system, the first filter of the plant, required high pH levels for high ammonium removal efficiency [89,90]. Ammonium reacts with water to form ammonium hydroxide. Thus, in ammonia stripping, lime or caustic is added to the wastewater until the pH reaches to 11.5–12.0 which converts ammonium hydroxide ions to ammonia gas (NH4OH → NH3 + H2O). The last area of the designed plant consisted of a (c) vertical wetland where 125 L of P-20 were deposited.
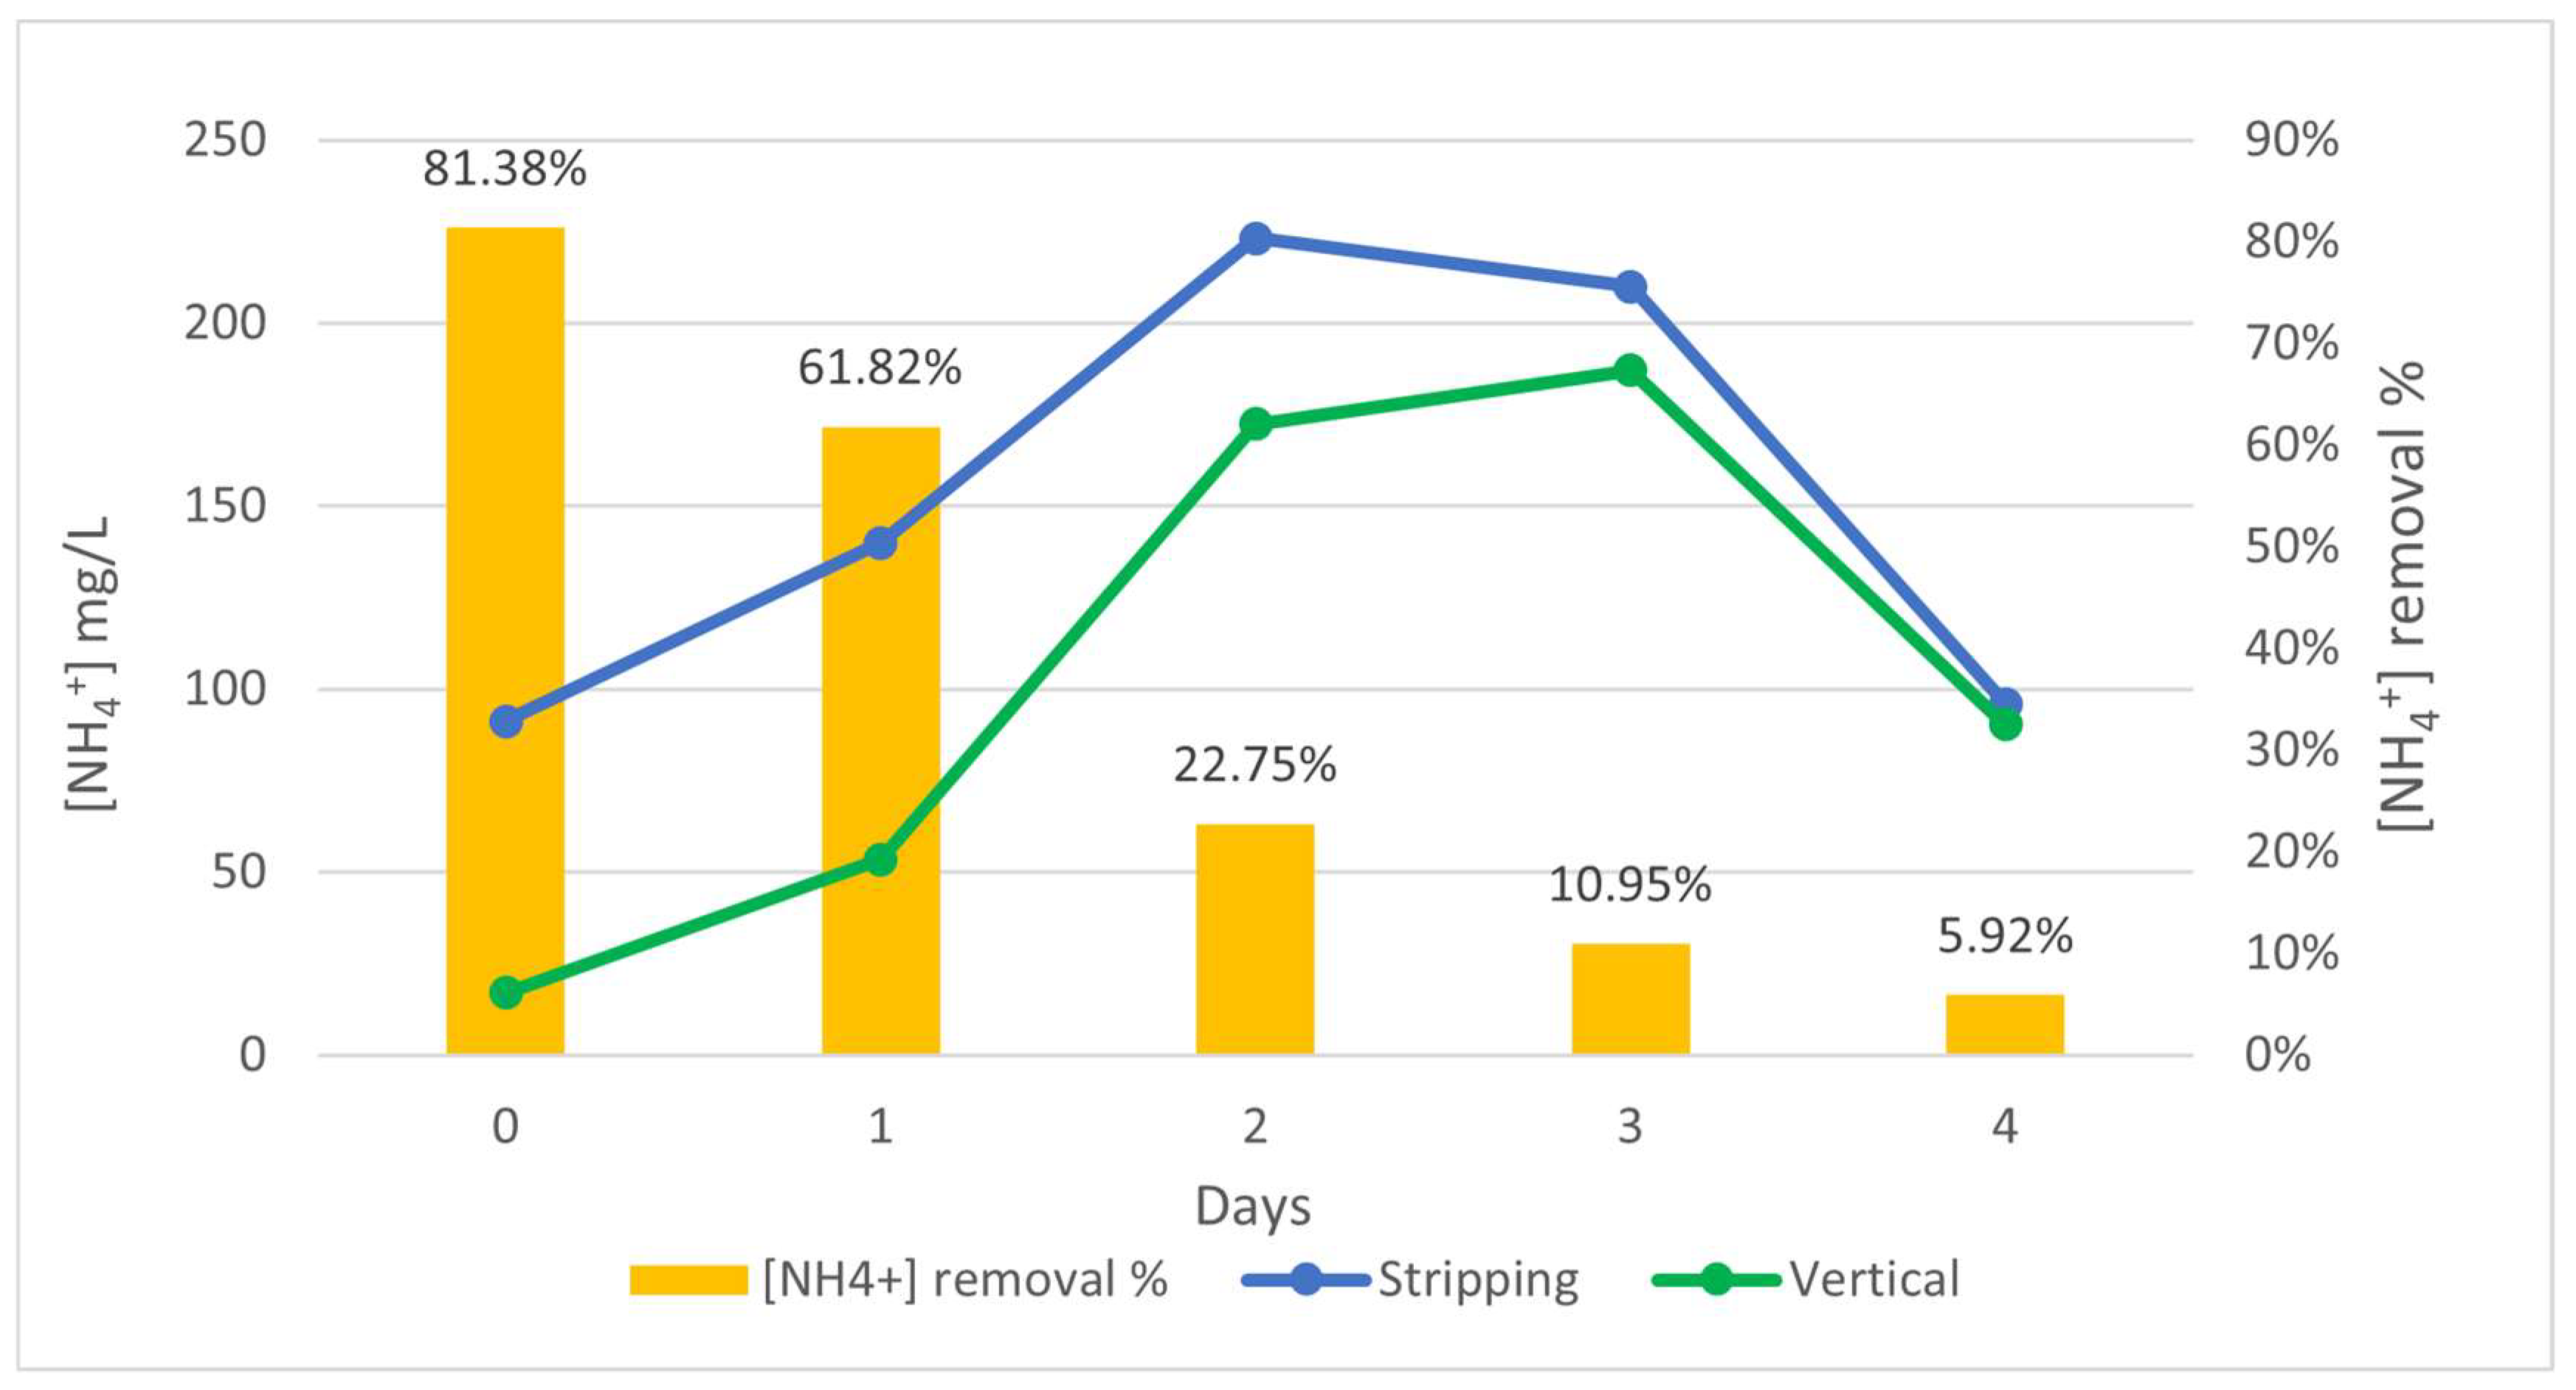
The results were monitored for 5 days at those three outlets points (a), (b) and (c). The NH4+ removal efficiencies and the pH and electric conductivity (EC) variations were measured as detailed in Figure 19 and Figure 20.
NH4+ concentration decreased from 91 mg/L to 17 mg/L at day 0 which supposed an initial removal of 81% of NH4+. After one day, P-20 still showed a good performance reducing the NH4+ concentration from 140 mg/L to 53.45 mg/L, which represented a total elimination of 61.82%. It is observed that the efficacy decreased with time as the active sites of the P-20 begin to be saturated. After 2 days, P-20 adsorption decreased from [NH4+] 223.2 mg/L to 172.4 mg/L which represented an efficiency of 22.75%. The contaminant removals on day 3 and 4 are 10.95 and 5.92% respectively. P-20 showed a similar performance in column tests which reflected the suitability and high selectivity to NH4+ even under real operating conditions.
The NH4+ removal at the beginning was similar or even higher than that reported for natural zeolites: mesolite (55%) [91], Turkish sepiolite (60%) [92], Romanian volcanic tuff (83%) [93] and Gordes clinoptilolite (85%) [94]; and it is even similar to many artificial zeolites: ceramic adsorbent (19.4%) [95], NaOH modified mordenite (81%) [96], ultrasound modified zeolite (84.6%) [97] and magnetic zeolite NaA (85%) [98]. However, these results reported for zeolites correspond to tests carried out in synthetic solutions.
It is worth to note the increment in the electrical conductivity and pH during the treatment. As shown in Figure 20, the pH increased sharply when passing through the stripping system (from 8 to 12 units). After passing through P-20 the pH > 13 which represented a gradient of approximately 1 unit with respect to the stripping. This was due to the alkalis leaching to the wastewater effluent. This effect could be modified as demonstrated in the results obtained in Section 3.1.4. According to the same reason, the EC also increased in values around 10–28 mS/cm.
An economic assessment of the adsorbent developed was carried out for comparative purposes. Considering the composition of P-20, the final cost was estimated on 0.4Ꞓ kg−1/ 0.43 USD kg−1. The most expensive component was the foaming agent (11Ꞓ kg−1) followed by the alkaline activator (0.9 Ꞓ kg−1) and finally the MK (0.3 Ꞓ kg−1). However, the H2O2 has a low impact on the total cost (13%). The Na-silicate was the product with the highest impact (59%). Considering the current adsorption technologies, P-20 was found less expensive than reported MOFs (~70 k USD kg−1) [99] and activated carbon (1.8–2.1 USD kg−1) [100] and in the price range reported for biochar (0.35–1.2 USD kg−1) [100]. Clay-based adsorbents are still the cheapest option (0.04 USD kg−1) [29]. Alkaline activating solutions in geopolymer manufacturing are not only one of the most expensive components but also the main responsible for the material carbon footprint according to reported LCAs [101]. Thus, recent researchers are focused on replacing traditional sodium silicates with other waste-based activators to alleviate both the cost and emissions of the final GP [102,103,104].

4. Conclusions

A porous GP material (P-20) based on MK was developed, characterized and evaluated as potential adsorbent material. The introduction of 20% of GW minimized the environmental impact and the cost of the final product, contributing to the sustainability of the process. High porosity (60%) was established by the addition of H2O2 (1%) as a foaming agent. The GP structure presented a main macropore distribution with critical pore sizes between 0.1–0.4 µm. The produced material is a lightweight GP (0.71 g/cm3) with a compressive strength of 6.7 MPa at 28 days-age.
The effect of pH, P-20 concentration, initial NH4+ concentration and contact time were assessed in batch tests. In the contact time experiment, the maximum capacity was obtained (qm = 28.18) and it was confirmed that ion exchange between NH4+ and Na+ occurred. The experimental data were fitted to different isotherm models, with the Redlich-Peterson (slightly superior), the Langmuir-Freundlich and the Tóth were able to predict the adsorption at equilibrium at 22 °C. The qm obtained from the models were higher than many of the natural and synthetic zeolites. The curve profile indicated that the NH4+ could be disposed on the GP homogenous surface as a monolayer and with strong physical-chemical attraction between molecules. The kinetics followed the Weber-Morris equation rate indicating that the intraparticle diffusion through the pores was the limiting mass transfer mechanism. Continuous laboratory experiments indicated an outstanding 93% of NH4+ removal during the first hours and q = 25.24 mg/g.
The material was also validated in a relevant full-scale pilot plant where 120 L of P-20 were disposed in a vertical wetland for wastewater treatment. The material showed encouraging results of adsorption capacitance reaching up to 81% overall NH4+ initial removal, similar to natural zeolites. After one day, P-20 still showed good performance reducing the concentration from 140 to 53.45 mg/L. The efficacy decreased over time as the active sites of the GP became saturated. The pH and electrical conductivity increments obtained in the plant could be alleviated with the application of the proposed cleansing treatments with acids.
This study allows to conclude that P-20 is a sustainable, low-cost (0.4 Ꞓ kg−1) and easy-to-install material that can be effectively used for NH4+ treatments due to its high selectivity in a real wastewater effluent.
Future investigations will be focused on the alkalis leaching reduction, the early saturation of the material and the substitution of the traditional alkaline activating solutions with waste-based ones.

Author Contributions

Material design and development, methodology, analysis and validation, draft writing, M.O. Adsorption characterization, methodology, formal analysis and validation, S.G.-C. and C.Á. Funding acquisition, project management, review and editing, investigation and supervision, L.F. All authors have read and agreed to the published version of the manuscript.

Funding

This research was funded by the Axencia Galega de Innovación (GAIN), Xunta de Galicia and FEDER under GEOPOLAR project (IN852A 2018/44).

Institutional Review Board Statement

Not applicable.

Informed Consent Statement

Not applicable.

Data Availability Statement

The data presented in this study are available on request from the corresponding author.

Conflicts of Interest

The authors declare no conflict of interest and the funders had no role in the design of the study; in the collection, analyses, or interpretation of data; in the writing of the manuscript; or in the decision to publish the results.

References

  1. Carreño-Gallardo, C.; Tejeda-Ochoa, A.; Perez-Ordonez, O.; Ledezma-Sillas, J.; Lardizabal-Gutierrez, D.; Prieto-Gomez, C.; Valenzuela-Grado, J.; Hernandez, F.R.; Herrera-Ramirez, J. In the CO2 emission remediation by means of alternative geopolymers as substitutes for cements. J. Environ. Chem. Eng. 2018, 6, 4878–4884. [Google Scholar] [CrossRef]
  2. Jacob, R.; Trout, N.; Solé, A.; Clarke, S.; Fernández, A.I.; Cabeza, L.F.; Saman, W.; Bruno, F. Novel geopolymer for use as a sensible storage option in high temperature thermal energy storage systems. AIP Conf. Proc. 2020, 2303, 190019. [Google Scholar]
  3. Rahjoo, M.; Goracci, G.; Martauz, P.; Rojas, E.; Dolado, J.S. Geopolymer Concrete Performance Study for High-Temperature Thermal Energy Storage (TES) Applications. Sustainability 2022, 14, 1937. [Google Scholar] [CrossRef]
  4. Perera, D.S.; Vance, E.R.; Aly, Z.; Finnie, K.S.; Hanna, J.V.; Nicholson, C.L.; Stewart, M.W.A. Characterisation of Geopolymers for the Immobilisation of Intermediate Level Waste. In Proceedings of the International Conference on Radioactive Waste Management and Environmental Remediation, Oxford, UK, 21–25 September 2003; pp. 1807–1814. [Google Scholar]
  5. Provis, J.L. Geopolymers: Structures, Processing, Properties and Industrial Applications; Elsevier: Amsterdam, The Netherlands, 2009; pp. 421–440. [Google Scholar]
  6. Duan, P.; Yan, C.; Zhou, W.; Ren, D. Development of fly ash and iron ore tailing based porous geopolymer for removal of Cu(II) from wastewater. Ceram. Int. 2016, 42, 13507–13518. [Google Scholar] [CrossRef]
  7. Al-Harahsheh, M.S.; Al Zboon, K.; Al-Makhadmeh, L.; Hararah, M.; Mahasneh, M. Fly ash based geopolymer for heavy metal re-moval: A case study on copper removal. J. Environ. Chem. Eng. 2015, 3, 1669–1677. [Google Scholar] [CrossRef]
  8. Ge, Y.; Yuan, Y.; Wang, K.; He, Y.; Cui, X. Preparation of geopolymer-based inorganic membrane for removing Ni2+ from wastewater. J. Hazard. Mater. 2015, 299, 711–718. [Google Scholar] [CrossRef] [PubMed]
  9. Gasca-Tirado, J.; Manzano-Ramírez, A.; Vazquez-Landaverde, P.; Herrera-Díaz, E.; Rodríguez-Ugarte, M.; Rubio-Ávalos, J.; Amigó-Borrás, V.; Chávez-Páez, M. Ion-exchanged geopolymer for photocatalytic degradation of a volatile organic compound. Mater. Lett. 2014, 134, 222–224. [Google Scholar] [CrossRef]
  10. Novais, R.M.; Seabra, M.; Labrincha, J. Porous geopolymer spheres as novel pH buffering materials. J. Clean. Prod. 2017, 143, 1114–1122. [Google Scholar] [CrossRef]
  11. Alshaaer, M.; El-Eswed, B.; Yousef, R.; Khalili, F.; Rahier, H. Development of functional geopolymers for water purification, and construction purposes. J. Saudi Chem. Soc. 2016, 20, S85–S92. [Google Scholar] [CrossRef]
  12. Gasca-Tirado, J.R.; Manzano-Ramírez, A.; Muñoz, E.R.; Velázquez-Castillo, R.; Apátiga-Castro, M.; Nava, R.; Rodríguez-López, A. Ion Exchange in Geopolymers. New Trends Ion Exch. Stud. 2018, 5, 72–82. [Google Scholar]
  13. Tan, T.H.; Mo, K.H.; Ling, T.-C.; Lai, S.H. Current development of geopolymer as alternative adsorbent for heavy metal removal. Environ. Technol. Innov. 2020, 20, 100684. [Google Scholar] [CrossRef]
  14. Skorina, T. Ion exchange in amorphous alkali-activated aluminosilicates: Potassium based geopolymers. Appl. Clay Sci. 2014, 87, 205–211. [Google Scholar] [CrossRef]
  15. Bell, J.L.; Kriven, W.M. Preparation of Ceramic foams from metakaolin-based geopolymer gels. Ceram Eng. Sci. Proc. 2008, 29, 97–112. [Google Scholar]
  16. Kränzlein, E.; Pöllmann, H.; Krcmar, W. Metal powders as foaming agents in fly ash based geopolymer synthesis and their impact on the structure depending on the Na/Al ratio. Cem. Concr. Compos. 2018, 8, 90–161. [Google Scholar] [CrossRef]
  17. Prud’Homme, E.; Michaud, P.; Joussein, E.; Peyratout, C.; Smith, A.; Rossignol, S. In situ inorganic foams prepared from various clays at low temperature. Appl. Clay Sci. 2011, 51, 15–22. [Google Scholar] [CrossRef]
  18. Henon, J.; Alzina, A.; Absi, J.; Smith, D.S.; Rossignol, S. Potassium geopolymer foams made with silica fume pore forming agent for thermal insulation. J. Porous Mater. 2013, 20, 37–46. [Google Scholar] [CrossRef]
  19. Bouwman, A.F.; Lee, D.S.; Asman, W.A.H.; Dentener, F.J.; Van Der Hoek, K.W.; Olivier, J.G.J. A global high-resolution emission inventory for ammonia. Glob. Biogeochem. Cycles 1997, 11, 561–587. [Google Scholar] [CrossRef]
  20. Asman, W.A. Factors influencing local dry deposition of gases with special reference to ammonia. Atmos. Environ. 1998, 32, 415–421. [Google Scholar] [CrossRef]
  21. Chiemchaisri, C.; Wiwattanakom, W.; Lee, S.H. Enhancement of organic and nitrogen removal in up-flow floating filter media reactor for piggery wastewater treatment. Int. J. Environ. Pollut. 2009, 37, 34.e44. [Google Scholar] [CrossRef]
  22. Han, B.; Butterly, C.; Zhang, W.; He, J.Z.; Chen, D. Adsorbent materials for ammonium and ammonia removal: A review. J. Clean. Prod. 2020, 283, 124611. [Google Scholar] [CrossRef]
  23. Huang, J.; Kankanamge, N.R.; Chow, C.; Welsh, D.T.; Li, T.; Teasdale, P.R. Removing ammonium from water and wastewater using cost-effective adsorbents: A review. J. Environ. Sci. 2018, 63, 174–197. [Google Scholar] [CrossRef] [PubMed]
  24. Tchobanoglous, G.; Burton, F.L.; Stensel, H.D. Wastewater Engineering: Treatment and Reuse, 4th ed.; Mc Graw Hill: New York, NY, USA, 2004. [Google Scholar]
  25. Hwang, J.H.; Oleszkiewicz, J.A. Effect of Cold-Temperature Shock on Nitrification. Water Environ. Res. 2007, 79, 964–968. [Google Scholar] [CrossRef] [PubMed]
  26. Fidel, R.B.; Laird, D.A.; Spokas, K.A. Sorption of ammonium and nitrate to biochars is electrostatic and pH-dependent. Sci. Rep. 2018, 8, 10. [Google Scholar] [CrossRef]
  27. Yang, H.I.; Lou, K.; Rajapaksha, A.U.; Ok, Y.S.; Anyia, A.O.; Chang, S.X. Adsorption of ammonium in aqueous solutions by pine sawdust and wheat straw biochars. Environ. Sci. Pollut. Res. 2018, 25, 25638–25647. [Google Scholar] [CrossRef] [PubMed]
  28. Rieth, A.J.; Wright, A.M.; Dincă, M. Kinetic stability of metal–organic frameworks for corrosive and coordinating gas capture. Nat. Rev. Mater. 2019, 4, 708–725. [Google Scholar] [CrossRef]
  29. Burakov, A.E.; Galunin, E.V.; Burakova, I.V.; Kucherova, A.E.; Agarwal, S.; Tkachev, A.G.; Gupta, V.K. Adsorption of heavy metals on conventional and nanostructured materials for wastewater treatment purposes: A review. Ecotoxicol. Environ. Saf. 2018, 148, 702–712. [Google Scholar] [CrossRef] [PubMed]
  30. Sun, Z.; Vollpracht, A.; van der Sloot, H.A. pH dependent leaching characterization of major and trace elements from fly ash and metakaolin geopolymers. Cem. Concr. Res. 2019, 125, 105889. [Google Scholar] [CrossRef]
  31. Ascensão, G.; Seabra, M.P.; Aguiar, J.B.; Labrincha, J.A. Red mud-based geopolymers with tailored alkali diffusion properties and pH buffering ability. J. Clean. Prod. 2017, 148, 23–30. [Google Scholar] [CrossRef]
  32. Javadian, H.; Ghorbani, F.; Tayebi, H.-A.; Asl, S.H. Study of the adsorption of Cd (II) from aqueous solution using zeolite-based geopolymer, synthesized from coal fly ash; kinetic, isotherm and thermodynamic studies. Arab. J. Chem. 2015, 8, 837–849. [Google Scholar] [CrossRef]
  33. Mužek, M.N.; Svilović, S.; Zelić, J. Kinetic studies of cobalt ion removal from aqueous solutions using fly ash-based geopolymer and zeolite NaX as sorbents. Sep. Sci. Technol. 2016, 51, 2868–2875. [Google Scholar] [CrossRef]
  34. Mužek, M.N.; Svilović, S.; Ugrina, M.; Zelić, J. Removal of copper and cobalt ions by fly ash-based geopolymer from solutions-equilibrium study. Desalin. Water Treat. 2016, 57, 10689–10699. [Google Scholar] [CrossRef]
  35. Andrejkovičová, S.; Sudagar, A.; Rocha, J.; Patinha, C.; Hajjaji, W.; da Silva, E.F.; Velosa, A.; Rocha, F. The effect of natural zeolite on microstructure, mechanical and heavy metals adsorption properties of metakaolin based geopolymers. Appl. Clay Sci. 2016, 126, 141–152. [Google Scholar] [CrossRef]
  36. Cheng, T.; Lee, M.; Ko, M.; Ueng, T.; Yang, S. The heavy metal adsorption characteristics on metakaolin-based geopolymer. Appl. Clay Sci. 2012, 56, 90–96. [Google Scholar] [CrossRef]
  37. López, F.J.; Sugita, S.; Tagaya, M.; Kobayashi, T. Metakaolin-based geopolymers for targeted adsorbents to heavy metal ion separation. J. Mater. Sci. Chem. Eng. 2014, 2, 16–27. [Google Scholar] [CrossRef]
  38. Novais, R.M.; Carvalheiras, J.; Tobaldi, D.M.; Seabra, M.P.; Pullar, R.C.; Labrincha, J.A. Synthesis of porous biomass fly ash-based geopolymer spheres for efficient removal of methylene blue from wastewaters. J. Clean. Prod. 2019, 207, 350–362. [Google Scholar] [CrossRef]
  39. Li, L.; Wang, S.; Zhu, Z. Geopolymeric adsorbents from fly ash for dye removal from aqueous solution. J. Colloid Interface Sci. 2006, 300, 52–59. [Google Scholar] [CrossRef] [PubMed]
  40. Khan, M.I.; Min, T.K.; Azizli, K.; Sufian, S.; Ullah, H.; Man, Z. Effective removal of methylene blue from water using phosphoric acid based geopolymers: Synthesis, characterizations and adsorption studies. RSC Adv. 2015, 5, 61410–61420. [Google Scholar] [CrossRef]
  41. Yousef, R.I.; El-Eswed, B.; Alshaaer, M.; Khalili, F.; Khoury, H. The influence of using Jordanian natural zeolite on the adsorption, physical, and mechanical properties of geopolymers products. J. Hazard. Mater. 2009, 165, 379–387. [Google Scholar] [CrossRef] [PubMed]
  42. Luukkonen, T.; Sarkkinen, M.; Kemppainen, K.; Rämö, J.; Lassi, U. Metakaolin geopolymer characterization and application for ammonium removal from model solutions and landfill leachate. Appl. Clay Sci. 2016, 119, 266–276. [Google Scholar] [CrossRef]
  43. Sanguanpak, S.; Wannagon, A.; Saengam, C.; Chiemchaisri, W.; Chiemchaisri, C. Porous metakaolin-based geopolymer granules for removal of ammonium in aqueous solution and anaerobically pretreated piggery wastewater. J. Clean. Prod. 2021, 297, 126643. [Google Scholar] [CrossRef]
  44. Luukkonen, T.; Věžníková, K.; Tolonen, E.-T.; Runtti, H.; Yliniemi, J.; Hu, T.; Kemppainen, K.; Lassi, U. Removal of ammonium from municipal wastewater with powdered and granulated metakaolin geopolymer. Environ. Technol. 2017, 39, 414–423. [Google Scholar] [CrossRef]
  45. UNE-EN 196-1:2018; Methods of Testing Cement—Part 1: Determination of Strength. AENOR: Madrid, Spain, 2018.
  46. UNE-EN 12390-7:2020; Testing Hardened Concrete—Part 7: Density of Hardened Concrete. AENOR: Madrid, Spain, 2021.
  47. Lancellotti, I.; Piccolo, F.; Traven, K.; Češnovar, M.; Ducman, V.; Leonelli, C. Alkali Activation of Metallurgical Slags: Reactivity, Chemical Behavior, and Environmental Assessment. Materials 2021, 14, 639. [Google Scholar] [CrossRef]
  48. Langmuir, I. The constitution and fundamental properties of solids and liquids. Part I Solids. J. Am. Chem. Soc. 1916, 38, 2221–2295. [Google Scholar] [CrossRef]
  49. Freundlich, H.M.F. Over the adsorption in solution. J. Phys. Chem. 1906, 57, 1100–1107. [Google Scholar]
  50. Sips, R. Combined form of Langmuir and Freundlich equations. J. Chem. Phys. 1948, 16, 490–495. [Google Scholar] [CrossRef]
  51. Redlich, O.; Peterson, D.L. A Useful Adsorption Isotherm. J. Phys. Chem. 1959, 63, 1024. [Google Scholar] [CrossRef]
  52. Toth, J. State equation of the solid-gas interface layers. Acta Chim. Hung. 1971, 69, 311–328. [Google Scholar]
  53. Lagergren, S. Zur theorie der sogenannten adsorption geloester stoffe. Veternskapsakad. Handl. 1898, 24, 1.e39. [Google Scholar]
  54. Ho, Y.S.; McKay, G. Pseudo-second order model for sorption processes. Process Biochem. 1999, 34, 451–465. [Google Scholar] [CrossRef]
  55. Allen, J.; Scaife, P. The Elovich equation and chemisorption kinetics. Aust. J. Chem. 1966, 19, 2015–2023. [Google Scholar] [CrossRef]
  56. Weber, W.J., Jr.; Morris, J.C. Kinetics of Adsorption on Carbon from Solution. J. Sanit. Eng. Div. Am. Soc. Civ. Eng. 1963, 89, 31. [Google Scholar] [CrossRef]
  57. Ozer, I.; Soyer-Uzun, S. Relations between the structural characteristics and compressive strength in metakaolin based geo-polymers with different molar Si/Al ratios. Ceram. Int. 2015, 41, 10192–10198. [Google Scholar] [CrossRef]
  58. Zaharaki, D.; Komnitsas, K.; Perdikatsis, V. Use of analytical techniques for identification of inorganic polymer gel composition. J. Mater. Sci. 2010, 45, 2715–2724. [Google Scholar] [CrossRef]
  59. Kljajević, L.; Nenadović, S.; Nenadović, M.; Bundaleski, N.; Todorović, B.; Pavlović, V.; Rakočević, Z. Structural and chemical properties of thermally treated geopolymer samples. Ceram. Inter. 2017, 43, 6700–6708. [Google Scholar] [CrossRef]
  60. Ivanovic, M.; Kljajevic, L.; Gulicovski, J.; Petkovic, M.; Jankovic-Castvan, I.; Bucevac, D.; Nenadovic, S. The effect of the concentration of alkaline activator and aging time on the structure of metakaolin based geopolymer. Sci. Sinter. 2020, 52, 219–229. [Google Scholar] [CrossRef]
  61. Heller-Kallai, L.; Lapides, I. Reactions of kaolinites and metakaolinites with NaOH: Comparison of different samples. Appl. Clay Sci. 2007, 35, 99–107. [Google Scholar] [CrossRef]
  62. Rowles, M.R.; O’Connor, B.H. Chemical and Structural Microanalysis of Aluminosilicate Geopolymers Synthesized by Sodium Silicate Activation of Metakaolinite. J. Am. Ceram. Soc. 2009, 92, 2354–2361. [Google Scholar] [CrossRef]
  63. Jaya, N.A.; Yun-Ming, L.; Cheng-Yong, H.; Abdullah, M.M.A.B.; Hussin, K. Correlation between pore structure, compressive strength and thermal conductivity of porous metakaolin geopolymer. Constr. Build. Mater. 2020, 247, 118641. [Google Scholar] [CrossRef]
  64. Petlitckaia, S.; Poulesquen, A. Design of lightweight metakaolin based geopolymer foamed with hydrogen peroxide. Ceram. Int. 2018, 45, 1322–1330. [Google Scholar] [CrossRef]
  65. Sudhakar, M.R.; Indra, P.A. Mercury Intrusion Porosimetry Studies with Geopolymers. Indian Geotech. J. 2017, 47, 495–502. [Google Scholar]
  66. Huang, Y.; Gong, L.; Shi, L.; Cao, W.; Pan, Y.; Cheng, X. Experimental investigation on the influencing factors of preparing porous fly ash-based geopolymer for insulation material. Energy Build. 2018, 168, 9–18. [Google Scholar] [CrossRef]
  67. Aly, Z.; Vance, E.; Perera, D. Aqueous dissolution of sodium aluminosilicate geopolymers derived from metakaolin. J. Nucl. Mater. 2012, 424, 164–170. [Google Scholar] [CrossRef]
  68. Novais, R.M.; Buruberri, L.; Seabra, M.; Bajare, D.; Labrincha, J. Novel porous fly ash-containing geopolymers for pH buffering applications. J. Clean. Prod. 2016, 124, 395–404. [Google Scholar] [CrossRef]
  69. Zhang, Z.; Provis, J.L.; Reid, A.; Wang, H. Fly ash-based geopolymers: The relationship between composition, pore structure and efflorescence. Cem. Concr. Res. 2014, 64, 30–41. [Google Scholar] [CrossRef]
  70. Bumanis, G.; Bajare, D.; Rugele, K. The effect of alkaline material particle size on adjustment ability of buffer capacity. Medziagotyra 2015, 21, 405–409. [Google Scholar] [CrossRef]
  71. Ajay, A.; Ramaswamy, K.P.; Thomas, A.V. A critical review on the durability of geopolymer composites in acidic environment. IOP Conf. Ser. Earth Environ. Sci. 2020, 491, 012044. [Google Scholar] [CrossRef]
  72. Szechyńska-Hebda, M.; Marczyk, J.; Ziejewska, C.; Hordyńska, N.; Mikuła, J.; Hebda, M. Optimal Design of pH-Neutral Geopolymer Foams for Their Use in Ecological Plant Cultivation Systems. Materials 2019, 12, 2999. [Google Scholar] [CrossRef]
  73. Liu, Y.; Meng, Y.; Qiu, X.; Zhou, F.; Wang, H.; Zhou, S.; Yan, C. Novel porous phosphoric acid-based geopolymer foams for adsorption of Pb (II), Cd(II) and Ni(II) mixtures: Behavior and mechanism. Ceram. Int. 2023, 49, 7030–7039. [Google Scholar] [CrossRef]
  74. Iftekhar, S.; Ramasamy, D.L.; Srivastava, V.; Asif, M.B.; Sillanpää, M. Understanding the factors affecting the adsorption of Lanthanum using different adsorbents: A critical review. Chemosphere 2018, 204, 413–430. [Google Scholar] [CrossRef]
  75. Kazmi, M.; Feroze, N.; Javed, H.; Zafar, M.; Ramzan, N. Biosorption of copper (II) on dry fruit by product: Characterization, kinetic and equilibrium studies. J. Chem. Soc. Pak. 2012, 34, 156–1365. [Google Scholar]
  76. Al-Zboon, K.K.; Al-Smadi, B.M.; Al-Khawaldh, S. Natural Volcanic Tuff-Based Geopolymer for Zn Removal: Adsorption Isotherm, Kinetic, and Thermodynamic Study. Water Air Soil Pollut. 2016, 227, 1–22. [Google Scholar] [CrossRef]
  77. Al-Ghouti, M.A.; Da’Ana, D.A. Guidelines for the use and interpretation of adsorption isotherm models: A review. J. Hazard. Mater. 2020, 393, 122383. [Google Scholar] [CrossRef] [PubMed]
  78. Wang, Y.; Liu, S.; Xu, Z.; Han, T.; Chuan, S.; Zhu, T. Ammonia removal from leachate solution using natural Chinese clinop-tilolite. J. Hazard. Mater. 2006, 136, 735–740. [Google Scholar] [CrossRef] [PubMed]
  79. Lei, L.; Li, X.; Zhang, X. Ammonium removal from aqueous solutions using microwave-treated natural Chinese zeolite. Sep. Purif. Technol. 2008, 58, 359–366. [Google Scholar] [CrossRef]
  80. Sarioglu, M. Removal of ammonium from municipal wastewater using natural Turkish (Dogantepe) zeolite. Sep. Purif. Technol. 2005, 41, 1–11. [Google Scholar] [CrossRef]
  81. Yusof, A.M.; Keat, L.K.; Ibrahim, Z.; Majid, Z.A.; Nizam, N.A. Kinetic and equilibrium studies of the removal of ammonium ions from aqueous solution by rice husk ash-synthesized zeolite Y and powdered and granulated forms of mordenite. J. Hazard. Mater. 2010, 174, 380–385. [Google Scholar] [CrossRef] [PubMed]
  82. Zhang, M.; Zhang, H.; Xu, D.; Han, L.; Niu, D.; Tian, B.; Zhang, J.; Zhang, L.; Wu, W. Removal of ammonium from aqueous solutions using zeolite synthesized from fly ash by a fusion method. Desalination 2011, 271, 111–121. [Google Scholar] [CrossRef]
  83. Juan, R.; Hernández, S.; Andrés, J.M.; Ruiz, C. Ion exchange uptake of ammonium in wastewater from a Sewage Treatment Plant by zeolitic materials from fly ash. J. Hazard. Mater. 2009, 161, 781–786. [Google Scholar] [CrossRef]
  84. Zheng, H.; Han, L.; Ma, H.; Zheng, Y.; Zhang, H.; Liu, D.; Liang, S. Adsorption characteristics of ammonium ion by zeolite 13X. J. Hazard. Mater. 2008, 158, 577–584. [Google Scholar] [CrossRef]
  85. Niu, Y.; Zhao, Y.; Xi, B.; Hu, X.; Xia, X.; Wang, L.; Lv, D.; Lu, J. Removal of ammonium from aqueous solutions using synthetic zeolite obtained from coal fly-ash. Fresenius Environ. Bull. 2012, 21, 1732–1739. [Google Scholar]
  86. Wang, J.; Guo, X. Rethinking of the intraparticle diffusion adsorption kinetics model: Interpretation, solving methods and applications. Chemosphere 2022, 309, 136732. [Google Scholar] [CrossRef]
  87. Svilović, S.; Rušić, D.; Bašić, A. Investigations of different kinetic models of copper ions sorption on zeolite 13X. Desalination 2010, 259, 71–75. [Google Scholar] [CrossRef]
  88. Wang, J.; Guo, X. Adsorption kinetic models: Physical meanings, applications, and solving methods. J. Hazard. Mater. 2020, 390, 122156. [Google Scholar] [CrossRef]
  89. EPA. United States Environmental Protection Agency, Wastewater Technology Fact Sheet Ammonia Stripping. Available online: https://www3.epa.gov/npdes/pubs/ammonia_stripping.pdf (accessed on 10 October 2023).
  90. Wu, C.-Q.; Zhang, Y.; Chen, X. Ammonia removal mechanism by the combination of air stripping and ultrasound as the function of pH. IOP Conf. Ser. Earth Environ. Sci. 2019, 344, 012051. [Google Scholar] [CrossRef]
  91. Thornton, A.; Pearce, P.; Parsons, S. Ammonium removal from solution using ion exchange on to MesoLite, an equilibrium study. J. Hazard. Mater. 2007, 147, 883–889. [Google Scholar] [CrossRef]
  92. Balci, S.; Dinçel, Y. Ammonium ion adsorption with sepiolite: Use of transient uptake method. Chem. Eng. Process. Process Intensif. 2002, 41, 79–85. [Google Scholar] [CrossRef]
  93. Marañón, E.; Ulmanu, M.; Fernández, Y.; Anger, I.; Castrillón, L. Removal of ammonium from aqueous solutions with volcanic tuff. J. Hazard. Mater. 2006, 137, 1402–1409. [Google Scholar] [CrossRef] [PubMed]
  94. Erdoğan, B.C.; Ülkü, S. Ammonium sorption by Gördes clinoptilolite rich mineral specimen. Appl. Clay Sci. 2011, 54, 217–225. [Google Scholar] [CrossRef]
  95. Zhao, Y.; Yang, Y.; Yang, S.; Wang, Q.; Feng, C.; Zhang, Z. Adsorption of high ammonium nitrogen from wastewater using a novel ceramic adsorbent and the evaluation of the ammonium-adsorbed-ceramic as fertilizer. J. Colloid Interface Sci. 2013, 393, 264–270. [Google Scholar] [CrossRef]
  96. Soetardji, J.P.; Claudia, J.C.; Ju, Y.-H.; Hriljac, J.A.; Chen, T.-Y.; Soetaredjo, F.E.; Santoso, S.P.; Kurniawan, A.; Ismadji, S. Ammonia removal from water using sodium hydroxide modified zeolite mordenite. RSC Adv. 2015, 5, 83689–83699. [Google Scholar] [CrossRef]
  97. Zieliński, M.; Zielińska, M.; Dębowski, M. Ammonium removal on zeolite modified by ultrasound. Desalination Water Treat. 2015, 57, 8748–8753. [Google Scholar] [CrossRef]
  98. Liu, H.; Peng, S.; Shu, L.; Chen, T.; Bao, T.; Frost, R.L. Effect of Fe3O4 addition on removal of ammonium by zeolite NaA. J. Colloid Interface Sci. 2013, 390, 204–210. [Google Scholar] [CrossRef]
  99. Vikrant, K.; Kumar, V.; Kim, K.H.; Kukkar, D. Metal-organic frameworks (MOFs): Potential and challenges for capture and abatement of ammonia. J. Mater. Chem. A 2017, 5, 22877–22896. [Google Scholar] [CrossRef]
  100. Thompson, K.A.; Shimabuku, K.K.; Kearns, J.P.; Knappe, D.R.; Summers, R.S.; Cook, S.M. Environmental comparison of biochar and activated carbon for tertiary wastewater treatment. Environ. Sci. Technol. 2016, 50, 11253–11262. [Google Scholar] [CrossRef] [PubMed]
  101. Ouellet-Plamondon, C.; Habert, G. Life cycle assessment (LCA) of alkali-activated cements and concretes. Handb. Alka-Li-Act. Cem. Mortars Concr. 2015, 215, 663–686. [Google Scholar]
  102. Torres-Carrasco, M.; Puertas, F. Waste glass as a precursor in alkaline activation: Chemical process and hydration products. Constr. Build. Mater. 2017, 139, 342–354. [Google Scholar] [CrossRef]
  103. Hwang, C.-L.; Huynh, T.-P. Effect of alkali-activator and rice husk ash content on strength development of fly ash and residual rice husk ash-based geopolymers. Constr. Build. Mater. 2015, 101, 1–9. [Google Scholar] [CrossRef]
  104. de Moraes Pinheiro, S.M.; Font, A.; Soriano, L.; Tashima, M.M.; Monzó, J.; Borrachero, M.V.; Payá, J. Olive-stone biomass ash (OBA): An alternative alkaline source for the blast furnace slag activation. Constr. Build. Mater. 2018, 178, 327–338. [Google Scholar] [CrossRef]
Figure 1. FTIR spectra of G-0.
Cleantechnol 06 00017 g001
Figure 2. SEM-EDX spectrum of (a) G-0 with analyses located at 1 and 2 and (b) G-20 with analyses located at 1, 2, 3 and 4.
Cleantechnol 06 00017 g002
Figure 3. XRD patterns obtained for G-0 (black), G-10 (blue) and G-20 (red).
Cleantechnol 06 00017 g003
Figure 4. Mechanical strengths obtained for G and P GPs with different GW additions.
Cleantechnol 06 00017 g004
Figure 5. P-20 geopolymer aspect.
Cleantechnol 06 00017 g005
Figure 6. Pore size distribution of P-20.
Cleantechnol 06 00017 g006
Figure 7. Evolution of the pH of P-20 leachate in aqueous solution for 60 days.
Cleantechnol 06 00017 g007
Figure 8. P-20 treatment cycles with water.
Cleantechnol 06 00017 g008
Figure 9. P-20 cleansing treatment cycles with (a) 0.1 N glacial acetic acid and (b) 1 M HCl.
Cleantechnol 06 00017 g009aCleantechnol 06 00017 g009b
Figure 10. Effect of pH on the adsorption process.
Cleantechnol 06 00017 g010
Figure 11. Effect of P-20 dose on the adsorption process.
Cleantechnol 06 00017 g011
Figure 12. Effect of contact time on the adsorption process.
Cleantechnol 06 00017 g012
Figure 13. Variations in [NH4+] and [Na+] during the contact time test.
Cleantechnol 06 00017 g013
Figure 14. Effect of NH4+ initial concentration on the adsorption process.
Cleantechnol 06 00017 g014
Figure 15. Redlich Peterson isotherm.
Cleantechnol 06 00017 g015
Figure 16. Adjustment of the data by Webber Morris regression.
Cleantechnol 06 00017 g016
Figure 17. P-20 column test.
Cleantechnol 06 00017 g017
Figure 18. Pilot-plant: (a) tank (b) air stripping system (c) vertical wetland.
Cleantechnol 06 00017 g018
Figure 19. NH4+ removal efficiencies of the designed plant for 5 days.
Cleantechnol 06 00017 g019
Figure 20. Values of pH and EC ∆.
Cleantechnol 06 00017 g020
Table 1. Parameters considered for porous GP optimization at laboratory scale.
ParametersUnitsValues
Si/AlMolar ratio2
Ms (SiO2/Na2O)Molar ratio1.5
NaOHMolarity10
Curing temperature°C25
Foaming agent (H2O2)wt%(0–1)
Granite Waste (GW)Additions%(0–60)
Table 2. Parameters of adsorption isotherms models.
ParametersUnitsMeaning
qmmg/gMaximum adsorption capacity
bAdimensionalIndicative of adsoprtion energy (affinity of binding sites)
nAdimensionalHeterogeneity of the adsorbent surface
k m g × L 1 n g × m g 1 n Adsorption coefficient/adsorption capacity
Table 3. GP formulations evaluated in this work.
NomenclatureGW (%)H2O2 (%)
G-000
G-10100
G-20200
G-40400
G-60600
P-20201
P-30301
P-40401
Table 4. Bulk density, true density and total porosity of G and P formulations with different GW additions.
NomenclatureTrue Density (g/cm3)True Density (g/cm3)Total Porosity (%)
G-01.342.0835.67
G-101.711.826.24
G-201.671.786.21
G-401.651.766.4
P-200.711.7358.99
P-300.862.1860.46
P-400.92.2459.96
Table 5. P-20 synthesis parameters and properties.
Ms (SiO2/Na2O)SiO2/Al2O3GWH2O2Curing Temperature
1.5220%1%25 °C
Flexural strenghtCompression strenghtBulk densityTotal porosityHardening time
1.6 Mpa6.1 MPa0.71 g/cm358.99%24 h
Table 6. Leaching results from sample P-20.
Time (h)Conductivity (ms/cm)Final pHNa+ (ppm)Cl (ppm)SO4−2 (ppm)NH4+ (ppm)
127.139.16.033.91%3.56<DL
236.679.510.843.73.54<DL
435.779.511.393.693.56<DL
645.49.816.633.783.57<DL
24115.3710.147.883.71<DL
Table 7. RSME and R2 of the different isotherm models.
LangmuirFreundlichLangmuir-FreundlichRedlich-PetersonTóth
qm23.98k = 2.0226.09818.3527.645
b0.0130.010.020.016
n0.360.8580.90.719
RMSE1.2011.981.1481.0961.119
R20.970.920.9730.9750.074
Table 8. Goodness of the different kinetic models.
Pseudo-First OrderPseudo-Second OrderElovichWeber Morris
RMSE0.9160.93320.91370.9871
Table 9. Main composition of the leachate at Xiloga S.L. landfill after 9 months monitoring.
ParameterUnityAverageStandar Deviation
T°C26.853
pHpH units8.10.4
CEmS/cm27.95.5
Solids in suspensionmg/L204161
Sedimentable solidsmg/L1.10.9
Alcalinitymg/L133972677
Hardnessmg CaCO354837
Total organic carbonmg/L28531888
Dissolved organic carbonmg/L25751798
DQOmg/L63802960
DBO5mg/L24001061
NTKmg/L2145613
NH4+mg/L1978276
Phosphorusmg/L2513
Chloridemg/L2768933
Fluoridemg/L72
Disclaimer/Publisher’s Note: The statements, opinions and data contained in all publications are solely those of the individual author(s) and contributor(s) and not of MDPI and/or the editor(s). MDPI and/or the editor(s) disclaim responsibility for any injury to people or property resulting from any ideas, methods, instructions or products referred to in the content.

