Article

Fluoride Removal and Recovery from Water Using Reverse Osmosis and Osmotic Membrane Crystallization

by
Wuhib Zeine Ousman
1,2,*,
Esayas Alemayehu
1 and
Patricia Luis
2,3
1
Jimma Institute of Technology, Jimma University, Jimma P.O. Box 378, Ethiopia
2
Materials & Process Engineering (iMMC-IMAP), UCLouvain, Place Sainte Barbe 2, 1348 Louvain-la-Neuve, Belgium
3
Research & Innovation Centre for Process Engineering (ReCIPE), Place Sainte Barbe 2, bte L5.02.02, 1348 Louvain-la-Neuve, Belgium
*
Author to whom correspondence should be addressed.
Clean Technol. 2023, 5(3), 973-996; https://doi.org/10.3390/cleantechnol5030049
Submission received: 12 May 2023 / Revised: 1 July 2023 / Accepted: 2 August 2023 / Published: 7 August 2023
(This article belongs to the Special Issue Membrane Technology in Decentralized Applications)

Abstract

:
Fluoride is a concern for human health at high concentrations, but it is also a valuable compound with multiple applications. Thus, having a system that gives the opportunity to remove and recover this valuable element from water is highly interesting. Reverse osmosis (RO) is a promising technology in the removal of fluoride from water. Nevertheless, the residual retentate highly concentrated in fluoride is still a concern. The aim of this study was to evaluate the performance of an integrated process consisting of RO and membrane crystallization to remove fluoride from water and to recover it as a pure fluoride salt. Pure water permeability and fluoride rejection of a commercial RO membrane was tested under different conditions. In addition, the performance of an osmotic membrane crystallization setup was evaluated, considering the effect caused by the flow rates and the concentration of both the feed and the osmotic solution on the mass transfer coefficient. The crystallization process allowed the production of pure NaF crystals with octahedral morphology with a face-centered cubic crystal system.

1. Introduction

Fluoride is a persistent and highly reactive natural mineral element that can enter the aqueous environment by weathering of fluoride-rich minerals and through anthropogenic actions [1,2]. Fluorine compounds are industrially important and are widely used in semiconductors, pharmaceuticals, fertilizers, metallurgical industries, phosphate production, glass manufacturing, and nuclear applications [3]. Due to both natural and anthropogenic emissions, natural water sources may contain elevated concentrations of fluoride [4]. Fluorosis is endemic in at least 25 countries around the world, and is most prevalent in India, China, and parts of Africa. Tens of millions of people are affected by the disease [5]. In 2006, the World Health Organization (WHO) identified 28 countries where dental fluorosis and skeletal fluorosis were linked to high levels of fluoride in drinking water. India, Ethiopia, and China were the countries most significantly impacted by this issue [6]. Countries located in the East African Rift Valley, such as Tanzania, Kenya, and Ethiopia, experience a high level of fluoride concentration in their groundwater [7]. This concentration ranges from 0 to 111 mgL−1 in boreholes and 0 to 140 mgL−1 in wells. Similarly, the highest reported fluoride concentration was 2800 mgL−1 in Lake Nakuru in Kenya [8].
The WHO recommends a maximum fluoride concentration of 1.5 mgL−1 in water based on daily water consumption of 2 L. Setting national guidelines must therefore take into account climatic conditions that affect water consumption and regional diets [9,10]. If fluoride concentrations exceed recommended values, there is a risk of fluorosis (dental and/or skeletal), as well as neurological damage in severe cases [11,12].
The Sustainable Development Goals (SDGs) were adopted by the United Nations in 2015, comprising 17 goals and 169 targets [13]. Ensuring access to clean and uncontaminated drinking water at all times without the presence of harmful substances or fecal matter is crucial for public health. It is essential for various purposes, such as drinking, household use, food production, and recreational activities. Enhancing water supply and sanitation, as well as effectively managing water resources, can have a positive impact on a country’s economic growth and significantly contribute to reducing poverty [14].
Extensive research has been conducted on the removal of fluoride from water [15]. Various techniques, such as precipitation–coagulation, ion exchange, and adsorption, can be employed for this purpose [2]. Among these methods, adsorption has been extensively studied and is considered a cost-effective and straightforward approach for removing fluoride from water [15]. However, the effectiveness of fluoride removal through adsorption is influenced by factors such as temperature, pH, and the amount of adsorbent used. Additionally, the adsorbents need to be regenerated once they have reached their absorption capacity, which can reduce their overall effectiveness [16].
Fluoride removal using membrane technology has gained significant attention, with various membrane processes being utilized, such as reverse osmosis, nanofiltration, electrodialysis, and more recently membrane distillation [17]. Among these processes, reverse osmosis (RO) has been widely adopted as a safe and reliable method for providing drinking water, addressing issues associated with other conventional methods, such as high installation costs, selectivity problems, low capacity, and the need for regeneration [18,19]. In RO, contaminants are eliminated by applying pressure to the feed water, forcing it through a semipermeable membrane. This process is the opposite of natural osmosis, as the applied pressure on the more concentrated side of the membrane overcomes the natural osmotic pressure. Both nanofiltration and reverse osmosis membranes can remove fluoride from water, with nanofiltration requiring lower pressure and reverse osmosis operating at higher pressure, consistently producing high-quality water with high purity when treating groundwater [20,21,22]. Table 1 summarizes the various studies conducted on reverse osmosis techniques for removing fluoride from different water sources. Both methods have the potential to be used in decentralized areas because of their compact size and the ability to utilize decentralized energy sources, such as photovoltaic panels, for operation. However, it is important to note that neither process allows for the recovery of fluoride, and the remaining retentate contains a high concentration of fluoride. These two concerns still need to be addressed. In this study, membrane crystallization through membrane distillation is suggested as a method to recover fluoride from reverse osmosis (RO) retentates. Membrane distillation (MD) has emerged as a promising water treatment technology that can effectively handle solutions with high salinity levels [23,24]. MD offers several advantages, including the generation of high-quality permeate through vapor-driven force, which sets it apart from pressure-driven technologies. Additionally, MD requires lower thermal energy compared to conventional thermal technologies [23]. These benefits have positioned MD as a feasible alternative for producing small-scale drinking water from saline and brackish groundwater, particularly when combined with alternative energy sources [23,24,25].
Membrane distillation is commonly carried out using membrane contactors, which facilitate nondispersive contact between two phases by utilizing a membrane as a separation barrier. This contact occurs within the pores of the membrane [36], allowing mass transfer to take place due to a difference in chemical potential between the two sides of the membrane. As a result, the solvent, typically water, is transported from the feed side to the permeate side [37]. While membrane distillation is primarily used for concentration purposes rather than crystallization, if the concentration continues to increase to very high levels, saturation can be reached, leading to the precipitation of solute crystals and initiating a membrane crystallization process [37]. The use of membrane contactors for crystallization is gaining significant interest due to several advantages they offer. These advantages include the ability to independently control the flow rates of the involved phases, a known active area, easy scalability (as membrane contactors are modular in design), low energy requirements, and the prevention of solvent droplet carryover since both phases are compartmentalized [38].
Osmotic membrane distillation–crystallization (OMD) is one of the methods used for membrane distillation–crystallization. It is a concentration technique specifically designed for aqueous mixtures. In OMD, water is extracted from the feed solution by utilizing a hypertonic solution that flows downstream of a microporous hydrophobic membrane [39]. The driving force for water vapor diffusion through the membrane pores is created by the difference in vapor pressure between the two sides of the membrane, which is directly related to the water activities in the two streams [26]. It is important to note that OMD is not solely a mass transfer process, but involves evaporation at the feed side and condensation at the extract side to facilitate water transport [40]. Figure 1 shows the mass transfer operation.
OMD provides several benefits, as previously mentioned. Moreover, it is not significantly affected by concentration polarization, unlike pressure-driven processes such as NF or RO. Furthermore, it can be easily integrated into conventional RO processes to enhance the recovery factor of desalted water and improve overall energy efficiency [23,40]. While OMD has not been applied to crystallize fluoride salts, it has been proposed for the crystallization of other salts. For instance, Ruiz Salmon et al. [26] successfully used OMD to crystallize sodium carbonate. However, they observed that the main challenge in the process was the membrane itself, and there was a possibility of wetting occurring [26]. Another study demonstrated the potential of membrane crystallization in achieving a high level of recovery for pharmaceutical compounds from waste streams [41]. In a recent investigation, a novel crystallization process for sodium bicarbonate (NaHCO3) was explored, suggesting the utilization of osmotic membrane distillation (OMD) for crystallization. The researchers highlighted OMD as an innovative technology that serves as an alternative to traditional crystallizers. This is attributed to its various advantages, including reduced energy and material consumption, enhanced control over operational parameters, and a larger evaporation surface area, among other benefits [42].
Membrane technology is known for its compact design and has proven successful in decentralized areas with limited energy sources [43,44,45]. As a result, this technology can be seen as a viable solution for treating water sources in communities lacking access to high-quality water. This study proposes the integration of reverse osmosis and osmotic membrane distillation–crystallization as a method to remove fluoride from water and recover it as pure salt (NaF). This approach serves as an initial step towards providing clean water and a source of NaF. To the best of our knowledge, no previous research has explored the combination of reverse osmosis and membrane distillation–crystallization for NaF crystallization.

2. Materials and Methods

2.1. Chemicals

Deionized ultrapure water (18.2 MΩ/cm) was used to prepare the feed solutions and the aqueous osmotic solutions. Sodium fluoride (NaF 99.0–100.5%, AnalaR Normapur® ACS, Leuven, Belgium) was used to prepare the feed solution, and sodium chloride (NaCl 99.5%, AnalaR Normapur® ACS, Leuven, Belgium) was used to prepare the osmotic solution.

2.2. Experimental Procedure

2.2.1. Reverse Osmosis

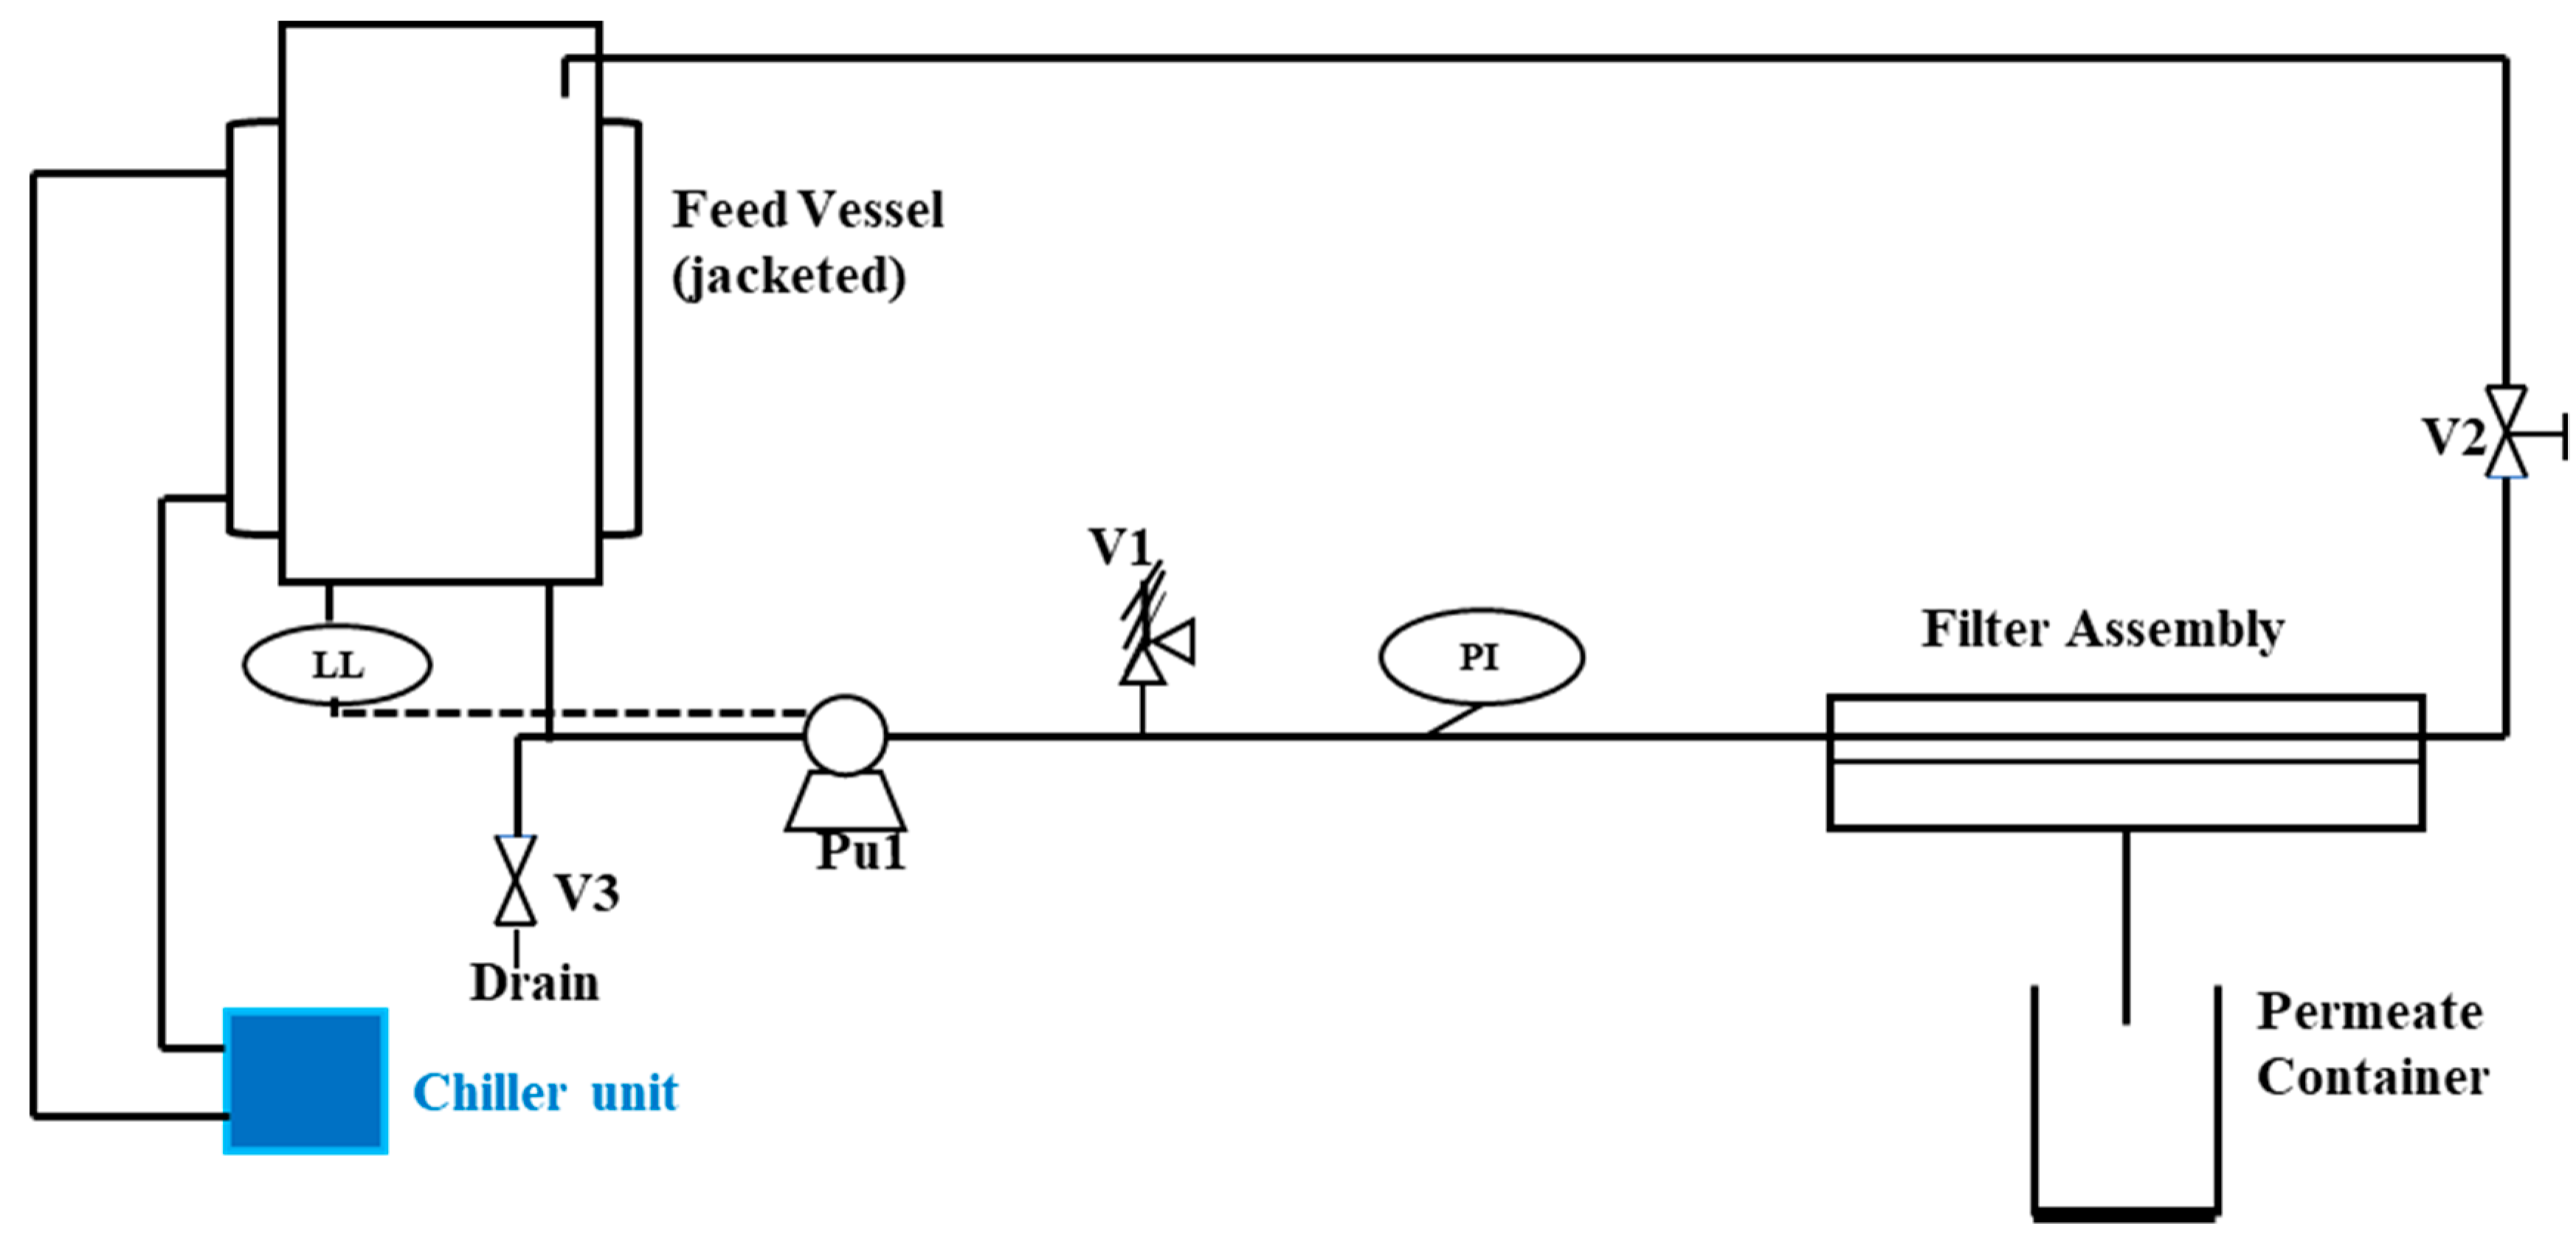
The setup used for crossflow filtration is the Armfield FT17 filtration system, which is a lab-scale crossflow flat-sheet membrane filtration unit with small product volumes (1 L). The test cell is a ring with an effective diameter of 92 mm. Figure 2 shows the schematic diagram of the experimental setup used in this study.
A commercial flat-sheet reverse osmosis membrane (Trisep X—20, from Lenntech, The Netherlands) was used to perform the RO experiments. The Trisep X—20 membrane is a new-generation, highly durable, RO membrane specifically designed for high fouling feed water [46]. Table 2 describes the specifications of the commercial membrane provided by the supplier.
Before the experiments, the membrane was thoroughly rinsed with ultrapure water (18.2 MΩ/cm) and soaked in ultrapure water at least for one day before being loaded into the membrane testing cell. Then, it was placed in the RO unit, and it was compacted with ultrapure water at 5 bar for 30 min to ensure a stable membrane. Afterwards, crossflow membrane filtration experiments of synthetic NaF feed solutions were performed under various operating pressures (15–40 bars). The synthetic NaF feed solutions were prepared by considering different fluoride background concentrations in the Rift Valley groundwater wells in Ethiopia, which typically range between 1.1 and 68 mg FL−1. Fluoride-containing synthetic solution at concentrations of 5 mg FL−1, 10 mg FL−1, 18 mg FL−1, 30 mg FL−1 and 70 mg FL−1 were thus prepared. The pH range of the synthetic solution was 6.9 to 7.1. The water permeability, permeate flux and rejections were studied.
When pure NaF (sodium fluoride) is diluted with ultrapure water, it dissociates into its constituent ions, sodium cations (Na+) and fluoride anions (F). The dissociation reaction is as follows:
N a F ( s ) N a + + F
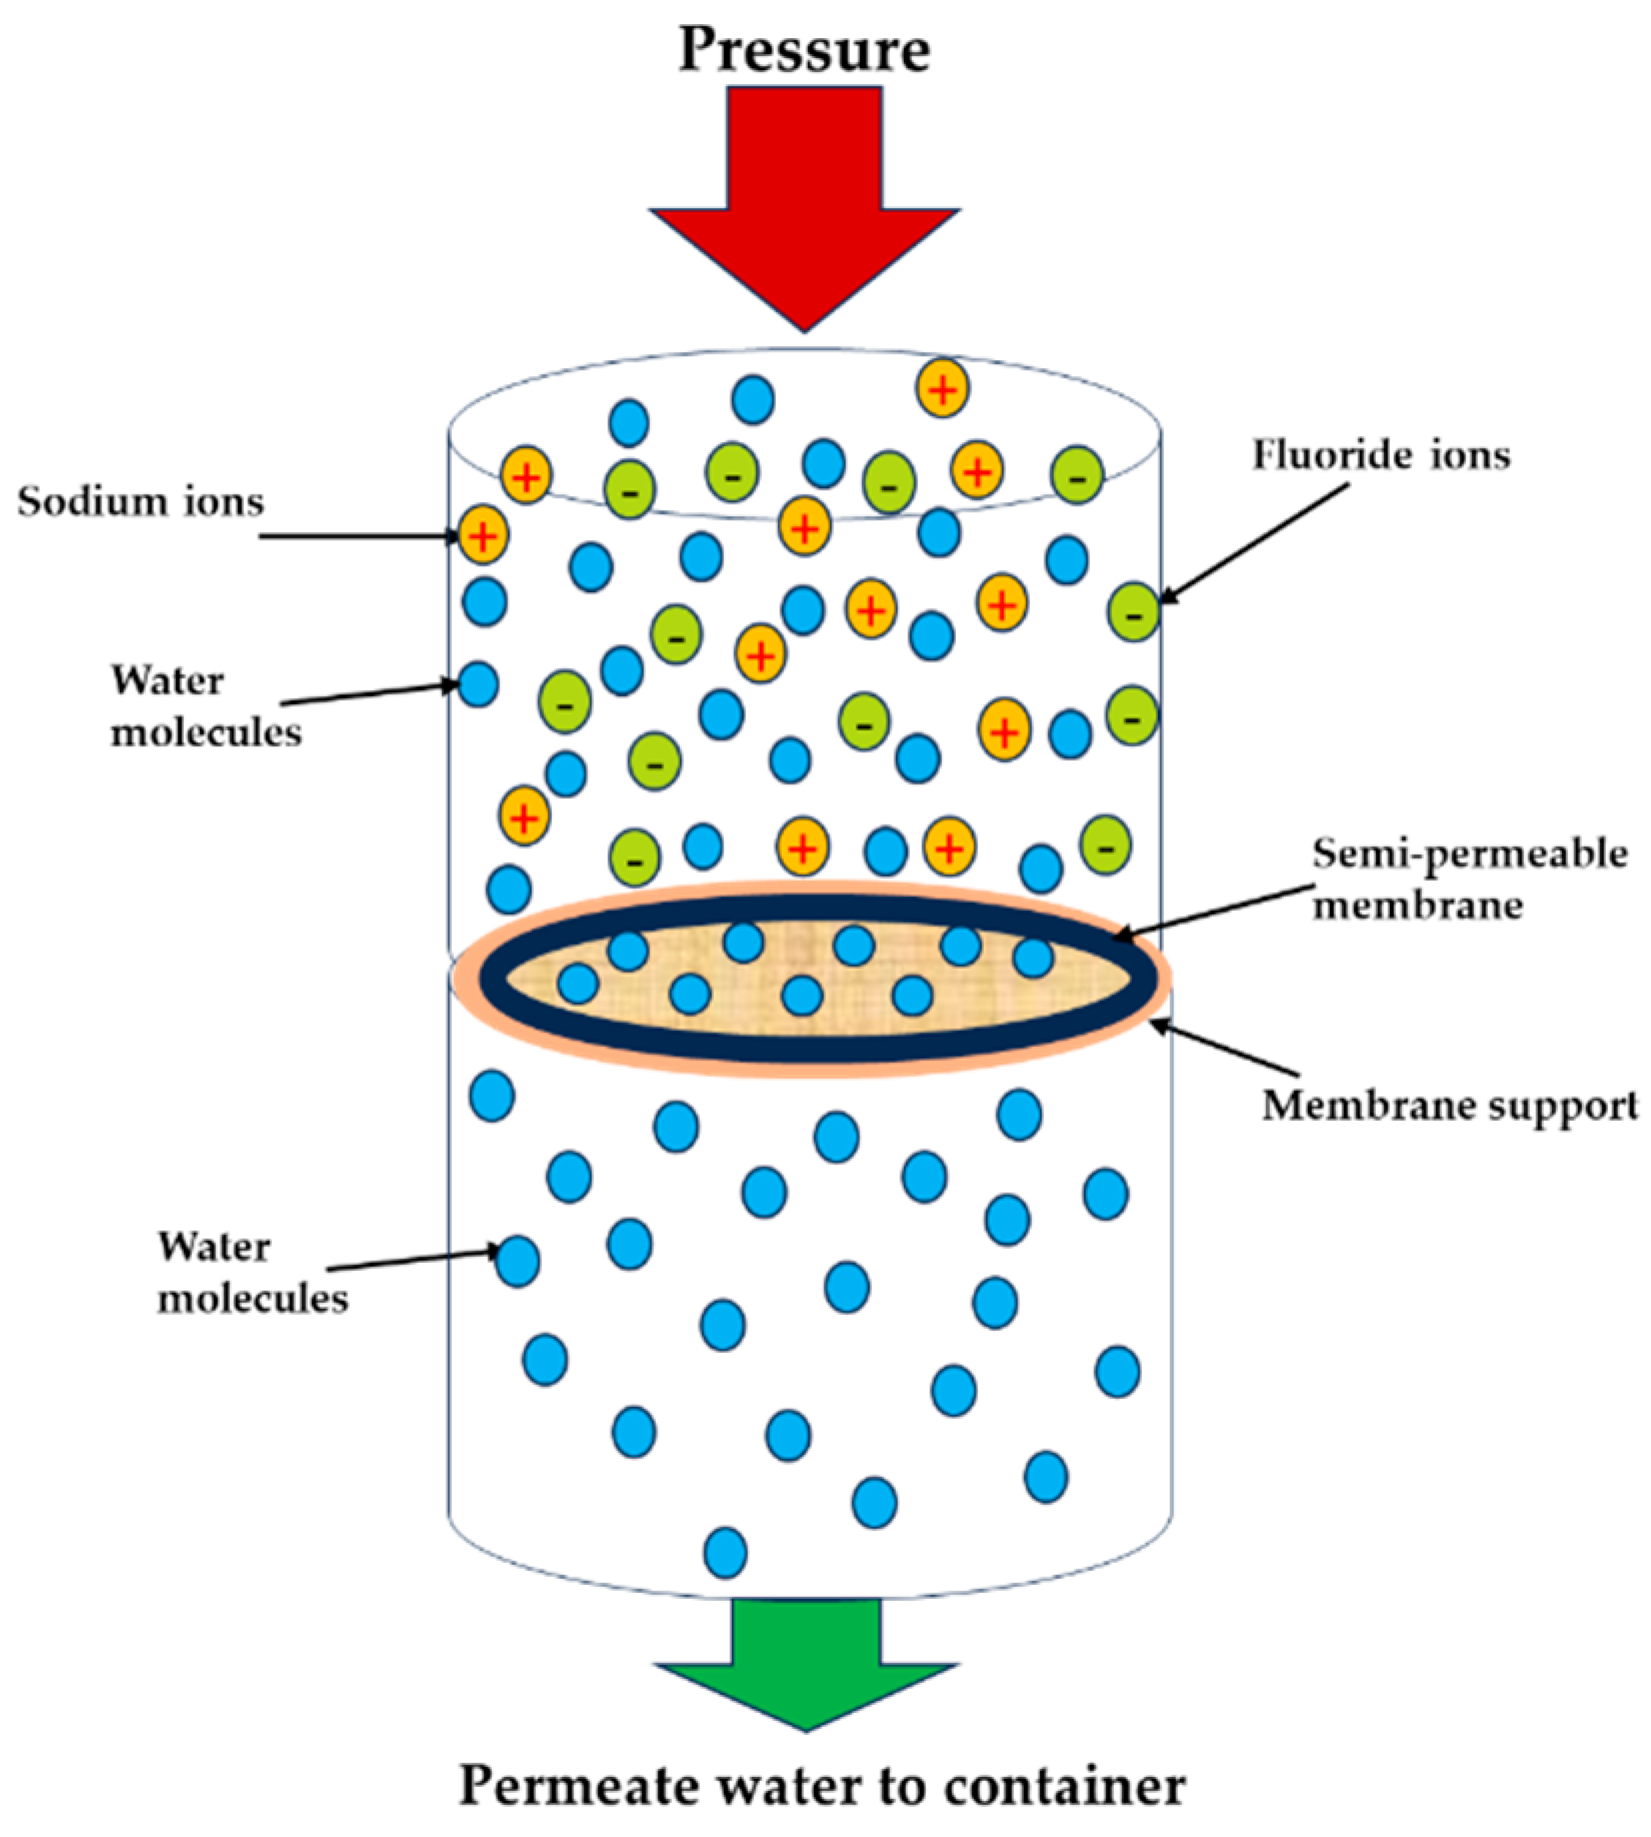
The concentration of ions in the water depends on the amount of NaF dissolved. It is important to understand that NaF is a highly soluble salt that completely dissociates into its constituent ions when dissolved in water. As a result, the resulting solution becomes electrically balanced, with an equal number of positive and negative charges. The negatively charged membrane and the fluoride anion experience electrostatic repulsion, making it less likely for fluoride to be adsorbed [47,48]. For effective fluoride removal using RO/NF membranes, it is recommended to operate in a weak alkaline environment t [49]. This is because most polymeric membranes exhibit an increase in negative surface charge as the feedwater pH is increased. In our study, the pH of the sample ranged from 6.9 to 7.1. The polyamide–urea membranes used have a dense layer of material that acts as a physical barrier, preventing the passage of dissolved salts and impurities. This material carries a negative charge, which promotes the repulsion (rejection) of fluoride ions. The mechanism of fluoride removal using the RO technique is illustrated in Figure 3.
Permeate fluxes of the crossflow membrane filtration tests at different operating conditions were determined by measuring the permeate weight collected in a given time interval per unit membrane area (Equation (2)):
J = V A t
where J (Lh−1m−2) is the permeate water flux, V (L) is volume of the permeate, A (m2) is the effective membrane surface area, and Δt (h) is the time interval to collect the permeate. The permeate weight was measured by a weight balance with a precision of ±0.01 g. All weight measurements were converted into volumetric measurements. In addition, the pure water permeability was determined using Equation (3):
L p = J P π
where Lp is the pure water permeability (Lh−1m−2bar−1) and ΔP and Δπ define the transmembrane pressure and the osmotic pressure differences across the membrane (bar), respectively. The osmotic pressure differences across the membrane were determined by using Equation (4):
π = v i c i R T M W
where vi is the number of ions in the dissociated salt, ci is concentration (gL−1) of solute, R is ideal gas constant (L atmK−1mol−1), T (K) is temperature at each operating condition, and MW (gmol−1) is molar mass of the ion. In this work, given the low concentrations of NaF in the feed solution, the osmotic pressure was 0.01 bar, having a negligible effect in the calculation of the permeability.
The observed rejection was calculated by Equation (5):
R = 1 C p C f 100
where R is the rejection (%) and Cp and Cf are permeate and feed concentrations (mgL−1), respectively.
The concentrations of the permeate and retentate were determined using a conductivity meter from Metrohm (914 pH/Conductometer, Germany). To establish a calibration curve, the conductivity of NaF standard solutions at various dilutions was measured at a temperature of 20 °C. The resulting data were used to plot the NaF concentration against the corresponding conductivity values (refer to Figure A1 in the Appendix A). By measuring conductivity, the salt concentration of the solutions could be determined. In this study, the conductivity values are expressed in millisiemens per centimeter (mScm−1) for the concentration ranges used. The conductivity cell of the device was calibrated with a standard KCl solution every other day.

2.2.2. Membrane Distillation–Crystallization

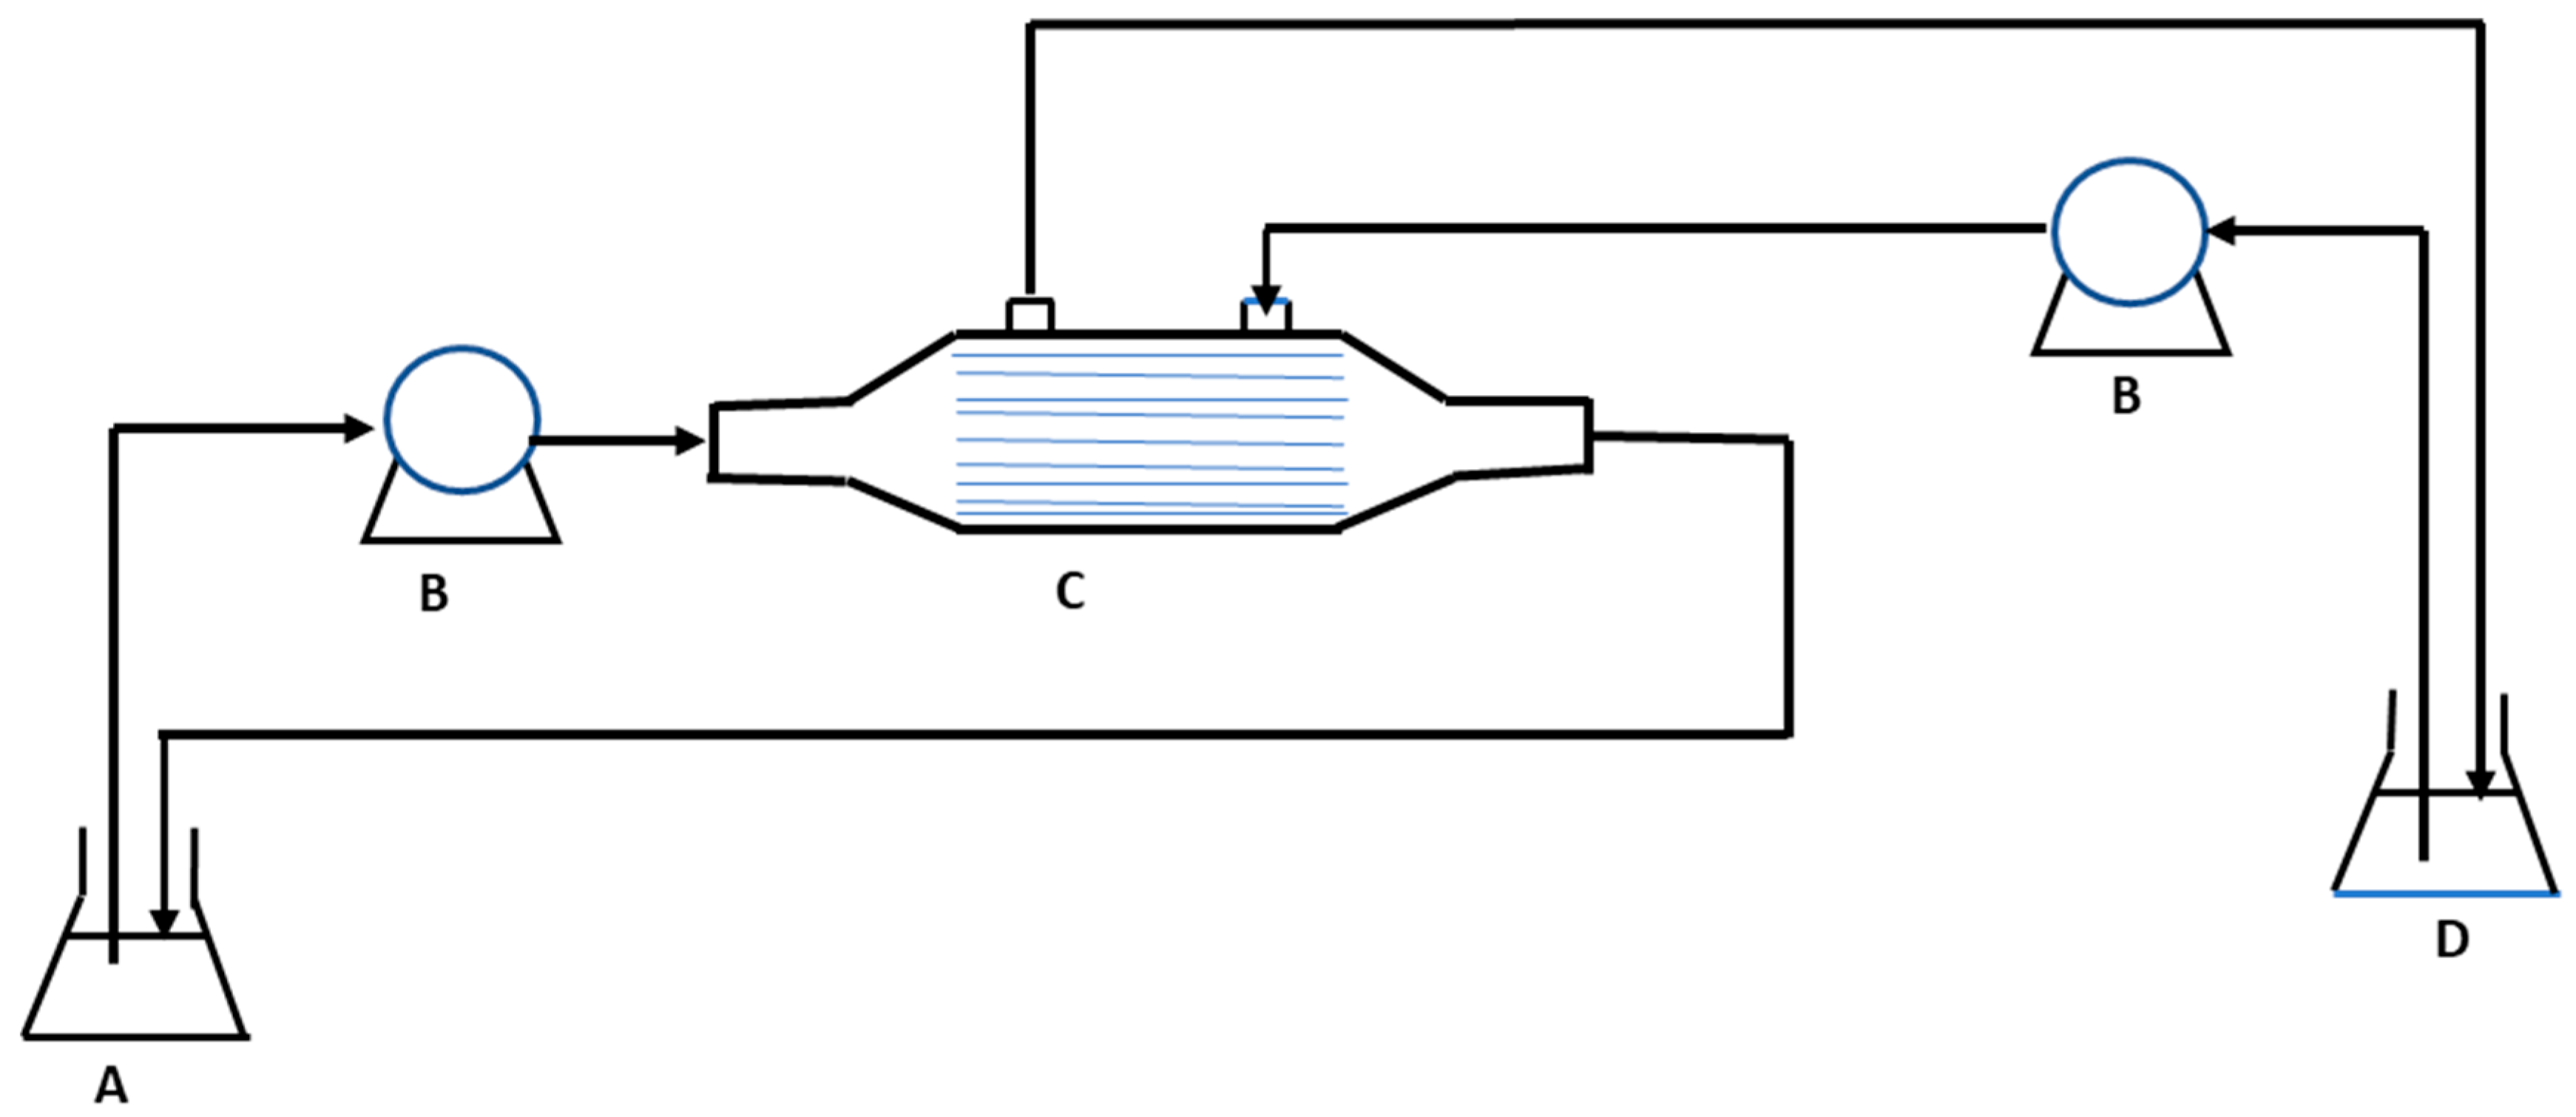
The experimental setup for osmotic membrane distillation–crystallization is illustrated in Figure 4. In this setup, a membrane contactor serves as a nonselective barrier between two solutions: the feed solution containing NaF, which undergoes crystallization as water permeates through the membrane, and the osmotic solution, with a high concentration of NaCl. The membrane distillation–crystallization apparatus employed was a hollow fiber membrane contactor 2.5 × 8 Extra-Flow ModuleTM Liqui-Cel® from Membrane GmbH, Germany. The key specifications of the membrane contactor can be found in Table 3. The permeate side was consistently maintained at room temperature. Two Masterflex peristaltic pumps were employed to circulate the feed stream (NaF solution) and the osmotic stream (NaCl solution) from the reservoirs to the membrane contactor, operating in a countercurrent mode. The feed stream flowed through the lumen side of the membranes, while the osmotic stream circulated through the shell side.
Several concentrations and flow rates were studied. The feed stream was prepared with various concentrations ranging from 0.01 to 40 g NaFL−1 (lower feed concentrations were selected by considering groundwater fluoride concentrations), and the osmotic solution was prepared at 100, 200 and 350 g NaCl L−1. The feed flow rates used during the experimentation ranged between 50 and 600 mL min−1, and the osmotic flow rate was kept constant at 300 mL min−1. All the experiments were performed at room temperature (20 ± 1 °C). When crystals were obtained at the bottom of the reservoir, the supersaturated solution was left for 12 h to allow the crystals to grow. Then, it was filtered to remove the water from the samples.
To minimize the impact of osmotic solution dilution on the transmembrane flux, the initial osmotic volume (1.5 L) was larger than the feed volume (1 L). In experiments where crystal formation occurred, the settling of crystals took place in a reservoir with a cylindrical shape that was not stirred. The conductivity of the solutions was measured using a conductivity meter (914 pH/Conductometer Metrohm, Germany). The conductivity cell of the meter was calibrated weekly using a standard KCl solution. Both the feed and osmotic solutions were maintained at room temperature, and the experiments were conducted at room temperature (20 ± 1 °C).
Two parameters were used to characterize the membrane system: the transmembrane flux (J, m3m−2·s−1) and the overall mass transfer coefficient (Kov, m3m−2 Pa−1s−1). The transmembrane flux (J) was determined by measuring the weight of the feed tank over time using a balance (LP 4202I, VWR, Milano, Italy). The measurements were recorded at 20 min intervals. The flux shown in the figures in the Results section is an average of the fluxes during the experiment, calculated by Equation (6) [50]:
J = 1 A . ρ w a t e r . w f t i + 1 w f t i 1 t i + 1 t i 1 [ m l m 2 m i n ]
In this equation, A is the active membrane area, ρwater is the water density, and wf (ti) is the feed reservoir weight at the measure number i.
The transfer of mass from the feed to the osmotic solution occurs because of the disparity in water activity between the two sides of the membrane. Therefore, the primary parameter used to assess the process is the overall mass transfer coefficient, Kov (m Pa−1 s−1), which can be determined using the following equation (Equation (7)) [26,41]:
J = K o v p = K o v ( p f * a f p p * a p )
where J is the water flux calculated in Equation (6), a is the water activity of the feed (f) and osmotic (p) side, and p f * and p p * are the water vapor pressures (Pa) of the feed and the osmotic solution, respectively.
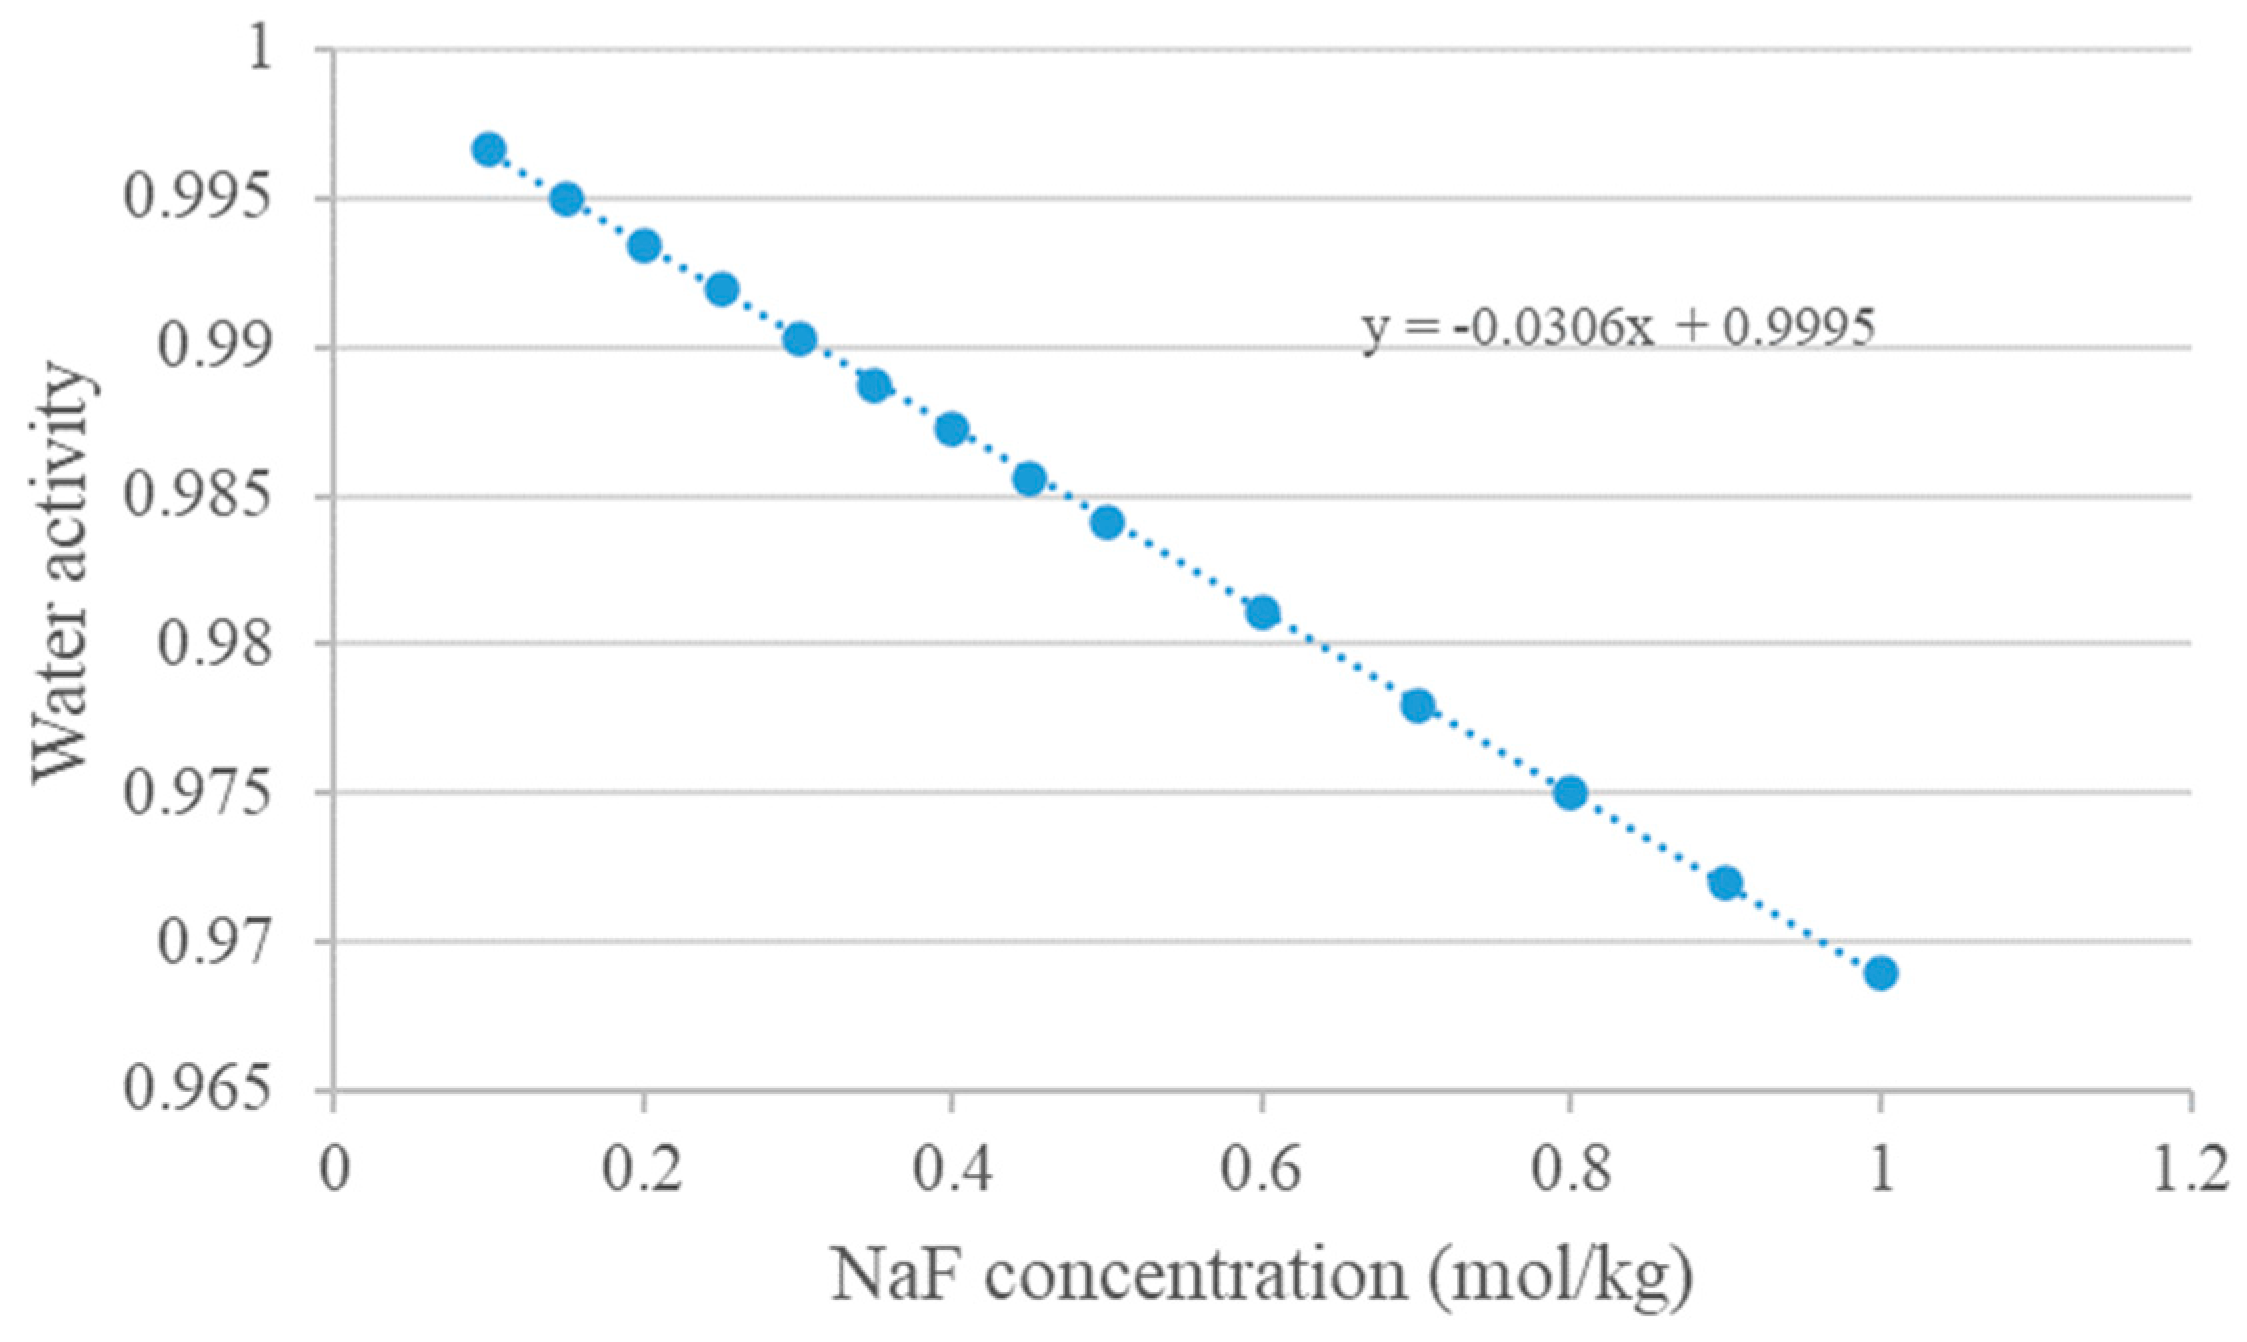
Both water activity and water vapor pressure were utilized at the specific operating temperature. The water activity of a pure NaF solution was determined using Equation (8) [51], provided that the osmotic coefficients for the specific salt concentration were available in the literature (refer to Figure A6 in the Appendix B). If these values were not available, the water activities were calculated using the method described by Sandler [52], included in the Appendix B.
φ = 1000 v m M l n a w
where φ is the osmotic coefficient, v is the number of ions that the solute molecule dissociates in the solution, m is the molality (mol kg −1), M is the molar mass (g mol−1) of the solvent, and aw is the water activity.
The Antoine equation is used to estimate the vapor pressure of water (p*, in mm Hg) at a given temperature (T, in °C) [26,41]. It is expressed as:
  p * T = 10 8.07131 1780.68 233.426 + T

2.3. Crystal Characterization

The crystal structure of the NaF sample was analyzed using a Bruker AXS D8 ADVANCE diffractometer. The XRD pattern was obtained by scanning from 20° to 100° with a step size of 0.02° and a time step of 2.4 s. The external morphology and crystalline structure of the sample were examined using scanning electron microscopy (SEM) analysis with GEMINI, Zeiss, ULTRA-55. Additionally, the size distributions of particles were determined using a Coulter LS 100 Q laser particle analyzer, which is capable of measuring particles ranging from 0.4 µm to 900 µm.

3. Results and Discussion

3.1. RO Results

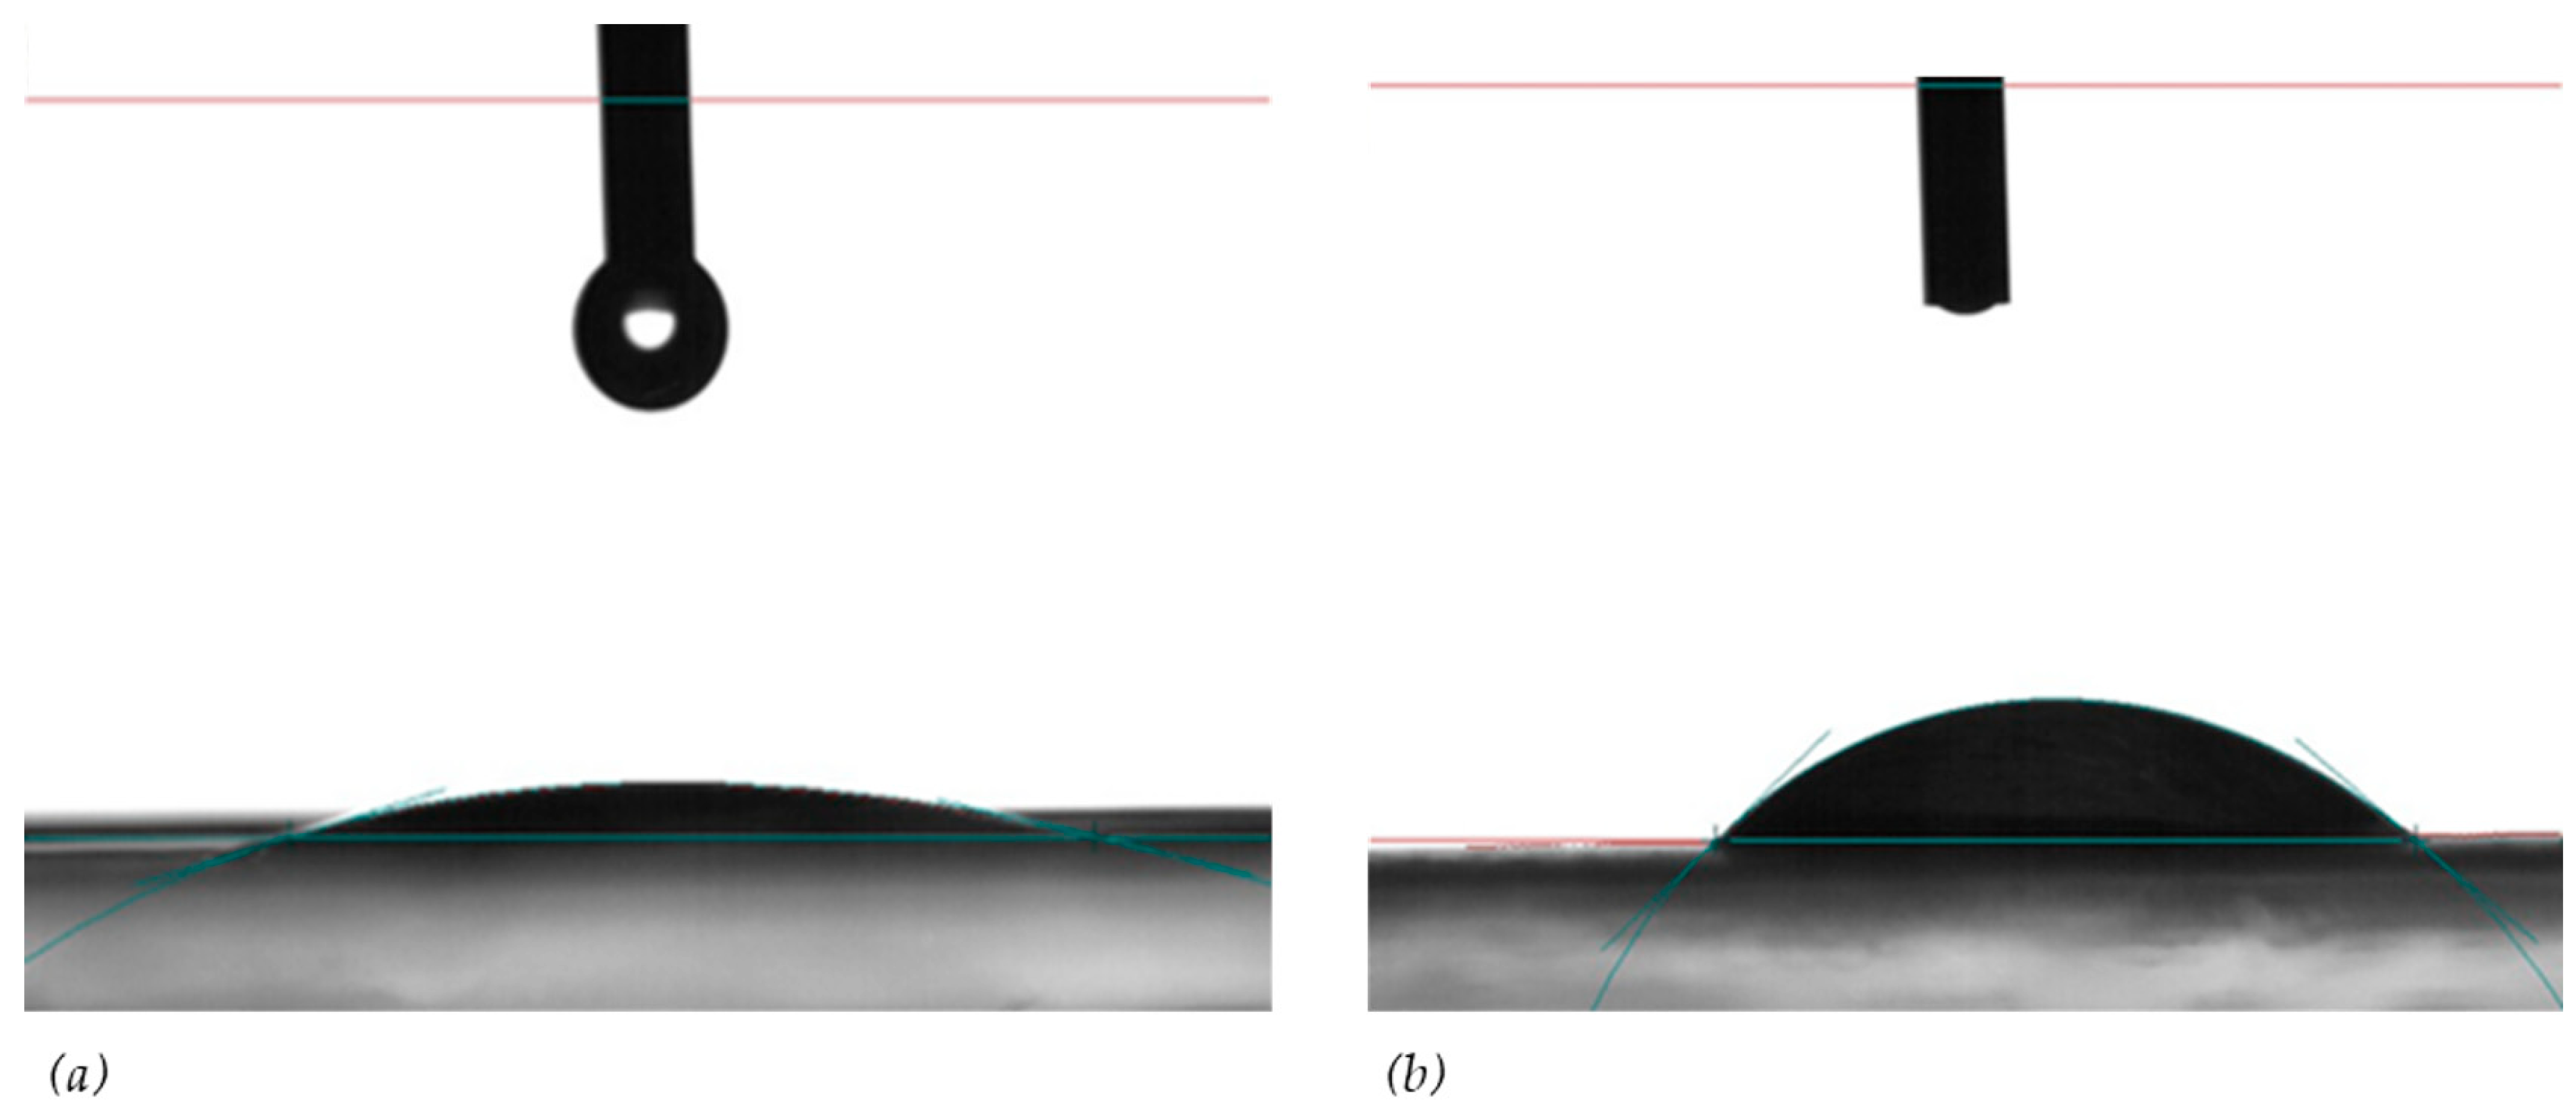
The hydrophilicity of a polyamide membrane can be determined by measuring its contact angle, which indicates how well the membrane surface can be wetted by a liquid. A hydrophilic membrane will have a small contact angle, typically less than 90 degrees. A more hydrophilic membrane will exhibit better wettability and higher permeate flux, assuming other surface properties remain the same [53]. A membrane that is more hydrophilic, softer, and neutrally charged will have a lower potential for fouling. Conversely, higher contact angles indicate a more hydrophobic surface [54]. In this study, the contact angle of the X—20 RO membrane was measured before and after filtration using an optical contact angle measuring and contour analysis system (DataPhysics OCA-Series). Prior to filtration, the mean contact angle ranged from 10.1° to 15.8°, while after filtration, it ranged from 27.2° to 58.9°. Figure 5 illustrates the contact angle before filtration (a) and after filtration (b).
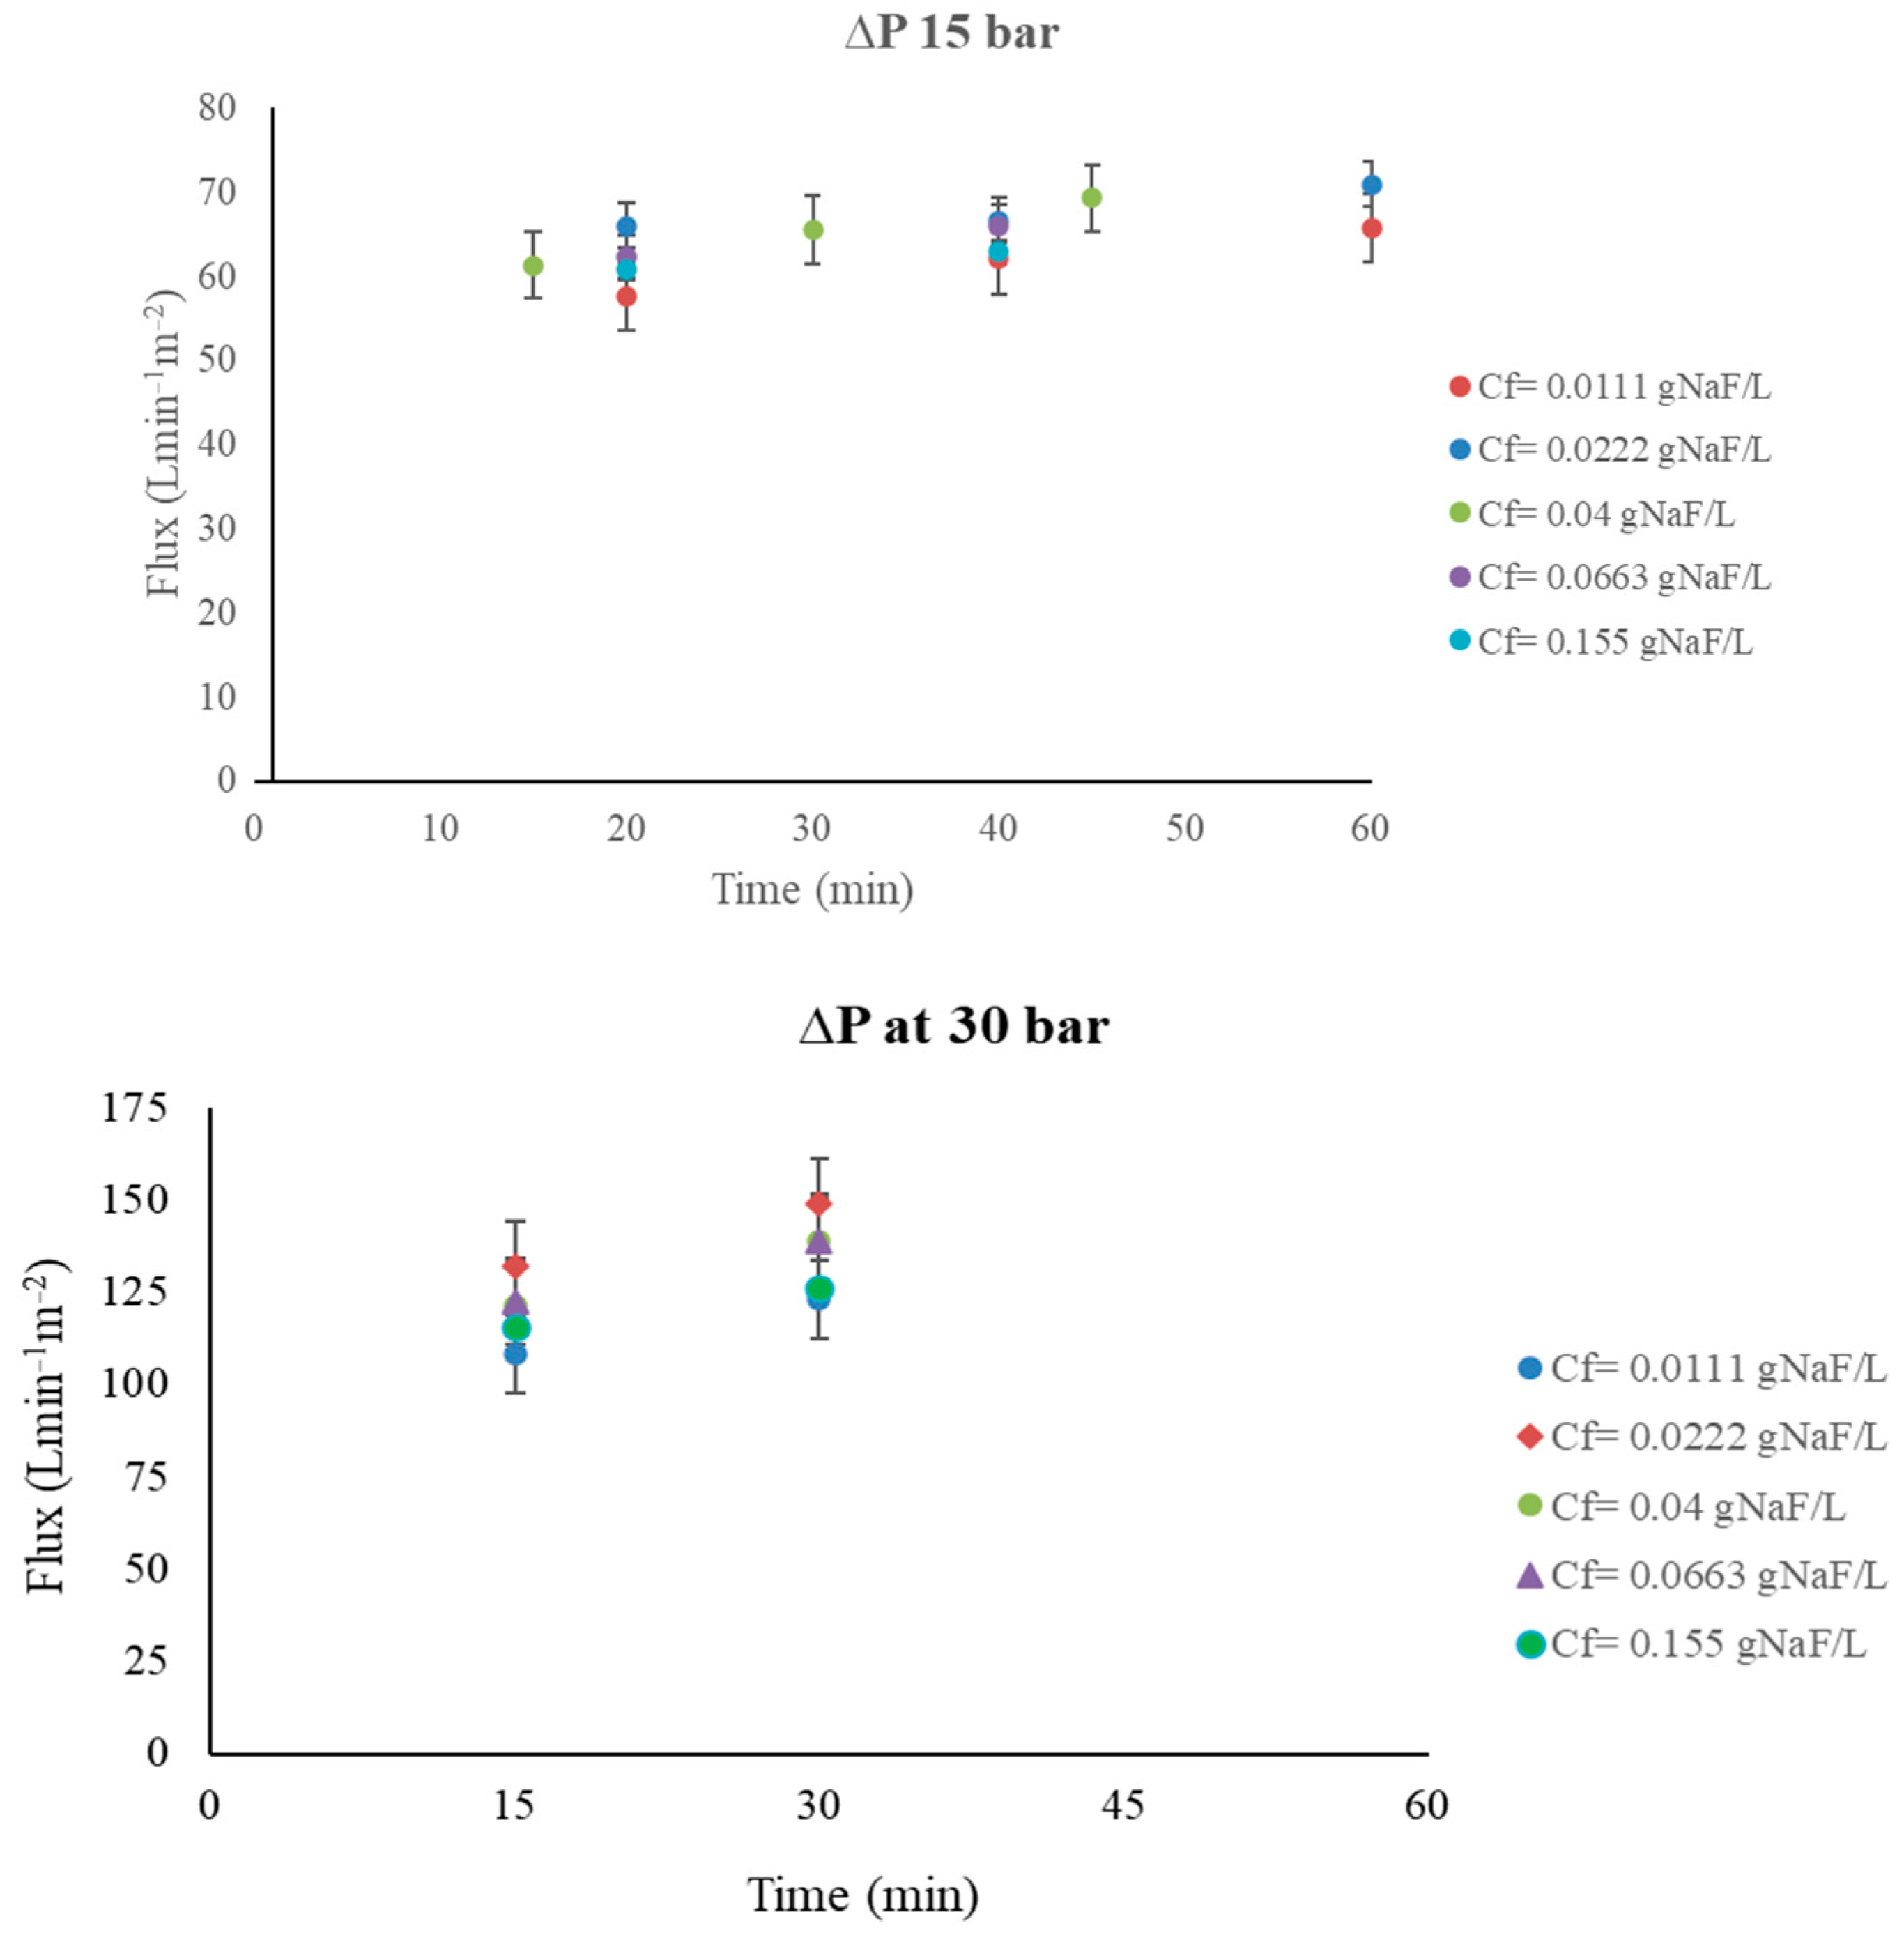
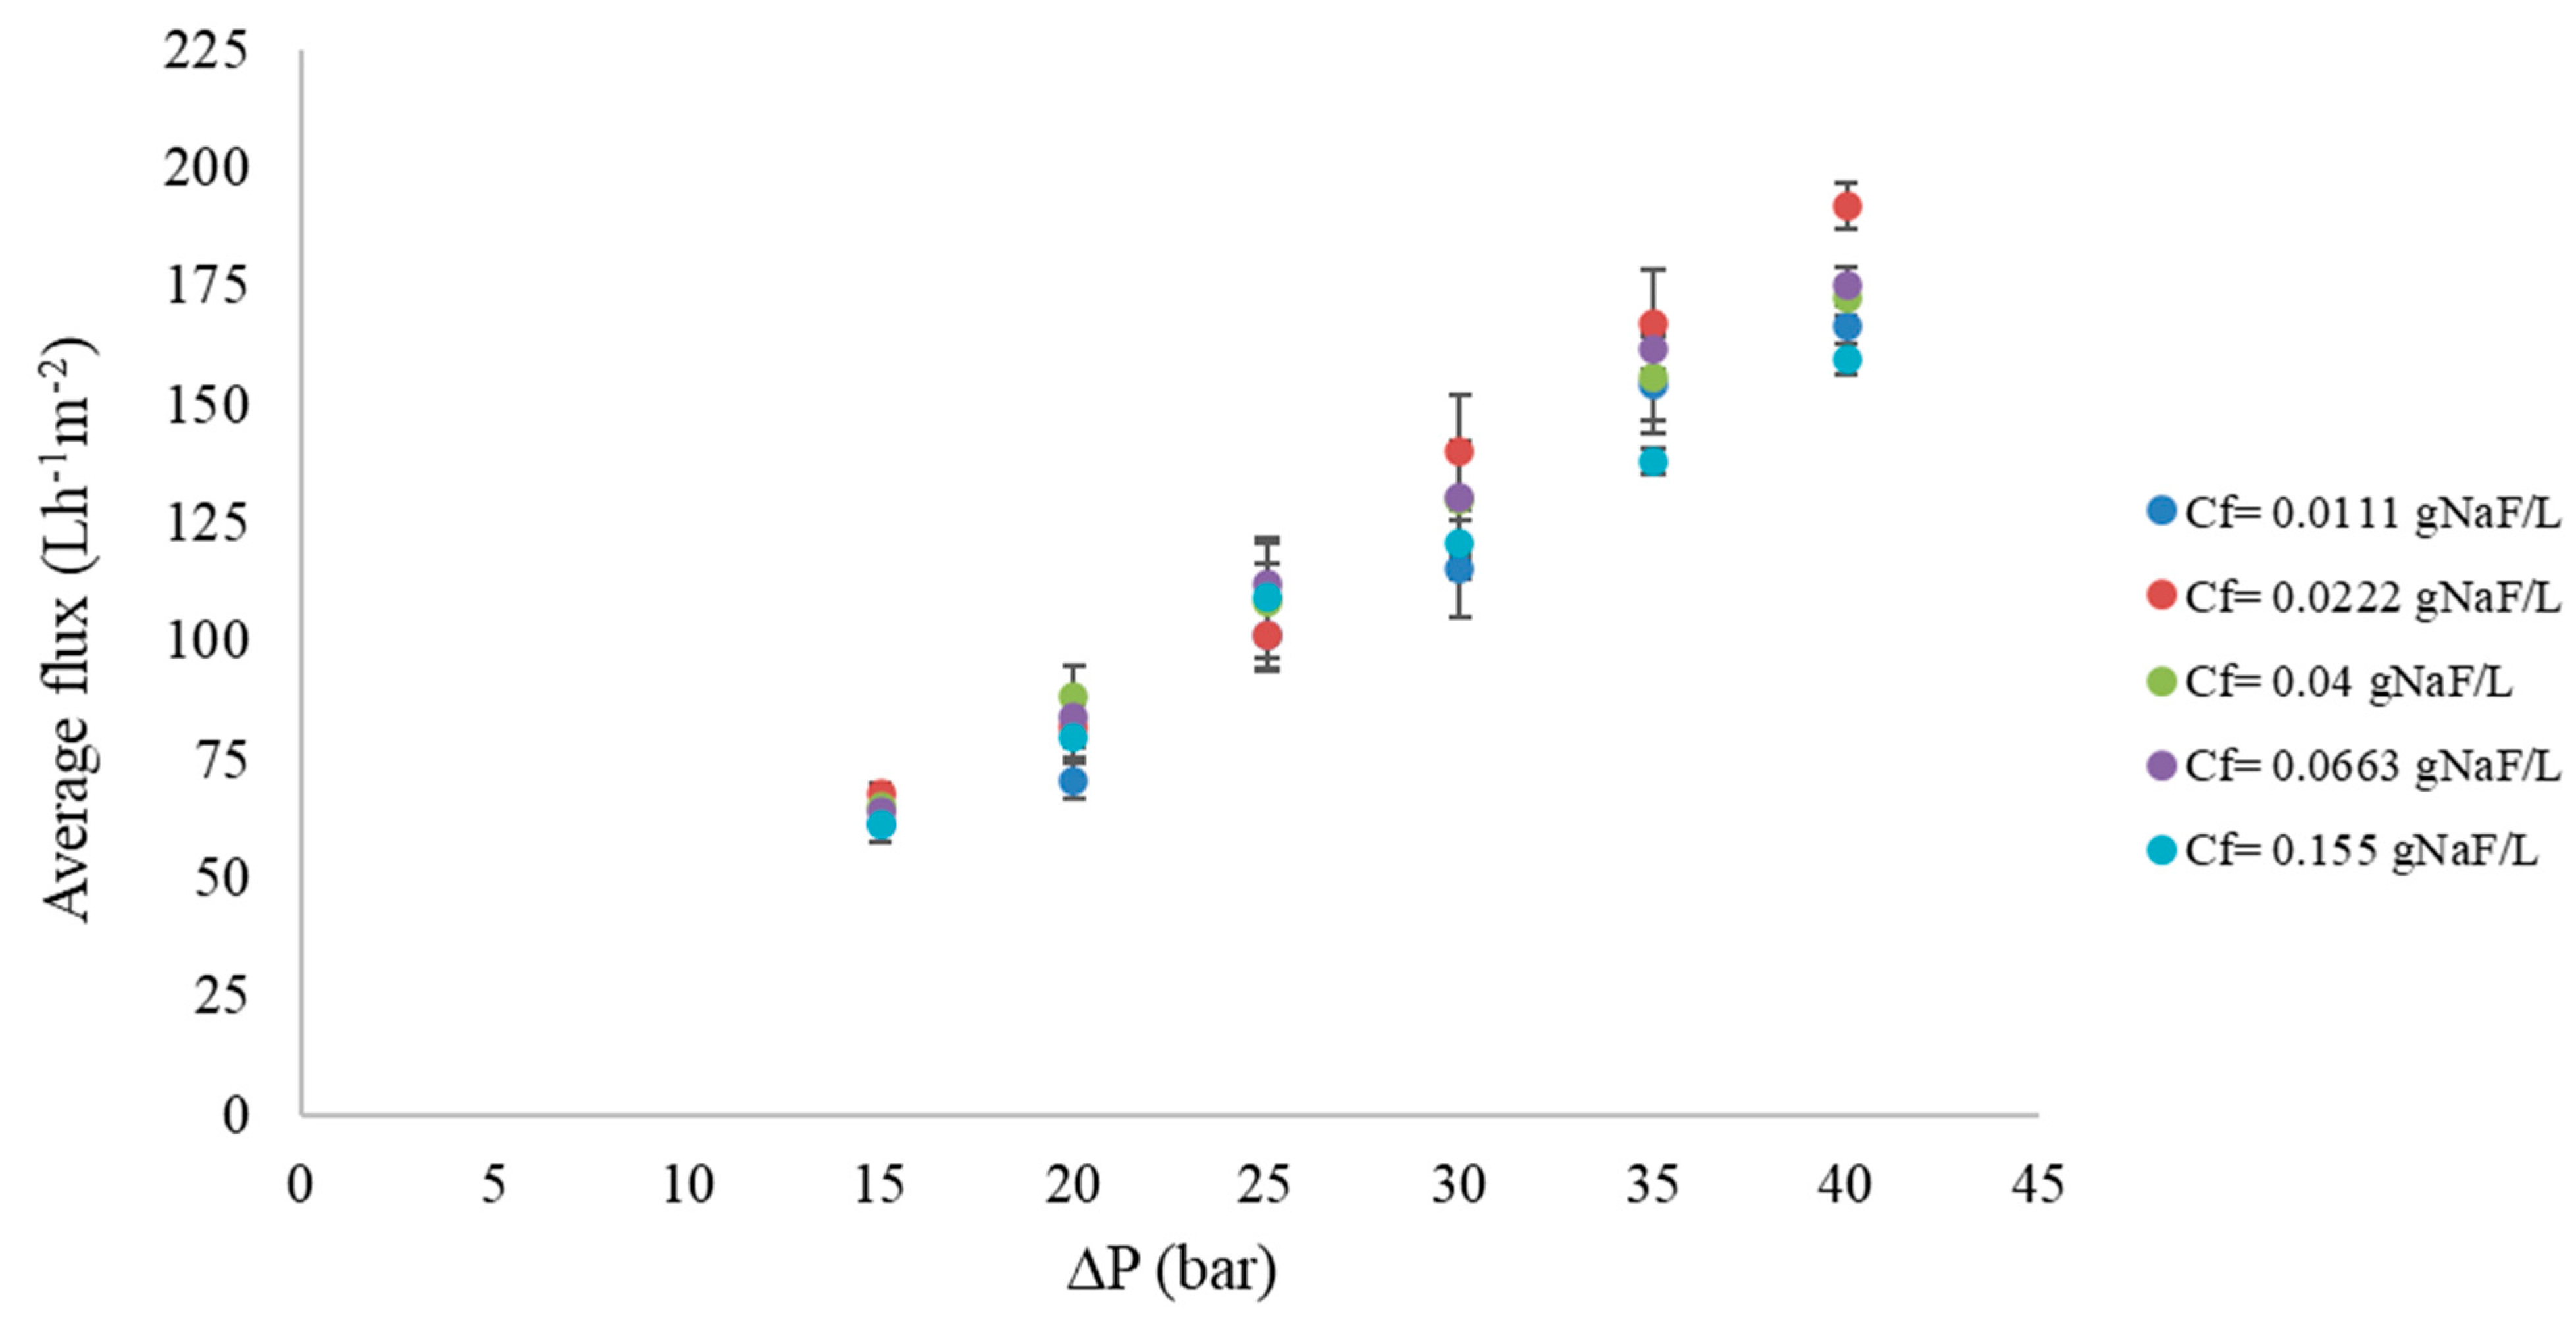
Permeate flux is an important parameter for assessing membrane performance [55]. In this study, the permeate flux performance of the X—20 RO membrane was investigated under various feed and operating conditions. The transmembrane operating pressure was varied between 15 and 40 bars. Throughout the experiment, the flux remained consistent, as depicted in Figure A4 in the Appendix A. Figure 6 illustrates the relationship between permeate flux and time at different transmembrane pressures. It was observed that the permeate flux increased linearly with transmembrane pressure, regardless of the feed concentration.
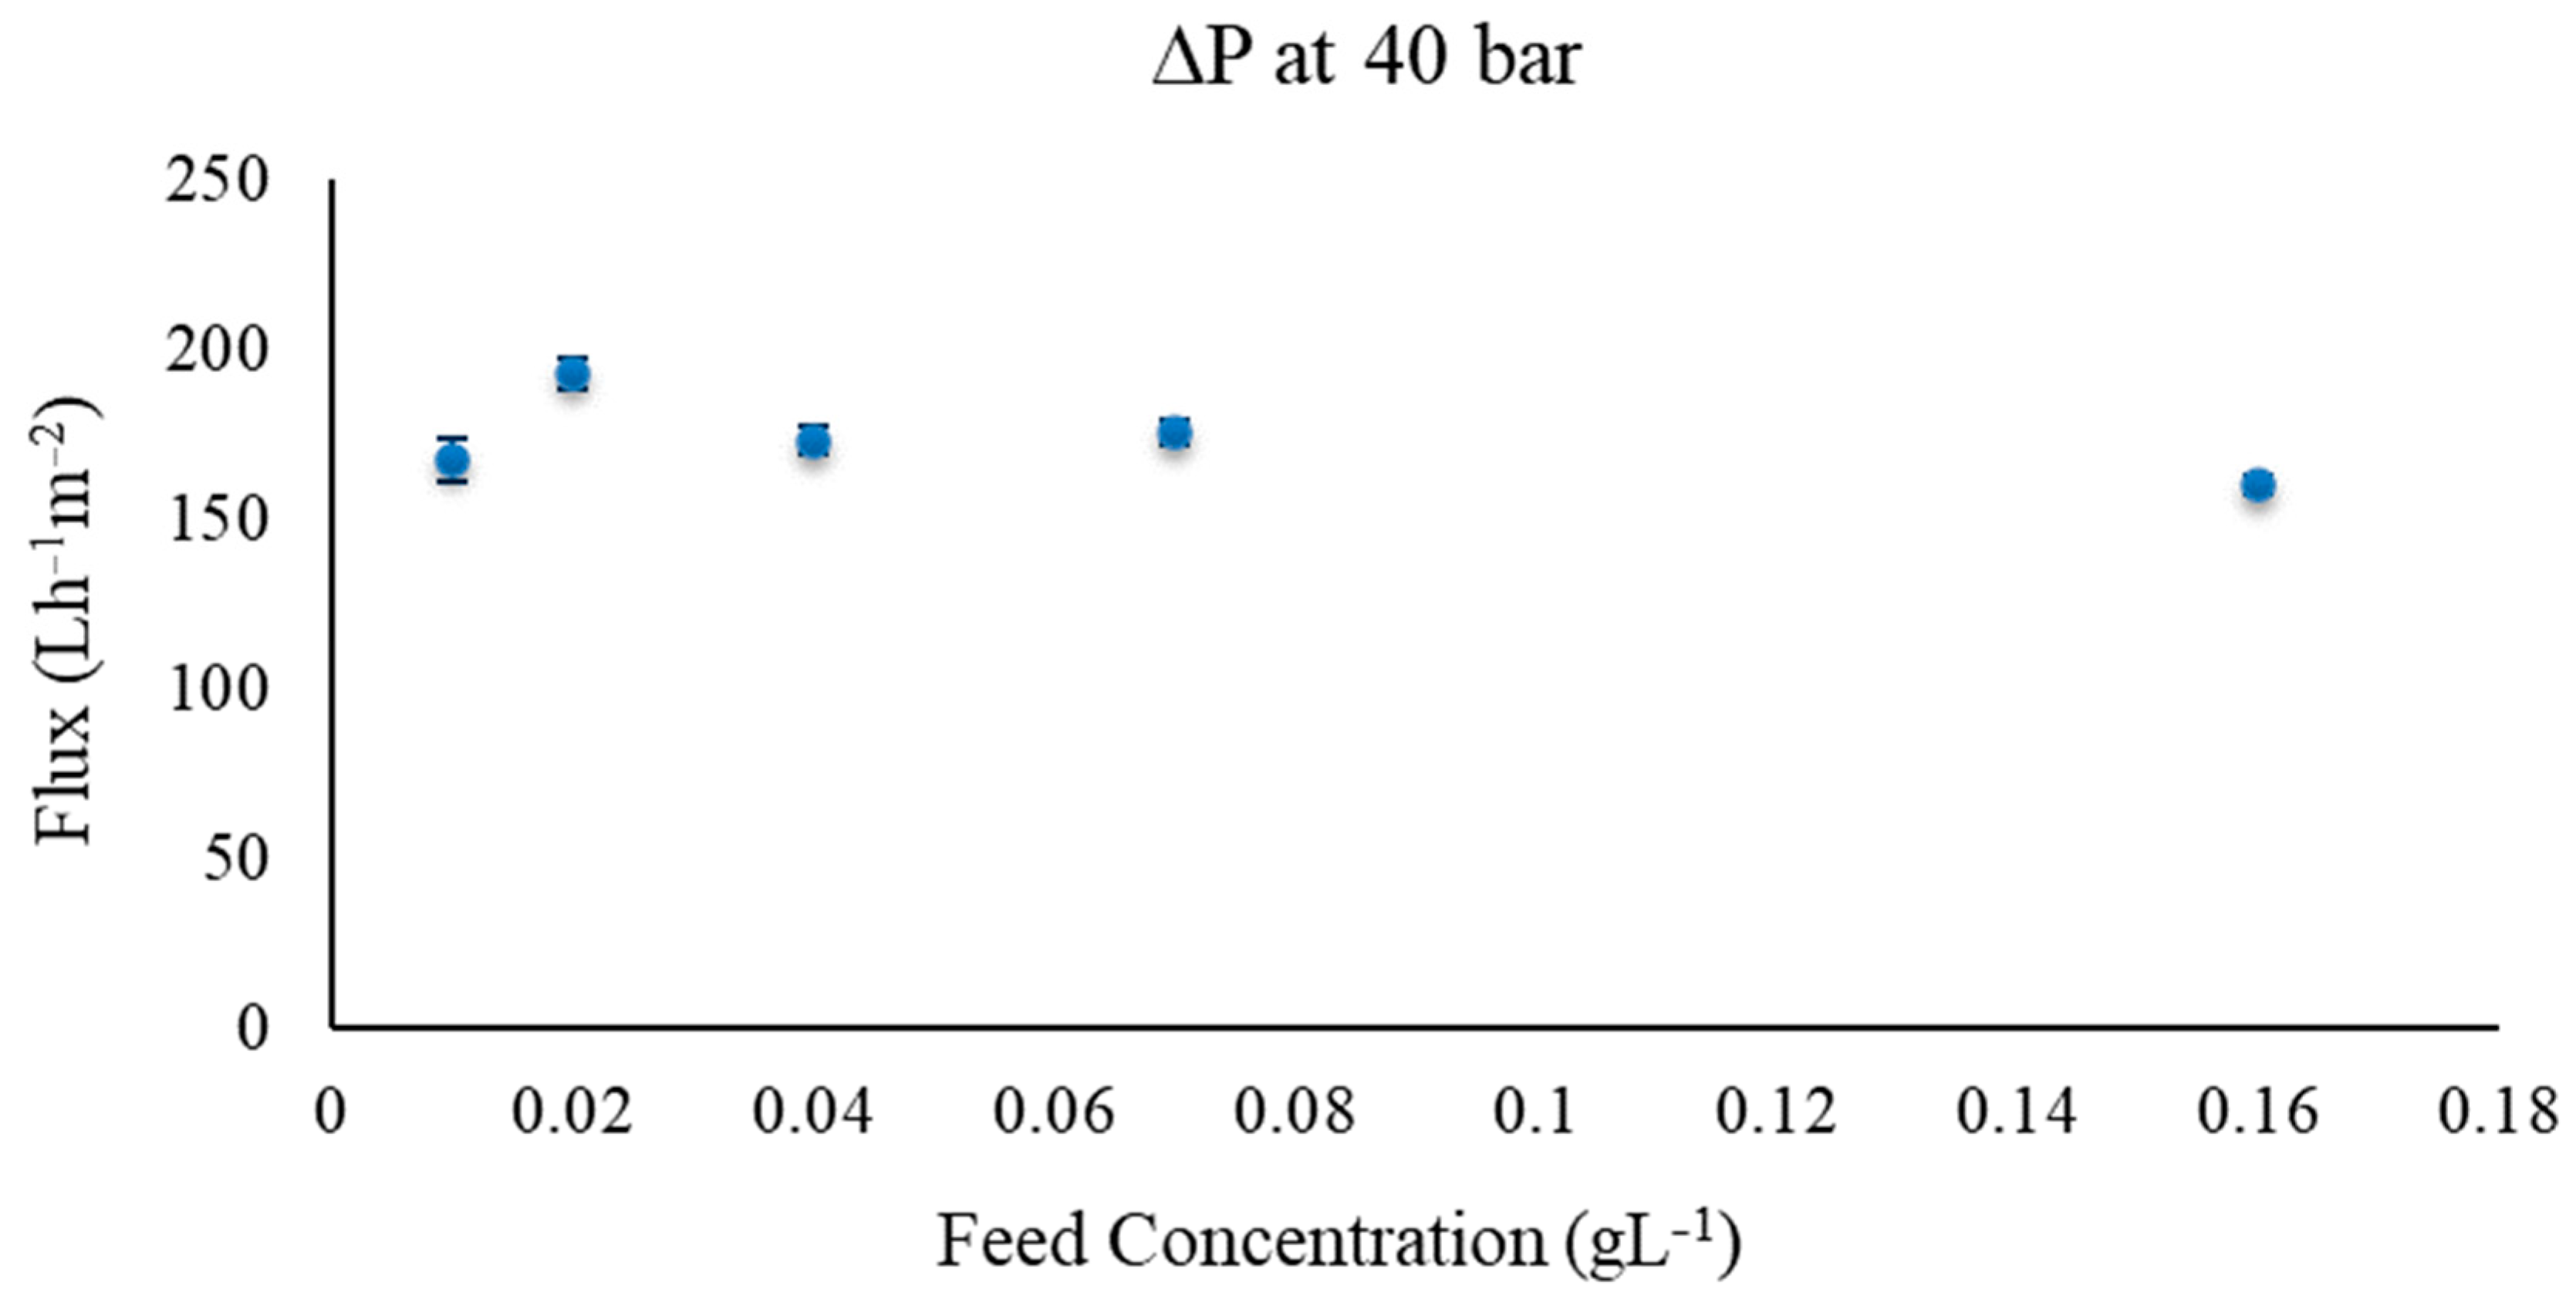
In addition, the higher the transmembrane pressure, the larger the effect of the feed concentration. Figure 7 shows the effect of concentration at 40 bar. The maximum flux was observed at 40 bar. This is because higher transmembrane pressure increases the driving force and thus the fluid transfer through the membrane. The permeate flux, however, is slightly affected at higher concentrations (0.16 gL−1). As salt deposits increase, incoming water flows encounter increased resistance to permeation through the membrane. This can be the impact of concentration polarization.
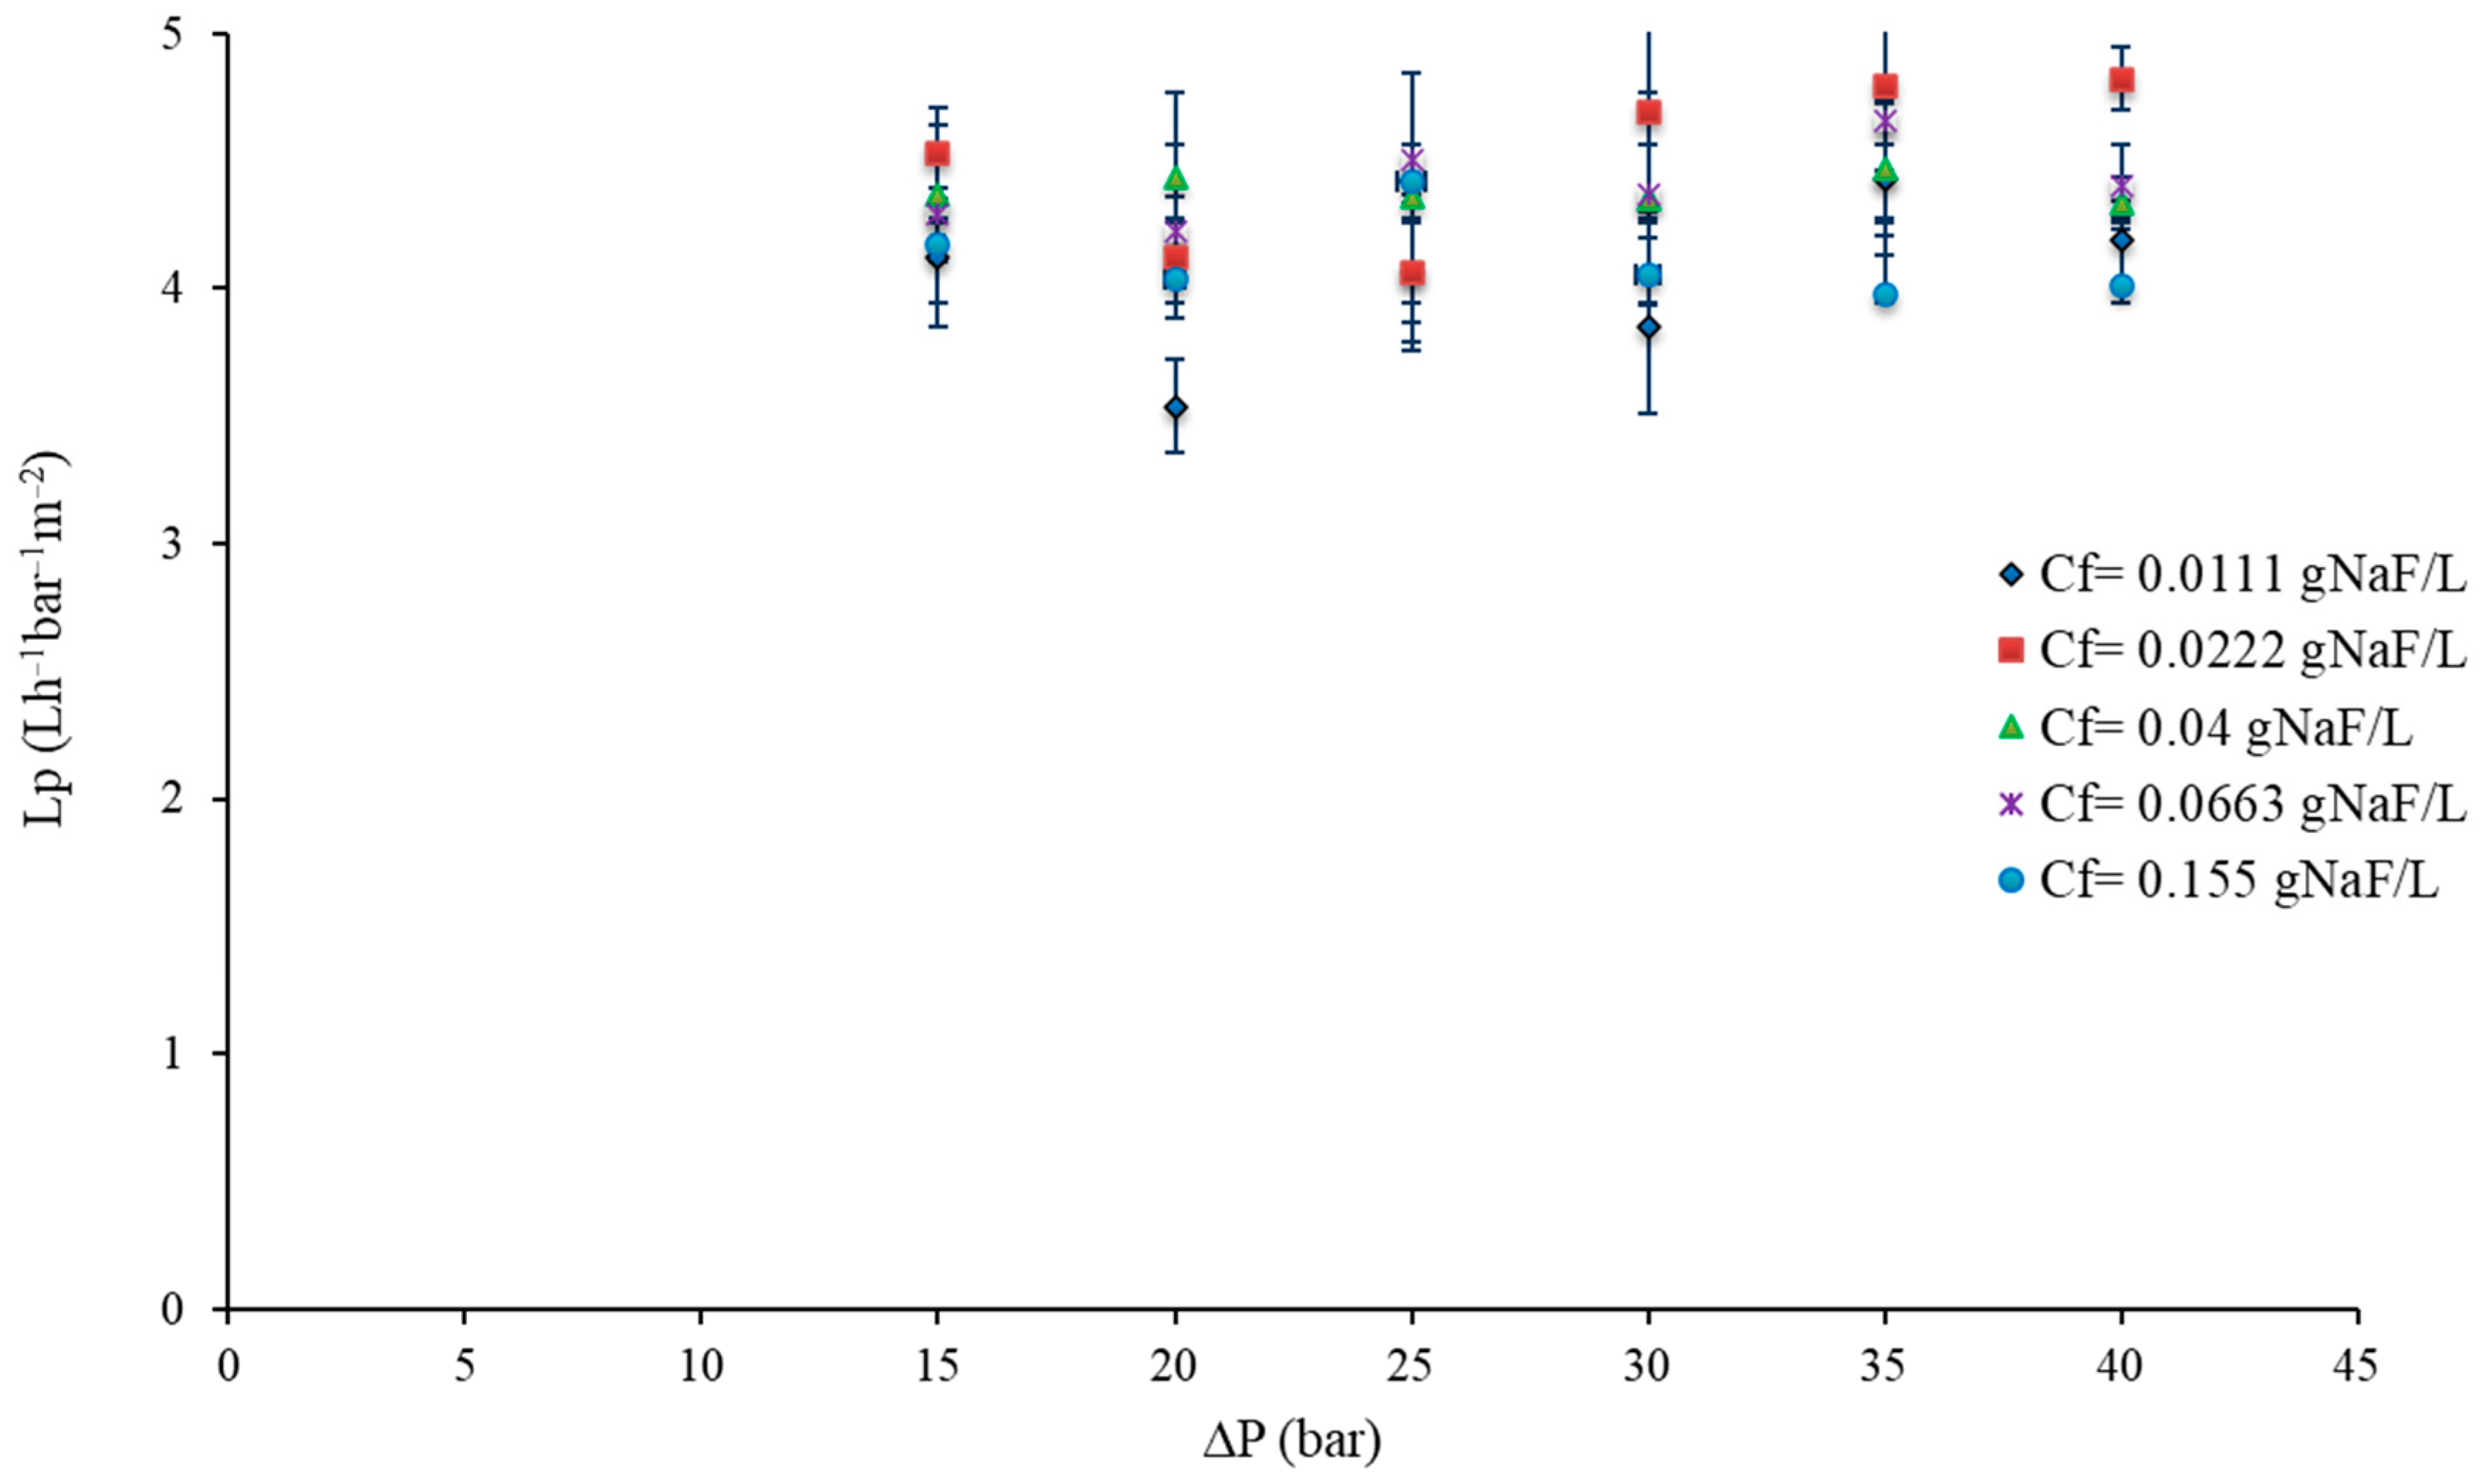
The average pure water permeability of the membrane was calculated according to Equation (3). Figure 8 shows the effect of pressure and concentration on the permeability. The maximum pure water permeability of the membrane was found to be 4.50 ± 0.25 Lh−1 bar−1m−2 and the minimum was 4.02 ± 0.26 Lh−1 bar−1m−2. Previously, it was observed that the permeate flux increases with the increase of transmembrane pressure, and it was found that permeate flux varied linearly with applied pressure; however, it is not the case that for permeability, it shows relatively a consistent trend.
The effect of feed concentration on the retention of fluoride as a function of transmembrane pressure can be observed in Figure 9. The rejection performance of the membrane varies from 92.5% to 98.6% depending on the applied transmembrane pressure. The fluoride ion concentration was less than 5 mgL−1 when the rejection was 98.6%, and for concentrations ranging from 5 to 70 mgL−1, the rejection was over 95% (see Figure 9 in supporting information).
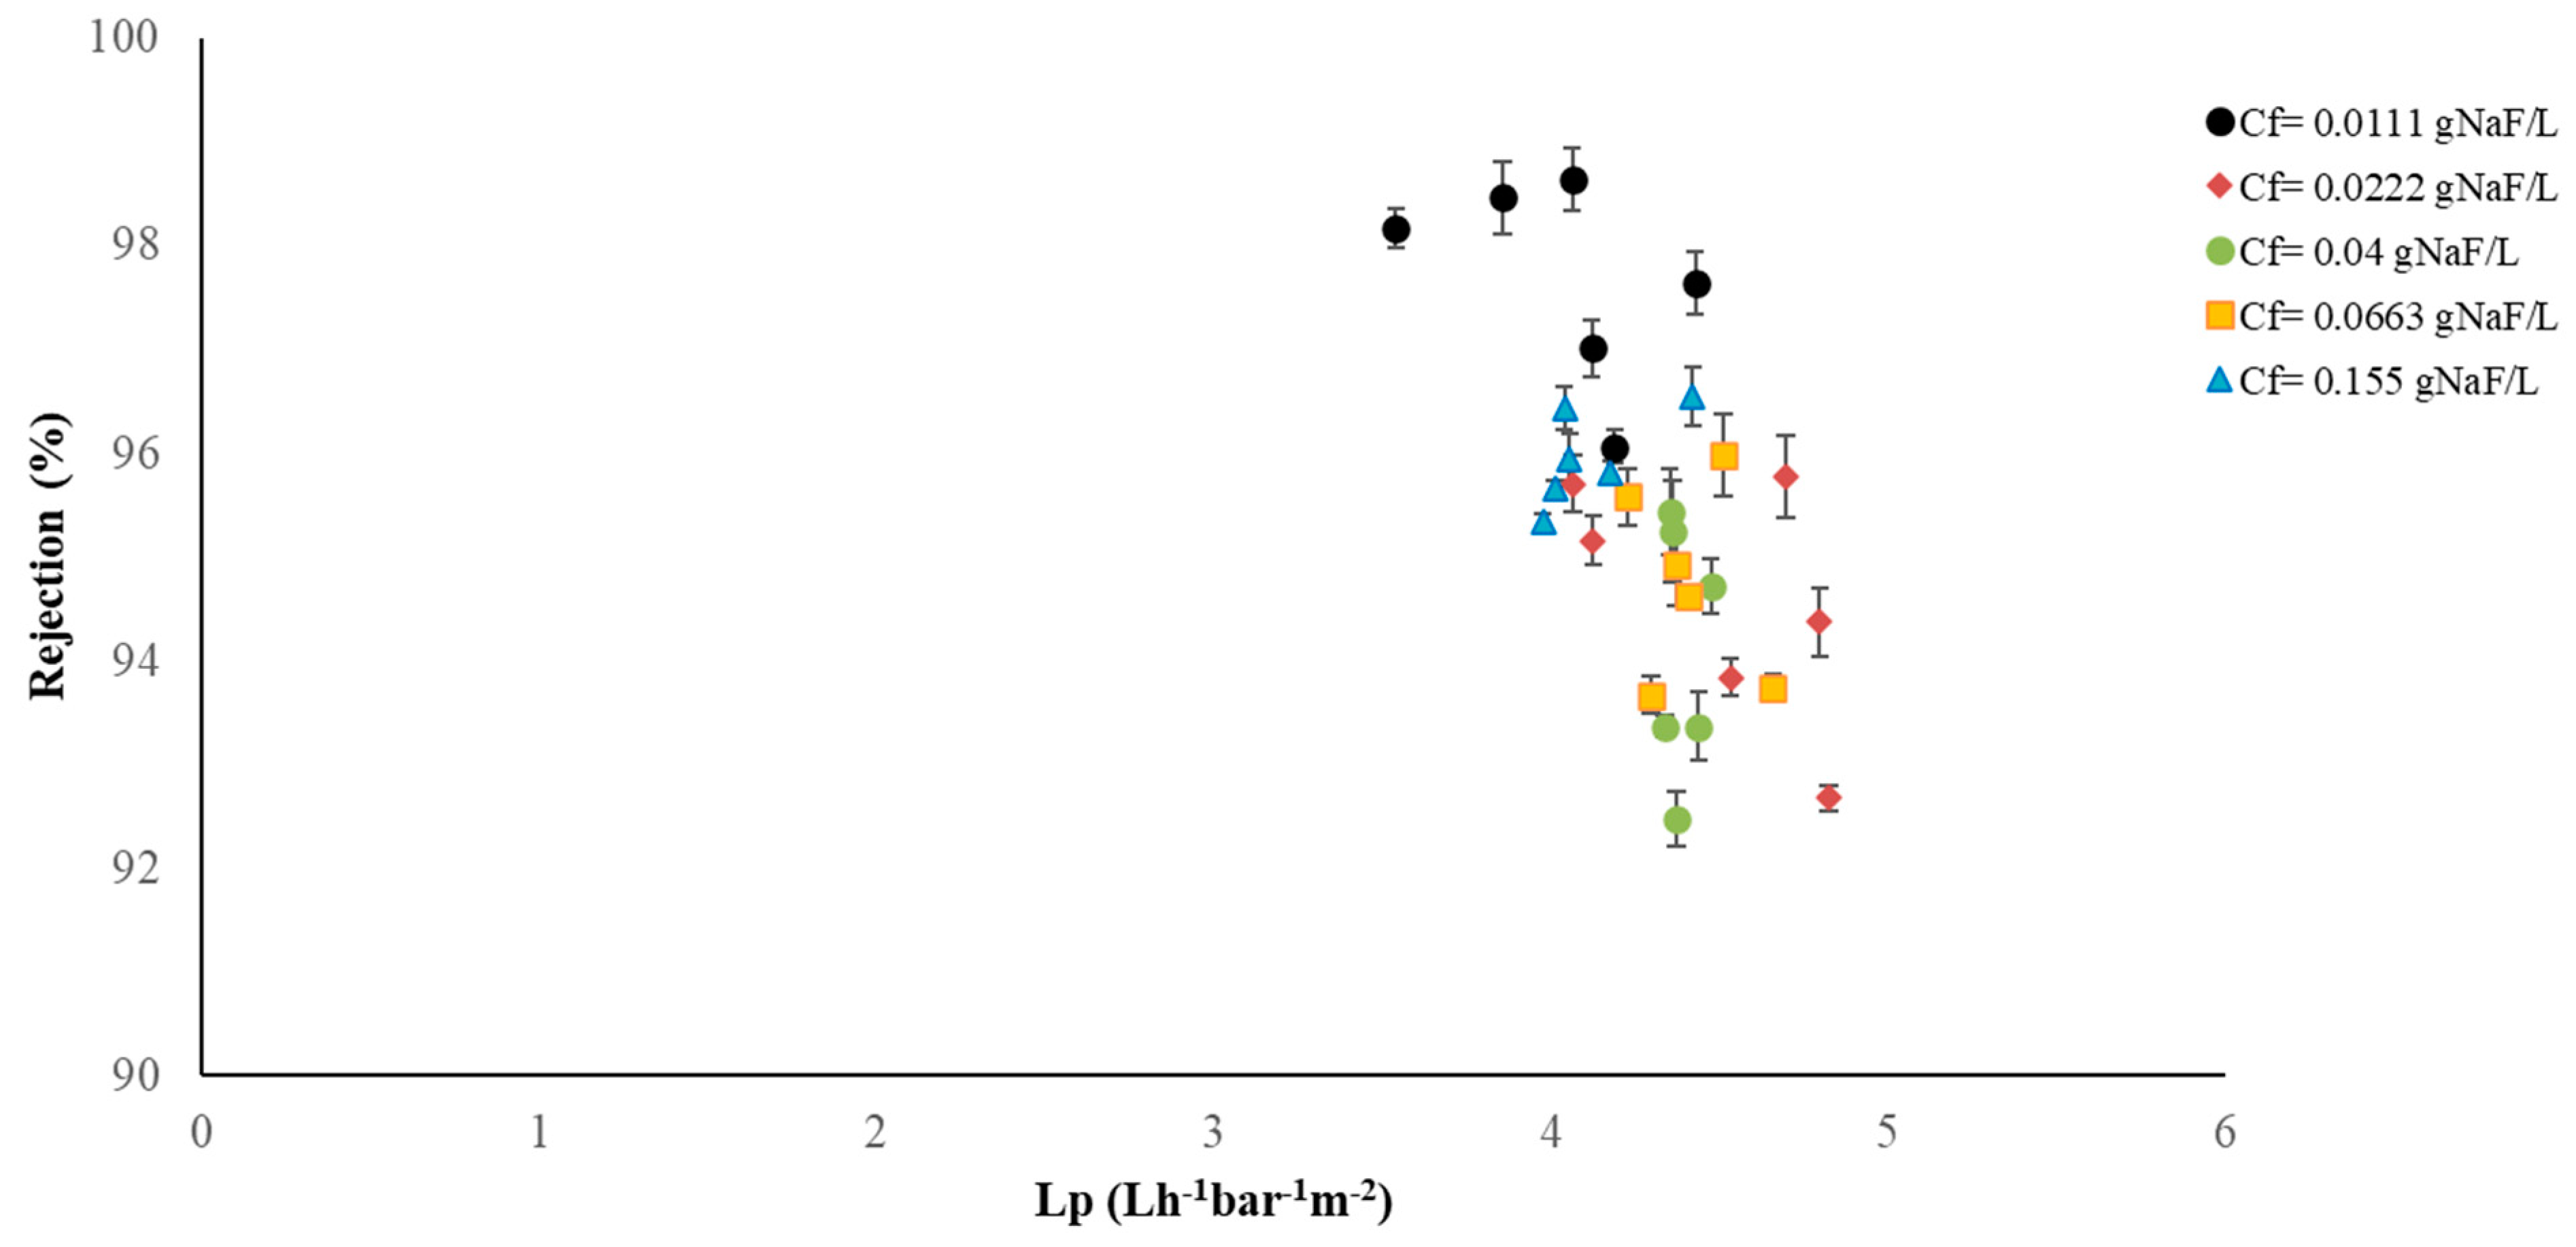
As a summary, the rejection of fluoride is plotted against the pure water permeability at the studied transmembrane pressures and feed concentrations (Figure 10). This figure allows the selection of the optimal transmembrane pressure depending on the feed concentration. It can be concluded that water containing less than 5 mg FL−1, which correspond to 0.01 g NaFL−1, should be treated with a pressure of 15 bar, and more concentrated waters would require higher pressures (more than 20 bars).

3.2. Osmotic Membrane Distillation–Crystallization Results

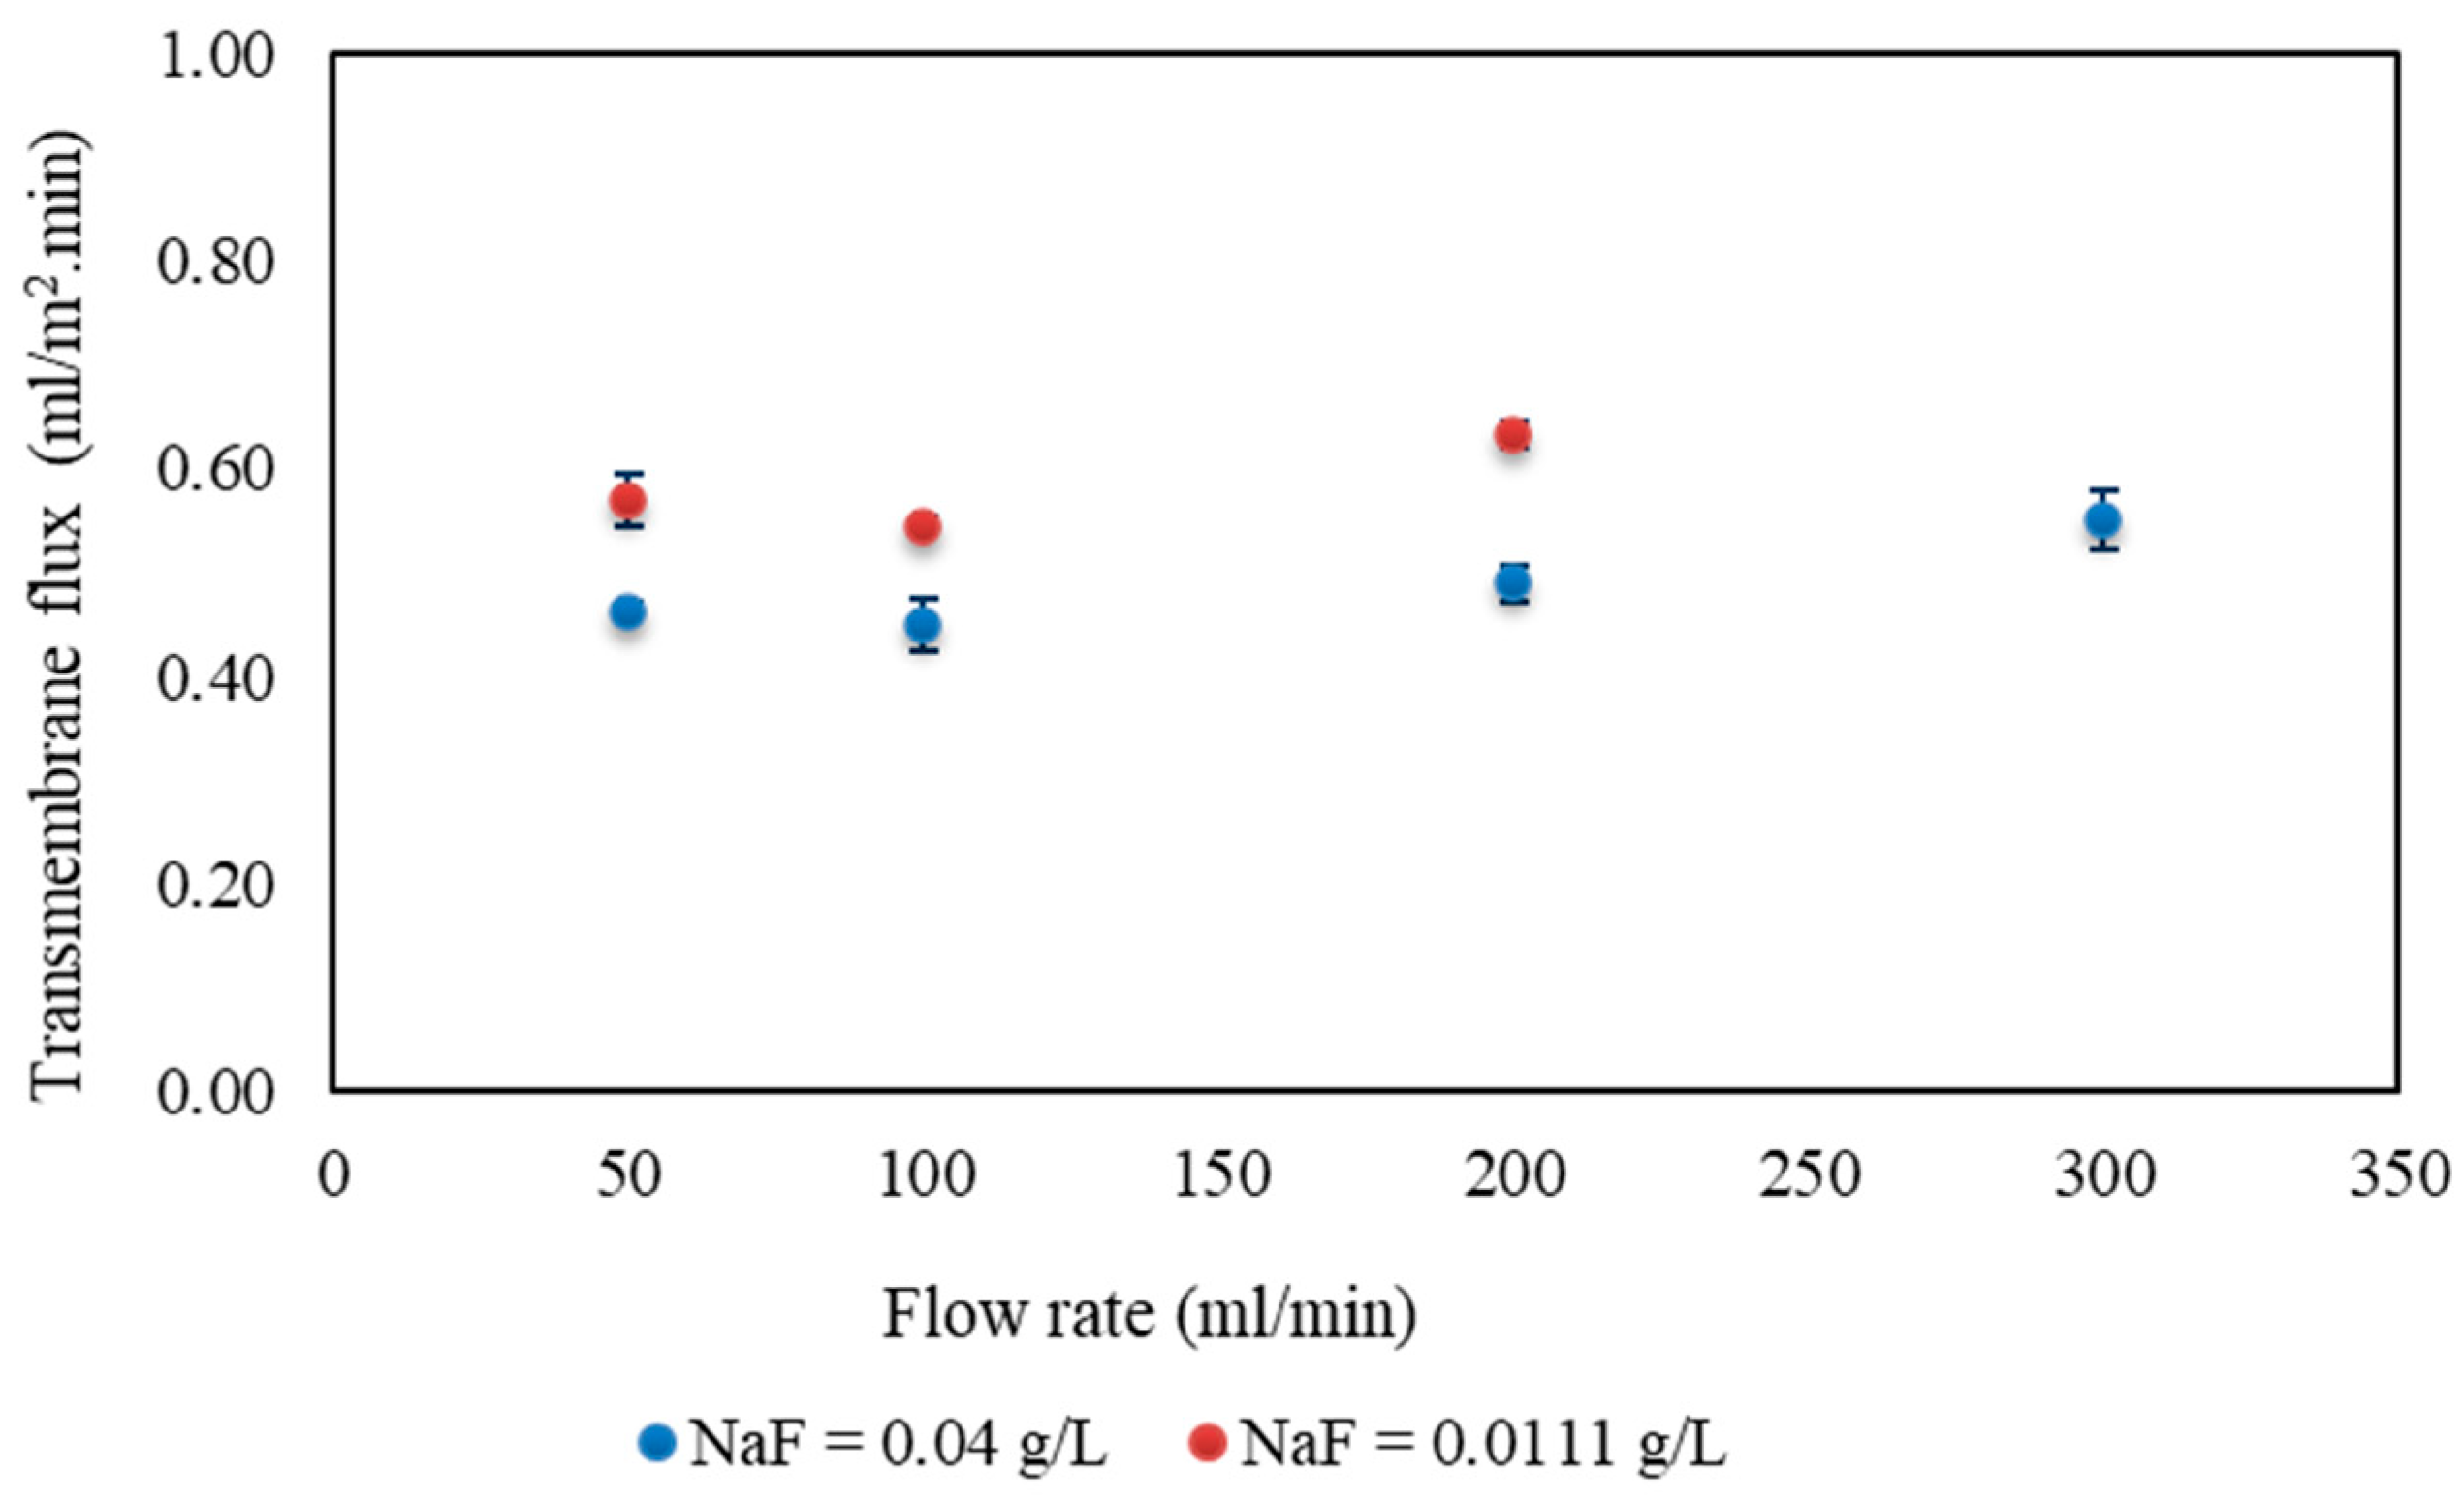
In the membrane distillation–crystallization experimental setup described in Section 2.2, the feed and osmotic solutions were kept at 20 °C. The influence of the feed concentration and feed flow rate on the water flux through the membrane is shown in Figure 11. The mass transfer coefficients are shown in Figure 12.
The results indicate that changes in flow rate do not significantly affect the flux or mass transfer coefficient, suggesting that the feed solution does not pose a major resistance to mass transfer. At low concentrations, there is less concentration polarization at the boundary layer, resulting in a lower dependence of flux on the feed flow rate [56]. However, low feed velocities can reduce the flux due to the presence of a boundary layer on the membrane surface caused by polarization [26]. Increasing the velocity typically has a positive effect on reducing boundary resistances on both the lumen and shell sides, thereby increasing the overall mass transfer coefficient. However, in this study, this effect was almost negligible.
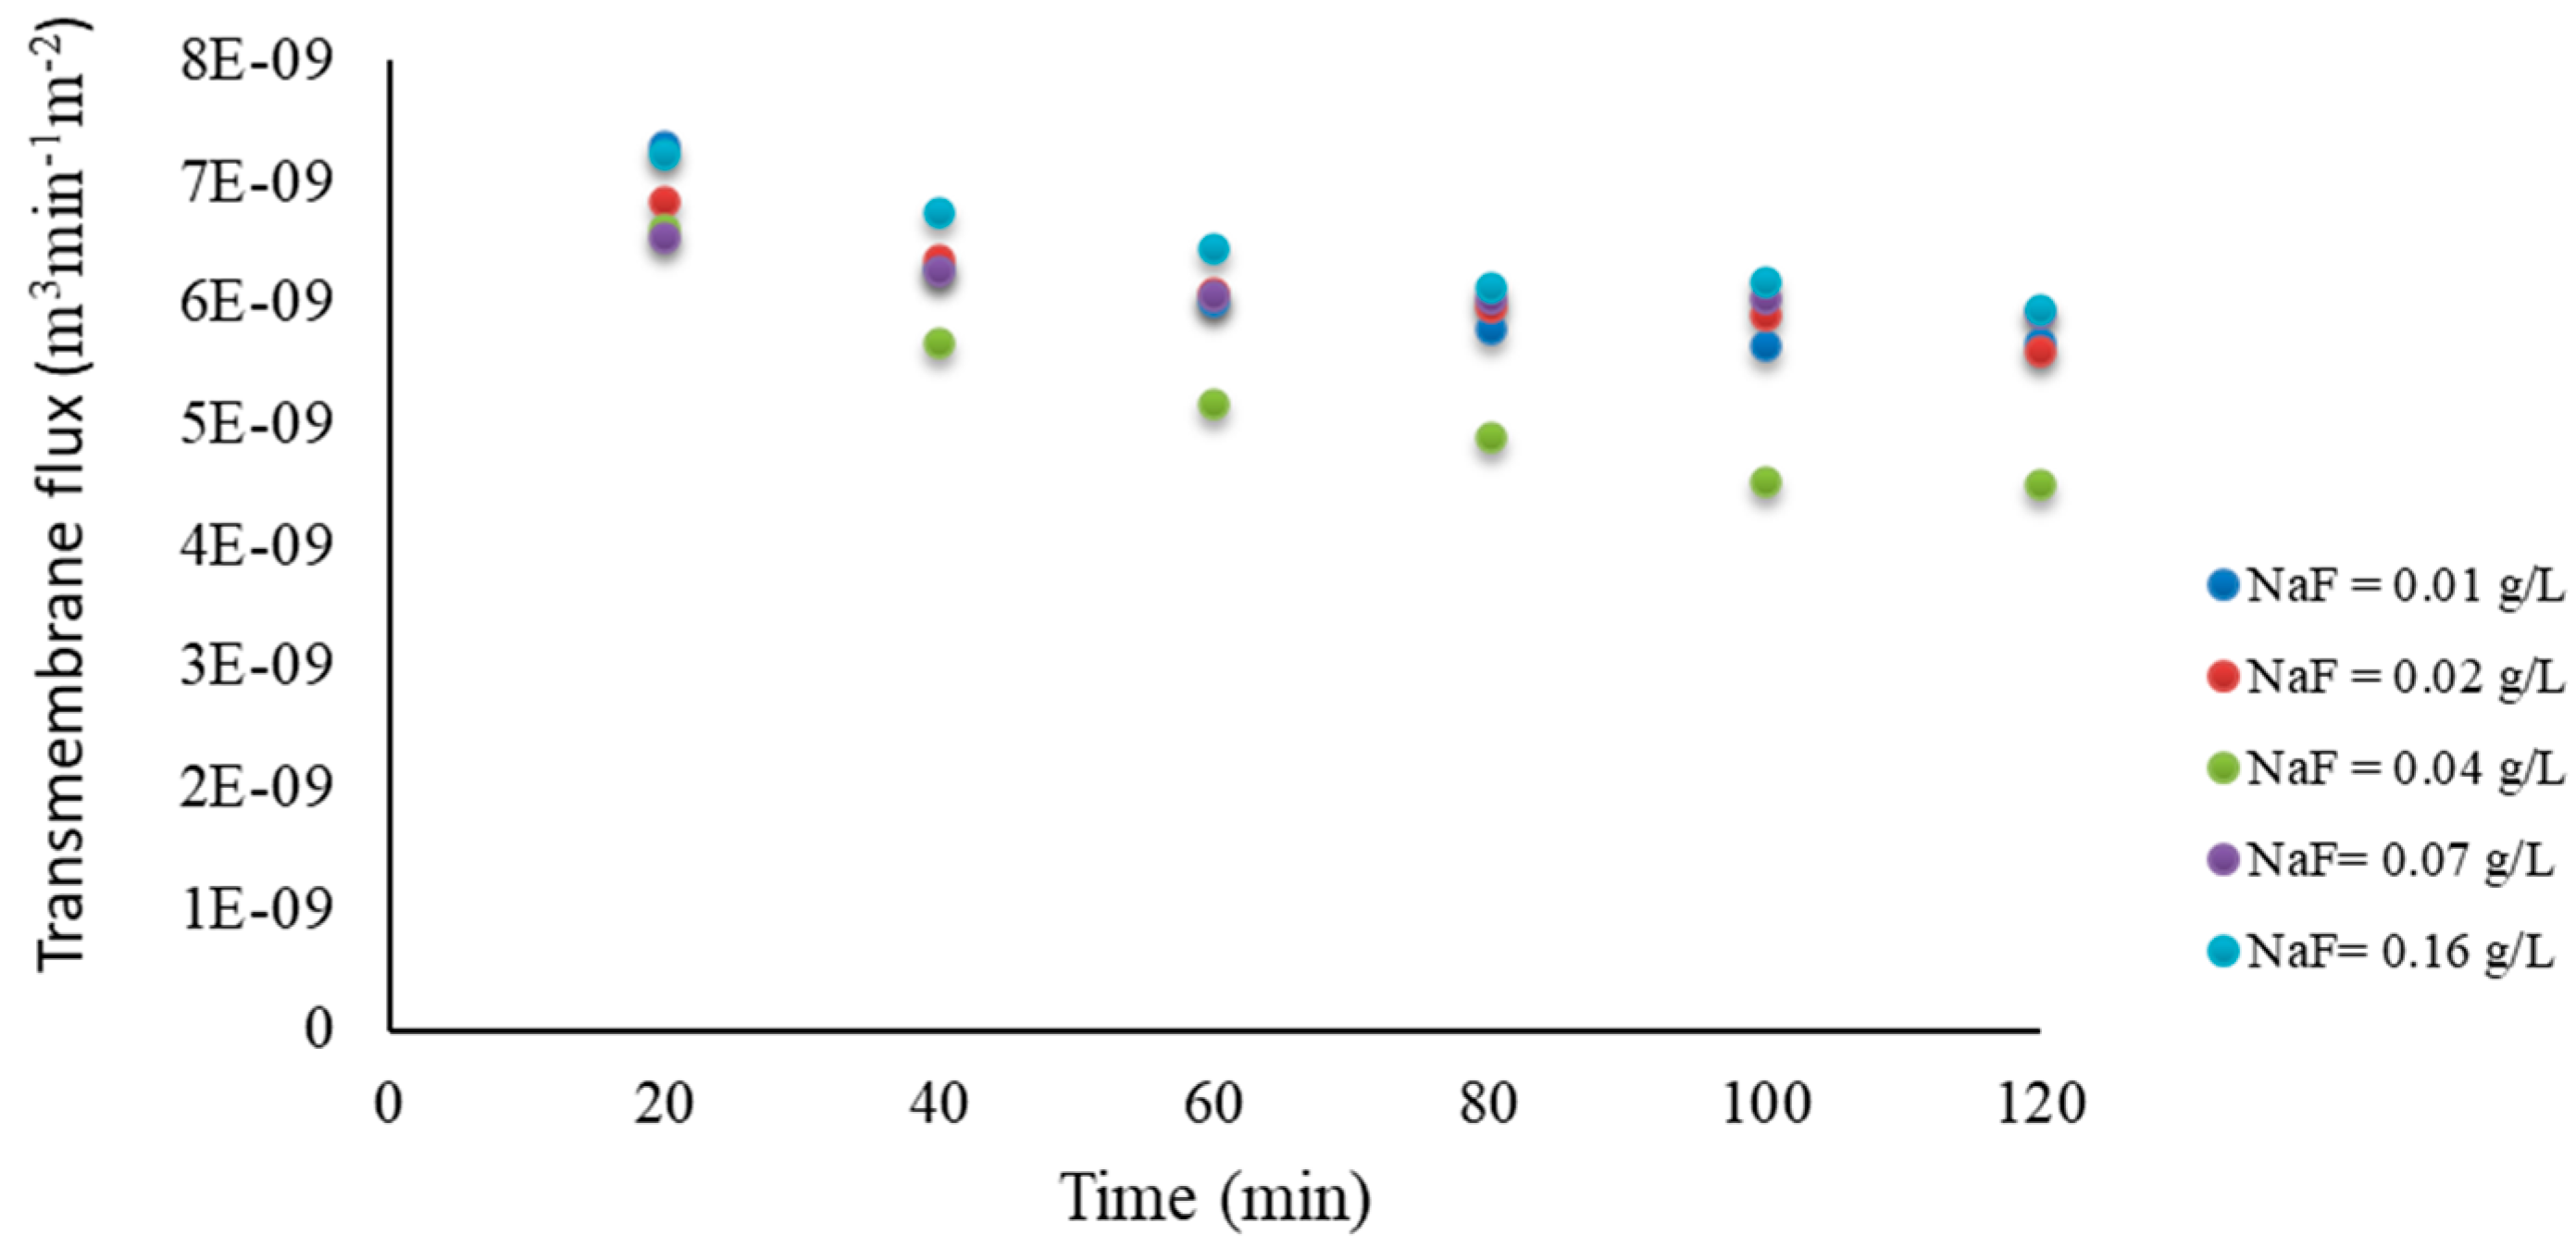
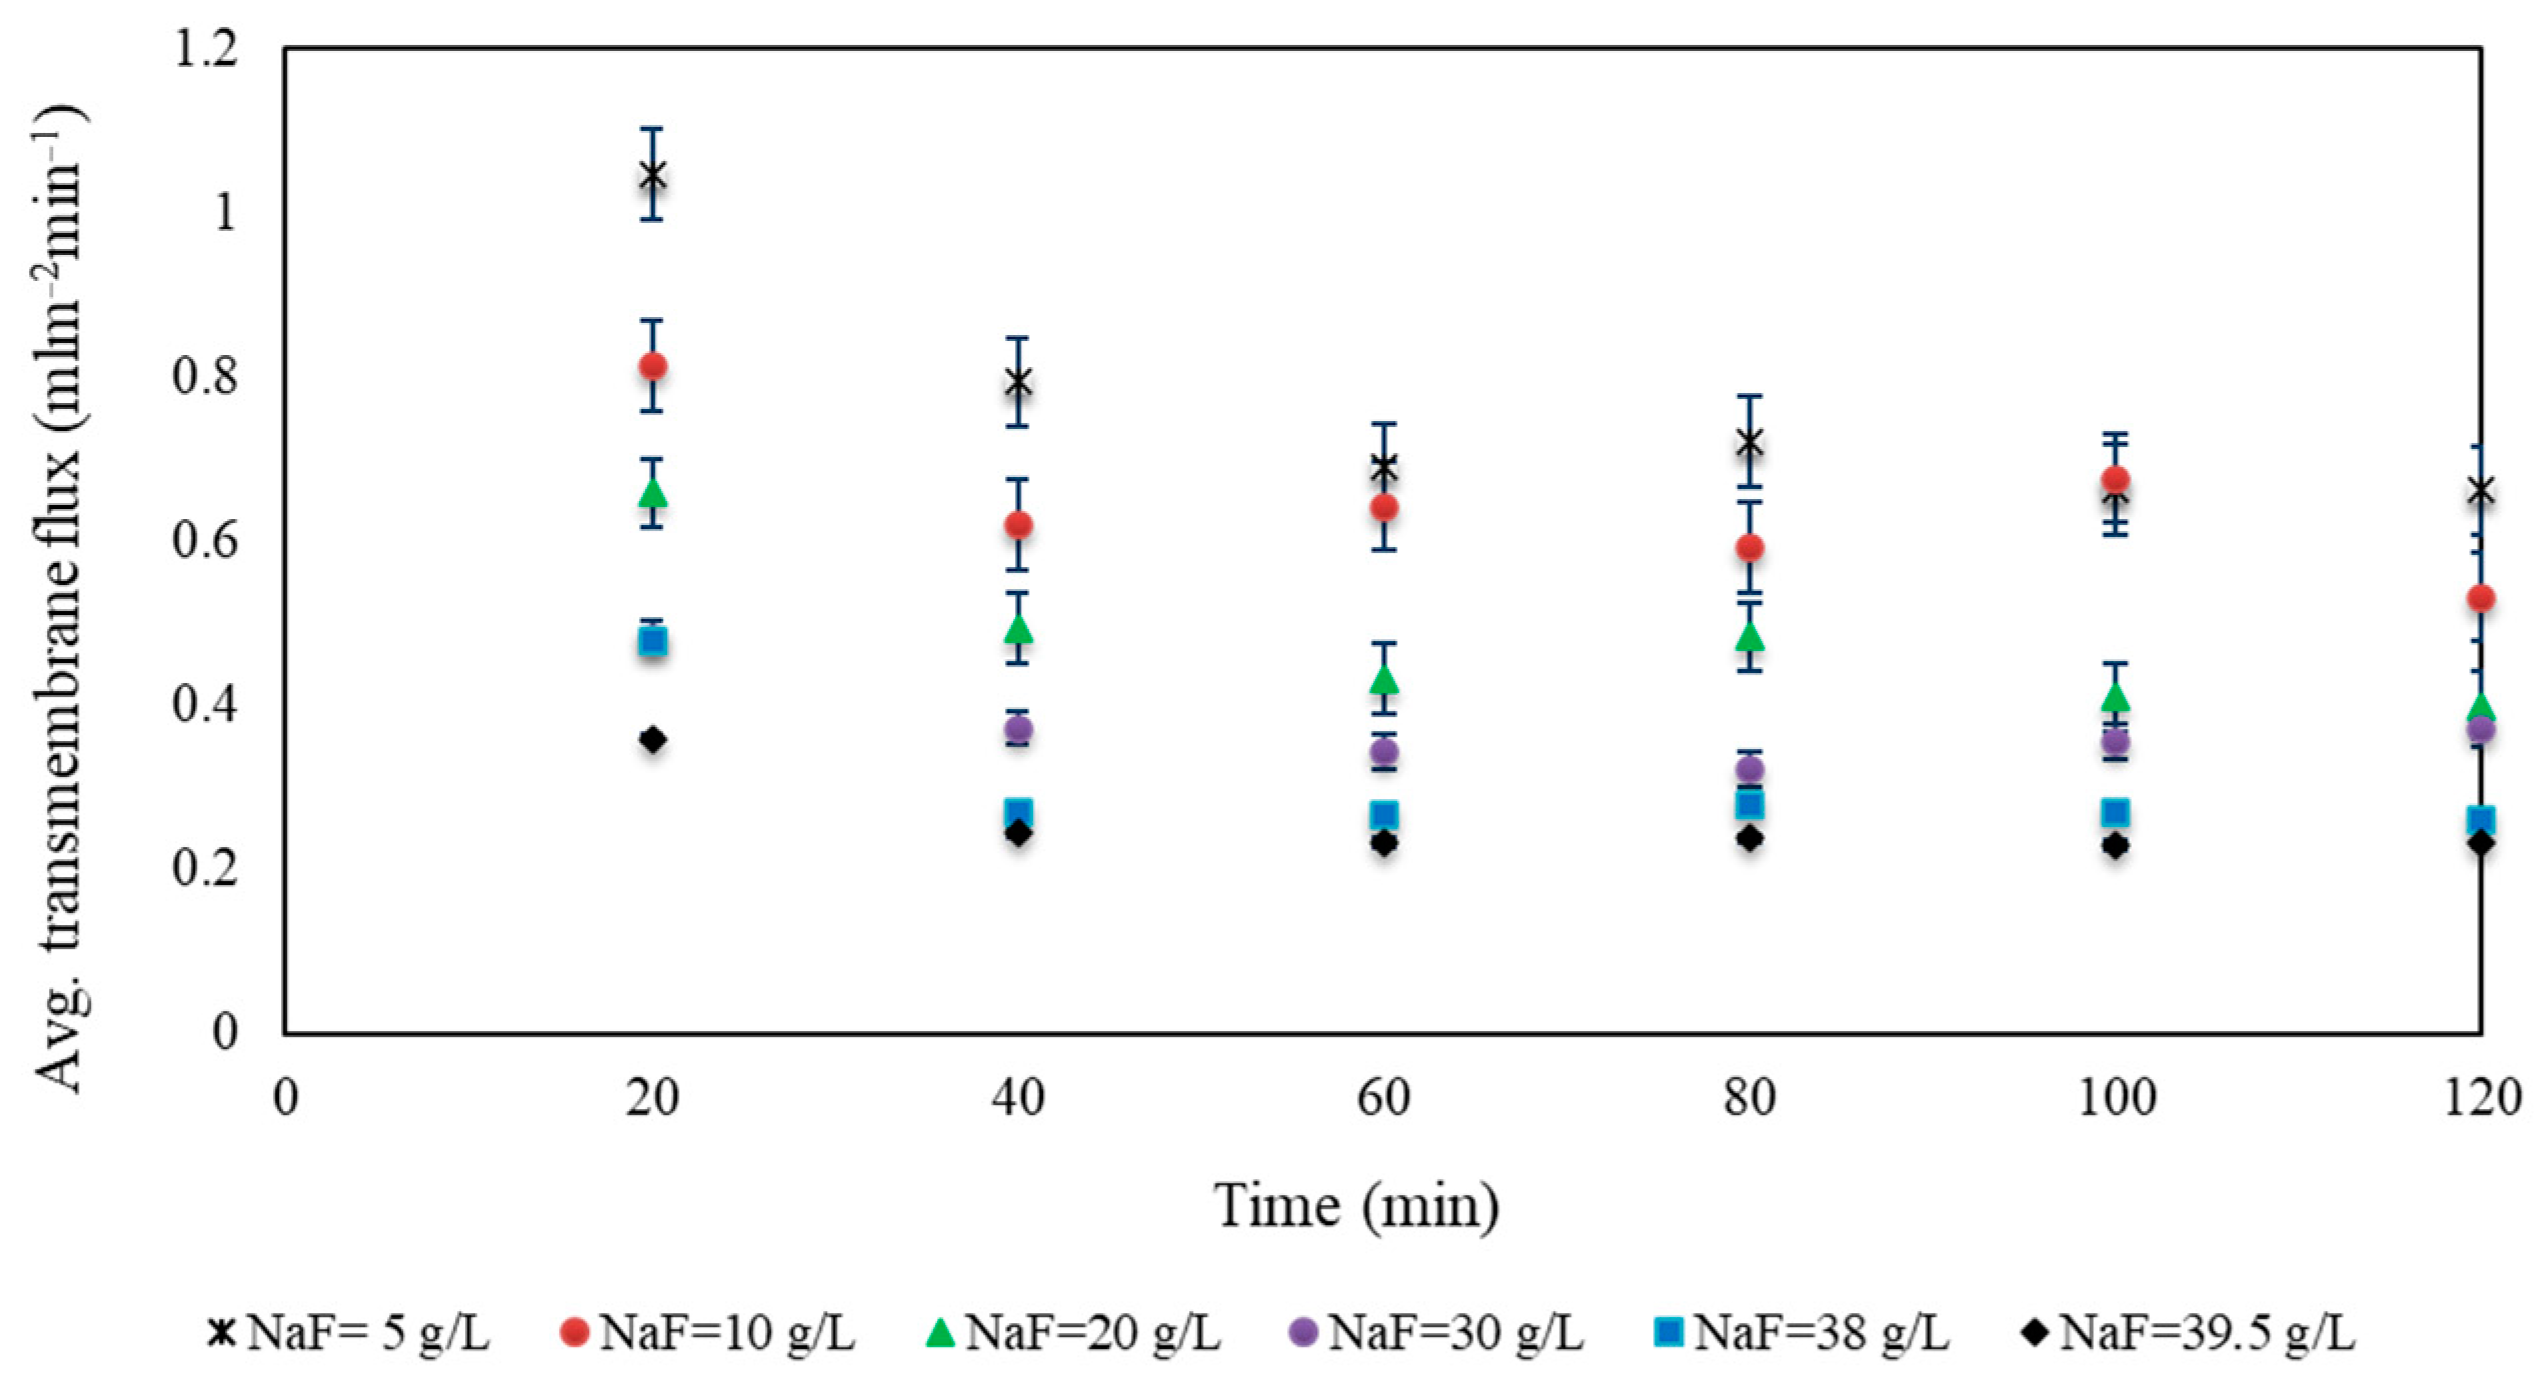
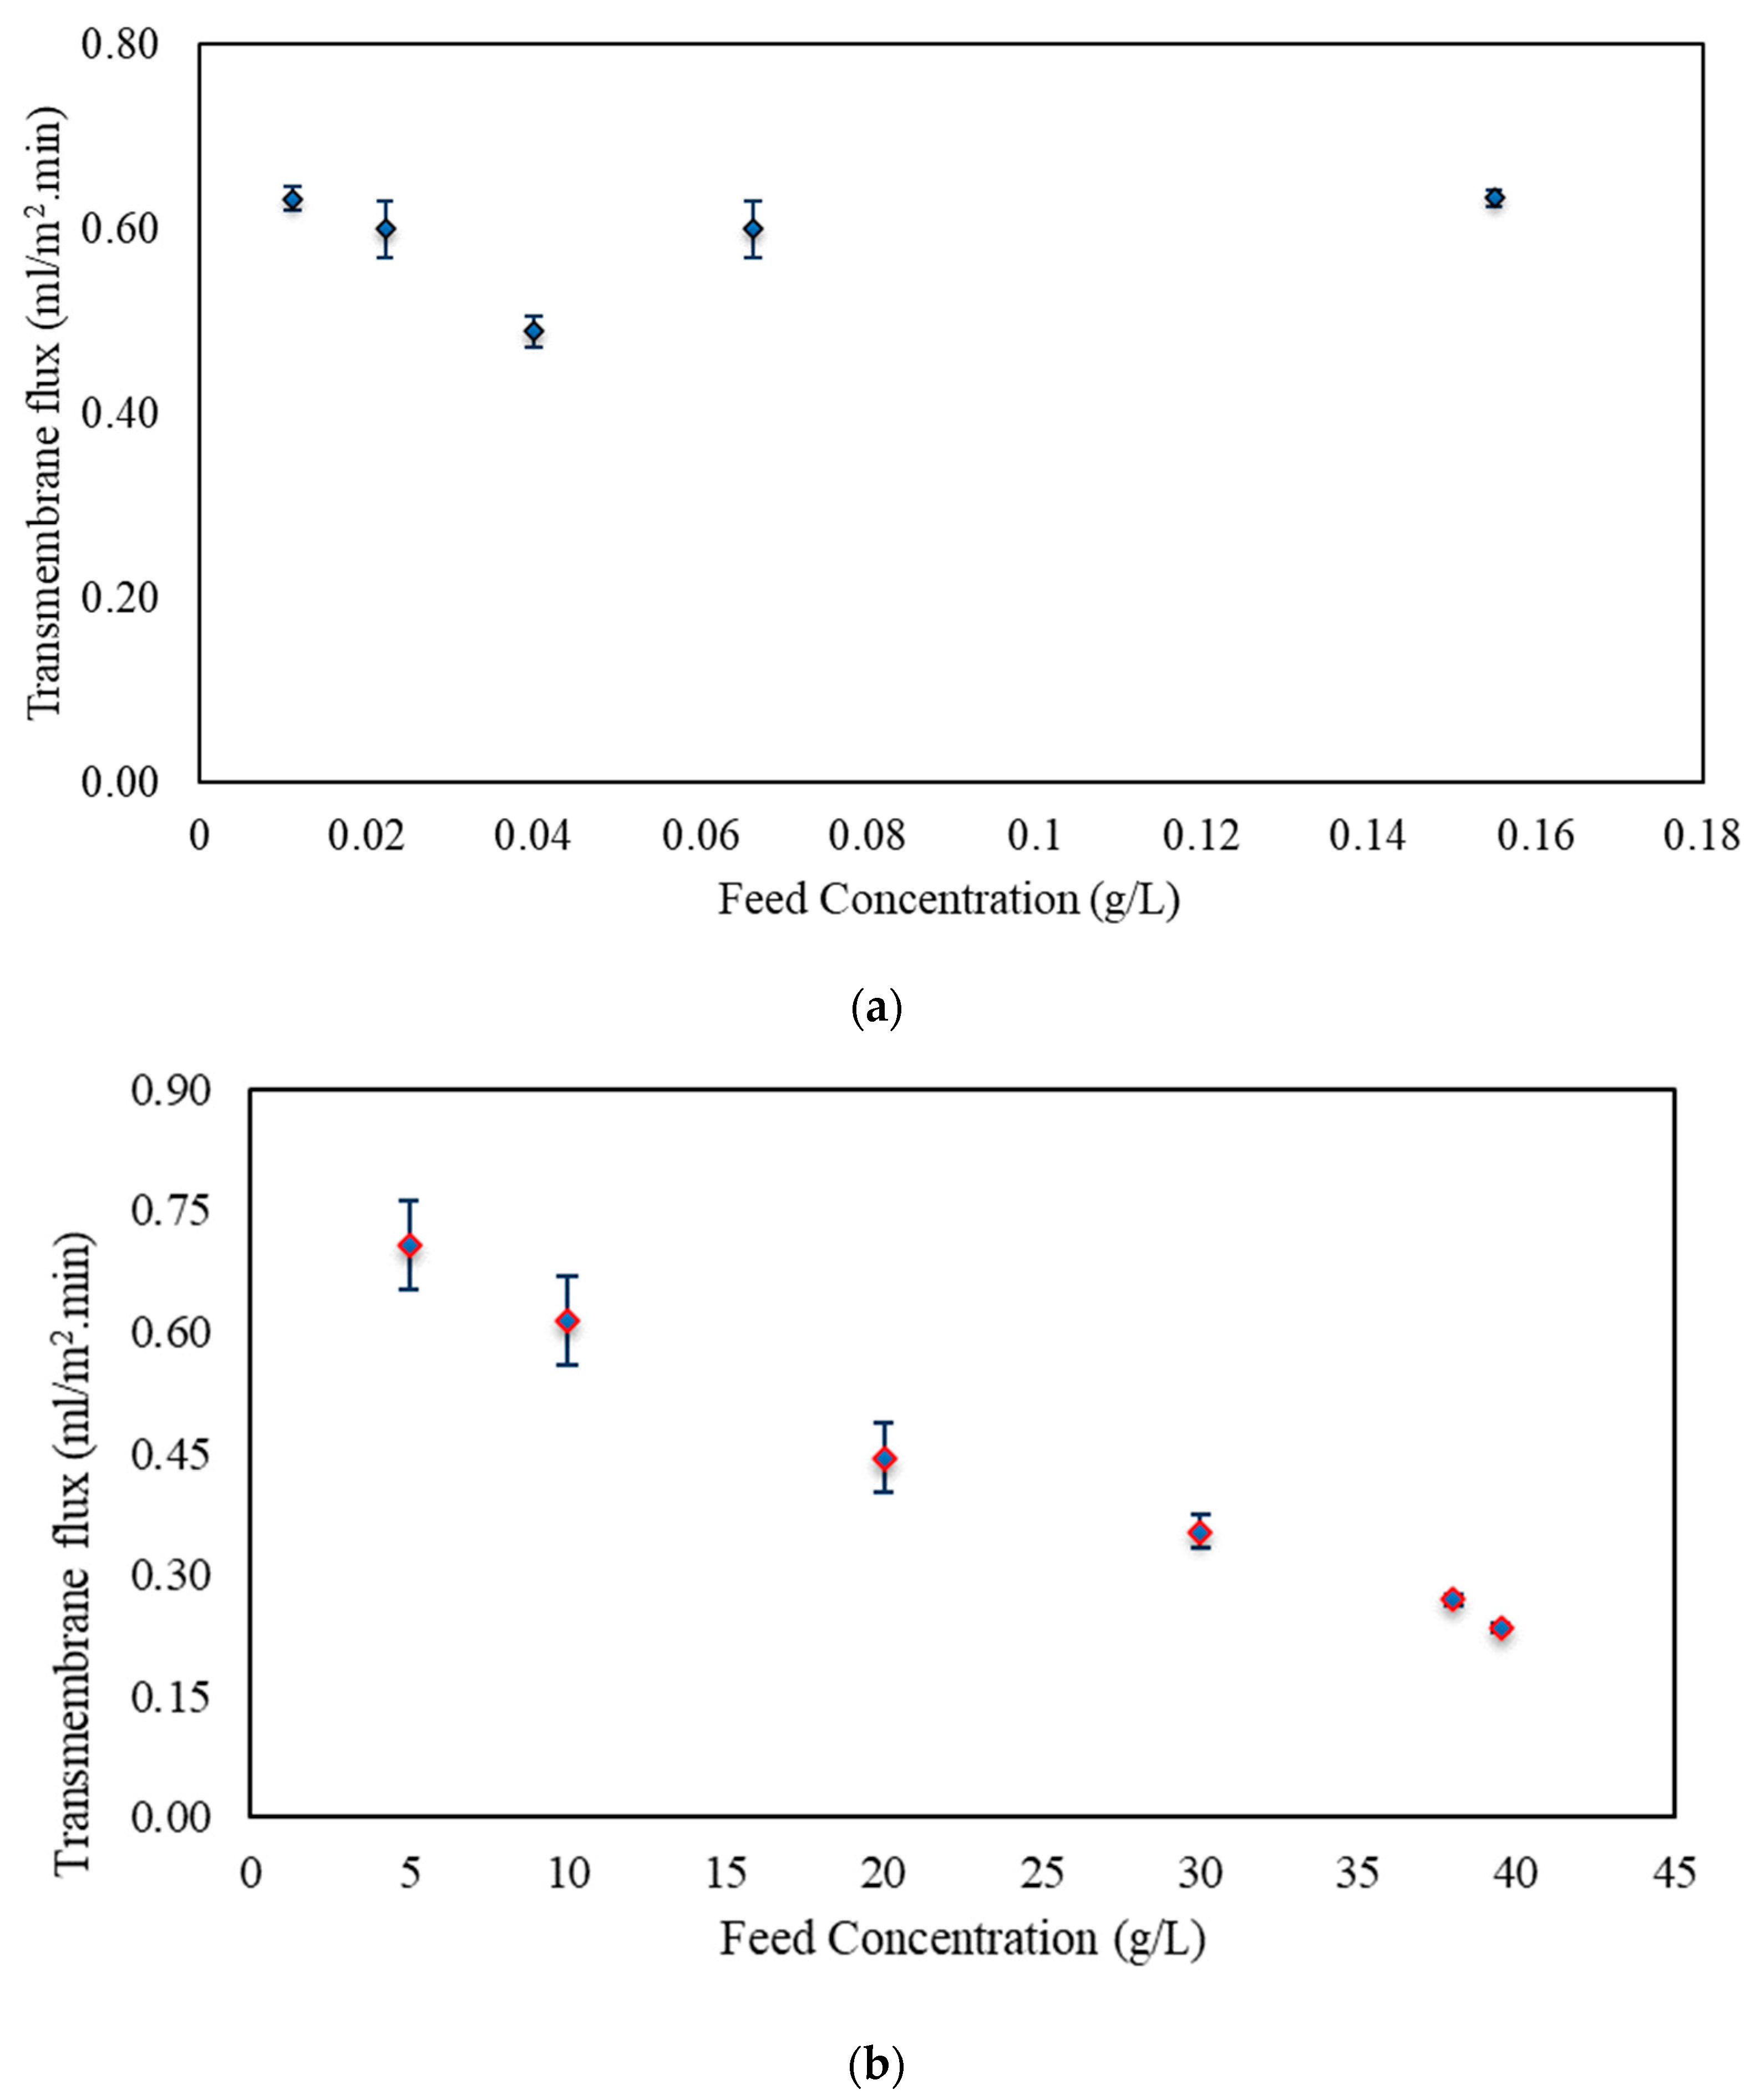
Different feed concentrations at constant feed flow rate were also studied to evaluate their effect on the transmembrane flux and the overall mass transfer coefficient. The osmotic concentration and flow rate were kept constant. Initially, there was an increase in flux observed during the first 15 min of experiment (see Figure A2 in Appendix A). Afterwards, steady-state conditions were reached. The average fluxes at low and high feed concentrations during the steady state are shown in Figure 13a,b, respectively.
There are three types of resistance that affect membrane performance: resistance from the feed and osmotic boundary layers, and resistance from the membrane surface. In addition to these boundary resistances, the phenomenon of concentration polarization significantly impacts membrane crystallization. For instance, when the salt concentration is higher on the membrane surface, concentration polarization occurs. To mitigate this, higher velocities within the membrane are preferred as they induce greater turbulence, leading to improved mixing of the solution in the membrane contactor. In this study, the optimal conditions were determined to be feed and osmotic flow rates of 200 and 300 mL/min, respectively.
When the feed concentrations are lower, the water activity and driving force are higher, whereas higher osmotic concentrations result in lower water activity and higher driving force [26,42]. Consequently, an increase in feed concentration is expected to lead to a decrease in flux. Figure 13 illustrates that flux remains relatively unaffected at lower feed concentrations (0.01–0.16 gNaFL−1), but is significantly influenced at higher feed concentrations (5–39.5 gNaFL−1). As feed concentrations increase, the average transmembrane flux shows a notable decrease, with the lowest feed concentrations yielding the highest flux.
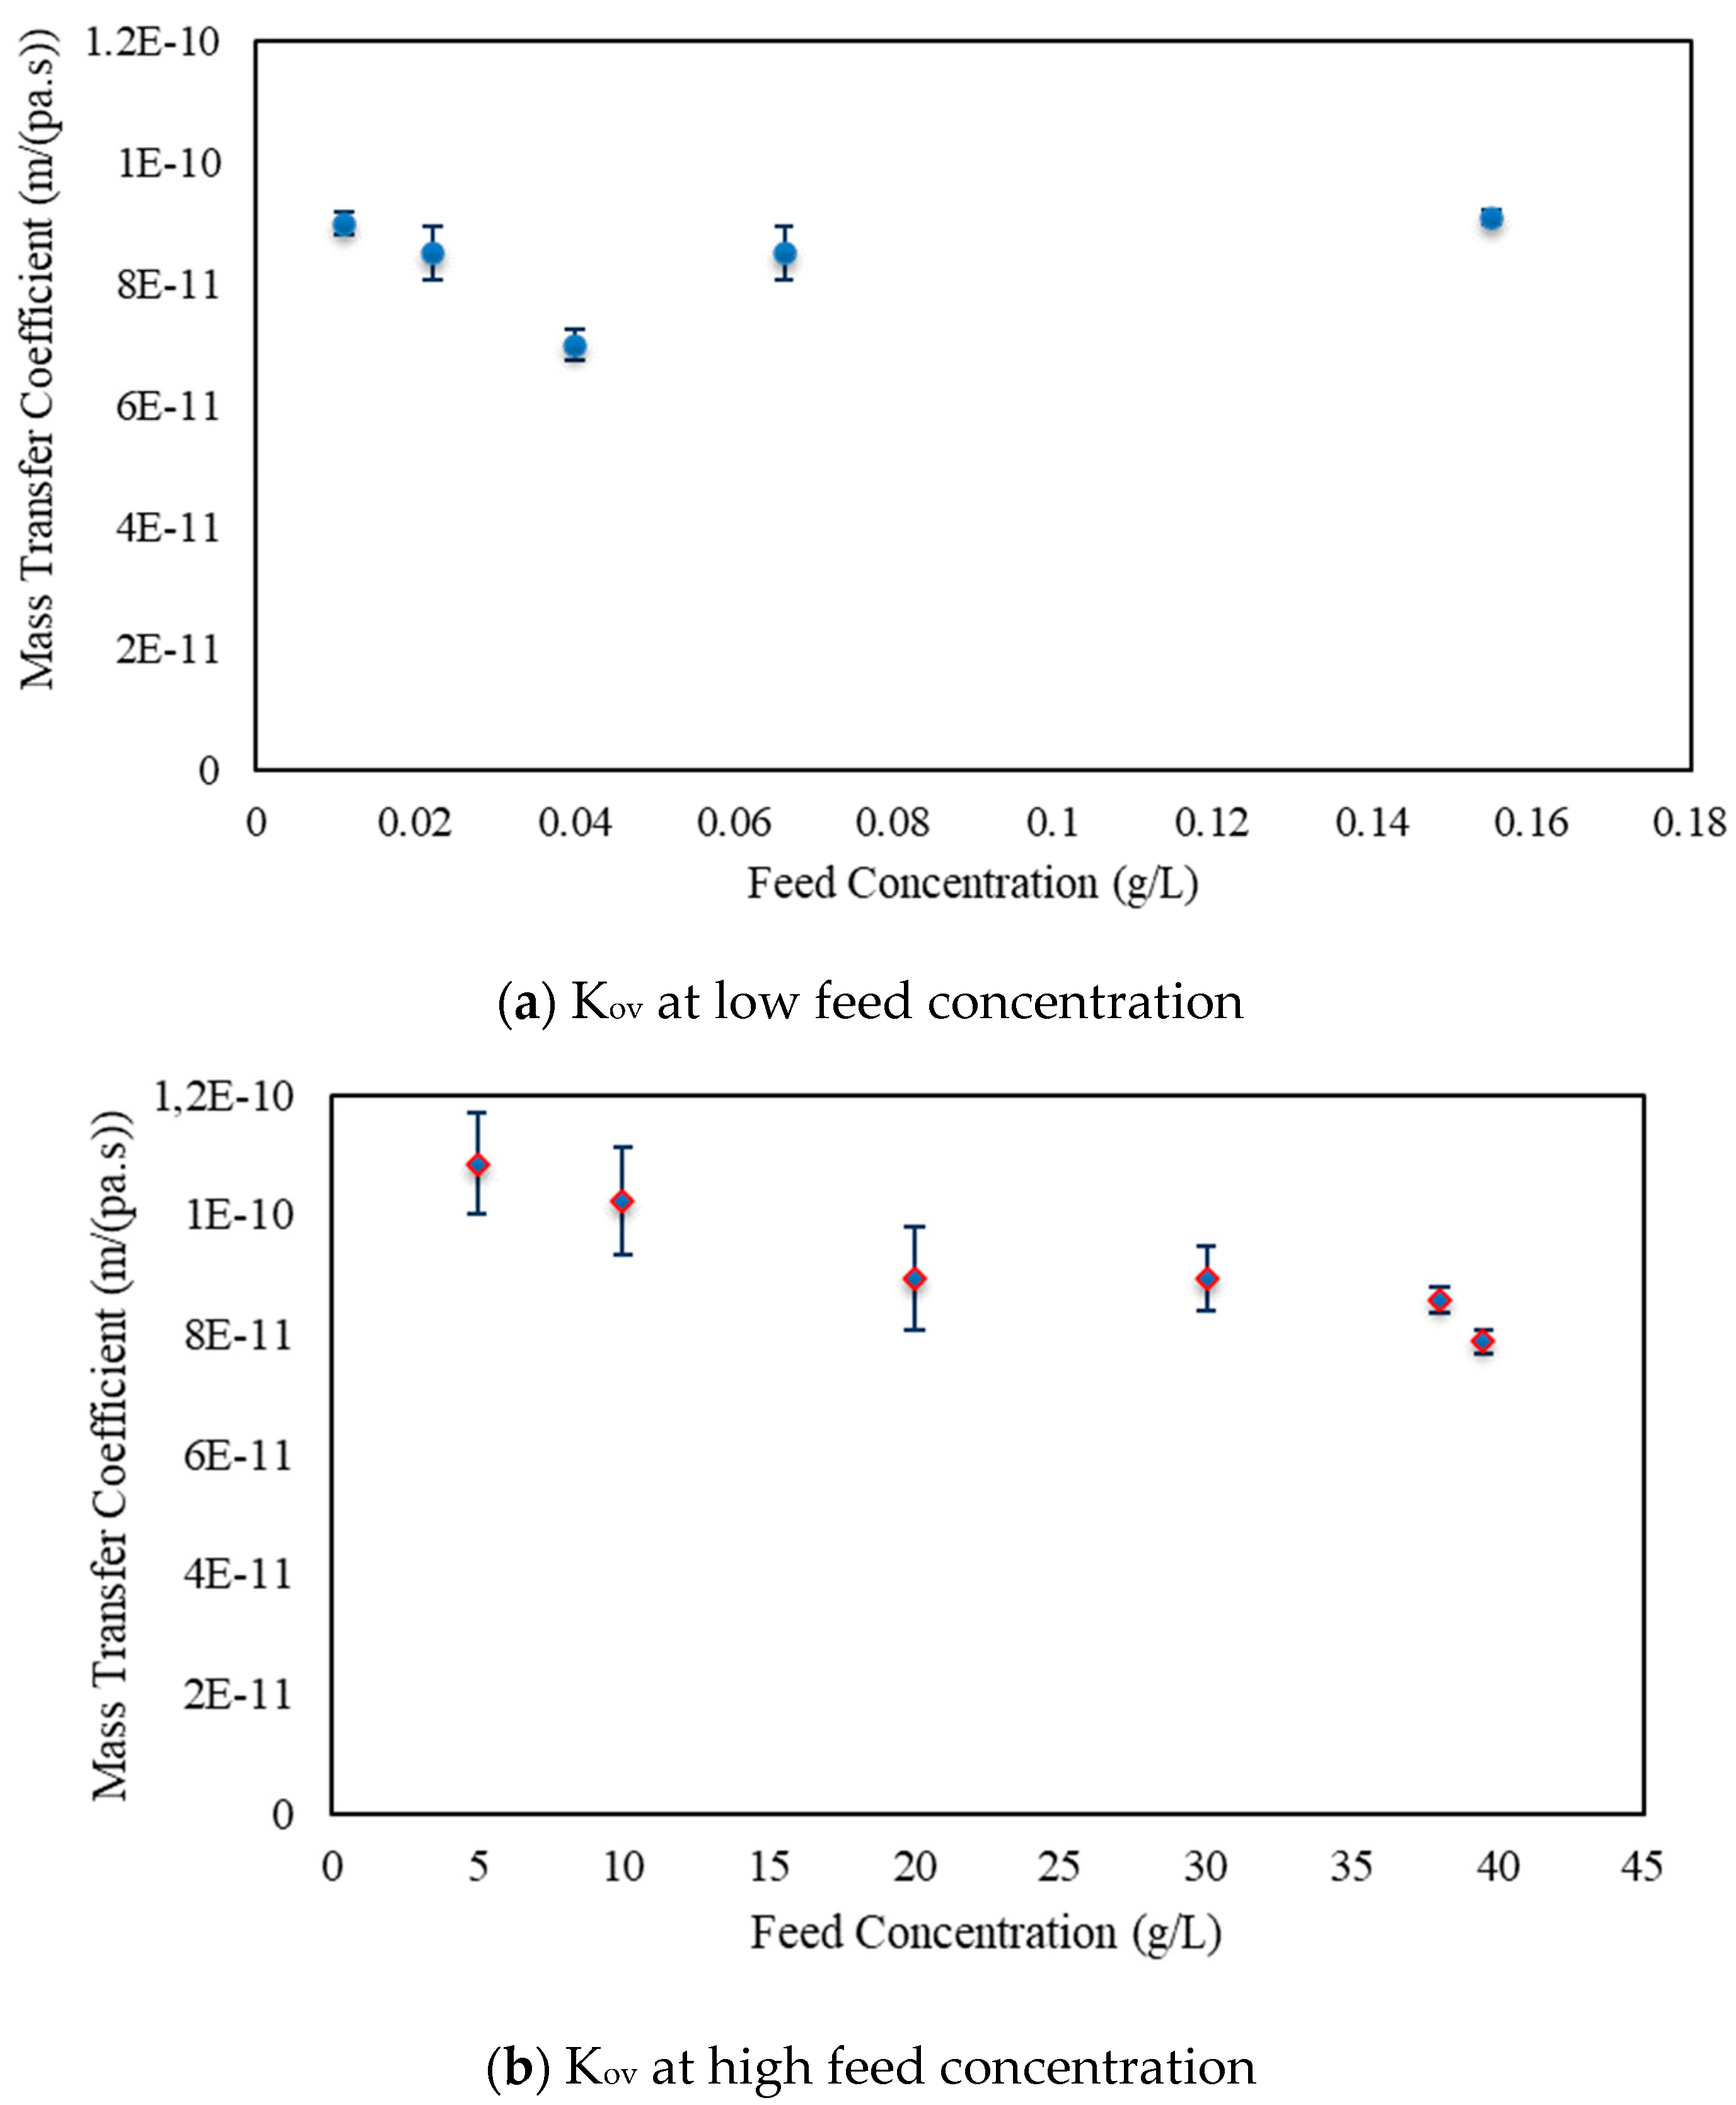
When the overall mass transfer coefficient is calculated, it is expected that the effect of the driving force will be eliminated, resulting in a constant Kov despite changes in concentration. However, Figure 14b and Figure 16 indicate that Kov still decreases as the concentration increases. This decrease in Kov could be attributed to concentration polarization.
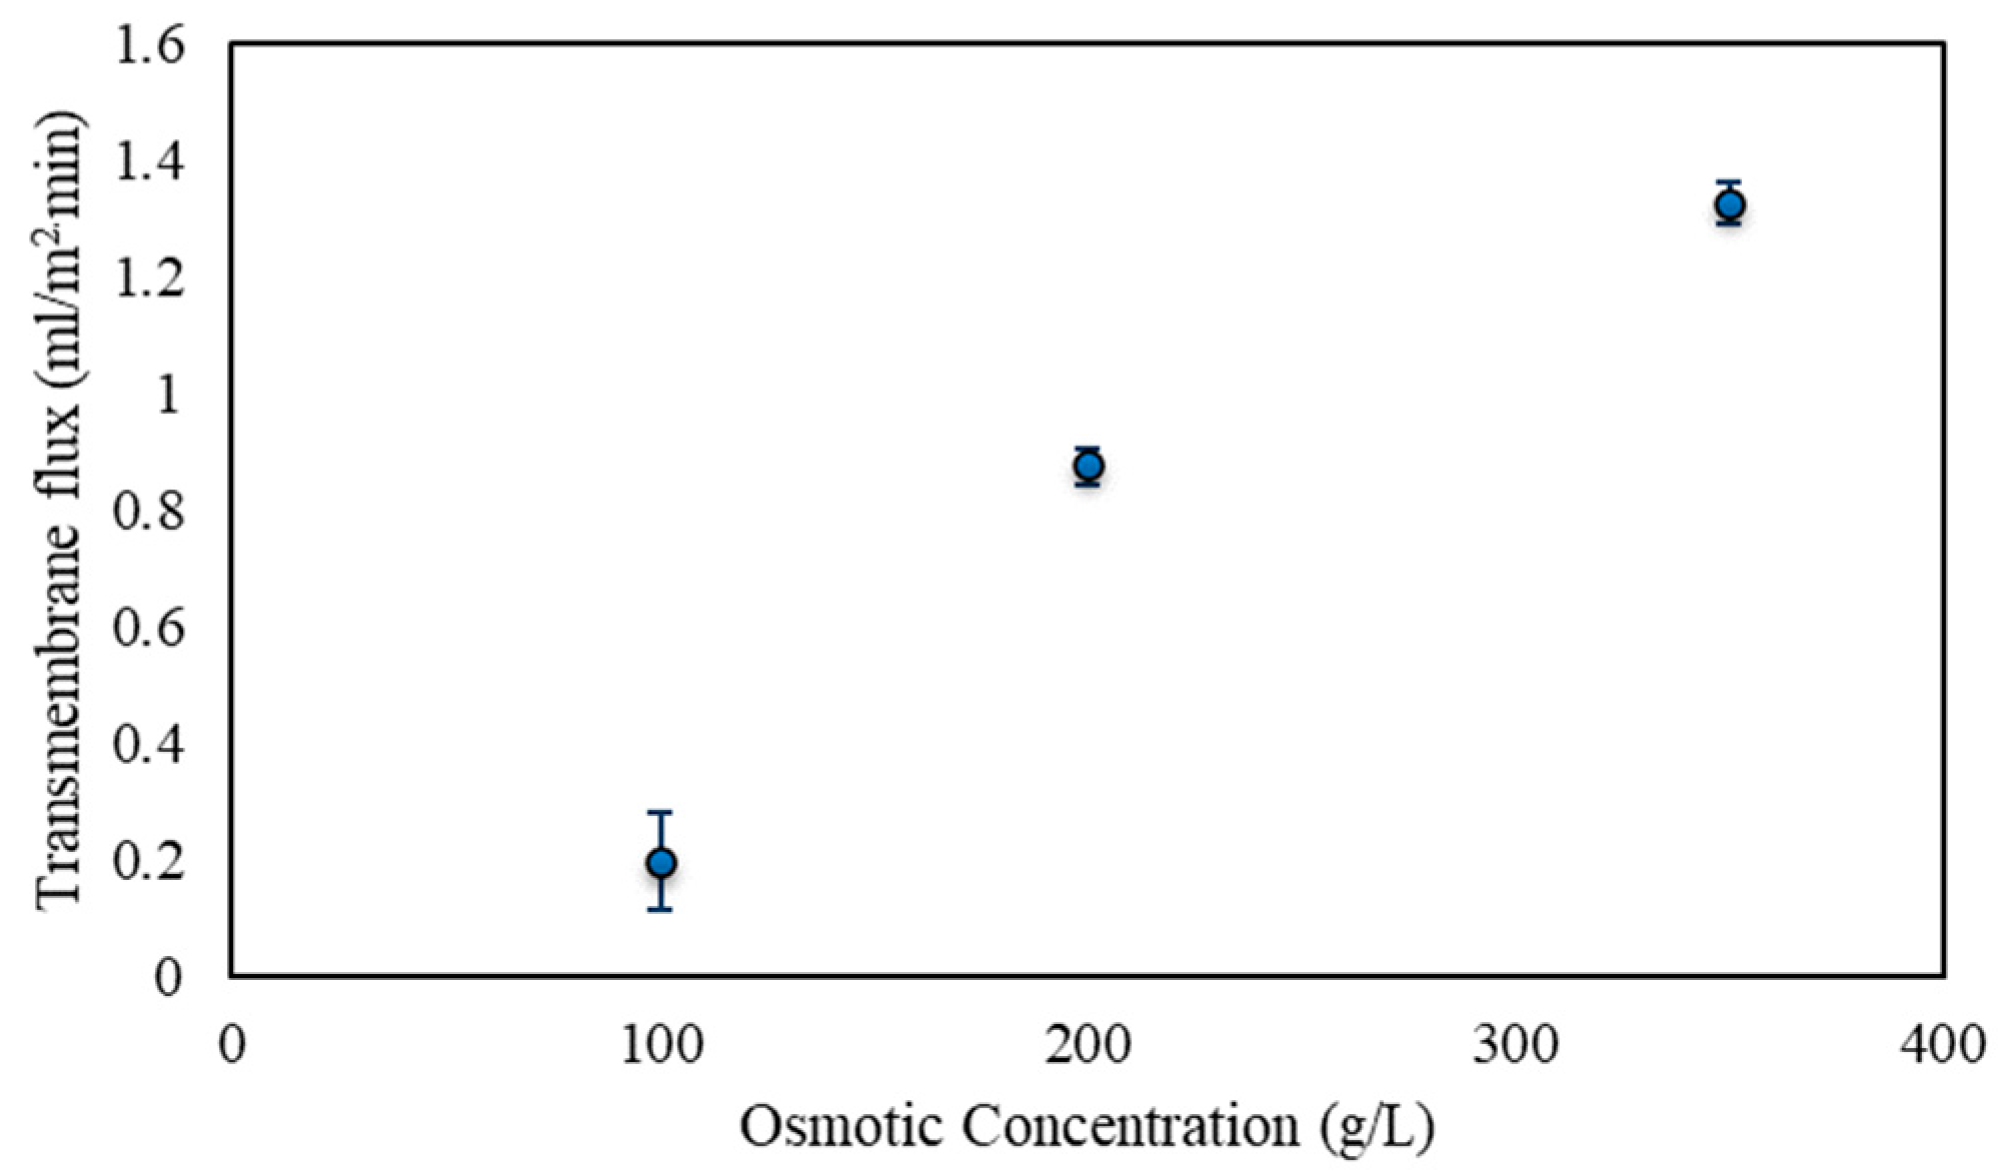
As mentioned earlier, higher osmotic concentrations lead to a greater driving force for water evaporation, resulting in increased water removal at the membrane surface (Figure 15). Under normal circumstances, this would result in a constant overall mass transfer coefficient, independent of concentration, if the flux increased proportionally to the driving force, as observed when varying the concentration of NaF in the feed stream (see Figure 13 in the supporting information). However, the experimental results demonstrate a different trend in the effect of the osmotic solution. The impact of osmotic concentration on transmembrane flux is more pronounced due to the higher dependence of water activity on concentration. Consequently, significant variations in flux can be observed when evaluating the influence of NaCl concentration. The mass transfer coefficients also decrease as the osmotic concentration increases, as shown in Figure 16 of the supporting information.

3.3. Crystal Characterization

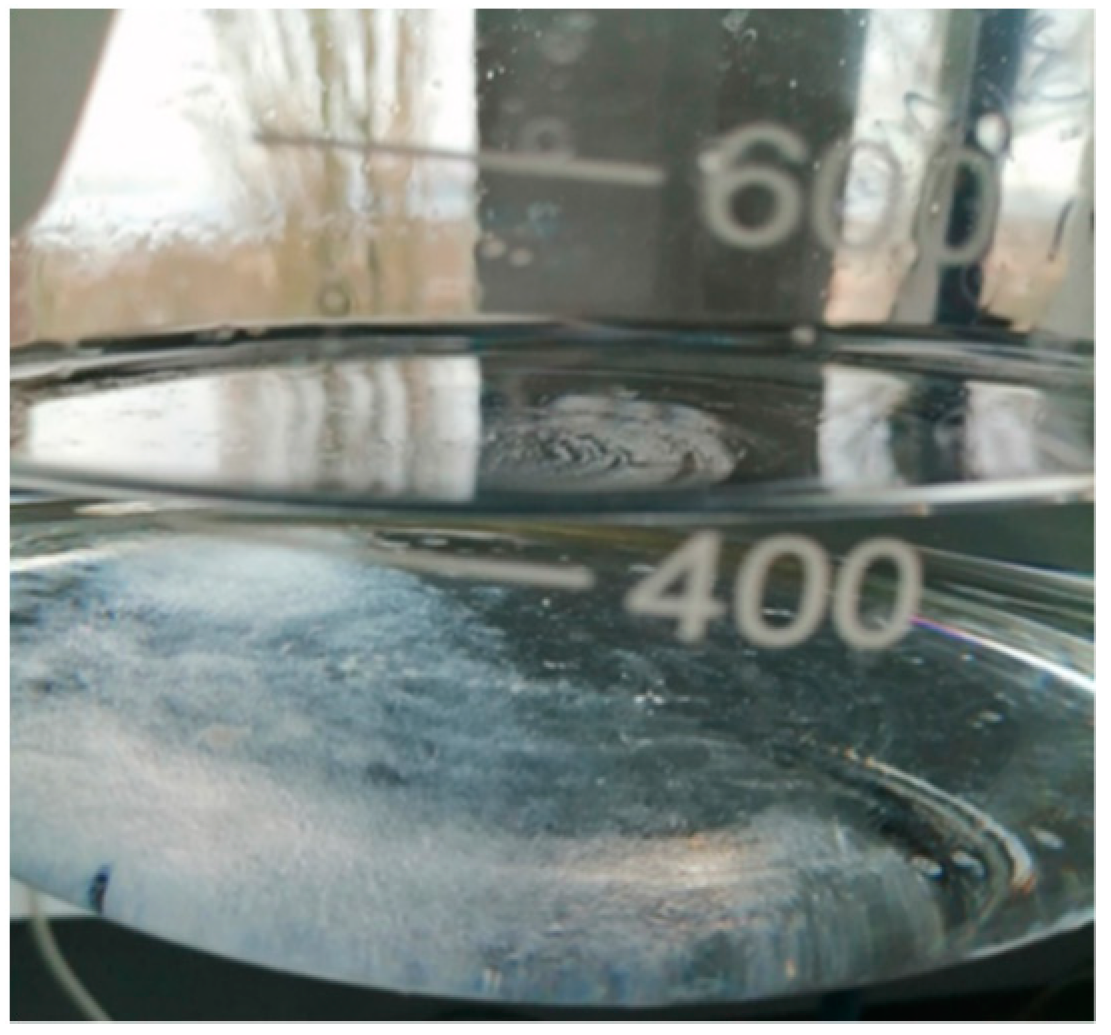
Figure 17 shows an example of crystal formation at the bottom of the feed reservoir at the end of an experiment. The crystals were taken for further characterization.
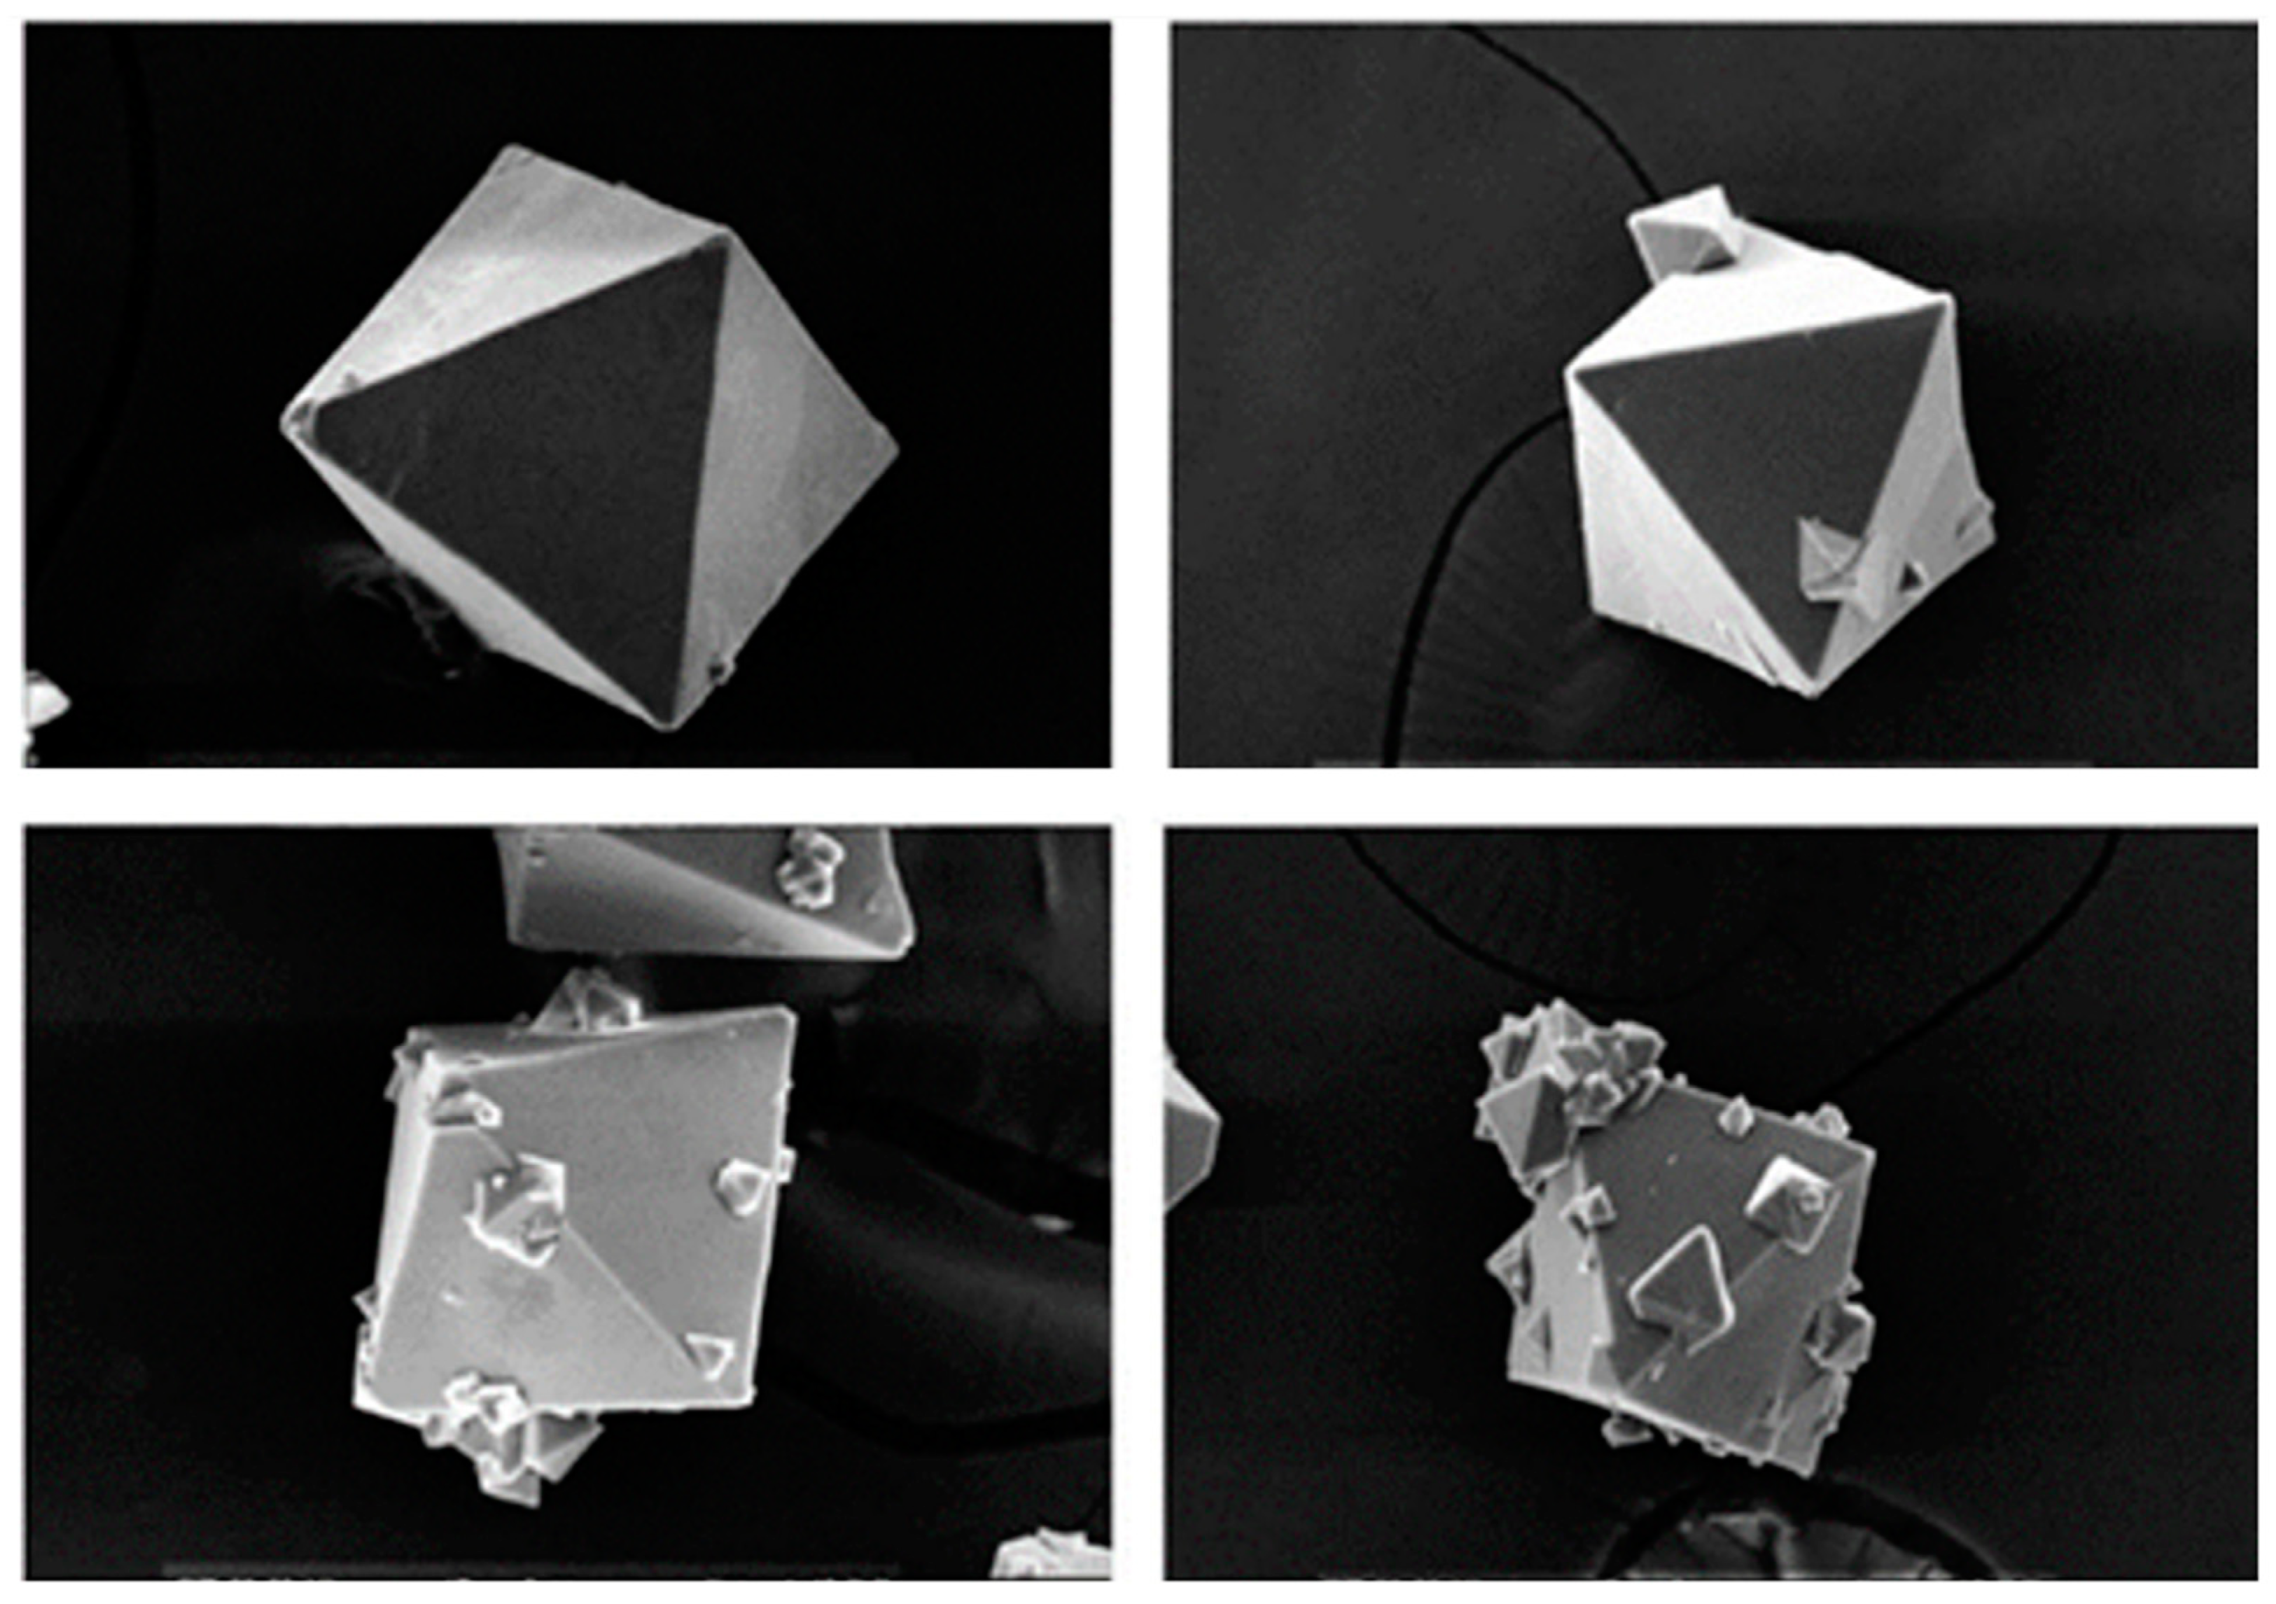
Scanning electron microscopy (SEM) images are shown in Figure 18. It can be observed that the crystals produced in the membrane distillation–crystallization system had an octahedral shape and a face-centered cubic crystal system. Based on the microscopic images, the mother crystals maintained their octahedral shape. These crystals resembled the crystals obtained using a semi-batch reactor crystallization process of sodium fluoride (Figure 19) [57].
The XRD patterns of obtained crystals and the commercial NaF sample are shown in Figure 20. The measured diffractions’ peak positions and intensities are a fingerprint of a particular crystalline phase. The crystal sample has the same crystalline phase as the commercial sample. On the other hand, the results of the particle size distribution of the crystals after a number of measurements is plotted in Figure 21. It can be observed that the average size is 160.86 ± 74.34 µm.
The feasibility of producing NaF crystals using a membrane contactor has been confirmed. However, membrane scaling due to the deposition of crystals on the surface was observed in some experiments, mainly because of the recirculation of the feed stream, which introduced microcrystals coming from the feed reservoir. In order to avoid this undesired situation, a crystallization reservoir should be considered after the membrane contactor so that crystals are not recirculated to the membrane contactor.

4. Conclusions

The following conclusions have been drawn from the present work.
  • Reverse osmosis
The optimal transmembrane pressure strongly depends on the feed concentration. The maximum pure water permeability of the membrane was found to be 4.8 ± 0.1 Lh−1 bar−1m−2 at 40 bar and with a feed concentration of 0.02 gNaFL−1. The rejection rate varied between 92.5 and 98.6, leading to a retentate concentration between 0.01 gNaFL−1 and 0.04 gNaFL−1. Thus, the Trisep X—20 membrane presented good performance for fluoride removal.
  • Osmotic membrane distillation–crystallization system
The effect of the feed concentration on the transmembrane water flux was evaluated. Results showed that at lower feed concentrations (0.01 to 0.16 gNaFL−1), the flux was not significantly influenced. However, at higher feed concentrations (5–39.5 gNaFL−1), the transmembrane water flux was significantly influenced by the concentration. The flux decreased from 0.71 to 0.24 mLm−2min−1 at 5 and 39 g NaFL−1, respectively. The lower the feed concentration, the higher the water activity and higher the driving force. This is supported by the nearly negligible variation in the overall mass transfer coefficient with the concentration, ranging from 1.1 × 10⁻¹⁰ mpa−1s−1 at the lowest concentration of 5 g NaFL−1 to 7.9 × 10⁻¹¹ mpa−1s−1 at the highest concentration of 39 g NaFL−1. On the other hand, the concentration of the osmotic solution showed a very significant effect on both the transmembrane flux and the mass transfer coefficient due to the water activity dependence on concentration being higher. Finally, pure NaF crystals with octahedral structure and a face-centered cubic crystal system were obtained, with an average size of 160.86 ± 74.34 µm.

Author Contributions

Conceptualization, W.Z.O., E.A. and P.L.; literature review, W.Z.O.; investigation, W.Z.O.; analysis, W.Z.O.; writing—original draft, W.Z.O.; writing–review and editing, E.A. and P.L.; supervision, E.A. and P.L. All authors have read and agreed to the published version of the manuscript.

Funding

This research received financial support from the Network for Advancement of Sustainable Capacity in Education and Research in Ethiopia–NASCERE, and the ARES-CCD (Commission pour la coopération au développement) in Belgium via Doctoral mobility grants.

Institutional Review Board Statement

Not applicable.

Informed Consent Statement

Not applicable.

Data Availability Statement

Data will be available upon request.

Acknowledgments

We would like to acknowledge the support of the research group Membrane Technology for a Sustainable World at the Institute of Mechanics, Materials and Civil Engineering (iMMC) at the UCLouvain. We also acknowledge the financial support from the Network for Advancement of Sustainable Capacity in Education and Research in Ethiopia (NASCERE) and ARES-CCD (Commission pour la Coopération au Développement) doctoral mobility grants.

Conflicts of Interest

The authors declare no conflict of interest associated with this study.

Appendix A

The conductivity of samples at different concentrations of NaF was measured and is shown in Figure A1, which was used to determine the concentrations of the permeate and the retentate. In addition, curve fitting was realized by linear regression on the data. This regression is valid strictly for the range of concentrations studied.
Figure A1. Function of conductivity versus sodium fluoride (NaF) concentrations.
Cleantechnol 05 00049 g0a1
Figure A2. Transmembrane flux over time at various feed concentrations. The osmotic concentration is 100 gNaClL−1. The feed and osmotic flow rates are 200 and 300 mL·min−1, respectively.
Cleantechnol 05 00049 g0a2
Figure A3. Effect of feed concentrations on the average transmembrane flux over time. The osmotic concentration is 100 gNaClL−1. The feed and osmotic flow rates are 200 and 300 mL·min−1, respectively.
Cleantechnol 05 00049 g0a3
Figure A4. Permeate flux of X-20 RO membrane as a function of time at transmembrane pressure of 15 and 30 bar.
Cleantechnol 05 00049 g0a4
Figure A5. Rejection and pure water permeability (Lp) of X_20 RO membrane at each applied transmembrane pressure.
Cleantechnol 05 00049 g0a5

Appendix B. Water Activity

According to the Debye–Hückel theory [52], the feed and osmotic water activities of Equation (6) are given by:
l n a = m s v M ( 1 α 3 z + z I σ + δ I 2 )
σ y = 3 y 3 ( 1 + y 2 ln 1 + y 1 1 + y )
y = B I
I = 1 2 M i o n s v i z i 2
with mw = 0.018 kg·mol−1 (the mass of solvent in one mole of solvent), v the number of ions after dissociation of the electrolyte, MAB(molsolute/kgsolvent) the electrolyte concentration, z the valence of the ion after dissociation, and I the ionic strength
Water activity of the osmotic solution:
ms = 0.018 (kg/mol)
V = 2 (Na = 1+; Cl = 1)
  σ 20 0 = 1.164
δ N a C l = 0.137
β N a C l = 1
Figure A5 shows the water activity of a pure solution of NaF, calculated based on the description by Faridi and El Guendouzi (2015).
Figure A6. Water activity as function of NaF concentration.
Cleantechnol 05 00049 g0a6

References

  1. Brindha, K.; Elango, L. Fluoride in groundwater: Causes, implications and mitigation measures. Fluoride Prop. Appl. Environ. Manag. 2011, 1, 111–136. [Google Scholar]
  2. Waghmare, S.S.; Arfin, T. Fluoride removal from water by various techniques. Int. J. Innov. Sci. Eng. Technol. 2015, 2, 560–571. [Google Scholar]
  3. Bejaoui, I.; Mnif, A.; Hamrouni, B. Performance of Reverse Osmosis and Nanofiltration in the Removal of Fluoride from Model Water and Metal Packaging Industrial Effluent. Sep. Sci. Technol. 2014, 49, 1135–1145. [Google Scholar] [CrossRef]
  4. Barathi, M.; Kumar, A.S.K.; Rajesh, N. Impact of fluoride in potable water—An outlook on the existing defluoridation strategies and the road ahead. Coord. Chem. Rev. 2019, 387, 121–128. [Google Scholar] [CrossRef]
  5. World Health Organization. Fluoride in Drinkingwater, Background Document for Development of WHO Guidelines for Drinking-Water Quality; World Health Organization: Geneva, Switzerland, 2004. [Google Scholar]
  6. Fawell, J.; Bailey, K.; Chilton, J.; Dahi, E.; Fewtrell, L.; Magara, Y. Fluoride in Drinking-Water; IWA Publishing: London, UK, 2006. [Google Scholar]
  7. Shen, J.; Schafer, A.I. Factors affecting fluoride and natural organic matter (NOM) removal from natural waters in Tanzania by nanofiltration/reverse osmosis. Sci. Total Environ. 2015, 527–528, 520–529. [Google Scholar] [CrossRef]
  8. Malago, J. Fluoride Levels in Surface and Groundwater in Africa: A Review. Am. J. Water Sci. Eng. 2017, 3, 1–17. [Google Scholar] [CrossRef]
  9. Craig, L.; Lutz, A.; Berry, K.A.; Yang, W. Recommendations for fluoride limits in drinking water based on estimated daily fluoride intake in the Upper East Region, Ghana. Sci. Total Environ. 2015, 532, 127–137. [Google Scholar] [CrossRef]
  10. Kheradpisheh, Z.; Mirzaei, M.; Mahvi, A.H.; Mokhtari, M.; Azizi, R.; Fallahzadeh, H.; Ehrampoush, M.H. Impact of drinking water fluoride on human thyroid hormones: A case-control study. Sci. Rep. 2018, 8, 2674. [Google Scholar] [CrossRef] [PubMed]
  11. Meenakshi; Maheshwari, R.C. Fluoride in drinking water and its removal. J. Hazard. Mater. 2006, 137, 456–463. [Google Scholar] [CrossRef]
  12. Bhatnagar, A.; Kumar, E.; Sillanpää, M. Fluoride removal from water by adsorption—A review. Chem. Eng. J. 2011, 171, 811–840. [Google Scholar] [CrossRef]
  13. United Nations. United Nations Sustainable Develepment Goals; United Nations: New York, NY, USA, 2015. [Google Scholar]
  14. World Health Organization. Drinking Water; World Health Organization: Geneva, Switzerland, 2022. [Google Scholar]
  15. He, J.; Yang, Y.; Wu, Z.; Xie, C.; Zhang, K.; Kong, L.; Liu, J. Review of fluoride removal from water environment by adsorption. J. Environ. Chem. Eng. 2020, 8, 104516. [Google Scholar] [CrossRef]
  16. Hou, D.; Wang, J.; Zhao, C.; Wang, B.; Luan, Z.; Sun, X. Fluoride removal from brackish groundwater by direct contact membrane distillation. J. Environ. Sci. 2010, 22, 1860–1867. [Google Scholar] [CrossRef] [PubMed]
  17. Moran Ayala, L.I.; Paquet, M.; Janowska, K.; Jamard, P.; Quist-Jensen, C.A.; Bosio, G.N.; Mártire, D.O.; Fabbri, D.; Boffa, V. Water Defluoridation: Nanofiltration vs Membrane Distillation. Ind. Eng. Chem. Res. 2018, 57, 14740–14748. [Google Scholar] [CrossRef]
  18. Hu, K.; Dickson, J.M. Nanofiltration membrane performance on fluoride removal from water. J. Membr. Sci. 2006, 279, 529–538. [Google Scholar] [CrossRef]
  19. Fadaei, A. Comparison of Water Defluoridation Using Different Techniques. Int. J. Chem. Eng. 2021, 2021, 2023895. [Google Scholar] [CrossRef]
  20. Peter-Varbanets, M.; Zurbrügg, C.; Swartz, C.; Pronk, W. Decentralized systems for potable water and the potential of membrane technology. Water Res. 2009, 43, 245–265. [Google Scholar] [CrossRef]
  21. Jadhav, S.V.; Bringas, E.; Yadav, G.D.; Rathod, V.K.; Ortiz, I.; Marathe, K.V. Arsenic and fluoride contaminated groundwaters: A review of current technologies for contaminants removal. J. Environ. Manag. 2015, 162, 306–325. [Google Scholar] [CrossRef]
  22. Singh, J.; Singh, P.; Singh, A. Fluoride ions vs removal technologies: A study. Arab. J. Chem. 2016, 9, 815–824. [Google Scholar] [CrossRef]
  23. Alkhudhiri, A.; Darwish, N.; Hilal, N. Membrane distillation: A comprehensive review. Desalination 2012, 287, 2–18. [Google Scholar] [CrossRef]
  24. Naidu, G.; Jeong, S.; Choi, Y.; Jang, E.; Hwang, T.-M.; Vigneswaran, S. Application of vacuum membrane distillation for small scale drinking water production. Desalination 2014, 354, 53–61. [Google Scholar] [CrossRef]
  25. Boubakri, A.; Bouchrit, R.; Hafiane, A.; Bouguecha, S.A. Fluoride removal from aqueous solution by direct contact membrane distillation: Theoretical and experimental studies. Environ. Sci. Pollut. Res. Int. 2014, 21, 10493–10501. [Google Scholar] [CrossRef] [PubMed]
  26. Ruiz Salmón, I.; Janssens, R.; Luis, P. Mass and heat transfer study in osmotic membrane distillation-crystallization for CO2 valorization as sodium carbonate. Sep. Purif. Technol. 2017, 176, 173–183. [Google Scholar] [CrossRef]
  27. Diawara, C.K.; Diop, S.N.; Diallo, M.A.; Farcy, M.; Deratani, A. Performance of nanofiltration (NF) and low pressure reverse osmosis (LPRO) membranes in the removal of fluorine and salinity from brackish drinking water. J. Water Resour. Prot. 2011, 3, 912. [Google Scholar] [CrossRef]
  28. Dolar, D.; Košutić, K.; Vučić, B. RO/NF treatment of wastewater from fertilizer factory—Removal of fluoride and phosphate. Desalination 2011, 265, 237–241. [Google Scholar] [CrossRef]
  29. Gedam, V.; Patil, J.; Kagne, S.; Sirsam, R.; Labhasetwar, P. Performance evaluation of polyamide reverse osmosis membrane for removal of contaminants in ground water collected from Chandrapur district. J. Memb. Sci. Technol. 2012, 2, 117. [Google Scholar] [CrossRef]
  30. Ezzeddine, A.; Meftah, N.; Hannachi, A. Removal of fluoride from an industrial wastewater by a hybrid process combining precipitation and reverse osmosis. Desalination Water Treat. 2015, 55, 2618–2625. [Google Scholar] [CrossRef]
  31. Owusu-Agyeman, I.; Jeihanipour, A.; Luxbacher, T.; Schäfer, A.I. Implications of humic acid, inorganic carbon and speciation on fluoride retention mechanisms in nanofiltration and reverse osmosis. J. Membr. Sci. 2017, 528, 82–94. [Google Scholar] [CrossRef]
  32. Gaikwad, M.S.; Balomajumder, C. Simultaneous rejection of fluoride and Cr (VI) from synthetic fluoride-Cr (VI) binary water system by polyamide flat sheet reverse osmosis membrane and prediction of membrane performance by CFSK and CFSD models. J. Mol. Liq. 2017, 234, 194–200. [Google Scholar] [CrossRef]
  33. Jeihanipour, A.; Shen, J.; Abbt-Braun, G.; Huber, S.A.; Mkongo, G.; Schäfer, A.I. Seasonal variation of organic matter characteristics and fluoride concentration in the Maji ya Chai River (Tanzania): Impact on treatability by nanofiltration/reverse osmosis. Sci. Total Environ. 2018, 637, 1209–1220. [Google Scholar] [CrossRef]
  34. Deswal, M.; Laura, J. Effect of change in trans-membrane pressure differences on the efficiency of a thin film reverse osmosis membrane. IOSR J. Eng. 2018, 8, 21–26. [Google Scholar]
  35. Owusu-Agyeman, I.; Reinwald, M.; Jeihanipour, A.; Schäfer, A.I. Removal of fluoride and natural organic matter from natural tropical brackish waters by nanofiltration/reverse osmosis with varying water chemistry. Chemosphere 2019, 217, 47–58. [Google Scholar] [CrossRef] [PubMed]
  36. Drioli, E.; Criscuoli, A.; Curcio, E. Membrane Contactors: Fundamentals, Applications and Potentialities; Elsevier: Amsterdam, The Netherlands, 2011. [Google Scholar]
  37. Salmón, I.R.; Luis, P. Membrane crystallization via membrane distillation. Chem. Eng. Process. Process Intensif. 2018, 123, 258–271. [Google Scholar] [CrossRef]
  38. Luis, P.; Van der Bruggen, B. The role of membranes in post-combustion CO2 capture. Greenh. Gases Sci. Technol. 2013, 3, 318–337. [Google Scholar] [CrossRef]
  39. Pramanik, B.K.; Thangavadivel, K.; Shu, L.; Jegatheesan, V. A critical review of membrane crystallization for the purification of water and recovery of minerals. Rev. Environ. Sci. Bio/Technol. 2016, 15, 411–439. [Google Scholar] [CrossRef]
  40. Curcio, E.; Drioli, E. Membrane distillation and related operations—A review. Sep. Purif. Rev. 2005, 34, 35–86. [Google Scholar] [CrossRef]
  41. Martínez, M.B.; Jullok, N.; Negrín, Z.R.; Van der Bruggen, B.; Luis, P. Membrane crystallization for the recovery of a pharmaceutical compound from waste streams. Chem. Eng. Res. Des. 2014, 92, 264–272. [Google Scholar] [CrossRef]
  42. Garcia Alvarez, M.; Sang Sefidi, V.; Beguin, M.; Collet, A.; Bahamonde Soria, R.; Luis, P. Osmotic Membrane Distillation Crystallization of NaHCO3. Energies 2022, 15, 2682. [Google Scholar] [CrossRef]
  43. Chen, Q.; Burhan, M.; Akhtar, F.H.; Ybyraiymkul, D.; Shahzad, M.W.; Li, Y.; Ng, K.C. A decentralized water/electricity cogeneration system integrating concentrated photovoltaic/thermal collectors and vacuum multi-effect membrane distillation. Energy 2021, 230, 120852. [Google Scholar] [CrossRef]
  44. Kurz, E.E.C.; Hellriegel, U.; Figoli, A.; Gabriele, B.; Bundschuh, J.; Hoinkis, J. Small-scale membrane-based arsenic removal for decentralized applications–Developing a conceptual approach for future utilization. Water Res. 2021, 196, 116978. [Google Scholar] [CrossRef]
  45. Yang, F.; Zhang, H.; Zhang, X.; Zhang, Y.; Li, J.; Jin, F.; Zhou, B. Performance analysis and evaluation of the 146 rural decentralized wastewater treatment facilities surrounding the Erhai Lake. J. Clean. Prod. 2021, 315, 128159. [Google Scholar] [CrossRef]
  46. Lenntech, Trisep X-20: The proven low fouling RO membrane. Available online: https://www.lenntech.com/Data-sheets/Trisep-X-20-Lit-L.pdf (accessed on 20 January 2023).
  47. Shen, J.; Schäfer, A. Removal of fluoride and uranium by nanofiltration and reverse osmosis: A review. Chemosphere 2014, 117, 679–691. [Google Scholar] [CrossRef] [PubMed]
  48. Bao, T.; Yu, Z.M.; Damtie, M.M.; Wu, K.; Jin, J.; Zhang, Y.; Wei, X.L.; Frost, R.L. Use of autoclaved aerated concrete particles for simultaneous removal of nitrogen and phosphorus as filter media from domestic wastewater. Environ. Technol. 2020, 41, 3032–3042. [Google Scholar] [CrossRef] [PubMed]
  49. Damtie, M.M.; Woo, Y.C.; Kim, B.; Hailemariam, R.H.; Park, K.-D.; Shon, H.K.; Park, C.; Choi, J.-S. Removal of fluoride in membrane-based water and wastewater treatment technologies: Performance review. J. Environ. Manag. 2019, 251, 109524. [Google Scholar] [CrossRef] [PubMed]
  50. Luis, P.; Van Aubel, D.; Van der Bruggen, B. Technical viability and exergy analysis of membrane crystallization: Closing the loop of CO2 sequestration. Int. J. Greenh. Gas Control 2013, 12, 450–459. [Google Scholar] [CrossRef]
  51. Faridi, J.; El Guendouzi, M. Study of Ion-Pairing and Thermodynamic Properties of Sodium Fluoride in Aqueous Solutions at Temperatures from 298.15 to 353.15 K. J. Solut. Chem. 2015, 44, 2194–2207. [Google Scholar] [CrossRef]
  52. Sandler, S.I. Chemical, Biochemical, and Engineering Thermodynamics; John Wiley & Sons: Hoboken, NJ, USA, 2017. [Google Scholar]
  53. Baek, Y.; Kang, J.; Theato, P.; Yoon, J. Measuring hydrophilicity of RO membranes by contact angles via sessile drop and captive bubble method: A comparative study. Desalination 2012, 303, 23–28. [Google Scholar] [CrossRef]
  54. Tang, C.Y.; Kwon, Y.-N.; Leckie, J.O. Effect of membrane chemistry and coating layer on physiochemical properties of thin film composite polyamide RO and NF membranes: I. FTIR and XPS characterization of polyamide and coating layer chemistry. Desalination 2009, 242, 149–167. [Google Scholar] [CrossRef]
  55. Liu, M.; Lü, Z.; Chen, Z.; Yu, S.; Gao, C. Comparison of reverse osmosis and nanofiltration membranes in the treatment of biologically treated textile effluent for water reuse. Desalination 2011, 281, 372–378. [Google Scholar] [CrossRef]
  56. Babu, B.R.; Rastogi, N.; Raghavarao, K. Mass transfer in osmotic membrane distillation of phycocyanin colorant and sweet-lime juice. J. Membr. Sci. 2006, 272, 58–69. [Google Scholar] [CrossRef]
  57. Kim, H.-J.; Kim, W.-S. Configuration of sodium fluoride crystal characterized by surface crystals on mother crystal. J. Cryst. Growth 2001, 233, 326–335. [Google Scholar] [CrossRef]
Figure 1. Schematic diagram of mass transfer in osmotic membrane distillation and crystallization.
Cleantechnol 05 00049 g001
Figure 2. Process flow diagram of the crossflow filtration unit. Legend: PI, pressure indicator (gauge); LL, low-level sensor (pump protection); V1, stainless steel pressure relief valve set to relieve at a little above 40 bar.
Cleantechnol 05 00049 g002
Figure 3. Schematic representation of fluoride removal mechanisms using reverse osmosis technique.
Cleantechnol 05 00049 g003
Figure 4. Schematic diagram of osmotic membrane distillation–crystallization experimental setup. A—feed solution; B—peristaltic pumps; C—membrane contactor; D—osmotic solution.
Cleantechnol 05 00049 g004
Figure 5. Contact angle measurement of X—20 RO membrane prior to filtration (a) and after filtration (b).
Cleantechnol 05 00049 g005
Figure 6. Average permeates flux of X—20 RO membrane as a function of transmembrane pressure.
Cleantechnol 05 00049 g006
Figure 7. Average permeates flux of X—20 RO membrane versus feed concentration at 40 bar.
Cleantechnol 05 00049 g007
Figure 8. Pure water permeability as a function of transmembrane pressure.
Cleantechnol 05 00049 g008
Figure 9. X-20 RO membrane rejection efficiency as a function of the applied transmembrane pressures depending on feed concentrations.
Cleantechnol 05 00049 g009
Figure 10. Rejection versus pure water permeability (Lp) of X—20 RO membrane. The six points at each concentration represent the applied transmembrane pressures (15 bar, 20 bar, 25 bar, 30 bar, 35 and 40 bar). Figure 5a in the supporting information shows the detailed conditions at each point.
Cleantechnol 05 00049 g010
Figure 11. Effect of feed flow rates on the transmembrane water flux for two different feed concentrations: 0.01 gNaFL−1 (5 mgFL−1) and 0.04 gNaFL−1 (18 mgFL−1). The concentration and flow rate of the osmotic solution are 100 gNaClL−1 and 300 mL·min−1 respectively.
Cleantechnol 05 00049 g011
Figure 12. Effect of feed flow rates on the mass transfer coefficients for two different feed concentrations: 0.01 gNaFL−1 (5 mgFL−1) and 0.04 gNaFL−1 (18 mgFL−1). The osmotic concentration and flow rate are 100 gNaClL−1 and 300 mL·min−1, respectively.
Cleantechnol 05 00049 g012
Figure 13. Transmembrane water flux at low (a) and high (b) feed (NaF) concentrations. The concentration of the osmotic solution is 100 gNaClL−1. The flow rates of the feed and the osmotic are 200 and 300 mL·min−1, respectively.
Cleantechnol 05 00049 g013
Figure 14. Mass transfer coefficient as a function of feed (NaF) concentration at constant osmotic concentration of 100 gNaClL−1. The flow rates of the feed and the osmotic are 200 and 300 mL·min−1, respectively.
Cleantechnol 05 00049 g014
Figure 15. Effect of osmotic concentrations on transmembrane water flux. Feed concentration near saturation (40 gNaFL−1) level. The flow rates of the feed and osmotic are 200 and 300 mL·min−1, respectively.
Cleantechnol 05 00049 g015
Figure 16. Effect of osmotic concentrations on mass transfer coefficient. Feed concentration near saturation (40 gNaFL−1) level. The flow rates of the feed and the osmotic are 200 and 300 mL·min−1, respectively.
Cleantechnol 05 00049 g016
Figure 17. Crystal formation at the bottom of feed reservoir in the osmotic membrane distillation–crystallization process at 20 °C.
Cleantechnol 05 00049 g017
Figure 18. SEM images of crystals from membrane distillation–crystallization system.
Cleantechnol 05 00049 g018
Figure 19. Microscopic images of sodium fluoride crystal from semi-batch crystallization process. Reprinted with permission from [57].
Cleantechnol 05 00049 g019
Figure 20. X-ray diffraction pattern of crystal sample and the original sample (commercial) of sodium fluoride.
Cleantechnol 05 00049 g020
Figure 21. Particle size distribution of the crystal sample from membrane distillation–crystallization system.
Cleantechnol 05 00049 g021
Table 1. Summary of previous studies conducted on fluoride rejection using reverse osmosis membranes.
ReferencesSource of FeedMembrane TypeInitial Feed ConcentrationRemoval Efficiency (%)
[26]Bore holeLow- and high-pressure RO membrane10 to 17 mgL−198
[27]Brackish drinking waterLow pressure RO, Polyamide-97–98.9
[28]Artificial model watersRO membranes (LFC, ULP, XLE, and TFC)2–20 mgL−1>80
[29]GroundwaterPolyamide (TW30-1812-75) RO membrane2.13 mgL−195–98
[3]Modeled waterRO-SG-2514 supplied by Osmonics 8.4 mgL−196
[3]Metal packaging industrial effluent RO-SG-2514 supplied by Osmonics34.96 mgL−196.1
[30]Real industrial wastewaterRO membrane8–60.1 mgL−198.1
[7]Surface water, groundwater, and soda lakes RO membranes (BW30LE and BW30) 42.4 mgL−199 and 98
[31]Natural waterFlat sheet TFC BW30, Dow FilmTech™ 59.7 mgL−199
[32]Synthetic waterPolyamide400 mgL−195
[33]Natural waterFlat sheet TFC BW30, Dow FilmTech™ membranes40 mgL−199
[34]Synthetic solutionRO Spiral-wound TFC (Vontron)10 mgL−189.8
[35]Natural tropical brackish waterFlat sheet TFC BW30, Dow FilmTech™ 50 mgL−195
Table 2. Product specification of RO commercial membrane Trisep X —20TM.
Trisep X—20TMSpecification
Membrane type Polyamide–urea thin film
Maximum operating T°50 °C
Minimum salt rejection (%)98.5
Maximum operating pressure 41 bar
Continuous operating pH range4–11
Maximum Silt Density Index (SDI) (15 min)5.0
Maximum turbidity 2 NTU
Table 3. Characteristics of the Liquid-Cel@ hollow fiber contactor membrane.
ParametersData from Manufacturer
Module configuration Hollow fibers
Membrane/potting materialPolypropylene/polyethylene
Fiber inner/outer diameter (μm)240/300
Wall thickness (μm)40
Effective pore size (μm)0.04
Porosity (%) 40
Effective fiber length (m)0.16
Effective membrane surface area (m2)1.4
Number of fibers 10,200
Burst strength (bar)27
Contact angle (°)112
Disclaimer/Publisher’s Note: The statements, opinions and data contained in all publications are solely those of the individual author(s) and contributor(s) and not of MDPI and/or the editor(s). MDPI and/or the editor(s) disclaim responsibility for any injury to people or property resulting from any ideas, methods, instructions or products referred to in the content.