
The Energy Efficiency Post-COVID-19 in China’s Office Buildings


Abstract
:
1. Introduction
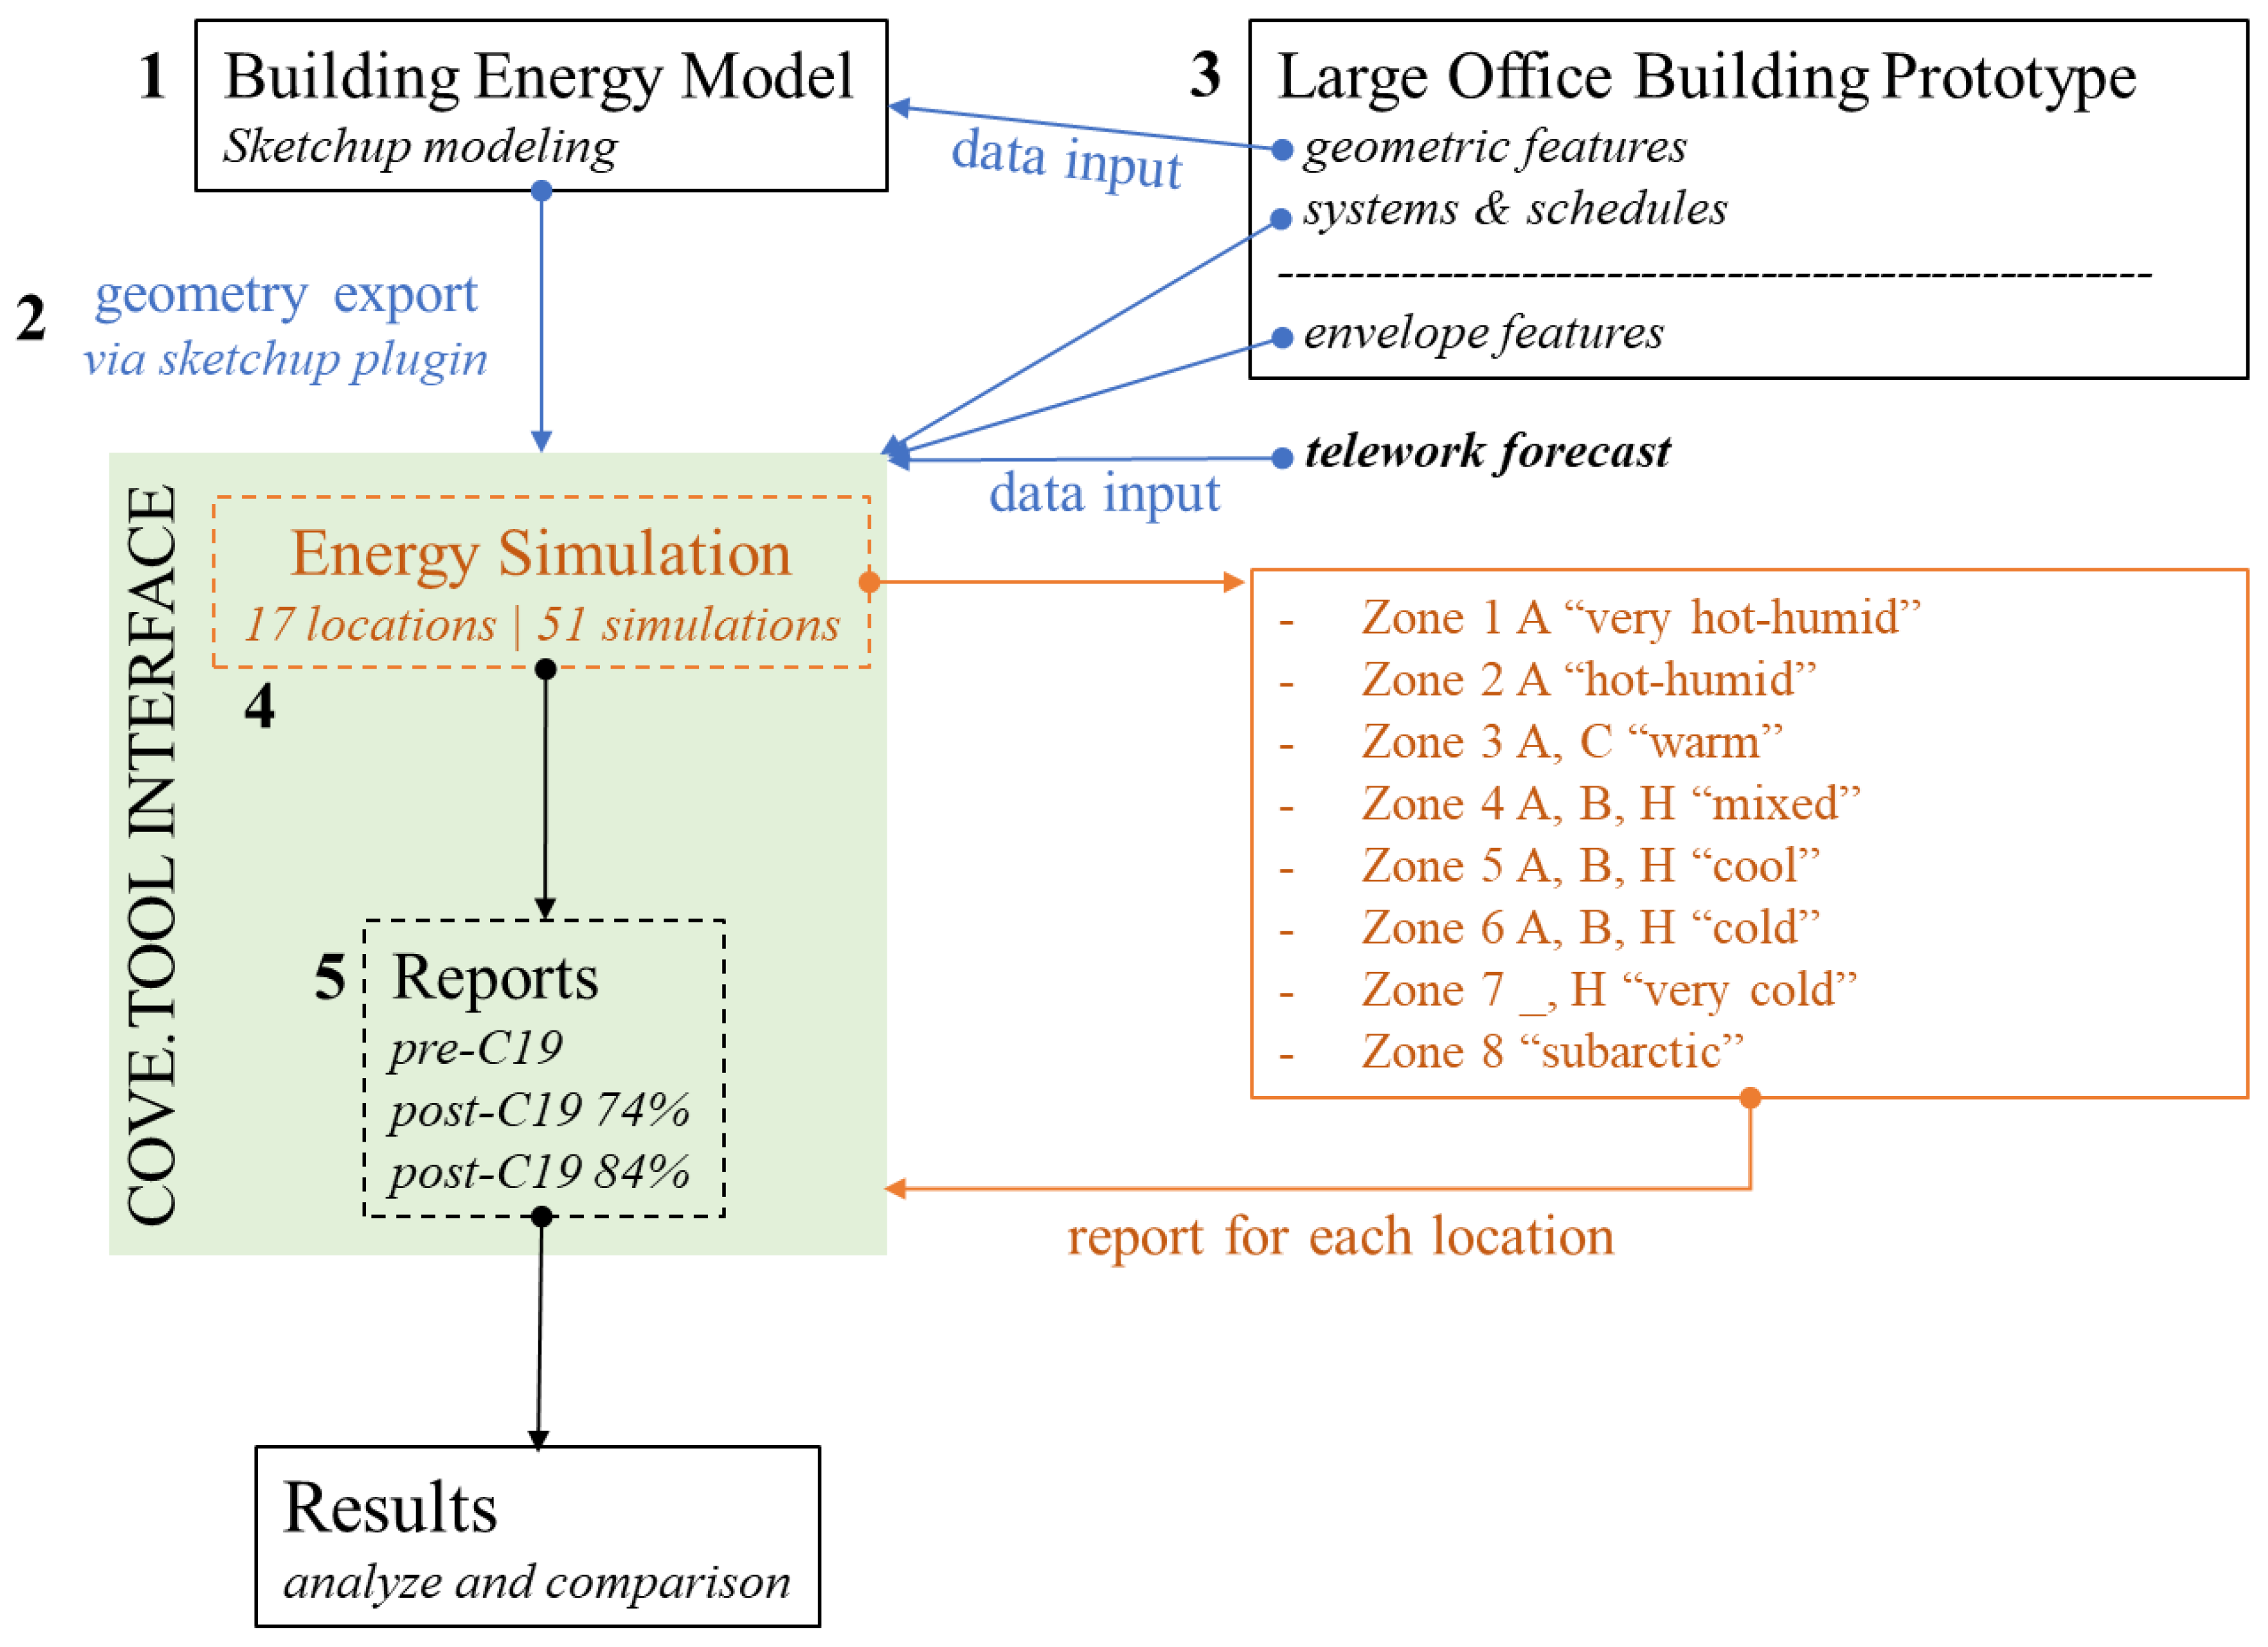
2. Materials and Methods
2.1. Pre- and Post-COVID-19 Scenario Descriptions
2.1.1. BACS and Sensors
2.1.2. Air Rate
2.1.3. Ambient Temperature and Relative Humidity
2.1.4. Filtration
2.1.5. Remote Work Policies
2.1.6. Summary
2.2. Reliability
3. Results
3.1. Data Analysis
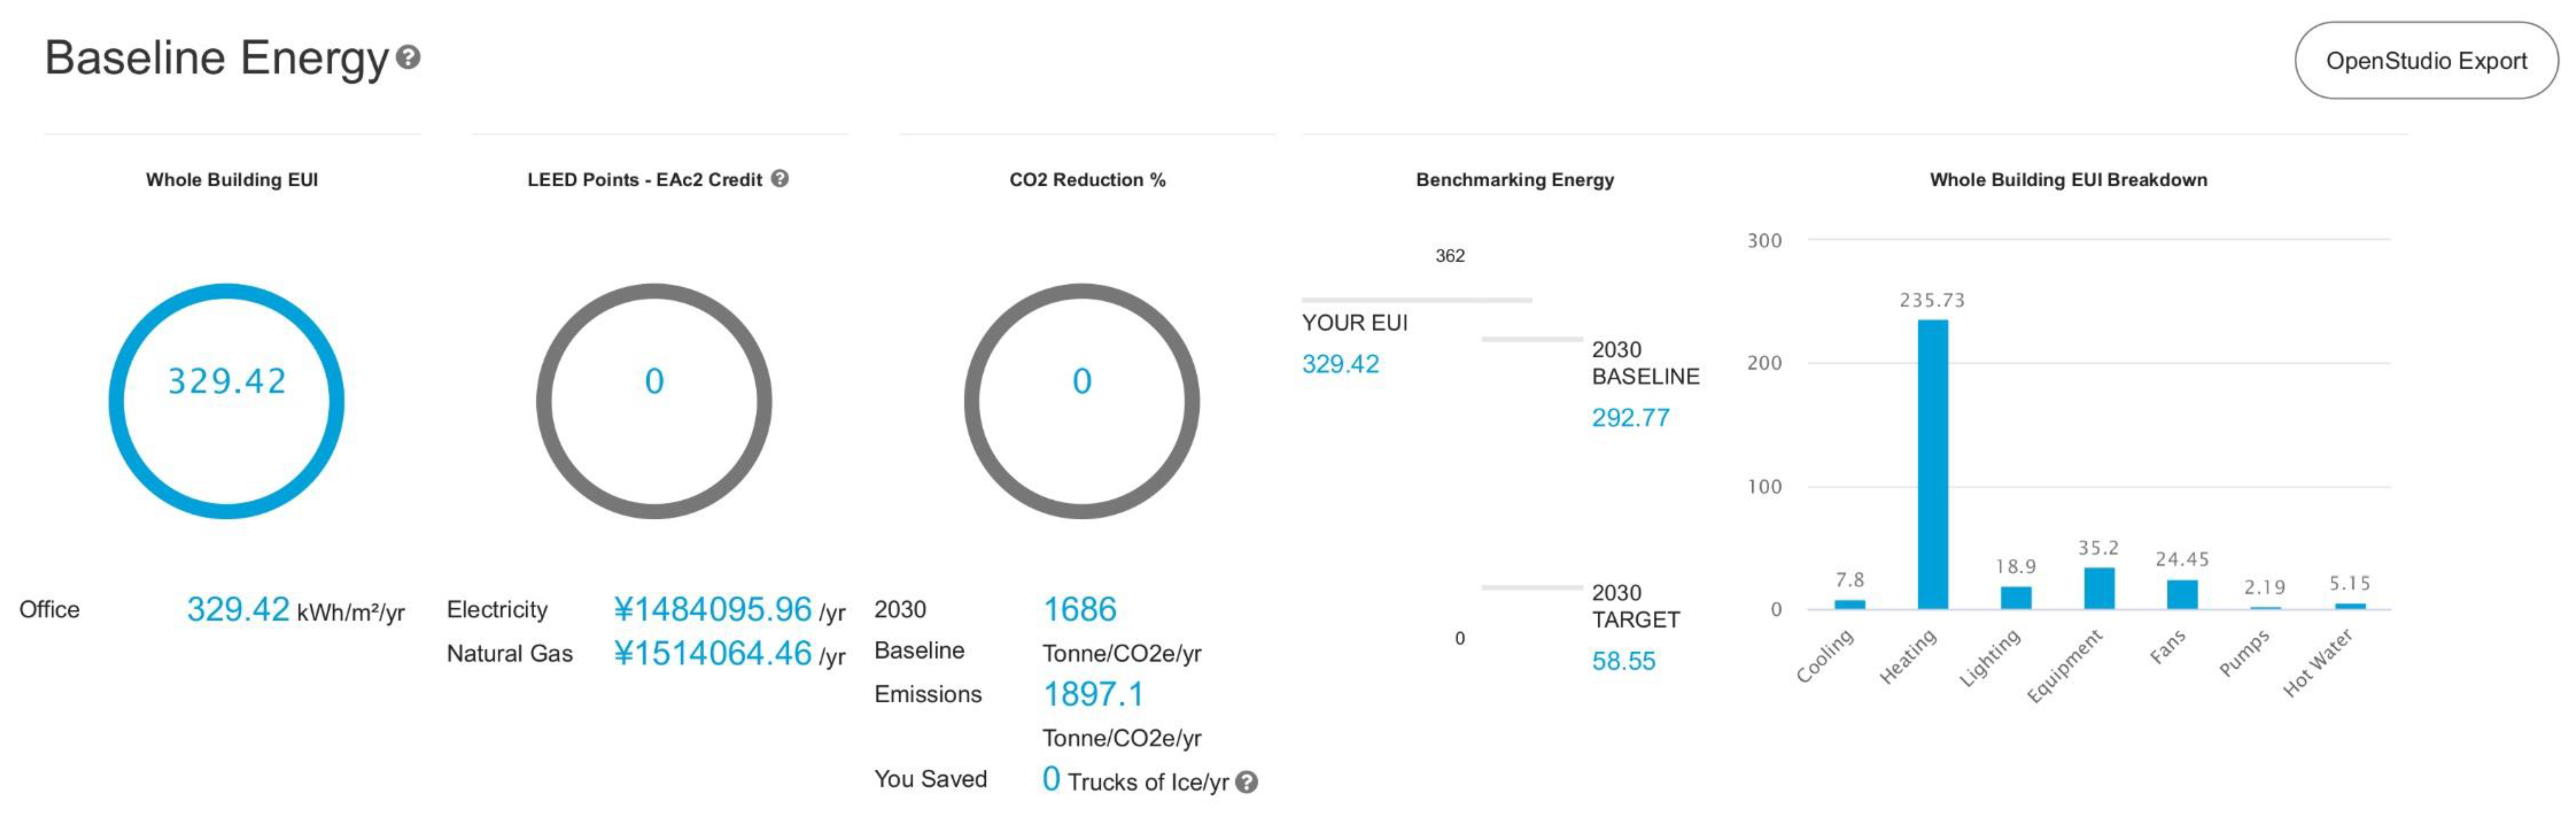
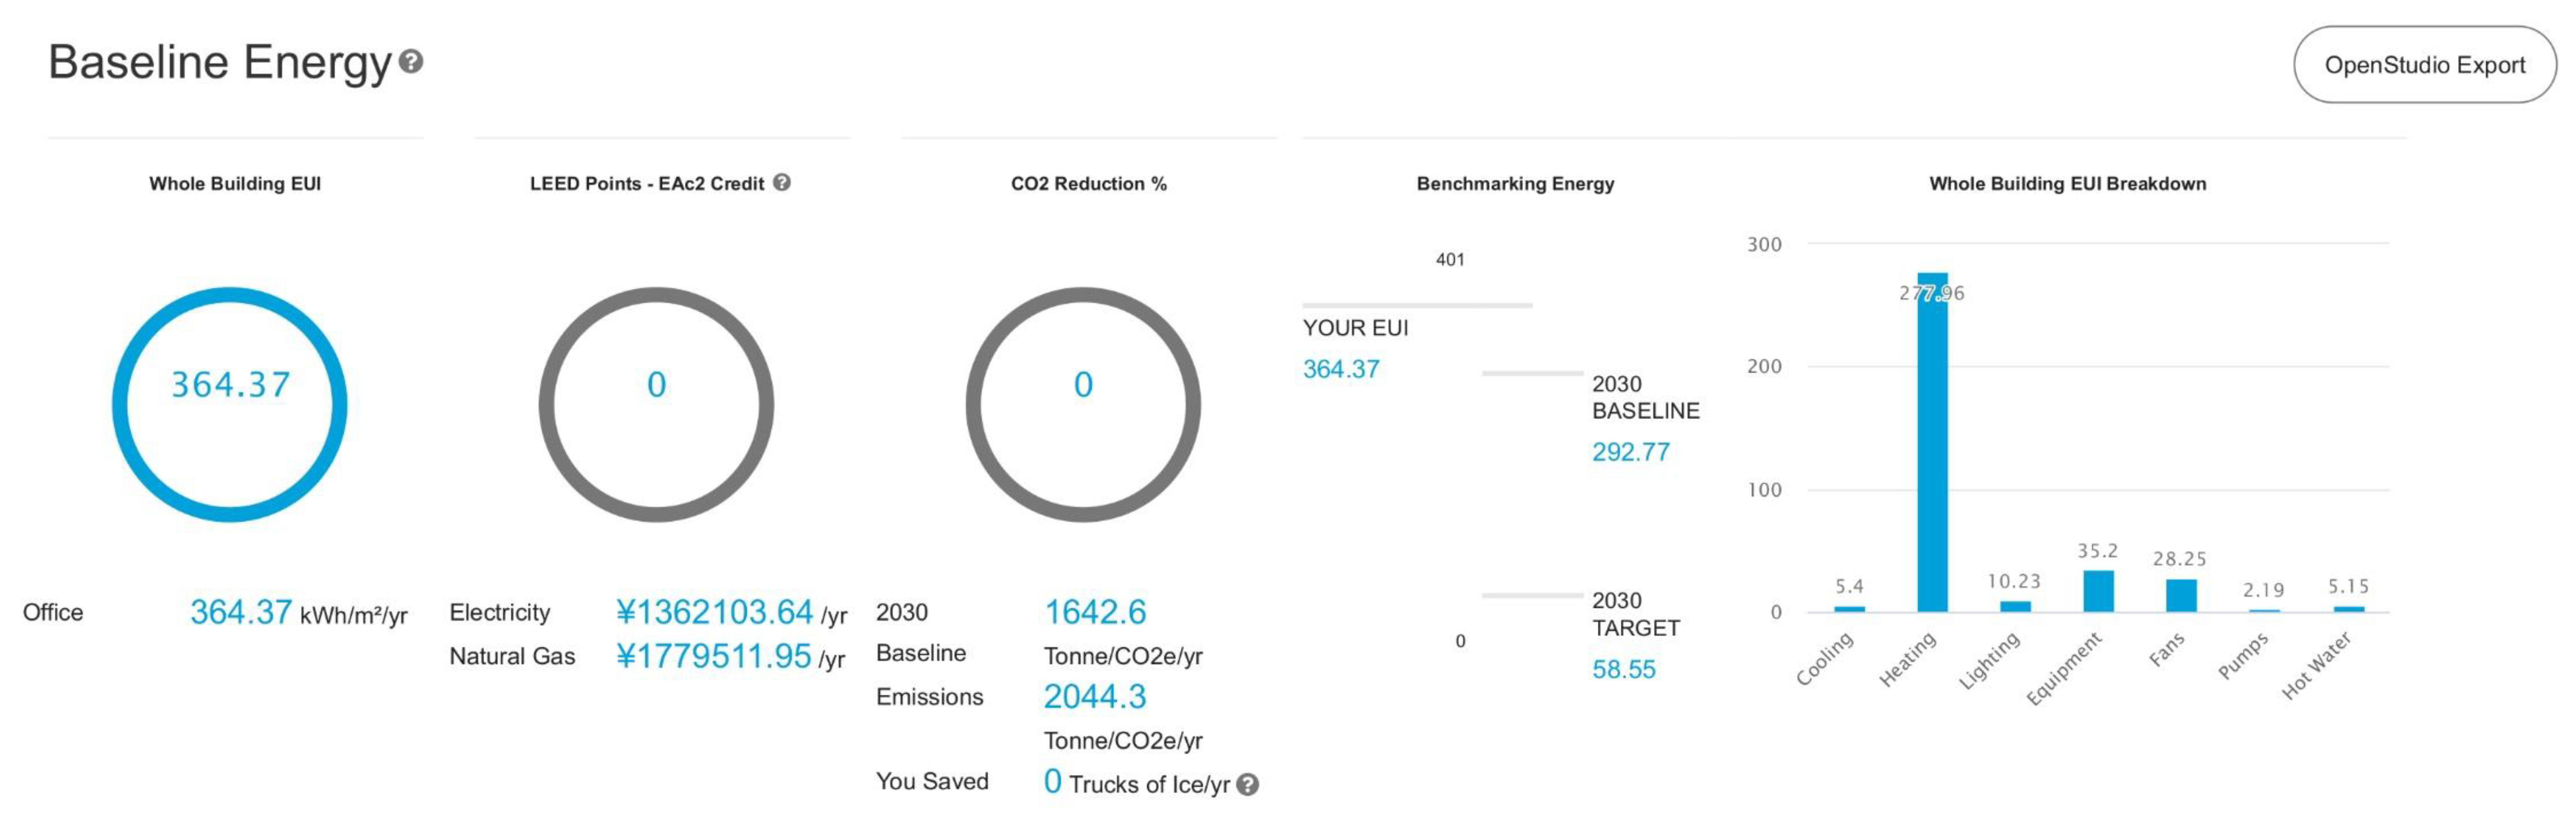
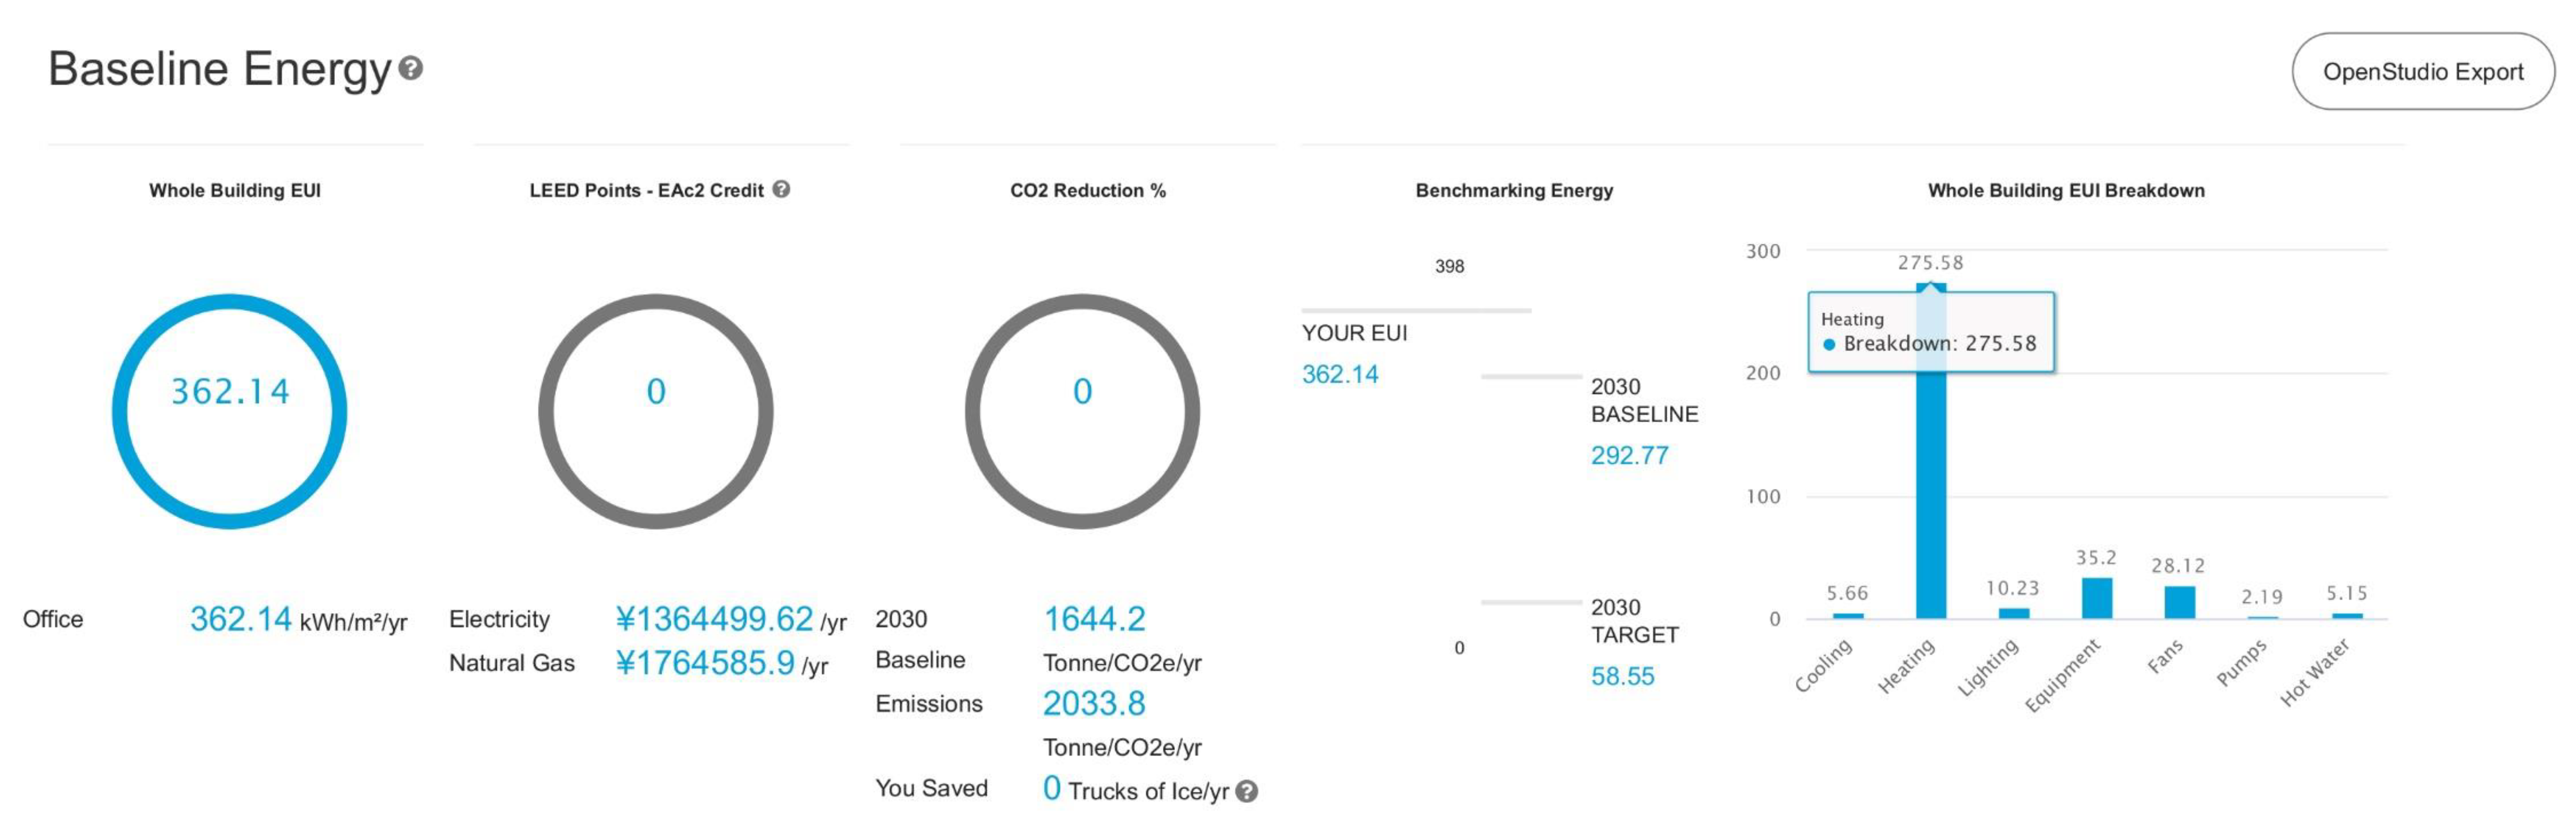
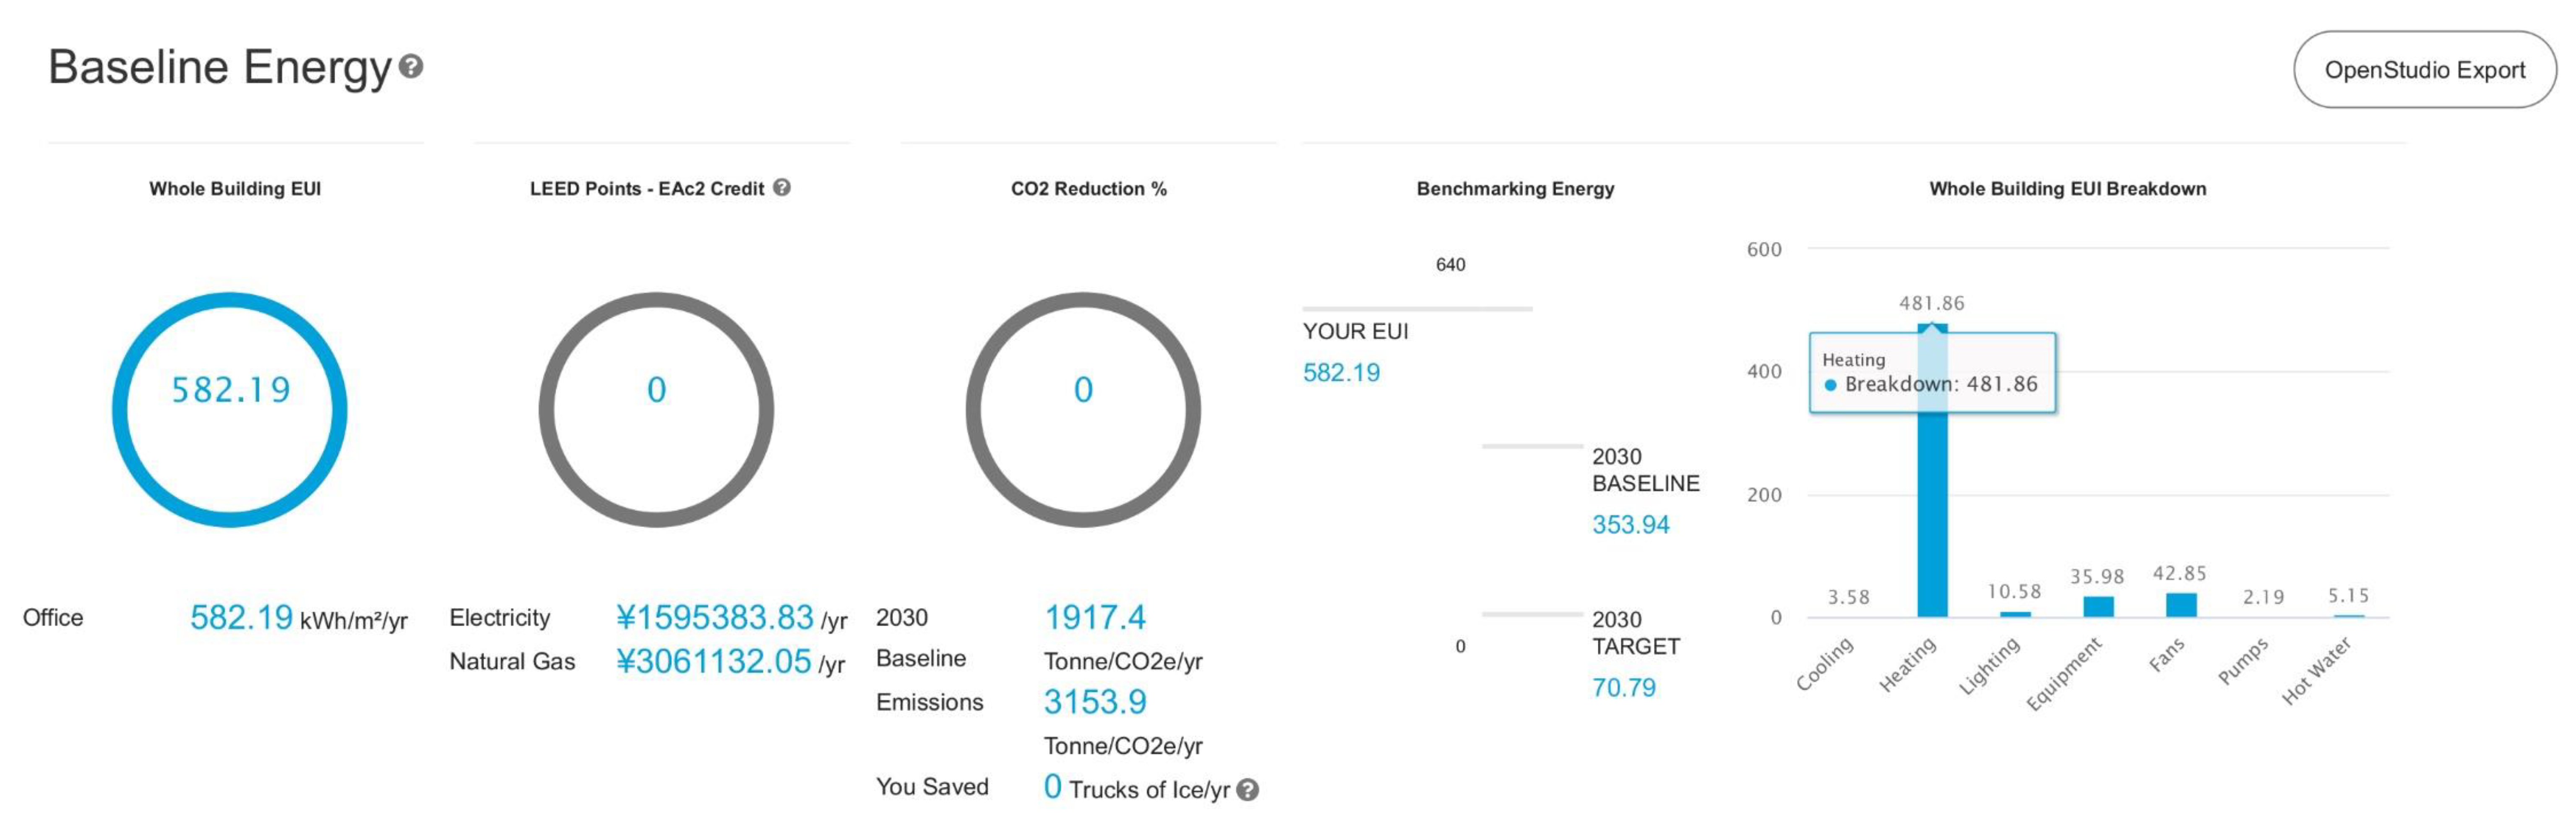
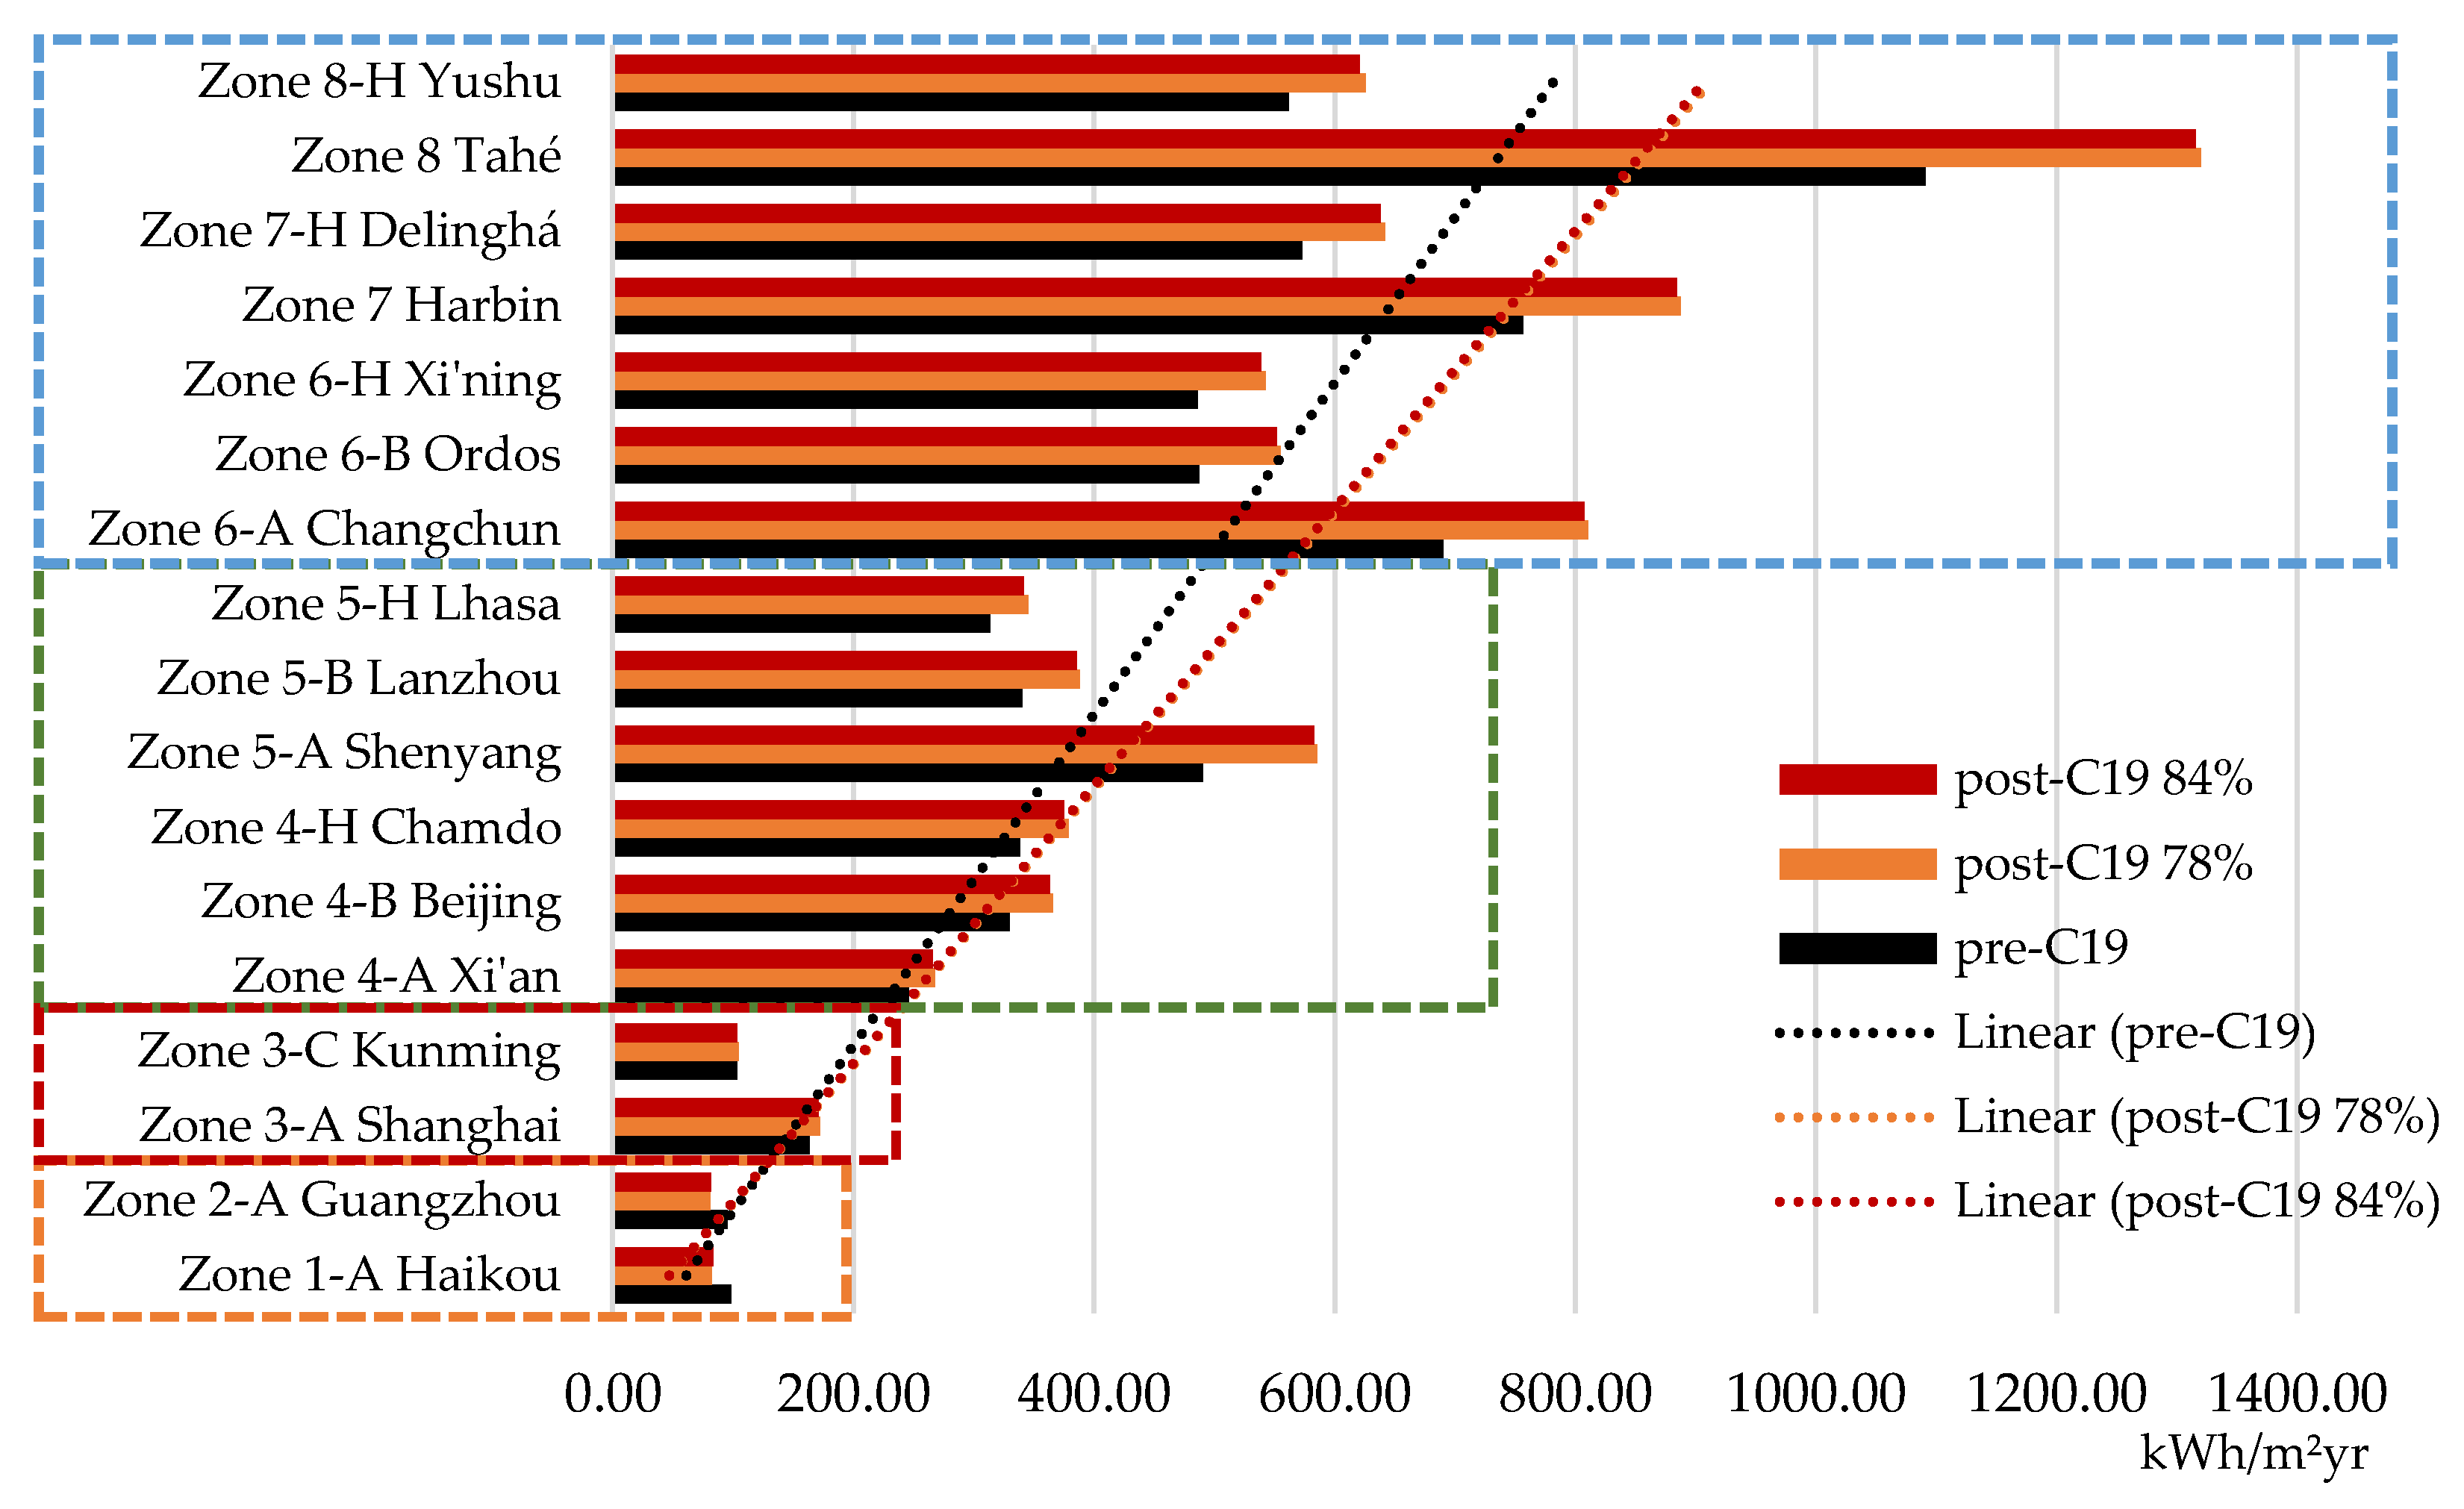
3.1.1. Energy Consumption
- Orange dashed line—“very hot” and “hot” climates from Zone 1-A to 2-A: average reduction amount between 14.97 kWh/m2yr (post-C19 78%) and 14.28 kWh/m2yr (post-C19 84%);
- Red dashed line—“warm” to “mixed humid” climates from Zone 3-A to 4-A: average increase amount between 10.79 kWh/m2yr (post-C19 78%) and 9.20 kWh/m2yr (post-C19 84%);
- Green dashed line—“mixed-dry” to “cool” climates from Zone 4-A to 5-H: average increase value amount 45.48 kWh/m2yr (post-C19 78%) and 42.64 kWh/m2yr (post-C19 84%);
- Blue dashed line—“cold” to “subarctic” climates from Zone 6-A to 8-H: average increase amount between 105.19 kWh/m2yr (post-C19 78%) and 101.53 kWh/m2yr (post-C19 84%).
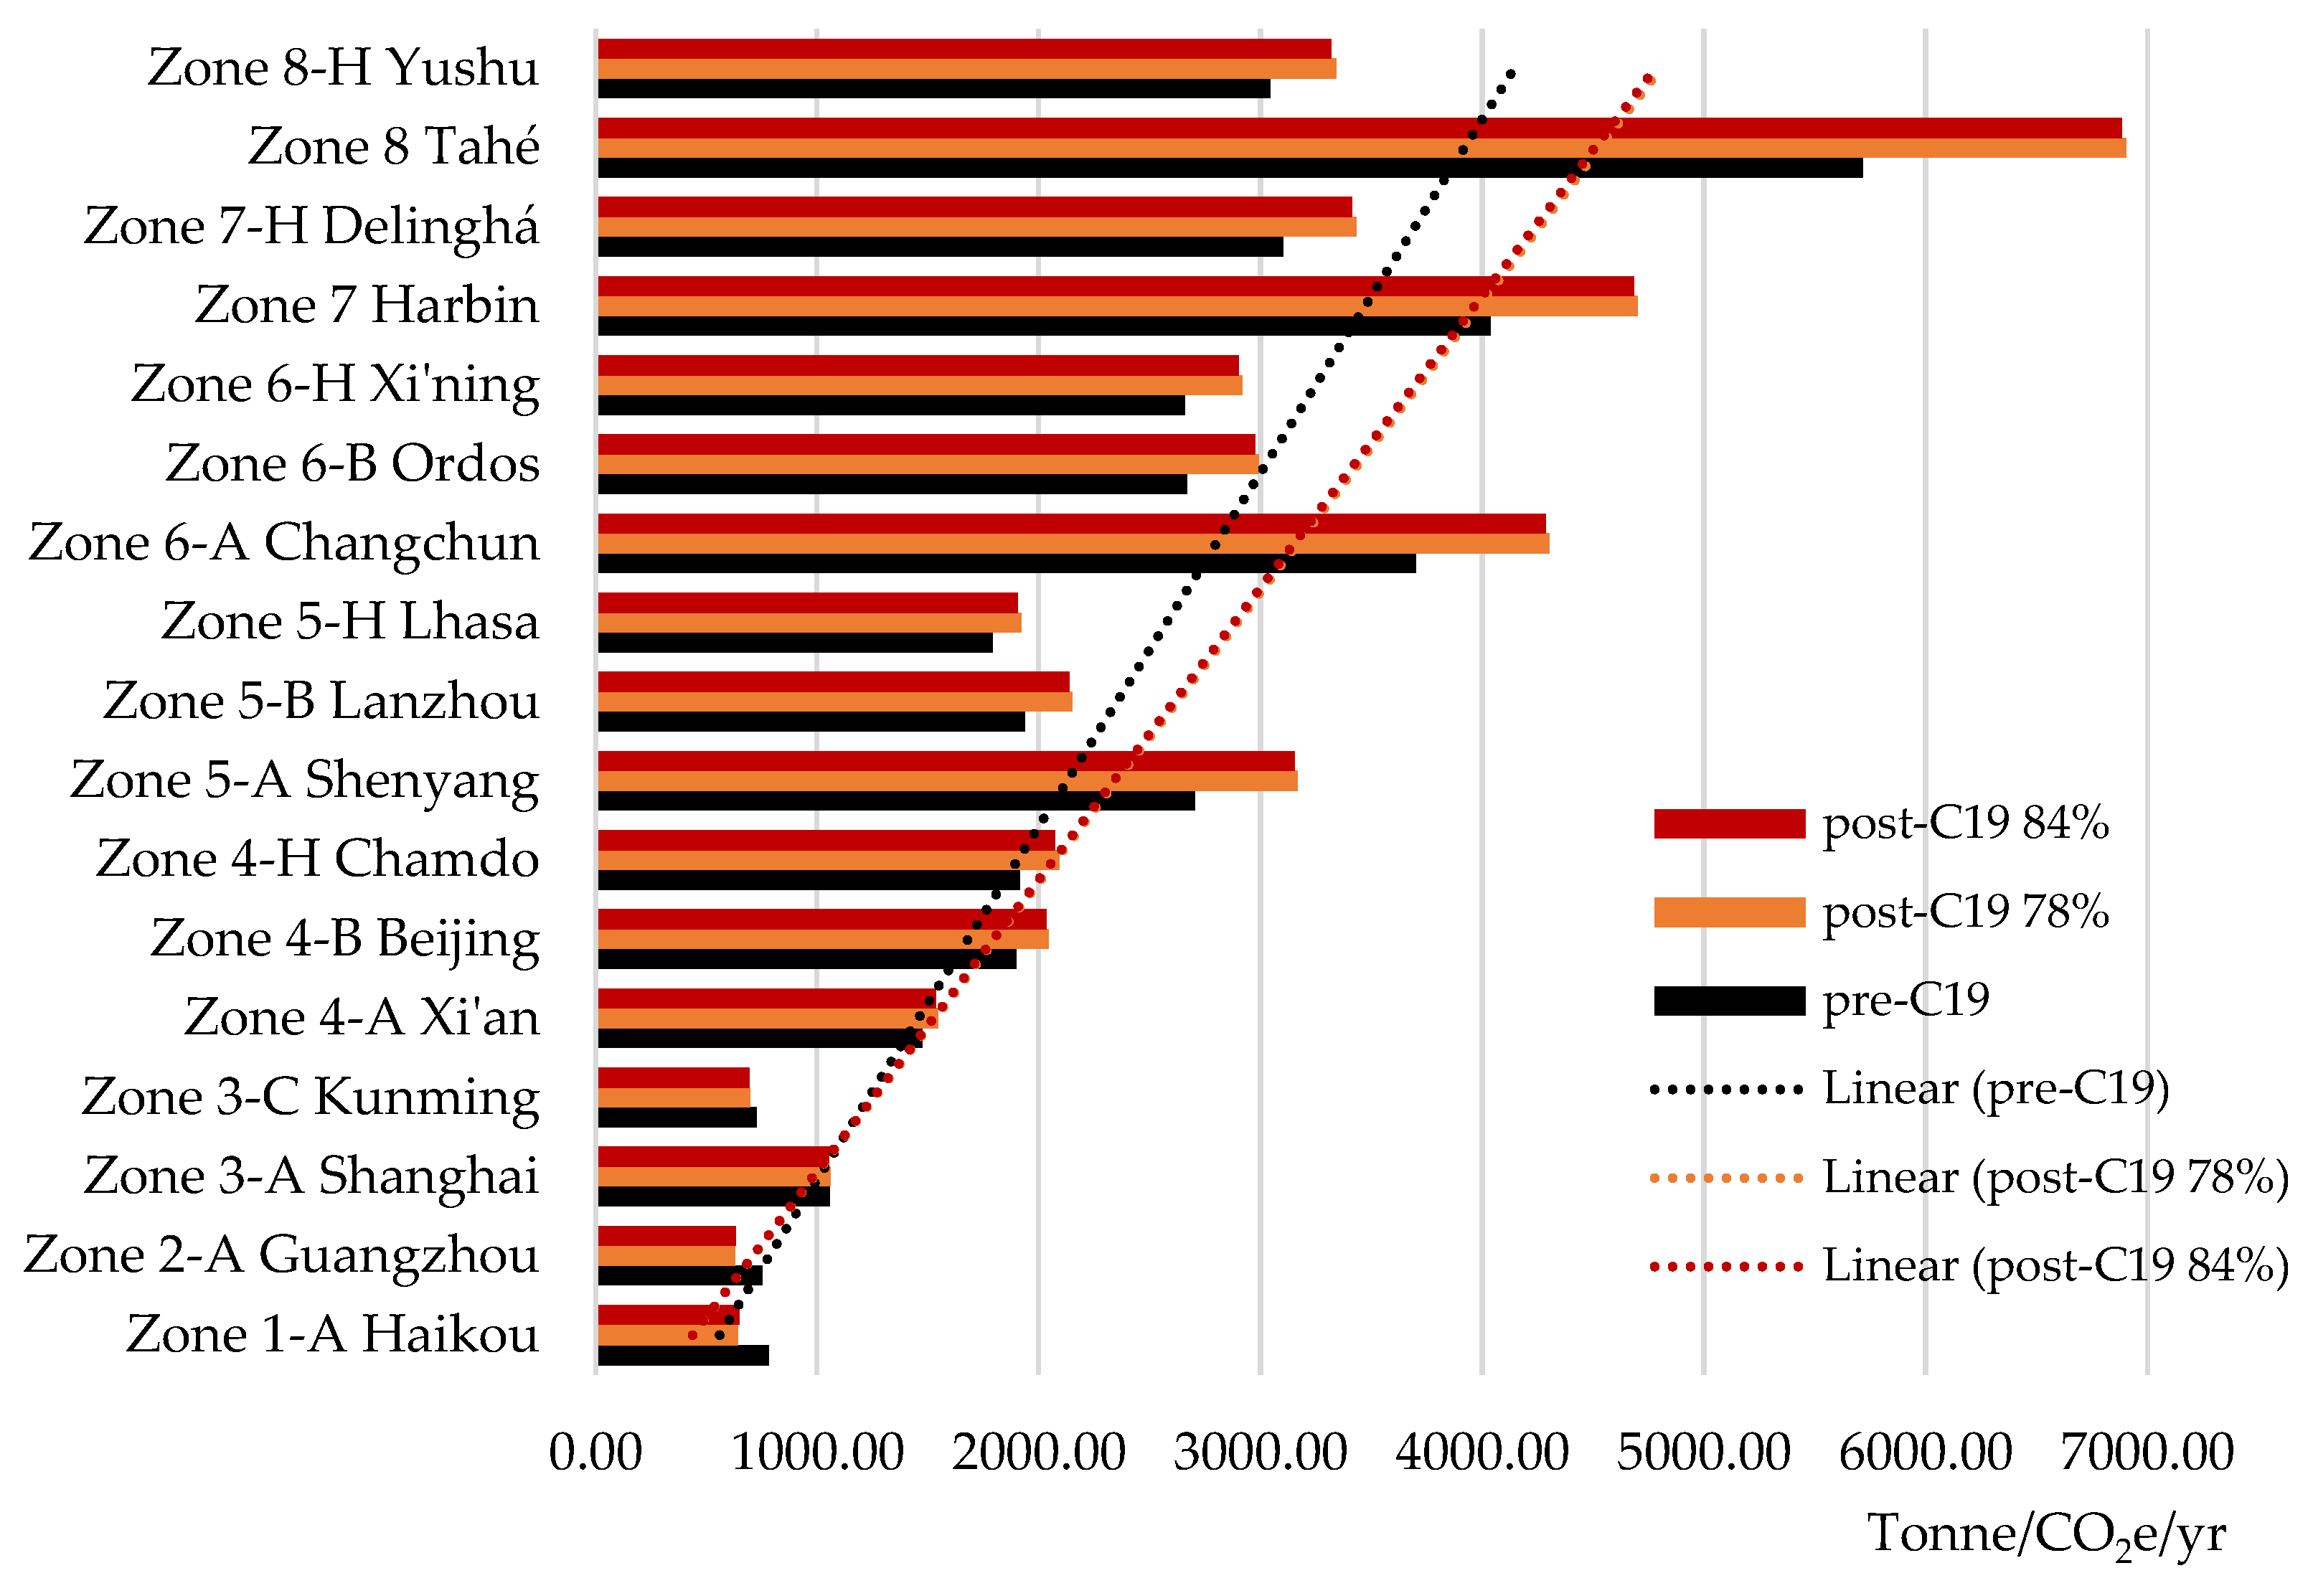
3.1.2. CO2 Emissions
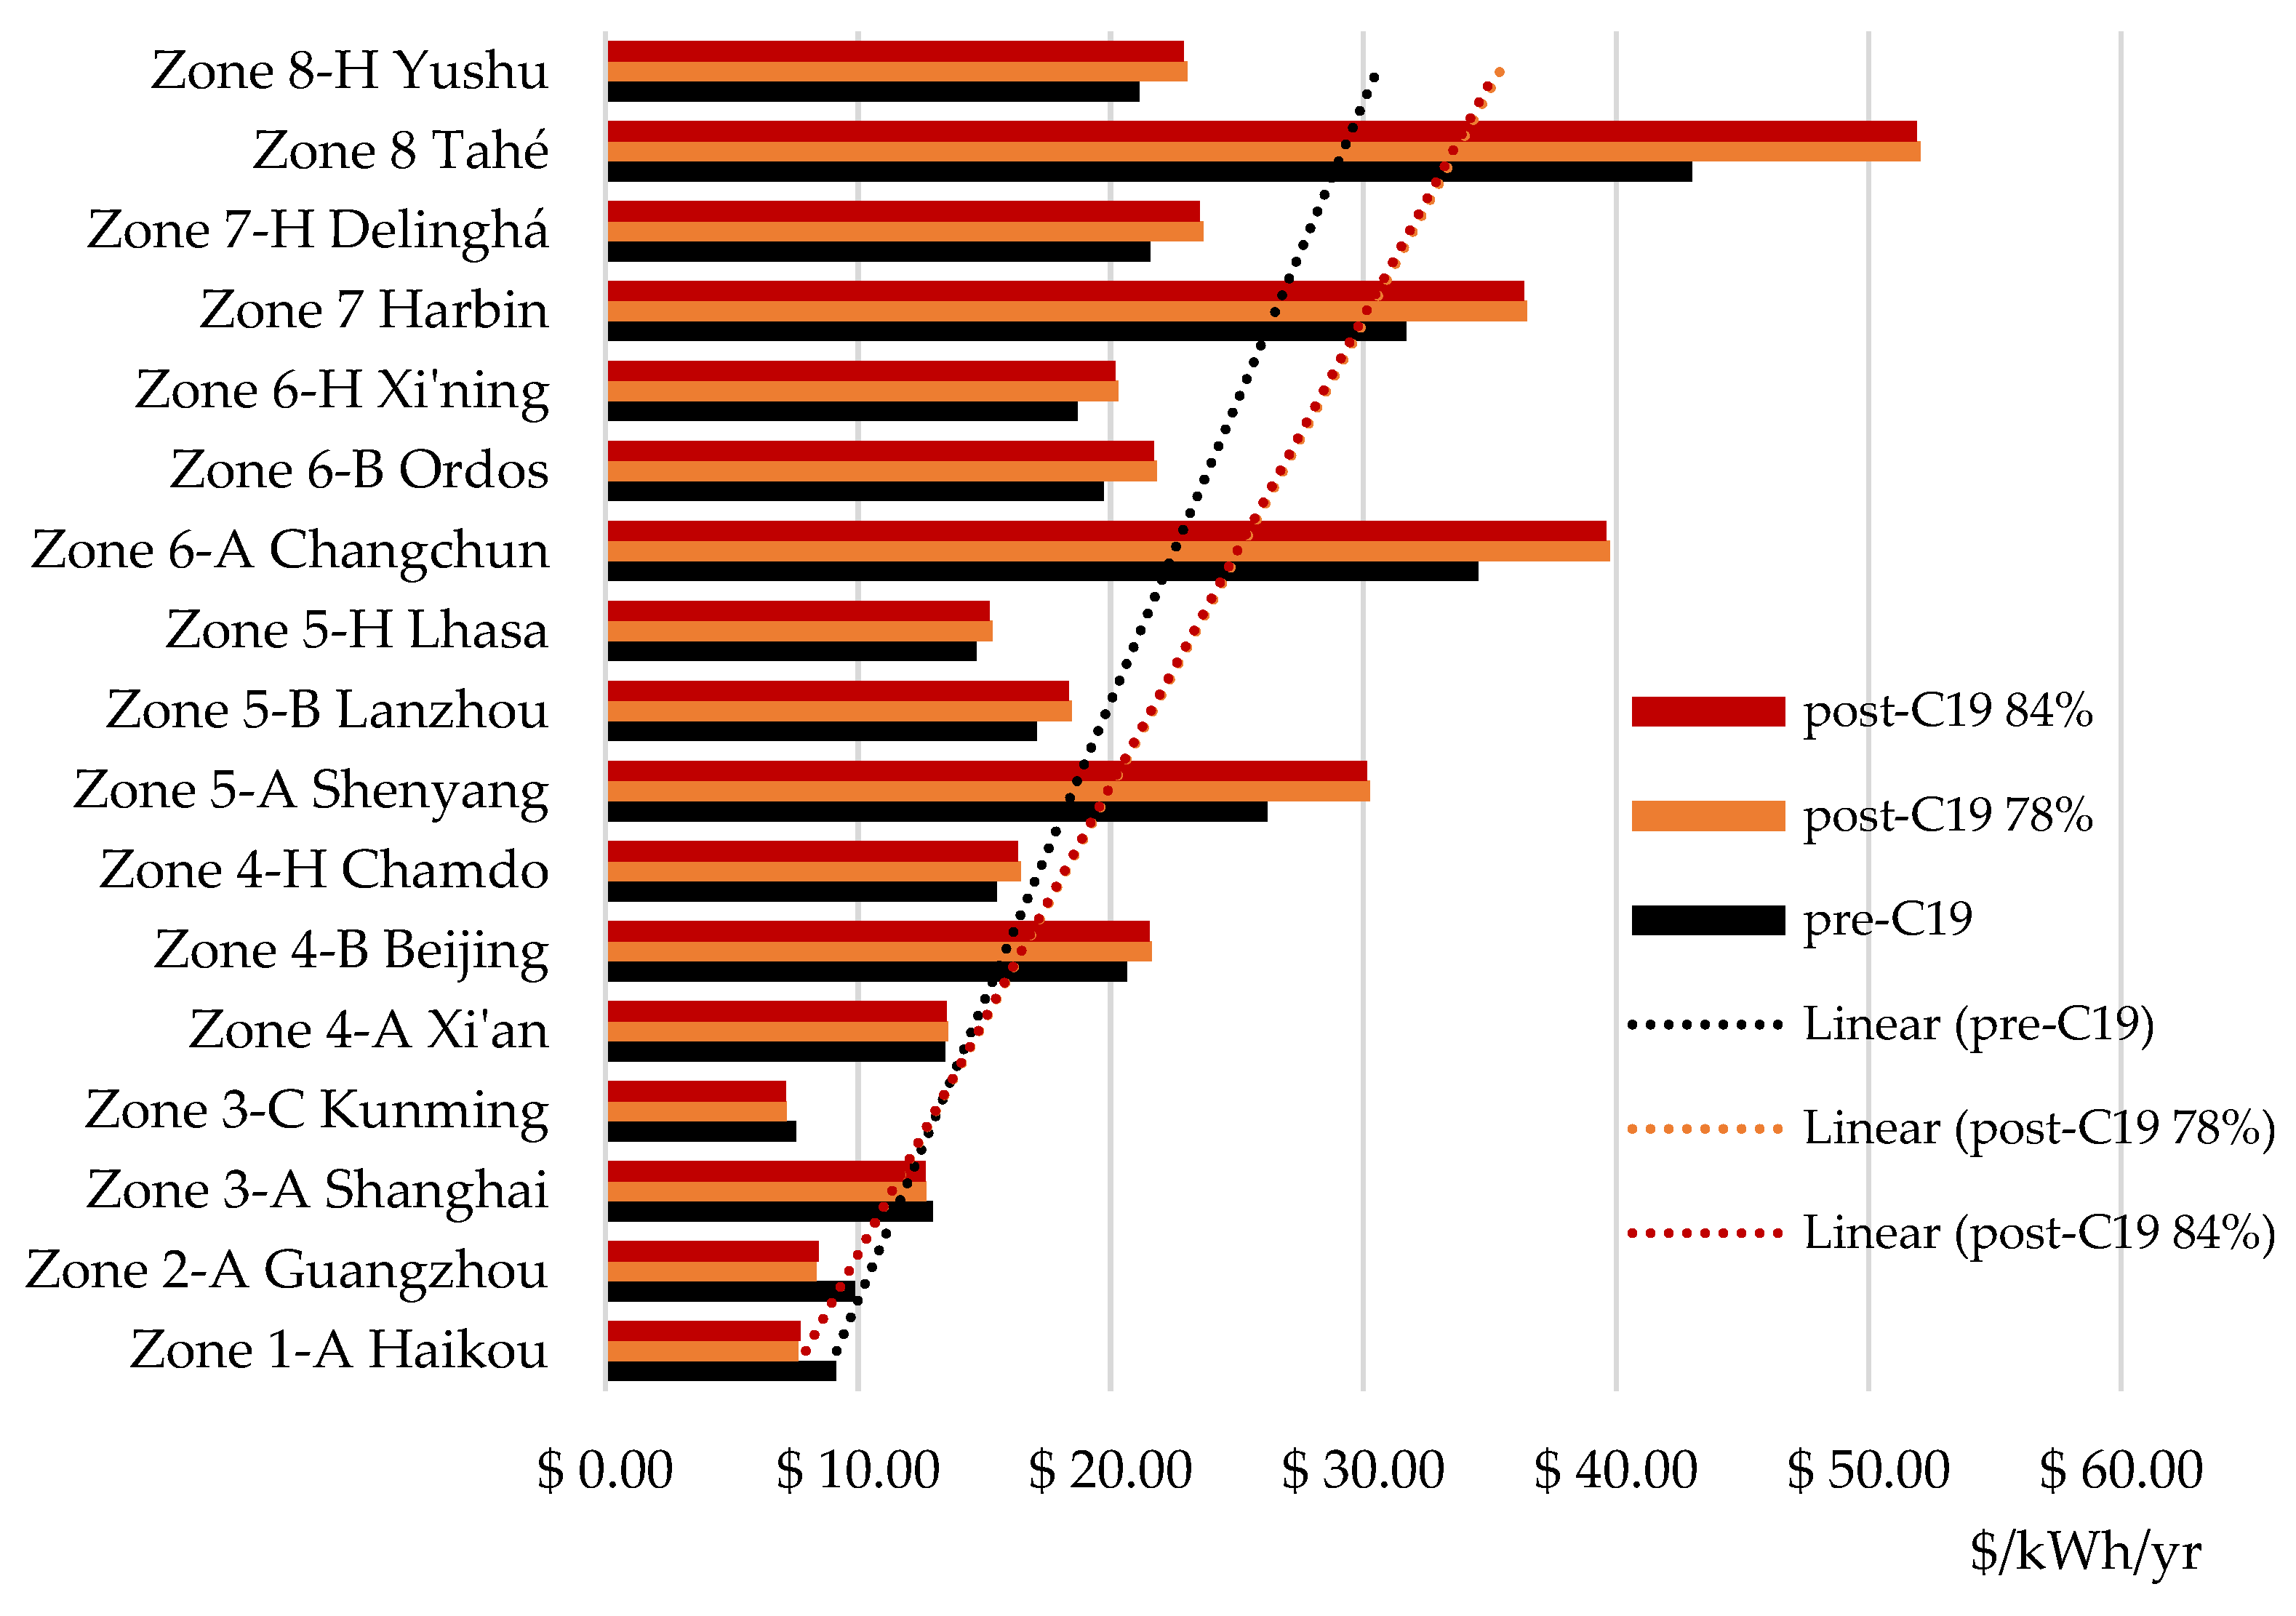
3.1.3. Energy Costs
3.2. Findings and Comments
- A correlation between the amount of usable energy consumed by the building emitting CO2 and costs behavior in post-C19 scenarios;
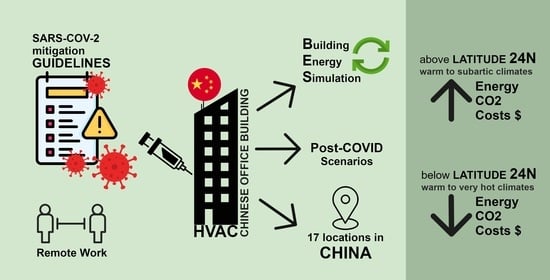
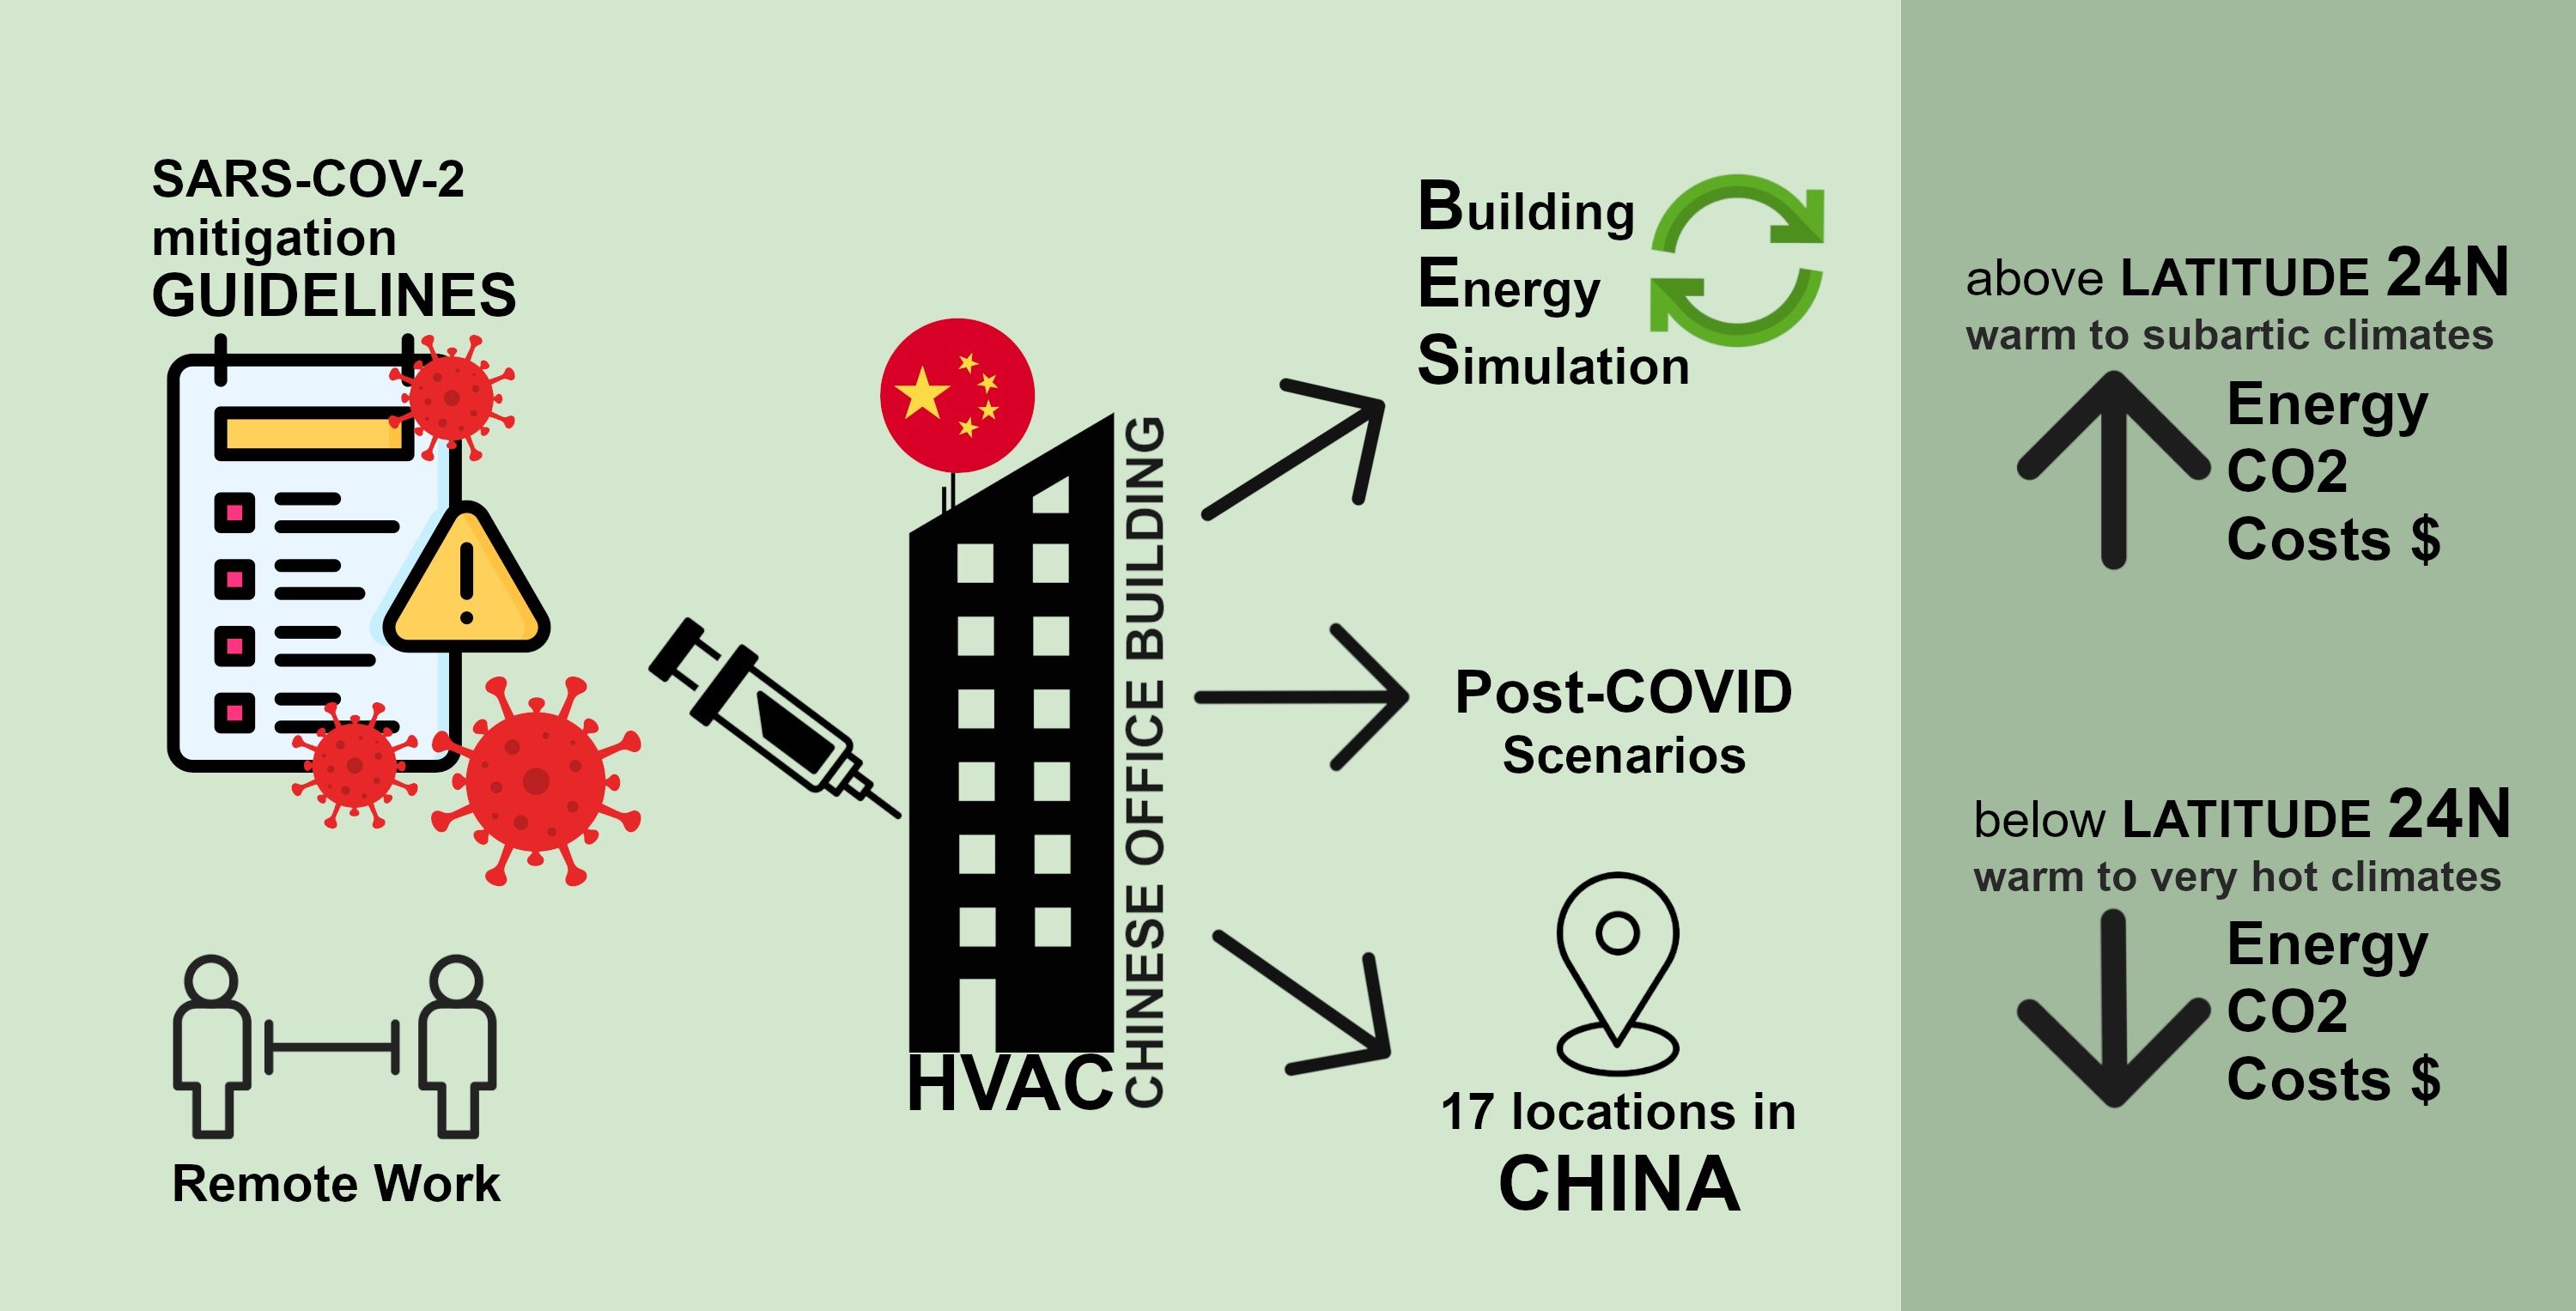
- An overall increase in buildings’ usable energy consumption in 15 of the 17 simulated locations, for latitudes above 24° N (“warm” to “subarctic” climates) at an average rate of 12.46% (post-C19 78%) and 11.70% (post-C19 84%) in post-C19 scenarios;
- The usable energy consumption of lower latitudes under 24° N (“hot” to “very hot” climates) is cut by, on average, between 15.47% (post-C19 78%) and 14.76% (post-C19 84%);
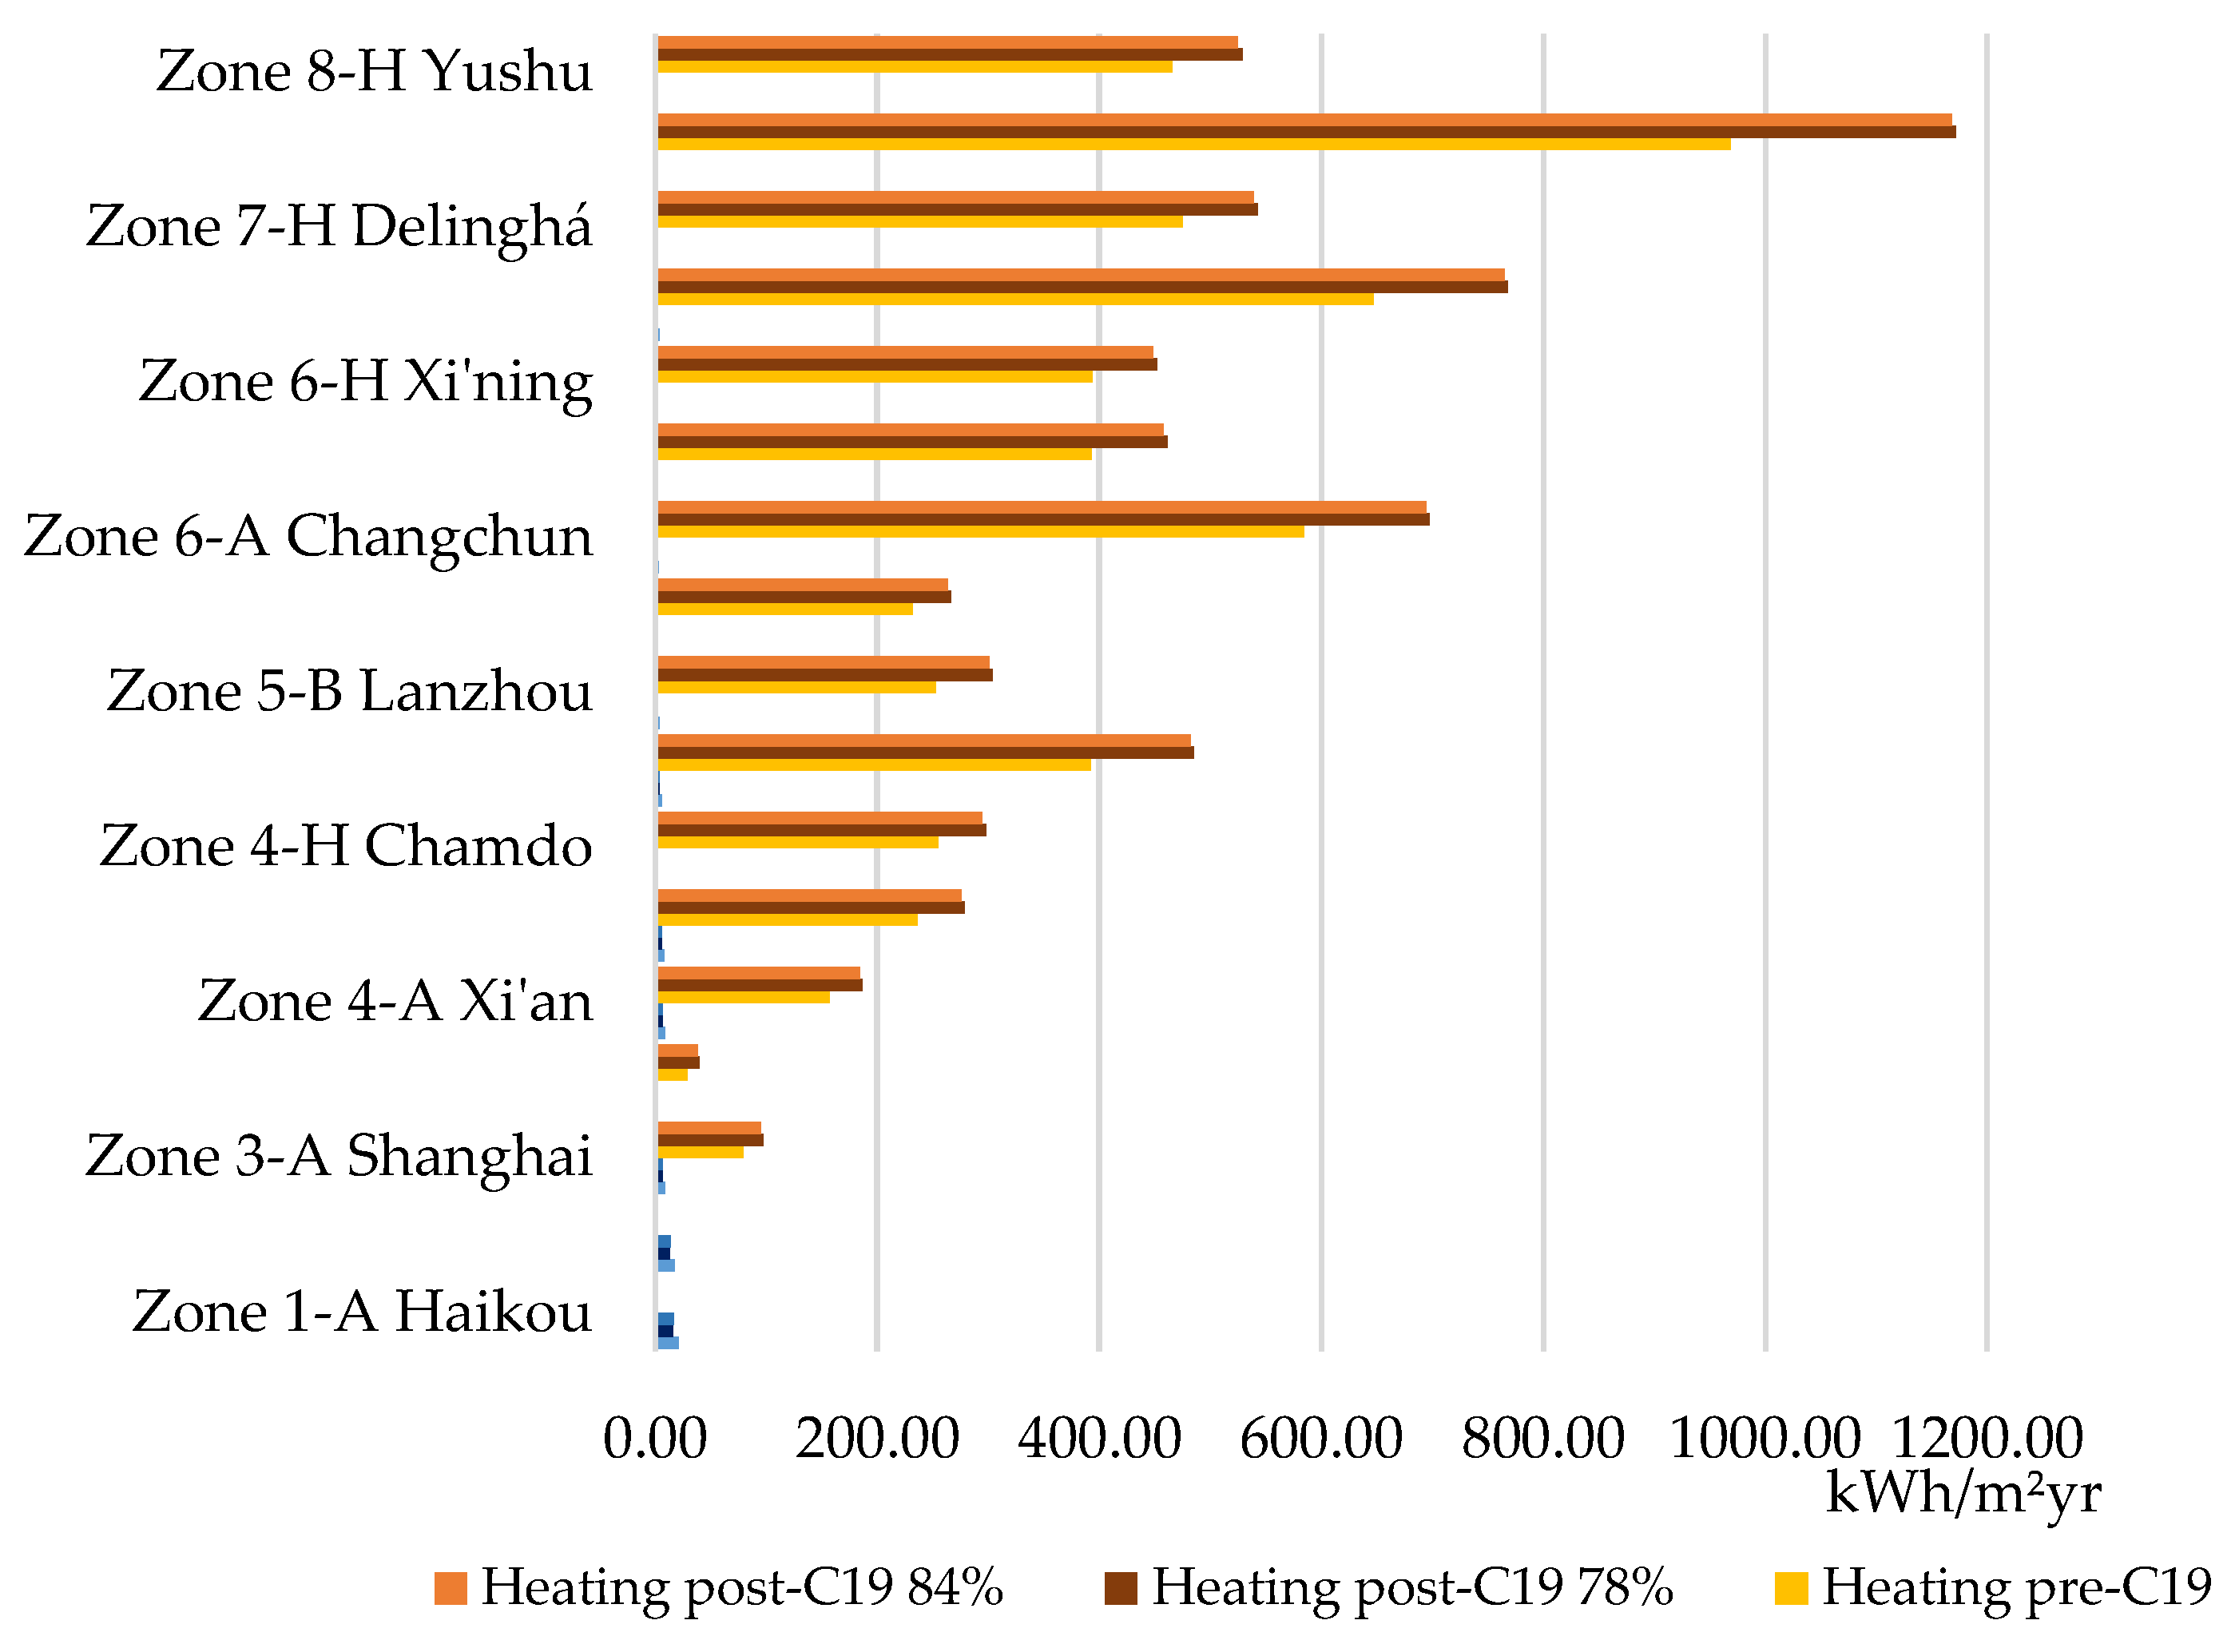
- “Cooling” and “heating” play a decisive role due to their EUI weight. In particular, the last one displays with an average EUI weight of 76.64%, peaking at 87.77% on Tahé (Zone 8 “subarctic”);
- The acclimatization, mainly the “heating” field, has a considerable impact on the building’s overall performance (energy consumption, CO2e, and costs) in post-C19 scenarios;
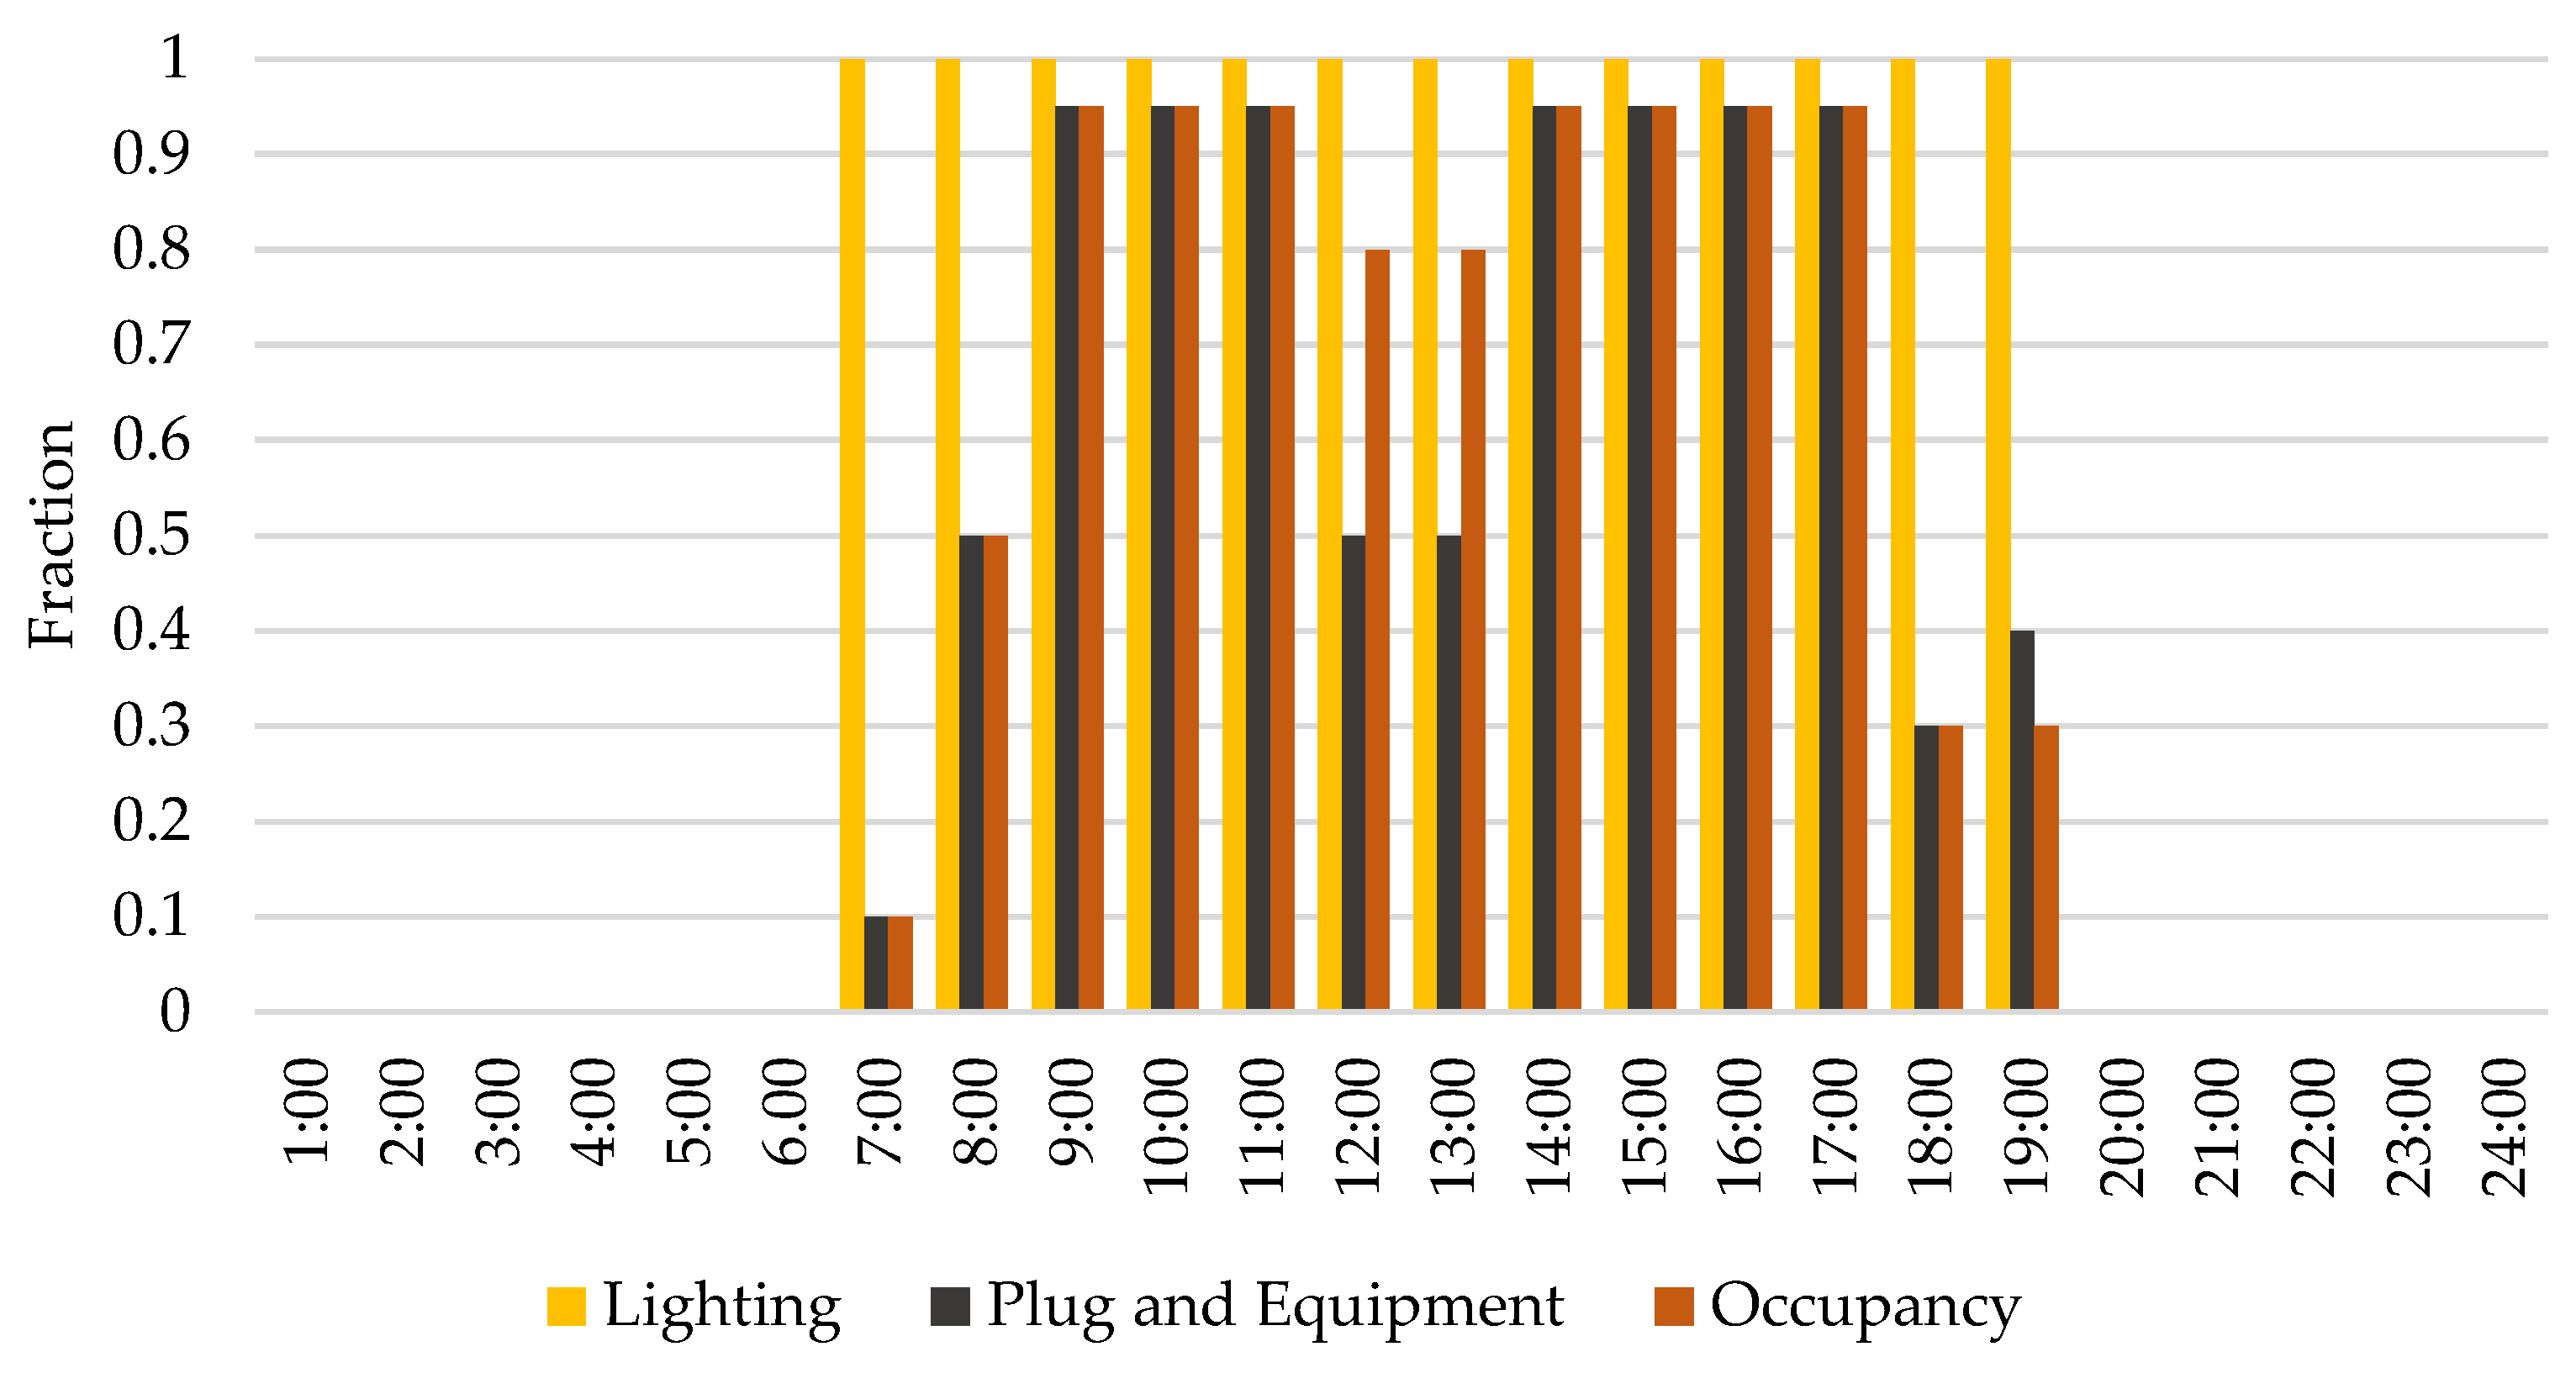
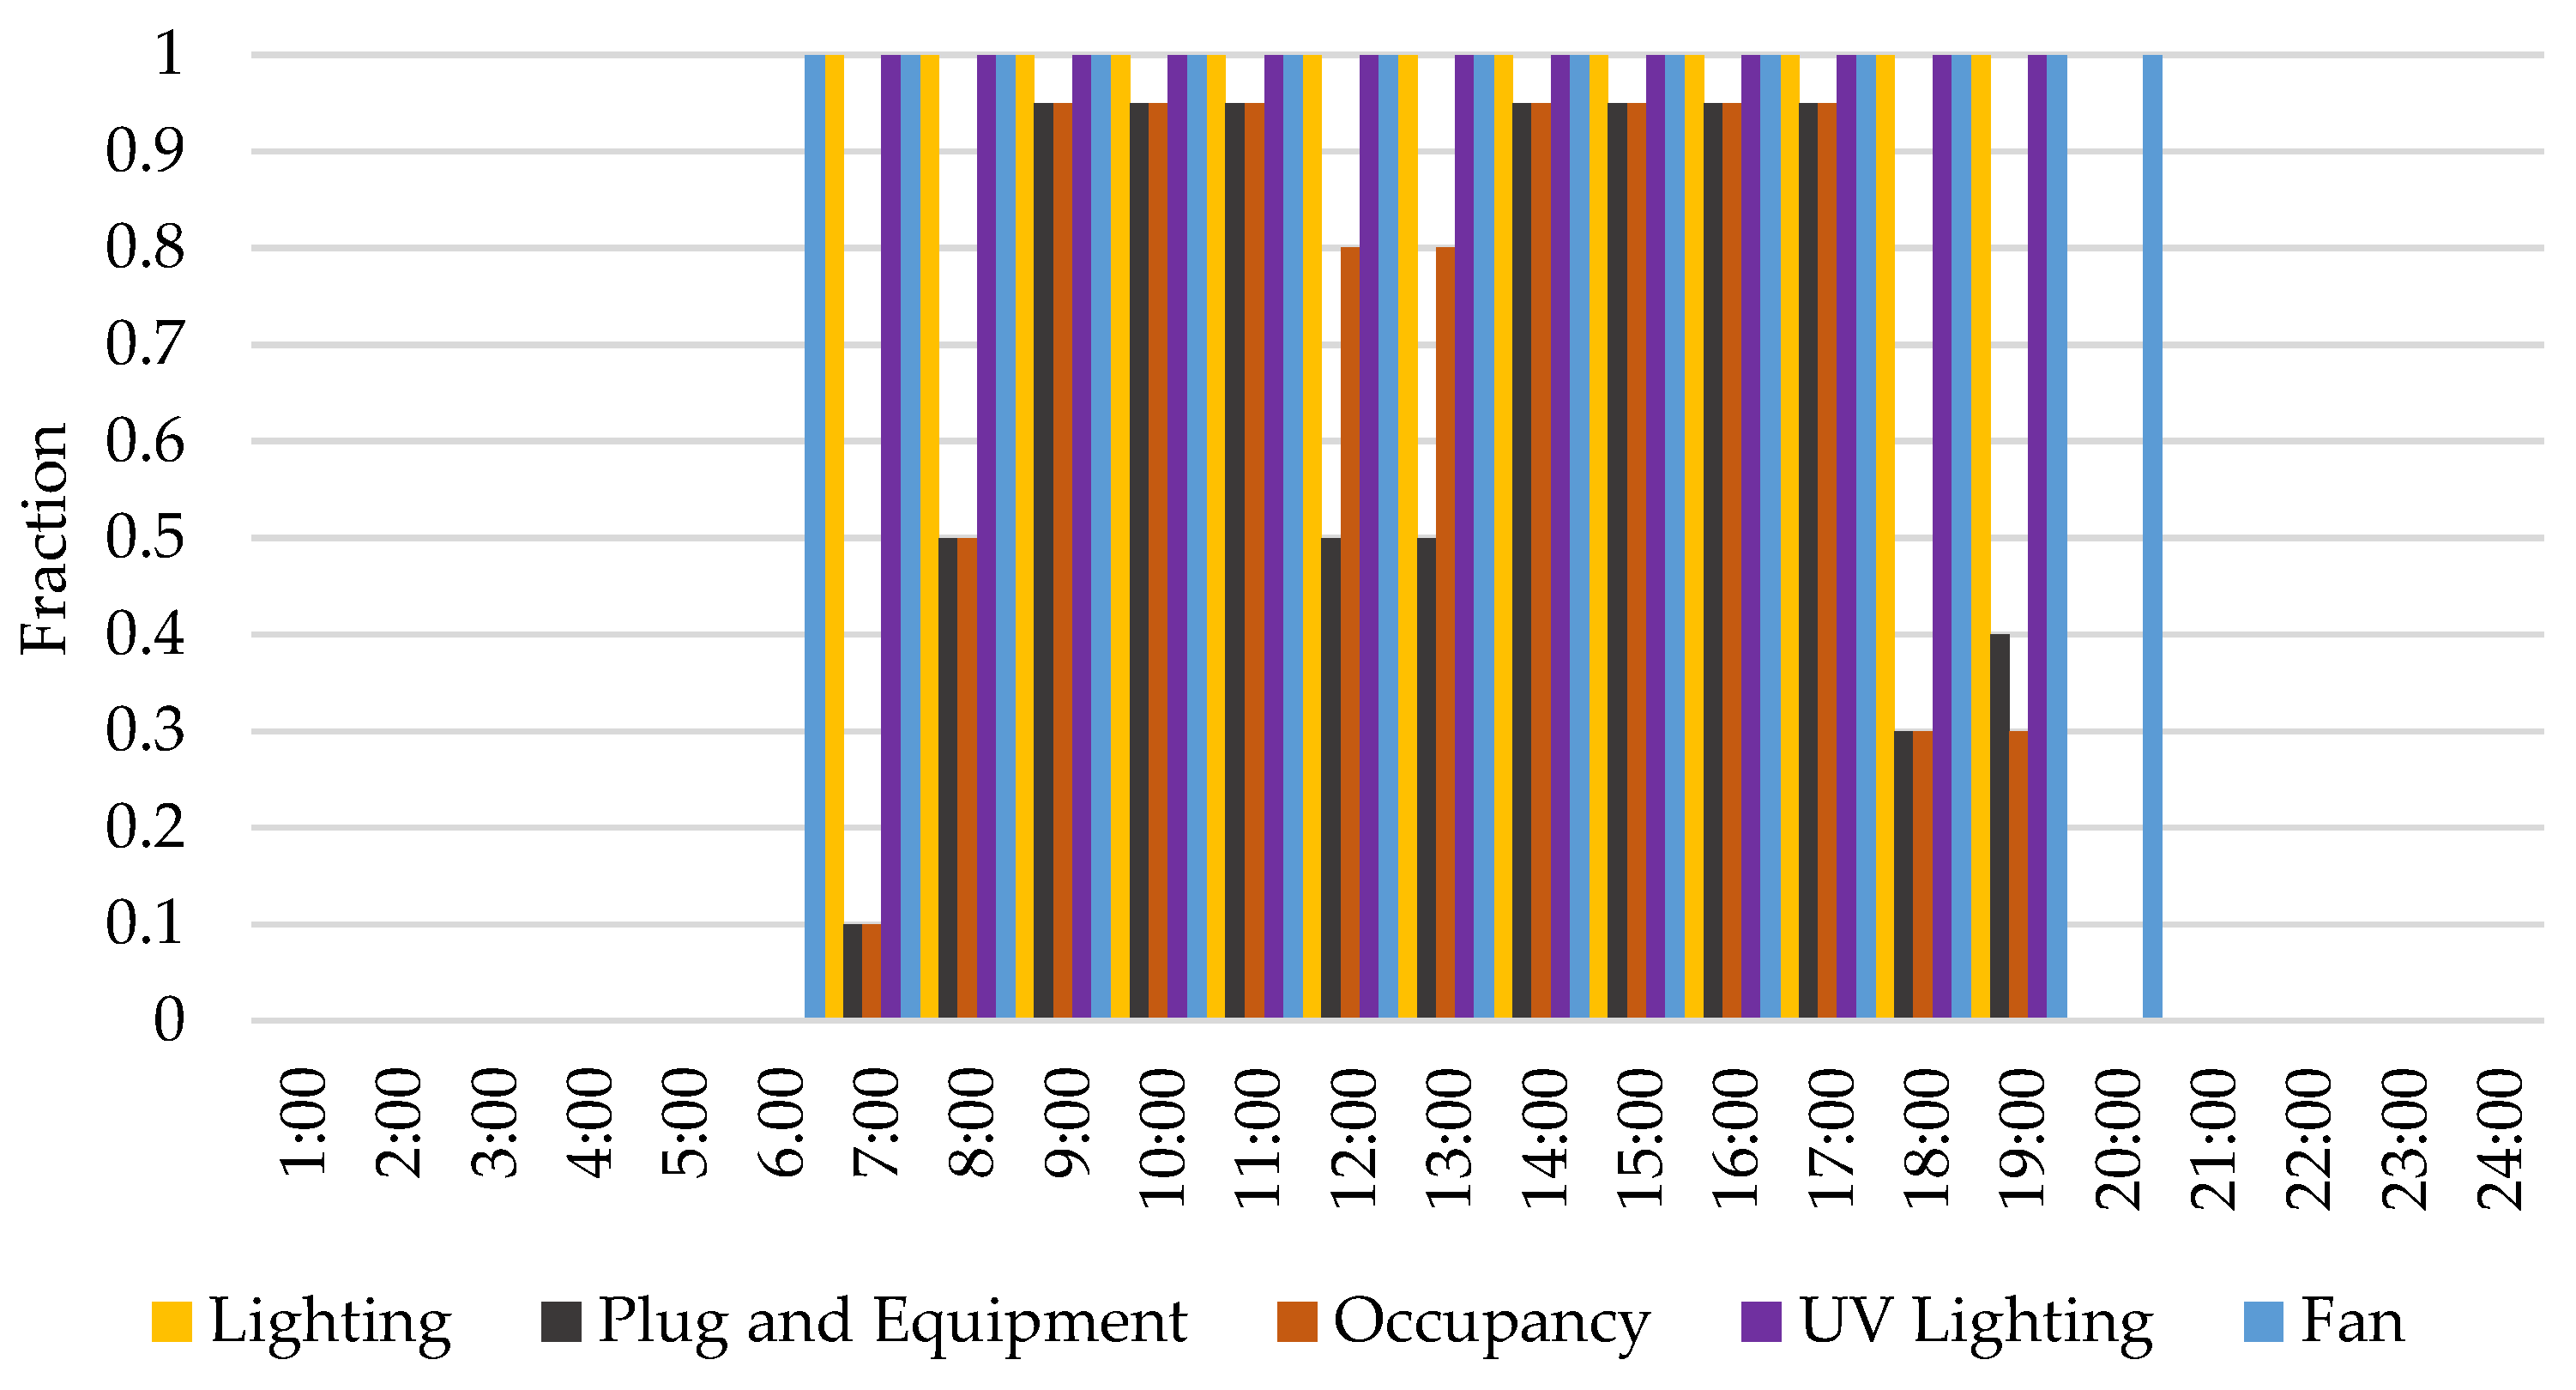
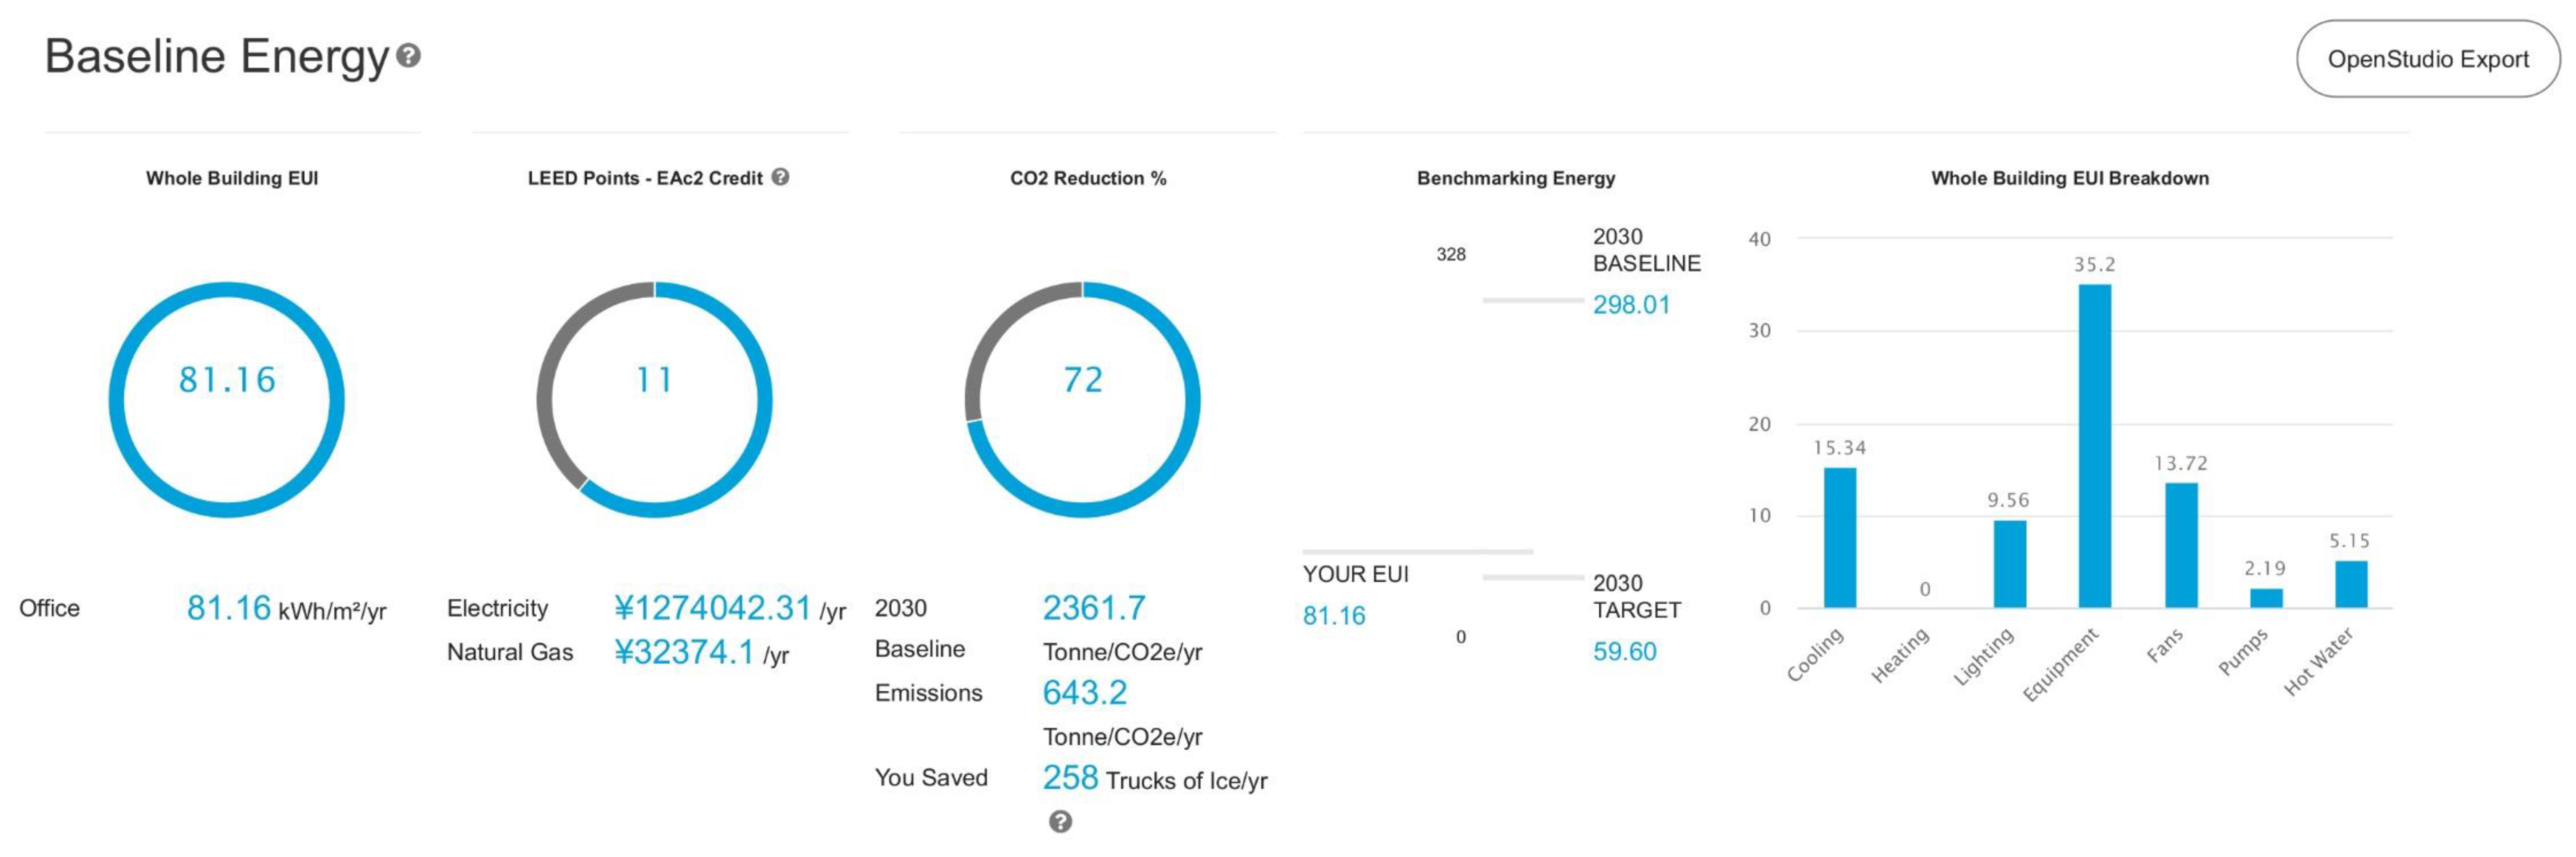
- The “lighting” and “fans” EUI consumption are marginal compared to other assessed parameters;
- Remote work policies also impact a building’s energy performance, assuming the extra space for establishing safe distancing between workers and visitors, and;
- The lower the occupation figure, the higher the energy consumption in cold climates (harmful) and the lower in hot to warm ones (beneficial).
4. Discussion
4.1. Contribution to Knowledge
4.2. Study Limitations
- Official guidelines to standard office buildings that set 0.4 window-to-wall ratios in every CZ [56];
- Non-official CZ in favor of a scientific update considering the climate changes;
- The sparse number of cities for each CZ;
- Limitations of the EE software (Cove.tool) that call for further calculations, such as fan airflow pressure and UV light consumption (manual input);
- The generalization of the standard Chinese office building following the official guidelines;
- The lack of involved costs to update the HVAC/AHU, BACS, installation of UVGI devices, sensors, and change the filters, and;
5. Conclusions
Author Contributions
Funding
Institutional Review Board Statement
Data Availability Statement
Acknowledgments
Conflicts of Interest
Appendix A

| CZ, City, Province | Fans | Variation Difference (%) | |||
|---|---|---|---|---|---|
| Pre-C19 | Post-C19 78% | Post-C19 84% | Post-C19 78% | Post-C19 84% | |
| 1-A, Haikou, Hainan | 16.71 | 14.94 | 15.20 | −10.59% | −9.04% |
| 2-A, Guangzhou, Guangdong | 15.73 | 14.59 | 14.75 | −7.25% | −6.23% |
| 3-A, Shanghai, Shanghai | 15.07 | 16.99 | 16.97 | +12.74% | +12.61% |
| 3-C, Kunming, Yunnan | 11.87 | 13.12 | 13.09 | +10.53% | +10.28% |
| 4-A, Xi’an, Shaanxi | 19.82 | 23.03 | 22.95 | +16.20% | +15.79% |
| 4-B, Beijing, Beijing | 24.45 | 29.47 | 29.34 | +20.53% | +20.00% |
| 4-H, Chamdo, Xizang | 22.84 | 28.73 | 28.49 | +25.79% | +24.74% |
| 5-A, Shenyang, Liaoning | 31.43 | 44.24 | 44.07 | +40.76% | +40.22% |
| 5-B, Lanzhou, Gansu | 23.56 | 30.80 | 30.63 | +30.73% | +30.01% |
| 5-H, Lhasa, Xizang | 21.94 | 26.79 | 26.62 | +22.11% | +21.33% |
| 6-A, Changchun, Jilin | 42.04 | 59.52 | 59.29 | +41.58% | +41.03% |
| 6-B, Ordos, Nei Menggu | 31.48 | 41.41 | 41.18 | +31.54% | +30.81% |
| 6-H, Xi’ning, Qinghai | 32.11 | 40.49 | 40.25 | +26.10% | +25.35% |
| 7, Harbin, Heilongjiang | 45.57 | 64.97 | 64.73 | +42.57% | +42.05% |
| 7-H, Delinghá, Qinghai | 37.19 | 47.09 | 46.86 | +26.62% | +26.00% |
| 8, Tahé, Heilongjiang | 60.72 | 94.84 | 94.60 | +56.19% | +55.80% |
| 8-H, Yushu, Qinghai | 35.82 | 44.64 | 44.38 | +24.62% | +23.90% |
| CZ, City, Province | Lighting | Variation Difference (%) | |||
|---|---|---|---|---|---|
| Pre-C19 | Post-C19 78% | Post-C19 84% | Post-C19 78% | Post-C19 84% | |
| 1-A, Haikou, Hainan | 18.60 | 9.56 | 9.56 | −48.60% | −48.60% |
| 2-A, Guangzhou, Guangdong | 18.90 | 10.07 | 10.07 | −46.72% | −46.72% |
| 3-A, Shanghai, Shanghai | 18.94 | 10.31 | 10.31 | −45.56% | −45.56% |
| 3-C, Kunming, Yunnan | 18.53 | 9.57 | 9.57 | −48.35% | −48.35% |
| 4-A, Xi’an, Shaanxi | 18.62 | 9.61 | 9.61 | −48.39% | −48.39% |
| 4-B, Beijing, Beijing | 18.90 | 10.23 | 10.23 | −45.87% | −45.87% |
| 4-H, Chamdo, Xizang | 18.41 | 9.61 | 9.61 | −47.80% | −47.80% |
| 5-A, Shenyang, Liaoning | 19.34 | 10.58 | 10.58 | −45.29% | −45.29% |
| 5-B, Lanzhou, Gansu | 18.78 | 9.85 | 9.85 | −47.55% | −47.55% |
| 5-H, Lhasa, Xizang | 18.03 | 9.40 | 9.40 | −47.86% | −47.86% |
| 6-A, Changchun, Jilin | 18.83 | 9.93 | 9.93 | −47.27% | −47.27% |
| 6-B, Ordos, Nei Menggu | 18.53 | 9.60 | 9.60 | −48.19% | −48.19% |
| 6-H, Xi’ning, Qinghai | 18.20 | 7.90 | 7.90 | −56.59% | −56.59% |
| 7, Harbin, Heilongjiang | 18.92 | 10.46 | 10.46 | −44.71% | −44.71% |
| 7-H, Delinghá, Qinghai | 18.69 | 9.67 | 9.67 | −48.26% | −48.26% |
| 8, Tahé, Heilongjiang | 18.81 | 10.44 | 10.44 | −44.50% | −44.50% |
| 8-H, Yushu, Qinghai | 18.13 | 9.44 | 9.44 | −47.93% | −47.93% |
Appendix B
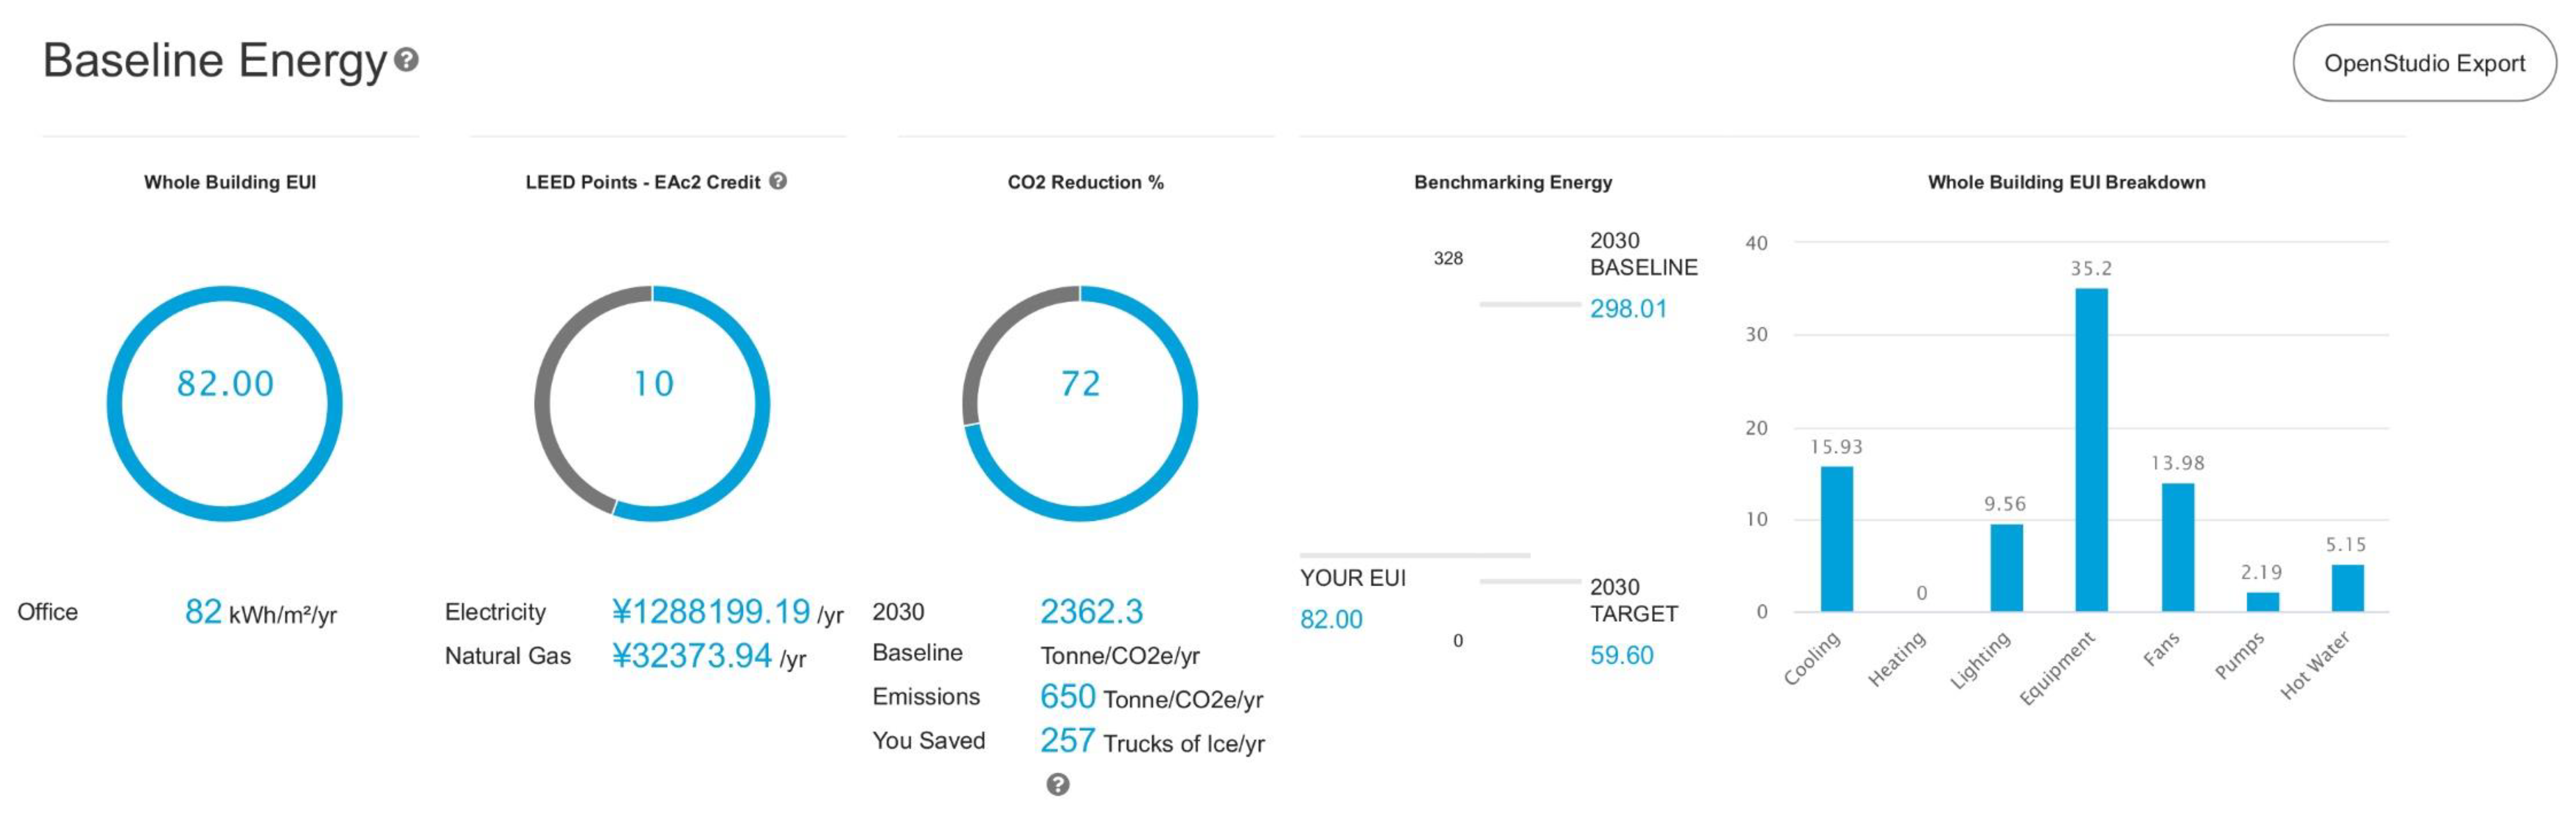
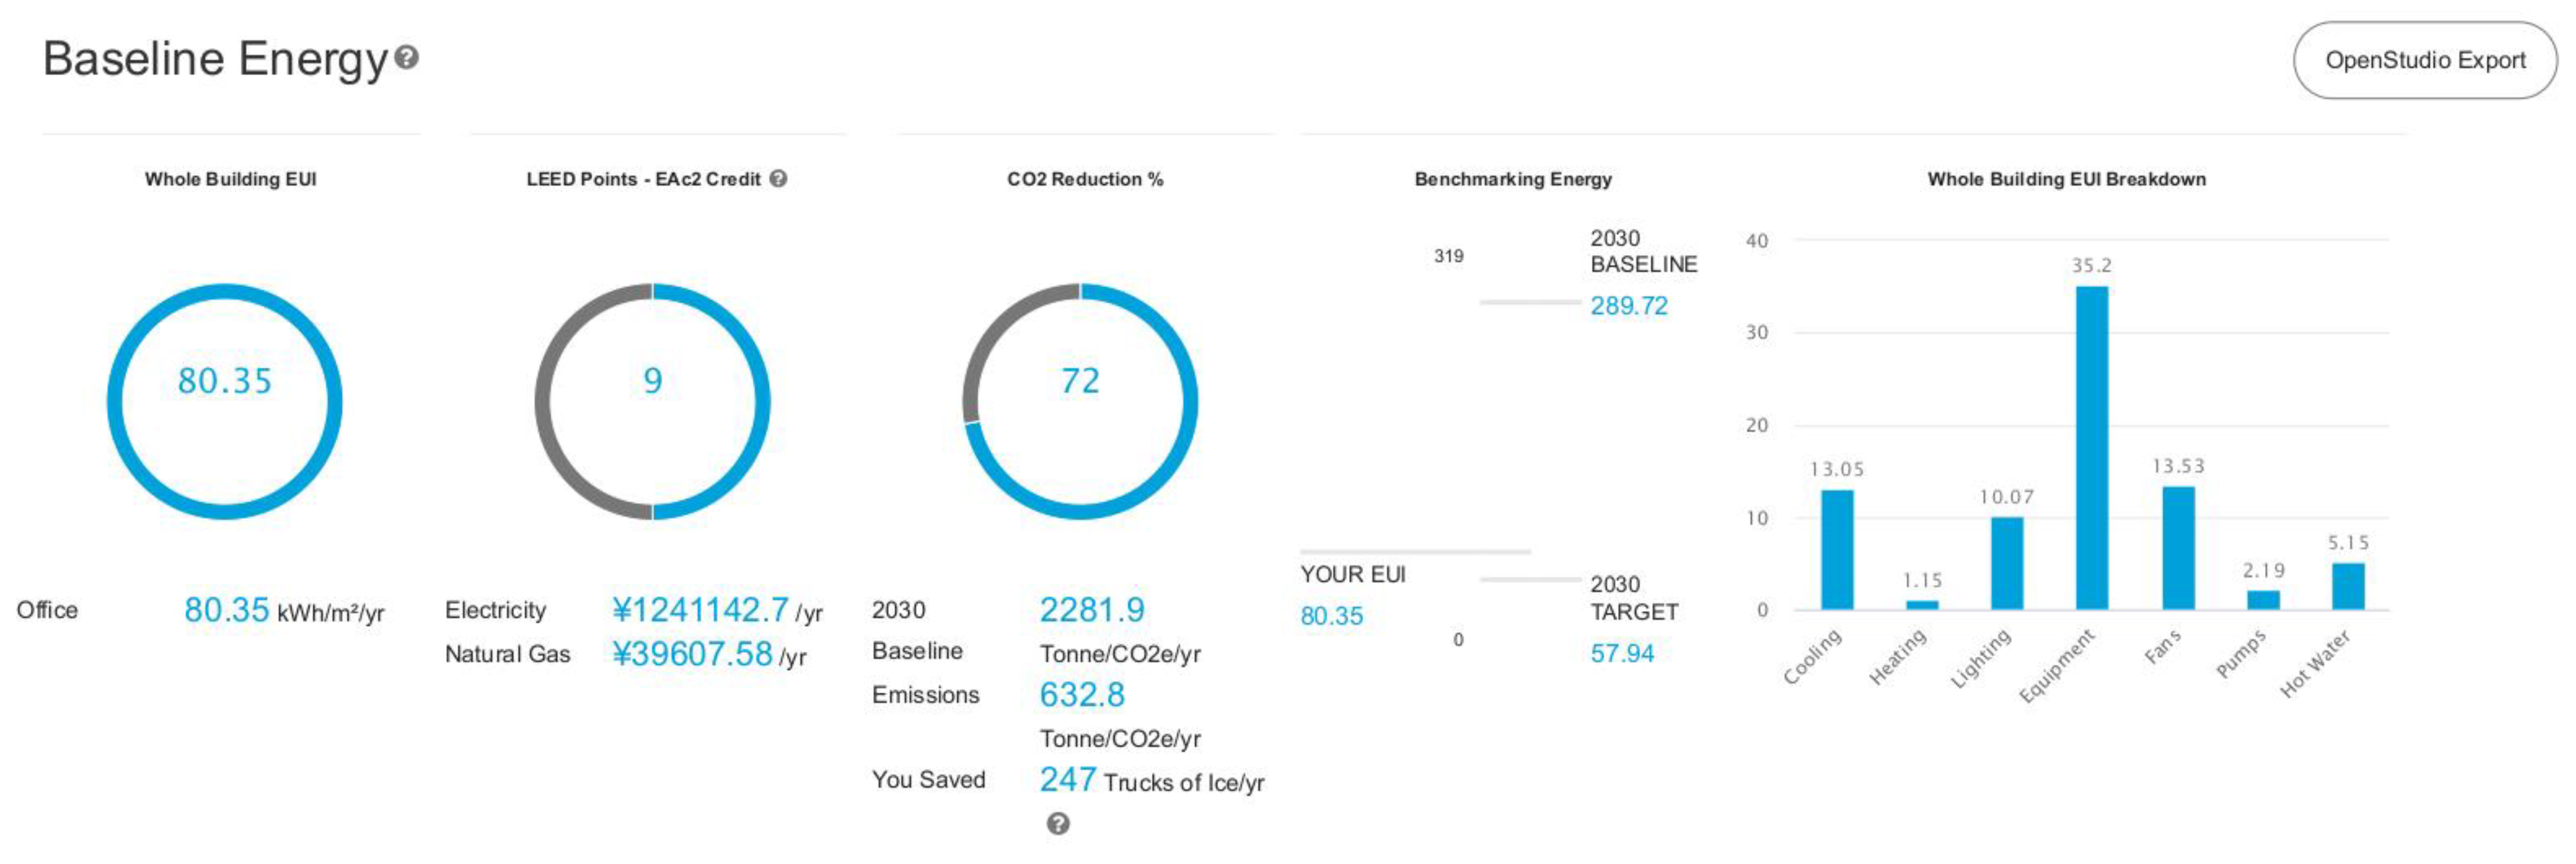
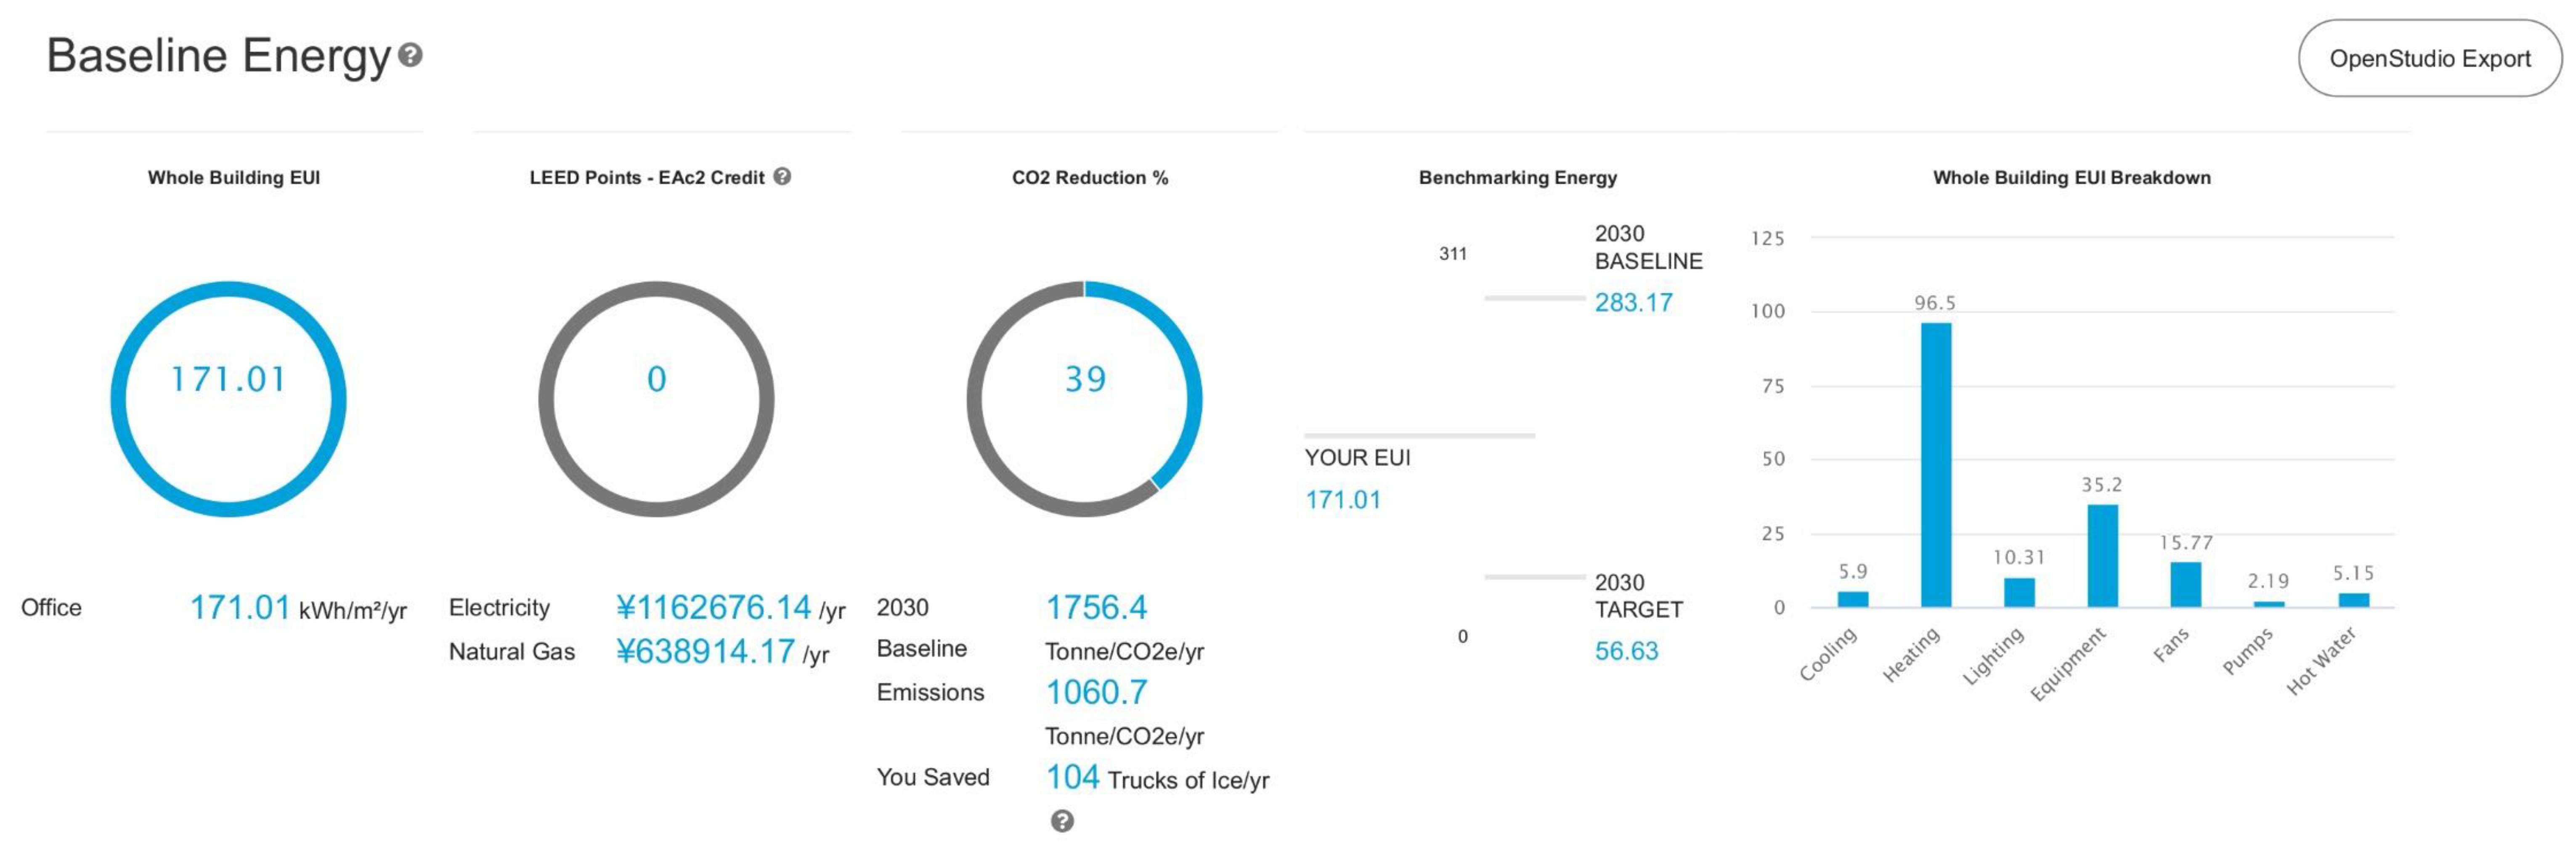
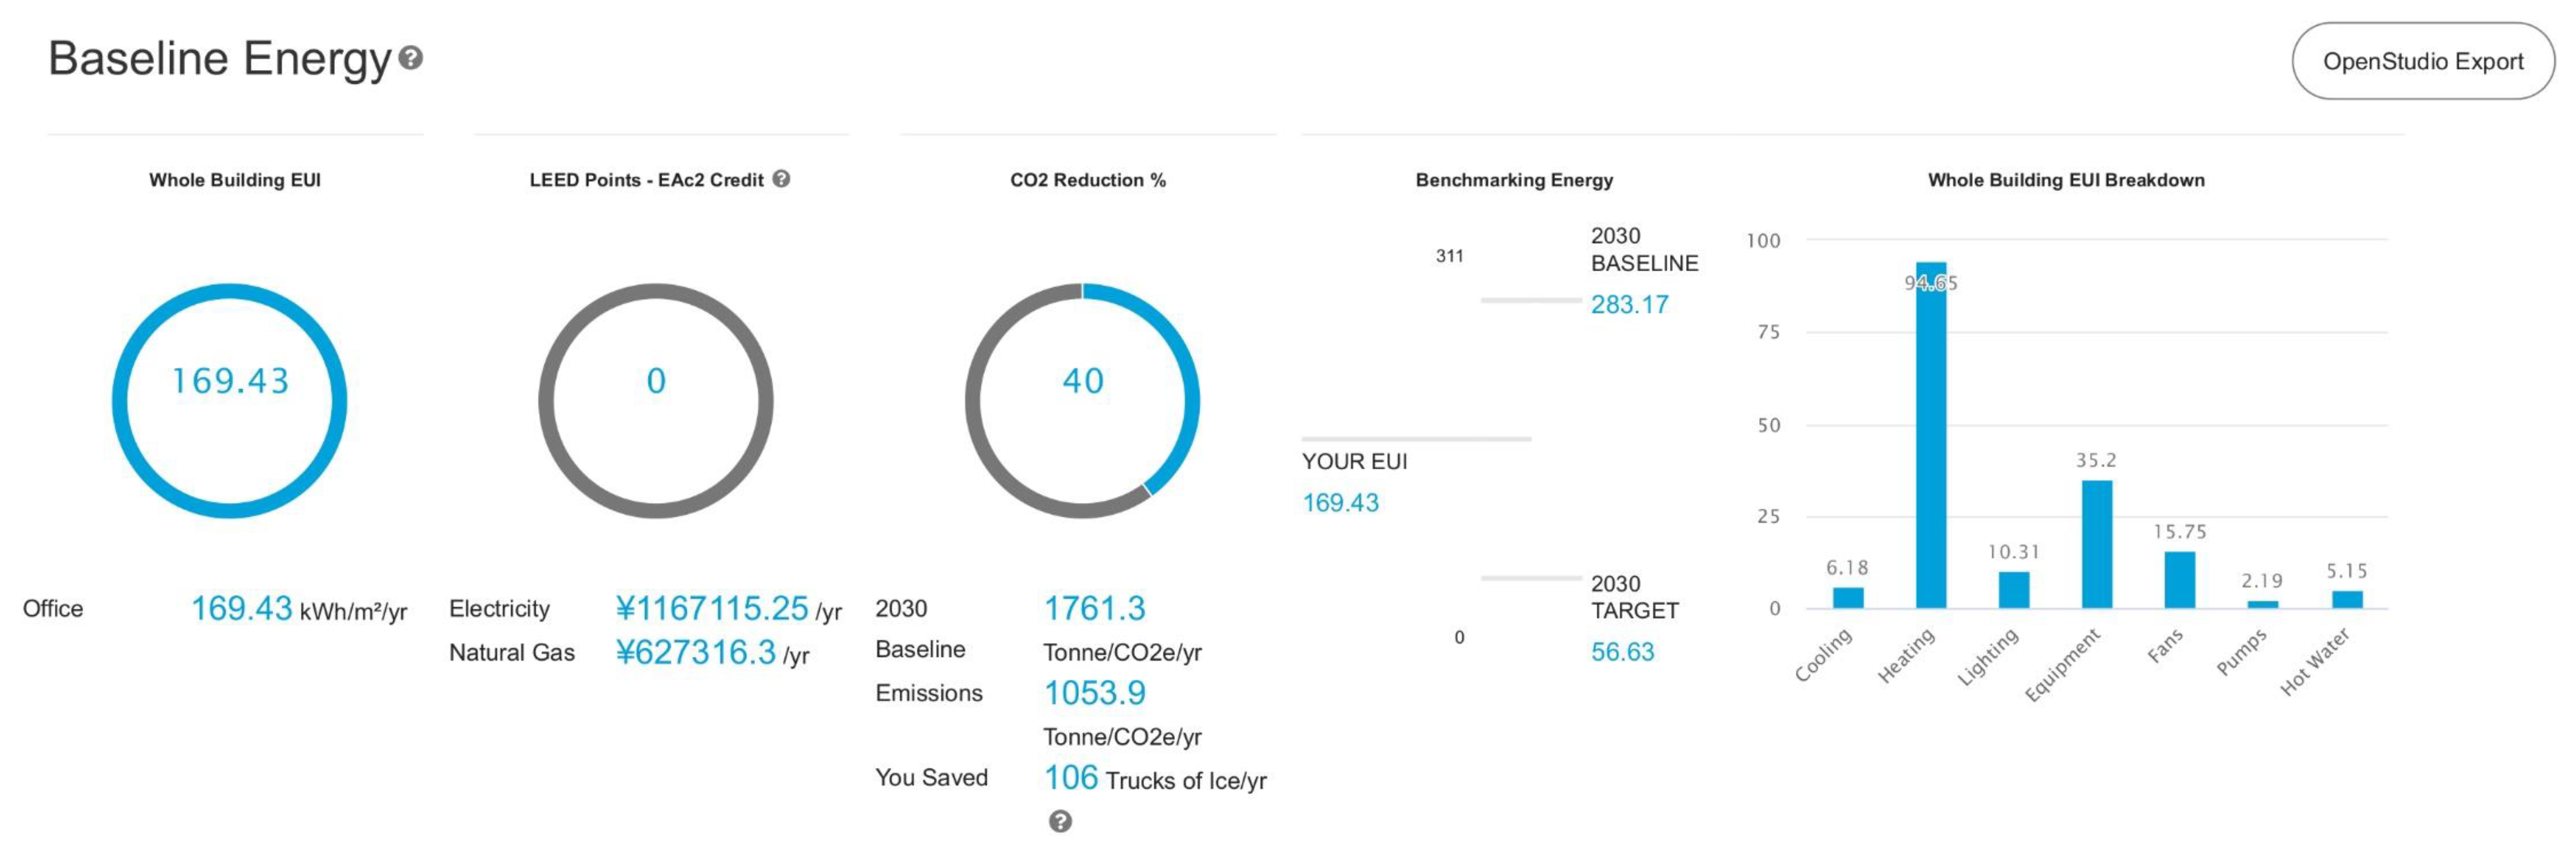
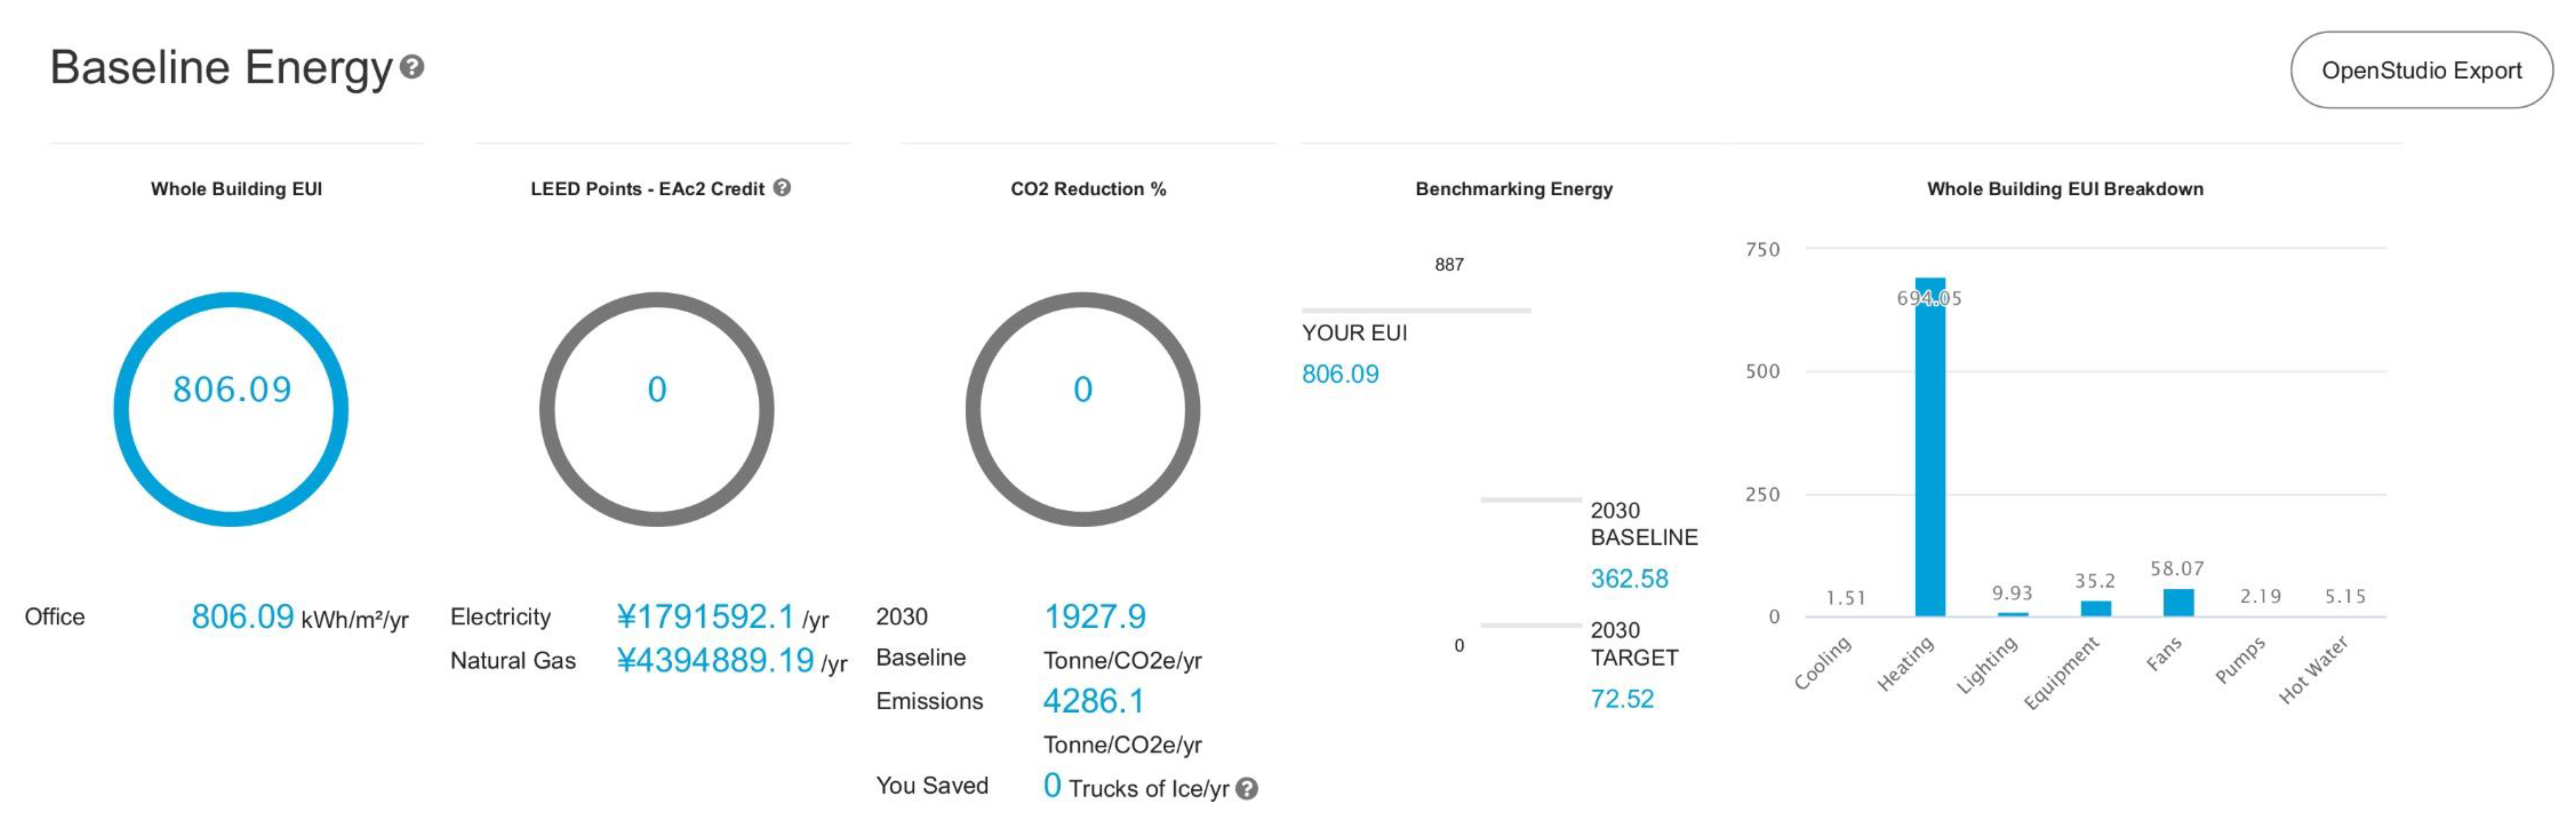
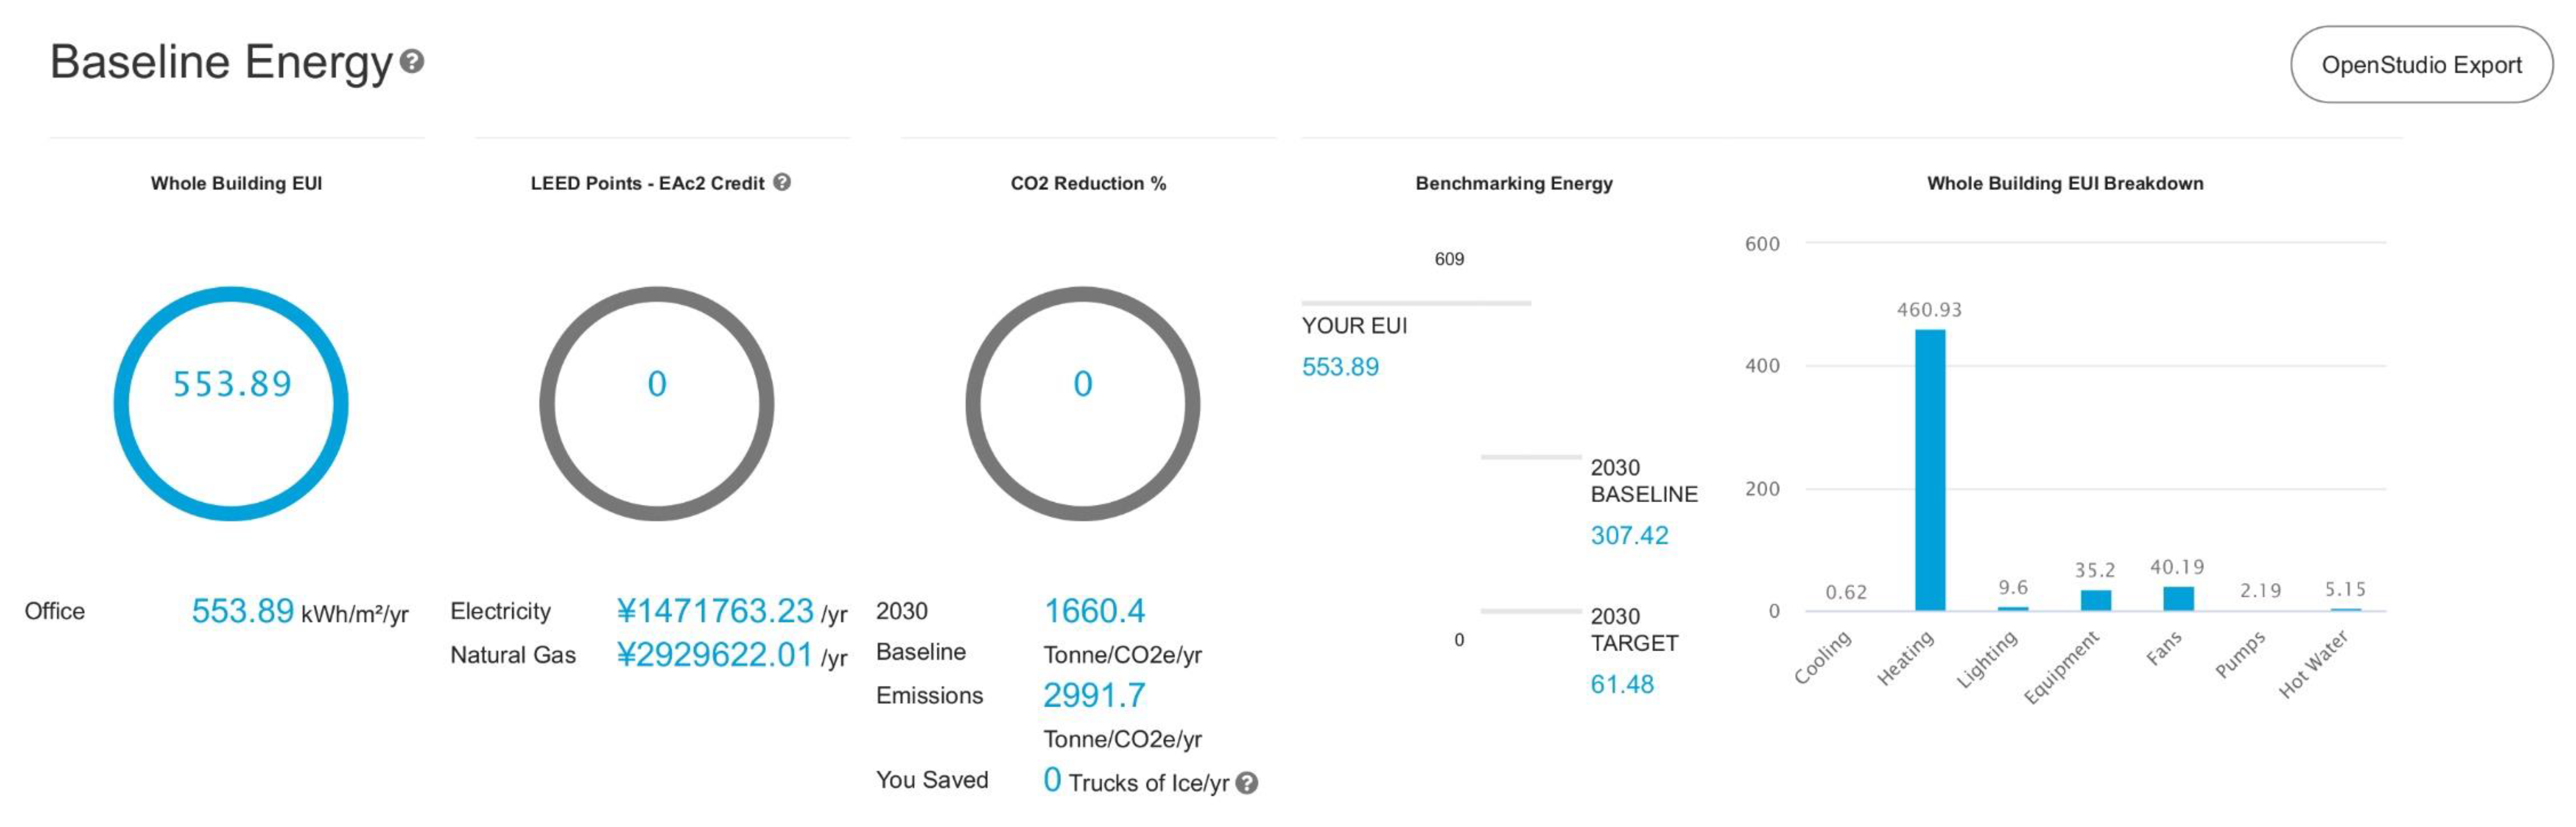
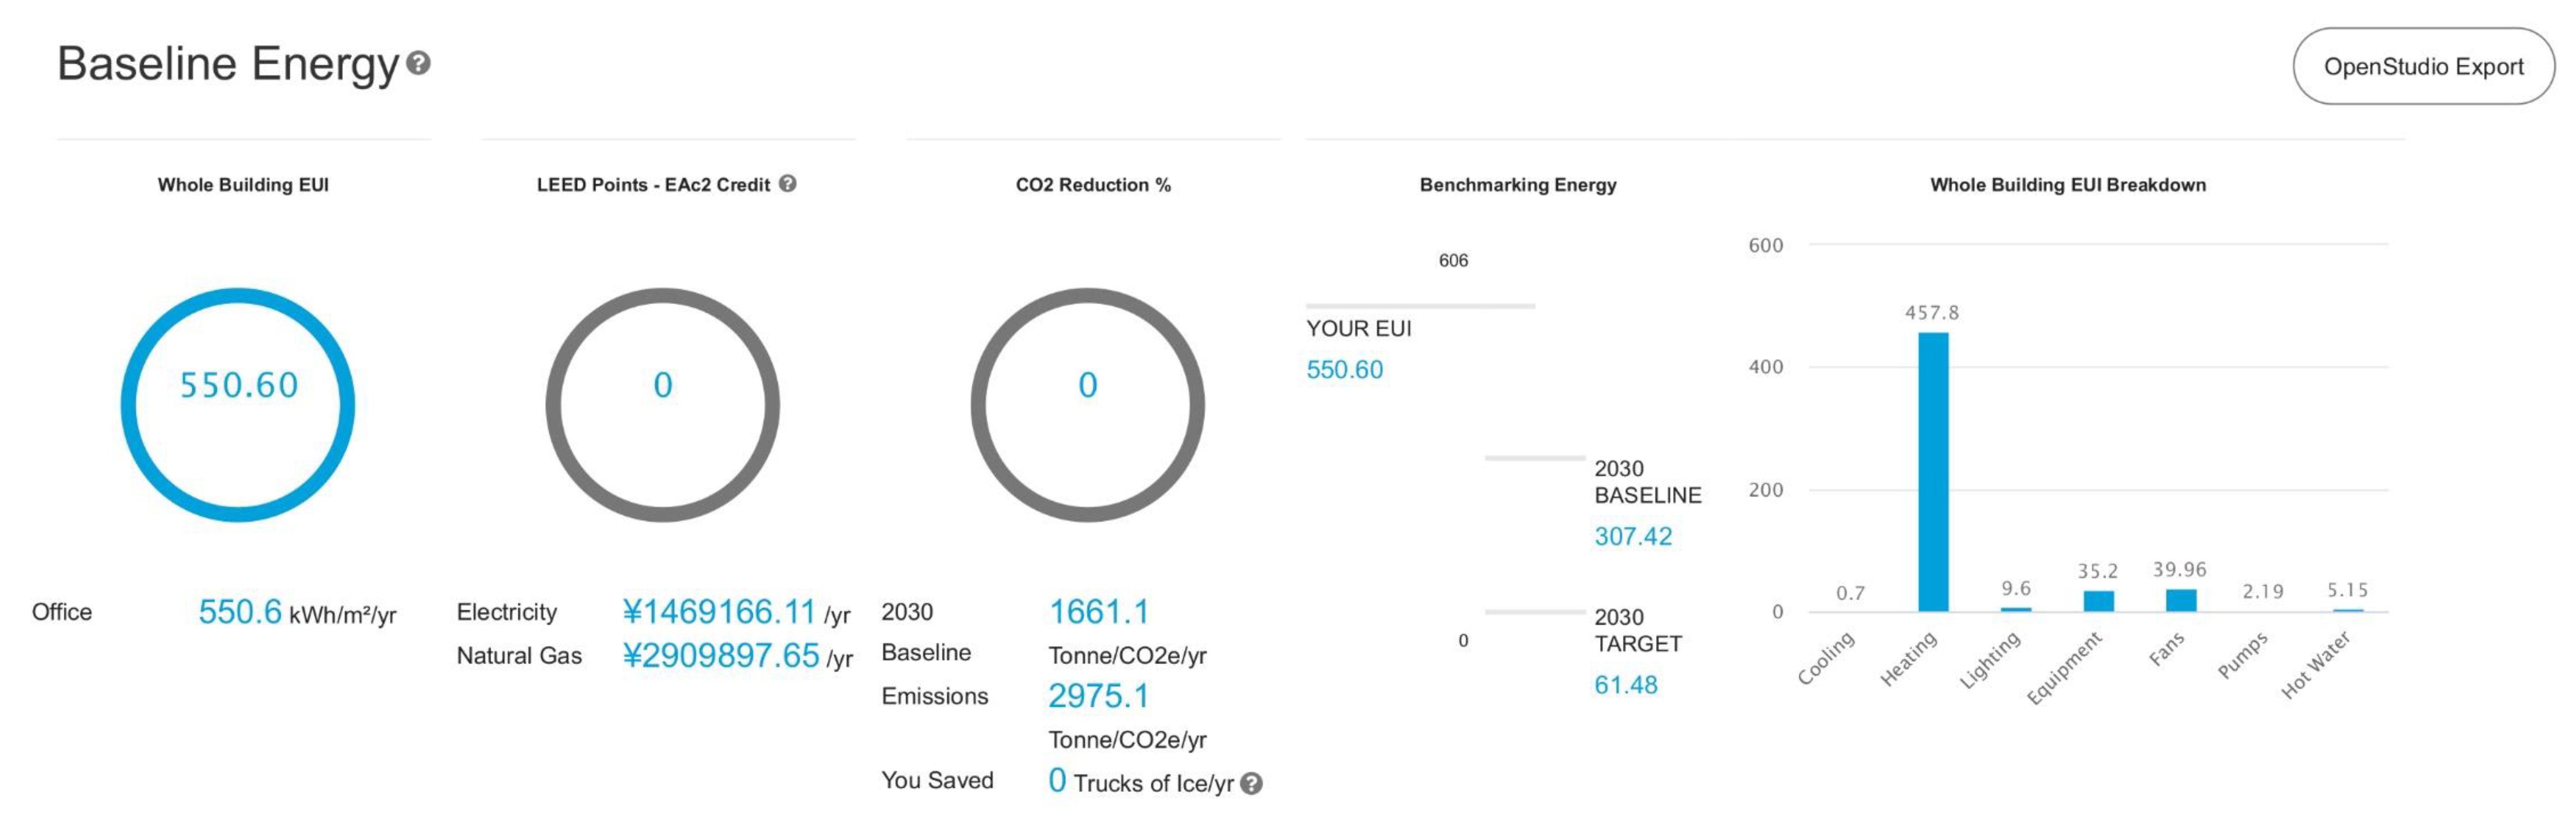
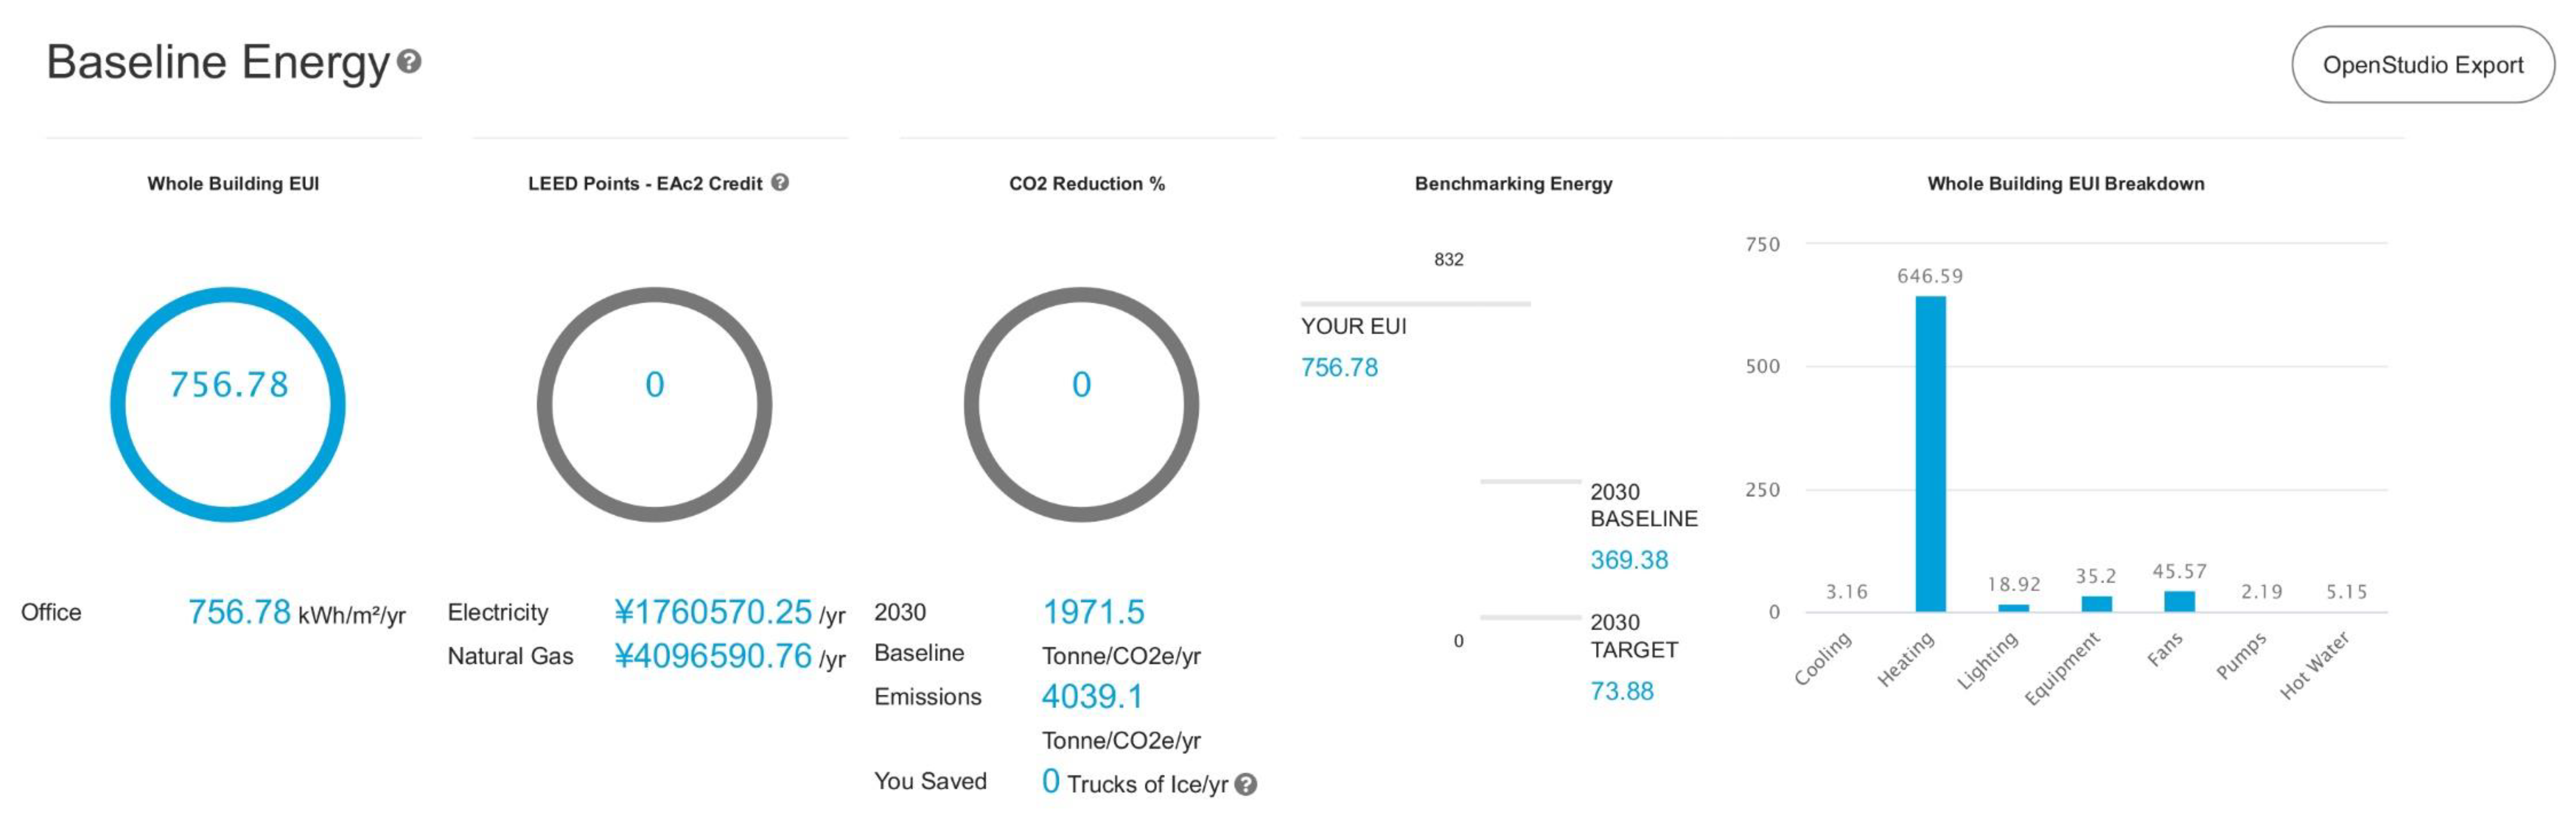
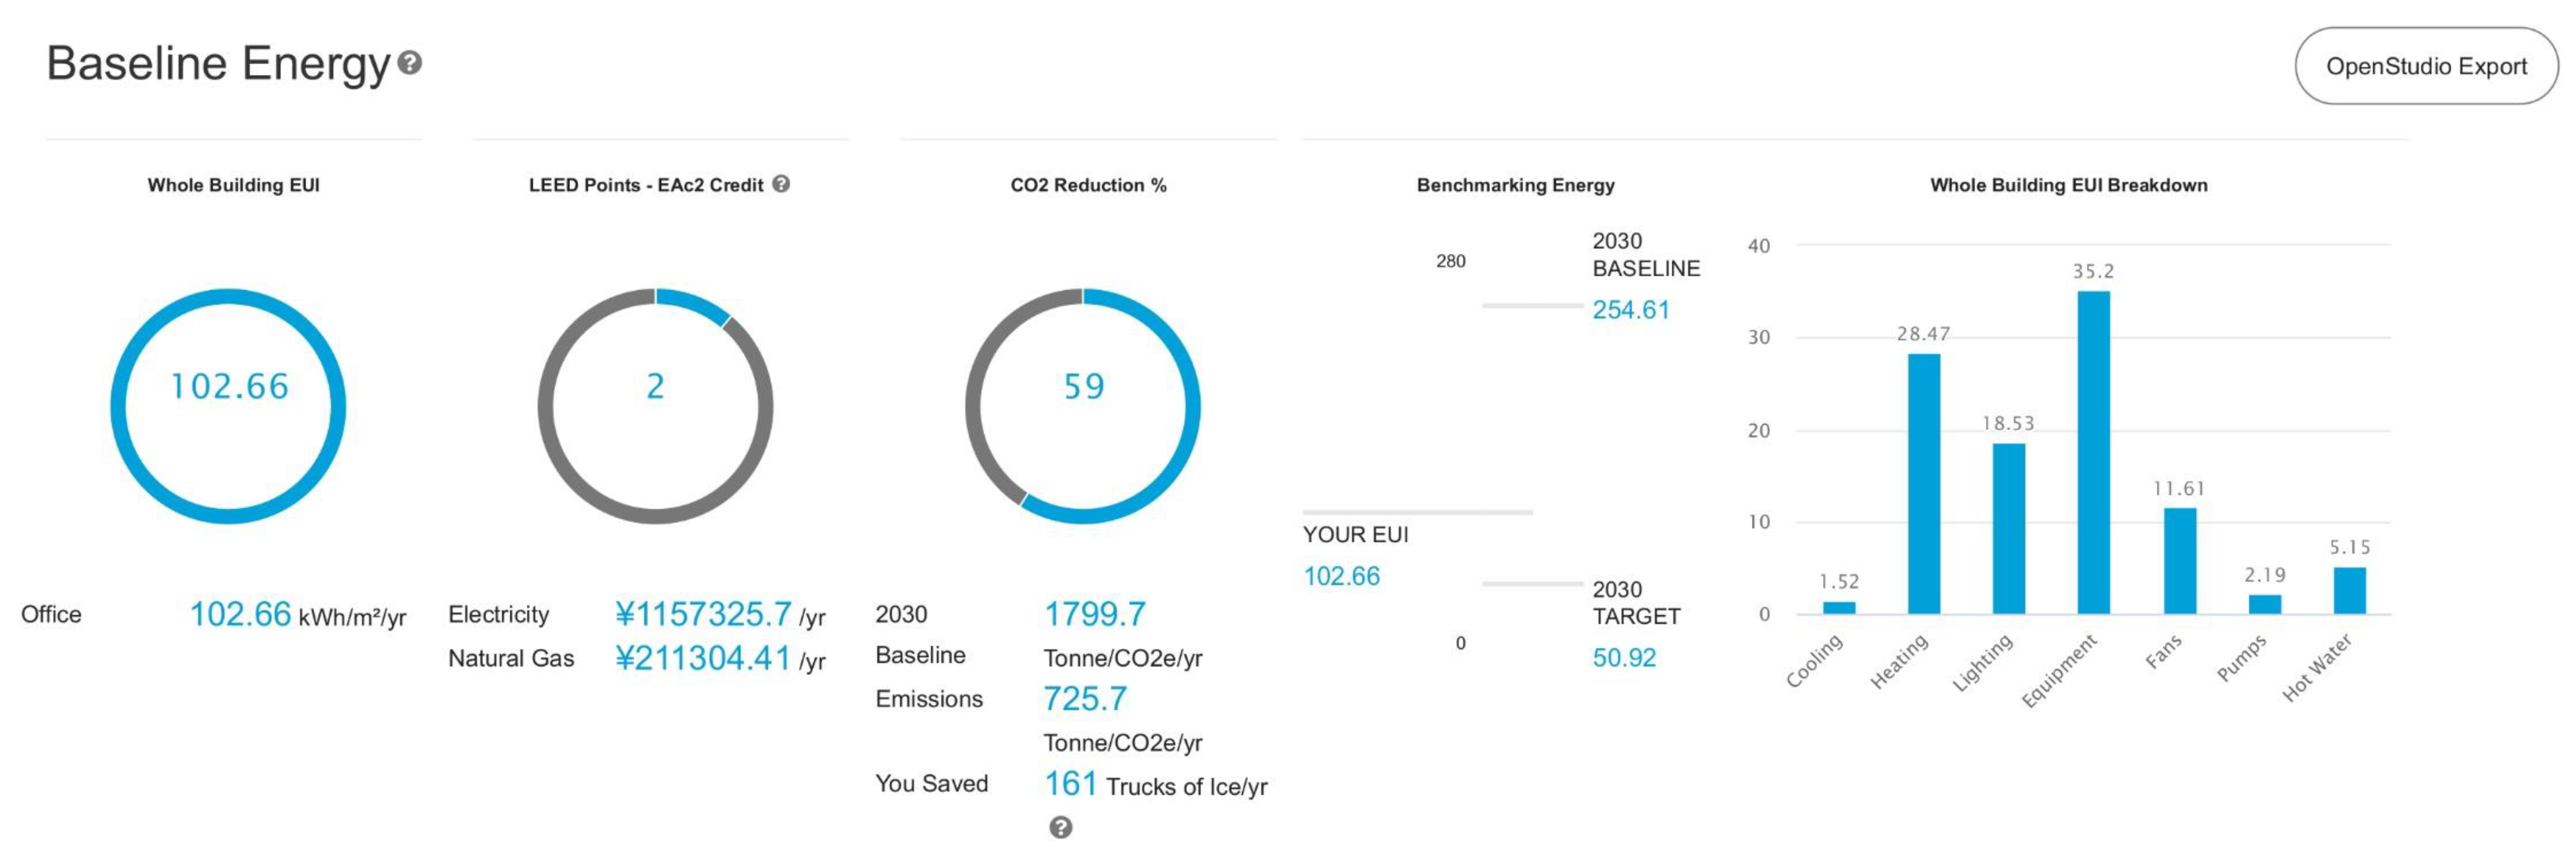
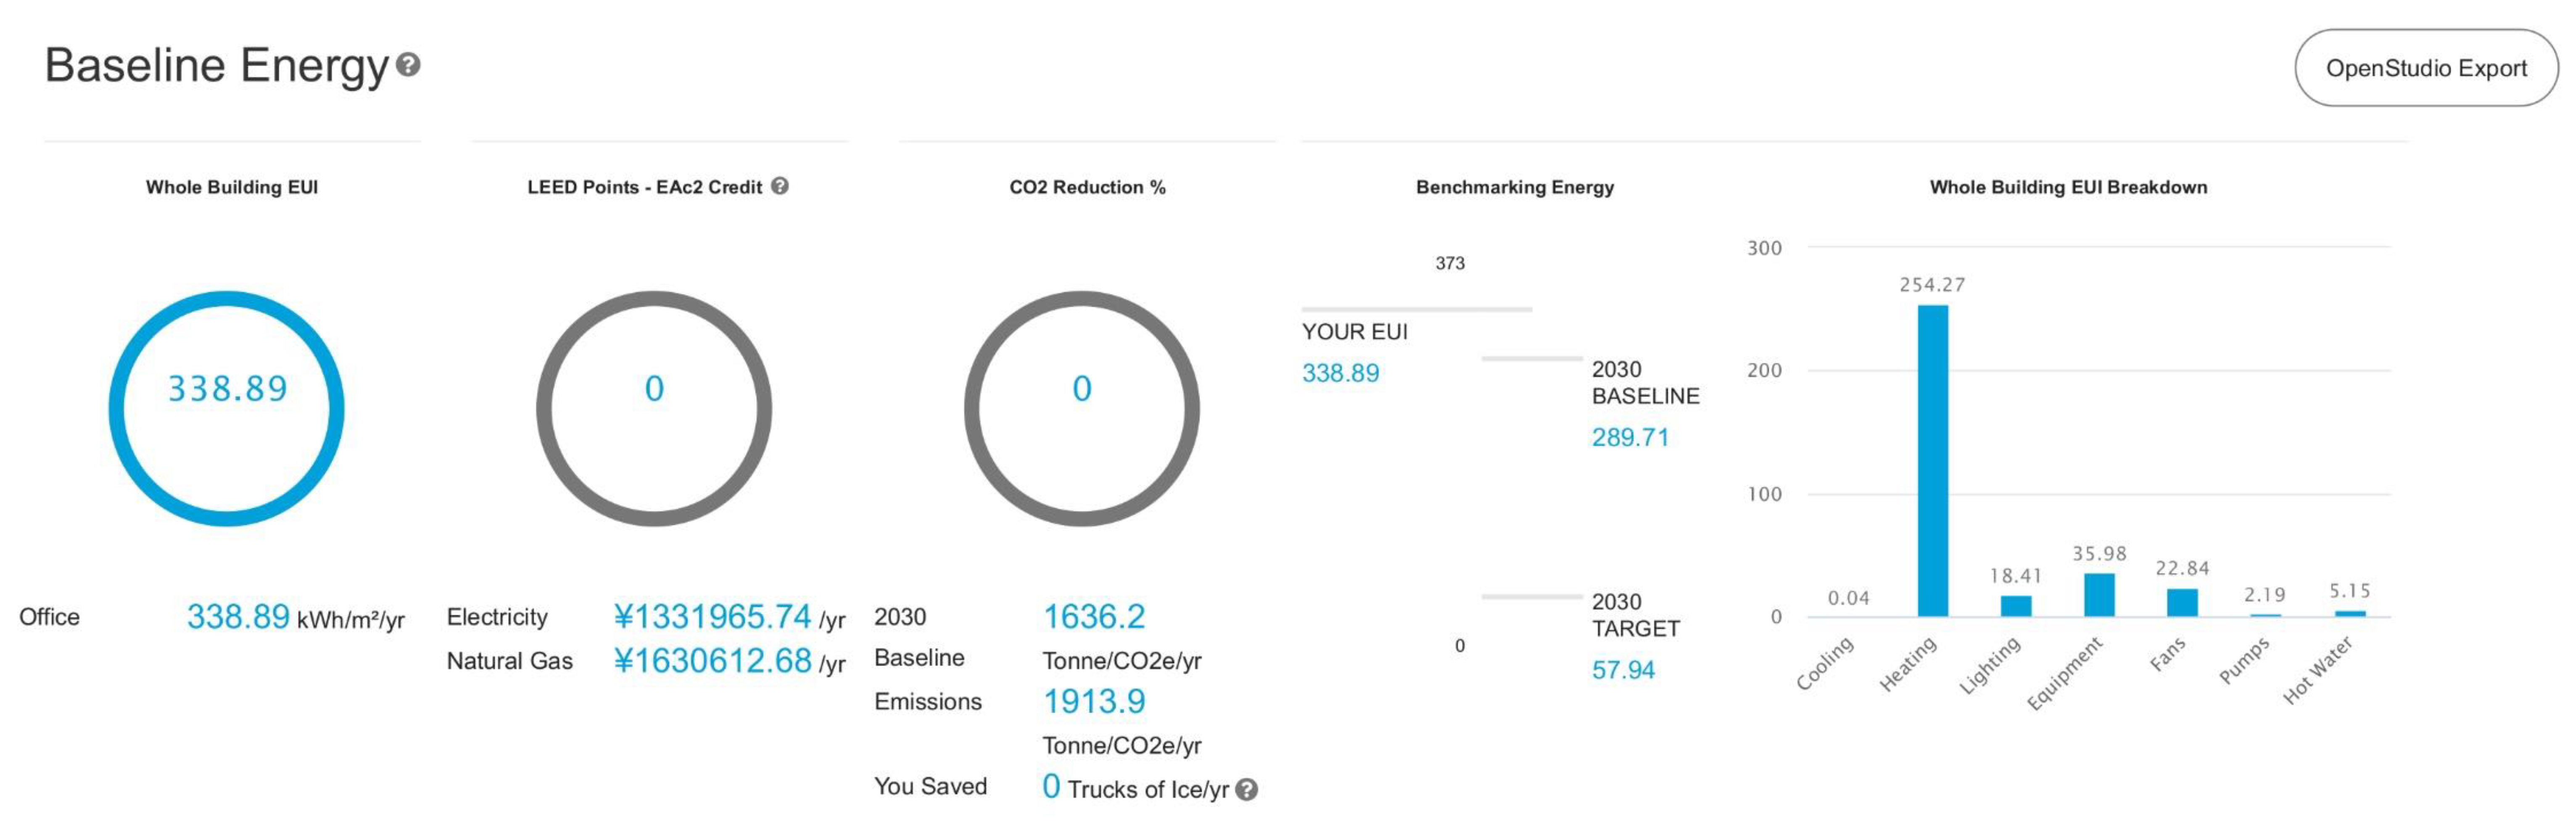
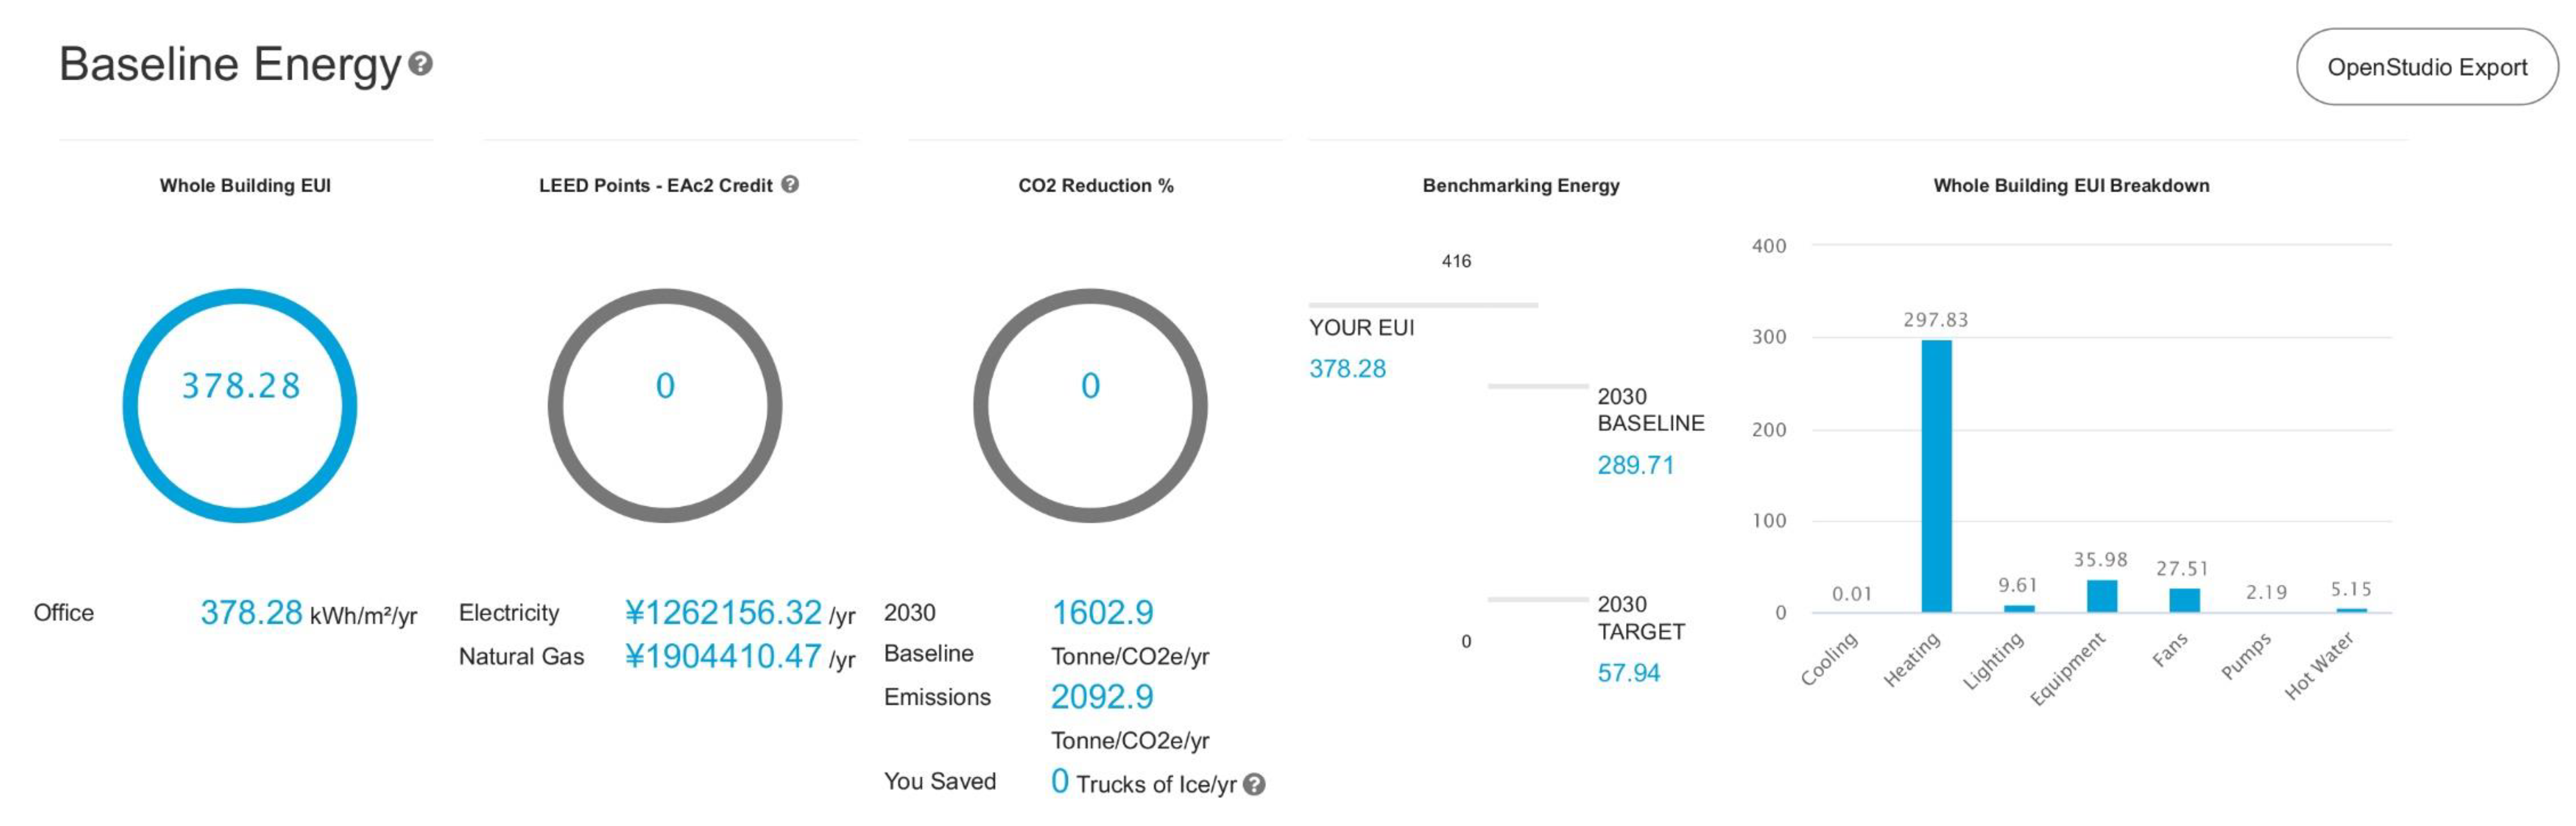
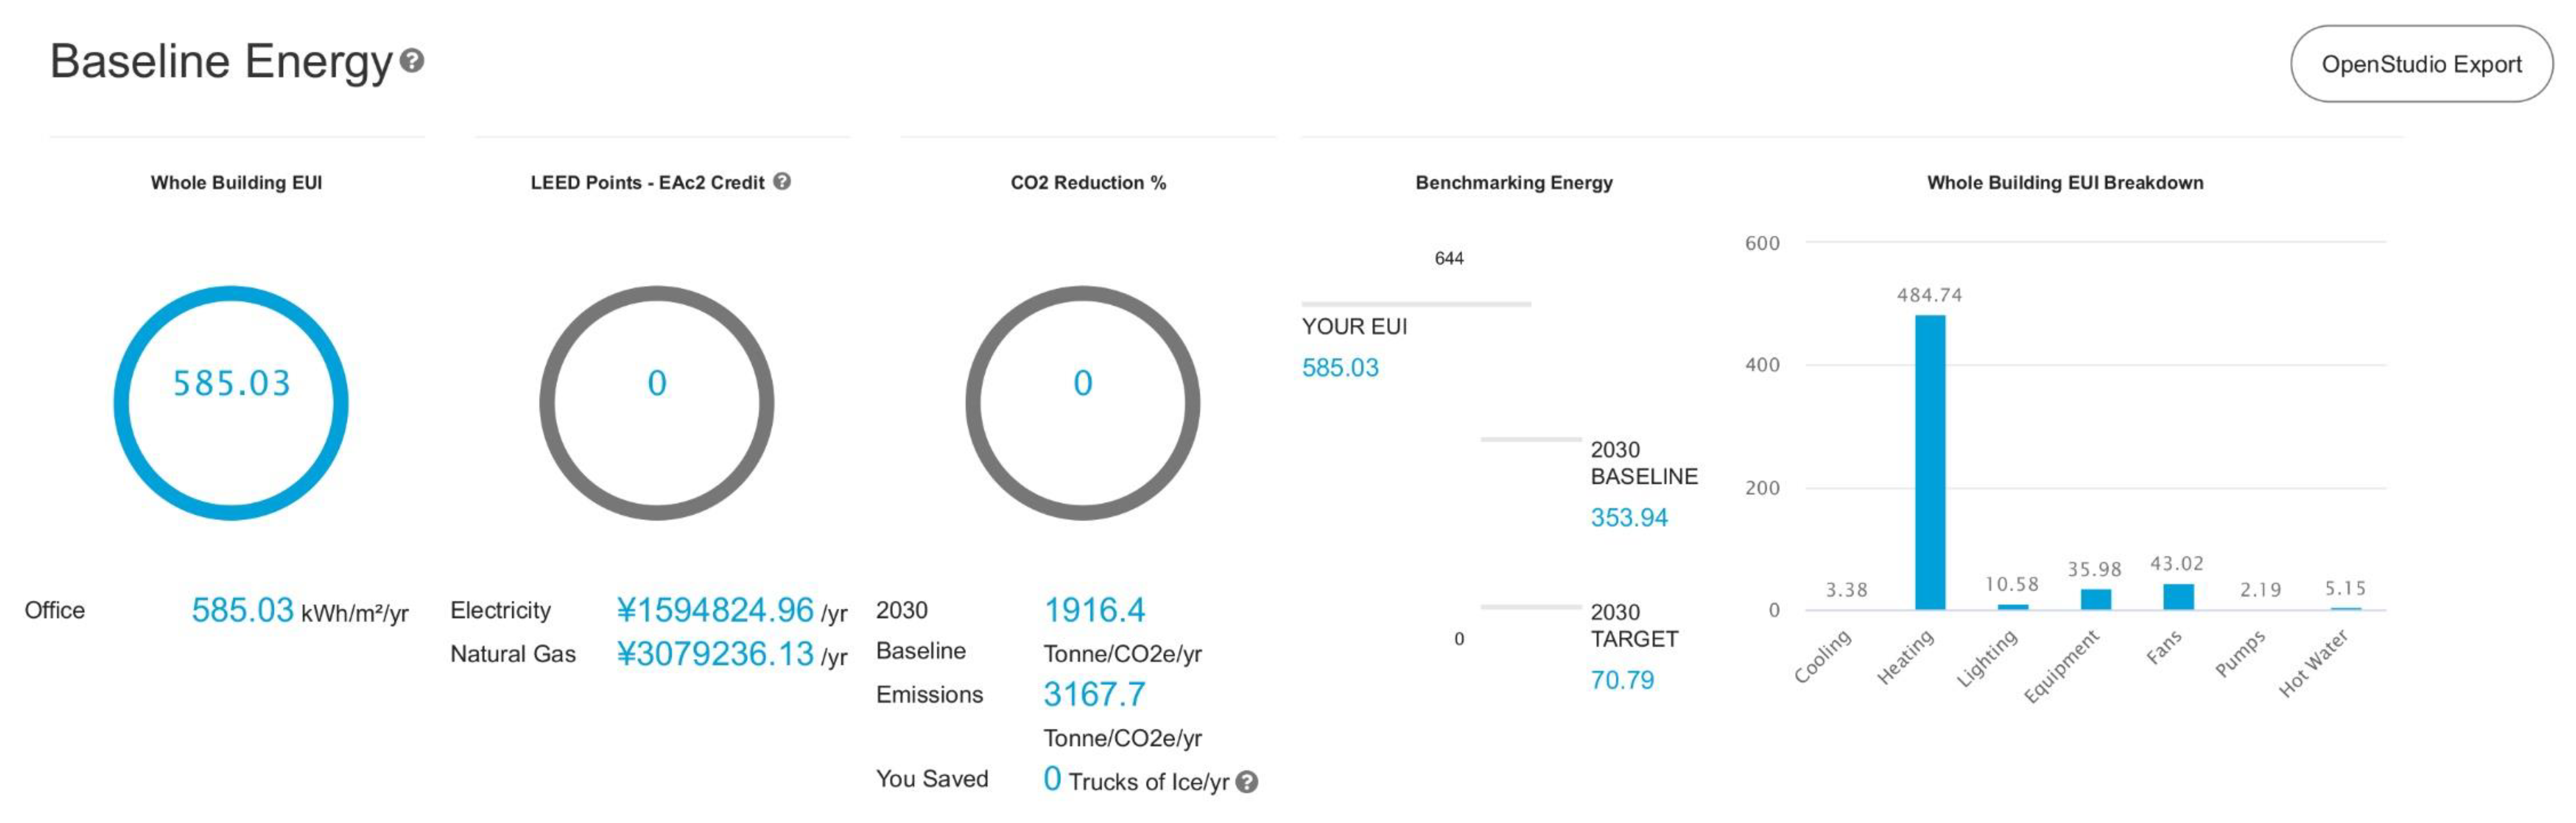
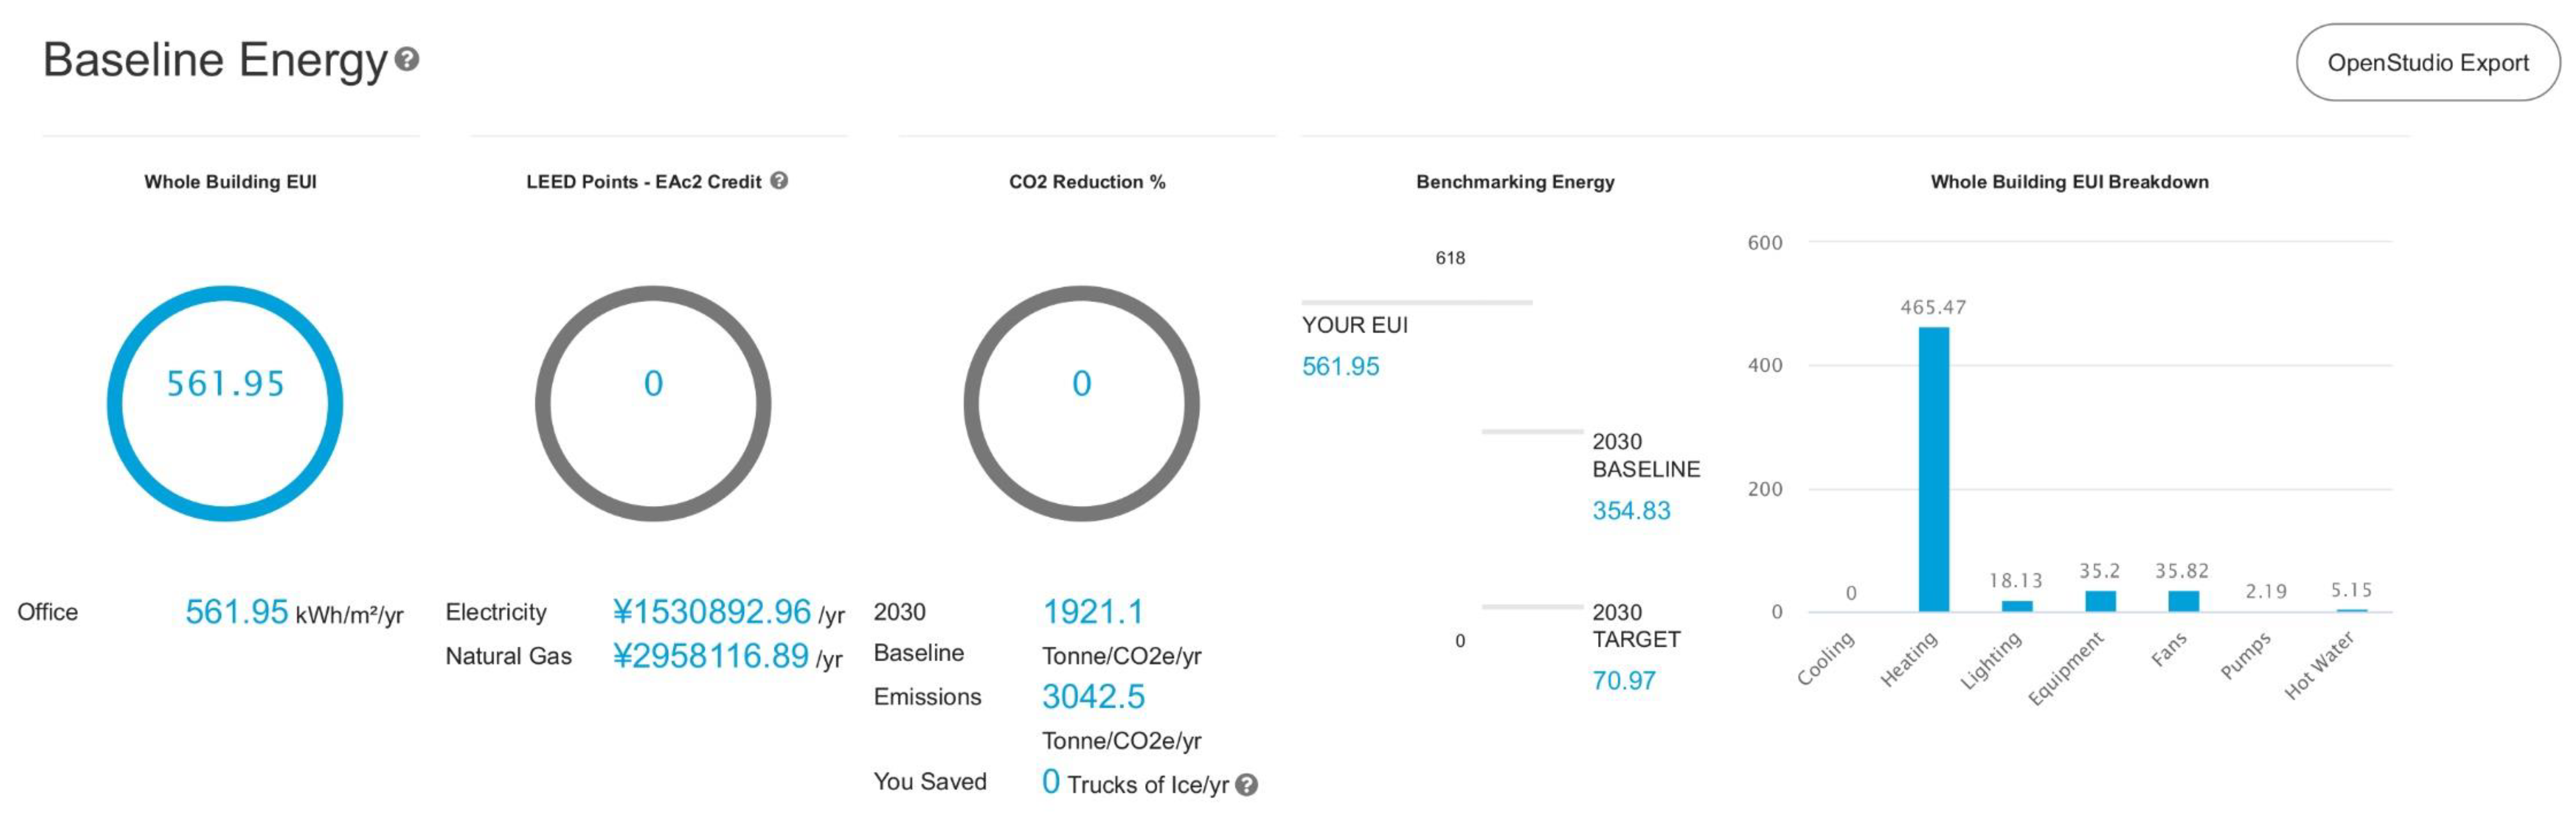
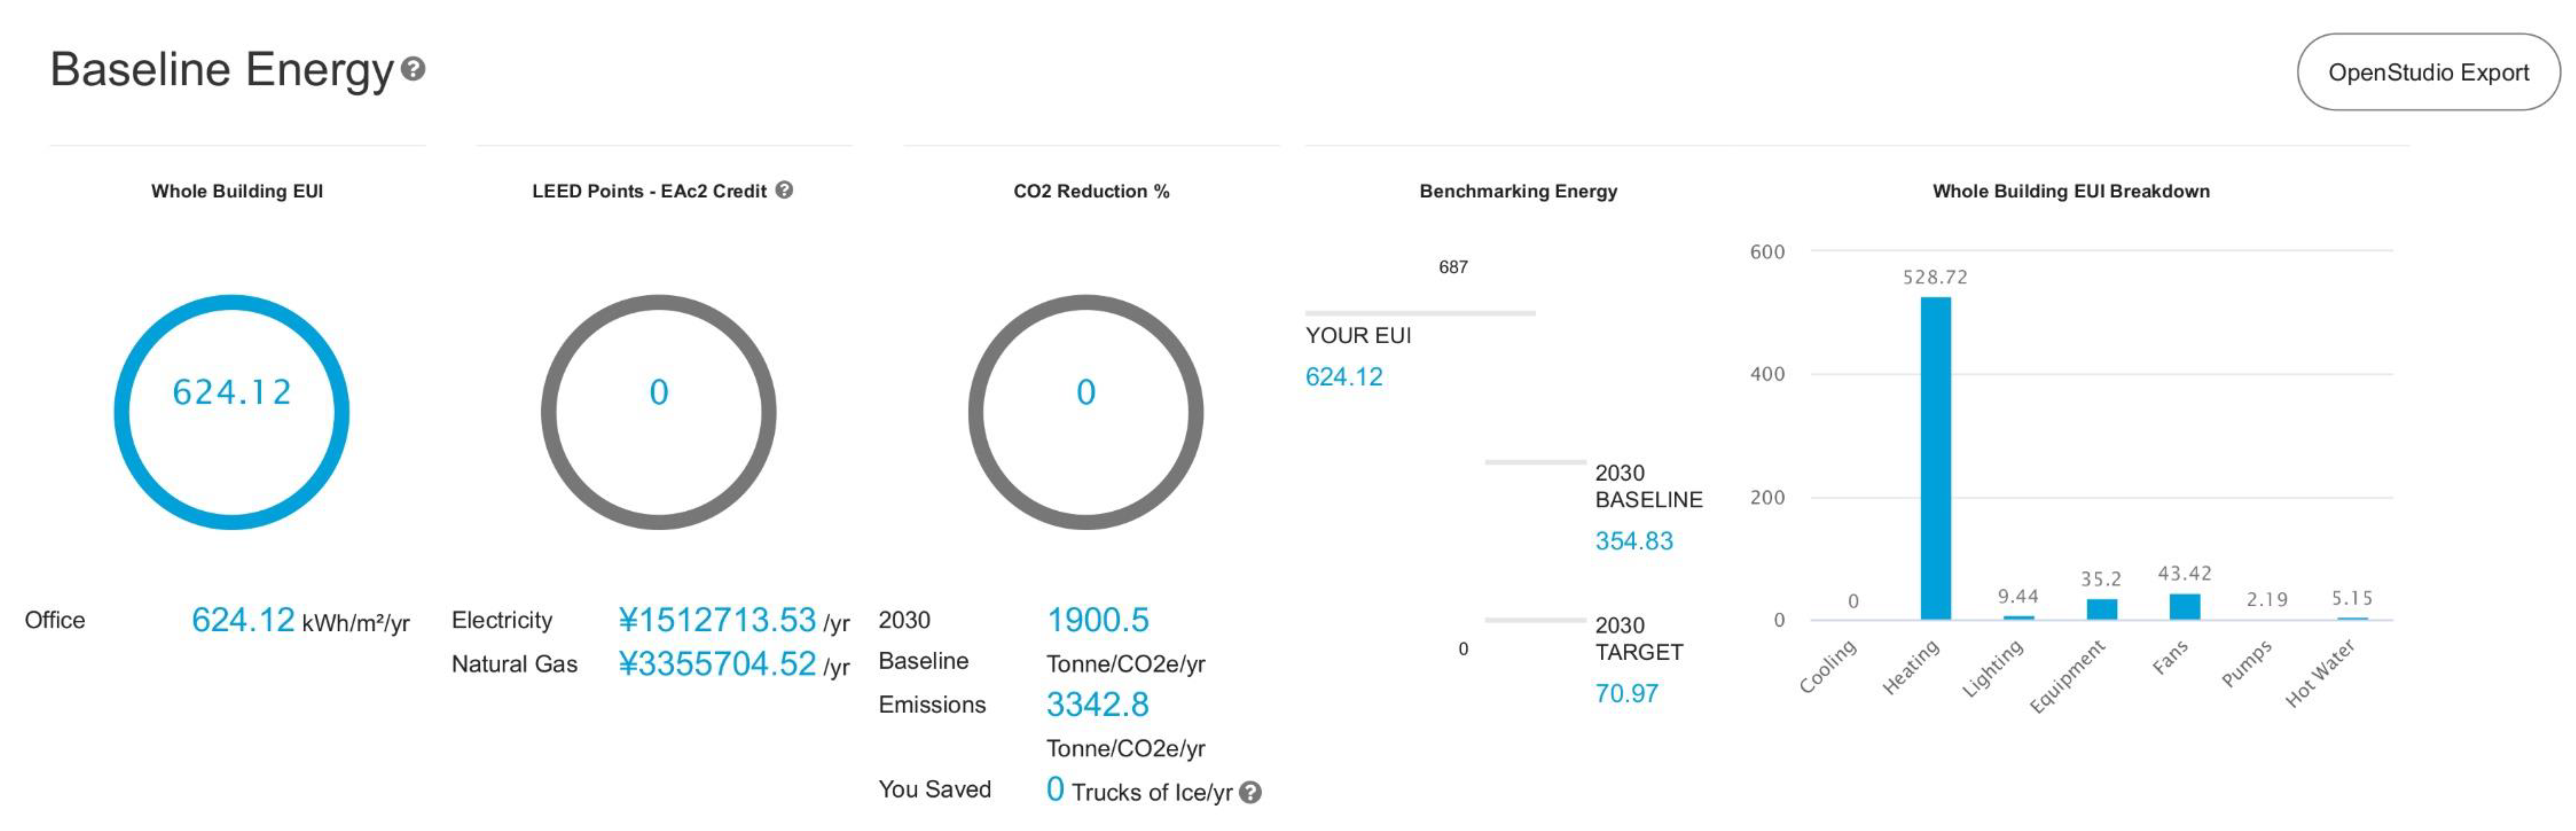
Appendix B.1. Cove.tool’s Assessments
Reports Pre- and Post-C19 Scenarios


Appendix B.2. Results
Appendix B.2.1. Disaggregated EUI and Total Usable Energy Consumption
| ASHRAE Climate Zone (29) | City | Cooling | Heating | Lighting | Plugs and Equipment | Fans | Pumps | SWH | Total | |||||||||||||||
|---|---|---|---|---|---|---|---|---|---|---|---|---|---|---|---|---|---|---|---|---|---|---|---|---|
| Zone, Subzone | Classification | Pre-C19 | Post-C19 78% | Post-C19 84% | Pre-C19 | Post-C19 78% | Post-C19 84% | Pre-C19 | Post-C19 78% | Post-C19 84% | Pre-C19 | Post-C19 | Pre-C19 | Post-C19 78% (a) | Post-C19 84% (a) | Pre-C19 | Post-C19 | Pre-C19 | Post-C19 | Pre-C19 | Post-C19 78% | Post-C19 84% | ||
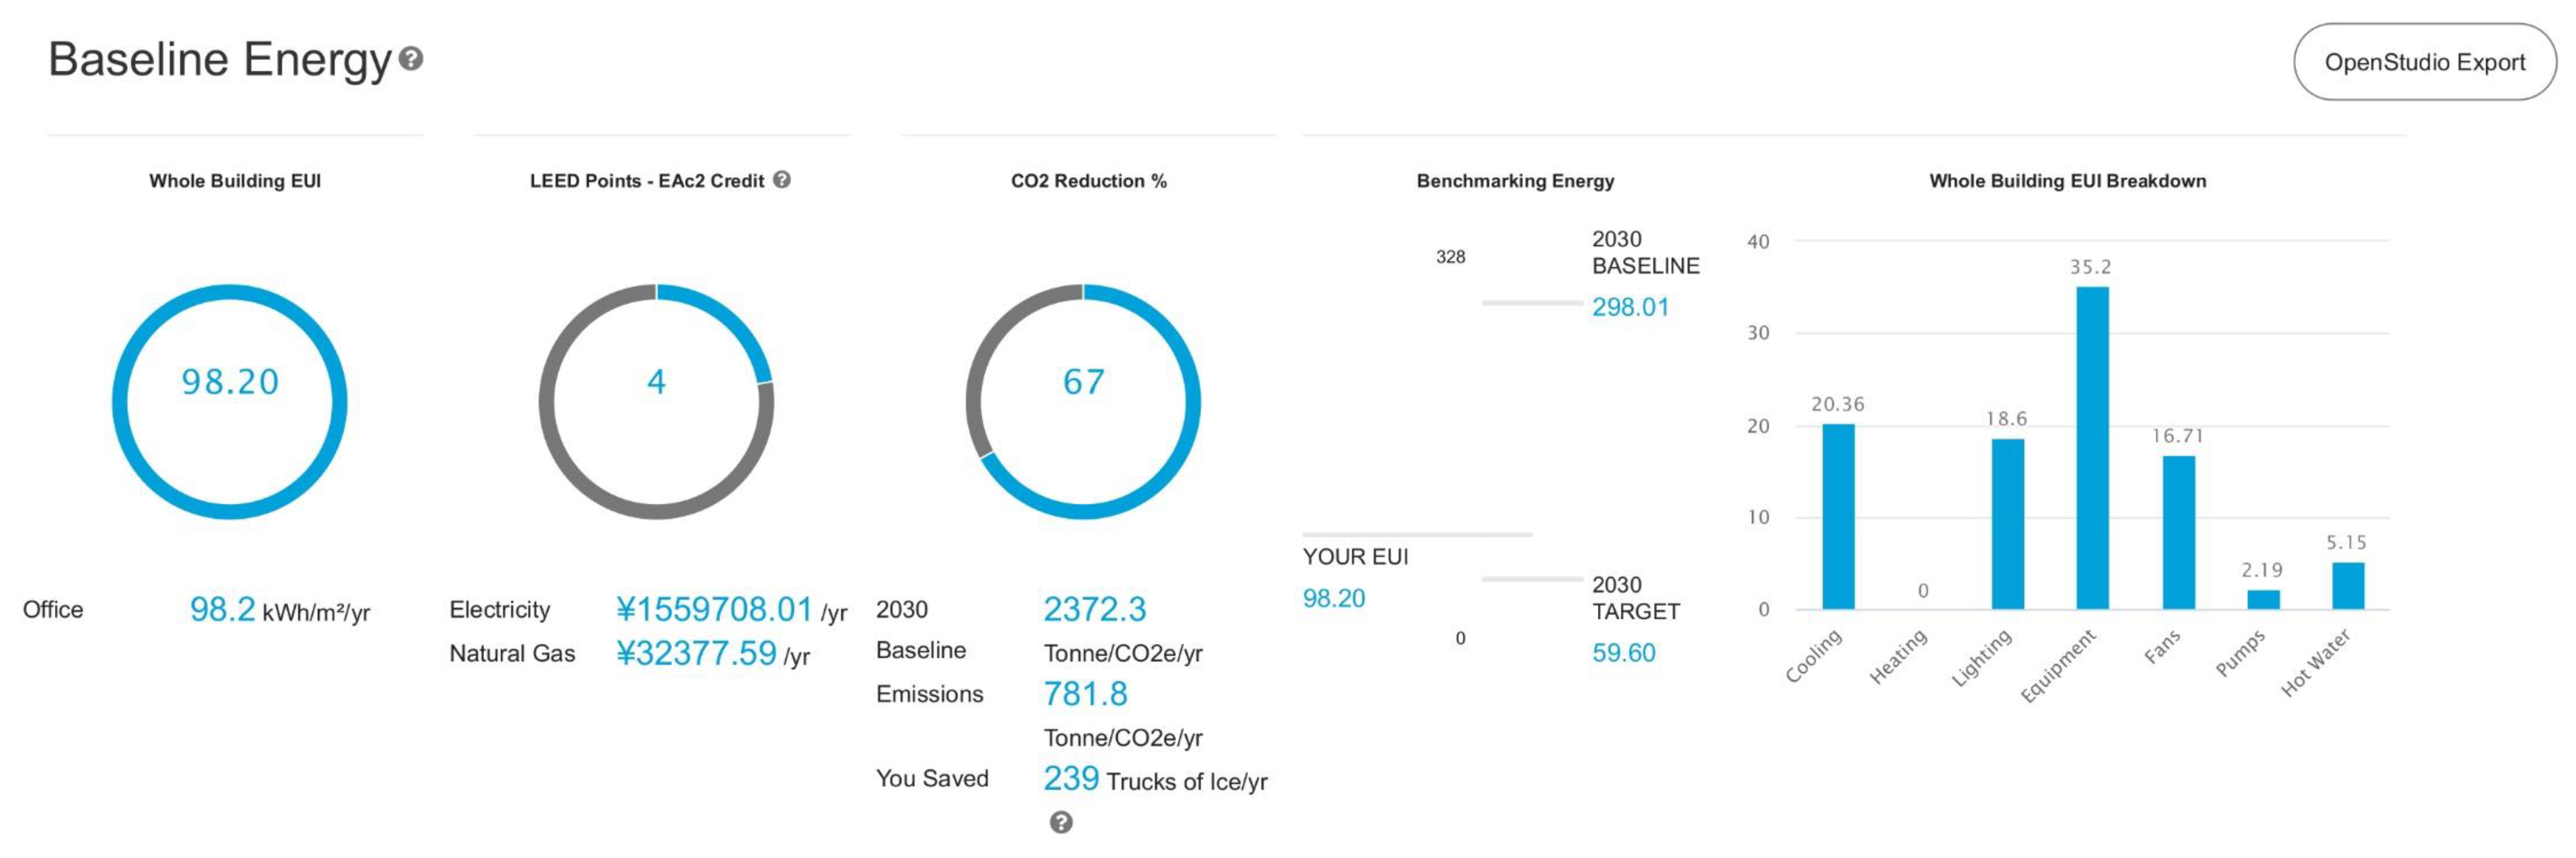
| 1 | A | very hot-humid | Haikou | 20.36 | 15.34 | 15.93 | 0.00 | 0.00 | 0.00 | 18.60 | 9.56 | 9.56 | 35.20 | 35.20 | 16.71 | 14.94 | 15.20 | 2.19 | 2.19 | 5.15 | 5.15 | 98.21 | 82.38 | 83.23 |
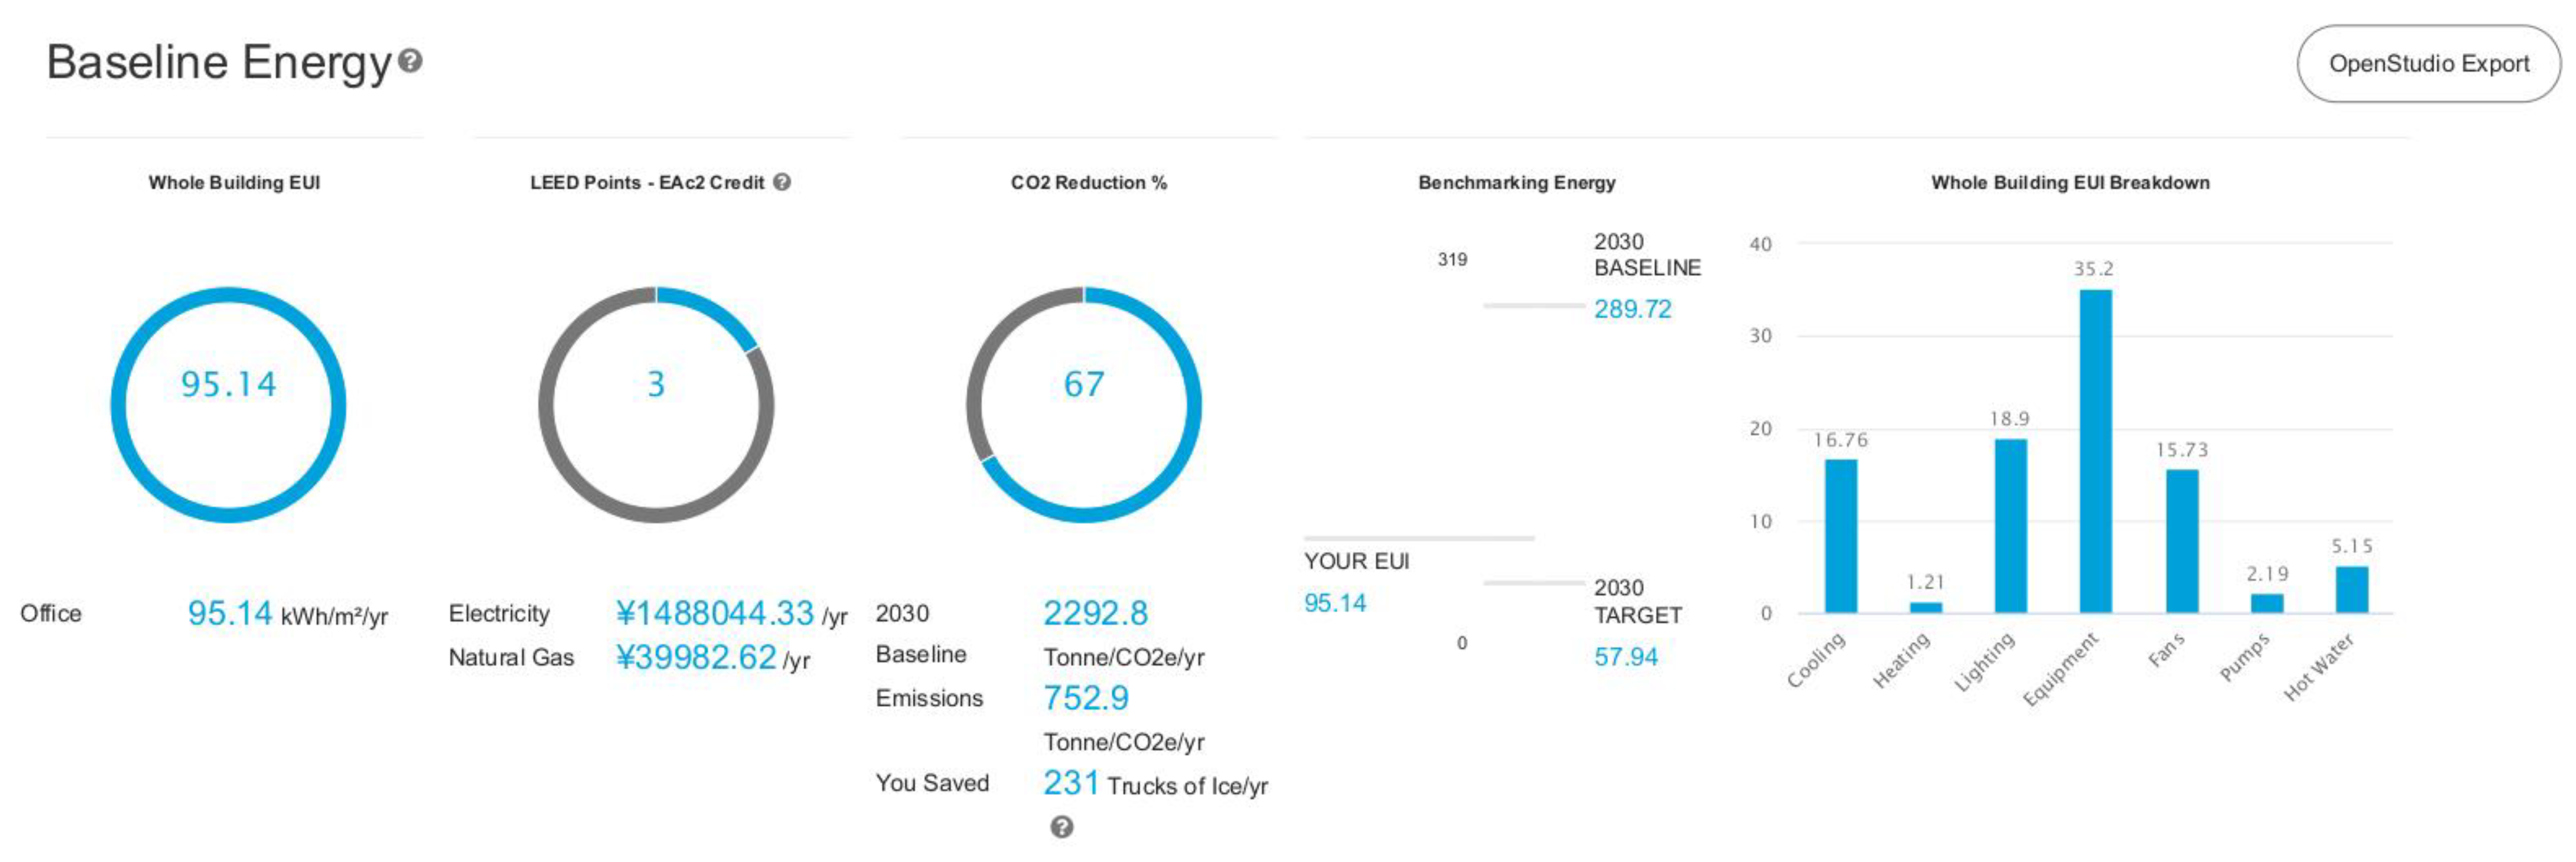
| 2 | A | hot-humid | Guangzhou | 16.76 | 12.57 | 13.05 | 1.21 | 1.27 | 1.15 | 18.90 | 10.07 | 10.07 | 35.20 | 35.20 | 15.73 | 14.59 | 14.75 | 2.19 | 2.19 | 5.15 | 5.15 | 95.14 | 81.04 | 81.56 |
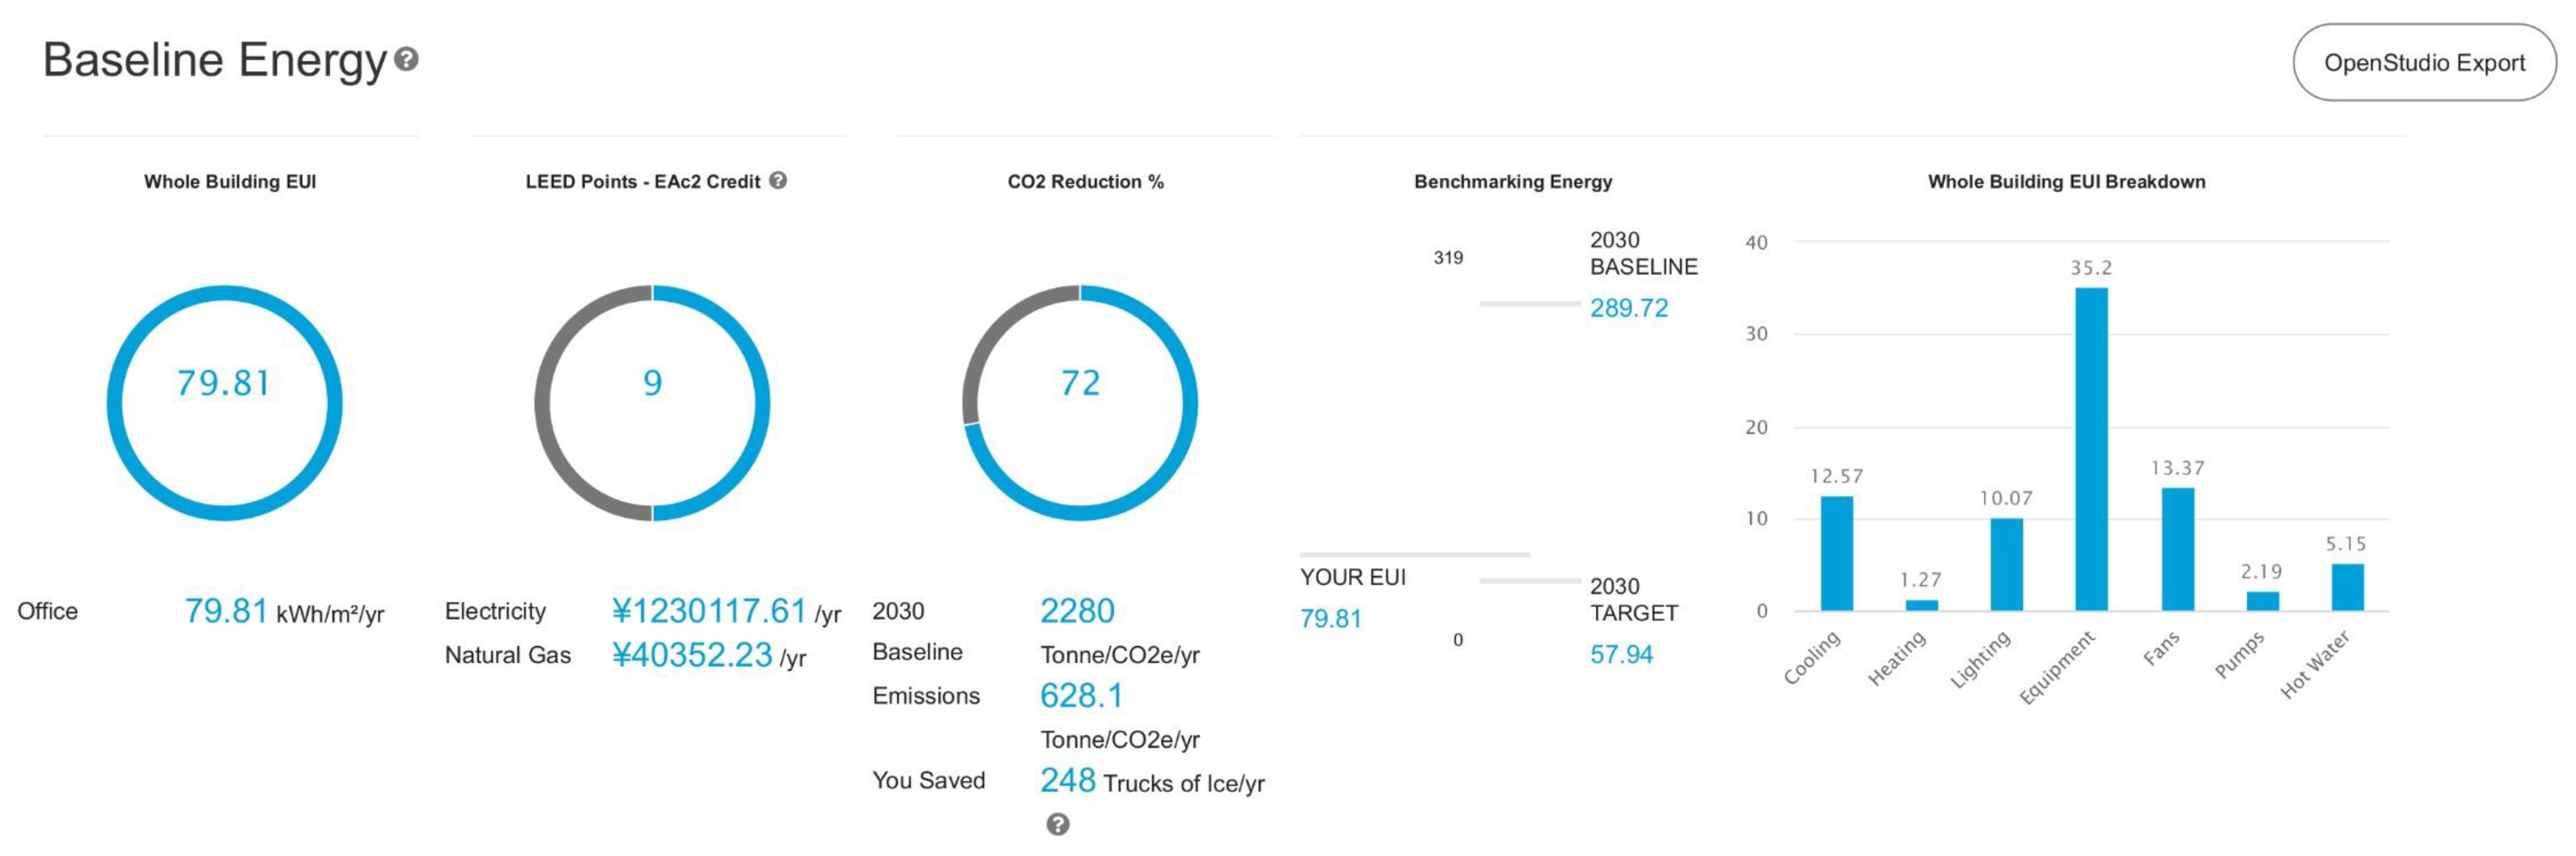
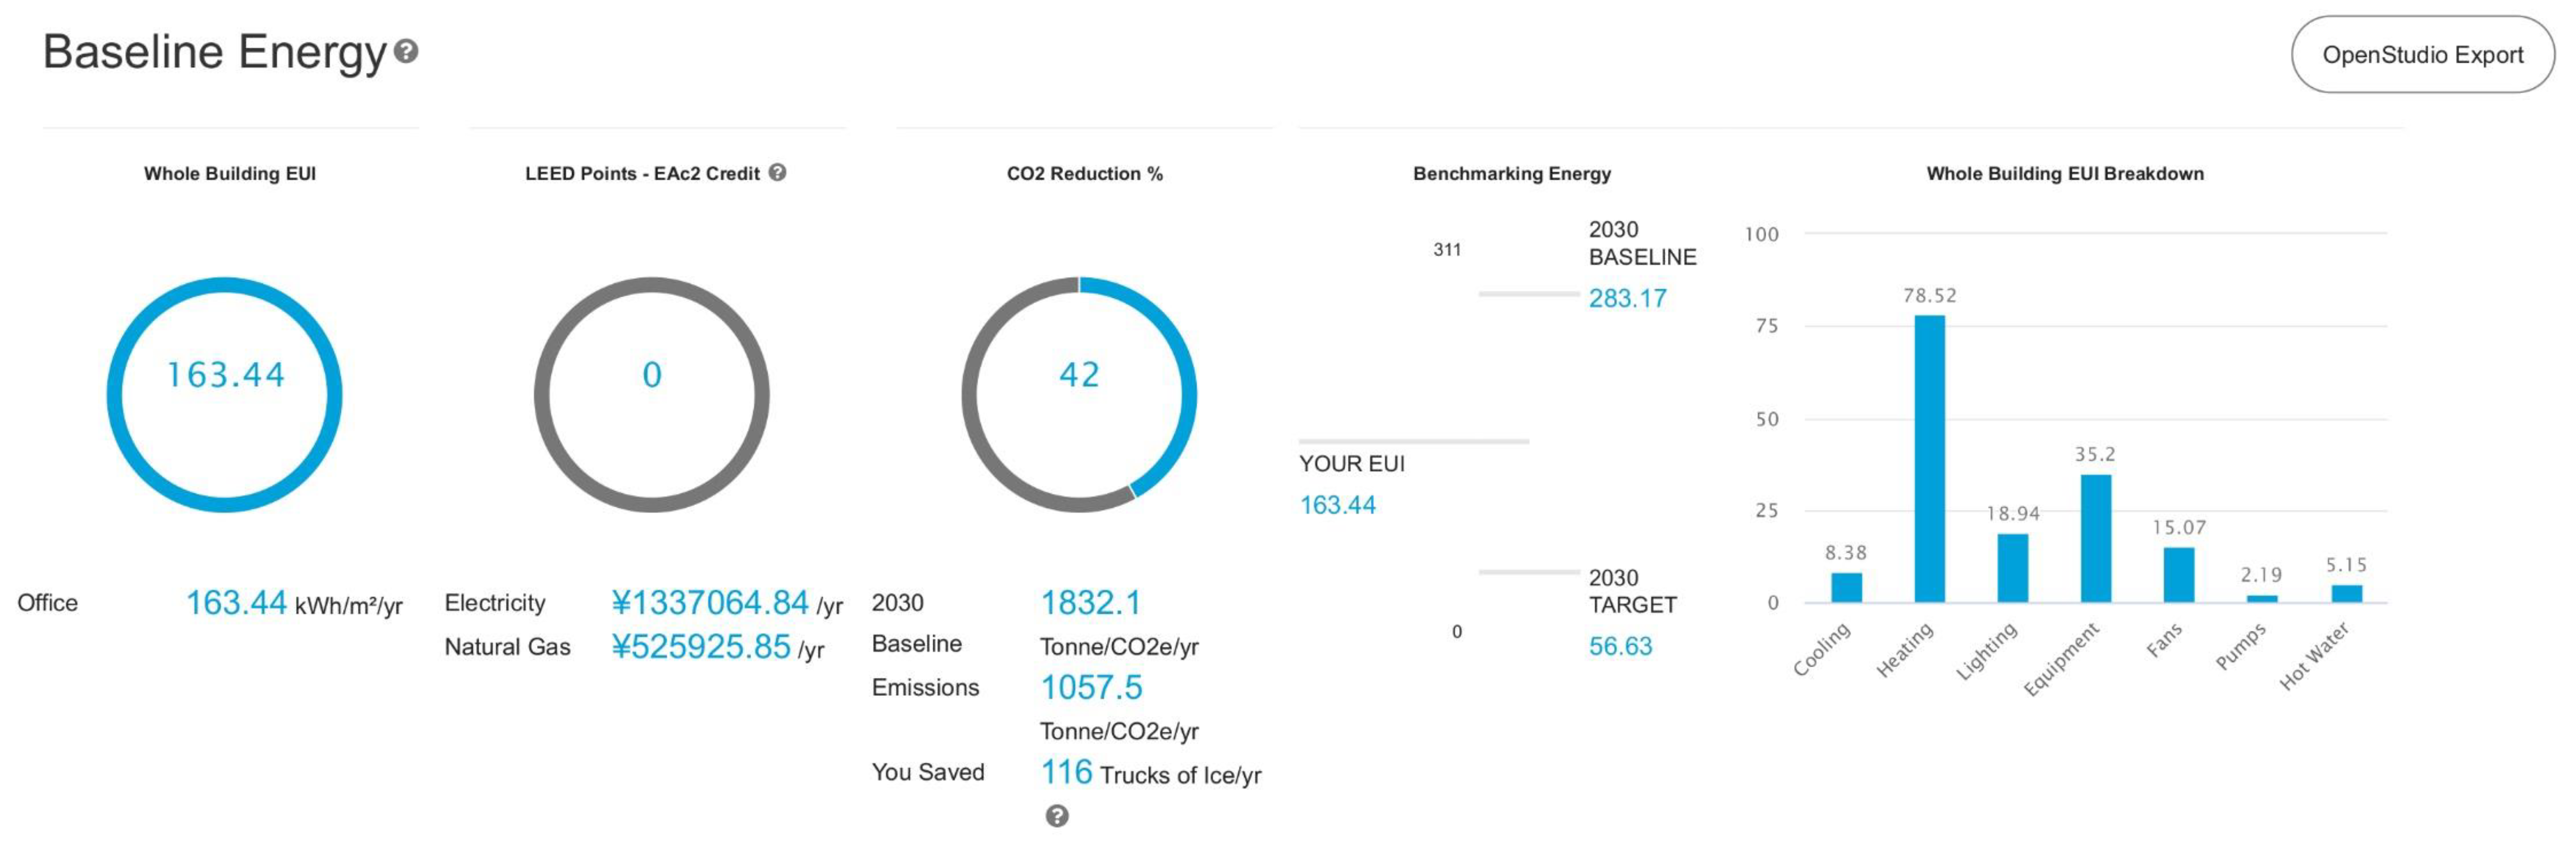
| 3 | A | warm-humid | Shanghai | 8.38 | 5.90 | 6.18 | 78.52 | 96.50 | 94.65 | 18.94 | 10.31 | 10.31 | 35.20 | 35.20 | 15.07 | 16.99 | 16.97 | 2.19 | 2.19 | 5.15 | 5.15 | 163.45 | 172.24 | 170.65 |
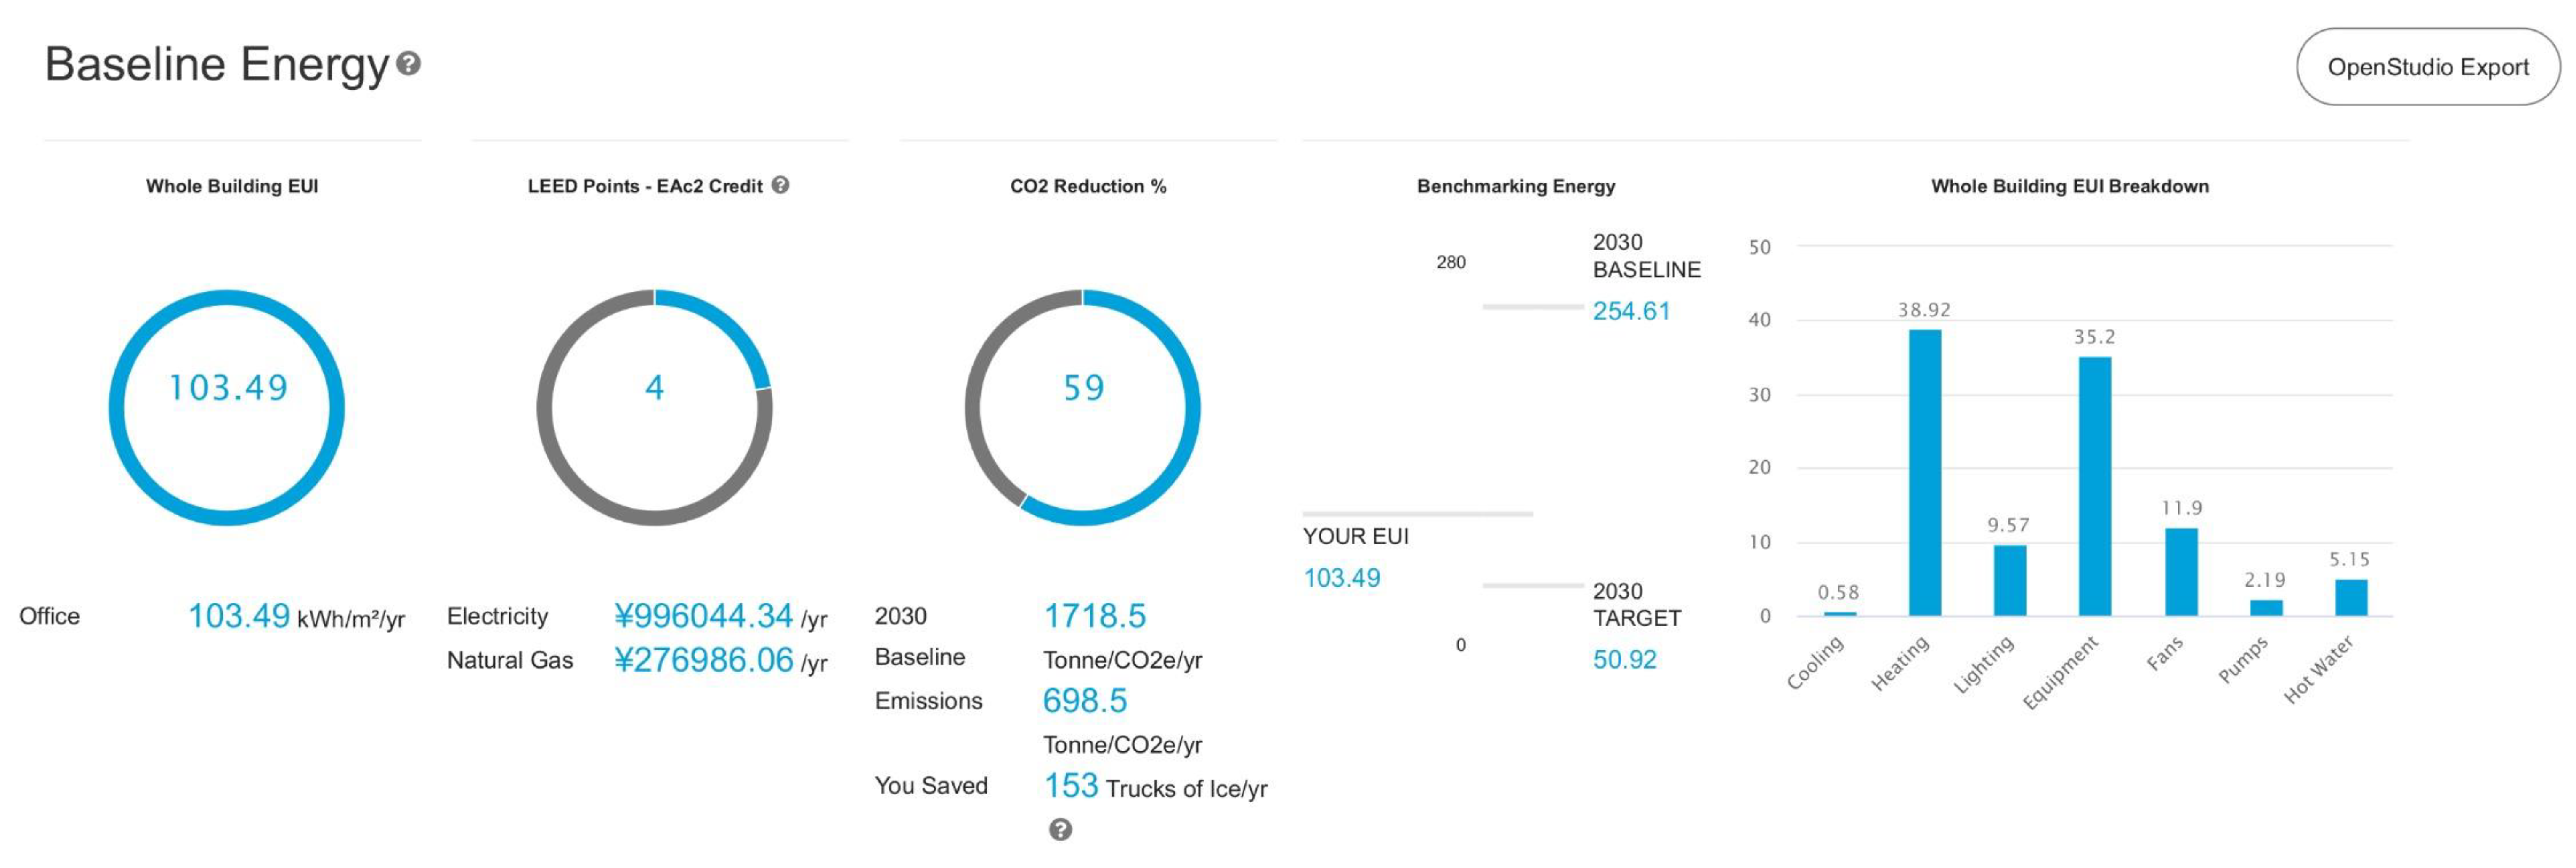
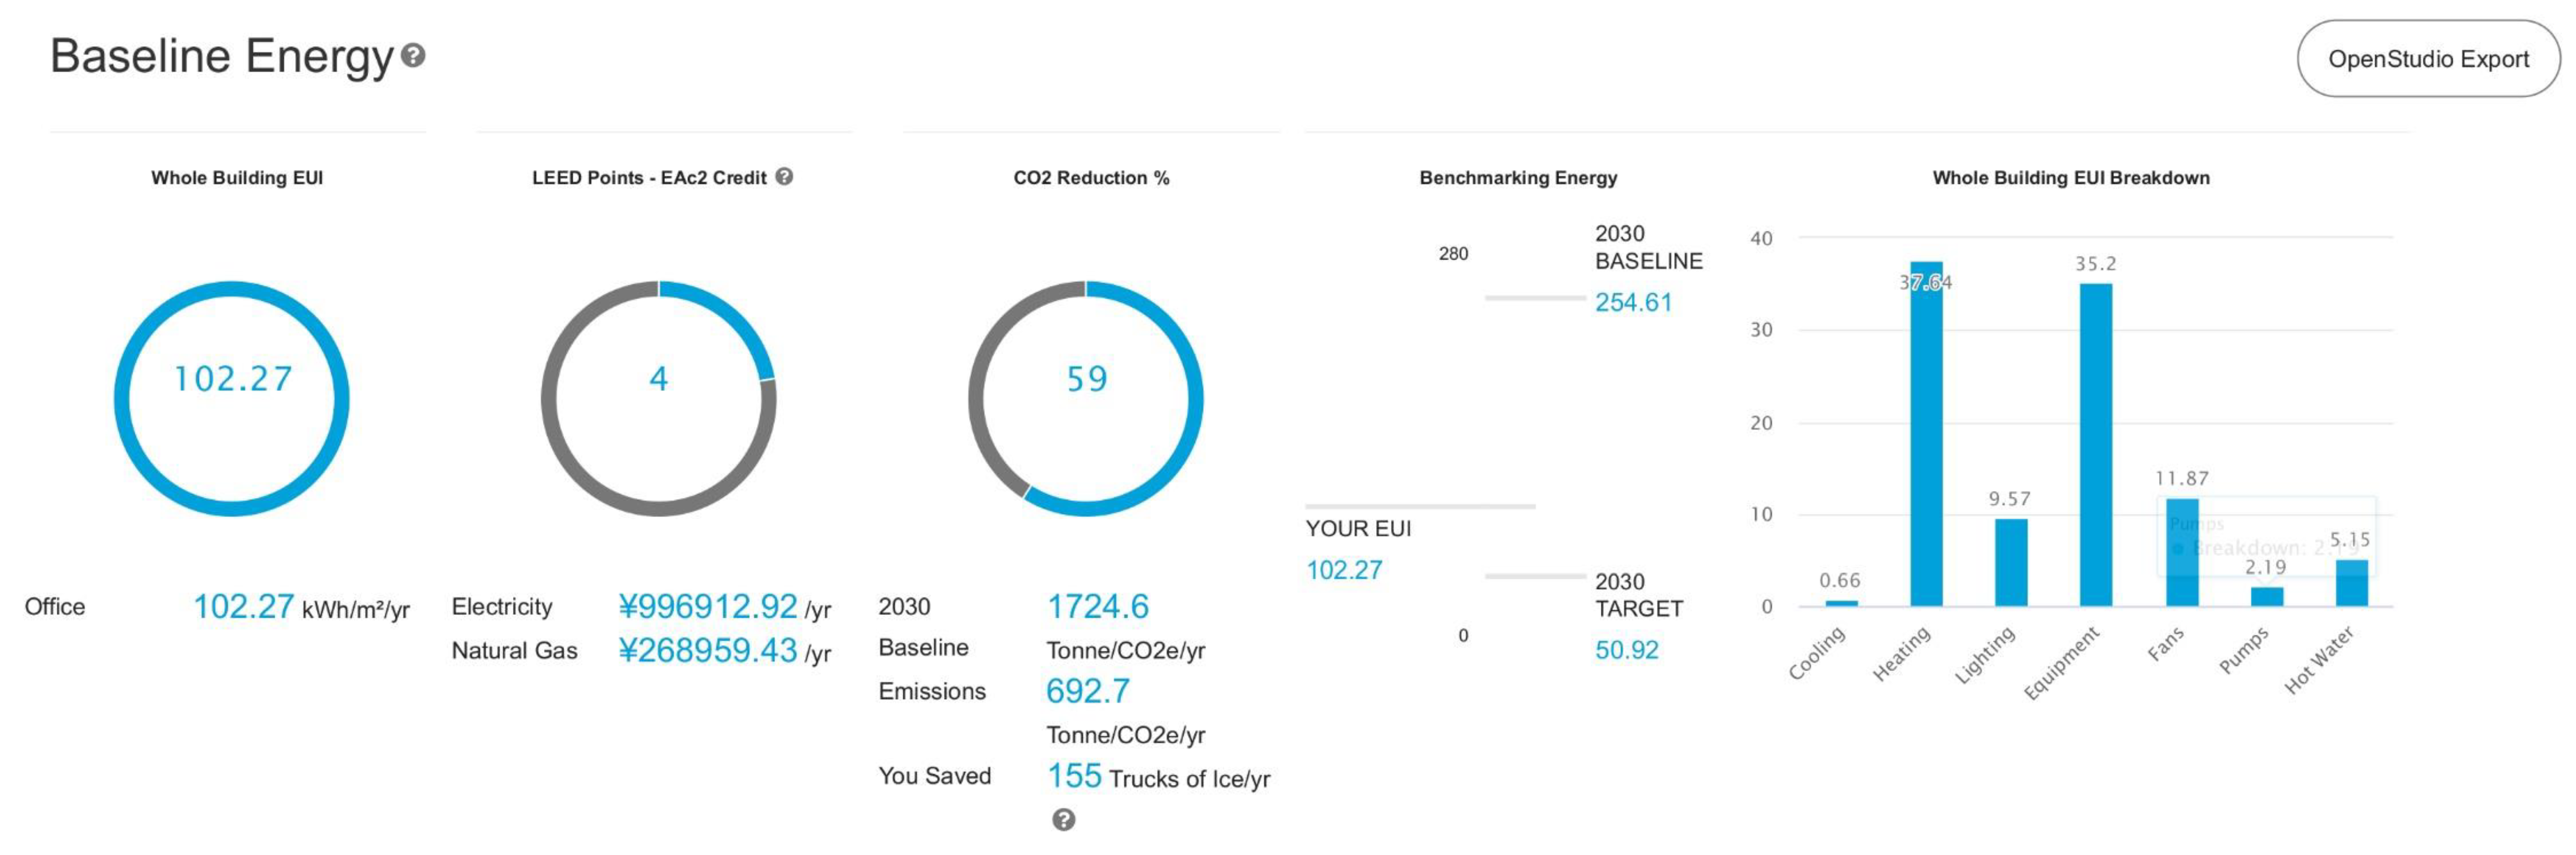
| C | warm-humid-highland | Kunming | 1.52 | 0.58 | 0.66 | 28.47 | 38.92 | 37.64 | 18.53 | 9.57 | 9.57 | 35.20 | 35.20 | 11.87 | 13.12 | 13.09 | 2.19 | 2.19 | 5.15 | 5.15 | 102.93 | 104.73 | 103.50 | |
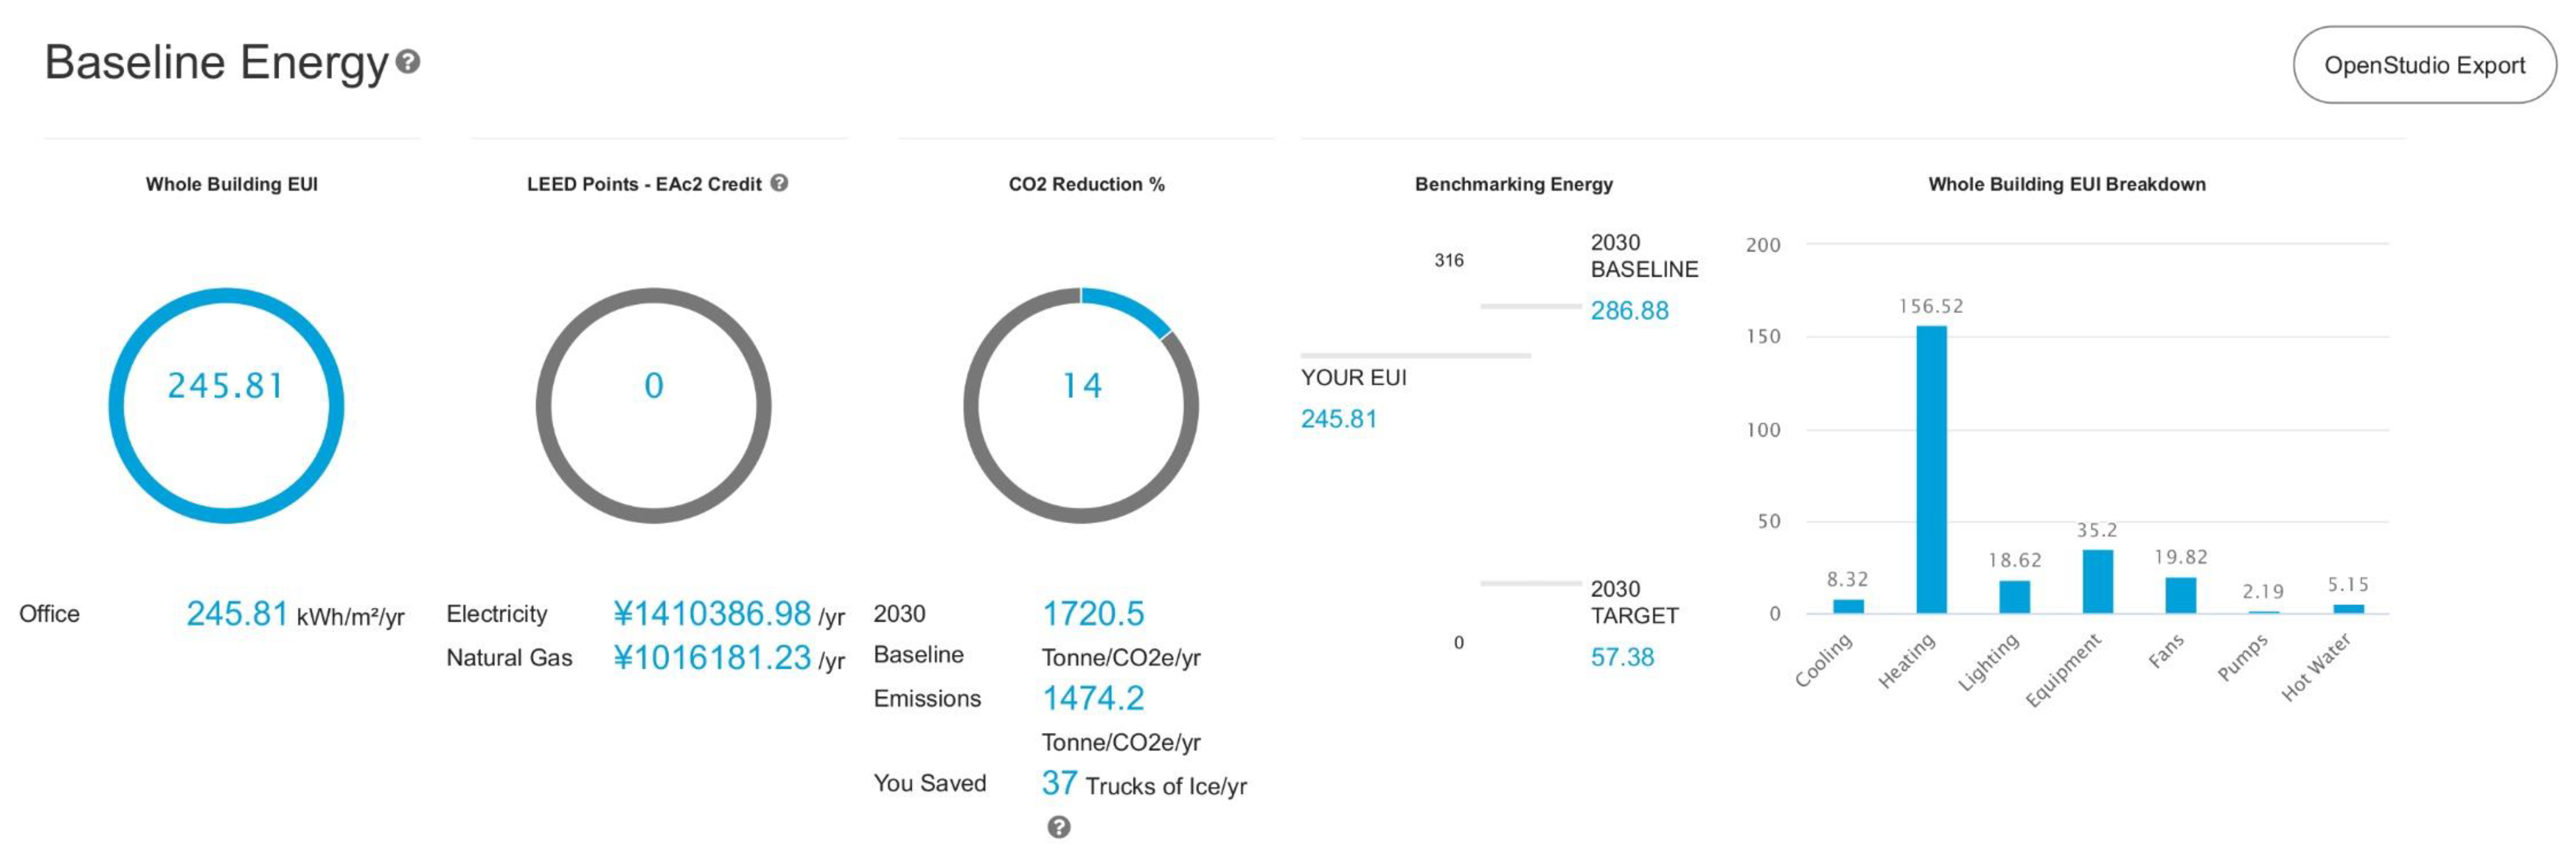
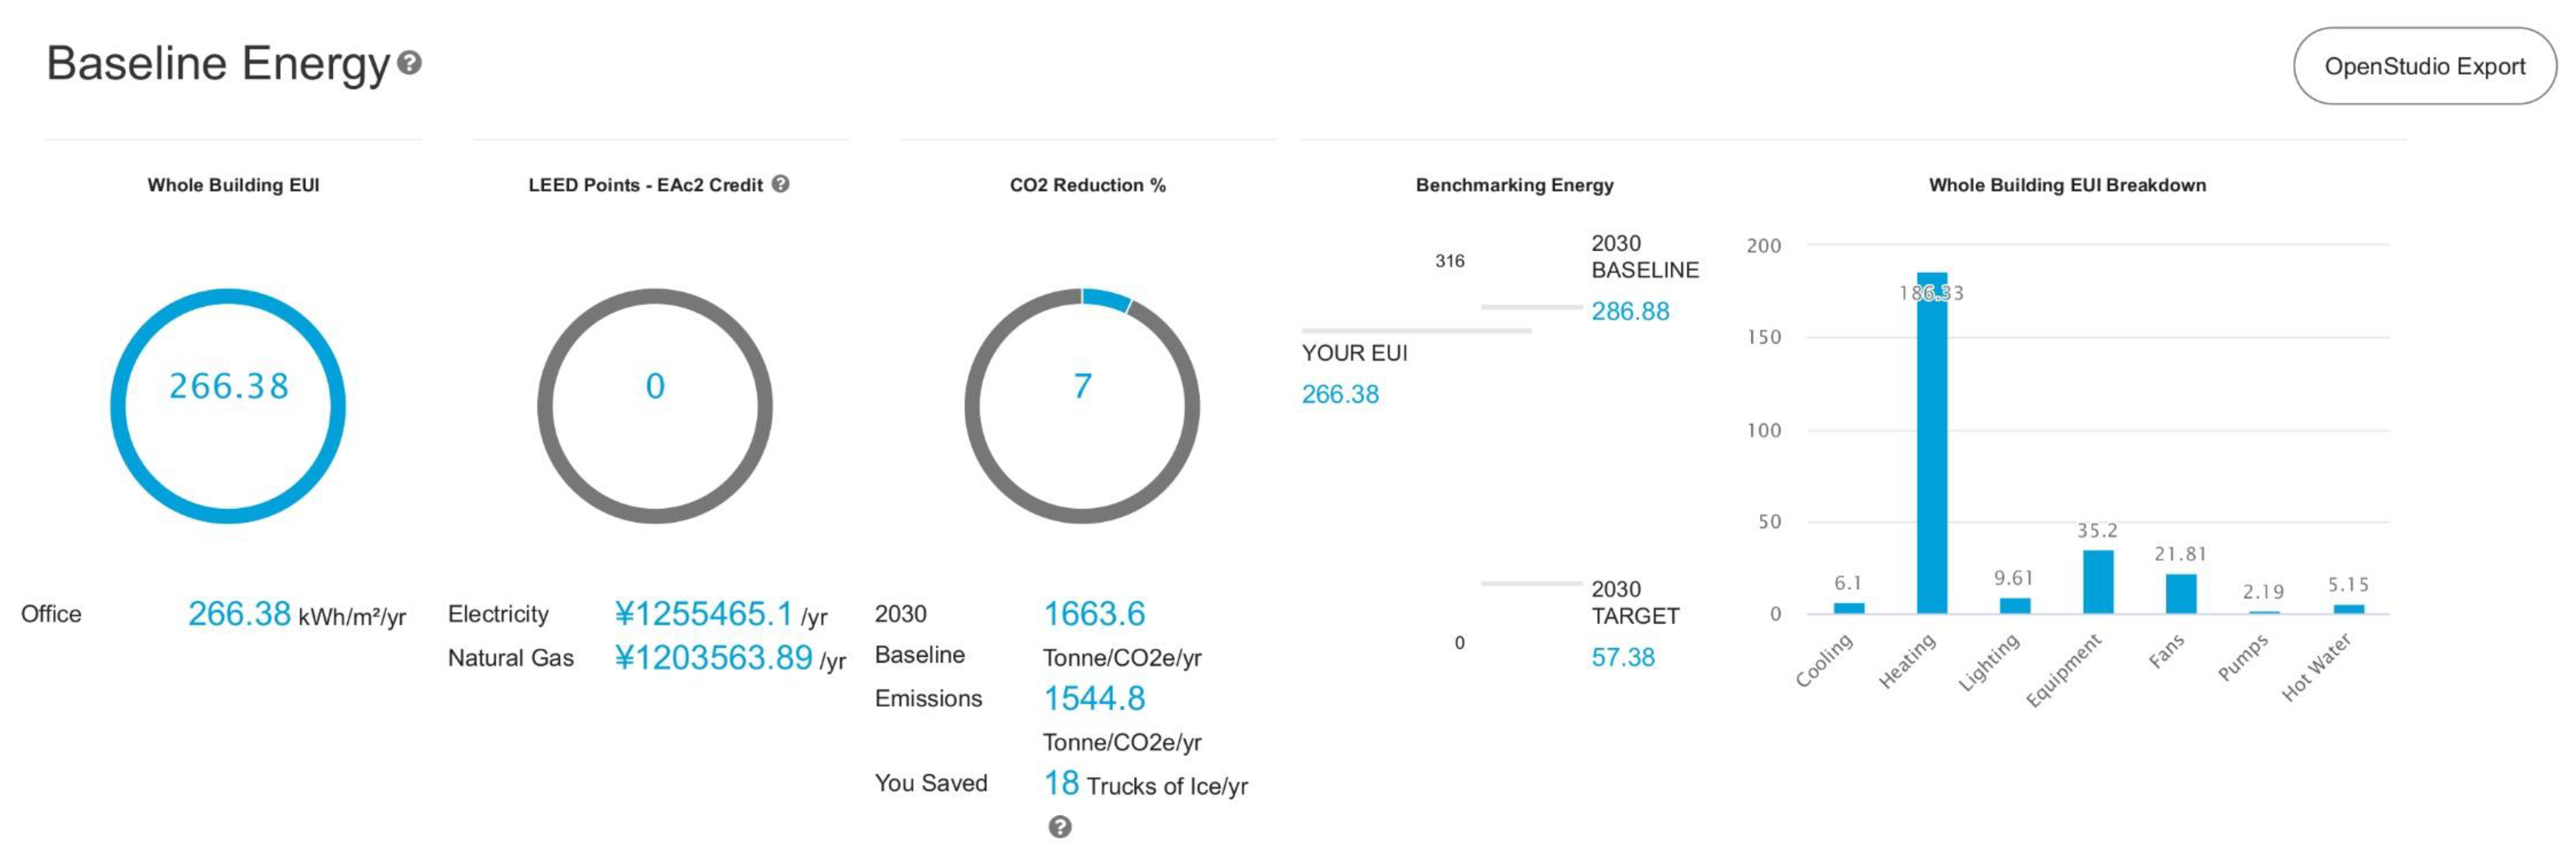
| 4 | A | mixed-humid | Xi’an | 8.32 | 6.10 | 6.36 | 156.52 | 186.33 | 184.18 | 18.62 | 9.61 | 9.61 | 35.20 | 35.20 | 19.82 | 23.03 | 22.95 | 2.19 | 2.19 | 5.15 | 5.15 | 245.82 | 267.61 | 265.64 |
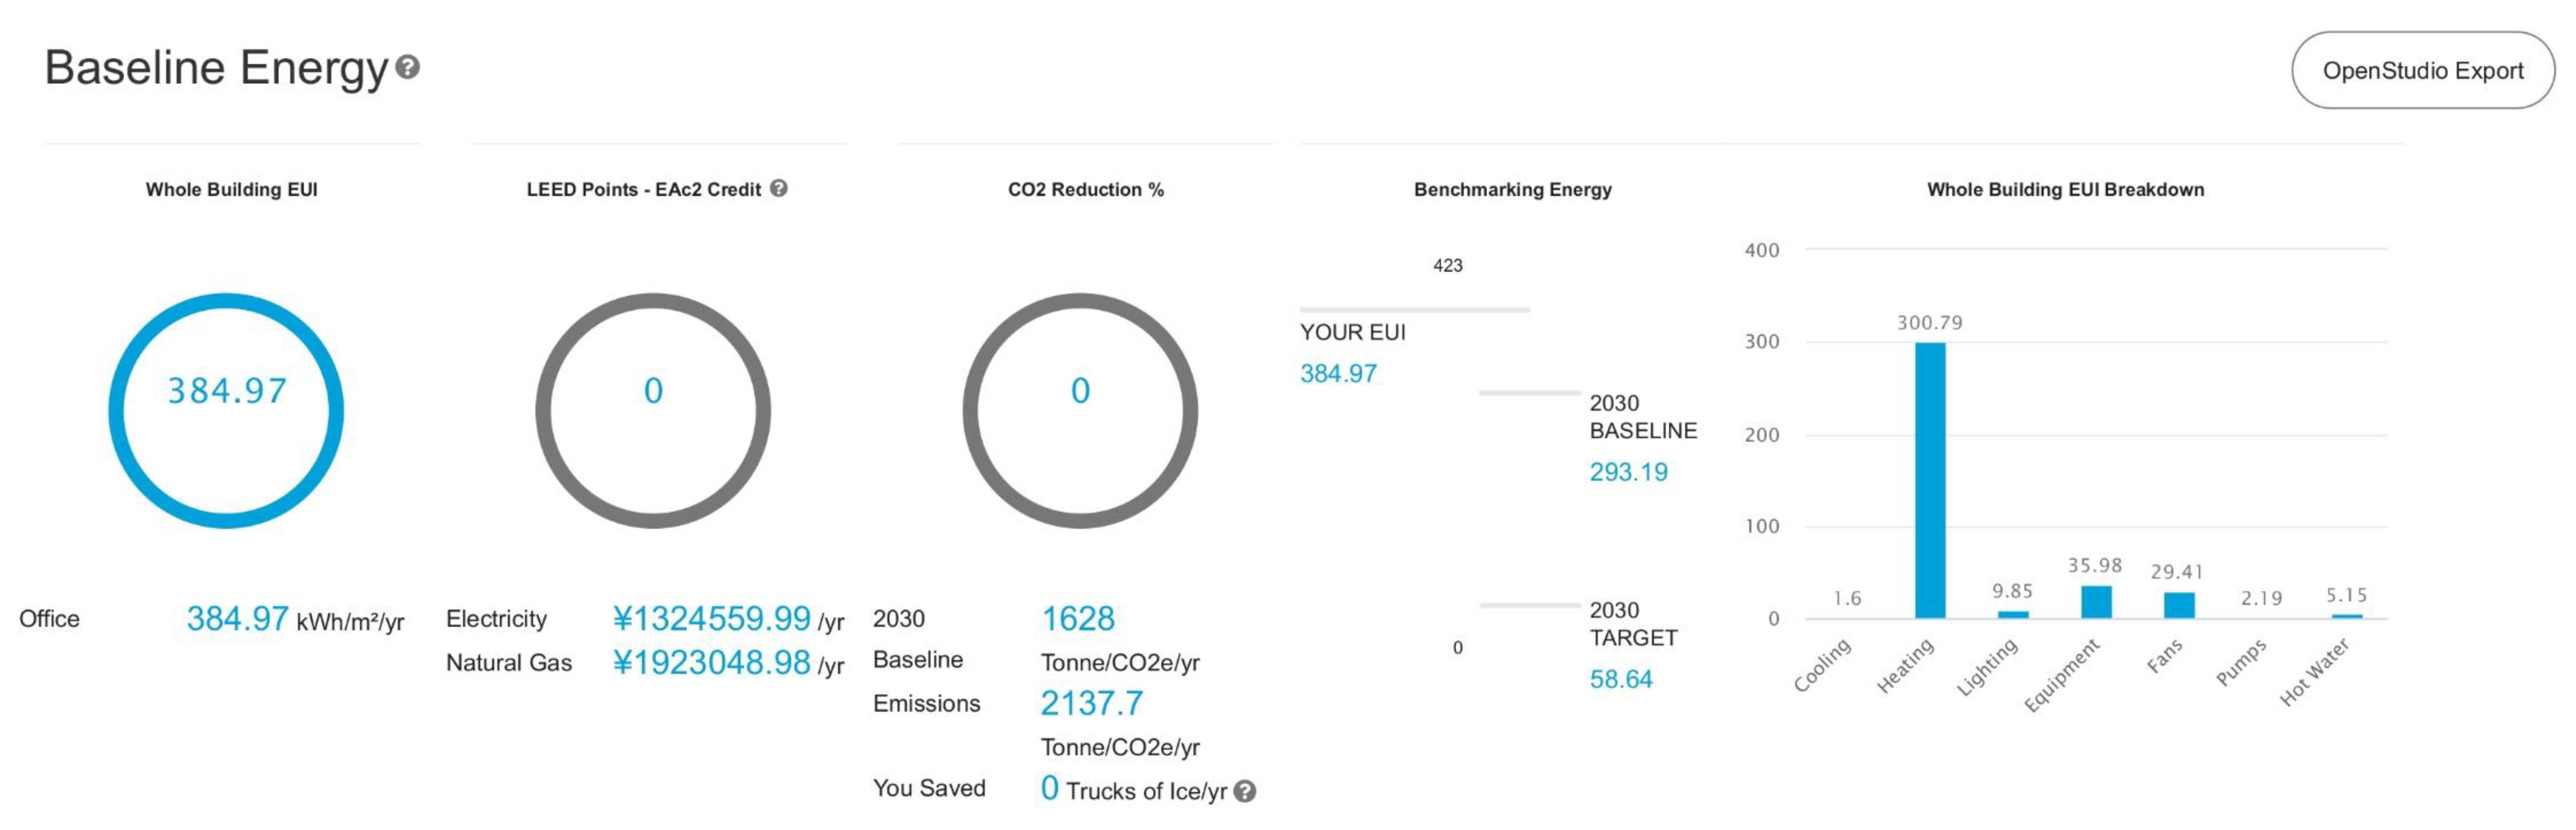
| B | mixed-dry | Beijing | 7.80 | 5.40 | 5.66 | 235.73 | 277.96 | 275.58 | 18.90 | 10.23 | 10.23 | 35.20 | 35.20 | 24.45 | 29.47 | 29.34 | 2.19 | 2.19 | 5.15 | 5.15 | 329.42 | 365.60 | 363.35 | |
| H | mixed-highland | Chamdo | 0.04 | 0.01 | 0.01 | 254.27 | 297.83 | 294.32 | 18.41 | 9.61 | 9.61 | 35.20 | 35.20 | 22.84 | 28.73 | 28.49 | 2.19 | 2.19 | 5.15 | 5.15 | 338.10 | 378.72 | 374.97 | |
| 5 | A | cool-humid | Shenyang | 5.26 | 3.38 | 3.58 | 391.62 | 484.74 | 481.86 | 19.34 | 10.58 | 10.58 | 35.20 | 35.20 | 31.43 | 44.24 | 44.07 | 2.19 | 2.19 | 5.15 | 5.15 | 490.19 | 585.48 | 582.63 |
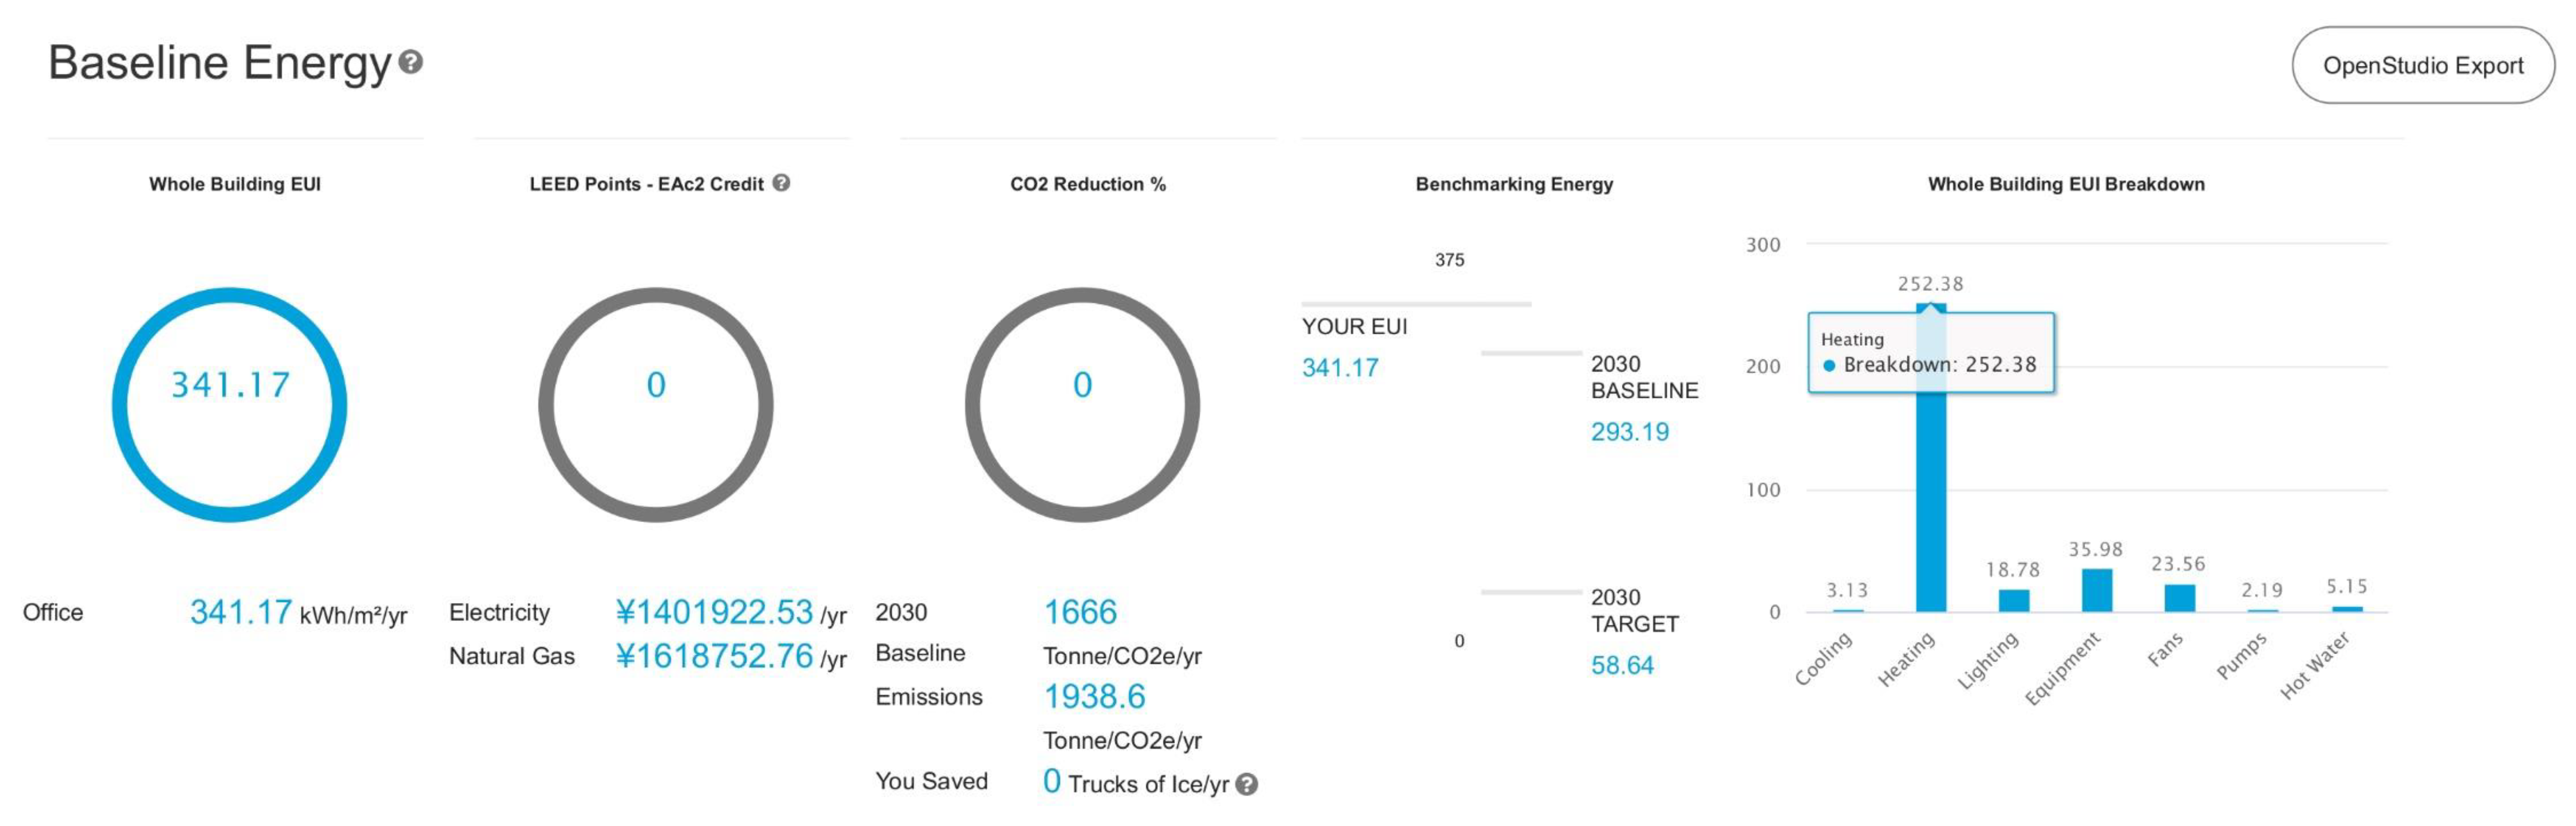
| B | cool-dry | Lanzhou | 3.13 | 1.44 | 1.60 | 252.38 | 303.53 | 300.79 | 18.78 | 9.85 | 9.85 | 35.20 | 35.20 | 23.56 | 30.80 | 30.63 | 2.19 | 2.19 | 5.15 | 5.15 | 340.39 | 388.16 | 385.41 | |
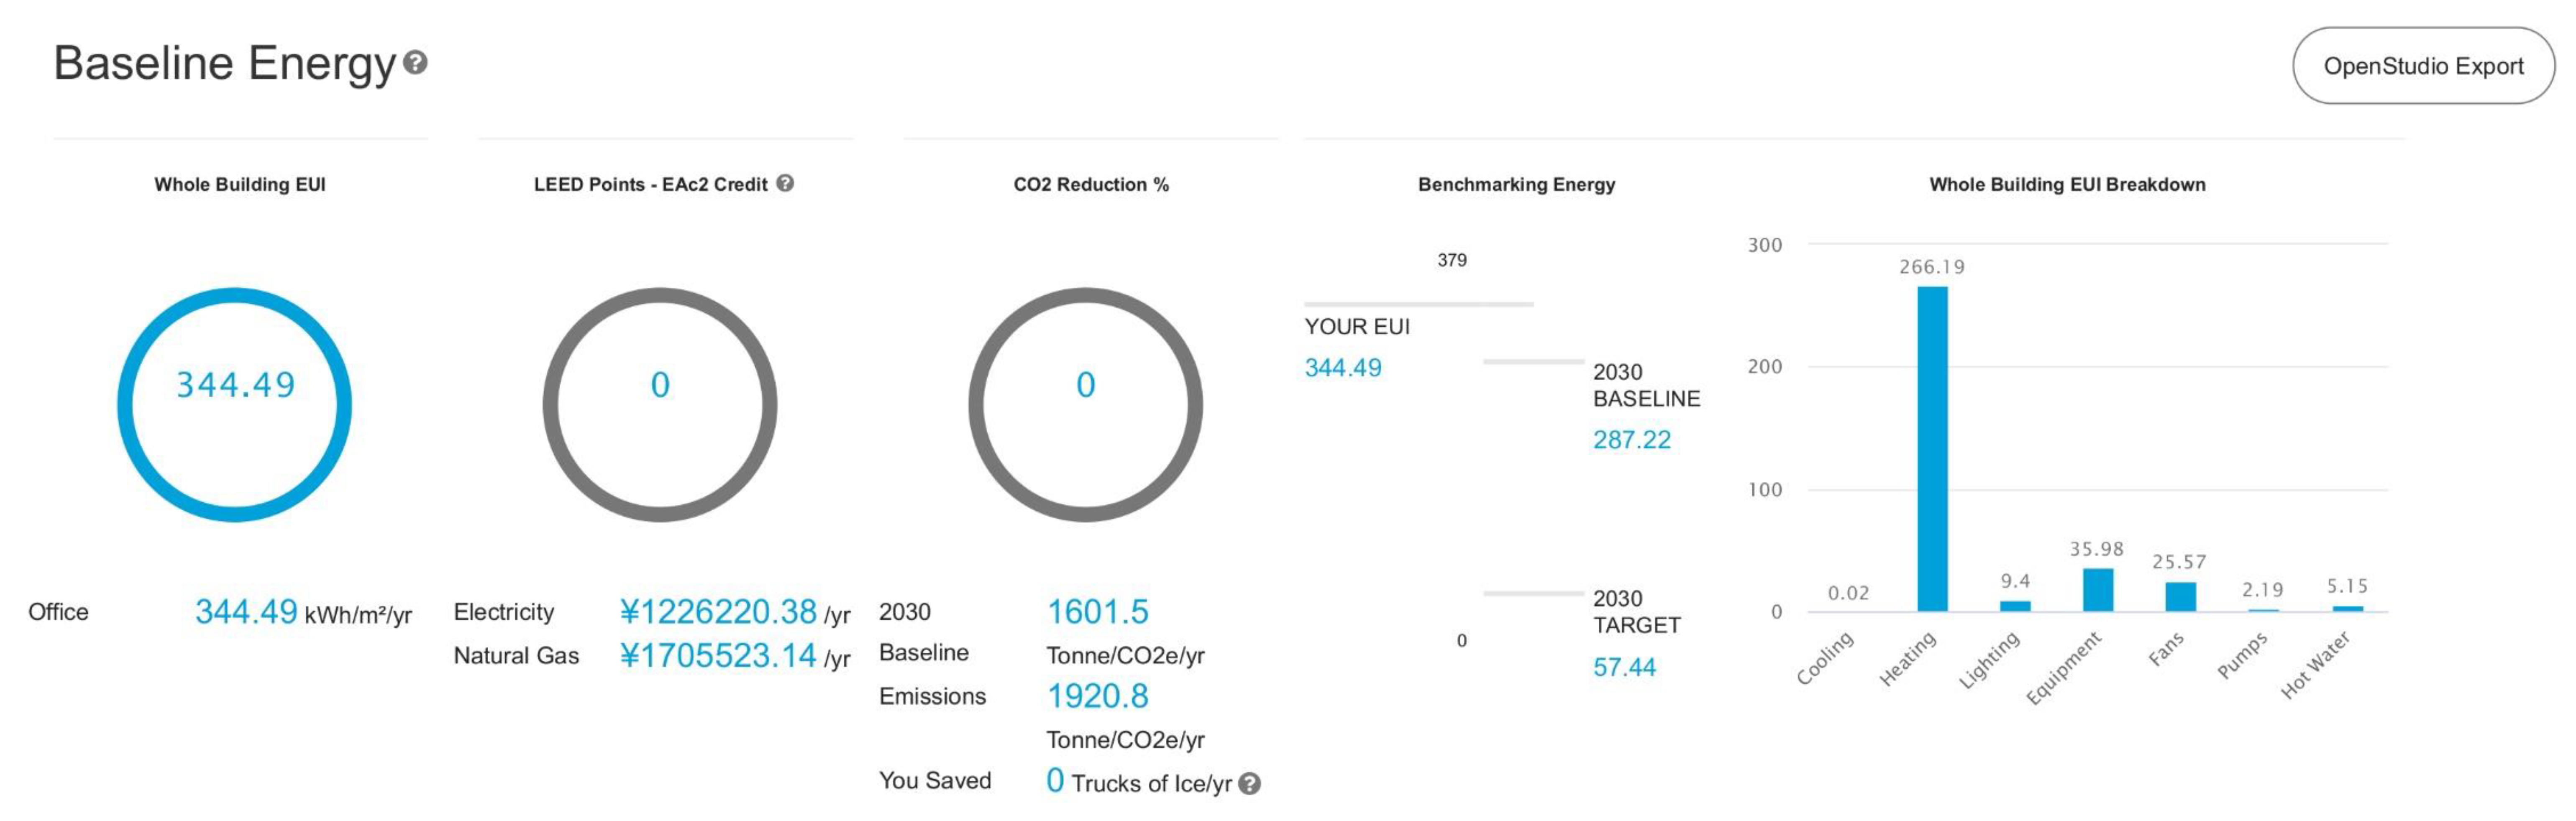
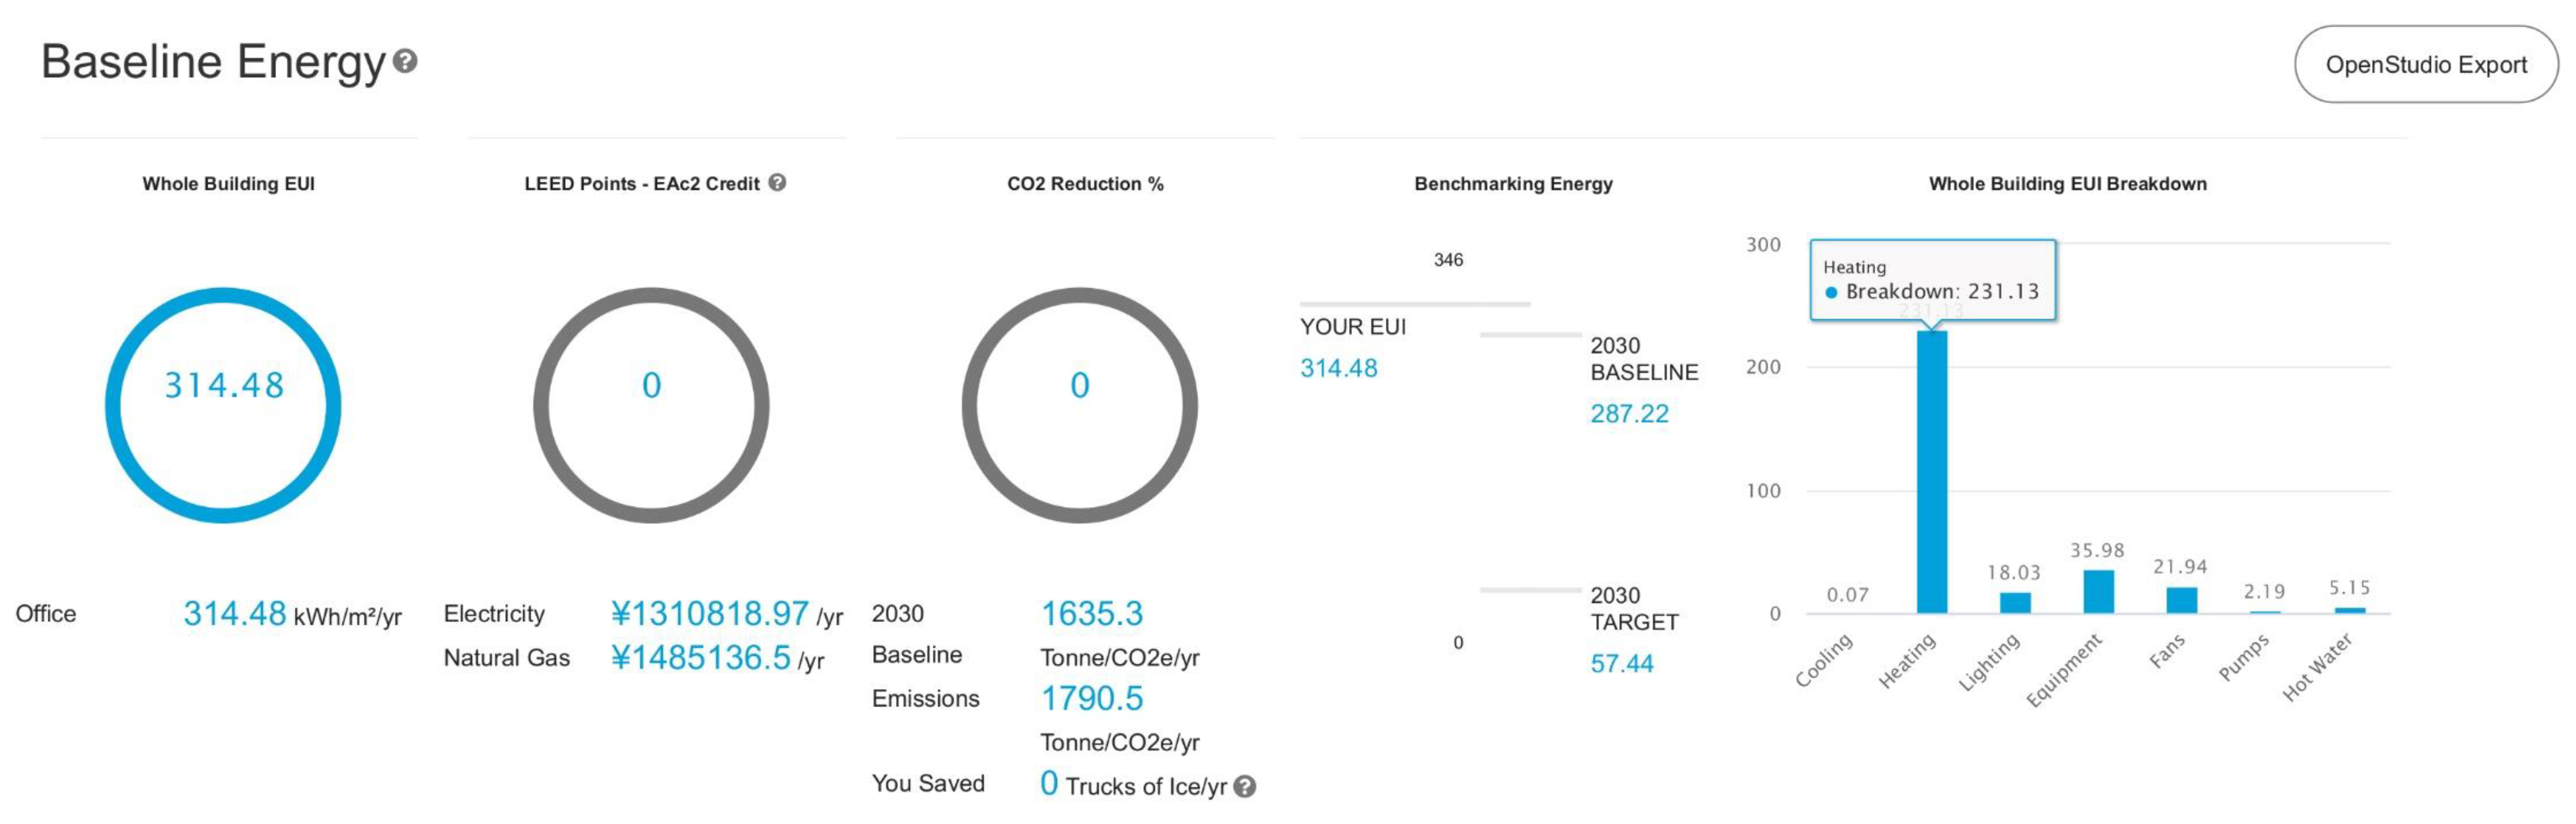
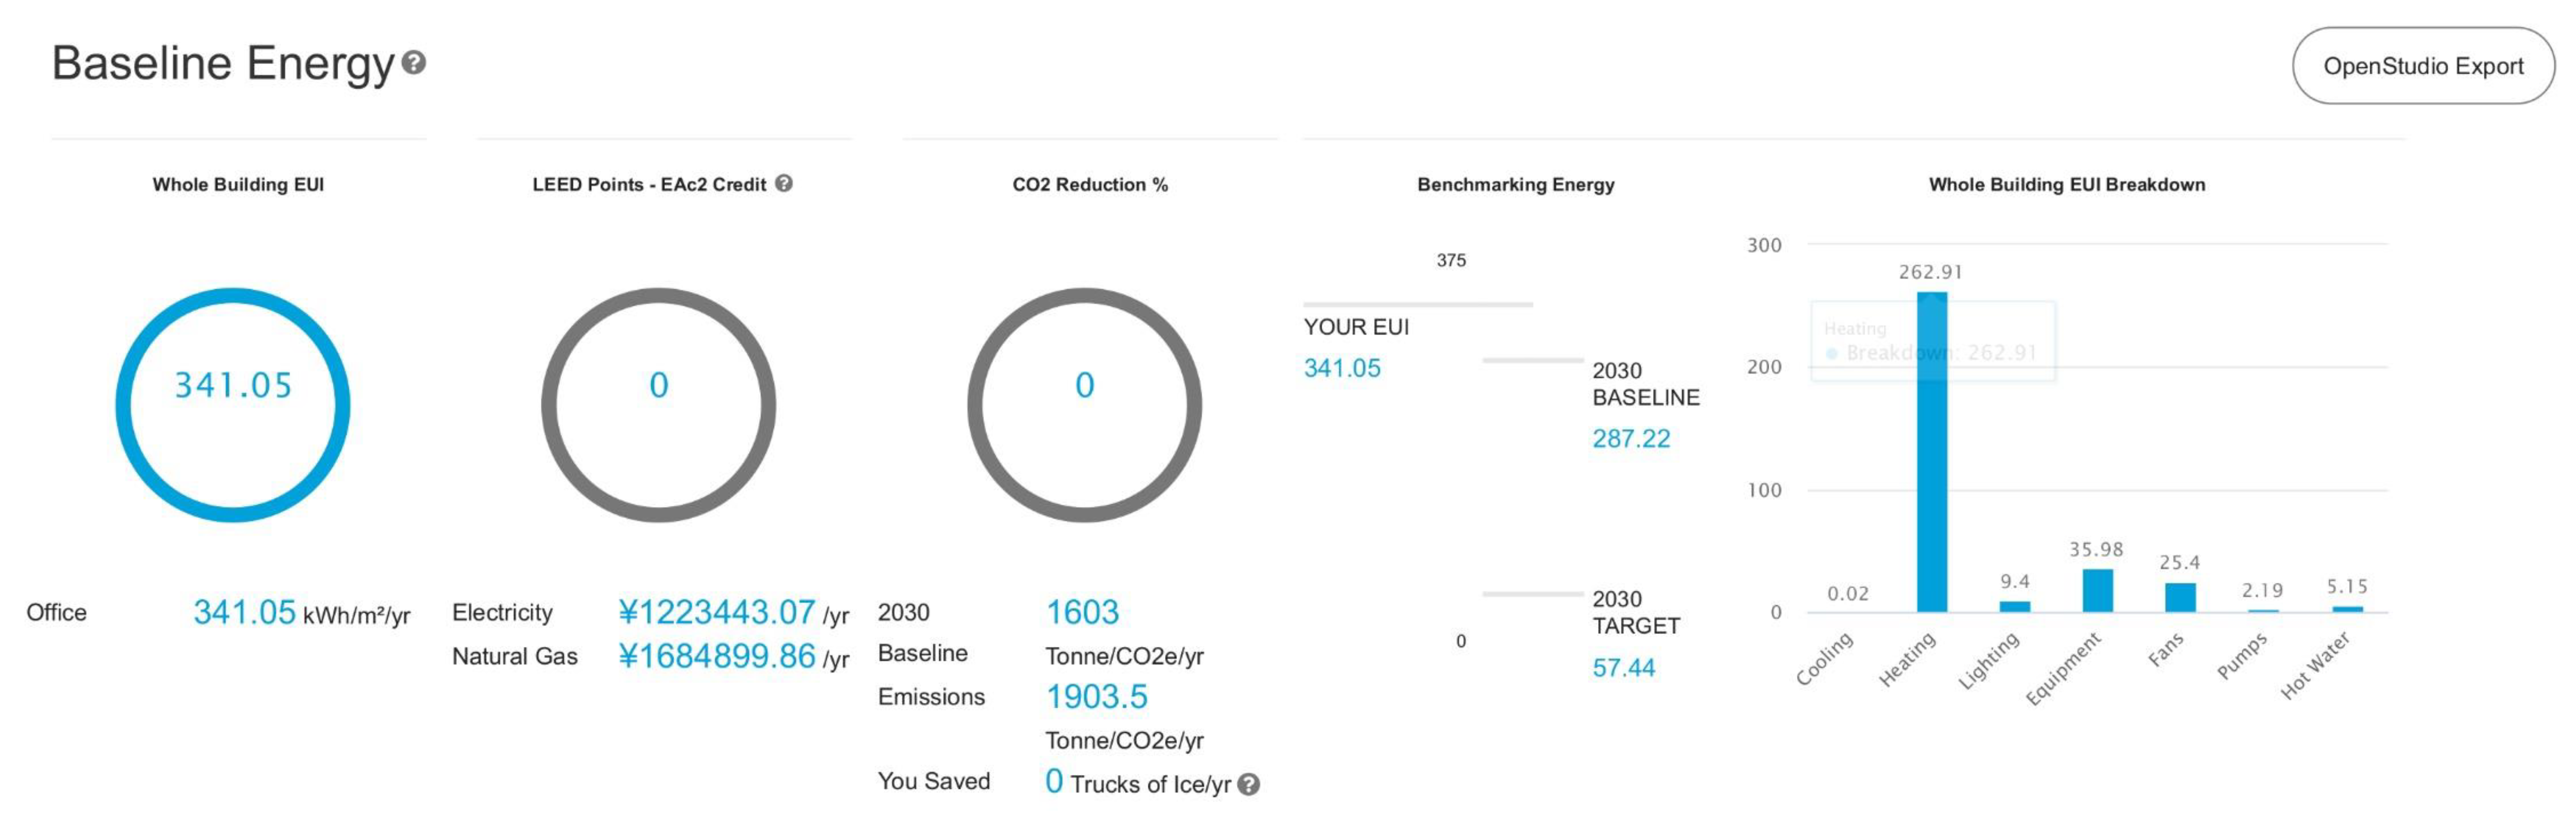
| H | cool-highland | Lhasa | 0.07 | 0.02 | 0.02 | 231.13 | 266.19 | 262.91 | 18.03 | 9.4 | 9.4 | 35.20 | 35.20 | 21.94 | 26.79 | 26.62 | 2.19 | 2.19 | 5.15 | 5.15 | 313.71 | 344.94 | 341.49 | |
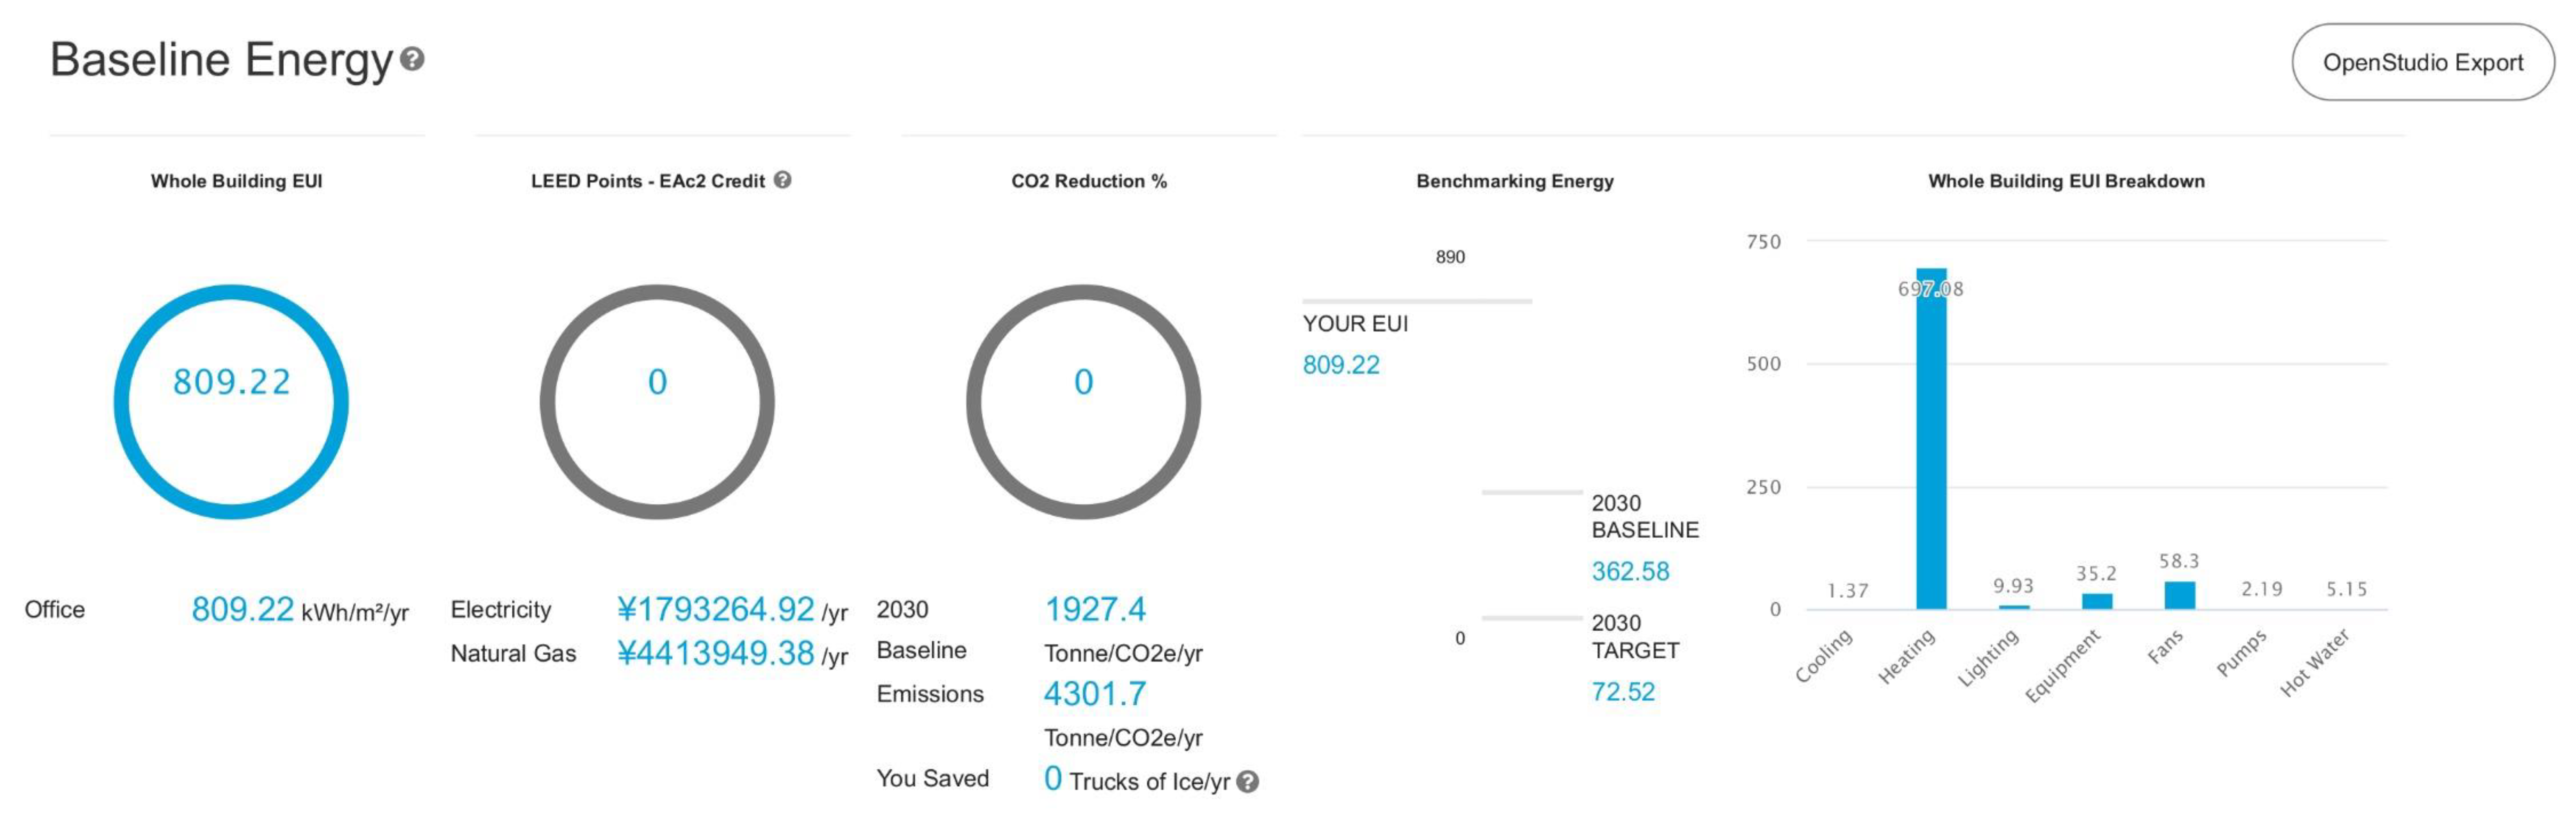
| 6 | A | cold-humid | Changchun | 2.84 | 1.37 | 1.51 | 583.78 | 697.08 | 694.05 | 18.83 | 9.93 | 9.93 | 35.20 | 35.20 | 42.04 | 59.52 | 59.29 | 2.19 | 2.19 | 5.15 | 5.15 | 690.03 | 810.44 | 807.32 |
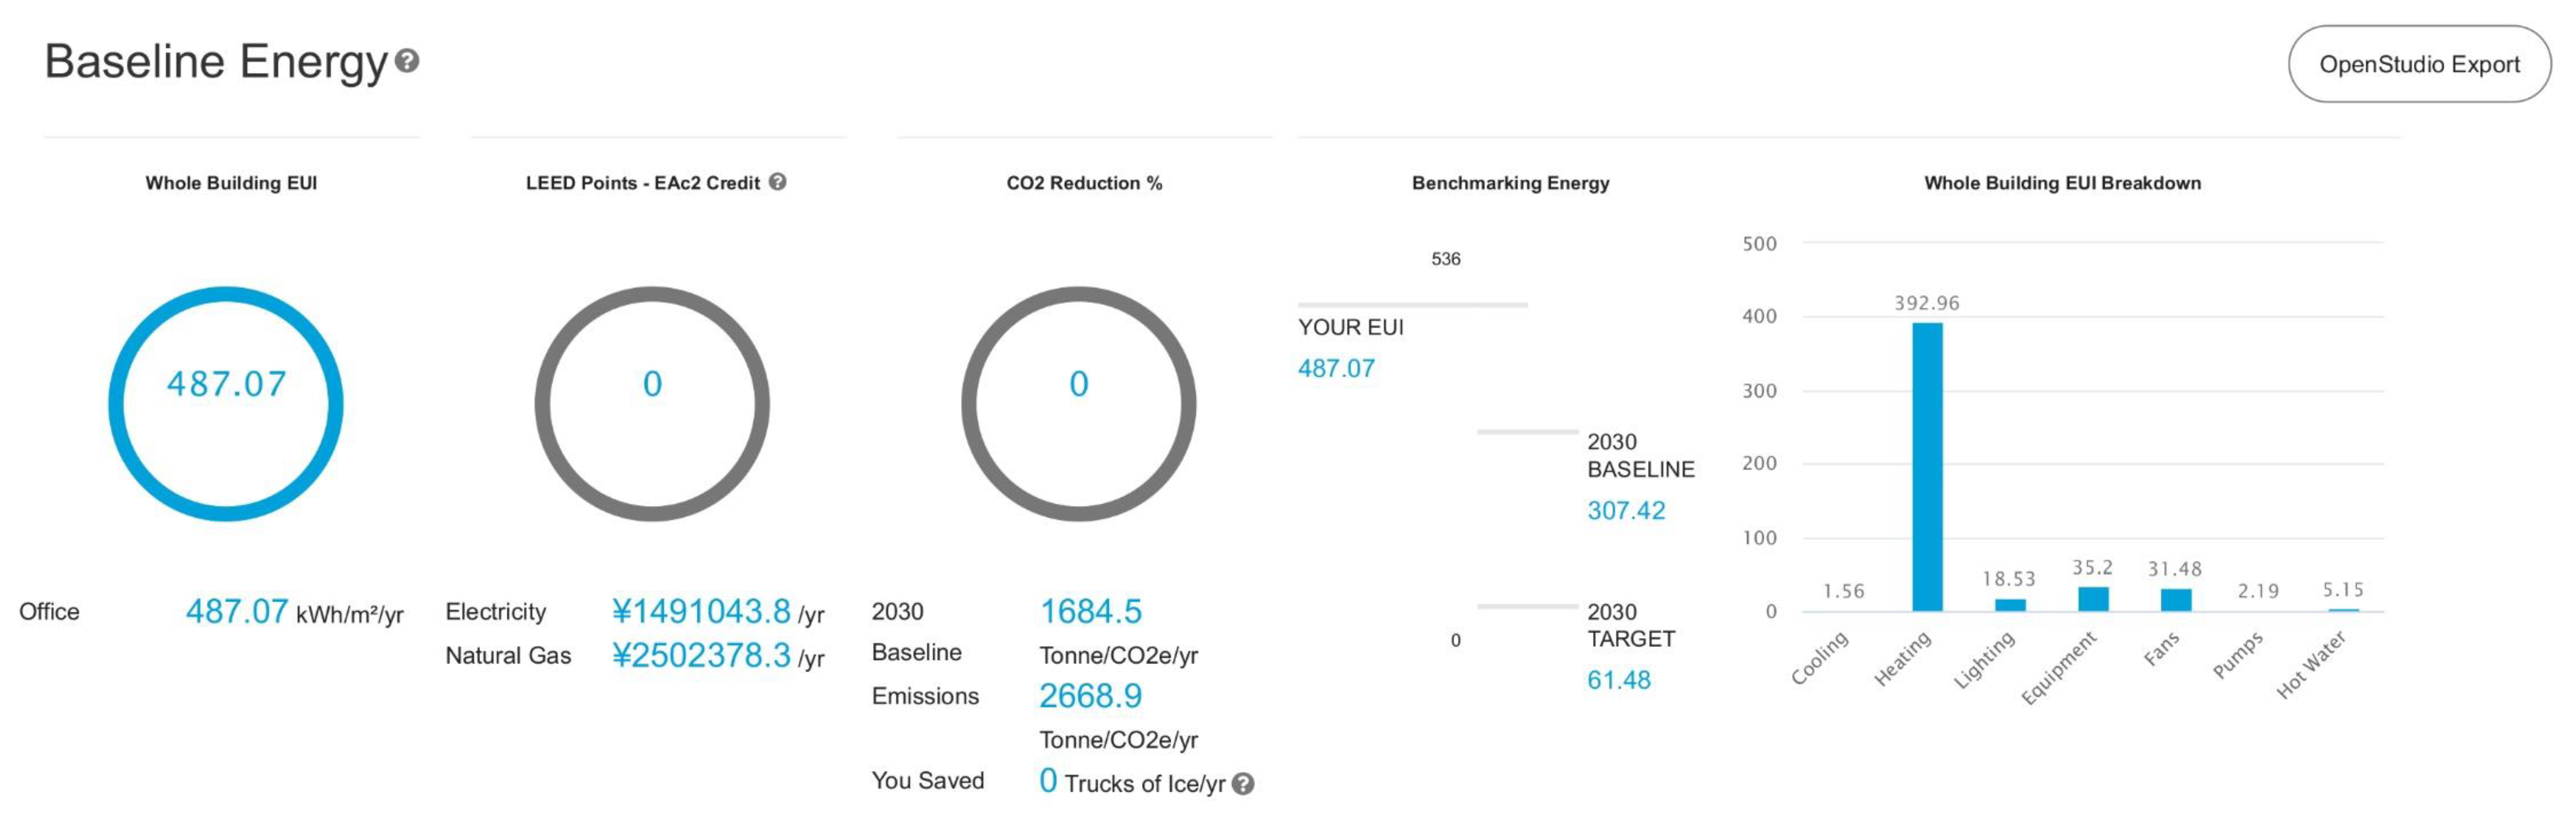
| B | cold-dry | Ordos | 1.56 | 0.62 | 0.7 | 392.96 | 460.93 | 457.8 | 18.53 | 9.6 | 9.6 | 35.20 | 35.20 | 31.48 | 41.41 | 41.18 | 2.19 | 2.19 | 5.15 | 5.15 | 487.07 | 555.10 | 551.82 | |
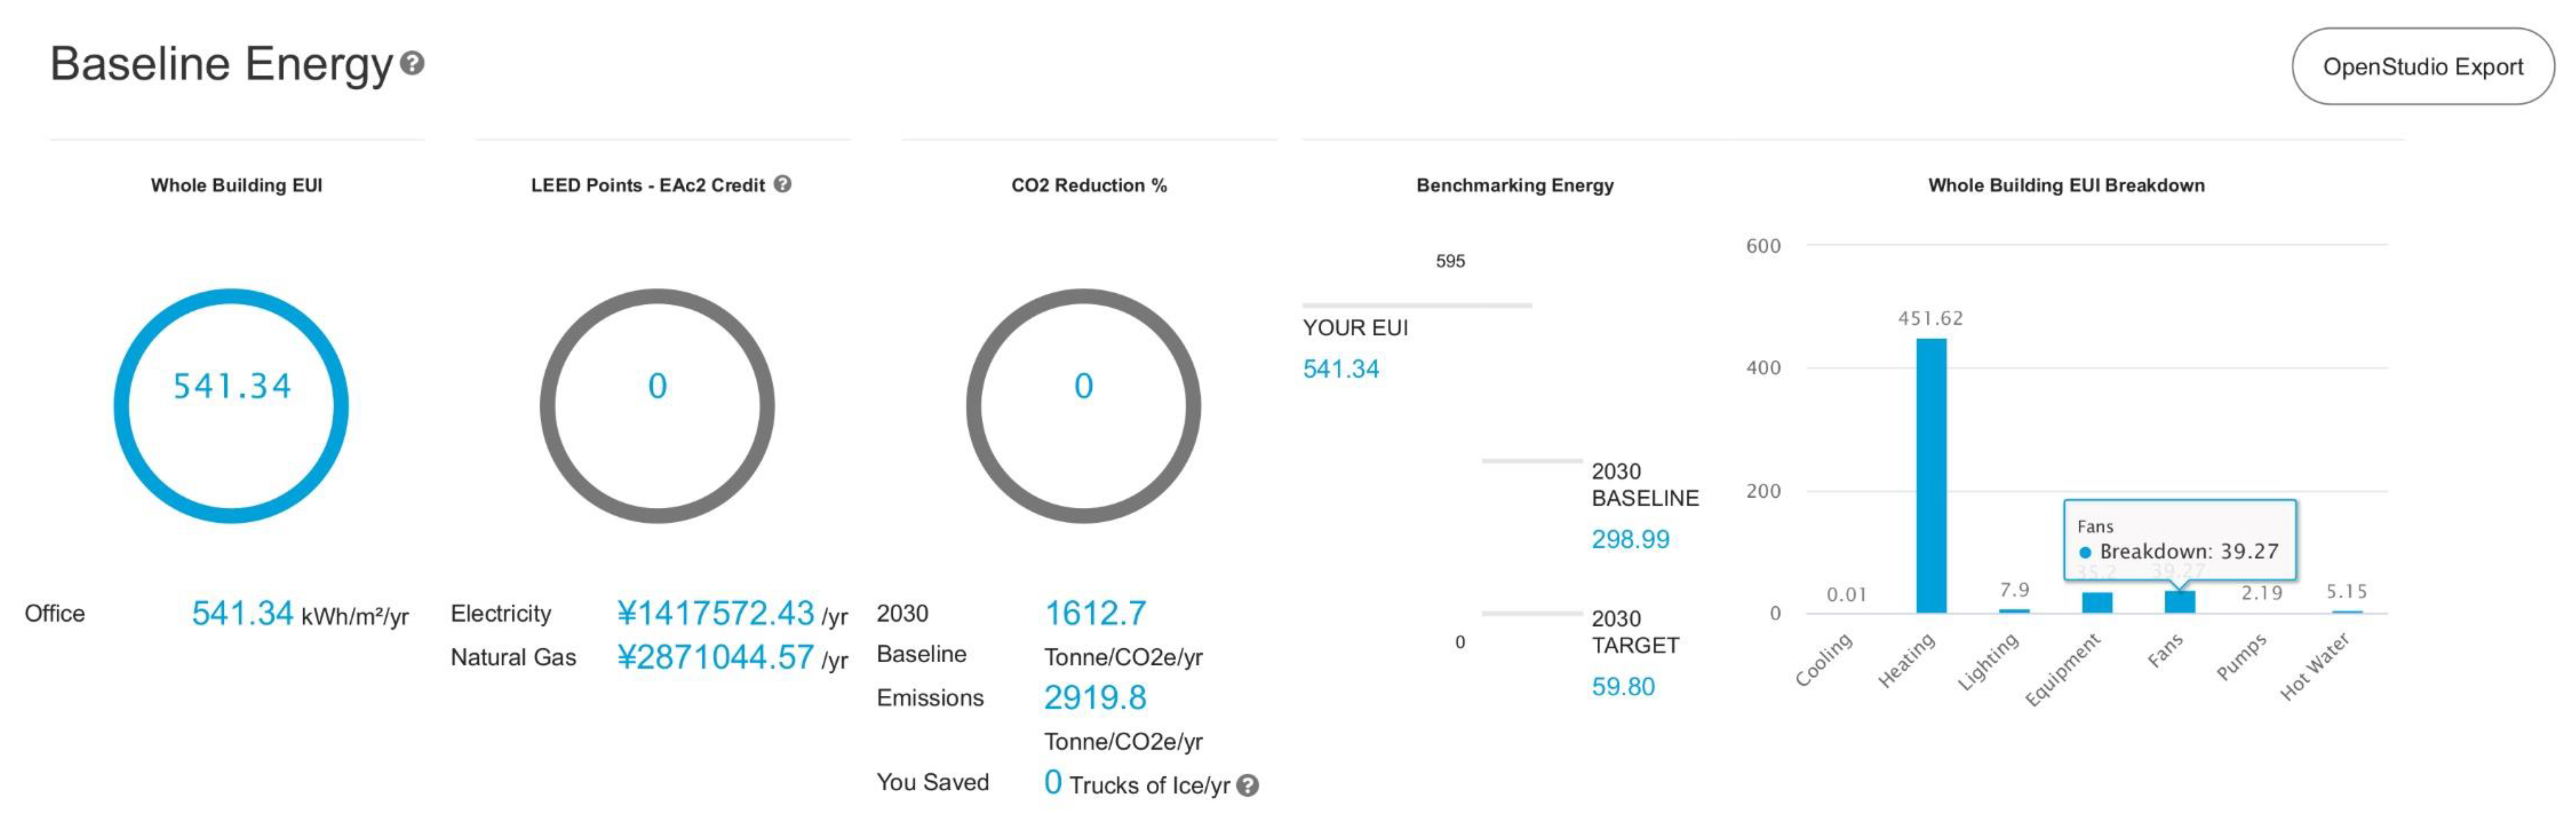
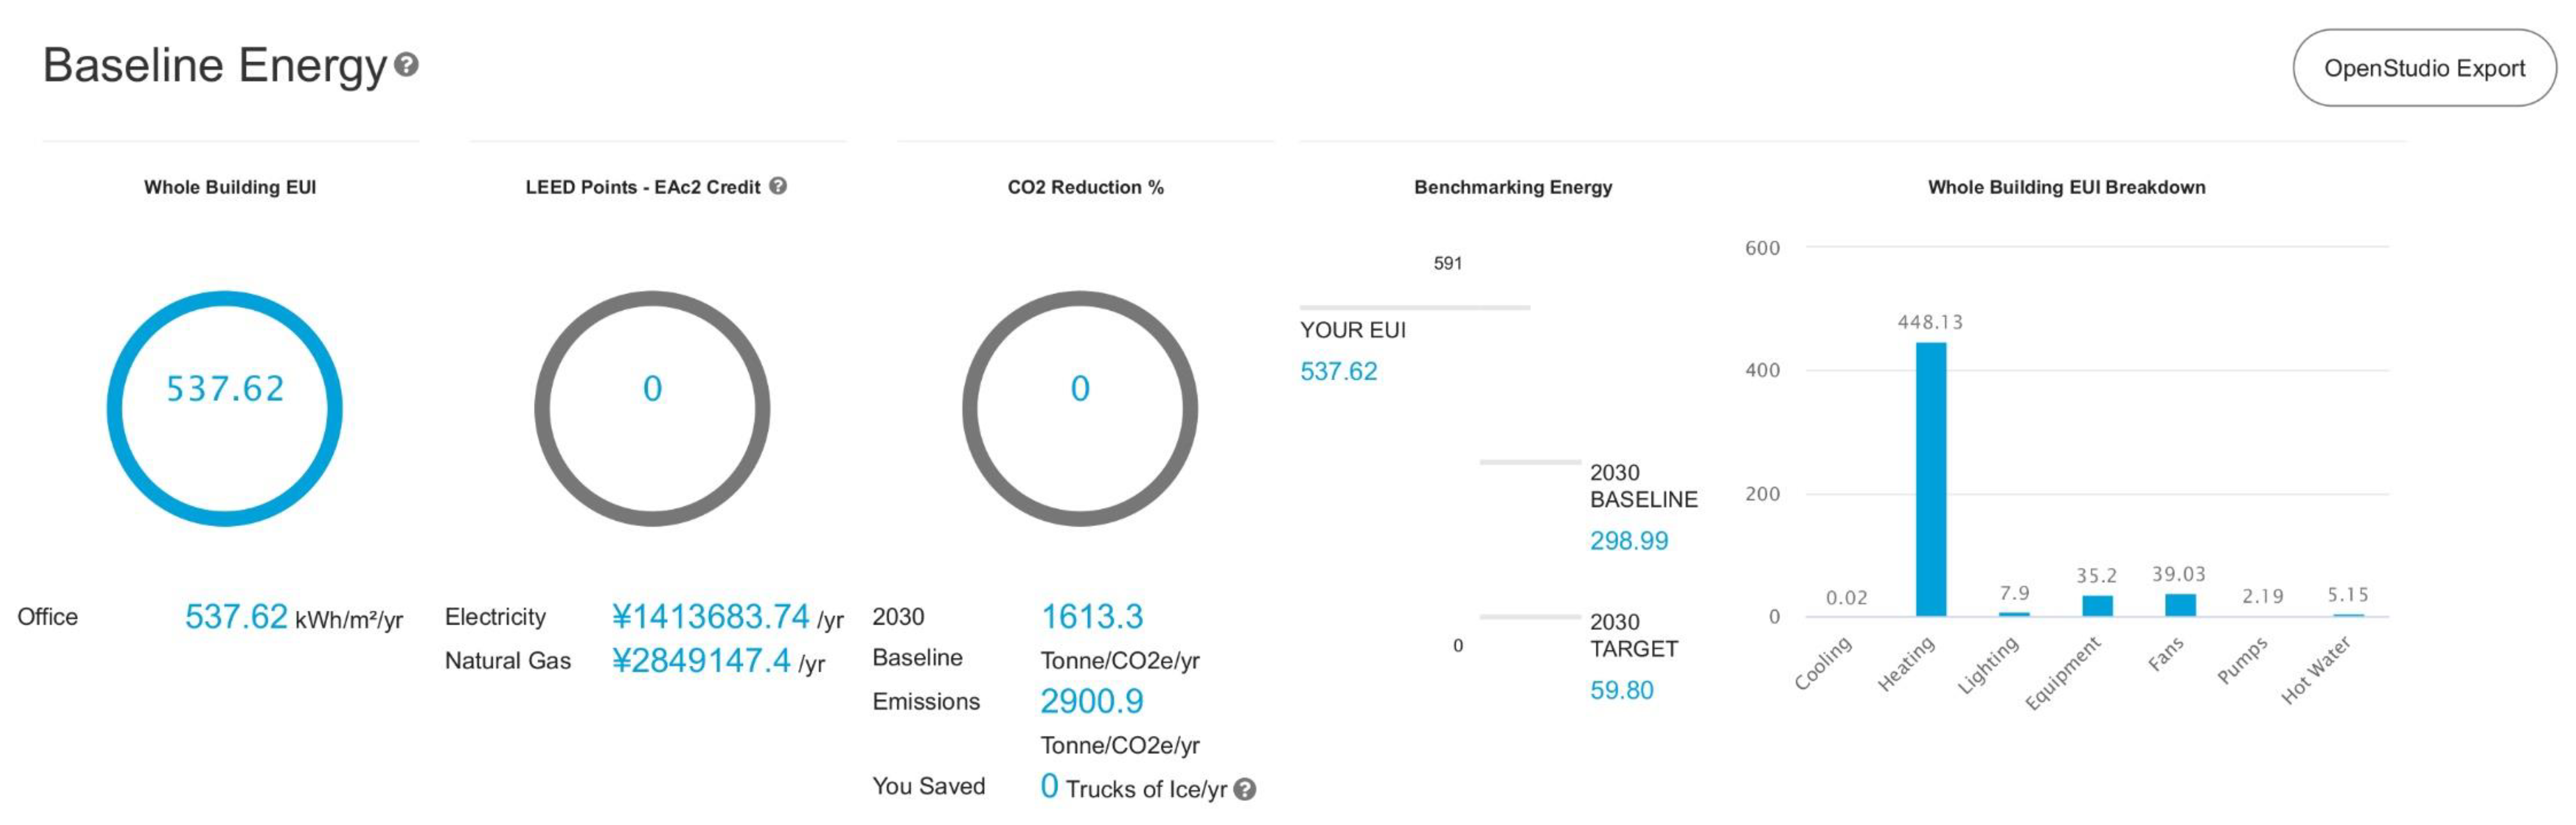
| H | cold-highland | Xi’ning | 0.07 | 0.01 | 0.02 | 393.07 | 451.62 | 448.13 | 18.2 | 7.9 | 7.9 | 35.20 | 35.20 | 32.11 | 40.49 | 40.25 | 2.19 | 2.19 | 5.15 | 5.15 | 485.99 | 542.56 | 538.84 | |
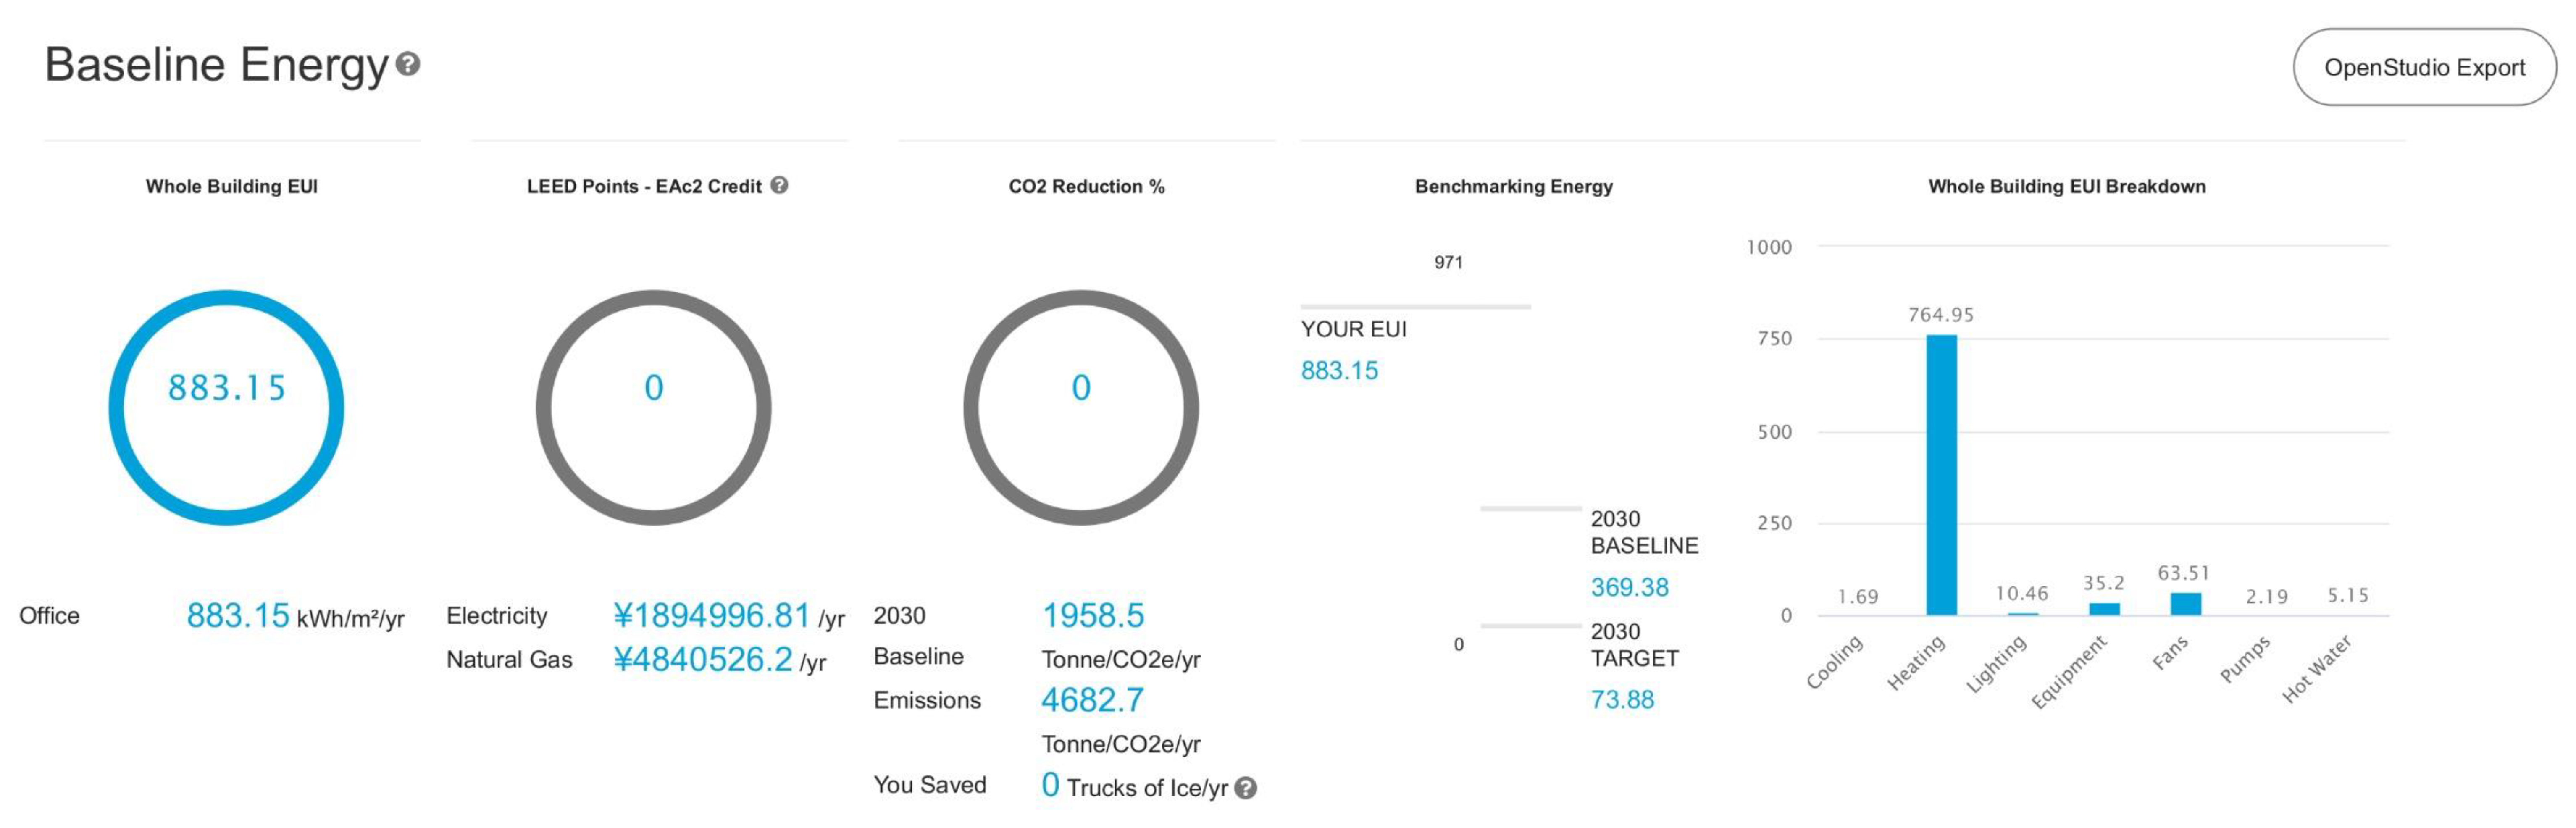
| 7 | - | very cold | Harbin | 3.16 | 1.54 | 1.69 | 646.59 | 768 | 764.95 | 18.92 | 10.46 | 10.46 | 35.20 | 35.20 | 45.57 | 64.97 | 64.73 | 2.19 | 2.19 | 5.15 | 5.15 | 756.78 | 887.51 | 884.37 |
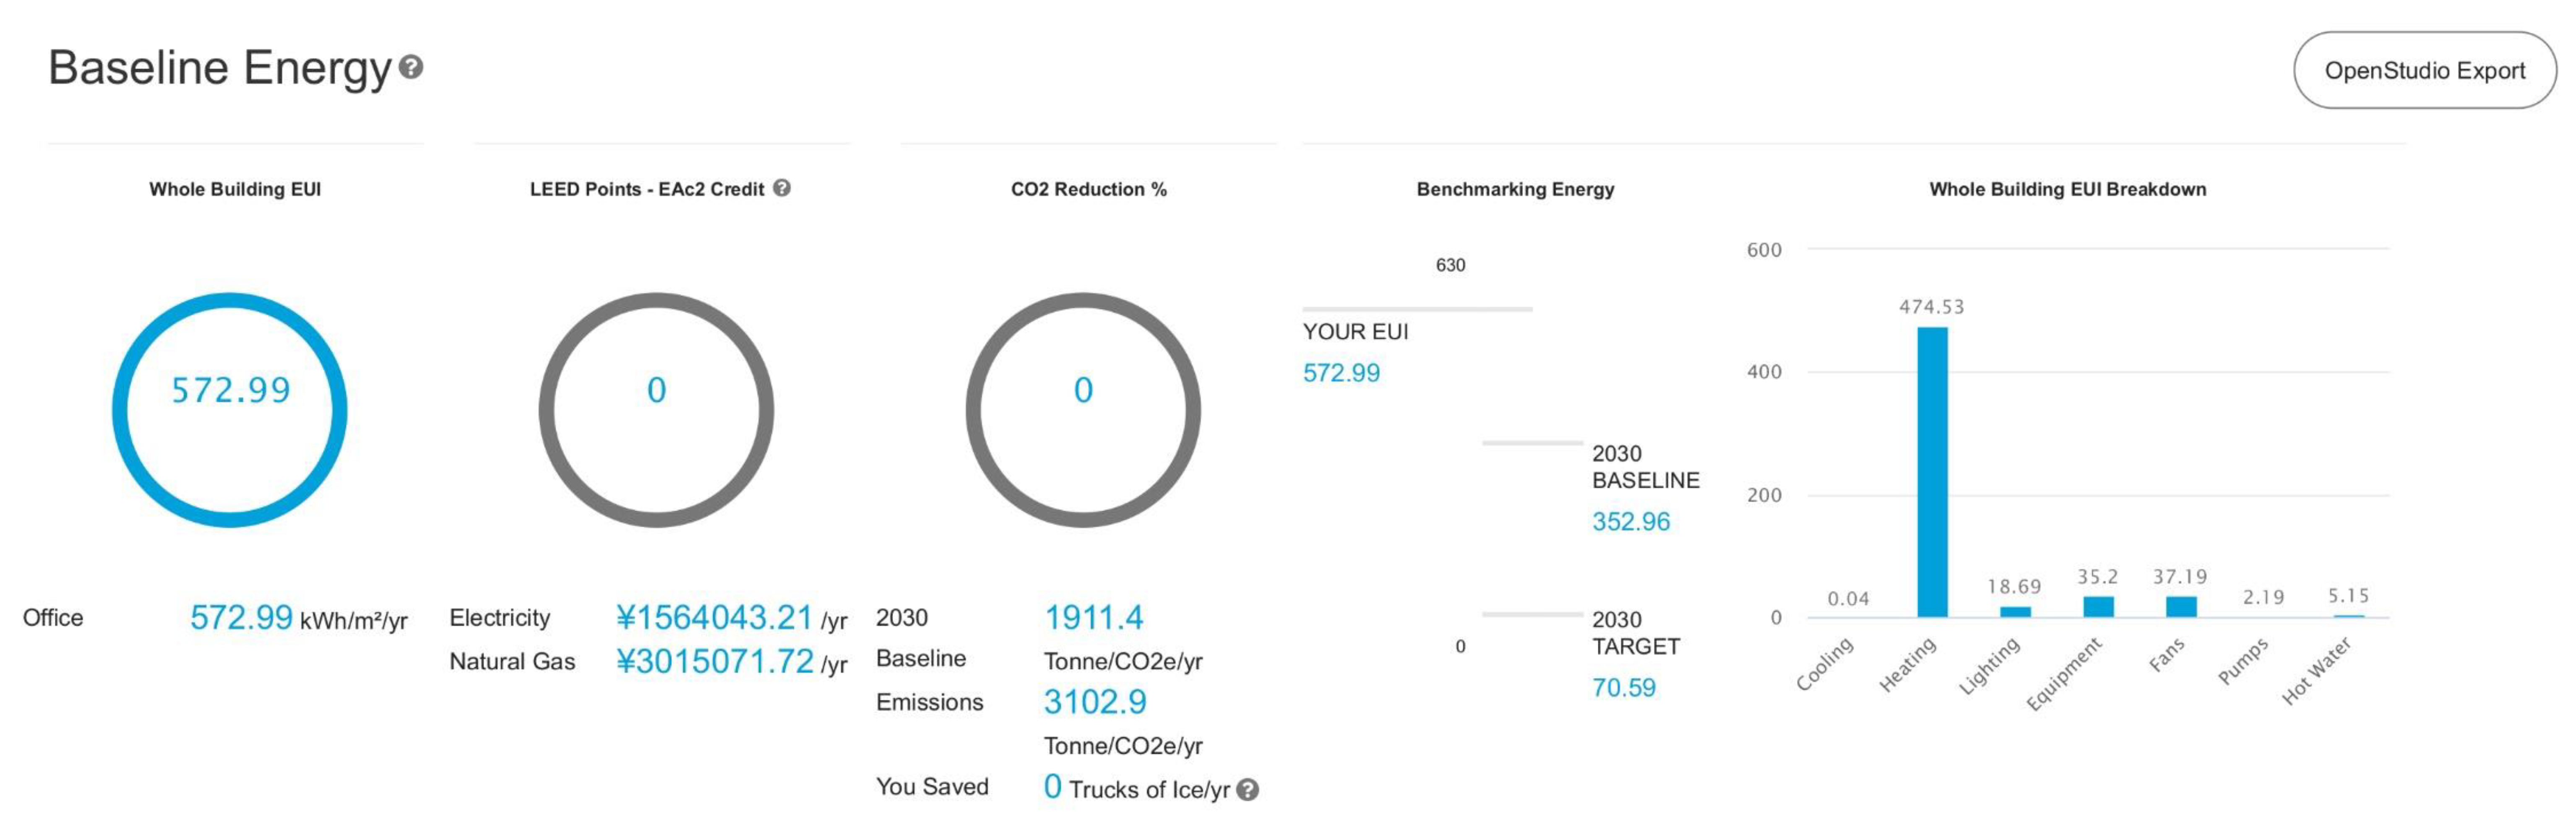
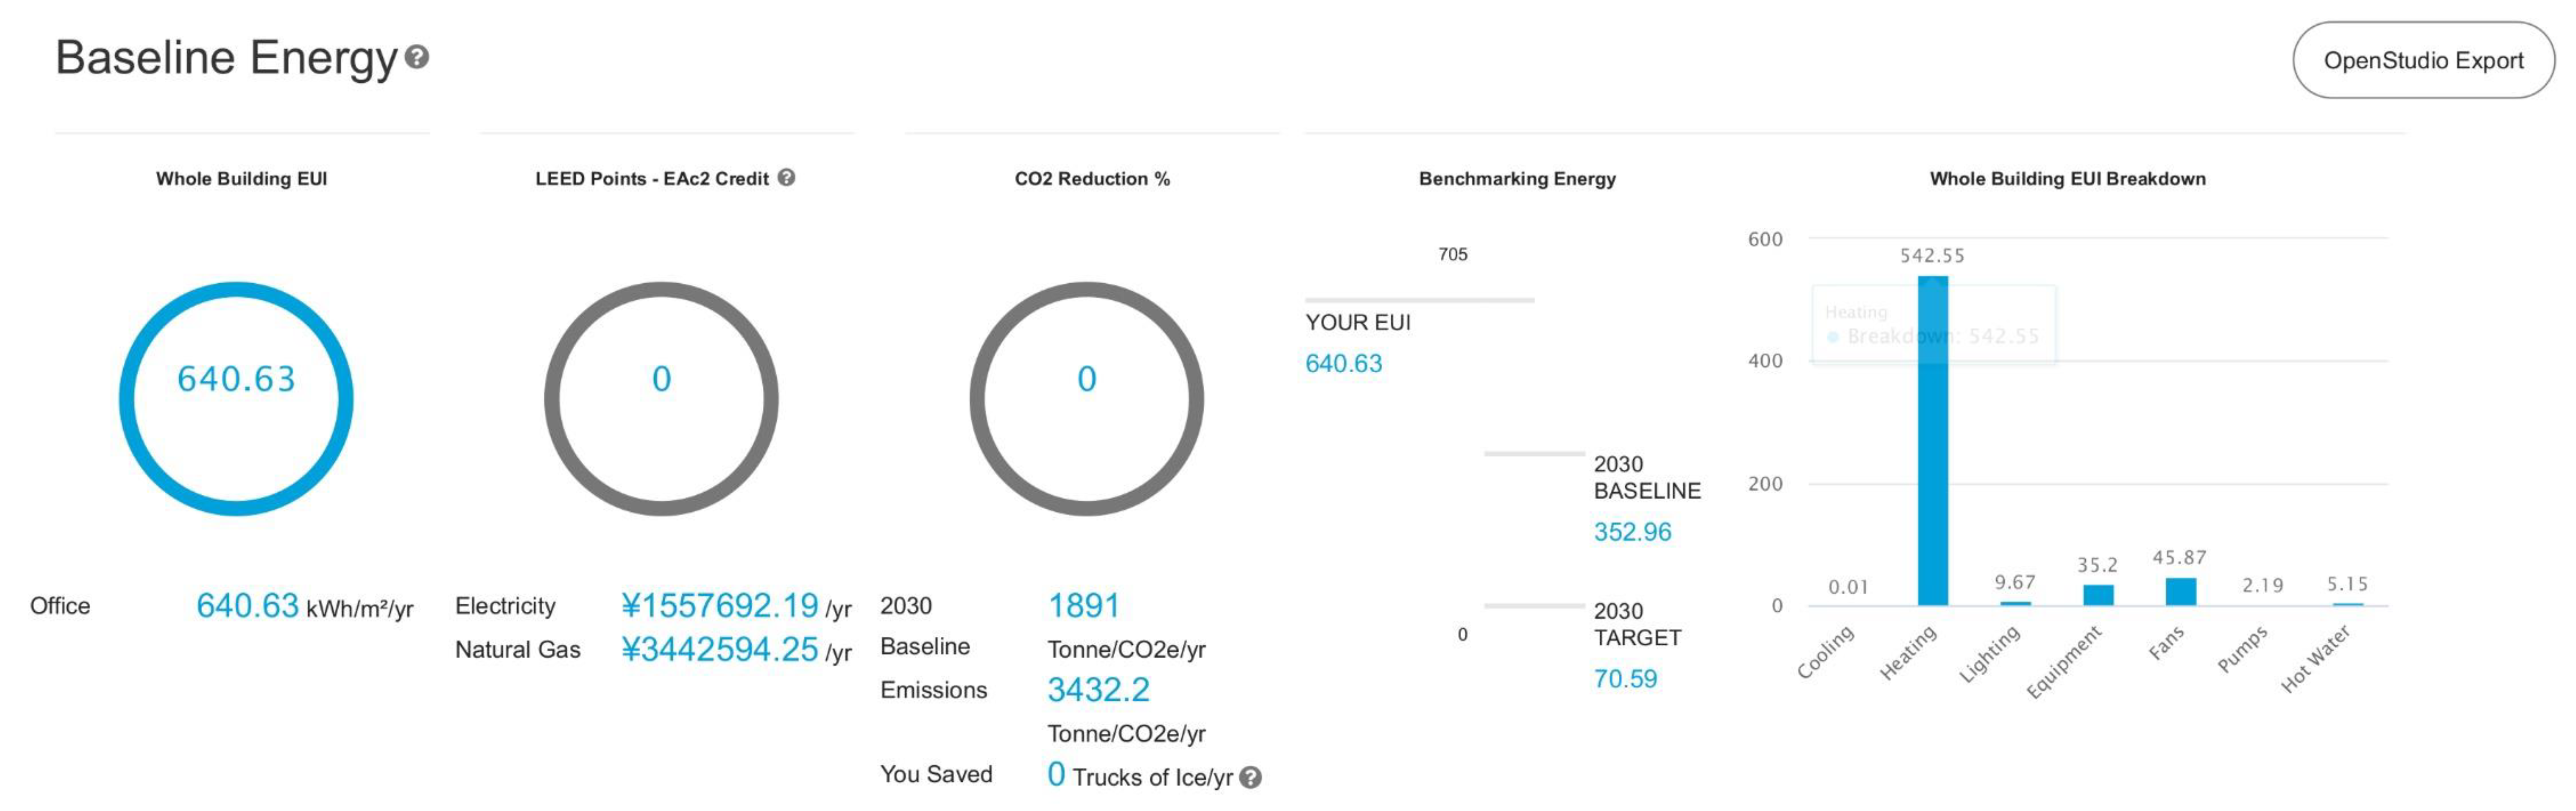
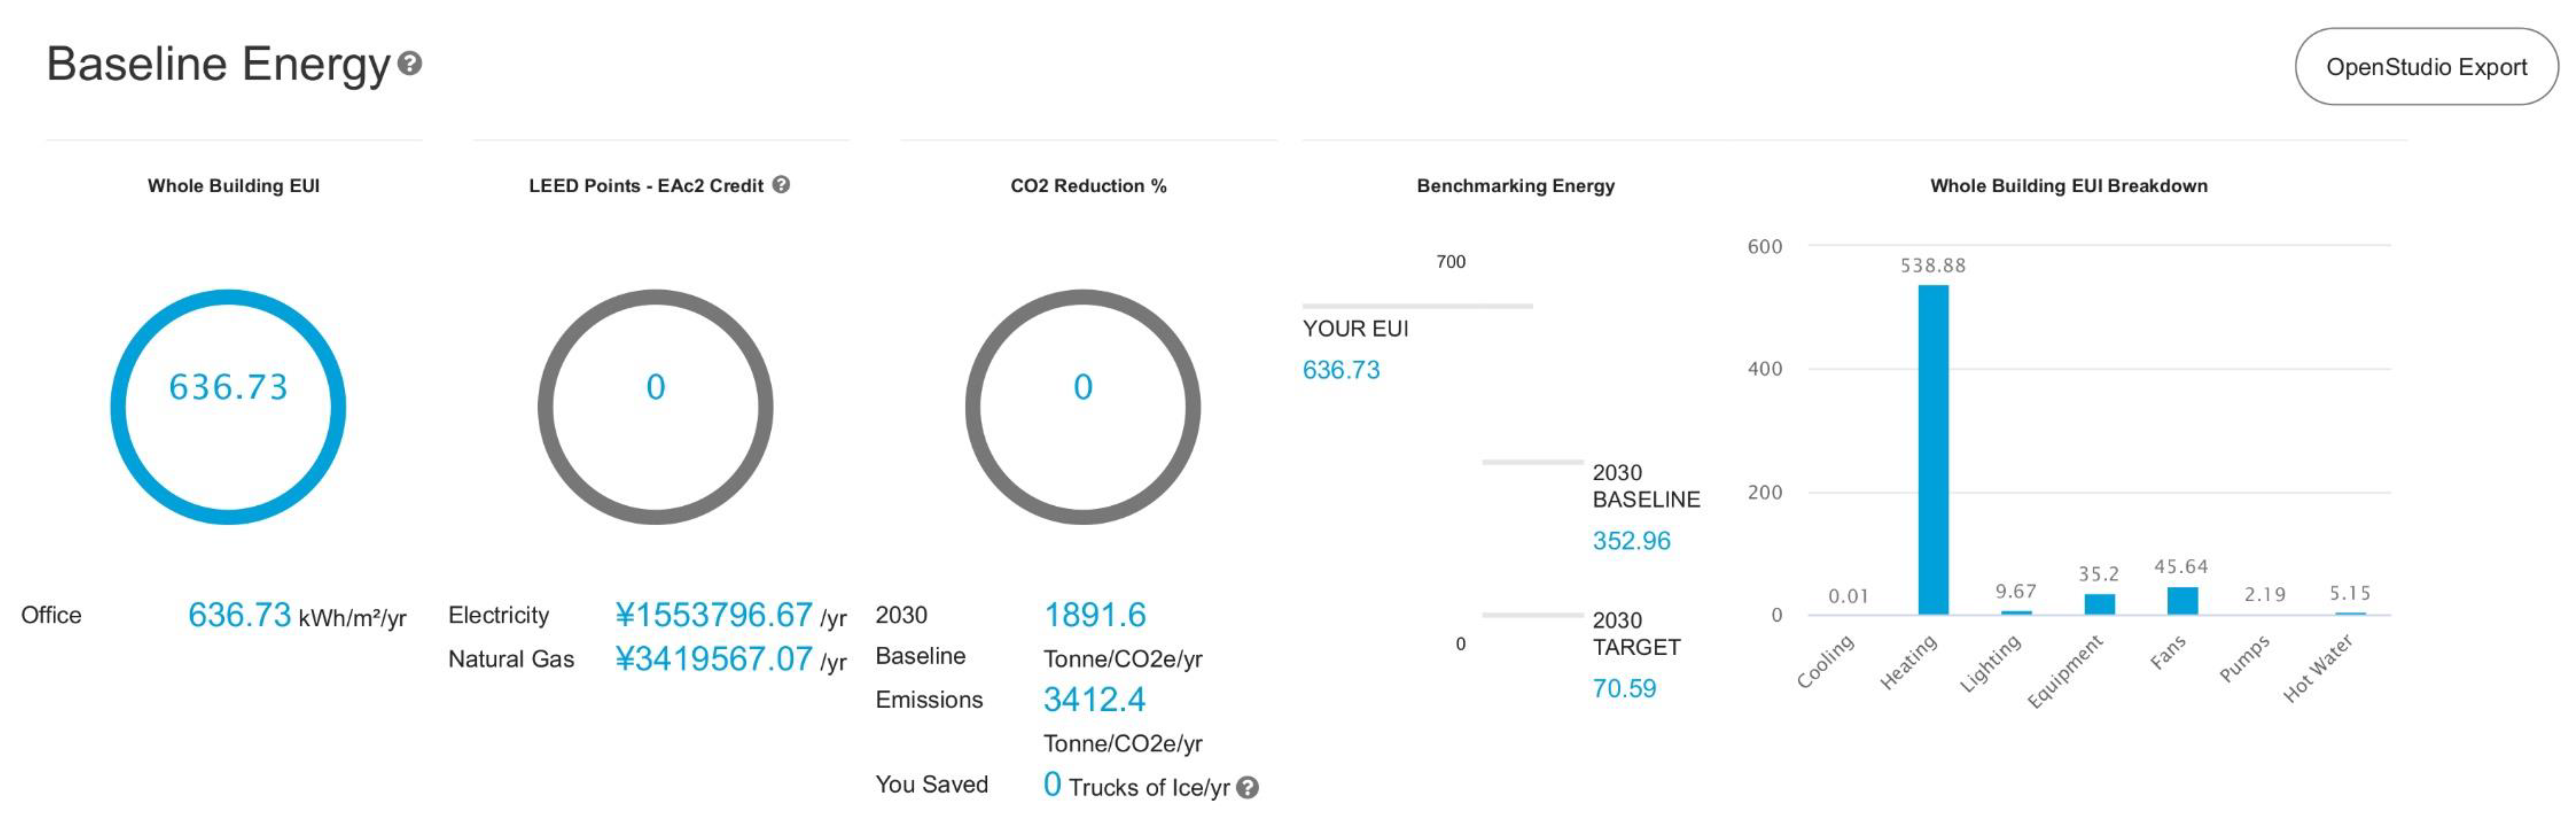
| H | very cold-highland | Delinghá | 0.04 | 0.01 | 0.01 | 474.53 | 542.55 | 538.88 | 18.69 | 9.67 | 9.67 | 35.20 | 35.20 | 37.19 | 47.09 | 46.86 | 2.19 | 2.19 | 5.15 | 5.15 | 572.99 | 641.86 | 637.96 | |
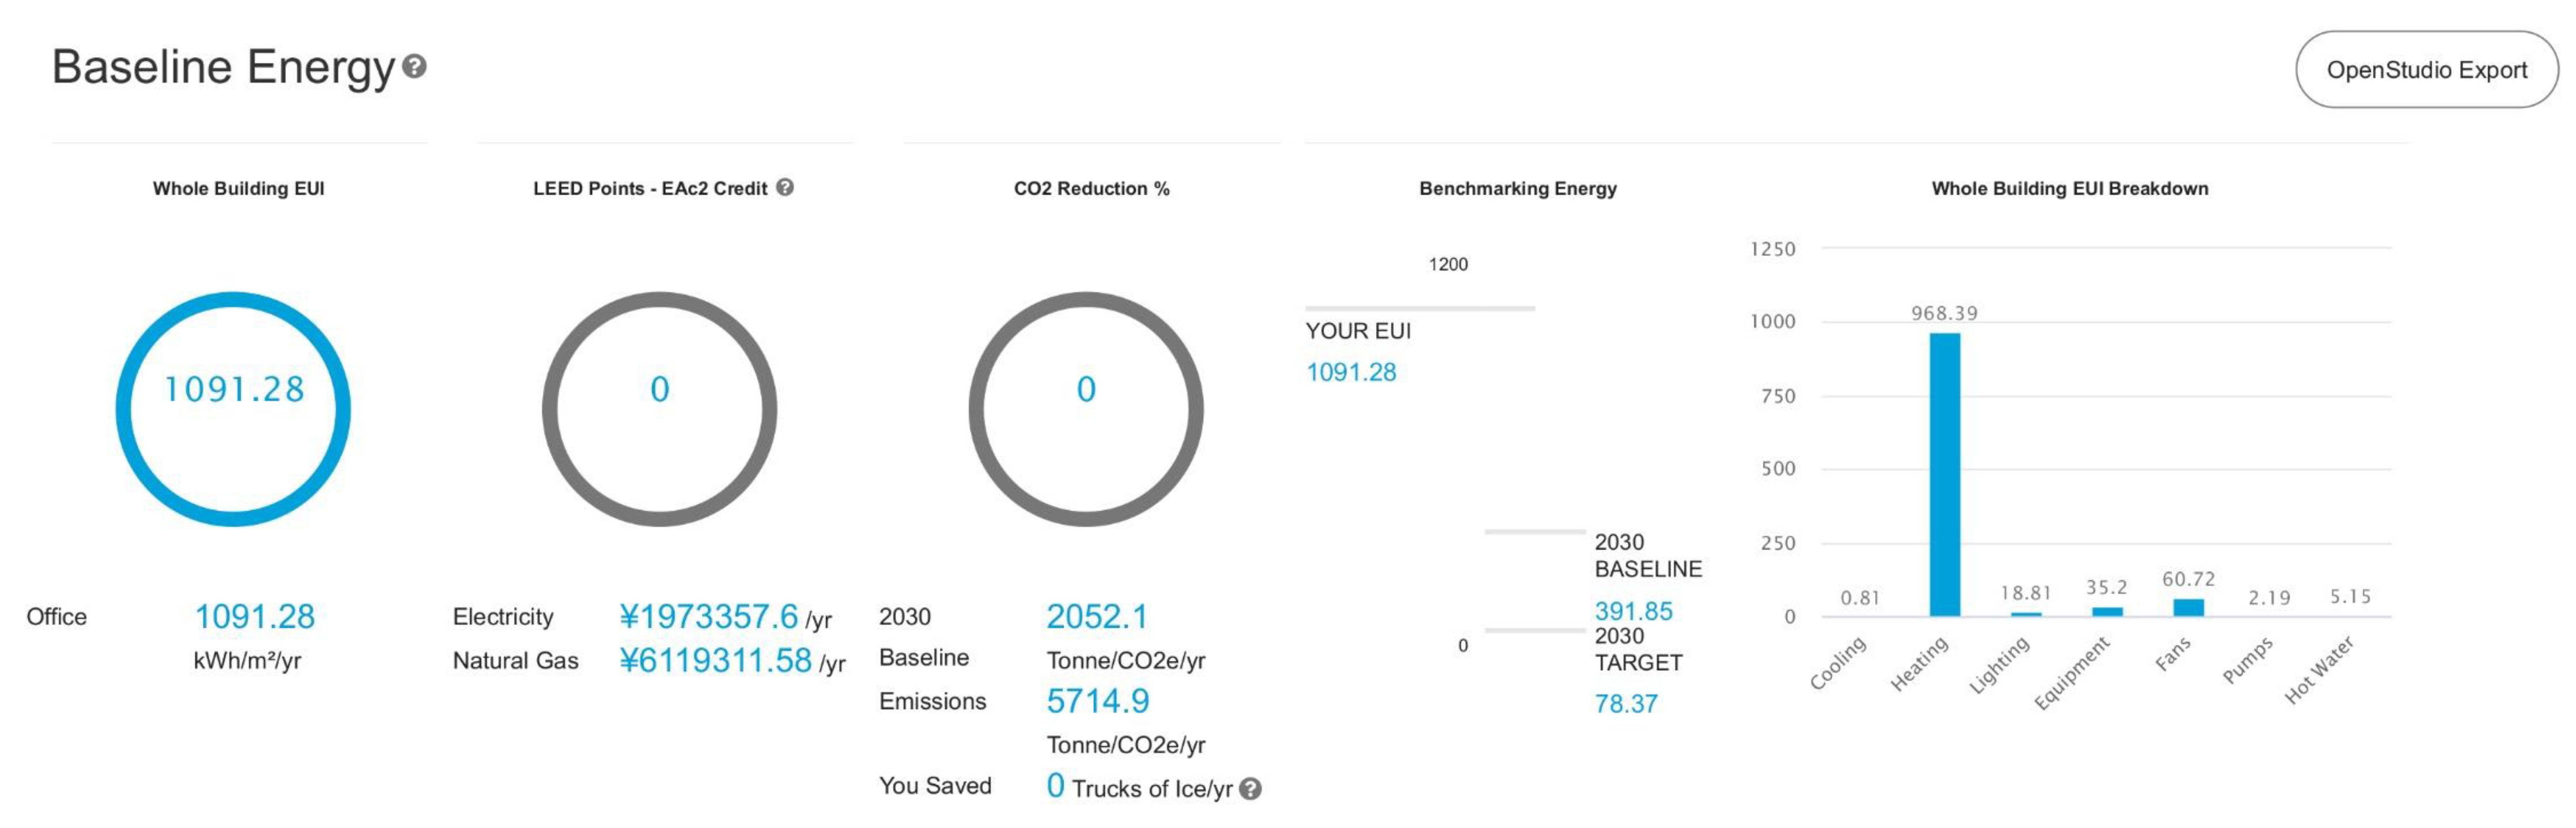
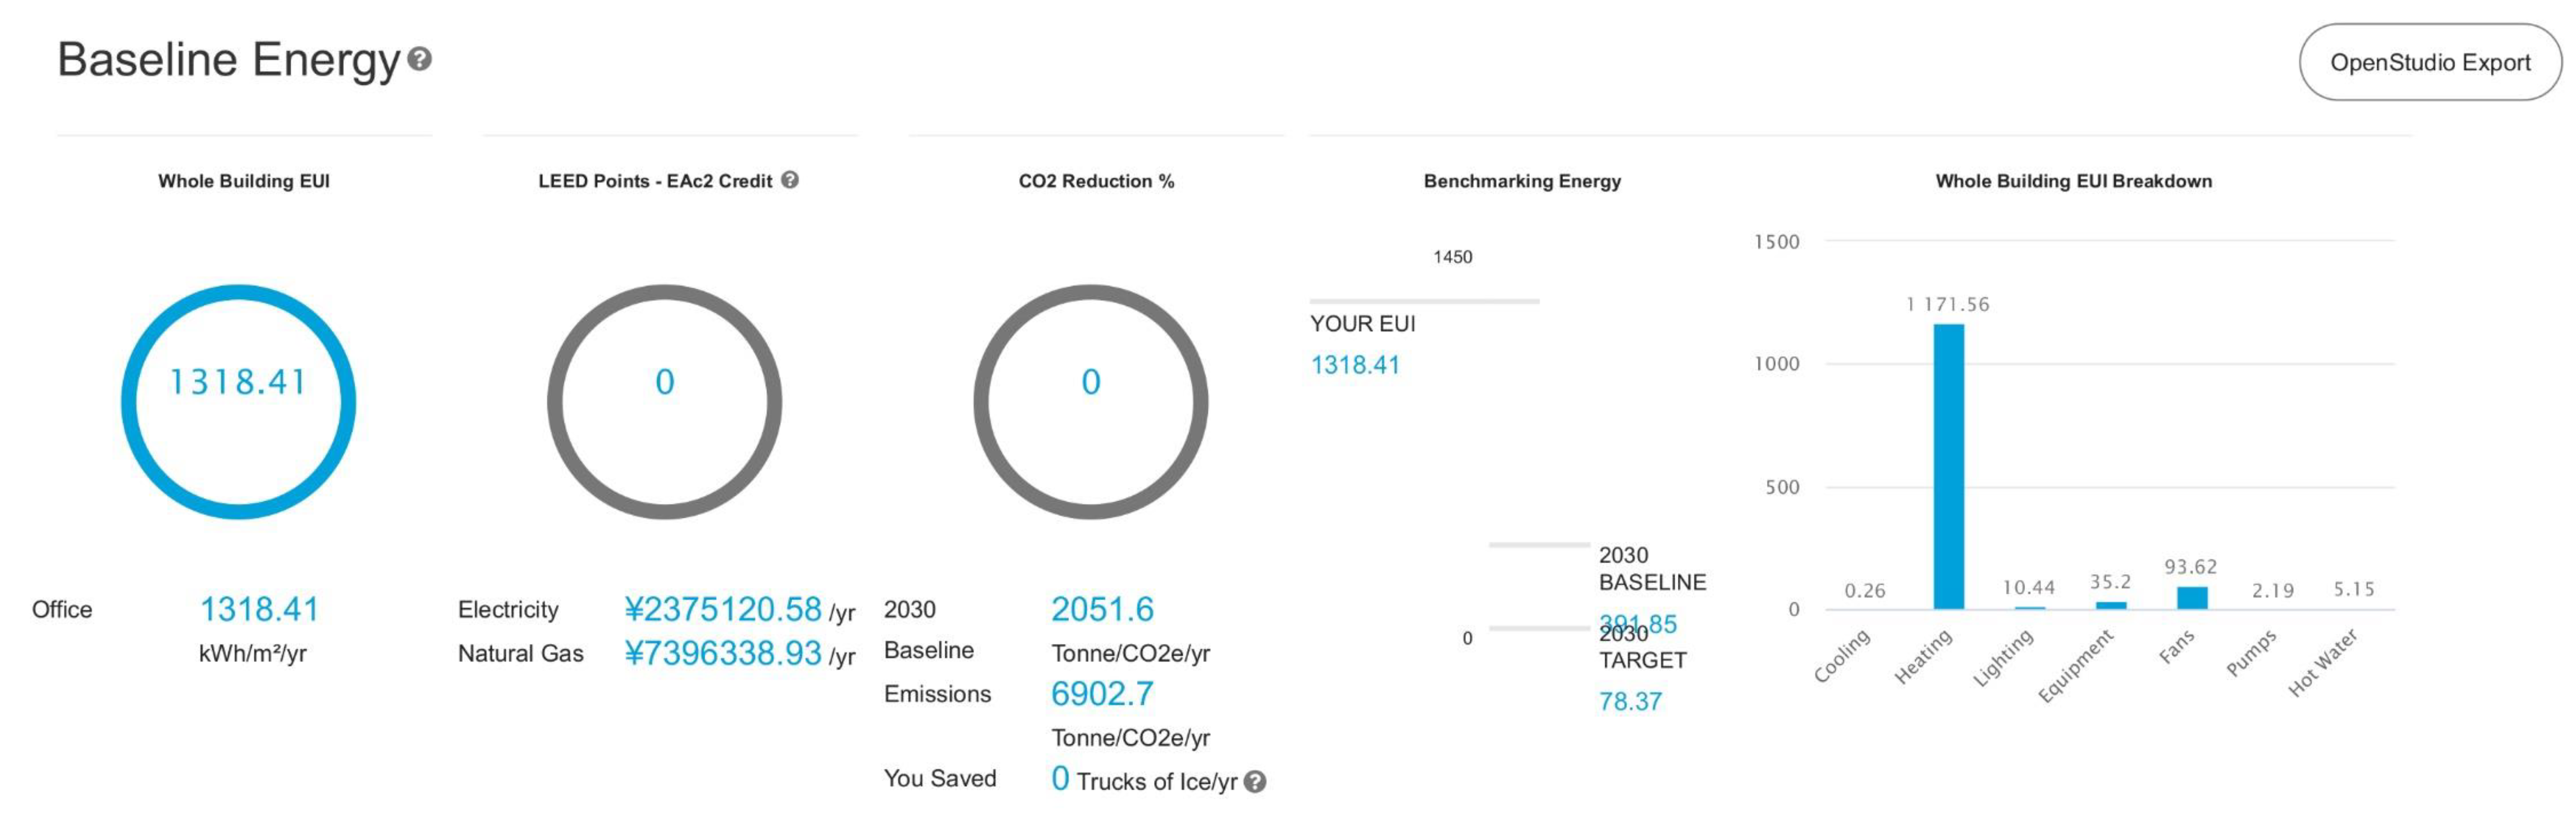
| 8 | - | subarctic | Tahé | 0.81 | 0.26 | 0.3 | 968.39 | 1171.56 | 1167.96 | 18.81 | 10.44 | 10.44 | 35.20 | 35.20 | 60.72 | 94.84 | 94.6 | 2.19 | 2.19 | 5.15 | 5.15 | 1091.27 | 1319.64 | 1315.84 |
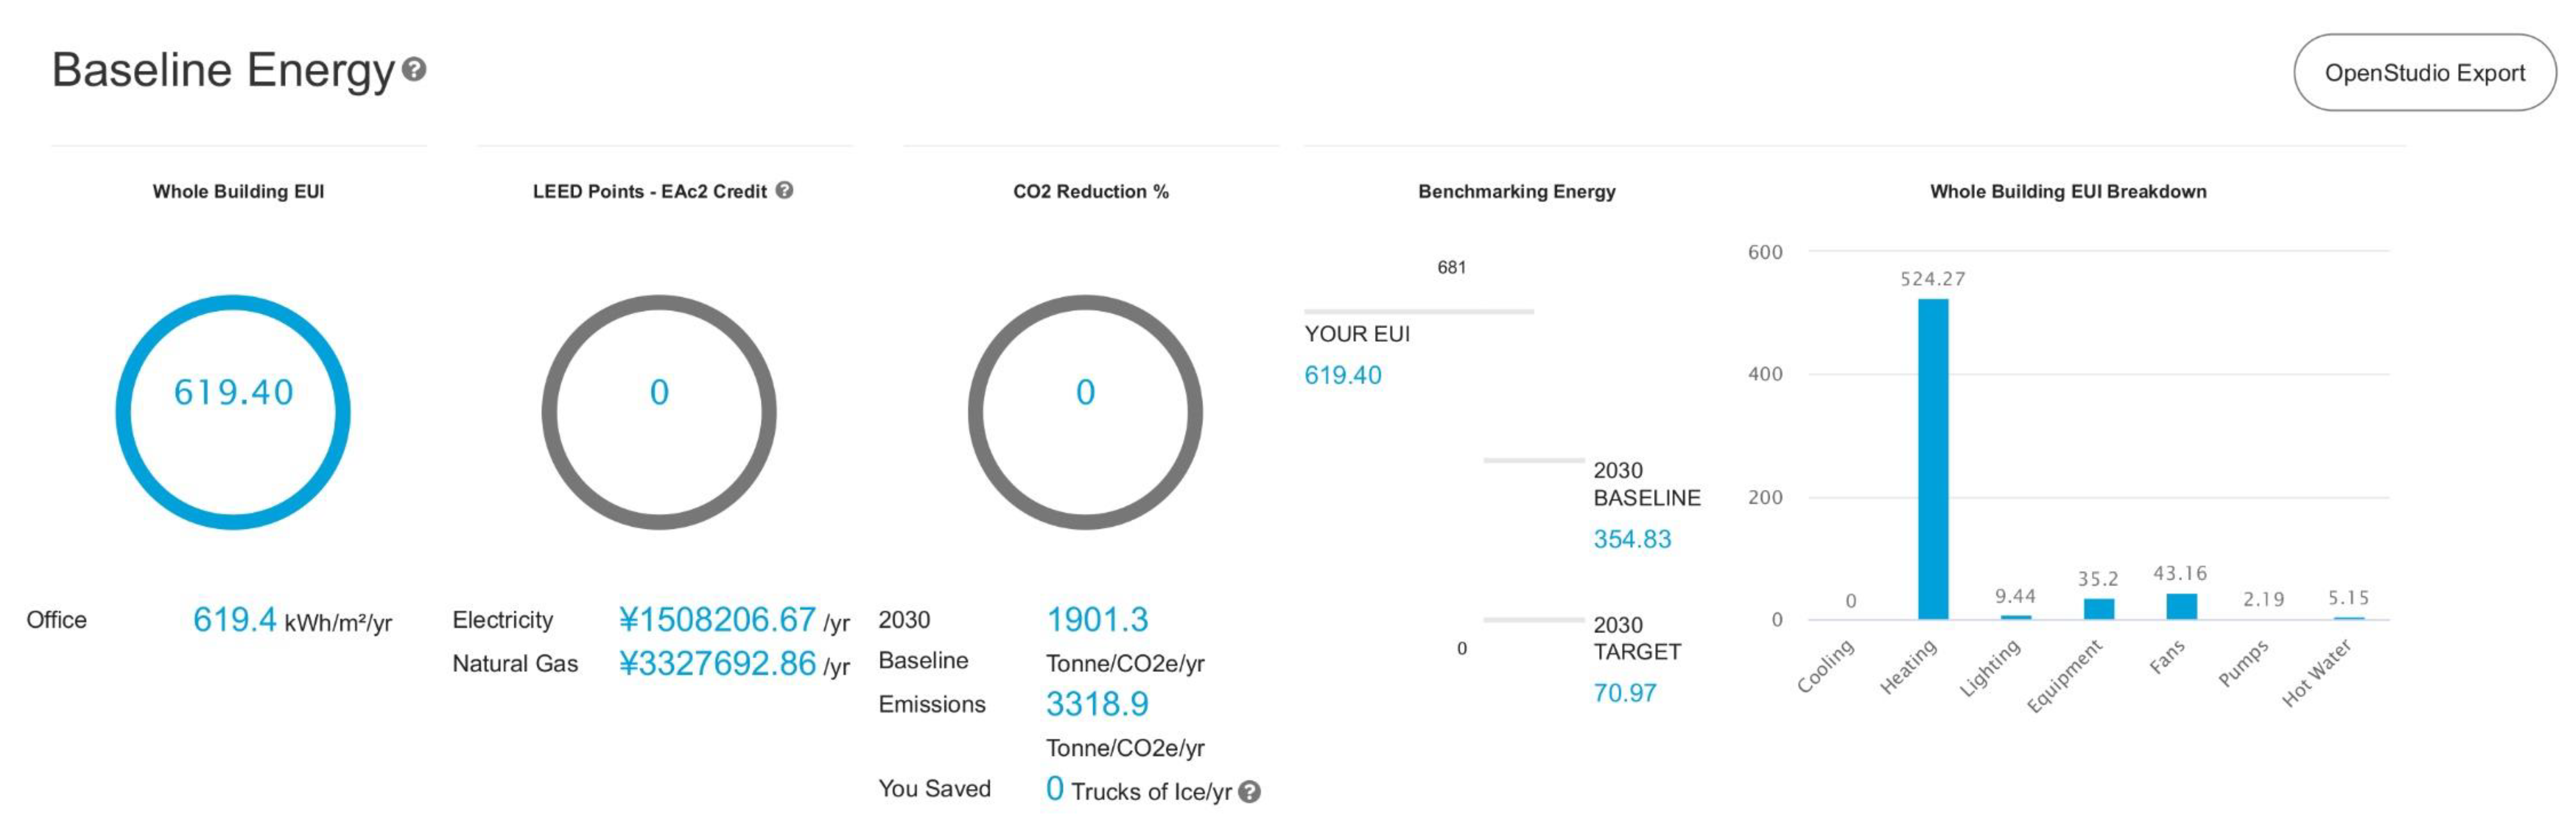
| H | subarctic-highland | Yushu | 0 | 0 | 0 | 465.47 | 528.72 | 524.27 | 18.13 | 9.44 | 9.44 | 35.20 | 35.20 | 35.82 | 44.64 | 44.38 | 2.19 | 2.19 | 5.15 | 5.15 | 561.96 | 625.34 | 620.63 | |
| Climate Zone, City | Total (kWh/m²yr) | Variation Difference (%) | Variation Difference (kWh/m²yr) | ||||
|---|---|---|---|---|---|---|---|
| Pre-C19 | Post-C19 78% | Post-C19 84% | Post-C19 78% | Post-C19 84% | Post-C19 78% | Post-C19 84% | |
| 1-A, Haikou | 98.21 | 82.38 | 83.23 | −16.12% | −15.25% | −15.83 | −14.98 |
| 2-A, Guangzhou | 95.14 | 81.04 | 81.56 | −14.82% | −14.27% | −14.10 | −13.58 |
| 3-A, Shanghai | 163.45 | 172.24 | 170.65 | +5.38% | +4.41% | +8.79 | +7.20 |
| 3-C, Kunming | 102.93 | 104.73 | 103.50 | +1.75% | +0.55% | +1.80 | +0.57 |
| 4-A, Xi’an | 245.82 | 267.61 | 265.64 | +8.86% | +8.06% | +21.79 | +19.82 |
| 4-B, Beijing | 329.42 | 365.60 | 363.35 | +10.98% | +10.30% | +36.18 | +33.93 |
| 4-H, Chamdo | 338.10 | 378.72 | 374.97 | +12.01% | +10.91% | +40.62 | +36.87 |
| 5-A, Shenyang | 490.19 | 585.48 | 582.63 | +19.44% | +18.86% | +95.29 | +92.44 |
| 5-B, Lanzhou | 340.39 | 388.16 | 385.41 | +14.03% | +13.23% | +47.77 | +45.02 |
| 5-H, Lhasa | 313.71 | 344.94 | 341.49 | +9.96% | +8.86% | +31.23 | +27.78 |
| 6-A, Changchun | 690.03 | 810.44 | 807.32 | +17.45% | +17.00% | +120.41 | +117.29 |
| 6-B, Ordos | 487.07 | 555.10 | 551.82 | +13.97% | +13.29% | +68.03 | +64.75 |
| 6-H, Xi’ning | 485.99 | 542.56 | 538.84 | +11.64% | +10.87% | +56.57 | +52.85 |
| 7, Harbin | 756.78 | 887.51 | 884.37 | +17.27% | +16.86% | +130.73 | +127.59 |
| 7-H, Delinghá | 572.99 | 641.86 | 637.96 | +12.02% | +11.34% | +68.87 | +64.97 |
| 8, Tahé | 1091.27 | 1319.64 | 1315.84 | +20.93% | +20.58% | +228.37 | +224.57 |
| 8-H, Yushu | 561.96 | 625.34 | 620.63 | +11.28% | +10.44% | +63.38 | +58.67 |
Appendix B.2.2. Energy Costs
| Climate Zone, City | Energy Prices (USD/kWh) | Total (kWh/m²yr) | Variation Difference (kWh/m²yr) | EUI (Fuel) (kWh/m²yr) | Cost (USD/kWh/yr) | Cost Difference | ||||||||||||||
|---|---|---|---|---|---|---|---|---|---|---|---|---|---|---|---|---|---|---|---|---|
| Pre-C19 | Post-C19 78% | Post-C19 84% | (USD/kWh/yr) | (%) | ||||||||||||||||
| N.Gas | Electricity | Pre-C19 | Post-C19 78% | Post-C19 84% | Post-C19 78% | Post-C19 84% | N.Gas | Electricity | N.Gas | Electricity | N.Gas | Electricity | Pre-C19 | Post-C19 78% | Post-C19 84% | Post-C19 78% | Post-C19 84% | Post-C19 78% | Post-C19 84% | |
| 1-A, Haikou | 0.037 | 0.096 | 98.21 | 82.38 | 83.23 | −15.83 | −14.98 | 5.15 | 93.06 | 5.15 | 77.23 | 5.15 | 78.08 | 9.12 | 7.60 | 7.69 | −1.52 | −1.44 | −16.66% | −15.76% |
| 2-A, Guangzhou | 0.045 | 0.108 | 95.14 | 81.04 | 81.56 | −14.10 | −13.58 | 6.36 | 88.78 | 6.42 | 74.62 | 6.30 | 75.26 | 9.87 | 8.35 | 8.41 | −1.53 | −1.46 | −15.46% | −14.82% |
| 3-A, Shanghai | 0.045 | 0.116 | 163.45 | 172.24 | 170.65 | +8.79 | +7.20 | 83.67 | 79.78 | 101.65 | 70.59 | 99.80 | 70.85 | 12.95 | 12.69 | 12.64 | −0.26 | −0.31 | −1.99% | −2.40% |
| 3-C, Kunming | 0.039 | 0.090 | 102.93 | 104.73 | 103.50 | +1.80 | +0.57 | 33.62 | 69.31 | 44.07 | 60.66 | 42.79 | 60.71 | 7.53 | 7.16 | 7.11 | −0.38 | −0.42 | −4.98% | −5.58% |
| 4-A, Xi’an | 0.031 | 0.101 | 245.82 | 267.61 | 265.64 | +21.79 | +19.82 | 161.67 | 84.15 | 191.48 | 76.13 | 189.33 | 76.31 | 13.43 | 13.54 | 13.49 | +0.11 | +0.06 | +0.82% | +0.47% |
| 4-B, Beijing | 0.041 | 0.122 | 329.42 | 365.60 | 363.35 | +36.18 | +33.93 | 240.88 | 88.54 | 283.11 | 82.49 | 280.73 | 82.62 | 20.62 | 21.61 | 21.53 | +0.99 | +0.91 | +4.82% | +4.42% |
| 4-H, Chamdo (a) | 0.029 | 0.102 | 338.10 | 378.72 | 374.97 | +40.62 | +36.87 | 259.42 | 78.68 | 302.98 | 75.74 | 299.47 | 75.50 | 15.47 | 16.42 | 16.29 | +0.95 | +0.82 | +6.14% | +5.33% |
| 5-A, Shenyang | 0.041 | 0.107 | 490.19 | 585.48 | 582.63 | +95.29 | +92.44 | 396.77 | 93.42 | 489.89 | 95.59 | 487.01 | 95.62 | 26.20 | 30.24 | 30.12 | +4.04 | +3.93 | +15.44% | +15.00% |
| 5-B, Lanzhou | 0.033 | 0.102 | 340.39 | 388.16 | 385.41 | +47.77 | +45.02 | 257.53 | 82.86 | 308.68 | 79.48 | 305.94 | 79.47 | 17.06 | 18.43 | 18.34 | +1.37 | +1.27 | +8.00% | +7.46% |
| 5-H, Lhasa | 0.029 | 0.102 | 313.71 | 344.94 | 341.49 | +31.23 | +27.78 | 236.28 | 77.43 | 271.34 | 73.60 | 268.06 | 73.43 | 14.68 | 15.29 | 15.18 | +0.62 | +0.50 | +4.19% | +3.43% |
| 6-A, Changchun | 0.039 | 0.117 | 690.03 | 810.44 | 807.32 | +120.41 | +117.29 | 588.93 | 101.10 | 702.23 | 108.21 | 699.20 | 108.12 | 34.54 | 39.74 | 39.61 | +5.20 | +5.07 | +15.06% | +14.69% |
| 6-B, Ordos | 0.031 | 0.084 | 487.07 | 555.10 | 551.82 | +68.03 | +64.75 | 398.11 | 88.96 | 466.08 | 89.02 | 462.95 | 88.87 | 19.71 | 21.81 | 21.70 | +2.09 | +1.99 | +10.63% | +10.07% |
| 6-H, Xi’ning | 0.030 | 0.077 | 485.99 | 542.56 | 538.84 | +56.57 | +52.85 | 398.22 | 87.77 | 456.77 | 85.79 | 453.28 | 85.56 | 18.67 | 20.28 | 20.16 | +1.61 | +1.48 | +8.60% | +7.95% |
| 7, Harbin | 0.031 | 0.111 | 756.78 | 887.51 | 884.37 | +130.73 | +127.59 | 651.74 | 105.04 | 773.15 | 114.36 | 770.10 | 114.27 | 31.70 | 36.46 | 36.36 | +4.77 | +4.66 | +15.04% | +14.71% |
| 7-H, Delinghá | 0.030 | 0.077 | 572.99 | 641.86 | 637.96 | +68.87 | +64.97 | 479.68 | 93.31 | 547.70 | 94.16 | 544.03 | 93.93 | 21.54 | 23.65 | 23.52 | +2.11 | +1.98 | +9.78% | +9.19% |
| 8, Tahé | 0.031 | 0.111 | 1091.27 | 1319.64 | 1315.84 | +228.37 | +224.57 | 973.54 | 117.73 | 1176.71 | 142.93 | 1173.11 | 142.73 | 43.00 | 52.04 | 51.91 | +9.04 | +8.91 | +21.03% | +20.72% |
| 8-H, Yushu | 0.030 | 0.077 | 561.96 | 625.34 | 620.63 | +63.38 | +58.67 | 470.62 | 91.34 | 533.87 | 91.47 | 529.42 | 91.21 | 21.12 | 23.03 | 22.87 | +1.91 | +1.76 | +9.04% | +8.31% |
References
- Reuters Staff Factbox: The Origins of COVID-19|Reuters. Available online: https://www.reuters.com/article/us-health-coronavirus-who-china-factbox-idUSKBN29O08P (accessed on 11 March 2021).
- WHO Archived: WHO Timeline—COVID-19. Available online: https://www.who.int/news/item/27-04-2020-who-timeline---covid-19 (accessed on 11 March 2021).
- Singh, K. China Coronavirus: Half a Billion Chinese Now in Confinement in Bid to Halt Killer Virus. Available online: https://inews.co.uk/news/world/china-coronavirus-chinese-confinement-lockdown-wuhan-containment-398066 (accessed on 11 March 2021).
- Life after Lockdown: How China Went Back to Work. BBC Worklife, 1 May 2020.
- Guo, B.M.; Xu, P.; Xiao, T.; He, R.; Dai, M.; Miller, S.L. Review and comparison of HVAC operation guidelines in different countries during the COVID-19 pandemic. Build. Environ. 2021, 187, 107368. [Google Scholar] [CrossRef] [PubMed]
- Lewis, D. Is the coronavirus airborne? Experts can’t agree. Nature 2020, 580, 175. [Google Scholar] [CrossRef] [PubMed] [Green Version]
- Morawska, L.; Cao, J. Airborne transmission of SARS-CoV-2: The world should face the reality. Environ. Int. 2020, 139, 105730. [Google Scholar] [CrossRef] [PubMed]
- Chinese Association of Refrigeration (CAR). Suggestions on the Safe Use of Air Conditioning (Heating) in Response to the New Corona Pneumonia Epidemic after Work during the Spring Festival. Available online: http://www.car.org.cn/index.php?s=/articles_1348.html (accessed on 25 March 2021).
- World Health Organization (WHO). Roadmap to Improve and Ensure Good Indoor Ventilation in the Context of COVID-19; World Health Organization: Geneva, Switzerland, 2021; ISBN 978-92-4-002128-0. [Google Scholar]
- World Health Organization (WHO). Getting Your Workplace Ready for COVID-19: How COVID-19 Spreads; Schools, Businesses and Institutions: Geneva, Switzerland, 2020. [Google Scholar]
- World Health Organization (WHO). Considerations for Public Health and Social Measures in the Workplace in the Context of COVID-19 (Annex); World Health Organization and ILO’s LabAdmin/OSH Branch: Geneva, Switzerland, 2020. [Google Scholar]
- Global Heat Health Information Network. Do Air Conditioning and Ventilation Systems Increase the Risk of Virus Transmis-sion? If So, How Can This Be Managed? Available online: https://ghhin.org/faq/do-air-conditioning-and-ventilation-systems-increase-the-risk-of-virus-transmission-if-so-how-can-this-be-managed/ (accessed on 15 April 2021).
- China Construction Technology Group Co., Ltd. Guide to Emergency Measures for Operation Management of Office Buildings in Response to the “New Coronavirus”; Architectural Society of China (ASC): Beijing, China, 2020. [Google Scholar]
- People’s Medical Publishing House (PMPH). Guidance for Corona Virus Disease 2019: Prevention, Control, Diagnosis and Management; National Health Commission (NHC): Beijing, China, 2020; ISBN 978-7-117-29817-9. [Google Scholar]
- Chinese Center for Disease Control and Prevention. Guideline on Operation Management and Use of Air Conditioners in Summer; Chinese Center for Disease Control and Prevention: Beijing, China, 2020. [Google Scholar]
- American Society of Heating, Refrigerating and Air-Conditioning Engineers (ASHRAE). ASHRAE Epidemic Task Force; Building Readiness: Peachtree Corners, GA, USA, 2021. [Google Scholar]
- Centers for Disease Control and Prevention (CDC). Guidance for Businesses and Employers Responding to Coronavirus Disease 2019 (COVID-19)—Plan, Prepare and Respond to Coronavirus Disease. 2019. Available online: https://www.cdc.gov/coronavirus/2019-ncov/community/guidance-business-response.html (accessed on 19 April 2021).
- Centers for Disease Control and Prevention (CDC). COVID-19 Employer Information for Office Buildings. Available online: https://www.cdc.gov/coronavirus/2019-ncov/community/office-buildings.html (accessed on 22 March 2021).
- Ministry of Housing and Urban-Rural Development. National Standard of the People’s of China. Code for Thermal Design of Civil Building GB 50176-2016; Ministry of Housing and Urban-Rural Development: Beijing, China, 2016. [Google Scholar]
- Zheng, W.; Hu, J.; Wang, Z.; Li, J.; Fu, Z.; Li, H.; Jurasz, J.; Chou, S.; Yan, J. COVID-19 Impact on Operation and Energy Consumption of Heating, Ventilation and Air-Conditioning (HVAC) Systems. Adv. Appl. Energy 2021, 3, 100040. [Google Scholar] [CrossRef]
- Taylor Engineering Taylor Engineering COVID-19 White Paper. 2020. Available online: https://taylorengineers.com/wp-content/uploads/2020/05/TE-COVID19-White-Paper.pdf (accessed on 22 March 2021).
- Nadel, S. Reducing COVID-19 Risks in Commercial Buildings without Wasting Energy; American Council for an Energy-Efficient Economy (ACEE): Washington, DC, USA, 2020. [Google Scholar]
- Cutler, D.M.; Summers, L.H. The COVID-19 Pandemic and the $16 Trillion Virus. JAMA 2020, 324, 1495–1496. [Google Scholar] [CrossRef] [PubMed]
- Mo, F.; Law, E.; Mao, M.; Pan, C.; Liu, L.; Wang, A.; Chen, S.; Lu, R.; Bazzoli, A. COVID-19 Recovery Guidelines for Buildings—China Practice; Royal Institution of Chartered Surveyors (China Regional Office): Beijing, China, 2020. [Google Scholar]
- Omar, O. Intelligent building, definitions, factors and evaluation criteria of selection. Alex. Eng. J. 2018, 57, 2903–2910. [Google Scholar] [CrossRef]
- Awada, M.; Becerik-Gerber, B.; White, E.; Hoque, S.; O’Neill, Z.; Pedrielli, G.; Wen, J.; Wu, T. Occupant health in buildings: Impact of the COVID-19 pandemic on the opinions of building professionals and implications on research. Build. Environ. 2021, 207, 108440. [Google Scholar] [CrossRef]
- Feng, W.; Li, X.; Szum, C.; Zhou, N.; Bendewald, M.; Meng, Z.; Zeng, Y. From Prescriptive to Outcome-Based—The Evolution of Building Energy Codes and Standards in China. In Proceedings of the European Council for an Energy Efficient Economy’s 2017 Summer Study, Hyeres, France, 29 May–3 June 2017. [Google Scholar]
- Ascione, F.; De Masi, R.F.; Mastellone, M.; Vanoli, G.P. The design of safe classrooms of educational buildings for facing contagions and transmission of diseases: A novel approach combining audits, calibrated energy models, building performance (BPS) and computational fluid dynamic (CFD) simulations. Energy Build. 2021, 230, 110533. [Google Scholar] [CrossRef]
- American Society of Heating, Refrigerating and Air-Conditioning Engineers (ASHRAE). ASHRAE Offers COVID-19 Building Readiness/Reopening Guidance. Available online: https://www.ashrae.org/about/news/2020/ashrae-offers-covid-19-building-readiness-reopening-guidance (accessed on 22 March 2021).
- American Society of Heating, Refrigerating and Air-Conditioning Engineers (ASHRAE). Ultraviolet Air and Surface Treatment. In 2019 ASHRAE Handbook—HVAC Applications; American Society of Heating, Refrigerating and Air-Conditioning Engineers (ASHRAE): Peachtree Corners, GA, USA, 2019; Chapter 62; pp. 62.1–62.17. [Google Scholar]
- Si, D.-K.; Li, X.-L.; Xu, X.; Fang, Y. The risk spillover effect of the COVID-19 pandemic on energy sector: Evidence from China. Energy Econ. 2021, 102, 105498. [Google Scholar] [CrossRef]
- Cortiços, N.D.; Duarte, C.C. COVID-19: The impact in US high-rise office buildings energy efficiency. Energy Build. 2021, 249, 111180. [Google Scholar] [CrossRef]
- Kang, H.; An, J.; Kim, H.; Ji, C.; Hong, T.; Lee, S. Changes in energy consumption according to building use type under COVID-19 pandemic in South Korea. Renew. Sustain. Energy Rev. 2021, 148, 111294. [Google Scholar] [CrossRef] [PubMed]
- Gui, X.; Gou, Z.; Zhang, F.; Yu, R. The impact of COVID-19 on higher education building energy use and implications for future education building energy studies. Energy Build. 2021, 251, 111346. [Google Scholar] [CrossRef] [PubMed]
- Wang, Q.; Li, S.; Jiang, F. Uncovering the impact of the COVID-19 pandemic on energy consumption: New insight from difference between pandemic-free scenario and actual electricity consumption in China. J. Clean. Prod. 2021, 313, 127897. [Google Scholar] [CrossRef]
- Aviv, D.; Chen, K.W.; Teitelbaum, E.; Sheppard, D.; Pantelic, J.; Rysanek, A.; Meggers, F. A fresh (air) look at ventilation for COVID-19: Estimating the global energy savings potential of coupling natural ventilation with novel radiant cooling strategies. Appl. Energy 2021, 292, 116848. [Google Scholar] [CrossRef]
- Faulkner, C.A.; Castellini, J.E.; Zuo, W.; Lorenzetti, D.M.; Sohn, M.D. Investigation of HVAC operation strategies for office buildings during COVID-19 pandemic. Build. Environ. 2021, 207, 108519. [Google Scholar] [CrossRef] [PubMed]
- Mokhtari, R.; Jahangir, M.H. The effect of occupant distribution on energy consumption and COVID-19 infection in buildings: A case study of university building. Build. Environ. 2021, 190, 107561. [Google Scholar] [CrossRef] [PubMed]
- Schibuola, L.; Tambani, C. High energy efficiency ventilation to limit COVID-19 contagion in school environments. Energy Build. 2021, 240, 110882. [Google Scholar] [CrossRef] [PubMed]
- Lourenço, J.M.; Aelenei, L.; Facão, J.; Gonçalves, H.; Aelenei, D.; Pina, J.M. The Use of Key Enabling Technologies in the Nearly Zero Energy Buildings Monitoring, Control and Intelligent Management. Energies 2021, 14, 5524. [Google Scholar] [CrossRef]
- Lund, S.; Madgavkar, A.; Manyka, J.; Smit, S. What’s next for Remote Work: An Analysis of 2,000 Tasks, 800 Jobs, and Nine Countries; Open Interactive Popup, McKinsey Global Institute: New York, NY, USA, 2020. [Google Scholar]
- He, H.; Neumark, D.; Weng, Q. Do Workers Value Flexible Jobs? A Field Experiment; NBER Working Paper Series; National Bureau of Economic Research: Cambridge, MA, USA, 2019. [Google Scholar]
- Mori, T. The Coronavirus Pandemic and the Increase of Teleworking in Eight Countries; Nomura Research Institute: Chiyoda, Tokyo, Japan, 2021. [Google Scholar]
- Neufeld, D. Visualizing the $94 Trillion World Economy in One Chart. Available online: https://www.visualcapitalist.com/visualizing-the-94-trillion-world-economy-in-one-chart/ (accessed on 3 January 2022).
- The World Bank. GDP Growth (Annual %)—China|Data. Available online: https://data.worldbank.org/indicator/NY.GDP.MKTP.KD.ZG?locations=CN (accessed on 3 January 2022).
- Textor, C. GDP Composition in China 2020, by Industry. Available online: https://www.statista.com/statistics/1124008/china-composition-of-gdp-by-industry/ (accessed on 3 January 2022).
- Forward Business Information Co., Ltd. Analysis Report on Market Prospect and Investment Strategic Planning of the China’s Intelligent Mobile Office Industry from 2021 to 2026; Forward (Qianzhan) Intelligence Co., Ltd: Shenzhen, China, 2020. [Google Scholar]
- Bai, L.; Yang, L.; Song, B.; Liu, N. A new approach to develop a climate classification for building energy efficiency addressing Chinese climate characteristics. Energy 2020, 195, 116982. [Google Scholar] [CrossRef]
- Feng, W.; Huang, K.; Levine, M.; Zhou, N.; Zhang, S. Evaluation of Energy Savings of the New Chinese Commercial Building Energy Standard. In Proceedings of the ACEEE Summer Study on Energy Efficiency in Buildings; Office of Energy Efficiency and Renewable Energy: Pacific Grove, CA, USA, 2014; pp. 4-121–4-132. [Google Scholar]
- Cipriano, J.; Mor, G.; Chemisana, D.; Pérez, D.; Gamboa, G. Evaluation of a multi-stage guided search approach for the calibration of building energy simulation models. Energy Build. 2015, 87, 370–385. [Google Scholar] [CrossRef]
- Coakley, D.; Raftery, P.; Keane, M. A review of methods to match building energy simulation models to measured data. Renew. Sustain. Energy Rev. 2014, 37, 123–141. [Google Scholar] [CrossRef] [Green Version]
- Shin, M.; Haberl, J.S. Thermal zoning for building HVAC design and energy simulation: A literature review. Energy Build. 2019, 203, 109429. [Google Scholar] [CrossRef]
- Cove.tool. Sustainable Building Design; cove.tool: Atlanta, GA, USA, 2021. [Google Scholar]
- Garwood, T.L.; Hughes, B.R.; Oates, M.R.; O’Connor, D.; Hughes, R. A review of energy simulation tools for the manufacturing sector. Renew. Sustain. Energy Rev. 2018, 81, 895–911. [Google Scholar] [CrossRef]
- Forouzandeh, N.; Tahsildoost, M.; Zomorodian, Z.S. A review of web-based building energy analysis applications. J. Clean. Prod. 2021, 306, 127251. [Google Scholar] [CrossRef]
- Feng, W.; Levine, M. Commercial Building Energy Efficiency Standards & Performance Evaluation; US Department of Energy and Lawrence Berkeley National Laboratory: Berkeley, CA, USA, 2015. [Google Scholar]
- Pacific Northwest National Laboratory. ASHRAE Standard 90.1—Prototype Building Models Large Office|Building Energy Codes Program; Office of Energy Efficiency and Renewable Energy: Washington, DC, USA, 2020. [Google Scholar]
- Hong, T.; Li, C.; Yan, D. Updates to the China Design Standard for Energy Efficiency in public buildings. Energy Policy 2015, 87, 187–198. [Google Scholar] [CrossRef] [Green Version]
- Engineering ToolBox. Emissivity Coefficients Materials. Available online: https://www.engineeringtoolbox.com/emissivity-coefficients-d_447.html (accessed on 30 July 2020).
- Bai, L.; Wang, S. Definition of new thermal climate zones for building energy efficiency response to the climate change during the past decades in China. Energy 2019, 170, 709–719. [Google Scholar] [CrossRef]
- American Society of Heating, Refrigerating and Air-Conditioning Engineers (ASHRAE); American National Standards Institute (ANSI). ANSI/ASHRAE Standard 55-2017—Thermal Environmental Conditions for Human Occupancy; American Society of Heating, Refrigerating and Air-Conditioning Engineers: Peachtree Corners, GA, USA, 2017. [Google Scholar]
- American Society of Heating, Refrigerating and Air-Conditioning Engineers (ASHRAE); American National Standards Institute (ANSI). ANSI/ASHRAE Standard 52.2-2017—Method of Testing General Ventilation Air-Cleaning Devices for Removal Efficiency by Particle Size; American Society of Heating, Refrigerating and Air-Conditioning Engineers: Peachtree Corners, GA, USA, 2017. [Google Scholar]
- Population of Cities in China. 2021. Available online: https://worldpopulationreview.com/countries/cities/china (accessed on 12 March 2021).
- Bai, L.; Yang, L.; Song, B. The impact of climate change on thermal climate zones and residential energy efficiency designs during the past decades in China. Adv. Build. Energy Res. 2020, 14, 389–402. [Google Scholar] [CrossRef]
- Brinkhoff, T. Population Statistics for Countries, Administrative Divisions, Cities, Urban Areas and Agglomerations. Available online: https://www.citypopulation.de/ (accessed on 15 March 2021).
- American Society of Heating, Refrigerating and Air-Conditioning Engineers (ASHRAE). ASHRAE Handbook; ASHRAE: Atlanta, GA, USA, 2020. [Google Scholar]
- (CEN) EN 15232; Energy Performance of Buildings—Impact of Building Automation, Controls and Building Management. European Committee for Standardization: Brussels, Belgium, 2017.
- TRANE Technologies. ASHRAE Recommendations for COVID-19; Engineers Newsletter, 49/2; TRANE Technologies: Dublin, Ireland, 2020. [Google Scholar]
- Li, Y. Effects of Building Ventilation on SARS-CoV-2 Transmission—A Preliminary Study. Presented at the ASHRAE 2020, Virtual Conference, Virtual, 29 June–2 July 2020. [Google Scholar]
- Spena, A.; Palombi, L.; Corcione, M.; Carestia, M.; Spena, V.A. On the Optimal Indoor Air Conditions for SARS-CoV-2 Inactivation. An Enthalpy-Based Approach. Int. J. Environ. Res. Public Health 2020, 17, 6083. [Google Scholar] [CrossRef]
- North Carolina Department of Administration (NCDA). Specification for Filters, AIR (HVAC); North Carolina Department of Administration (NCDA): Raleigh, NC, USA, 2017. [Google Scholar]
- Ahlawat, A.; Wiedensohler, A.; Mishra, S.K. An Overview on the Role of Relative Humidity in Airborne Transmission of SARS-CoV-2 in Indoor Environments. Aerosol Air Qual. Res. 2020, 20, 1856–1861. [Google Scholar] [CrossRef]
- Engineering ToolBox Fans. Efficiency and Power Consumption. Available online: https://www.engineeringtoolbox.com/fans-efficiency-power-consumption-d_197.html (accessed on 3 April 2021).
- Brendel, M. Fan Efficiency Grade Classification for Fans. Presented at the ASHRAE Annual Meeting 2012, San Antonio, TX, USA, 23–27 June 2012. [Google Scholar]
- Xu, P.; Peccia, J.; Fabian, M.P.; Martyny, J.W.; Fennelly, K.P.; Hernandez, M.; Miller, S.L. Efficacy of ultraviolet germicidal irradiation of upper-room air in inactivating airborne bacterial spores and mycobacteria in full-scale studies. Atmos. Environ. 2003, 37, 405–419. [Google Scholar] [CrossRef]
- Riley, R.L.; Nardell, E.A. Clearing the Air: The Theory and Application of Ultraviolet Disinfection. Am. Rev. Respir. Dis. 1989, 139, 1286–1294. [Google Scholar] [CrossRef] [PubMed]
- Martin, S., Jr.; Bahnfleth, W.P.; Dunn, C.; Freihaut, J.; Lau, J.; Davidovic-Nedeljkovic, A. Ultraviolet Germicidal Irradiation. Curr. Best Pract. ASHRAE J. 2008, 28–36. [Google Scholar]
- U.S. Department of Health & Human Services (HHS); Centers for Disease Control and Prevention (CDC); National Institute for Occupational Safety and Health (NIOSH). Environmental Control for Tuberculosis: Basic Upper-Room Ultraviolet Germicidal Irradiation Guidelines for Healthcare Settings; U.S. Department of Health and Human Services: Washington, DC, USA, 2009.
- Kerkhoff, P.; Dijk, E. Philips Lighting. UV-C Disinfection for Air, Surfaces and Water. UV-C Market, Applications and Offering. Presented at the Signify Webinars, Eindhoven, The Netherlands, 23 June 2020. [Google Scholar]
- Ahuja, S. What Is the Simulation Engine Being Used? Available online: http://help.covetool.com/en/articles/2301606-what-is-the-simulation-engine-being-used (accessed on 19 March 2021).
- Zhang, Z.Y. China Electricity Prices for Industrial Consumers. Available online: https://www.china-briefing.com/news/china-electricity-prices-industrial-consumers/ (accessed on 5 April 2021).
- Paltsev, S.; Zhang, D. Natural gas pricing reform in China: Getting closer to a market system? Energy Policy 2015, 86, 43–56. [Google Scholar] [CrossRef] [Green Version]
- Sarkhosh, M.; Najafpoor, A.A.; Alidadi, H.; Shamsara, J.; Amiri, H.; Andrea, T.; Kariminejad, F. Indoor Air Quality associations with sick building syndrome: An application of decision tree technology. Build. Environ. 2021, 188, 107446. [Google Scholar] [CrossRef]


| Scope | Institution | Document |
|---|---|---|
| Worldwide | World Health Organization (WHO) | 1 March 2021, “Roadmap to improve and ensure good indoor ventilation COVID-19” [9] |
| 19 March 2020, “Getting your workplace ready for COVID-19” under the “Country & Technical Guidance—Coronavirus disease (COVID-19)” [10] | ||
| 10 May 2020, “Considerations for public health and social measures in the workplace in the form of COVID-19” [11] | ||
| 22 May 2020, “Global Heat Health Knowledge Network” (The World Meteorological Organization Joint Office for Climate and Health (WMO) and the United States National Oceanic and Atmospheric Administration (NOAA) under WHO supervision issued additional guidelines to mitigate the COVID-19 pandemic) [12] | ||
| China | Chinese Association of Refrigeration (CAR) | 3 February 2020, “Suggestions on the safe use of air conditioning (heating) in response to the new corona pneumonia epidemic after work during the Spring Festival” [8] |
| China Construction Technology Group (CCTG) | 20 February 2020, “Guide to Emergency Measures for Operation Management of Office Buildings in Response to the ‘New Coronavirus’” [13] published by the Architectural Society of China (ASC) | |
| People’s Medical Publishing House (PMPH) | March 2020, “Guidance for corona virus disease 2019: Prevention, Control, Diagnosis and Management” [14] | |
| Chinese Center for Disease Control and Prevention (CDCP) | 29 July 2020, “Guideline on Operation Management and Use of Air Conditioners in Summer” [15] | |
| USA | American Society of Heating, Refrigerating, and Air-Conditioning Engineers (ASHRAE) | 20 October 2020, “Epidemic Task Force. Building Readiness” [16] |
| US Center for Disease Control and Prevention (US CDC) | 8 March 2021, “Guidance for Businesses and Employers Responding to Coronavirus Disease 2019 (COVID-19)—Plan, Prepare and Respond to Coronavirus Disease 2019” [17] | |
| 7 April 2021, “COVID-19 Employer Information for Office Buildings” [18] |
| Operation Guidelines | Before COVID-19 | During COVID-19 | ≠ | |
|---|---|---|---|---|
| Ventilation | Outside air (OA) | >60% | >70% | 10% |
| Re-entrainment | <40% | <30% | - | |
| ERV/exhaust air Transfer rate (EATR) | 6% | 0% | - | |
| Outdoor air rate per person | 7 L/s | 10 L/s | 3 L/s | |
| Outdoor air rate per area | 0.4 L/s | - | - | |
| Air distribution | Mechanical | Unidirectional across rooms | Avoid room interchange | - |
| Mechanical + natural | Yes | Under climate assessment | - | |
| Filtration and disinfection | MERV filter | G4 (MERV 6–8) | F7 (MERV 13 equivalent) | - |
| HEPA filter | No | No | - | |
| UVGI | No | No | - | |
| Indoor setpoints | Ambient temperature | Winter >18 °C Summer 24–26 °C | >16 °C to 18 °C no maximum | - |
| Relative humidity | Winter >40% <50% Summer >50% <60% | >40% | - |
| Model Features | |
|---|---|
| Location type | City Central Business District (CBD) |
| Height | 71.28 m |
| Volume | 106,920 m3 |
| Gross area | 27,000 m2 |
| Floor area | 1500 m2 |
| Floor height | 3.96 m (a) |
| Opaque wall surface area | 11,404.80 m2 |
| Glazed wall surface area | 4561.92 m2 |
| Shape coefficient | 0.12 |
| Climate Zone GB 50176-2016 [48] | Roof | Wall | Window | |
|---|---|---|---|---|
| U-Value (W/m²·K) | U-Value (W/m²·K) | U-Value (W/m²·K) | SHGC | |
| Severe cold (SCZ) A, B | 0.28 | 0.38 | 1.90 | 0.70 |
| Severe cold (SCZ) C | 0.35 | 0.43 | 2.00 | 0.70 |
| Cold (CZ) | 0.45 | 0.50 | 2.20 | 0.70 |
| Hot summer and cold winter (HSCWZ) | 0.50 | 0.80 | 2.40 | 0.40 |
| Hot summer and warm winter (HSWWZ) | 0.80 | 1.50 | 2.70 | 0.40 |
| Mild (MZ) | 0.80 | 1.50 | 2.70 | 0.40 |
| Model Systems and Schedules | |
|---|---|
| HVAC heating system | Gas-fired boiler |
| HVAC cooling system | Water-cooled centrifugal chiller |
| HVAC distribution system | VAV with hot water reheating coil (a) |
| Chiller COP (b) | 5.2 |
| Boiler efficiency (b) | 0.89 |
| Pumps | Variable speed |
| Lighting power density (LPD) (b) | 9 W/m2 |
| Plug and equipment’s power density (b) | 15 W/m2 |
| Occupation density | 8 m3/person |
| Air tightness (b) | 3 m3/(m2h) |
| Outdoor air rate | 30 m3h/person (8.33 L/s/person) |
| Heating setpoint | 20 °C |
| Heating setback | 5 °C |
| Cooling setpoint | 26 °C |
| Cooling setback | 37 °C |
| Zone | Subzone | Classification | City, Province | Population | Latitude (b) | Elevation (b) |
|---|---|---|---|---|---|---|
| Zone 1 | A | very hot-humid | Haikou, Hainan | 615,835 | 20.04623 | 11 m |
| Zone 2 | A | hot-humid | Guangzhou, Guangdong | 11,071,424 | 23.13019 | 23 m |
| Zone 3 | A | warm-humid | Shanghai, Shanghai | 22,315,474 | 31.28732 | 4 m |
| C | warm-humid-highland | Kunming, Yunnan | 3,855,346 | 24.88430 | 1932 m | |
| Zone 4 | A | mixed-humid | Xi’an, Shaanxi | 6,501,190 | 34.34305 | 377 m |
| B | mixed-dry | Beijing, Beijing | 11,716,620 | 39.90621 | 46 m | |
| H | mixed-highland | Chamdo, Xizang (a) | 44,028 | 31.14497 | 3250 m | |
| Zone 5 | A | cool-humid | Shenyang, Liaoning | 6,255,921 | 41.67498 | 47 m |
| B | cool-dry | Lanzhou, Gansu | 2,628,426 | 36.06207 | 1528 m | |
| H | cool-highland | Lhasa, Xizang | 118,721 | 29.65538 | 3658 m | |
| Zone 6 | A | cold-humid | Changchun, Jilin | 4,193,073 | 43.81307 | 216 m |
| B | cold-dry | Ordos, Nei Menggu | 1,940,653 | 39.60814 | 1308 m | |
| H | cold-highland | Xi’ning, Qinghai | 767,531 | 36.61733 | 2268 m | |
| Zone 7 | - | very cold | Harbin, Heilongjiang | 5,878,939 | 45.79882 | 118 m |
| H | very cold-highland | Delinghá, Qinghai (a) | 54,844 | 37.36908 | 2992 m | |
| Zone 8 | - | subarctic | Tahé, Heilongjiang (a) | 81,480 | 52.32526 | 358 m |
| H | subarctic-highland | Yushu, Qinghai | 124,736 | 33.00060 | 3695 m |
| Pre-C19 (MERV8) | Post-C19 (MERV14) | |
|---|---|---|
| Air volume delivered (m3/h·person) | 0.00833 | 0.01 |
| Number of occupants (a) | 13,365 | 6683 |
| Total air volume delivered (q) (m3/s) | 111,371 | 66,825 |
| Filter max. initial resistance (dp) (Pa) (b) | 77.22 | 169.38 |
| Fan efficiency (μf) (c) | 0.6 | |
| Belt efficiency (μb) (c) | 0.88 | |
| Motor efficiency (μm) (c) | 0.87 | |
| Power consumption (P = dp·q/(µf·µb·µm)) (W) | 18,721.77 | 24,640.41 |
| Power consumption diff. (MERV 14/F8 -MERV 8/M5) (W) | 5918.64 | |
| Fan operation on working days (hour/yr) (d) | 3380 | |
| Additional two-hour air flush (weekdays) (e) | ||
| Number of hours per year | 520 | |
| Power consumption (W/yr) | 12,813,012.93 | |
| Additional fan power consumption | ||
| (kW/yr) | 31,818.00 | |
| (kW/m2yr) | 1.22 | |
| Schedule Inputs | Pre-C19 | Post-C19 |
|---|---|---|
| Daylight sensors | No | Yes (a) |
| Occupancy sensors | No | Yes (a) |
| Lighting (LPD) | 9 W/m² | 10.83 W/m2 (b) |
| Lighting (unocccup. h) (LPD) | n/a | |
| Lighting (exterior) | n/a | |
| Plug-equipment (PA) | 15 W/m² | |
| Plug-equipment (PA) (unoccup. h) | n/a | |
| Metabolic rate | 1.1 Met (sitting and typing) | |
| Heating setpoint | 20.00 °C | |
| Heating setback | 5 °C | 16 °C (c) |
| Cooling setpoint | 26 °C | |
| Cooling setback | 37 °C | |
| Total occupants (occup. h) | 8 m3/person | 9.52 m3/person (d) 10.26 m3/person (e) |
| Total occupants (unoccup. h) | n/a | |
| Systems Inputs | Pre-C19 | Post-C19 |
|---|---|---|
| HVAC system type: heating | Gas-fired boiler | |
| HVAC system type: cooling | Water-cooled centrifugal chillers | |
| HVAC system distribution | VAV terminal box with damper and hot water reheating coil | |
| Integrated part load value | Constant speed centrifugal chiller | |
| Heating system COP | 0.89 | |
| Cooling system COP | 5.2 | |
| Heat recovery system | Run-around coil | |
| Fan flow control factor | Variable speed | |
| Specific fan power | Central mechanical ventilation with heating and cooling | |
| Ventilation type | Mechanical | Natural and mechanical (a) |
| People outdoor air rate (per person) | 30 m3/h (8.33 L/s) | 36 m3/h (10 L/s) (a) |
| Area outdoor air rate | n/a | |
| Infiltration | 3.00 m3/h.floor area | |
| BACS | Standard (class C) | Advanced (class B) (b) |
| DCV (ventilation control) | Demand control | Disabled (a) |
| Exhaust recirculation | 40% | 20% |
| SWH system fuel | Natural gas | |
| SWH system capacity | 1135.62 litters tank | |
| SWH system setpoint temperature | 60 °C | |
| SWH system performance efficiency | min 80% | |
| SWH generation | Gas boiler, HR boiler | |
| Hot water distribution system | Circulation system (0.6) | |
| Hot water demand | 1329.1 m3/yr (c) | |
| RES systems | None | |
| CZ, City, Province | Usable Energy Consumption (kWh/m²yr) | Variation Difference | ||
|---|---|---|---|---|
| Pre-C19 | Post-C19 78%|84% | Absolute Value (kWh/m²yr) 78%|84% | Percentual (%) 78%|84% | |
| Zone 1-A, Haikou, Hainan | 98.21 | 82.38|82.23 | −15.83|−14.98 | −16.12|−15.25 |
| Zone 2-A, Guangzhou, Guangdong | 95.14 | 81.04|81.56 | −14.10|−13.58 | −14.82|14.27 |
| Zone 3-A, Shanghai, Shanghai | 163.45 | 172.24|170.65 | 8.79|7.20 | 5.38|4.41 |
| Zone 3-C, Kunming, Yunnan | 102.93 | 104.73|103.50 | 1.80|0.57 | 1.75|0.55 |
| Zone 4-A, Xi’an, Shaanxi | 245.82 | 267.61|265.64 | 21.79|19.82 | 8.86|8.06 |
| Zone 4-B, Beijing, Beijing | 329.42 | 365.60|363.35 | 36.18|33.93 | 10.98|10.30 |
| Zone 4-H, Chamdo, Xizang | 338.10 | 378.72|374.97 | 40.62|36.87 | 12.01|10.91 |
| Zone 5-A, Shenyang, Liaoning | 490.19 | 585.48|582.63 | 95.29|92.44 | 19.44|18.86 |
| Zone 5-B, Lanzhou, Gansu | 340.39 | 388.16|385.41 | 47.77|45.02 | 14.03|13.23 |
| Zone 5-H, Lhasa, Xizang | 313.71 | 344.94|341.49 | 31.23|27.78 | 9.96|8.86 |
| Zone 6-A, Changchun, Jilin | 690.03 | 810.44|807.32 | 120.41|117.29 | 17.45|17.00 |
| Zone 6-B, Ordos, Nei Menggu | 487.07 | 555.10|551.82 | 68.03|64.75 | 13.97|13.29 |
| Zone 6-H, Xi’ning, Qinghai | 485.99 | 542.56|538.84 | 56.57|52.85 | 11.64|10.87 |
| Zone 7, Harbin, Heilongjiang | 756.78 | 887.51|884.37 | 130.73|127.59 | 17.27|16.86 |
| Zone 7-H, Delinghá, Qinghai | 572.99 | 641.86|637.96 | 68.87|64.97 | 12.02|11.34 |
| Zone 8, Tahé, Heilongjiang | 1091.27 | 1319.64|1315.84 | 228.37|224.57 | 20.93|20.58 |
| Zone 8-H, Yushu, Qinghai | 561.96 | 625.34|620.63 | 63.38|58.67 | 11.28|10.44 |
| CZ, City, Province | Cooling (kWh/m²yr) | Heating (kWh/m²yr) | Variation Difference (%) | |||
|---|---|---|---|---|---|---|
| Pre-C19 | Post-C19 78%|84% | Pre-C19 | Post-C19 78%|84% | Cooling 78%|84% | Heating 78%|84% | |
| Zone 1-A, Haikou, Hainan | 20.36 | 15.34|15.93 | 0.00 | 0.00|00 | −24.66|−21.76 | 0.00|0.00 |
| Zone 2-A, Guangzhou, Guangdong | 16.76 | 12.57|13.05 | 1.21 | 1.27|1.15 | −25.00|−22.14 | 4.96|−4.96 |
| Zone 3-A, Shanghai, Shanghai | 8.38 | 5.90|6.18 | 78.52 | 96.50|94.65 | −29.59|−26.25 | 22.90|20.54 |
| Zone 3-C, Kunming, Yunnan | 1.52 | 0.58|0.66 | 28.47 | 38.92|37.64 | −61.84|−56.58 | 36.71|32.21 |
| Zone 4-A, Xi’an, Shaanxi | 8.32 | 6.10|6.36 | 156.52 | 186.33|184.18 | −26.68|−23.56 | 19.05|16.67 |
| Zone 4-B, Beijing, Beijing | 7.80 | 5.40|5.66 | 235.73 | 277.96|275.58 | −30.77|−27.44 | 17.91|16.90 |
| Zone 4-H, Chamdo, Xizang | 0.04 | 0.01|0.01 | 254.27 | 297.83|294.32 | −75.00|−75.00 | 17.13|15.75 |
| Zone 5-A, Shenyang, Liaoning | 5.26 | 3.38|3.58 | 391.62 | 484.74|481.86 | −35.74|−31.94 | 23.78|23.04 |
| Zone 5-B, Lanzhou, Gansu | 3.13 | 1.44|1.60 | 252.38 | 303.53|300.79 | −53.99|−48.88 | 20.27|19.18 |
| Zone 5-H, Lhasa, Xizang | 0.07 | 0.02|0.02 | 231.13 | 266.19|262.91 | −71.43|−71.43 | 15.17|13.75 |
| Zone 6-A, Changchun, Jilin | 2.84 | 1.37|1.51 | 583.78 | 697.08|694.05 | −51.76|−46.83 | 19.41|18.89 |
| Zone 6-B, Ordos, Nei Menggu | 1.56 | 0.62|0.70 | 392.96 | 460.93|457.80 | −60.26|−55.13 | 17.30|16.50 |
| Zone 6-H, Xi’ning, Qinghai | 0.07 | 0.01|0.02 | 393.07 | 451.62|448.13 | −85.71|−71.43 | 14.90|14.01 |
| Zone 7, Harbin, Heilongjiang | 3.16 | 1.54|1.69 | 646.59 | 768.00|764.95 | −51.27|−46.52 | 18.78|18.31 |
| Zone 7-H, Delinghá, Qinghai | 0.04 | 0.01|0.01 | 474.53 | 542.55|538.88 | −75.00|−75.00 | 14.33|13.56 |
| Zone 8 Tahé, Heilongjiang | 0.81 | 0.26|0.30 | 968.39 | 1171.56|1167.96 | −67.90|−62.96 | 20.98|20.61 |
| Zone 8-H, Yushu, Qinghai | 0.00 | 0.00|0.00 | 465.47 | 528.72|524.27 | 0.00|0.00 | 13.59|12.63 |
| CZ, City, Province | CO2 Emissions (Tonne/CO2e/yr) | Variation Difference | ||
|---|---|---|---|---|
| Pre-C19 | Post-C19 78%|84% | Absolute Value 78%|84% | Percentual (%) 78%|84% | |
| Zone 1-A, Haikou, Hainan | 781.80 | 643.20|650.00 | −138.60|−131.8 | −17.73|−16.86 |
| Zone 2-A, Guangzhou, Guangdong | 752.90 | 628.10|632.80 | −124.80|−120.10 | −16.58|−15.95 |
| Zone 3-A, Shanghai, Shanghai | 1057.50 | 1060.70|1053.90 | 3.20|−3.60 | 0.30|−0.34 |
| Zone 3-C, Kunming, Yunnan | 725.70 | 698.50|692.70 | −27.20|−33.00 | −3.75|−4.55 |
| Zone 4-A, Xi’an, Shaanxi | 1474.20 | 1544.80|1535.80 | 70.60|61.60 | 4.79|4.18 |
| Zone 4-B, Beijing, Beijing | 1897.10 | 2044.30|2033.80 | 147.20|136.70 | 7.76|7.21 |
| Zone 4-H, Chamdo, Xizang | 1913.90 | 2092.90|2073.80 | 179.00|159.90 | 9.35|8.35 |
| Zone 5-A, Shenyang, Liaoning | 2704.90 | 3167.70|3153.90 | 462.80|449.00 | 17.11|16.60 |
| Zone 5-B, Lanzhou, Gansu | 1938.60 | 2151.10|2137.70 | 212.50|199.10 | 10.96|10.27 |
| Zone 5-H, Lhasa, Xizang | 1790.50 | 1920.80|1903.50 | 130.30|113.00 | 7.28|6.31 |
| Zone 6-A, Changchun, Jilin | 3700.10 | 4301.70|4286.10 | 601.60|586.00 | 16.26|15.84 |
| Zone 6-B, Ordos, Nei Menggu | 2668.90 | 2991.70|2975.10 | 322.80|306.20 | 12.09|11.47 |
| Zone 6-H, Xi’ning, Qinghai | 2659.70 | 2918.80|2900.90 | 259.10|241.20 | 9.74|9.07 |
| Zone 7, Harbin, Heilongjiang | 4039.10 | 4698.30|4682.70 | 659.20|643.60 | 16.32|15.93 |
| Zone 7-H, Delinghá, Qinghai | 3102.90 | 3432.20|3412.40 | 329.30|309.50 | 10.61|9.97 |
| Zone 8, Tahé, Heilongjiang | 5714.90 | 6902.70|6883.60 | 1187.80|1168.70 | 20.78|20.45 |
| Zone 8-H, Yushu, Qinghai | 3042.50 | 3342.80|3318.19 | 300.30|276.40 | 9.87|9.08 |
Publisher’s Note: MDPI stays neutral with regard to jurisdictional claims in published maps and institutional affiliations. |
© 2022 by the authors. Licensee MDPI, Basel, Switzerland. This article is an open access article distributed under the terms and conditions of the Creative Commons Attribution (CC BY) license (https://creativecommons.org/licenses/by/4.0/).
Share and Cite
Duarte, C.C.; Cortiços, N.D. The Energy Efficiency Post-COVID-19 in China’s Office Buildings. Clean Technol. 2022, 4, 174-233. https://doi.org/10.3390/cleantechnol4010012
Duarte CC, Cortiços ND. The Energy Efficiency Post-COVID-19 in China’s Office Buildings. Clean Technologies. 2022; 4(1):174-233. https://doi.org/10.3390/cleantechnol4010012
Chicago/Turabian StyleDuarte, Carlos C., and Nuno D. Cortiços. 2022. "The Energy Efficiency Post-COVID-19 in China’s Office Buildings" Clean Technologies 4, no. 1: 174-233. https://doi.org/10.3390/cleantechnol4010012
APA StyleDuarte, C. C., & Cortiços, N. D. (2022). The Energy Efficiency Post-COVID-19 in China’s Office Buildings. Clean Technologies, 4(1), 174-233. https://doi.org/10.3390/cleantechnol4010012