Article

Soil Erosion by Wind Storms in a Pampean Semi-Arid Region of Argentina: An Environmental Magnetism Approach

by
Brenda Alba
1,
Marcos A. E. Chaparro
1,2,*,
Andrea A. Bartel
3,
Harald N. Böhnel
4 and
Silvia B. Aimar
3
1
Centro de Investigaciones en Física e Ingeniería del Centro de la Provincia de Buenos Aires (CIFICEN, CONICET-UNCPBA), Pinto 399, Tandil 7000, Buenos Aires, Argentina
2
Facultad de Ciencias Exactas, Universidad Nacional del Centro de la Provincia de Buenos Aires (UNCPBA), Instituto de Física Arroyo Seco (IFAS), Pinto 399, Tandil 7000, Buenos Aires, Argentina
3
Departamento de Geología, Facultad de Ciencias Exactas y Naturales, Universidad Nacional de La Pampa (UNLPAM), Uruguay 151, Santa Rosa 6300, La Pampa, Argentina
4
Instituto de Geociencias (IGc), Universidad Nacional Autónoma de México (UNAM), Boulevard Juriquilla No. 3001, Querétaro 76230, Querétaro, Mexico
*
Author to whom correspondence should be addressed.
Soil Syst. 2025, 9(2), 60; https://doi.org/10.3390/soilsystems9020060
Submission received: 14 April 2025 / Revised: 27 May 2025 / Accepted: 29 May 2025 / Published: 6 June 2025
(This article belongs to the Special Issue Research on Soil Management and Conservation: 2nd Edition)

Abstract

:
Wind storm events are erosive processes in susceptible soil areas, resulting in severe land degradation. Environmental magnetism methods offer a practical approach to assessing soil redistribution by wind and water. In this study, we applied magnetic techniques to analyze soil and wind-transported material from nine erosion events recorded in 1995 at two sites in the central Pampean Semi-Arid Region (Argentina) for two representative soils: an Entic Haplustoll S1 and a Typic Ustipsamment S2. Ferrimagnetic minerals (magnetite and maghemite) dominate high-coercivity minerals (hematite), and their sizes are <1 μm for eolian particle collections and soil samples. Mean values of magnetic susceptibility and saturation isothermal remanent magnetization (SIRM) of eolian particle collections exhibit similar patterns across erosion events. These variations appear to be more closely linked to seasonal meteorological conditions, such as rainfall and wind speed, rather than intrinsic soil properties. Correlation analysis between magnetic parameters and erosion indicators reveals a significant correlation between total soil loss (eolian erosion, 547–8754 kg ha−1, S1; and 224–25,472 kg ha−1, S2) and SIRM at both studied sites (Rplot 1 = 0.72 and Rplot 2 = 0.70; p < 0.05). These results suggest that the soil magnetic properties may serve as valuable indicators for studying wind-driven soil erosion.

Graphical Abstract

1. Introduction

Soil erosion is a process of detachment, transport, and deposition of soil particles, primarily driven by wind and water. While it is a natural phenomenon, human activities and biophysical factors can accelerate and intensify this process, leading to significant environmental consequences, as accelerated soil erosion destroys natural resources and threatens environmental sustainability [1]. About 1094 million ha (Mha) are affected annually globally by water erosion, of which 751 Mha is severely affected and 549 Mha by wind erosion, of which 296 Mha is severely affected [1]. The increasing trend of soil erosion in Latin America and the Caribbean is primarily attributed to rapid human population growth, deforestation, overgrazing, and unsustainable farming practices [2]. In Argentina, it is estimated that approximately 37.5% of the national territory is affected by water and wind erosion processes, representing a total of around 105 Mha [3], and the main drivers of these degradation processes are overgrazing (30%) and agricultural activities (31%) [4]. Eolian erosion in Argentina is a significant environmental concern, and particularly one of the main degradation processes in dry ecosystems like the Pampean Semi-Arid Region [5]. Approximately 41 Mha of soils is eroded by wind, of which 12.5 Mha is severely eroded [6]. In the Pampean Semi-Arid Region of Argentina, eolian erosion has been extensively studied, focusing on its causes, effects, and predictive modeling. The main studies in this region include field measurements of eolian erosion with reports of erosion rates and soil susceptibility [7,8], predictive modeling [9,10,11], and the relations between various critical determinants of erosion rates such as soil characteristics [12,13,14], climatic conditions [15], and land management practices [16,17].
Traditional methods for assessing soil erosion are often time-consuming and costly despite the availability of various effective techniques. Consequently, it is critical to identify and develop alternative, more time-efficient, and economically viable approaches to assess areas affected by or susceptible to erosion. Rapid and low-cost methods, such as magnetic measurements, have gained attention in this context due to their potential as proxies for erosion processes [18], offering a cost-effective and efficient method for analyzing soil redistribution patterns. Soil erosion and sediment delivery using magnetic measurements were investigated by Royall [19], reporting changes in magnetic susceptibility related to soil redistribution in agricultural catchments. According to Ding et al. [20], elevated magnetic susceptibility values observed in croplands suggest soil redistribution primarily driven by water erosion, whereas lower values in pasturelands indicate the deposition of wind-eroded materials. It is demonstrated that the Chernozem soils of northeast Bulgaria exhibited a pattern of soil loss and redistribution by wind and water, where magnetic susceptibility variations correspond to different erosion mechanisms across slopes [21]. Quijano et al. [22] emphasize the importance of understanding the relationship between magnetic properties and soil erosion processes, integrating magnetic measurements with topographic attributes and soil properties to assess soil degradation. Studies in northeast China showed how magnetic susceptibility can effectively trace soil erosion and deposition processes by analyzing soil redistribution patterns, particularly concerning land use changes [23]. Magnetic susceptibility is a valuable tool for assessing soil erodibility, with studies reporting significant correlations between magnetic parameters, erosion indices and humus or organic carbon content in soils with degradation from water erosion [24,25,26,27,28,29].
Particularly for eolian erosion, magnetic susceptibility is used to trace erosion and deposition processes in wind-dominated landscapes [30,31] and estimate soil loss and redistribution because of soil tillage, reinforcing relationships between soil erosion and changes in magnetic properties [32]. However, using magnetic susceptibility and other magnetic parameters in studies of eolian soil erosion is not as widespread as in water erosion studies, even though such applications are likely to be feasible. Furthermore, the relationships between field measurements of total soil erosion and magnetic parameters have not been exhaustively investigated.
Therefore, this study aimed to (i) determine the magnetic properties of eroded soil and compare them to eolian soil particle collections after erosion processes; (ii) study the temporal distribution of eolian soil particles collected over nine wind storms in 1995 through magnetism techniques and eolian erosion indicators; and (iii) evaluate the relationships between magnetic parameters and erosion indicators to identify a potential magnetic proxy for soil erosion.

2. Materials and Methods

2.1. Study Area and Sampling

The study area is located in the central Pampean Semi-Arid Region of Argentina (RPSC, La Pampa Province; Figure 1a) and the sampling sites (Figure 1b) in a flat relief of the geomorphological subregion “Planicies con Tosca” [33]. The climate in RPSC is dry and sub-humid, with cold winters and hot summers. The average annual temperature is 16 °C, and the extreme minimum and maximum temperatures (1961–2024) are −12.7 °C and 44.9 °C, respectively [34]. The annual precipitation averages 700 mm, while higher rainfall occurs in spring and summer, between October and March; the driest month is August [33]. The mean annual wind velocity ranges from 4.5 to 17.1 kmh−1, with the highest wind speed reached in spring, the principal eolian erosion season, because it combines with the end of the driest period [15]. According to the Soil Taxonomy System [35], the predominant natural soils are Mollisols and Entisols.
For this study, Aimar [37] provided samples collected during twenty storms in 1995, which were used for the total annual eolian erosion determination in the RPSC [9]. The square 1-hectare experimental fields, or plots for short (Figure 1c), comprise two different representative soil sites: an Entic Haplustoll in Santa Rosa (S1, 36°35′31″ S; 64°16′46″ W), a sandy loam soil, and a Typic Ustipsamment in Anguil (S2, 36°31′ S; 64°01′ W, Figure 1b), a loamy sand soil. Before the sampling, tillage was performed in fields. Initial tillage operations were carried out using a heavy harrow due to the high root density of weeping lovegrass (Eragrostis curvula). Subsequent weed control practices involved the use of a disk harrow, followed by a final pass with a tine harrow oriented in a north–south (N–S) direction [37]. Both sites were maintained uncovered and with minimum roughness conditions during the experiment. This field setting was controlled to have the best erosion conditions in both sites.
Twelve sampling points were established in a 4 × 3 grid in each plot (a square 1-hectare experimental field), equidistantly separated by 33 m between rows and 45 m between columns (Figure 1c). At each sampling point, three dust collectors, model Big Spring Number Eight (BSNE; [38]), were placed 147.0, 54.0, and 13.5 cm above the ground to collect eolian soil particles (Figure 1d). BSNE collectors are passive dust samplers made of galvanized metal, composed of a trapezoidal body with upper and lower mesh screens (0.3 mm and 1 mm). Airborne particles enter through a front rectangular opening; wind velocity decreases inside the chamber, allowing sediment to settle into a lower tray. Each unit is mounted on a horizontal arm with a wind vane to maintain orientation into the prevailing wind [37,38]. Thirty-six samples on each plot were originally collected in every wind storm studied.
The sample collection involved 648 collector samples (eolian soil particle samples) collected during nine wind storms in 1995. After collection, according to Walden’s procedures [39], the samples were dried to avoid changes in soil properties, labeled, and stored at the laboratory. Since many of the initially collected samples contained a small amount of material, several of the received samples were composed samples: in some cases, the composition combines samples collected at the same height in columns, while in other cases, it combines samples from the same row. In other cases, the sample collection from all 12 collectors at the same height was combined into a single sample. The particular date, wind speed, storm duration, and total soil loss (total eolian erosion) of each erosion event are detailed in Table 1. Additionally, Table 2 presents soil texture, moisture content, and organic matter data for the A horizon of Entic Haplustoll and Typic Ustipsamment soils. For comparison, four topsoil samples at a 0–2 cm depth were obtained in both sites before erosion events and 15 years after the original study. Granulometric fractions of all soil samples were obtained for the following grain sizes: <50 μm (clay and silt), 50 to 74 μm (very fine sand I), 74 to 100 μm (very fine sand II), 100 to 250 μm (fine sand), and 250 to 2000 μm (medium and coarse sand). One hundred and seven eolian soil particle samples and twenty-three topsoil samples (including granulometric fractions) were measured and analyzed.

2.2. Experimental Techniques and Magnetic Measurements

For magnetism measurements, topsoil and eolian soil particle samples were air-dried at room temperature, ground, and passed through a 2000 μm mesh to obtain the <2000 μm size fraction (whole soil). Then, they were subsampled using plastic containers of 2.3 cm3 holding about 2 g of material. The magnetic measurements were made in the Laboratory of Environmental Magnetism at the University of Tandil (UNCPBA, Tandil, Argentina), and some specific magnetic measurements were made in the Laboratory of Rock Magnetism and Paleomagnetism at the University of Mexico (UNAM, Querétaro, Mexico). Magnetic susceptibility measurements were carried out using the magnetic susceptibility meter MS2 (Bartington Instruments Ltd., Witney, UK) linked to the MS2B dual frequency sensor (0.465 and 4.65 kHz) with a 1 × 10⁻⁵ SI sensitivity. Measurements were corrected for drift over five cycles (two air readings and three sample readings). The mass-specific susceptibility (χ) was calculated considering the sample weight. Also, the percentage of frequency-dependent susceptibility (χFD% = 100 × (χ0.465kHz − χ4.65kHz)/χ0.465kHz) was calculated. This last parameter allows a semi-quantitative interpretation to estimate the total concentration of ultrafine ferrimagnetic particles (superparamagnetic, SP) in soil samples [40]. The anhysteretic and isothermal remanent magnetizations (ARM and IRM, respectively) were measured using a spinner fluxgate magnetometer Minispin (spin46.exe, 2009 version) (Molspin Ltd., Newcastle upon Tyne, Tyne and Wear, UK). ARM was acquired using a device attached to a shielded demagnetizer (Molspin Ltd.), superimposing a DC bias field of 90 µT onto a peak alternating field (AF) of 100 mT and an AF decay rate of 17 µT per cycle. Mass-specific anhysteretic susceptibility (χARM) was estimated using linear regression for ARM acquired in two DC bias fields of 50 and 90 µT. The IRM studies used a pulse magnetizer model IM- 10–30 (ASC Scientific, Narragansett, RI, USA). Each sample was magnetized by exposing it to growing stepwise DC fields from 4.3 to 2470 mT and backfields from −1.7 mT to −1150 mT. Saturation of IRM (SIRM = IRM2470mT), anhysteretic ratios χARM/χ and ARM/SIRM, remanent coercivity (Hcr), and S-ratio (=−IRM−300mT/SIRM) were also measured and calculated from remanent magnetization measurements [41]. The experimental IRM-AF method [42] was applied to sixteen samples for discriminating low- and high-coercivity magnetic phases. The method is based on the responses of different assemblages of magnetic minerals and was only carried out for backfield IRM measurements, as detailed by Chaparro et al. [42]. In particular, a peak AF value of 100 mT was selected as the filter, and hence, two magnetic phases (Phases 1 and 2) were obtained. Thus, the SIRM, S-ratio, and the Hcr for each phase and its corresponding magnetic contribution to the total SIRM were determined. Temperature-dependent magnetization M(T) measurements were conducted in the air under a 0.5 T magnetic field using a translation magnetic balance constructed at the IGC in Mexico. Soil material (≈100 mg) was heated and cooled, i.e., it was heated up to 710 °C (heating run) and then cooled to room temperature (RT, cooling run) with a controlled heating/cooling rate of 30 °C min−1. The temperature was controlled, and the force was compensated and recorded with a sensor that generates an output voltage (PicoLog® recorder, Pico Technology Ltd., Eaton Socon, UK). The Curie temperature was estimated using the RockMagAnalyzer software [43] based on the second derivative of M(T).
The non-parametric one-way analysis of variance, i.e., the Kruskal–Wallis test [44], was performed to determine significant (at the 0.05 level) differences between magnetic parameters, medians of sample subsets, such as sites, particle collection height, and particle collection in each storm.

3. Results

3.1. Magnetic Properties of Eolian Soil Particles

The magnetic properties of soil samples concerning magnetic mineralogy, particle size, and concentration are detailed in Table 3. Results of both datasets, i.e., plot 1 (Entic Haplustoll) and plot 2 (Typic Ustipsamment), were grouped into two different classifications for their analysis. The first classification refers to the height at which the sample was collected in both plots, and it is subset A, subset B, and subset C for those collected at 147 cm, 54 cm, and 13.5 cm, respectively. The second classification refers to the sites where collectors were established, i.e., subset H and subset U for plot 1 and plot 2, respectively. Table 3 presents the descriptive statistics of magnetic parameters for each subset of samples.
Concentration-dependent magnetic parameters χ and SIRM varied from 204.0–368.7 × 10⁻⁸ m3kg−1 and 37.0–68.6 × 10⁻³ Am2kg−1, respectively, considering the total dataset. The parameter χFD% varied from 0 to 6.6% with a mean (SD) value of 2.7 (1.4) %, indicating the absence of SP particles if χFD% < 2% and an admixture of SP and coarser non-SP particles if χFD% = 2–10% [40].
Anhysteretic bivariate ratios ARM/SIRM and χARM/χ that are designed to cancel the effects of magnetic mineral concentration and enhance the ferromagnetic signal due to variations in particle size [45] give a quantitative size estimation of all magnetic minerals (SP, single-, pseudo-single-, and multi-domain magnetic particles). Values of ARM/SIRM that varied from 0.015 to 0.024 and χARM/χ from 2.8 to 7.0 indicate the presence of fine magnetic particles (<1 μm).
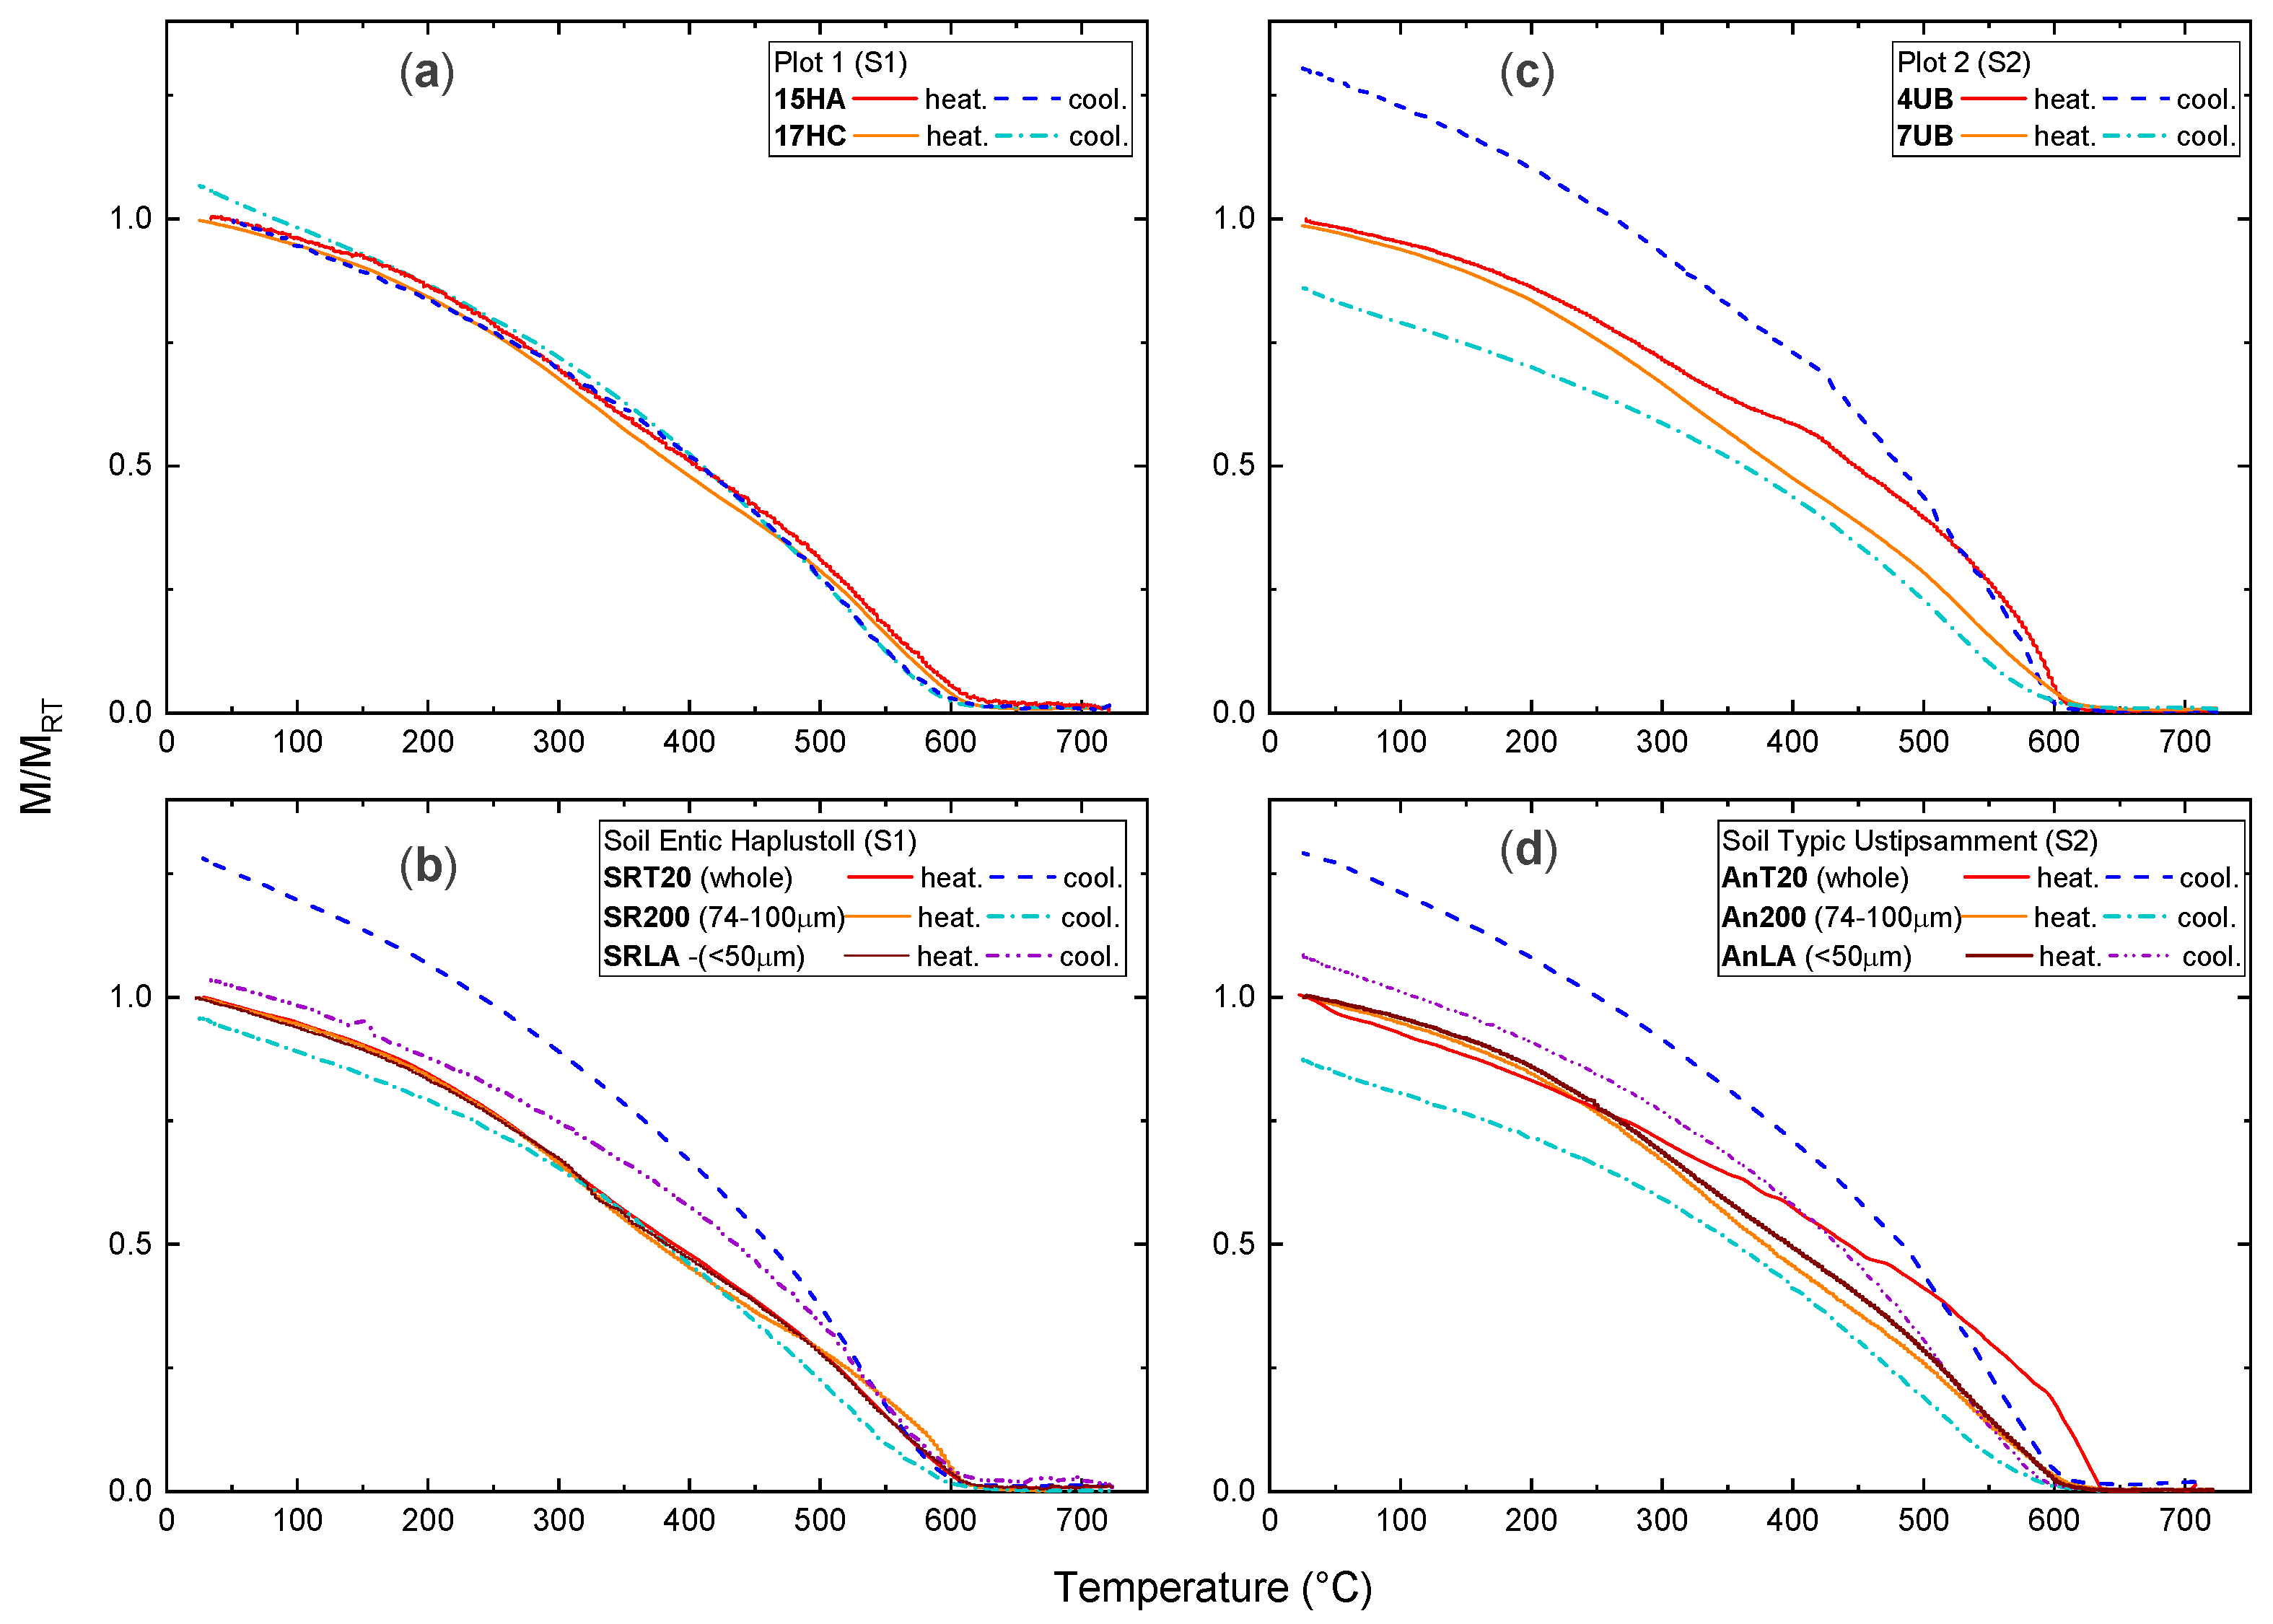
Thermomagnetic M-T measurements were conducted on 13 samples, including collectors (n = 6) and topsoil (n = 7). Heating and cooling runs of the eolian soil particle samples are shown in Figure 2a,c. M-T measurements evidenced the presence of ferromagnetic and antiferromagnetic Fe oxides such as Fe3O4 (magnetite, Tc = 580 °C), α-Fe2O3 (hematite, TN = 675 °C), Fe2+(Fe3+, Ti)2O4 (titano-magnetite, Tc = 200–580 °C), and γ-Fe2O3 (maghemite, Tc = 645 °C). All samples showed a decrease in magnetization for heating runs at about 500–600 °C and, for sample 4UB, from 500–650 °C. In the case of hematite, its TN may decrease and gradually approach the Tc of magnetite because of Al substitution (Al-hematite) in natural environments [46]. Regarding maghemite, its thermally unstable nature converts it to other magnetic minerals (usually magnetite or hematite) at temperatures of 250–550 °C [45,47]. Figure 2a,c show that the eolian soil particle samples 15HA, 17HC, and 4UB have a (slight) magnetization increase in the cooling run at room temperature (RT). This behavior may be associated with the chemical transformation of titano-magnetite and paramagnetic minerals in new magnetic ones, such as magnetite, through an “exsolution” process [47]. In contrast, a lower magnetization in the cooling run at RT of 15% (Figure 2c), like the eolian soil particle sample 7UB, may evidence the transformation of maghemite, which previously contributed to the total magnetization. According to [41] and references therein, its ferrimagnetic contribution to the magnetization may be estimated from the difference in magnetization at RT between cooling and heating runs.
The S-ratio quantifies the relative abundance of ferrimagnetic minerals, and the Hcr values for the dataset range from 0.79–0.96 and from 36.8 to 43.4 mT, respectively (Table 3). Therefore, soft ferrimagnetic minerals (magnetite and maghemite) are in more significant proportions than high-coercivity minerals and dominate over antiferromagnetic (hematite and goethite) ones.
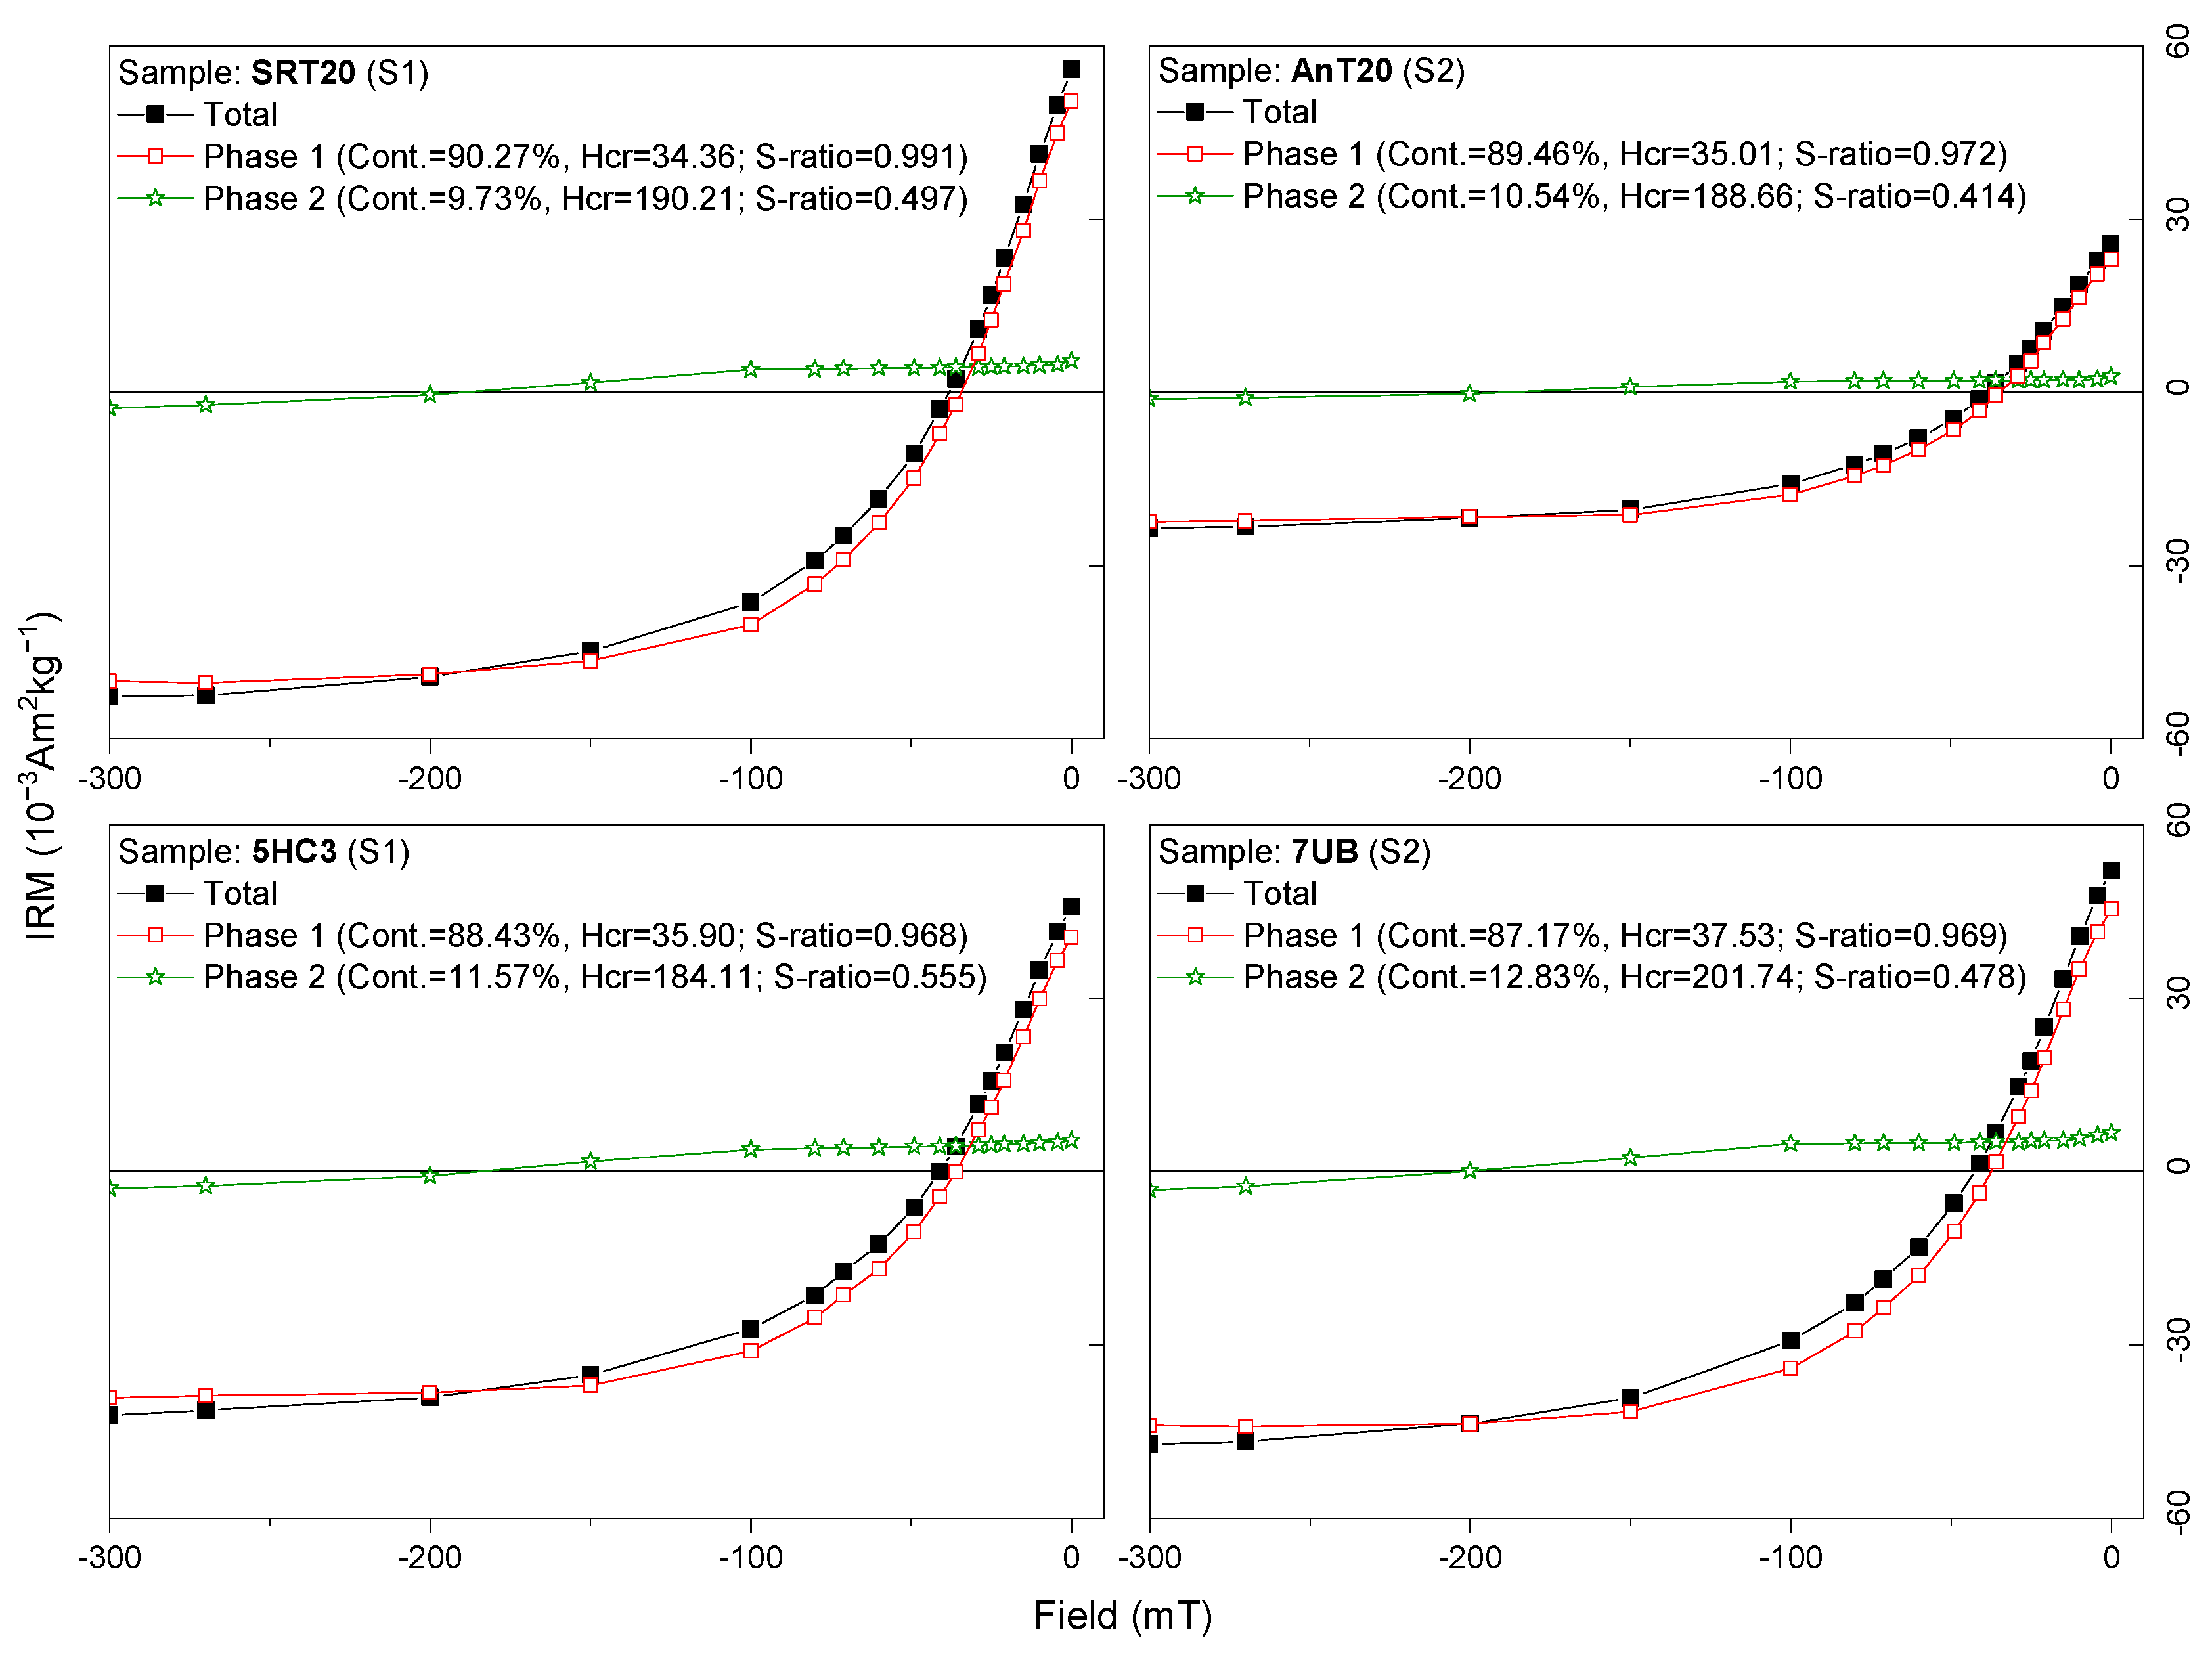
In addition, the remanent coercivity values of low- and high-coercivity phases in mixed magnetic assemblages were determined using the experimental IRM-AF method. IRM backfield measurements of four (out of sixteen) samples, including both eolian soil particles and soil samples, are shown in Figure 3. Mean (SD) values of Hcr1 for eolian soil particle samples are 35.3 (1.7) mT for low-coercivity phases, contributing 86.9–89.9% to the total SIRM and with S-ratio1 from 0.95–1. High-coercivity phases exhibited mean (SD) values of 191.4 (6.9) mT for Hcr2, with 10.0–13.0% contributions to the total SIRM and an S-ratio2 of 0.39–0.56 (Table S1, Supplementary Materials).

3.2. Soil Samples

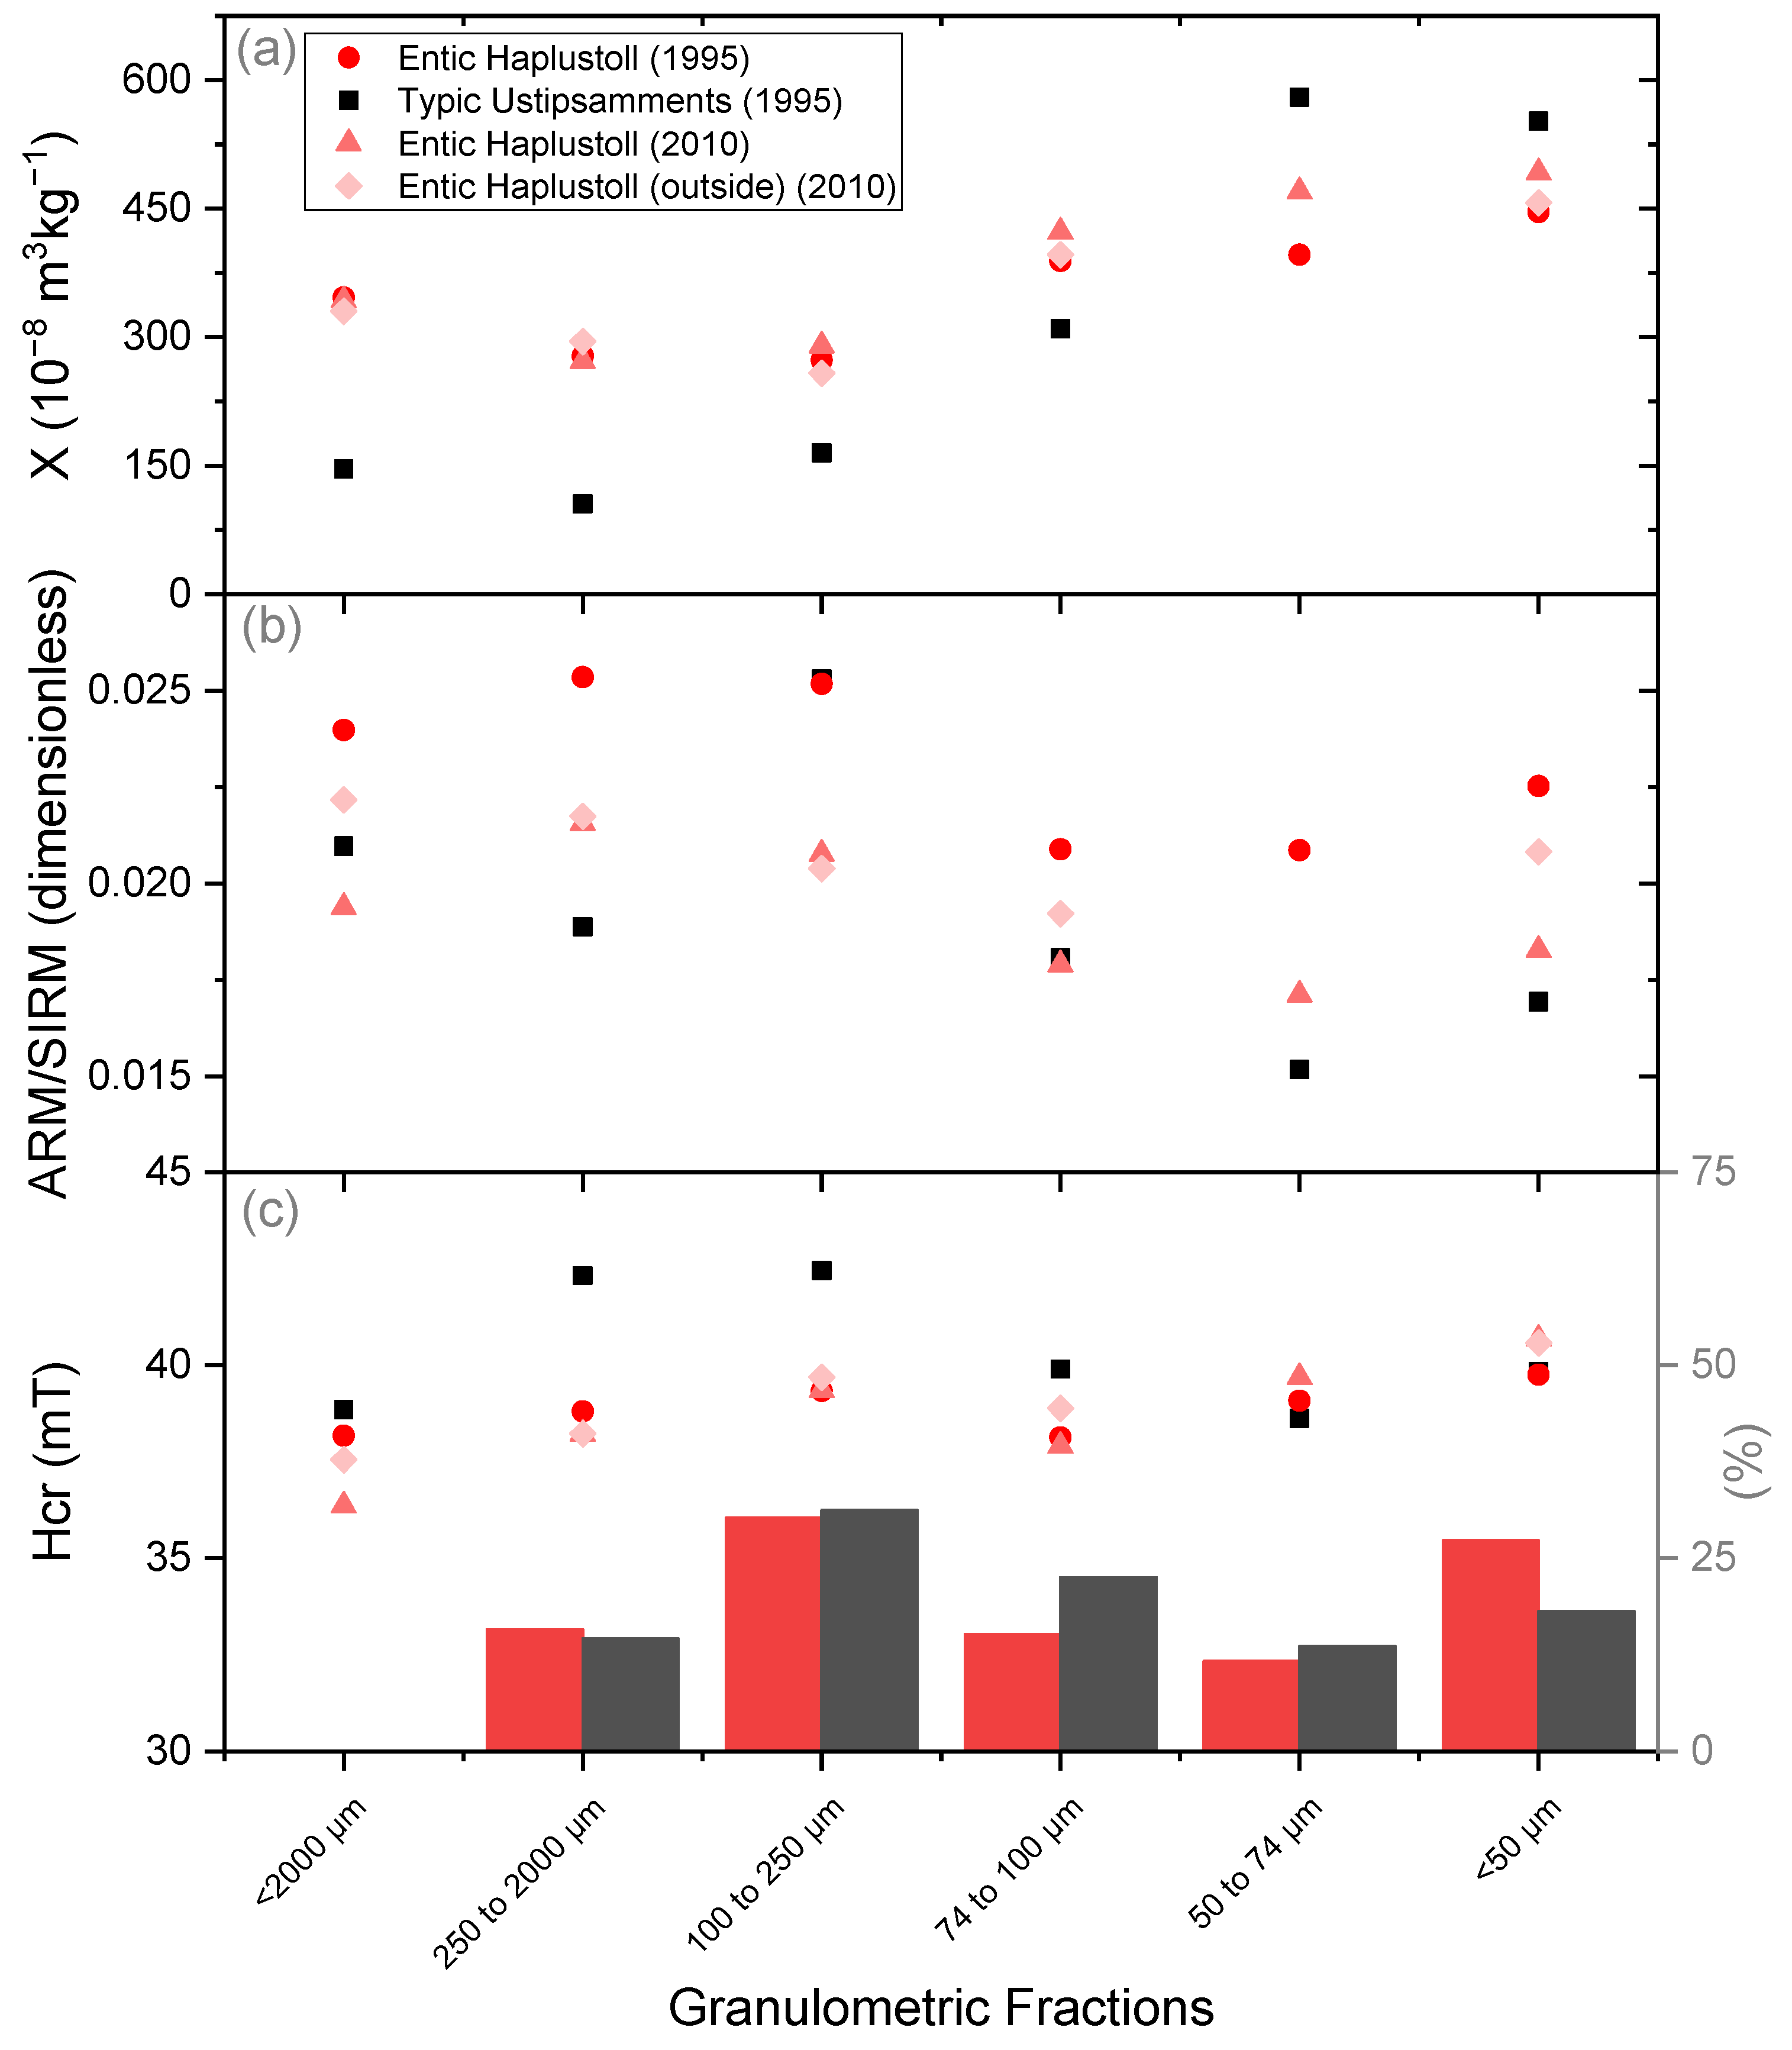
Magnetic measurements were also performed over twenty-three topsoil samples, i.e., four superficial soil samples and their corresponding granulometric fractions. The results of all magnetic parameters for the Entic Haplustoll (S1) and the Typic Ustipsamment (S2) (Figure 1b) are presented in detail in Table S2 (Supplementary Materials). In particular, parameters χ, ARM/SIRM, and Hcr for whole soil samples and each fraction are shown in Figure 4. χ values for whole soil samples (<2000 μm) were 345.9 × 10⁻⁸ m3kg−1 for S1 and 145.9 × 10⁻⁸ m3kg−1 for S2, while χ values for fractions varied from 104.8–580.3 × 10⁻⁸ m3kg−1 and 273.3 to 446.3 × 10⁻⁸ m3kg−1, respectively.
The anhysteretic ratios ARM/SIRM and χARM/χ values were 0.021–0.025 and 4.1–5.5, respectively, for S1 and 0.015–0.025 and 2.9–5.7 for S2, indicating in all cases the presence of fine magnetic particles.
The Hcr values varied from 38.1–39.8 mT (S1) and 38.6–42.5 mT (S2), while the S-ratio values ranged from 0.91–0.93 for S1 and 0.92–0.93 for S2.
Regarding thermomagnetic measurements, all samples show a decrease in magnetization of about 250 °C and then from 500–600 °C, as shown in samples SRT20, SR200, SRLA, An200, and AnLA in Figure 2b,d. For sample AnT20, this decreasing range is from 500–650 °C. These M-T measurements showed properties similar to those of the corresponding eolian soil particle samples: magnetite, maghemite, hematite, and titano-magnetite. For very fine sand fractions of 74–100 μm in soils S1 (sample SR200, Figure 2b) and S2 (An200, Figure 2d), cooling runs showed lower magnetization than heating runs, consistent with the previously explained presence of maghemite, magnetite, and hematite. In the case of whole soil (SRT20 and AnT20) and clay and silt fractions (SRLA and AnLA), cooling runs exhibit higher magnetization than heating runs of up to 30% at RT (Figure 2b,d), which indicates the presence and corresponding transformation of titano-magnetite and the transformation of paramagnetic minerals into magnetite.
Results from the experimental IRM-AF method for whole soil samples SRT20 (S1) and AnT20 (S2) are shown in Figure 3. Mean (SD) values of Hcr1 for soil samples are 35.2 (0.8) mT for low-coercivity phases, contributing 87.7–90.4% to the total SIRM and with an S-ratio1 from 0.95–0.99. High-coercivity phases exhibited mean (SD) values of 190.9 (4.6) mT for Hcr2, with 9.6–12.3% contributions to the total SIRM and an S-ratio2 from 0.33–0.55 (Table S1, Supplementary Materials).

4. Discussion

4.1. Soil Properties

The magnetic and textural properties of topsoil and eolian soil particle samples are studied complementarily to determine total soil eolian erosion in the Pampean Semi-Arid Region. The concentration-dependent magnetic parameters of the whole soil samples (χ = 345.9 × 10⁻⁸ m3kg−1 and SIRM = 56.0 × 10⁻³ Am2kg−1 for Entic Haplustoll; and χ = 146.0 × 10⁻⁸ m3kg−1 and SIRM = 25.7 × 10⁻³ Am2kg−1 for Typic Ustipsamment) are comparable to zonal Entic Haplustoll soils (Trenel, province of La Pampa), where χ = 300 × 10−8 m3kg−1 for a well-drained soil and χ = 230 × 10−8 m3kg−1 for a non-well-drained agricultural soil [48]. Results of the present study and the zonal soils are lower than previously reported ones on soils of a region located to the S-SE of the study area (χ = 516.5 × 10⁻⁸ m3kg−1 and SIRM = 78.1 × 10⁻³ Am2kg−1, Typic Ustipsamment; χ = 480.4 × 10⁻⁸ m3kg−1 and SIRM = 72.9 × 10⁻³ Am2kg−1, Entic Haplustoll [41]; and χ = 557.2 × 10⁻⁸ m3kg−1, Aridic Haplustoll, [49]). The χ of SRT20 and AnT20 granulometric fractions are comparable with those reported for topsoils in other studies conducted in La Pampa and Buenos Aires provinces [49,50,51]. A comparison between S1 and S2 revealed notable differences, with the χ value for S1 being more than double that of S2 for the whole soil sample (Figure 4). Differences in χ values between S1 and S2 tend to decrease for finer fractions. In addition, the highest values of χ (up to 581 × 10−8 m3kg−1) are reached in the very fine sand I (50–74 μm) and clay and silt (<50 μm) fractions of S2 (Figure 4a). Moreover, χ values of S1 fractions that range from 273.3–446.3 × 10⁻⁸ m3kg−1 exhibit less variation concerning the whole soil sample than the χ values of S2 fractions (χ = 104.9–580.3 × 10⁻⁸ m3kg−1, Table S2, Supplementary Materials). Considering that χ is a concentration-dependent magnetic parameter for soils and the contribution of each granulometric fraction, most of the magnetic susceptibility signal is contributed by the fine sand fraction, representing 30% of the whole soil samples in both sites. This fraction shows the most similar χ value to the whole soil sample (Table S2, Supplementary Materials). In S1, although variations in χ values between fractions are narrow, this soil has a higher proportion of silt and clay fraction (27.3%) that, together with the fine sand fraction, may primarily contribute to the total soil magnetic susceptibility.
The Hcr and S-ratio values for all topsoil samples indicate, as seen from the eolian soil particle samples, that soft magnetite-like minerals dominate over other magnetic phases. Thermomagnetic measurements detect the presence of magnetite, maghemite, hematite, and titano-magnetite in whole and fraction samples. Regarding the contribution of low- and high-coercivity phases, the experimental IRM-AF method (Figure 3) allowed us to determine low-coercivity phases (Hcr1 = 35.1 (0.8) mT; contribution of 87.7–90.4% to the total SIRM) and high-coercivity phases (Hcr2 = 190.9 (4.6) mT, contribution of 9.6–12.3% to the total SIRM; Table S1, Supplementary Materials). Remanent coercivity values of whole and fractions of S1 and S2 soil samples (Figure 4c) show a behavior opposite to that of χ and ARM/SIRM. Relatively higher Hcr values are observed in S2 than S1, and the Hcr values are comparable for whole and finer fractions (≈39–40 mT).
Except for the fine sand fraction (100 to 250 μm), the grain size-sensitive anhysteretic ratios of whole and fraction samples (1995) are higher for S1 (ARM/SIRM = 0.021–0.024; χARM/χ = 4.1–5.5) than for S2 (ARM/SIRM = 0.015–0.021; χARM/χ = 3.0–5.2, Table S2, Supplementary Materials and Figure 4b). This result indicates finer ferrimagnetic mineral fractions for S1 than S2 [52]. According to the anhysteretic ratio and the χARM/χ and the calibration particle size lines of magnetite [53], magnetic grain sizes range from 0.1–1 μm for S1 and S2, and coarser fractions have finer magnetic particles of 0.1–0.2 μm in size. Nevertheless, the whole soil samples show similar χARM/χ values, i.e., of 5.0 and 4.6 for S1 and S2, respectively (Table S2, Supplementary Materials), indicating that both sites have a similar proportion of very fine magnetic particles of 0.2 μm in size. Although each site exhibits differences in values of the anhysteretic ratios between coarser and finer fractions, differences in the percentual contribution of soil texture fractions seem to balance the magnetic grain size distribution.

4.2. The Entic Haplustoll and Erosion Events

The comparison of the Entic Haplustoll samples before (χbefore) and fifteen years after erosion (χ15_yr) events reveals slight differences of χ, i.e., Δχ = χ15_yr − χbefore, in coarser fractions. However, a considerable χ increase in the very fine sand II (Δχ = 34 × 10−8 m3kg−1), very fine sand I (Δχ = 74 × 10−8 m3kg−1), and clay and silt (Δχ = 46 × 10−8 m3kg−1) fractions is observed. Magnetic mineralogy, interpreted from coercivity remanent, does not change significantly for S1 over time (1995 and 2010), as observed in Figure 4c. The soil S1 samples collected fifteen years after erosion showed lower anhysteretic ratio values than before erosion events (Figure 4b). With time, this decrease in grain-size-dependent magnetic parameters (coarser magnetic particles, [52]) indicates the loss of finer magnetic particles and dominance of coarser magnetic particles in eroded soil S1 in 2010. The analysis of magnetic mineralogy, grain size, and concentration-dependent parameters suggests that, while particle size changes occurred over time for magnetic minerals, the low-coercivity ferrimagnetic minerals, such as magnetite and maghemite, do not change over fifteen years and dominate the magnetic signal.
Soil texture analysis of the fifteen years after erosion samples showed that the clay content remained relatively stable, while the main changes involved a ≈ 3% reduction in silt and a proportional increase in the amount of sand [37]. Modifications in the surface horizons resulted from the loss of different textural fractions, such as the very fine sand I and silt, with such modifications being more pronounced in loamy sand soils like the studied Entic Haplustoll (Table 2). Furthermore, these fractions’ loss led to changes in the mineral composition of the post-erosion surface horizon with a relative increase in the proportion of heavy (magnetite) to lighter (quartz) minerals [54]. This fact suggests that magnetic mineral content is mainly provided by the parental material rather than newly formed magnetic minerals, and its increase over time is related to the very fine sand I and silt loss that affects magnetic mineral concentration.

4.3. Eolian Soil Particles

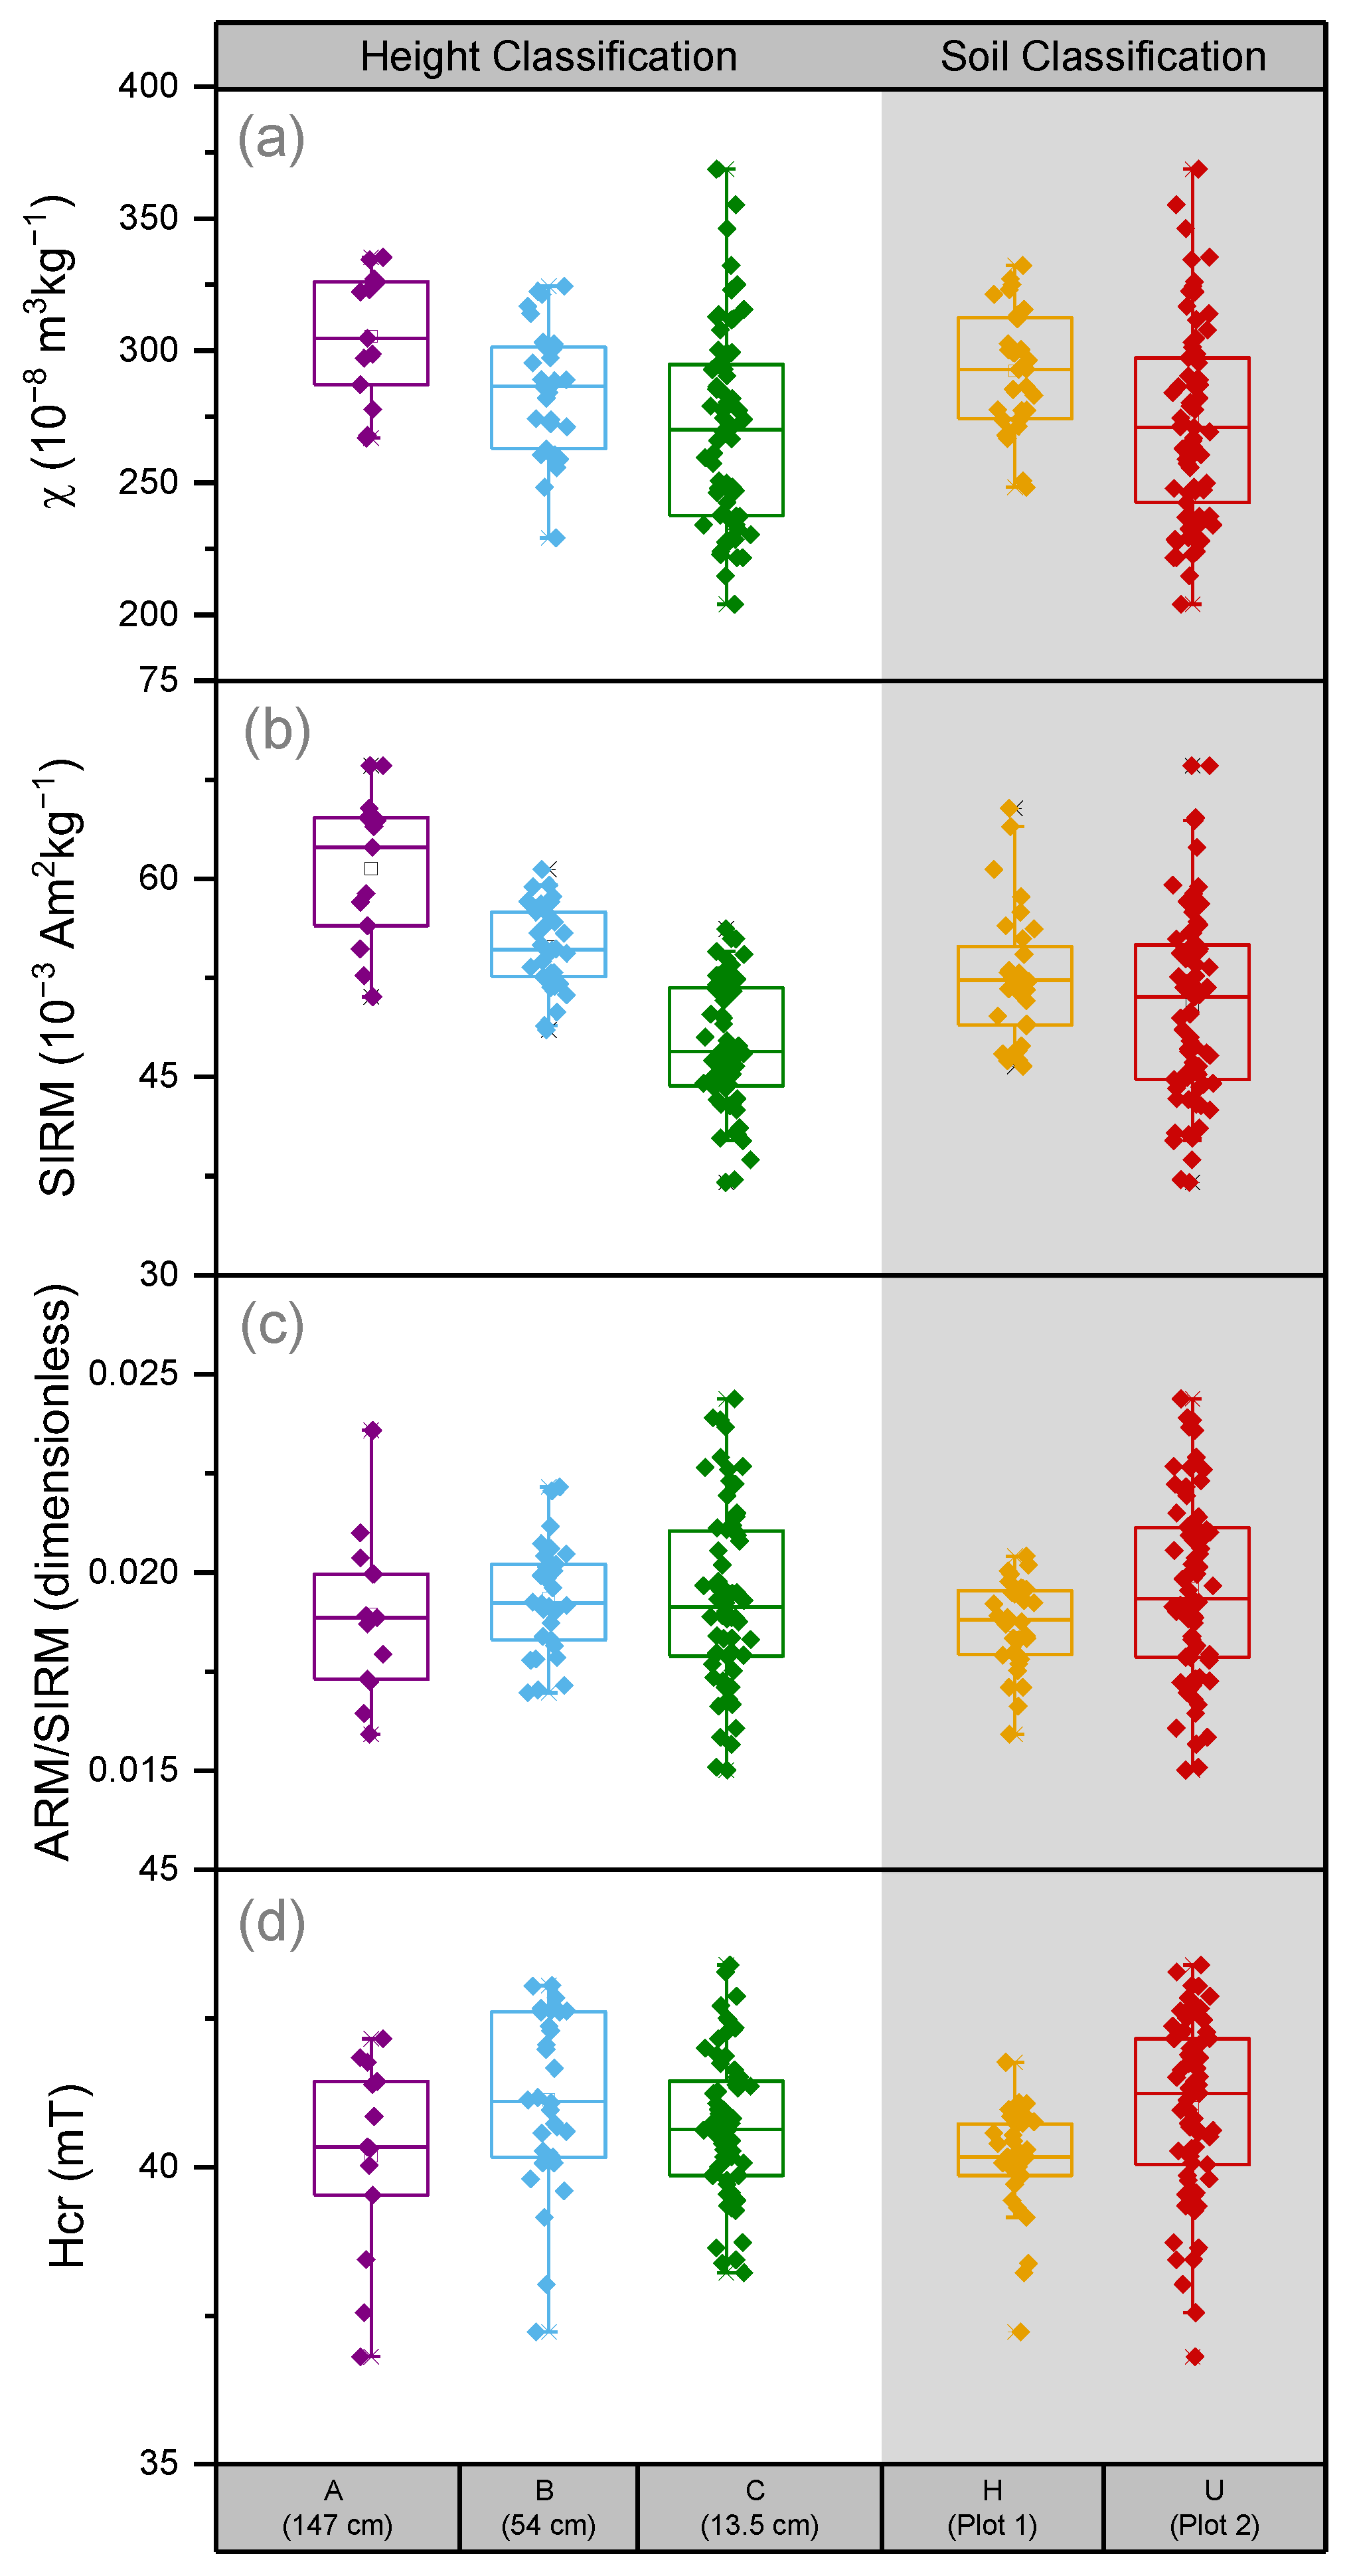
Figure 5 shows descriptive statistics of mass-specific magnetic susceptibility, saturation isothermal remanent magnetization, anhysteretic ratio, and remanent coercivity of eolian soil particle samples of subsets A, B, and C (collection heights) and subsets H and U (plot 1, Entic Haplustoll and plot 2, Typic Ustipsamment, respectively). The Kruskal–Wallis test indicates that populations (subsets A, B, and C) are not significantly different at the 0.05 significance level for grain size and mineralogy-dependent magnetic parameters (ARM/SIRM and Hcr); however, there are significant differences for χ and SIRM (Table S3, Supplementary Materials). Results of these concentration-dependent magnetic parameters show a reduction of the median values, i.e., χC = 270.1 × 10⁻⁸ m3kg−1 < χB = 286.5 × 10⁻⁸ m3kg−1 < χA = 304.7 × 10⁻⁸ m3kg−1 and SIRMC = 46.9 × 10⁻³ Am2kg−1 < SIRMB = 54.6 × 10⁻³ Am2kg−1 < SIRMA = 62.4 × 10⁻³ Am2kg−1, as height decreases from 147 cm to 13.5 cm above the ground. This pattern may be related to the textural composition of eroded soil material, as seen for soil samples (Figure 4). At higher heights, the finest fraction (<50 μm, clay and silt) represents around 51% and 37% of the collected material in plot 1 and plot 2, respectively [37]. The highest χ values of this fine fraction (Table S2, Supplementary Materials) and its content in BSNE collections (subset A) increase the magnetic signal. At the middle height, granulometric compositions are similar between fractions, and at the low height (subset C), the very fine sand II (74–100 μm) fraction is the most abundant collected material, as it represents 29.1% and 41.7% of the collected material in plot 1 and plot 2, respectively [37]. As discussed, these fractions with low χ values represent the surface horizon of soils affected by eolian erosion events. The fraction of fine sand and coarse silt (20–100 μm) is the most susceptible fraction to be transported by wind [55], and its proportion is significant in sandy soils (like S1, Table 2), where eolian erosion is firmly influenced by surface properties such as texture [12]. Material collected at 13.5 cm above the ground represents 80% (plot 1) and 87% (plot 2) of the total eroded material, being distinctively higher than at 54 cm above the ground (14% (plot 1) and 10% (plot 2)) and at 147 cm above the ground (6% (plot 1) and 3% (plot 2)) [37]. At 13.5 cm above the ground, most of the collected material is made of eroded soil particles by saltation processes, representing 50–70% of the total eroded material [56]. Thus, the wind storm event analysis will focus on comparisons among sites (i.e., plot 1 and plot 2) rather than between collection heights, as the latter classification does not reveal significant differences with other magnetic parameters and the most important information on the eolian erosion process is contained in samples collected closest to the soil surface (13.5 cm).
The comparison between sites, i.e., subset H and subset U, showed significant differences (at the 0.05 significance level) for parameters χ, ARM/SIRM, and Hcr, except for SIRM (Table S3, Supplementary Materials). This result agrees with differences in magnetic parameters χ, SIRM, and ARM/SIRM between topsoil samples, except parameter Hcr (Table S2, Supplementary Materials).

4.4. Eolian Erosion Events over One Year

For each wind storm event, the mean (SD) and median values of magnetic parameters were calculated and analyzed statistically. The Kruskal–Wallis test shows that the medians of χ, SIRM, Hcr, and ARM/SIRM were significantly different at plot 2 (Typic Ustipsamment) when comparing erosion events, i.e., wind storms T3–T8, T10, T15, and T17 (Table S3, Supplementary Materials). For plot 1 (Entic Haplustoll), the Hcr and ARM/SIRM medians were insignificantly different (Table S3, Supplementary Materials). Figure 6 compares mean mass-specific magnetic susceptibility and saturation of isothermal remanent magnetization for each wind storm event, in addition to meteorological data (reported by Aimar [37]) of rainfall, mean wind velocity, and duration of each storm during the studied year. The most remarkable result from the data is that χ and SIRM of eolian soil particles collected in plots 1 and 2 (sites S1 and S2, Figure 1b,c) show a similar pattern throughout the year. These variations indicate that changes in the magnetic mineral concentration of soil loss due to eolian erosion are associated with seasonal factors. In particular, it is associated with meteorological factors affecting erosion, such as rainfall and wind velocity, rather than specific soil properties. As observed in Figure 6, a peak of mass-specific magnetic susceptibility is reached for plot 1 (S1, Entic Haplustoll) in winter, when the wind velocity threshold for soil erosion is lower, meaning that soil detachment occurs at lower wind speeds [15]. However, contrary to what is expected, in storm T7, mean wind velocity did not exceed the wind velocity threshold for winter (21.9 km h−1), but it reached the maximum soil loss in S1 (8754 kg ha−1, Table 1) among the storms studied. Aimar et al. [9] explained that, in this case, site S1 was subjected to tillage with a disk harrow a few days before sampling. The highest amounts of soil loss in both sites may also be explained by the occurrence of highly short-lasting erosive gusts during the storm or low soil water content due to minimal rainfall during this season. Nevertheless, the complex processes involved in eolian soil erosion require more detailed meteorological data for further analysis alongside the magnetic properties of collected eolian material.
A bivariate analysis using Pearson’s coefficient was performed for storms studied in the search for correlations between magnetic parameters: χ, χFD%, ARM, χARM, ARM/SIRM, χARM/χ, SIRM, Hcr, and S-ratio (Table 2) and eolian erosion indicators: storm duration, mean wind velocity, eolian erosion, and erosion rate. The most important result was a significant direct correlation between concentration-dependent magnetic parameter SIRM and eolian erosion in plots 1 and 2 (Rplot 1 = 0.72 and Rplot 2 = 0.70; p < 0.05). Only for plot 2, significant correlations are between ARM–storm duration (Rplot 2 = 0.66; p < 0.05) and SIRM–erosion rate (Rplot 2 = 0.79; p < 0.01). The mean (SD) values of SIRM and eolian erosion, along with a linear regression model for each plot, are shown in Figure 7. A correlation was found with SIRM, rather than with χ, indicating a relationship with ferromagnetic minerals contributing to remanent magnetization. Thus, this result suggests that the material removed during erosion events tends to be richer in ferromagnetic minerals under favorable conditions for increased eolian erosion. This finding differs from previous results reported for soils affected by hydric erosion [21,22,30], and in these studies higher χ and SIRM values for soils were related to higher hydric erosion rates in the upper parts of the fields, while magnetic signal usually decreased downslope. On the other hand, this work agrees with some hydric and eolian erosion studies [20,23,27,32] that found higher values for χ in slope positions of fields with different land uses, where the redistributed material accumulates.
Results of concentration-dependent magnetic parameters of soils affected by either eolian or hydric erosion are very dependent on multiple factors that may not be fully explained by only studying the magnetic properties of soils. When comparing these results with those reported by others, the general trend may agree or contradict completely. The region has exhibited complexity, as for the modeling of Pampean loess, that may not adequately account for the existing magneto-climatological models, i.e., the wind vigor model (Siberia), the pedogenetic model (China), and the mixed behavior model (Argentina) [50].
Apart from this debate, the present result confirms the relation of soil magnetic properties with erosion events. Therefore, given that these findings are based on a limited number of magnetic and erosion parameters, these results should be interpreted cautiously because local and regional environmental influences may lead to incorrect interpretations. Thus, further research is needed to establish relationships between soil magnetic properties and eolian erosion indicators in different study areas.

5. Conclusions

Mixtures of iron oxides (magnetite, maghemite, and hematite) are determined in soils and eolian soil particle collections in an Entic Haplustoll and a Typic Ustipsamment from the central Pampean Semi-Arid Region. Room- and high-temperature-dependent measurements indicate that magnetite (Hcr = 33.3–37.5 mT) dominates other magnetic phases with a contribution ranging from 87.0–90.4% of the total SIRM. The grain-size-sensitive anhysteretic ratios of whole and fraction soil samples indicate fine ferrimagnetic minerals of 0.1–1 μm for S1 and S2. The concentration-dependent magnetic parameter comparison between soils reveals differences that tend to decrease for finer fractions (e.g., 50–74 and <50 μm), with the highest values of χ and SIRM.
The eolian soil particle collections at different heights show significant differences for χ and SIRM, showing a decrease of the median values from 147 cm (χA = 304.7 × 10⁻⁸ m3kg−1 and SIRMA = 62.4 × 10⁻³ Am2kg−1) to 13.5 cm above the ground (χC = 270.1 × 10⁻⁸ m3kg−1 and SIRMC = 46.9 × 10⁻³ Am2kg−1), which is related to the dominant textural composition of eroded soil material. On the contrary to the highest height, the very fine sand II (74–100 μm) fraction is the most abundant collected material at the lowest height. Since eolian soil particles collected close to the ground represent 80–87% of the total collected particles, valuable information on the erosion process is contained there.
Comparing nine erosion events, the medians of χ and SIRM were significantly different for plots 1 and 2. Thus, changes in the magnetic mineral concentration of eolian soil particles are associated with meteorological factors. A significant correlation between SIRM and eolian erosion is found in plots 1 and 2 (Rplot 1 = 0.72 and Rplot 2 = 0.70; p < 0.05). This result suggests that the material removed during erosion events tends to be richer in ferromagnetic minerals under favorable conditions for increased eolian erosion. The present result confirms the relationship of soils’ magnetic properties with erosion events and proposes using SIRM as a potential magnetic proxy for eolian soil erosion. However, these results should be interpreted cautiously because local and regional environmental influences may lead to incorrect interpretations.

Supplementary Materials

The following supporting information can be downloaded at: https://www.mdpi.com/article/10.3390/soilsystems9020060/s1, Table S1: Descriptive statistics (mean, min, max, standard deviation (SD)) of Hcr (mT), contribution (%) and S-ratio for phase 1 and phase 2 obtained through IRM-AF method for soil samples (n = 8) and eolian soil particle samples (n = 8); Table S2: Analytic data of magnetic parameters for soil (whole and fractions) samples from Entic Haplustoll and Typic Ustipsamment soils (La Pampa, Argentina); Table S3: Kruskal–Wallis test of sample subsets, such as particle collection height (Subsets A, B, and C), sites (Subsets H and U), and particle collection at each storm and site (Subsets Storm H and U T3–T8, T10, T15, T17). Statistical differences in median values of χ, SIRM, Hcr, and ARM/SIRM are indicated. YES indicates that differences are significant at the 0.05 level.

Author Contributions

Conceptualization, M.A.E.C. and A.A.B.; methodology, B.A.; formal analysis, B.A.; investigation, B.A.; writing—original draft preparation, B.A.; writing—review and editing, M.A.E.C., A.A.B., H.N.B. and S.B.A.; supervision, M.A.E.C. and A.A.B.; funding acquisition, M.A.E.C. All authors have read and agreed to the published version of the manuscript.

Funding

The authors thank the Universidad Nacional de la Pampa (UNLPAM), the Universidad Nacional del Centro de la Provincia de Buenos Aires (UNCPBA), Universidad Nacional Autónoma de Mexico (UNAM), and the National Council for Scientific and Technological Research (CONICET) for their financial support.

Institutional Review Board Statement

Not applicable.

Informed Consent Statement

Not applicable.

Data Availability Statement

Data will be made available on request.

Acknowledgments

The authors thank the Editor and three anonymous reviewers whose comments significantly improved this manuscript. Special thanks to J. Gargiulo and D. Buitrago Posada from CIFICEN and J. Escalante-González from IGc for their technical help and support. Brenda Alba is a graduate student in the Environment and Health Applied Sciences Doctoral Program (DCAAS) at UNICEN, Argentina.

Conflicts of Interest

The authors declare no conflicts of interest.

References

  1. Lal, R. Soil erosion and the global carbon budget. Environ. Int. 2003, 29, 437–450. [Google Scholar] [CrossRef]
  2. de Mendonça-Santos, M.L.; Comerma, J. Regional assessment of soil changes in Latin America and the Caribbean. In Status of the World’s Soil Resources (SWSR)—Main Report; Food and Agriculture Organization of the United Nations (FAO) and Intergovernmental Technical Panel on Soils (ITPS): Rome, Italy, 2016; Chapter 12; pp. 343–382. ISBN 978-92-5-109004-6. [Google Scholar]
  3. Casas, R.R.; Albarracín, G.F. El Deterioro Del Suelo Y Del Ambiente En La Argentina; Fundación Ciencia, Educación y Cultura. FECIC: Buenos Aires, Argentina, 2015; Volume 2, ISBN 978-950-9149-40-3. [Google Scholar]
  4. Sommer, S.; Cherlet, M.; Ivits, E. The Global Land Outlook, 1st ed.; UNCCD: Bonn, Germany, 2017. [Google Scholar]
  5. Buschiazzo, D.E. Management Systems in Southern South America. In Agronomy Monographs; Peterson, G.A., Unger, P.W., Payne, W.A., Eds.; American Society of Agronomy, Crop Science Society of America, Soil Science Society of America: Madison, WI, USA, 2006; pp. 395–425. ISBN 978-0-89118-265-8. [Google Scholar]
  6. Colazo, J.C.; Carfagno, P.; Gvozdenovich, J.; Buschiazzo, D. Soil Erosion. In The Soils of Argentina; Rubio, G., Lavado, R.S., Pereyra, F.X., Eds.; World Soils Book Series; Springer International Publishing: Cham, Switzerland, 2019; pp. 239–250. ISBN 978-3-319-76853-3. [Google Scholar]
  7. Buschiazzo, D.E.; Zobeck, T.M.; Abascal, S.A. Wind erosion quantity and quality of an Entic Haplustoll of the semi-arid pampas of Argentina. J. Arid Environ. 2007, 69, 29–39. [Google Scholar] [CrossRef]
  8. Michelena, R.O.; Irurtia, C.B. Susceptibility of soil to wind erosion in La Pampa province, Argentina. Arid Land Res. Manag. 1995, 9, 227–234. [Google Scholar] [CrossRef]
  9. Aimar, S.B.; Mendez, M.J.; Buschiazzo, D.E. Predicción de la erosión eólica potencial con el modelo EWEQ en dos suelos loesicos: Efectos de las condiciones climáticas. Cienc. Suelo 2011, 29, 253–264. [Google Scholar]
  10. Buschiazzo, D.E.; Zobeck, T.M. Validation of WEQ, RWEQ and WEPS wind erosion for different arable land management systems in the Argentinean Pampas. Earth Surf. Process. Landf. 2008, 33, 1839–1850. [Google Scholar] [CrossRef]
  11. Panebianco, J.E.; Buschiazzo, D.E. Erosion predictions with the Wind Erosion Equation (WEQ) using different climatic factors. Land. Degrad. Dev. 2008, 19, 36–44. [Google Scholar] [CrossRef]
  12. Avecilla, F.; Panebianco, J.E.; Buschiazzo, D.E. Variable effects of saltation and soil properties on wind erosion of different textured soils. Aeolian Res. 2015, 18, 145–153. [Google Scholar] [CrossRef]
  13. Colazo, J.C.; Buschiazzo, D.E. Soil dry aggregate stability and wind erodible fraction in a semiarid environment of Argentina. Geoderma 2010, 159, 228–236. [Google Scholar] [CrossRef]
  14. De Oro, L.A.; Colazo, J.C.; Avecilla, F.; Buschiazzo, D.E.; Asensio, C. Relative soil water content as a factor for wind erodibility in soils with different texture and aggregation. Aeolian Res. 2019, 37, 25–31. [Google Scholar] [CrossRef]
  15. de Oro, L.A.; Buschiazzo, D.E. Threshold wind velocity as an index of soil susceptibility to wind erosion under variable climatic conditions. Land. Degrad. Dev. 2009, 20, 14–21. [Google Scholar] [CrossRef]
  16. Iturri, L.A.; Avecilla, F.; Hevia, G.G.; Buschiazzo, D.E. Comparing adjacent cultivated and “virgin” soils in wind erosion affected environments can lead to errors in measuring soil degradation. Geoderma 2016, 264, 42–53. [Google Scholar] [CrossRef]
  17. Mendez, M.J.; Buschiazzo, D.E. Wind erosion risk in agricultural soils under different tillage systems in the semiarid Pampas of Argentina. Soil Till. Res. 2010, 106, 311–316. [Google Scholar] [CrossRef]
  18. Maher, B.A. The magnetic properties of Quaternary aeolian dusts and sediments, and their palaeoclimatic significance. Aeolian Res. 2011, 3, 87–144. [Google Scholar] [CrossRef]
  19. Royall, D. Use of mineral magnetic measurements to investigate soil erosion and sediment delivery in a small agricultural catchment in limestone terrain. Catena 2001, 46, 15–34. [Google Scholar] [CrossRef]
  20. Ding, Z.; Zhang, Z.; Li, Y.; Zhang, L.; Zhang, K. Characteristics of magnetic susceptibility on cropland and pastureland slopes in an area influenced by both wind and water erosion and implications for soil redistribution patterns. Soil Till. Res. 2020, 199, 104568. [Google Scholar] [CrossRef]
  21. Jordanova, D.; Jordanova, N.; Petrov, P. Pattern of cumulative soil erosion and redistribution pinpointed through magnetic signature of Chernozem soils. Catena 2014, 120, 46–56. [Google Scholar] [CrossRef]
  22. Quijano, L.; Chaparro, M.A.E.; Marie, D.C.; Gaspar, L.; Navas, A. Relevant magnetic and soil parameters as potential indicators of soil conservation status of Mediterranean agroecosystems. Geophys. J. Int. 2014, 198, 1805–1817. [Google Scholar] [CrossRef]
  23. Liu, L.; Zhang, K.; Zhang, Z.; Qiu, Q. Identifying soil redistribution patterns by magnetic susceptibility on the black soil farmland in Northeast China. Catena 2015, 129, 103–111. [Google Scholar] [CrossRef]
  24. Jakšík, O.; Kodešová, R.; Kapička, A.; Klement, A.; Fér, M.; Nikodem, A. Using magnetic susceptibility mapping for assessing soil degradation due to water erosion. Soil Water Res. 2016, 11, 105–113. [Google Scholar] [CrossRef]
  25. Menshov, O.; Kruglov, O.; Vyzhva, S.; Nazarok, P.; Pereira, P.; Pastushenko, T. Magnetic methods in tracing soil erosion, Kharkov Region, Ukraine. Stud. Geophys. Geod. 2018, 62, 681–696. [Google Scholar] [CrossRef]
  26. Nazarok, P.; Kruglov, O.; Menshov, O.; Kutsenko, M.; Sukhorada, A. Mapping soil erosion using magnetic susceptibility. A case study in Ukraine. Solid Earth Discuss. 2014, 6, 831–848. [Google Scholar] [CrossRef]
  27. Ed-Dakiri, S.; Etebaai, I.; Moussaoui, S.E.; Tawfik, A.; Lamgharbaj, M.; Talibi, H.E.; Dekkaki, H.C.; Taher, M. Assessing soil erosion risk through geospatial analysis and magnetic susceptibility: A study in the Oued Ghiss dam watershed, Central Rif, Morocco. Sci. Afr. 2024, 26, e02401. [Google Scholar] [CrossRef]
  28. Fattakhova, L.A.; Kuzina, D.M.; Antonenko, V.V. Identification of erosion processes in the soils of the coastal territory of lake Kandrykul (Republic of Bashkortostan). Izvestiya 2025, 336, 17–25. [Google Scholar] [CrossRef]
  29. Moustakim, M.; Benmansour, M.; Bouarfa, R.; Amenzou, N.E.; Benkdad, A.; Damnati, B. Evaluation of the correlation between Caesium-137 inventory, magnetic susceptibility, and organic matter content to assess soil erosion status in two agricultural fields within El Hachef watershed of northwest Morocco. Heliyon 2025, 11, e41650. [Google Scholar] [CrossRef]
  30. Liu, L.; Zhang, Z.; Zhang, K.; Liu, H.; Fu, S. Magnetic susceptibility characteristics of surface soils in the Xilingele grassland and their implication for soil redistribution in wind-dominated landscapes: A preliminary study. Catena 2018, 163, 33–41. [Google Scholar] [CrossRef]
  31. Ravi, S.; Gonzales, H.B.; Buynevich, I.V.; Li, J.; Sankey, J.B.; Dukes, D.; Wang, G. On the development of a magnetic susceptibility-based tracer for aeolian sediment transport research. Earth Surf. Process. Landf. 2019, 44, 672–678. [Google Scholar] [CrossRef]
  32. Jordanova, D.; Jordanova, N.; Atanasova, A.; Tsacheva, T.; Petrov, P. Soil tillage erosion estimated by using magnetism of soils—A case study from Bulgaria. Environ. Monit. Assess. 2011, 183, 381–394. [Google Scholar] [CrossRef]
  33. INTA; Gobierno de La Pampa; Universidad Nacional de La Pampa. Inventario Integrado De Los Recursos Naturales De La Provincia De La Pampa: Clima, Geomorfología, Suelo Y Vegetación; Instituto Nacional de Tecnología Agropecuaria: Buenos Aires, Argentina; Universidad Nacional de la Pampa: Santa Rosa, Argentina, 1980; 493p.
  34. SMN. Servicio Meteorológico Nacional. Available online: https://www.smn.gob.ar/estadisticas (accessed on 14 April 2025).
  35. USDA. Soil Taxonomy: A Basic System of Soil Classification for Making an Interpreting Soil Surveys; Soil Conservation Service Agriculture: Washington, DC, USA, 1975. Available online: https://www.amazon.com/Soil-Taxonomy-Classification-Interpreting-Surveys/dp/B000K6Y8VG (accessed on 13 April 2025).
  36. Bianchi, A.R.; Cravero, S.A.C. Atlas Climático Digital De La República Argentina; Instituto Nacional de Tecnología Agropecuaria (INTA): Salta, Argentina, 2010; ISBN 978-987-1623-95-2.
  37. Aimar, S.B. Estimaciones Cualitativas y Cuantitativas de Pérdidas Por Erosión Eólica en Suelos de la Región Semiárida Pampeana Central. Masther’s Thesis, Universidad Nacional del Sur, Bahia Blanca, Argentina, 2002. [Google Scholar]
  38. Fryrear, D.W. A field dust sampler. J. Soil Water Conserv. 1986, 41, 117–120. [Google Scholar] [CrossRef]
  39. Walden, J. Sample collection and preparation. In Environmental Magnetism: A Practical Guide Technical Guide Series; Walden, J., Oldfield, F., Smith, J., Eds.; Quaternary Research Association: London, UK, 1999; pp. 26–34. [Google Scholar]
  40. Dearing, J.A.; Dann, R.J.L.; Hay, K.; Lees, J.A.; Loveland, P.J.; Maher, B.A.; O’Grady, K. Frequency-dependent susceptibility measurements of environmental materials. Geophys. J. Int. 1996, 124, 228–240. [Google Scholar] [CrossRef]
  41. Chaparro, M.A.E.; del Moralejo, M.P.; Böhnel, H.N.; Acebal, S.G. Iron oxide mineralogy in Mollisols, Aridisols and Entisols from southwestern Pampean region (Argentina) by environmental magnetism approach. Catena 2020, 190, 104534. [Google Scholar] [CrossRef]
  42. Chaparro, M.A.E.; Lirio, J.M.; Nuñez, H.; Gogorza, C.S.G.; Sinito, A.M. Preliminary magnetic studies of lagoon and stream sediments from Chascomús Area (Argentina)—Magnetic parameters as indicators of heavy metal pollution and some results of using an experimental method to separate magnetic phases. Environ. Geol. 2005, 49, 30–43. [Google Scholar] [CrossRef]
  43. Leonhardt, R. Analyzing rock magnetic measurements: The RockMagAnalyzer 1.0 software. Comput. Geosci. 2006, 32, 1420–1431. [Google Scholar] [CrossRef]
  44. Conover, W.J. Practical Nonparametric Statistics, 3rd ed.; John Wiley & Sons Inc.: New York, NY, USA, 1999; ISBN 978-0-471-16068-7. [Google Scholar]
  45. Liu, Q.; Roberts, A.P.; Larrasoaña, J.C.; Banerjee, S.K.; Guyodo, Y.; Tauxe, L.; Oldfield, F. Environmental magnetism: Principles and applications. Rev. Geophys. 2012, 50, RG4002. [Google Scholar] [CrossRef]
  46. Cornell, R.M.; Schwertmann, U. The Iron Oxides: Structure, Properties Reactions, Occurrences and Uses; Wiley: New York, NY, USA, 2003. [Google Scholar]
  47. Dunlop, D.J.; Özdemir, Ö. Magnetizations in Rocks and Minerals. In Geomagnetism Treatise on Geophysices; Schubert, G., Ed.; Elsevier: Amsterdam, The Netherlands, 2007; Volume 5, pp. 277–336. [Google Scholar]
  48. Bartel, A.A.; Chaparro, M.A.E.; Pires, M.; de Elorriaga, E.; Martinez Uncal, C. Influencia del hidromorfismo en la susceptibilidad magnética de suelos del departamento Trenel, La Pampa (Summary). In Proceedings of the Actas de Resúmenes del Decimoquinto Encuentro del Centro Internacional de Ciencias de la Tierra, Mendoza, Argentina, 23–25 November 2020; CNEA: Buenos Aires, Argentina, 2020. [Google Scholar]
  49. Bartel, A.A.; Bidegain, J.C.; Sinito, A.M. Magnetic parameter analysis of a climosequence of soils in the Southern Pampean Region, Argentina. Geof. Int. 2011, 50, 9–22. [Google Scholar] [CrossRef]
  50. Bidegain, J.C.; Rico, Y.; Bartel, A.; Chaparro, M.A.E.; Jurado, S. Magnetic parameters reflecting pedogenesis in Pleistocene loess deposits of Argentina. Quat. Int. 2009, 209, 175–186. [Google Scholar] [CrossRef]
  51. Samus, M.L.G.; Rico, Y.; Bidegain, J.C. Señal magnética en suelos del centro de la provincia de Buenos Aires, Argentina. Lat. Am. J. Sedimentol. Basin Anal. 2016, 23, 93–110. [Google Scholar]
  52. Dunlop, D.J.; Özdemir, Ö. Rock Magnetism: Fundamentals and Frontiers, 1st ed.; Cambridge University Press: Cambridge, UK, 1997; ISBN 978-0-521-00098-7. [Google Scholar]
  53. King, J.; Banerjee, S.K.; Marvin, J.; Özdemir, Ö. A comparison of different magnetic methods for determining the relative grain size of magnetite in natural materials: Some results from lake sediments. Earth Planet. Sci. Lett. 1982, 59, 404–419. [Google Scholar] [CrossRef]
  54. Buschiazzo, D.E.; Taylor, V. Efectos de la erosión eólica sobre algunas propiedades de suelos de la Región Semiárida Pampeana Central. Cienc. Suelo 1993, 10, 46–53. [Google Scholar]
  55. Chepil, W.S. Soil Conditions That Influence Wind Erosion; United States Department of Agriculture’s Economic Research Service: Washington, DC, USA, 1958; p. 28.
  56. Kok, J.F.; Parteli, E.J.R.; Michaels, T.I.; Karam, D.B. The physics of wind-blown sand and dust. Rep. Prog. Phys. 2012, 75, 106901. [Google Scholar] [CrossRef]
Figure 1. (a) Aridic index map of Argentina adapted from [36]; (b) location of the studied sites S1 and S2 (circled); (c) the plot or 1 ha square experimental field of each site and distribution (black circles) of the sampler collectors; (d) pole with the three BSNE dust samplers placed at 147.0 (A), 54.0 (B), and 13.5 cm (C).
Soilsystems 09 00060 g001
Figure 2. Temperature-dependent magnetization M-T applying a high magnetic field (0.5 T) for soil particle collections (plots 1 and 2) and soil samples. Thermomagnetic heating and cooling runs were measured for eolian soil particle samples (a,c), as well as whole topsoil samples (whole and fractions) (b,d).
Soilsystems 09 00060 g002
Figure 3. Separation of IRM backfield measurements into two phases using the experimental IRM-AF method by Chaparro et al. [42]. Curves of total back IRM (without AF filter) and achieved phases (Phase 1 and Phase 2) for soil samples (SRT20 and AnT20) and eolian soil particle samples (5HC3 and 7UB) are shown.
Soilsystems 09 00060 g003
Figure 4. Magnetic properties of topsoil samples and each granulometric fraction from the Entic Haplustoll (S1) and the Typic Ustipsamment (S2). (a) Mass-specific magnetic susceptibility χ, (b) anhysteretic ratio ARM/SIRM, and (c) remanence coercivity Hcr and the percentual contribution of each granulometric fraction for Entic Haplustoll (red bars) and Typic Ustipsamment (dark grey bars).
Soilsystems 09 00060 g004
Figure 5. Magnetic parameters: (a) mass-specific magnetic susceptibility χ; (b) saturation isothermal remanent magnetization (SIRM); (c) anhysteretic ratio ARM/SIRM; and (d) remanence coercivity Hcr for subset of samples classified by collection height: subset A (147 cm, n = 13), subset B (54 cm, n = 30), and subset C (13.5 cm, n = 64); or by soil types: subset H (Entic Haplustoll, n = 32) and subset U (Typic Ustipsamment, n = 75). The box delineates the interquartile range 25–75% (q1–q3), and the horizontal line in the box indicates the median. The mean value is indicated with an open square; vertical lines represent the 5–95% range, and minimum and maximum values are shown using whiskers.
Soilsystems 09 00060 g005
Figure 6. Mean (SD) values for each storm over 1995 in plot 1 (S1, Entic Haplustoll) and plot 2 (S2, Typic Ustipsamment) of (a) χ and (b) SIRM; (c) monthly rainfall; and (d) mean wind velocity and storm duration, meteorological data by Aimar et al. [9].
Soilsystems 09 00060 g006
Figure 7. Scatter plot and linear regression equation of total eolian erosion and SIRM for plots 1 (S1, Entic Haplustoll) and 2 (S2, Typic Ustipsamment).
Soilsystems 09 00060 g007
Table 1. Total eolian erosion, storm duration, and wind speed data from 1995 by Aimar et al. [9] for each erosion event studied in this work.
Site
Entic
Haplustoll (S1)
Typic
Ustipsamment (S2)
VariableDateStorm DurationWind SpeedTotal Eolian ErosionTotal Samples Studied (Present Work)Total Eolian ErosionTotal Samples Studied (Present Work)
Unitsdd-monthhkm h−1kg ha−1 kg ha−1
Year 199523-February1317.1547628764
29-March1319.56412464634
16-June3218.81498781806
30-June2023.73734345353
10-July3819.78754350203
25-July43193214162244
1-September4818.46321016,6813
24-October3821.55713310,5843
21-November5119.7697325,4722
Table 2. Detailed data about soil texture, moisture equivalent (gravimetric), and organic matter for horizon A of each study site [37].
Entic
Haplustoll (S1)
Typic
Ustipsamment (S2)
Analytic Soil DataUnitsHorizon A
Organic matter%1.61.1
Moisture equivalent11.57.5
Clay, 0–2 μm10.27.3
Fine silt, 2–20 μm7.46.0
Coarse silt, 20–50 μm9.74.8
Very fine sand I, 50–74 μm11.713.6
Very fine sand II, 74–104 μm15.022.5
Fine sand, 104–246 μm30.231.2
Medium and coarse sand, 246–2000 μm15.714.6
Table 3. Descriptive statistics of magnetic parameters (mean, min, max, standard deviation (SD)) for five data subsets from Entic Haplustoll and Typic Ustipsamment soils (La Pampa, Argentina). The magnetic parameters are mass-specific susceptibility (χ), frequency-dependent susceptibility (χFD%), mass-specific anhysteretic susceptibility (χARM) and anhysteretic ratios (ARM/SIRM; χARM/χ), saturation isothermal remanent magnetization (SIRM), remanent coercivity (Hcr), and S-ratio.
VariableSubset A (n = 13)Subset B (n = 30)Subset C (n = 64)
MinMaxMeanSDMinMaxMeanSDMinMaxMeanSD
χ (10−8 m3 kg−1)266.9335.4305.324.7229.2324.4284.523.8204.0368.7270.636.8
χFD% (%)0.75.43.51.6−2.66.62.81.80.66.62.61.3
ARM (10−6 A m2 kg−1)866.11276.31144.8109.7891.21196.71060.384.4709.11087.6911.080.9
χARM (10−8 m3 kg−1)861.91690.11403.3254.81051.71611.91365.5144.7823.71475.11179.7134.8
χARM2.85.74.60.93.57.04.80.72.86.44.40.8
SIRM (10−3A m2 kg−1)51.168.660.85.848.660.754.93.237.056.247.44.7
ARM/SIRM0.0160.0240.0190.0020.0170.0220.0190.0010.0150.0240.0190.002
Hcr (mT)36.8142.1640.191.7037.2343.0641.121.4938.2243.4040.661.21
S-ratio0.7940.944----0.8680.959----0.7960.962----
VariableSubset H (n = 32)Subset U (n = 75)
χ (10−8 m3 kg−1)248.3332.2292.222.4204.0368.7272.936.7
χFD% (%)06.62.51.70.66.62.91.4
ARM (10−6 A m2 kg−1)818.41276.3980.1100.2709.11245.3981.7132.7
χARM (10−8 m3 kg−1)903.41541.51252.1146.4823.71690.11261.9197.2
χARM2.85.24.30.52.87.04.70.8
SIRM (10−3A m2 kg−1)45.865.352.54.937.068.650.57.2
ARM/SIRM0.0160.0200.0190.0010.0150.0240.0200.002
Hcr (mT)37.241.840.10.936.843.441.01.5
S-ratio0.7960.962----0.7940.959----
Disclaimer/Publisher’s Note: The statements, opinions and data contained in all publications are solely those of the individual author(s) and contributor(s) and not of MDPI and/or the editor(s). MDPI and/or the editor(s) disclaim responsibility for any injury to people or property resulting from any ideas, methods, instructions or products referred to in the content.