Article

Nitrogen Budget and Statistical Entropy Analysis of the Tiber River Catchment, a Highly Anthropized Environment

by
Alessandra De Marco
1,
Maria Francesca Fornasier
2,
Augusto Screpanti
1,
Danilo Lombardi
3 and
Marcello Vitale
3,*
1
Department for Sustainability, Italian National Agency for New Technologies, Energy and Sustainable Economic Development—Casaccia, Via Anguillarese, S. Maria di Galeria, 301-00123 Rome, Italy
2
Department for Environmental Assessment, Controls and Sustainability, Institute for Environmental Protection and Research (ISPRA), Via Vitaliano Brancati, 48-00144 Rome, Italy
3
Department of Environmental Biology, Sapienza University of Rome, Piazzale Aldo Moro, 5-00185 Rome, Italy
*
Author to whom correspondence should be addressed.
Soil Syst. 2022, 6(1), 17; https://doi.org/10.3390/soilsystems6010017
Submission received: 23 November 2021 / Revised: 18 January 2022 / Accepted: 20 January 2022 / Published: 2 February 2022
(This article belongs to the Special Issue Advancements in Soil and Sustainable Agriculture)

Abstract

:
Modern farming causes a decline in the recycling of the soil’s inorganic matter due to losses by leaching, runoff, or infiltration into the groundwater. The Soil System Budget approach was applied to evaluate the net N budget at the catchment and sub-catchment levels of the Tiber River (central Italy) in order to establish the causes for different N budgets among the sub-catchments. Statistical Entropy Analysis (SEA) was used to evaluate the N efficiency of the Tiber River and its sub-catchments, providing information on the dispersion of different N forms in the environment. The total N inputs exceeded the total outputs, showing a low N retention (15.8%) at the catchment level, although some sub-catchments showed higher N retention values. The Utilized Agricultural Area was important in the determination of the N balance, as it was linked to zoo- and agricultural activities, although the Random Forest analysis showed that the importance ranking changed with the land use. The low N retention of the Tiber catchment was due to the soil characteristics (Cambisols and Leptosols), loads from atmospheric deposition, biological fixation, and the livestock industry. The SEA simulations showed a reduction of the N released into the atmosphere and groundwater compartments from 34% to 6% through a reduction of the N loads by 50%.

1. Introduction

Freshwater is essential for agriculture, industry, human existence, and energy production [1,2], but it is also a limited resource on Earth [3]. Water quality is affected by human activities such as industrialization, urbanization, tourism, and garbage production, and by natural events such as rainfall, erosion, and climate change [4,5,6]. The reduction of inland water’s availability as a resource constitutes one of the most important environmental problems of the last century [7]. Surface water and wastewater discharges are the main factors causing an increase of the inorganic nutrients in the rivers, lakes, and seas, inducing the eutrophication phenomenon and water pollution [2]. It is known that nitrogen (N) pollution is a global problem [8,9]. The N and phosphorus (P) concentrations play a key role in the characterization of the ecological status of water systems. As they are essential for the biogeochemical cycle, these elements can enter the waters through anthropogenic activities such as domestic sewage, industrial, and “unknown” source spills [10,11]. Excessive N and P loads are often considered to be the major cause of eutrophication, which is one of the most serious environmental threats to aquatic ecosystems. Because of eutrophication and algal blooms, many environmental problems occur, such as the reduction of oxygen in the water, which causes the death of aquatic organisms, taste and bad smell problems, and biodiversity loss [12,13,14].
Over the last 50 years, nitrogen cycling in watersheds has been heavily exploited by urbanization, and agriculture and animal farming have undergone major alterations because of multiple interplaying factors [15]. Sewage treatment plants, manure production and spreading, the excessive use of industrially fixed N-based fertilisers, fixation by crops, and atmospheric deposition have resulted in punctual and diffuse releases of reactive N species into the environment, greatly exceeding the crop uptake and other N-removal processes in both the soil and aquatic compartments [16,17,18,19].
Concurrently, intensive agricultural practices have simplified the landscape and removed the natural buffers such as vegetated riparian areas and wetlands [20]. The absence of these elements enhanced the lateral and vertical movements of nitrogen, and made the ground surface and groundwater more prone to N contamination [21]. This risk is augmented by the high use of water for irrigation, and by traditional practices based on soil flooding over permeable areas, thus enhancing the N losses through runoff and leaching [17,22]. Furthermore, high infiltration rates decrease the groundwater residence time, altering the rates of biogeochemical reactions [23]. High N concentrations in the surface waters may saturate both microbial processes and uptake by primary producers, making the N control by natural processes less effective [24,25]. This increased N loading has, therefore, a suite of negative consequences, including demonstrated health effects and contributions to global warming [26,27]. The recent literature reports numerous studies on N dynamics at the catchment scale [28,29], investigations of nitrate ion ( N O 3 ) origin in surface watercourses [30,31,32,33], and evidence of the increase of the reactive nitrogen concentration in river basins [18].
Agricultural practices can have low nitrogen-use-efficiency (NUE), especially under increasing N inputs. As a result, losses of reactive N to the environment have increased greatly, including the nitrate pollution of watercourses and emissions of both ammonia and nitrous oxide into the atmosphere, with impacts on biodiversity and climate change [34]. In response to population growth and the associated activities, riverine nutrient loads have increased, leading to a deterioration in the ecological state of rivers, lakes, reservoirs, and marine areas in many regions of the world [35,36,37]. Consequently, great attention is paid to the surface–groundwater interaction [38,39], and to assimilation and biological removal processes [31,40]. Iit is important to understand the dynamics underlining the nutrient transportation by water flows in rivers and lakes because they are critical for resource management, the conservation of ecological processes and functions, and the prevention of eutrophication [41].
Open questions about the fate of the N surplus in impacted watersheds concern where and how long the excess N accumulates, and the processes and transformations that it undergoes [42,43]. Because of increasing problems concerning water quality and quantity, the European Commission has launched the Water Framework Directive (WFD) [44,45]. Member States that availed themselves of an extension beyond 2015 were required to achieve all of the WFD environmental objectives by the end of the second and third management cycles, which extended from 2015 to 2021, and from 2021 to 2027, respectively [46]. The most important objectives of the WFD were to protect the status of water bodies, and for all of the bodies of the European Union to achieve good ecological status by the target dates (2021 and 2027) through an integrated approach to water management [47]. However, fifteen years after the WFD was introduced, the achievement of its objectives remains a challenge, with 47% of EU surface waters not reaching a good ecological status in 2015, which was a central objective of the EU water legislation [48]. Furthermore, despite considerable effort, the accurate modelling of N sources, transformations, and sinks at the catchment scale remains a challenge. The improved knowledge on the uptake capacity of N of the watersheds and the response of biological reserves to climate change or N deposition, which are both pressing concerns, have also provided evidence for increasing anthropogenic N emissions [49].
In this context, a national initiative was launched in Italy at the beginning of 2014 (Italian Nitrogen Network, INN), which included limnologists, ecologists, biologists, agronomists, and hydrogeologists working with nitrogen and its consequences on ecosystems and ecosystem services. The initiative consisted in the sharing of a common methodology to evaluate the nitrogen budget at the catchment level. Data collection and budget calculation were also discussed and shared in the INN. In this frame, our research is an interesting case study which was intended to obtain information about nitrogen use efficiency, and to acquire better knowledge of nitrogen sources and fates in the catchment area of the Tiber River (Central Italy). Therefore, the main aim of this work concerns the integration of the nitrogen budget model, which was quantified based on the difference between inputs and outputs, with the system ability to dilute or concentrate nitrogenous substances within the entire river catchment and in its sub-catchments. These two complementary approaches allow the estimation of the impacts of nitrogen use change scenarios at the local level and the definition of the spatial distribution of the highest risk of nitrogen accumulation both at the catchment level and local areas (at the sub-catchment level), to suggest conceivable corrective actions.

2. Materials and Methods
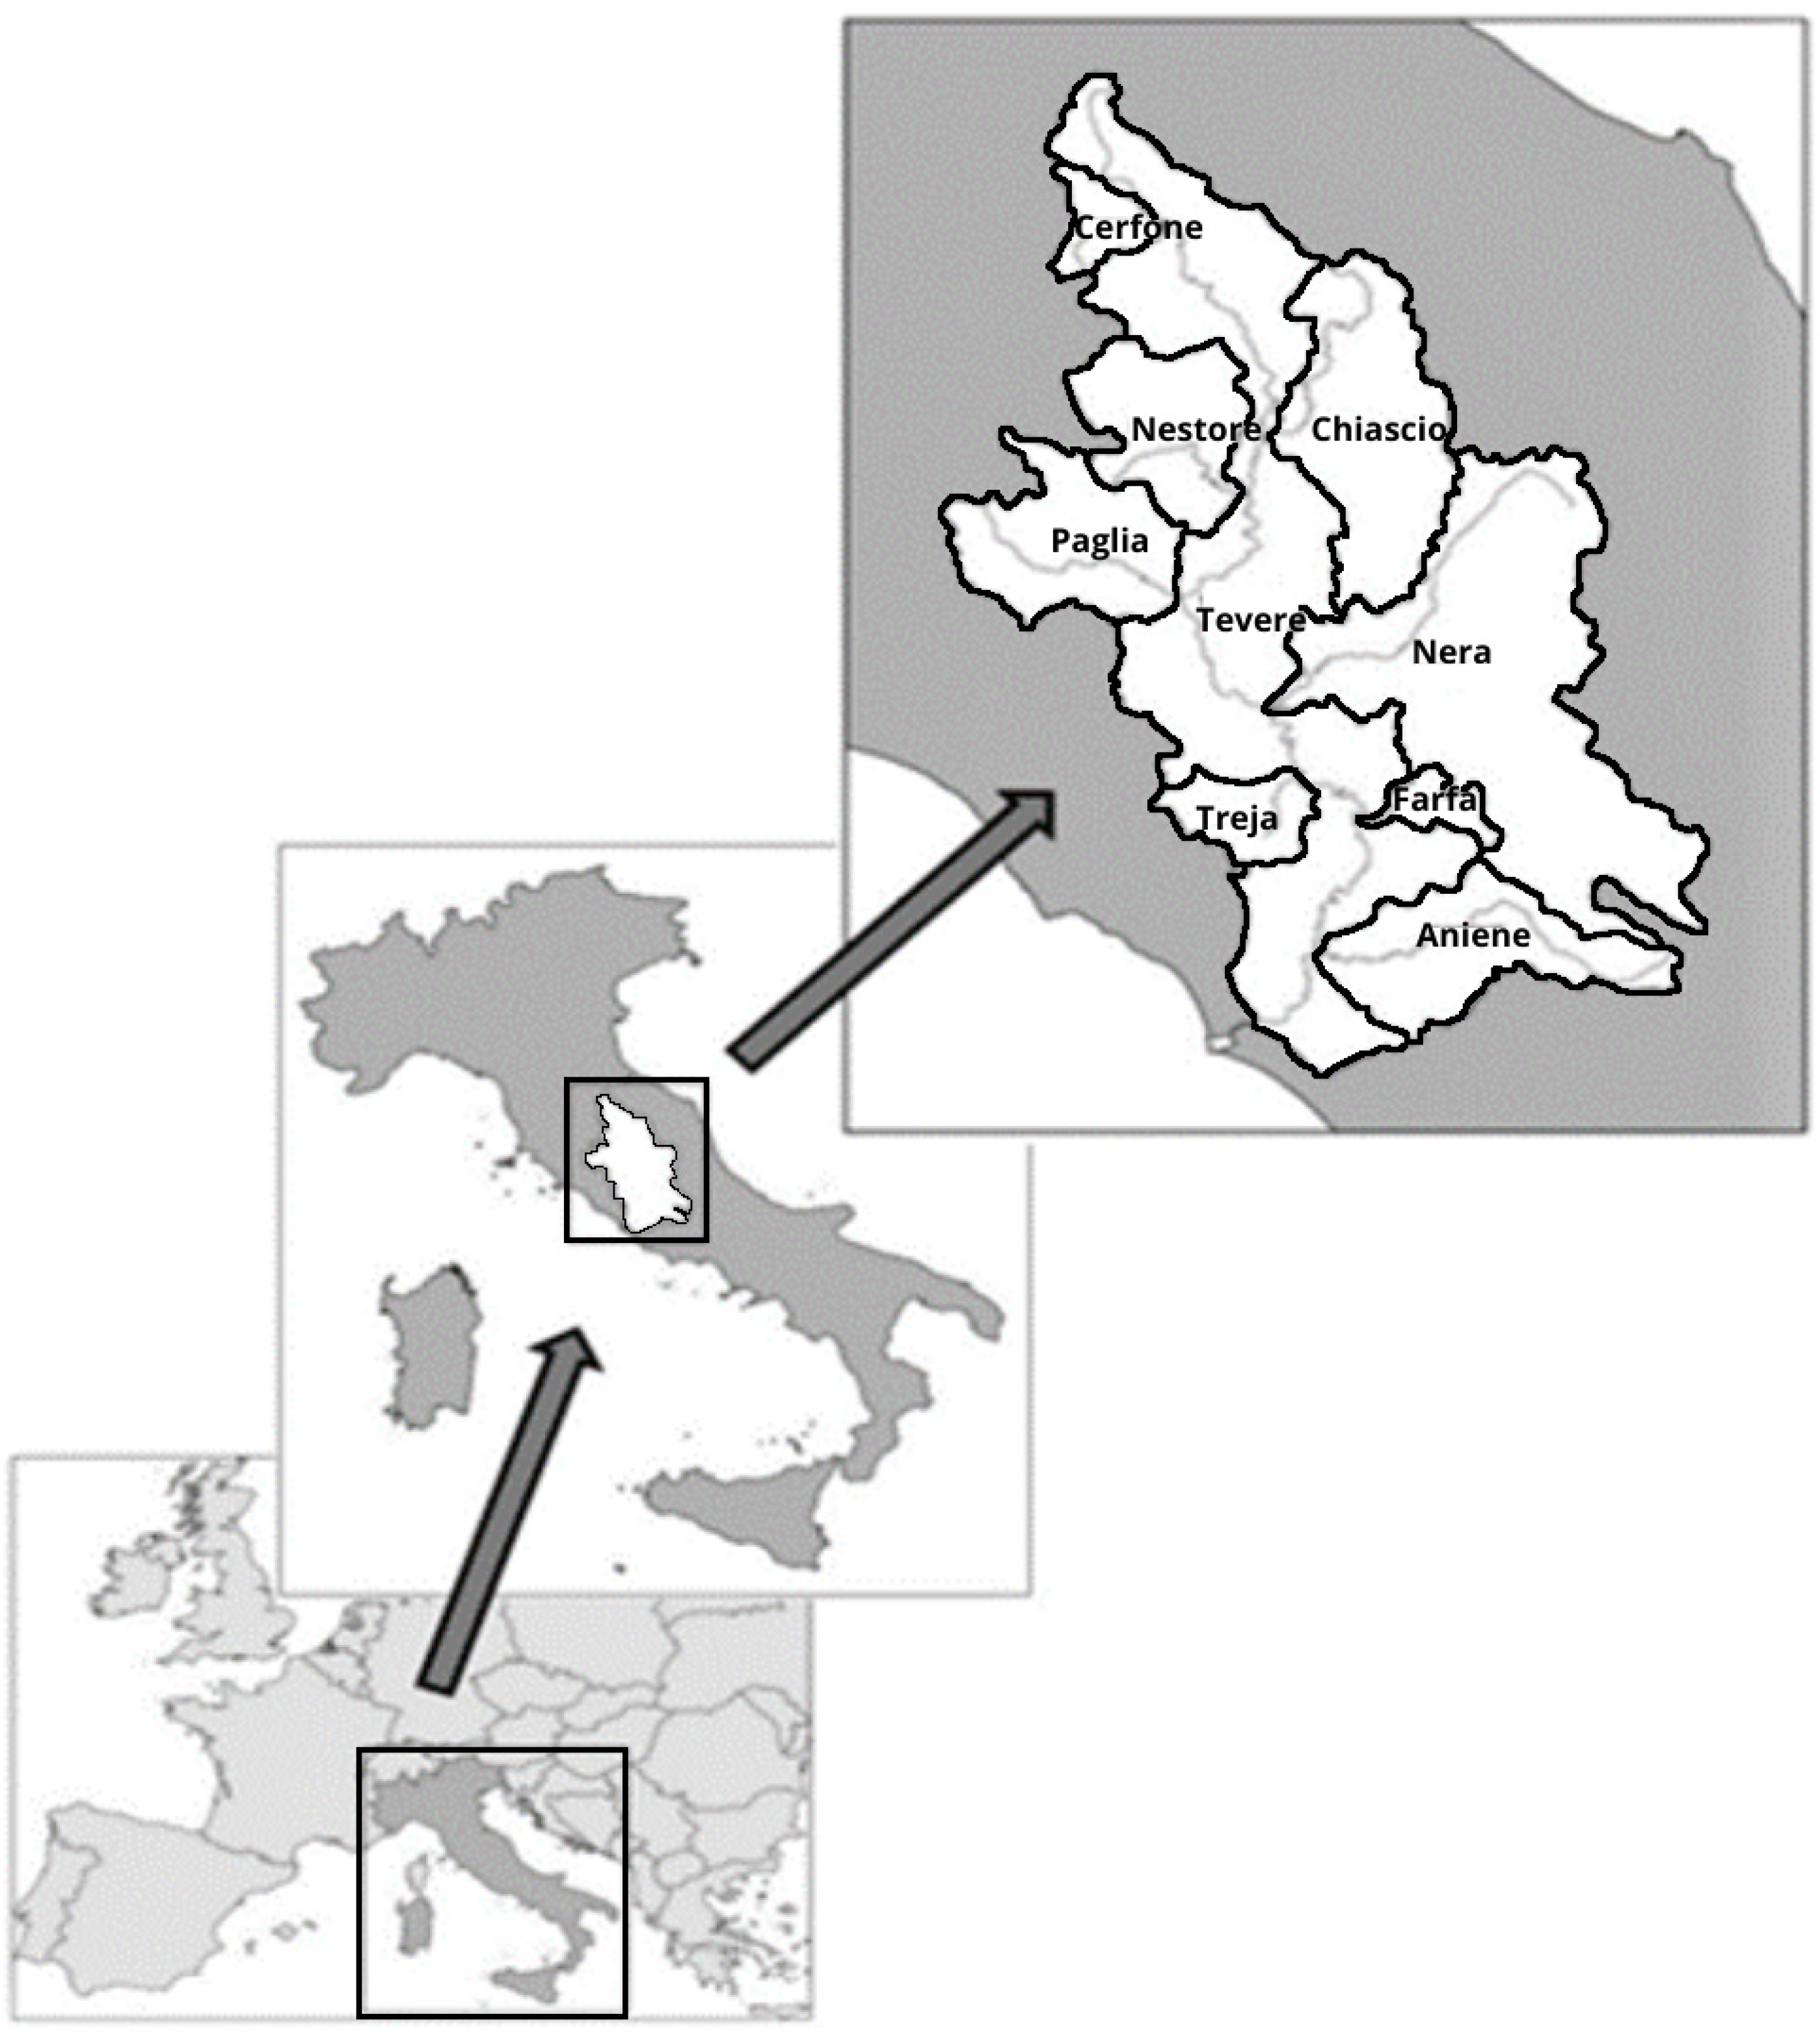
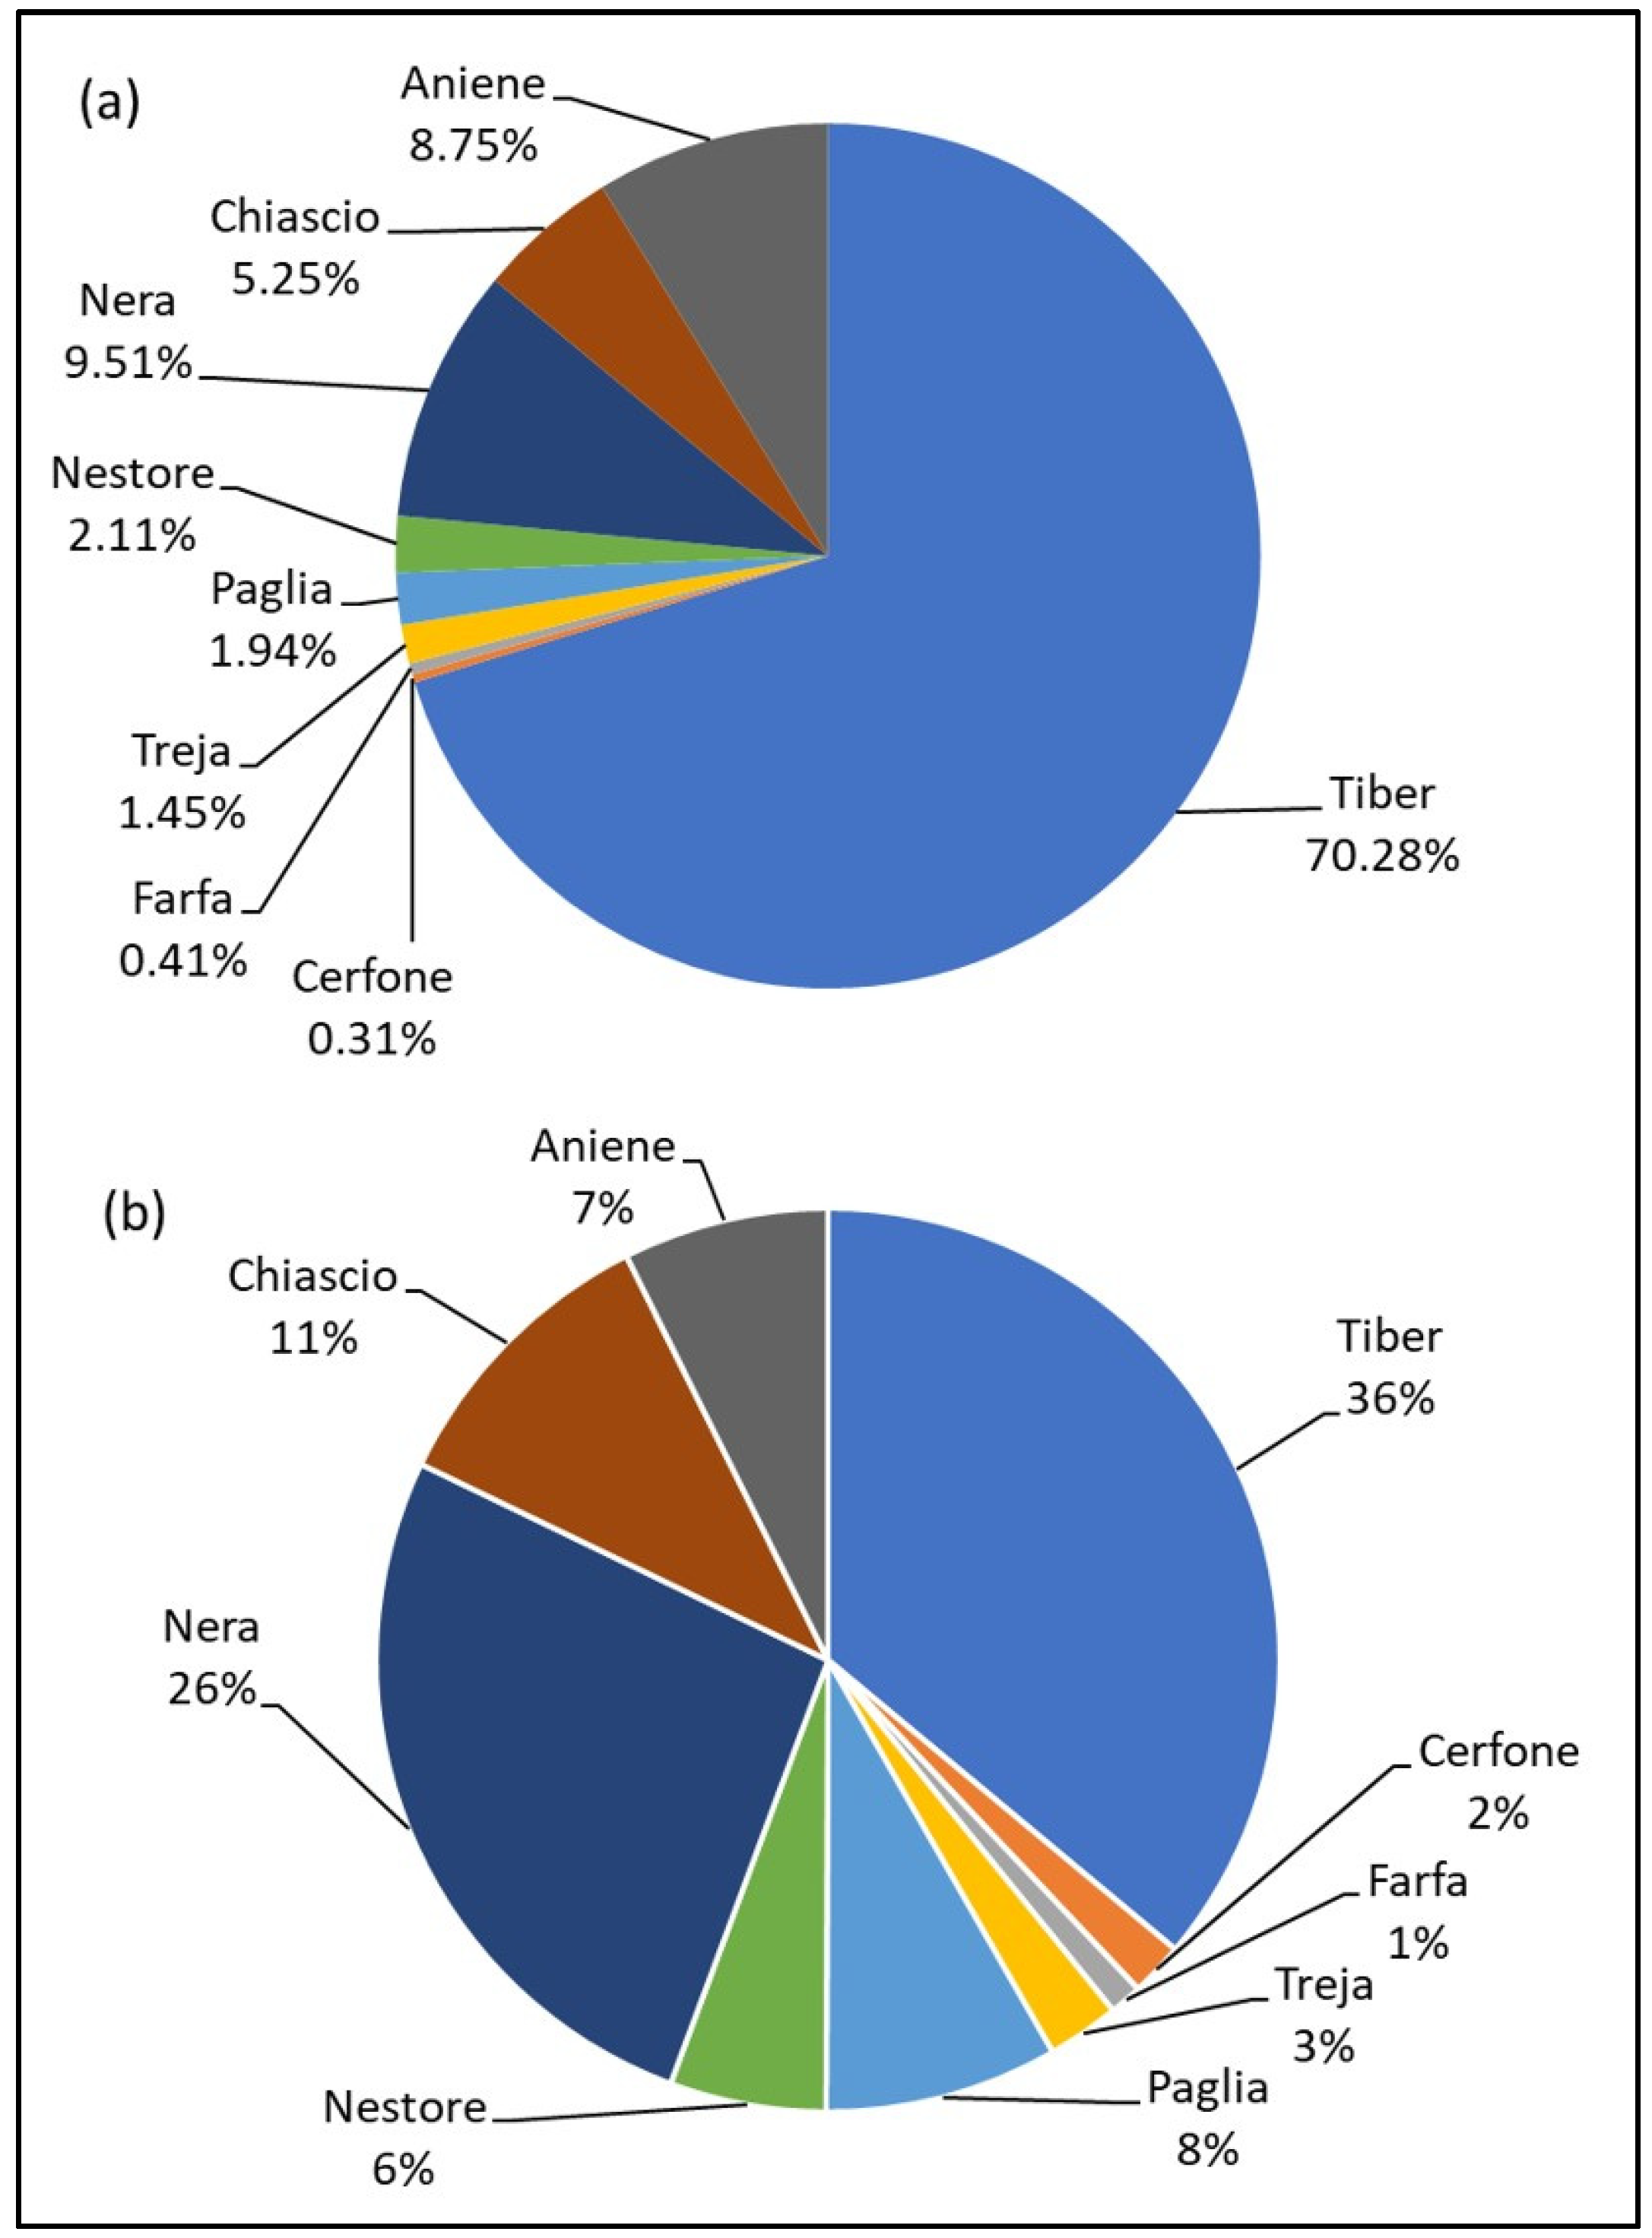
2.1. Study Area

The Tiber River catchment (TRC) extends for 17,169 square kilometres in central Italy and represents the second largest river basin in Italy [50]. The catchment area covers a great part of Central Italy (mainly the Umbria and Latium regions) and 335 municipalities. The Tiber flows through important cities (Perugia, Terni, Rieti, and Rome), and it is the third greatest Italian river in terms of length (409 km) and volumetric flow rate (240 m3/s measured at the mouth), with three left tributaries (Chiascio, Nera and Aniene) and three right tributaries (Nestore, Paglia, and Treja). The database built for the Tiber River catchment was parted into sub-catchments, such as the Tiber, Cerfone, Farfa, Treja, Paglia, Nestore, Nera, Chiascio, and Aniene (Figure 1).
From a biogeographic point of view, the Tiber catchment is part of the Mediterranean district of the middle-Tyrrhenian sector. From a hydro-morphological perspective, there are three hydro-morphological sectors (Tiber, Aniene, and Nera) in the main watercourses of the catchment. The upper sector starts in the mountainous belt, where watercourses are generally characterized by steep slopes, rocky substrata, and a rapid flow. The middle sector is characterized by a pebbly–gravelly substratum and changing slopes that affect the behaviour of the water flow from turbulent shallow waters to medium laminar flowing water (usually in the deeper tracts). Finally, the lower sector has a typical fluvial regime, slow-flowing waters, and calcareous sandy–muddy substrate [51]. A Temperate climate characterizes the upper and middle sectors, whereas a Mediterranean climate is typical in the lower sector. The main litho-type of the Tiber catchment is calcareous, whereas natural vegetation is generally well preserved in the mountain and sub-mountain areas. On the other hand, a great part of the original characteristics of the riparian system has been lost in the bottom of valleys and plains, with some exceptions, due to intensive agricultural practices and urban sprawl. These land uses are the main cause of the general mineralization and eutrophication of the waters in the lower sector [52]. In Table 1, some important characteristics of the Tiber River sub-catchments are reported.

2.2. Data Collection

In order to evaluate the N losses from agricultural and zoo-technical sources, the Soil System Budget approach [53] was applied to the Tiber River and its sub-catchments. The soil system budget records all of the nutrient inputs and nutrient outputs, including the nutrient gains and losses within and from the soil. The system approach also allows partitioning between the various nutrient loss pathways and the storage and/or depletion of nutrients in nutrient compartments within the system. A surplus/deficit is a measure of the net depletion (output > input) or enrichment (output < input) of the system. Most of the necessary data at the spatial resolution of municipalities (i.e., agricultural productions in terms of surfaces, typologies, and amounts of farmed animals, etc.) were downloaded from the Italian National Institute of Statistics (ISTAT) and formed part of the sixth Agricultural Census database for 2010. All of the data were converted into nitrogen units (the actual amount of nitrogen included in agricultural products—horticultural, crops, and industrial crops—and synthetic fertilizers) by employing appropriate site- and product-specific coefficients, which are available in the ISTAT database. An inventory of inputs (livestock manure, synthetic fertilisers, atmospheric deposition, biological fixation) and outputs (crop uptake, denitrification in soil, nitrogen leaching, and ammonia volatilization) was produced, and the net budget was calculated. The N budget and the inclusion of accessory information (e.g., population density, land use, slopes, the presence of wetlands, soil permeability) were derived by the ISTAT database, allowing inferences to be made regarding the system’s ability to metabolize nitrogen loads, and allowing the planning of appropriate management actions.
The N contribution by livestock manure was derived from the number of cattle for each animal category (thirty-six animal categories were considered, according to typologies, age, and use; see File S1). The average weight and N production coefficients for each animal category were provided by the Rural Development Programs of the Lombardy [54] and Emilia Romagna [55] Regions, and the ISTAT database. Nitrogen inputs due to chemical fertilization were calculated considering the extension of each fertilised crop type, the annual sales of mineral fertilisers, and the N content of each type of mineral fertiliser. These data were subdivided by a percentage based on the utilized agricultural area (UAA) of each municipality falling inside the Tiber River catchment. The amount of N biological fixation was derived from the literature by considering woods, arable lands, permanent grasses, and N-fixing crop (Fabaceae) areas, and the N-fixing rates for woods, permanent grass and pastures, alfalfa, soy, and legumes [56,57,58,59,60].
The reduced and oxidised N depositions for the year 2010 were derived from the Greenhouse Gas Air Pollution Interactions and Synergies model—GAINS (The GAINS’ features http://www.iiasa.ac.at/web/home/research/researchPrograms/air/GAINS.html (accessed on 26 January 2022)). Details about GAINS and the references are reported in File S2.
The N uptake by crops was calculated by multiplying the area of each culture by its own yield, as reported in the sixth Agricultural Census for 2010, whereas the N content of each crop was derived from the Rural Development Programmes of the Lombardy and Emilia Romagna Regions [54,55]. The N output due to ammonia volatilization was evaluated according to the literature [61,62], excluding the locally re-deposited fraction corresponding to 60% [63]. The denitrification in the soil was calculated as 10% of the sum of the N derived from livestock manure and chemical fertilisers [64]. The data regarding the water flow and N concentration at the mouth of the Tiber River were provided by the Regional Environmental Agency of the Lazio Region.
Data regarding the soil type were obtained from the European Soil Data Centre (ESDAC) for Europe at a 1 km resolution [65]. The portion of nitrogen lost due to the leaching and runoff were calculated taking into consideration the national average values [66]. The fraction of N lost per runoff was 4% of the nitrogen resulting from manure and synthetic fertilization, whereas the fraction of N lost due to leaching was 18% of the estimated surplus, corrected by the ammonia (NH3) losses and runoff. The quantities of nitrogen derived from manure, synthetic fertilization and NH3 losses were provided by the sixth Agricultural Census for 2010 [66]. The inputs and outputs of N were assigned to each sub-catchment, and in turn, the N retentions were calculated as the difference between the inputs and outputs both at the catchment and sub-catchment levels.

2.3. Statistical Analysis

Significant differences of N retention (N input–N output, a response variable) among the sub-catchments (discriminant factor) were quantified by one-way analysis of variance (one-way ANOVA, p ≤ 0.05). The Neumann–Keuls post hoc test (p ≤ 0.05) was applied for the definition of which sub-catchments were statistically different. The Random Forest (RF) analysis [67,68] was applied to determine the most important predictors that significantly affected the response variable. RF is a machine learning method that builds an ensemble of classification or regression trees [69]. The RF algorithm estimates the importance of a variable by looking at the extent to which the prediction error increased when out-of-bag (OOB) data (OOB data are those samples that are not included in the bootstrap samples, and the final prediction is the average or majority vote among all of the predictors, or any bootstrap-aggregated methods). When this process is repeated, such as when building a random forest, many bootstrap samples and OOB sets are created for the variable that was permuted while all of the others were left unchanged. The calculations were carried out tree by tree as the random forest was constructed. The final predictor importance values were computed such that the highest average was assigned a value of 1, and the importance of all of the other predictors was expressed in terms of the relative magnitude of the average values of the predictor statistics, relative to the most important predictor [70]. Note that (a) OOB samples are unique to Bagging, which is a variance reduction technique based on a collection of predictors trained on bootstrap samples, and (b) the bootstrap is any test or metric that uses random sampling with replacement, and falls under the broader class of resampling methods.
In this analysis, the most important predictors affecting the N retention were selected until their percentage difference from the most important one was 30–35%. The RF analysis has been performed both at the catchment and sub-catchment areas, taking into consideration all of the N inputs and outputs, and the environmental parameters (area, Utilised Agricultural Area (UAA), resident’s number, etc.; see File S3 for a complete list of the predictors). All of the statistical analyses were carried out using the software package STATISTICA 12 (StatSoft Inc., Tulsa, OK, USA).

2.4. Statistical Entropy Analysis

Statistical Entropy Analysis (SEA) is a tool that evaluates the ability of a system to dilute or concentrate a substance (known as the system’s power). Due to Shannon’s concept of statistical entropy, SEA allows the calculation of the probability of the appearance of an element through its concentration in each system [71]. Therefore, SEA was used to analyse the performances of the Tiber River both at the catchment and sub-catchment levels by quantifying the dispersion of N in several environmental compartments (soil, water, and air), unlike the nitrogen use efficiency (NUE), which only operated on the total N input and N output quantities [72]. In this paper, SEA was used to analyse the N budget related to agricultural, zoo-technical, and other human-based activities occurring in the TRC and its sub-catchments. The input of the N load was due to synthetic and natural fertilizers in the form of urea ( C O ( N H 2 ) 2 ), ammonium nitrate ( N H 4 N O 3 ) and organic nitrogen (Norg). Some chemical species of N ( N O 3 , N H 4 + and nitrogen entering as N 2 ) were derived from atmospheric depositions and ground fixation processes. Outgoing nitrogen was lost in the atmosphere in a gaseous form mainly as ammonia ( N H 3 ) and nitrogen ( N 2 ), and in smaller quantities as nitrous oxide ( N 2 O ) and more generally nitrogen oxides ( N O x ). The N emissions in groundwater were in the form of N O 3 , N H 4 + and Norg chemical species (Figure 2a). When all of the incoming nitrogen forms were diluted into groundwaters, the maximum value of the entropy (Hmax) arose (Figure 2b). When, instead, all of the nitrogen was in the Norg form, which could be found in the products, the system had the minimum (Hmin) or optimum (Hopt) entropy value (Figure 2c).
The basic formula for the calculation of the statistical entropy (H) was:
H ( c i N , m i ) = i = 1 k m i c i N log 2 ( c i N ) 0
with
m i = M i i = 1 k X i N
x i N = M i c i N
where ciN (expressed in mass per mass) was the N concentration in the mass flow of goods I, such as the amount of dry and humid depositions, fertilisers, and products; xiN was the flow of N in the goods flow i, which was the product of Mi (equal to the material flow i, expressed in mass per time) and ciN. The mass fraction of the material flow i (mi) was calculated using Equation (2). K was the maximum number of material flows, where for the imported material flows K = 4 (such as synthetic fertilisation, farming animals, atmospheric deposition, and N-fixation), and for the exported material flows K = 3 (ammonia volatilization, denitrification in soil, and crop uptake product) (Figure 2a). The relative values of H (dimensionless) for the input and output scenario were also calculated. The variation of entropy ΔH indicated the nitrogen behaviour in the system: if the system concentrated nitrogen, then ΔH < 0, otherwise ∆H > 0 (the system was able to dilute nitrogen). The dilution and/or concentration concerned the natural levels of the environmental concentrations of the element or compounds examined. In general, entropy increased when the nitrogen emitted in a compartment was at a higher concentration than the natural background [71,72,73].
Δ H = H o u t H i n H i n %

2.5. Simulations of N Performance Variation in the TRC System

After the entropy values’ calculation for a realistic N efficiency of the TRC system, five scenarios were simulated, aiming to study the N performance variation in the hydrological system. In the first scenario (S1), we assumed a 50% reduction in the nitrogen load coming from synthetic fertilization. In the second (S2), the nitrogen load from the livestock manure was reduced by 50%. In the third and fourth scenarios (S3–S4) we simulated concurrent reductions in nitrogen loads from synthetic fertilization and livestock manure by 25% and 50%, respectively. The fifth scenario (S5) simulated an increase of 50% of the N inputs derived from synthetic fertilization and livestock manure.

3. Results

3.1. Nitrogen Budget

The Tiber catchment area is populated by 4.06 million people. Overall, the total N inputs amounted to 7.60 × 10⁴ tons (average 227.43 ± 28.72 tons S.E., N = 334). The global N balance yielded a value of 1.62 × 10⁴ tons, which was retained within the catchment area, and 5.98 × 10⁴ tons came out of the hydrographic system. The main input was biological N-fixation, with a 45% contribution, followed by synthetic fertilisers (31%) and livestock (19%). The remaining 5% depended on atmospheric N deposition. The main output was given by food, horticulture, and industrial crop uptake (79.43%), with a small contribution of other budget components, as reported in Table 2.
The low nitrogen retention (12,053 t N/yr; 15.83%) of the whole catchment area was relevant. However, some sub-catchments showed higher nitrogen retentions when they were related to their own N inputs, such as Farfa (677 t N/yr; 61.06%), Aniene (1303 t N/yr; 52.97%), Chiascio (3116 t N/yr; 29.98%) and Nera (3801 t N/yr; 28.53%). The Tiber basin showed an N retention of 19.51% (6897 t N/yr), although its area is the highest of the whole catchment (Table 1). The lowest N retention values were found for the Paglia (−930 t N/yr) and Treja (−103 t N/yr) sub-catchments.
The Tiber and Nera were characterised by high values of N loads (35,351 t N/yr and 13,321 t N/yr, respectively), representing 62% of the catchment area and 79.8% of the total residential population (Figure 3a,b). It could be argued that the N loads were likely due to an excessive amount of nutrients coming from the discharge of domestic sewage. However, as will become clearer later, the role of the nitrogen load derived from urban, peri-urban, and rural wastewater is practically nil in influencing the nitrogen retention capacity, except in the Paglia sub-catchment. In this basin an imbalance of N was evident, with a surplus of N output compared to inputs, although showing a low percentage of residents (1.94%) compared to the total resident population (Figure 3a) and a small extension of the sub-catchment area (Figure 3b).

3.2. Random Forest Analysis

In order to clarify these dynamics, it was essential to estimate the role of each predictor and its importance in affecting N retention. The Random Forest highlighted different ranks of importance for the catchment and each sub-catchment area. The important predictors affecting N retention at the catchment and sub-catchment levels were reported in Table 3, including predictors’ changes to the most important one within a threshold set at up to 35%; the others included in the RF analysis were not considered because they exceeded the threshold of 35%.
The total N losses by denitrification with the contribution of livestock and agriculture, total N loads due to atmospheric deposition, utilised agricultural area, total N loads due to livestock industry, total N losses due to the sum of fractions effectively lost (i.e., fractions of N of livestock origin, N-ammonium nitrate, N-ternary, organic compounds, and N-urea ammonium sulphate totally lost by volatilisation), N losses from non-nitrogen fixing plants (i.e., N losses from cereal crops; industrial and textile crops, including aromatic plant crops; open-field horticultural crops; floral crops and ornamental plants; seedlings, alternating forage crops; agricultural tree crops, i.e., vineyards, olive groves, and orchards; and family gardens), and total N loads by biological fixation (symbiotic and non-symbiotic N fixation) were considered to be main predictors contributing to and affecting the N retention at the catchment level (Table 3). It was meaningful that the N load due to civil sewages and the number of residents living in the catchment area did not significantly affect the N retention, with this being in the intermediate and/or final positions in the importance ranking (not reported here).
Looking at Random Forest results concerning each sub-catchment (Table 3), the negative value of the nitrogen balance of the Paglia sub-catchment seemed to be due to N loads from the livestock industry and its territorial density, biological fixation, and the nitrogen contributed by the resident people (Table 3). The output N surplus in the balance of this sub-catchment likely originated from a non-equilibrium between the loads and losses; therefore, the total N loads exceed the total N losses by removal through N-fixing species (alfalfa, soy, and legumes). The biological fixation (symbiotic and non-symbiotic N fixation) may be altered in its components when nitrogen sources, such as ammonium ions and nitrates, are available in soils, inducing a strong reduction of the non-symbiotic N fixation [74] by prokaryotes such as Azotobacter and Clostridium living in the soil and waters. With the N outputs being greater than the N inputs, the significant and negative correlation between N retention and non-symbiotic N fixation (r = minus 0.379, p = 0.046) suggested that the N outputs exceed the N inputs when non-symbiotic N fixation was reduced by the high availability of N in the soil (that is, the total N losses were low, at 61% N retention). This high availability of N in the soil should be due to the agricultural practices that enriched the soil through synthetic N fertilization. The Paglia sub-catchment was typified by 54.8% non-irrigated arable land and agricultural land (Figure 4). Similar considerations could be made for the Treja sub-catchment (data not shown), where the N retention was negative, and correlated in a negative and significant way with non-symbiotic N fixation (r = −0.789, p << 0.001); its territory was represented by non-irrigated arable land (44.7%) and fruit tree and berry plantations (11.7%; Figure 4).
The equilibrium between the loads and losses also characterised the other sub-catchments (Table 3); the total N losses by denitrification, and as the sum of fractions effectively lost (N from ammonia volatilization, i.e., losses due to the volatilization of nitrogen of zootechnical origin, N urea-ammonium sulphate, N ammonium nitrate, and N ternary + various organic), were opposed to the N load by biological fixation, atmospheric deposition, and livestock industry (e.g., the Tiber, Table 3). The total N loss by denitrification was opposed to atmospheric N deposition and the total N load due to livestock industry loads (Nera, Table 3). Generally, it was significant that the N loads were not due to domestic sewage but agricultural and livestock practices because, looking at the land use assessment, the Tiber and Nera represented 62% of the entire catchment area, where the most typical categories were crops and orchards, forests, and pastures (Figure 4). Furthermore, similar considerations could be made for the Aniene sub-catchment (Table 3). Atmospheric N deposition could be due to the contribution of some of the sub-catchments where this variable was one of the most important ones, such as the Tiber, Nera, and Aniene sub-catchments (Table 3), which covered 68% of the whole catchment area. Because industrial areas were scarcely distributed in the territory, N deposition could arrive from surrounding areas or local industrial ensembles. De Marco et al. [75] reported a differential action of oxidised and reduced nitrogen depositions to the net primary production of Italian forests that was linked to the geographical location of the N sources, which were mainly situated in northern Italy. The Utilised Agricultural Area (UAA) was another important variable that was generally associated with the Total N load due to livestock industry, or the Total N loss (denitrification) by livestock and agricultural practices. In fact, UAA was tightly correlated with these parameters (r = 0.854, p << 0.01 and r = 0.944, p << 0.01 for the Total N load due to livestock industry and the Total N loss (denitrification) by livestock and agricultural practices, respectively). There appeared to be a balance between these two processes that prevented (or limited) the release of N compounds outside the catchment area..

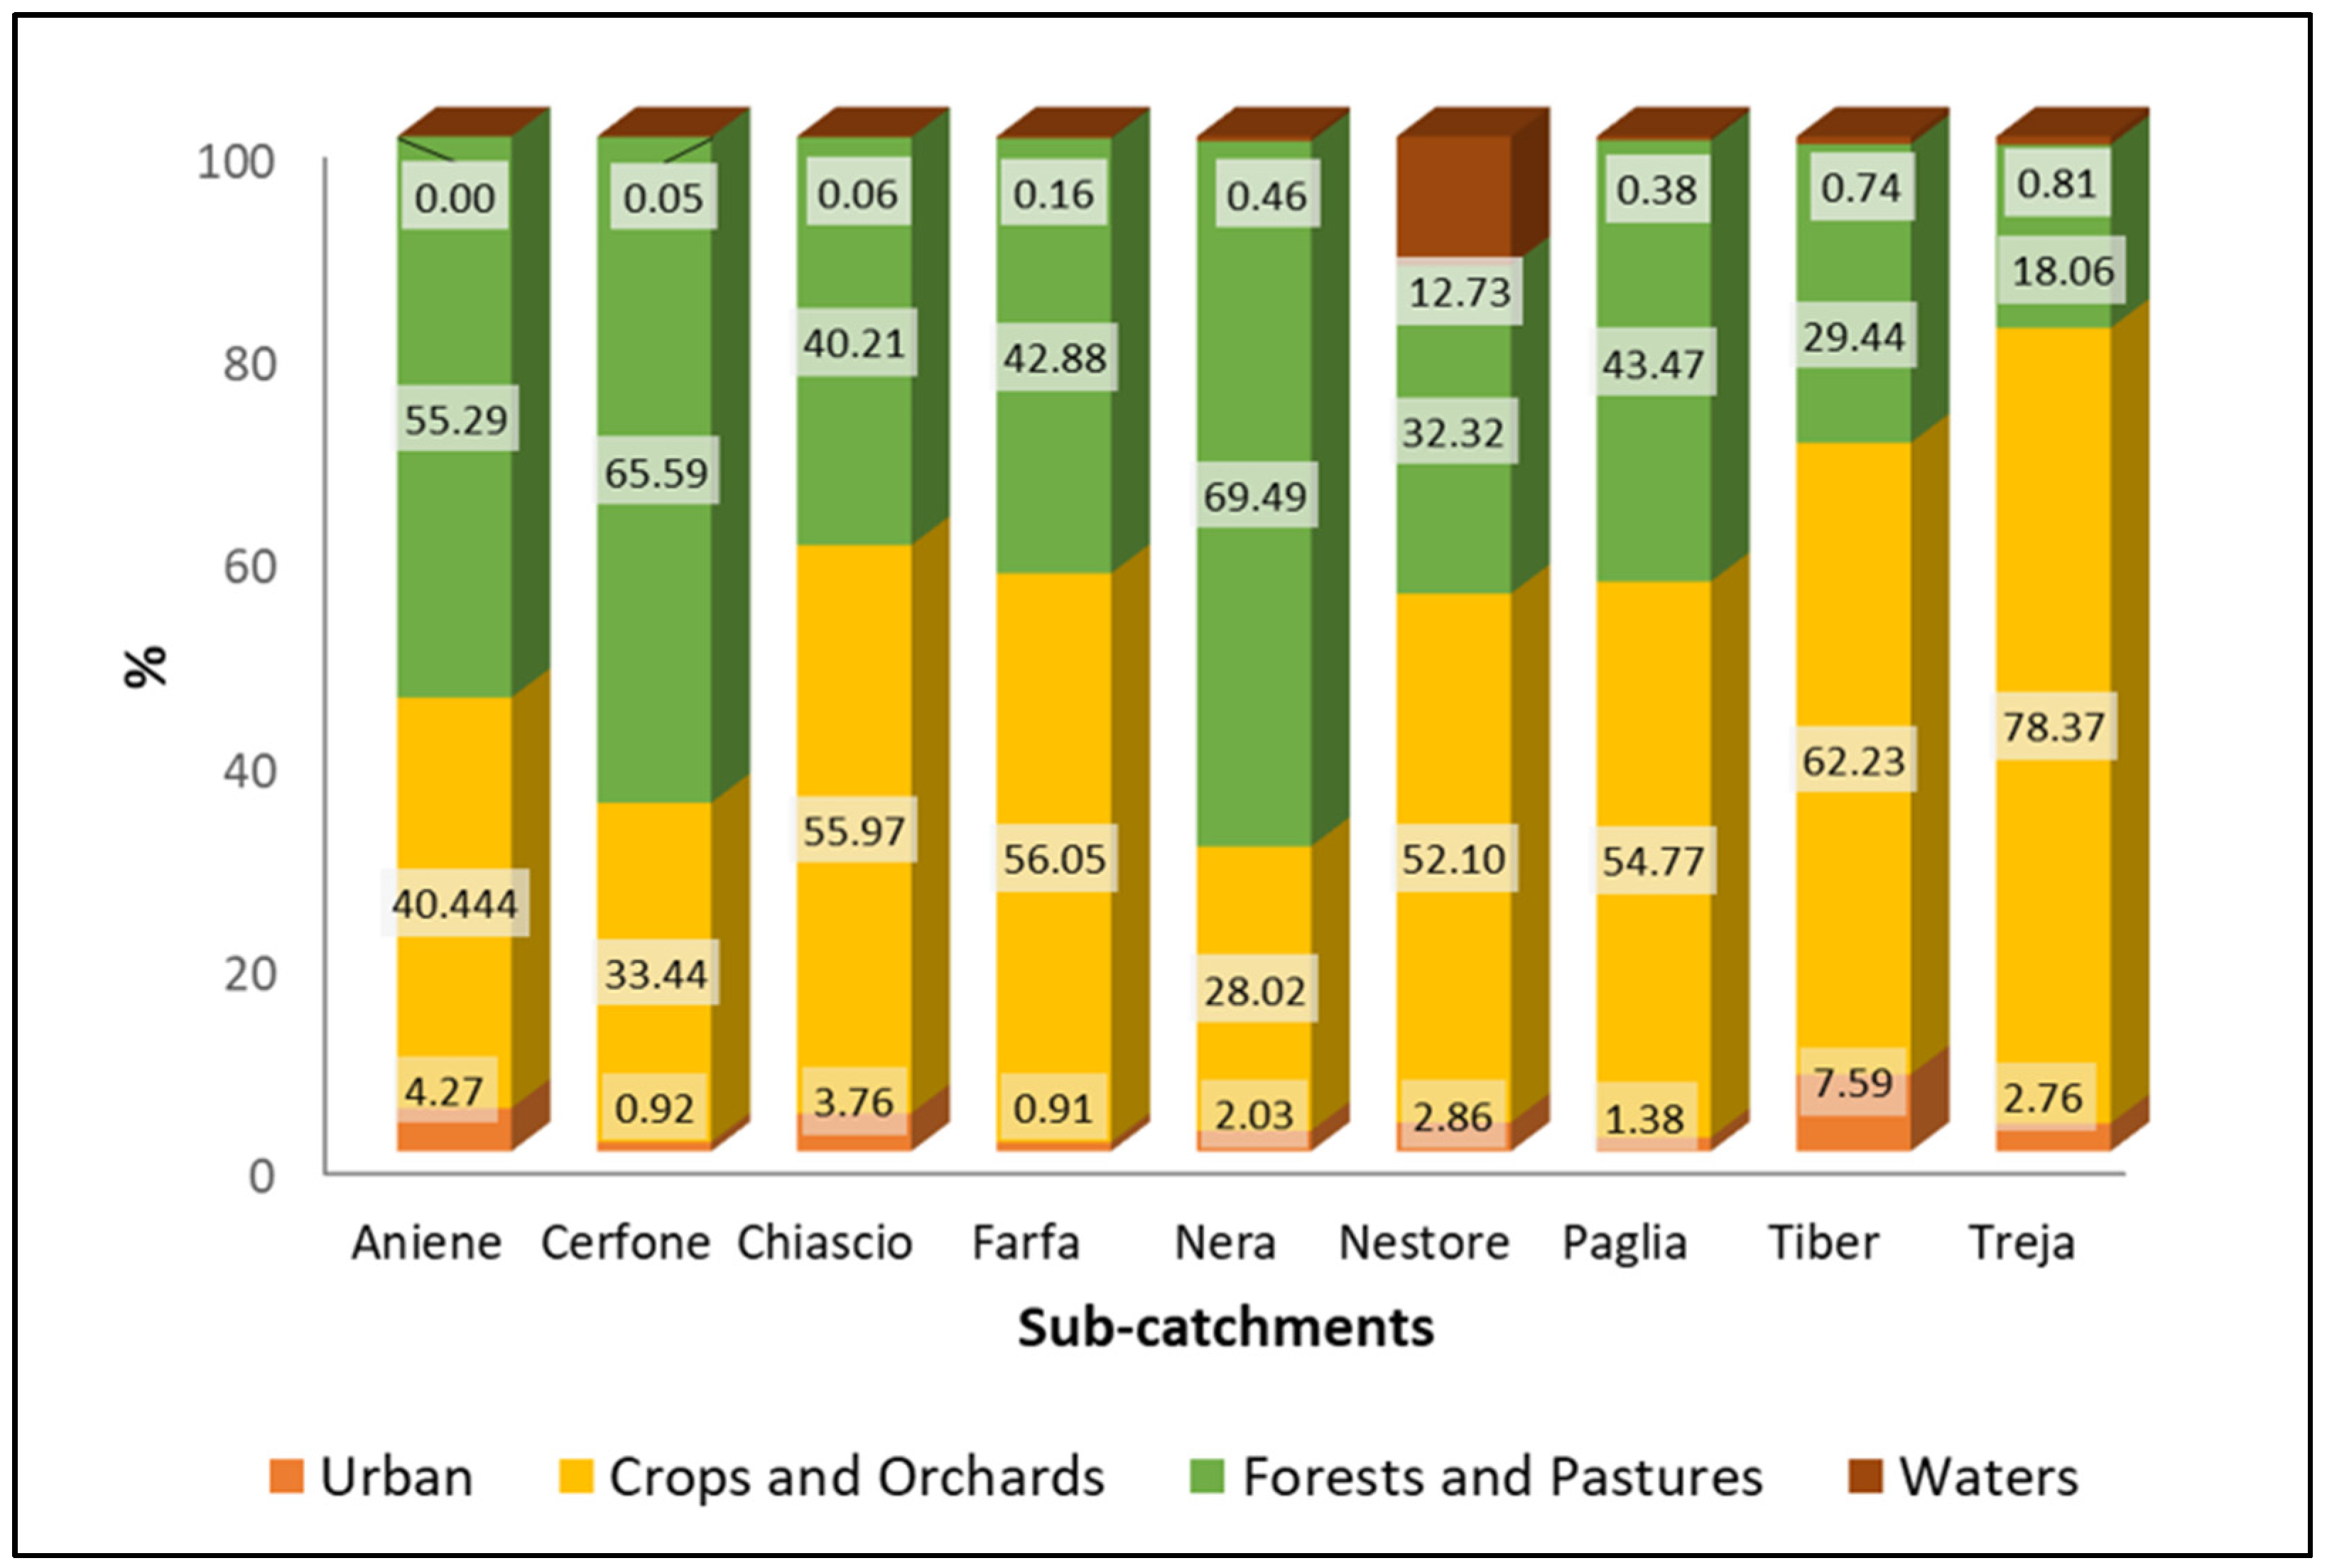
3.3. Soil Type Distribution at the Catchment and Sub-Catchment Levels

Looking at the distribution of the soil types existing in the Tiber catchment, it was clear that Cambisol was the most representative type (84.9%), followed by Leptosol (Rendzina) (8.7%), Luvisol (2.6%), Regosol and Andosol (1.6 and 1.5%, respectively), and Lithosol (<1%). As reported by the World Reference Base for Soil Resources [76], Cambisol is related to mineral soils of which the formation is conditioned by their limited age, that is, soils that are only moderately developed on account of their limited paedogenic age or because of the rejuvenation of the soil material. On the other hand, Leptosols are very shallow soils over a hard rock or highly calcareous material but also deeper soils that are extremely gravelly and/or stony. Leptosols are azonal soils with an incomplete solum and/or without clearly expressed morphological features. They are particularly common in mountain regions. Leptosols correlate with the ‘Lithosols’ taxa of many international classification systems (USA, FAO), and with ‘Lithic’ subgroups of other soil groupings. In many systems, Leptosols on the calcareous rock are denoted as ‘Rendzinas’. From these definitions, Cambisols and Leptosols (covering 93.6% of the Tiber catchment area) were not able to retain nitrogen in the soil, although in some sub-catchments (e.g., the Farfa) the nitrogen retention was high (61%). In this sub-catchment, the prevalent soil typology was Chromic Cambisols (65.2%), and in hilly (mainly colluvial) terrain Eutric, Calcaric, and Chromic Cambisols were planted with a variety of annual and perennial crops or were used as grazing land. These soils are medium-textured and have good structural stability, a high porosity, a good water holding capacity, and good internal drainage, thus allowing us to retain much more nitrogen than in the other sub-catchment. Note that, in the Farfa sub-catchment, crops and forests and pastures extended for 56% and 43% of the area, respectively (Figure 4).

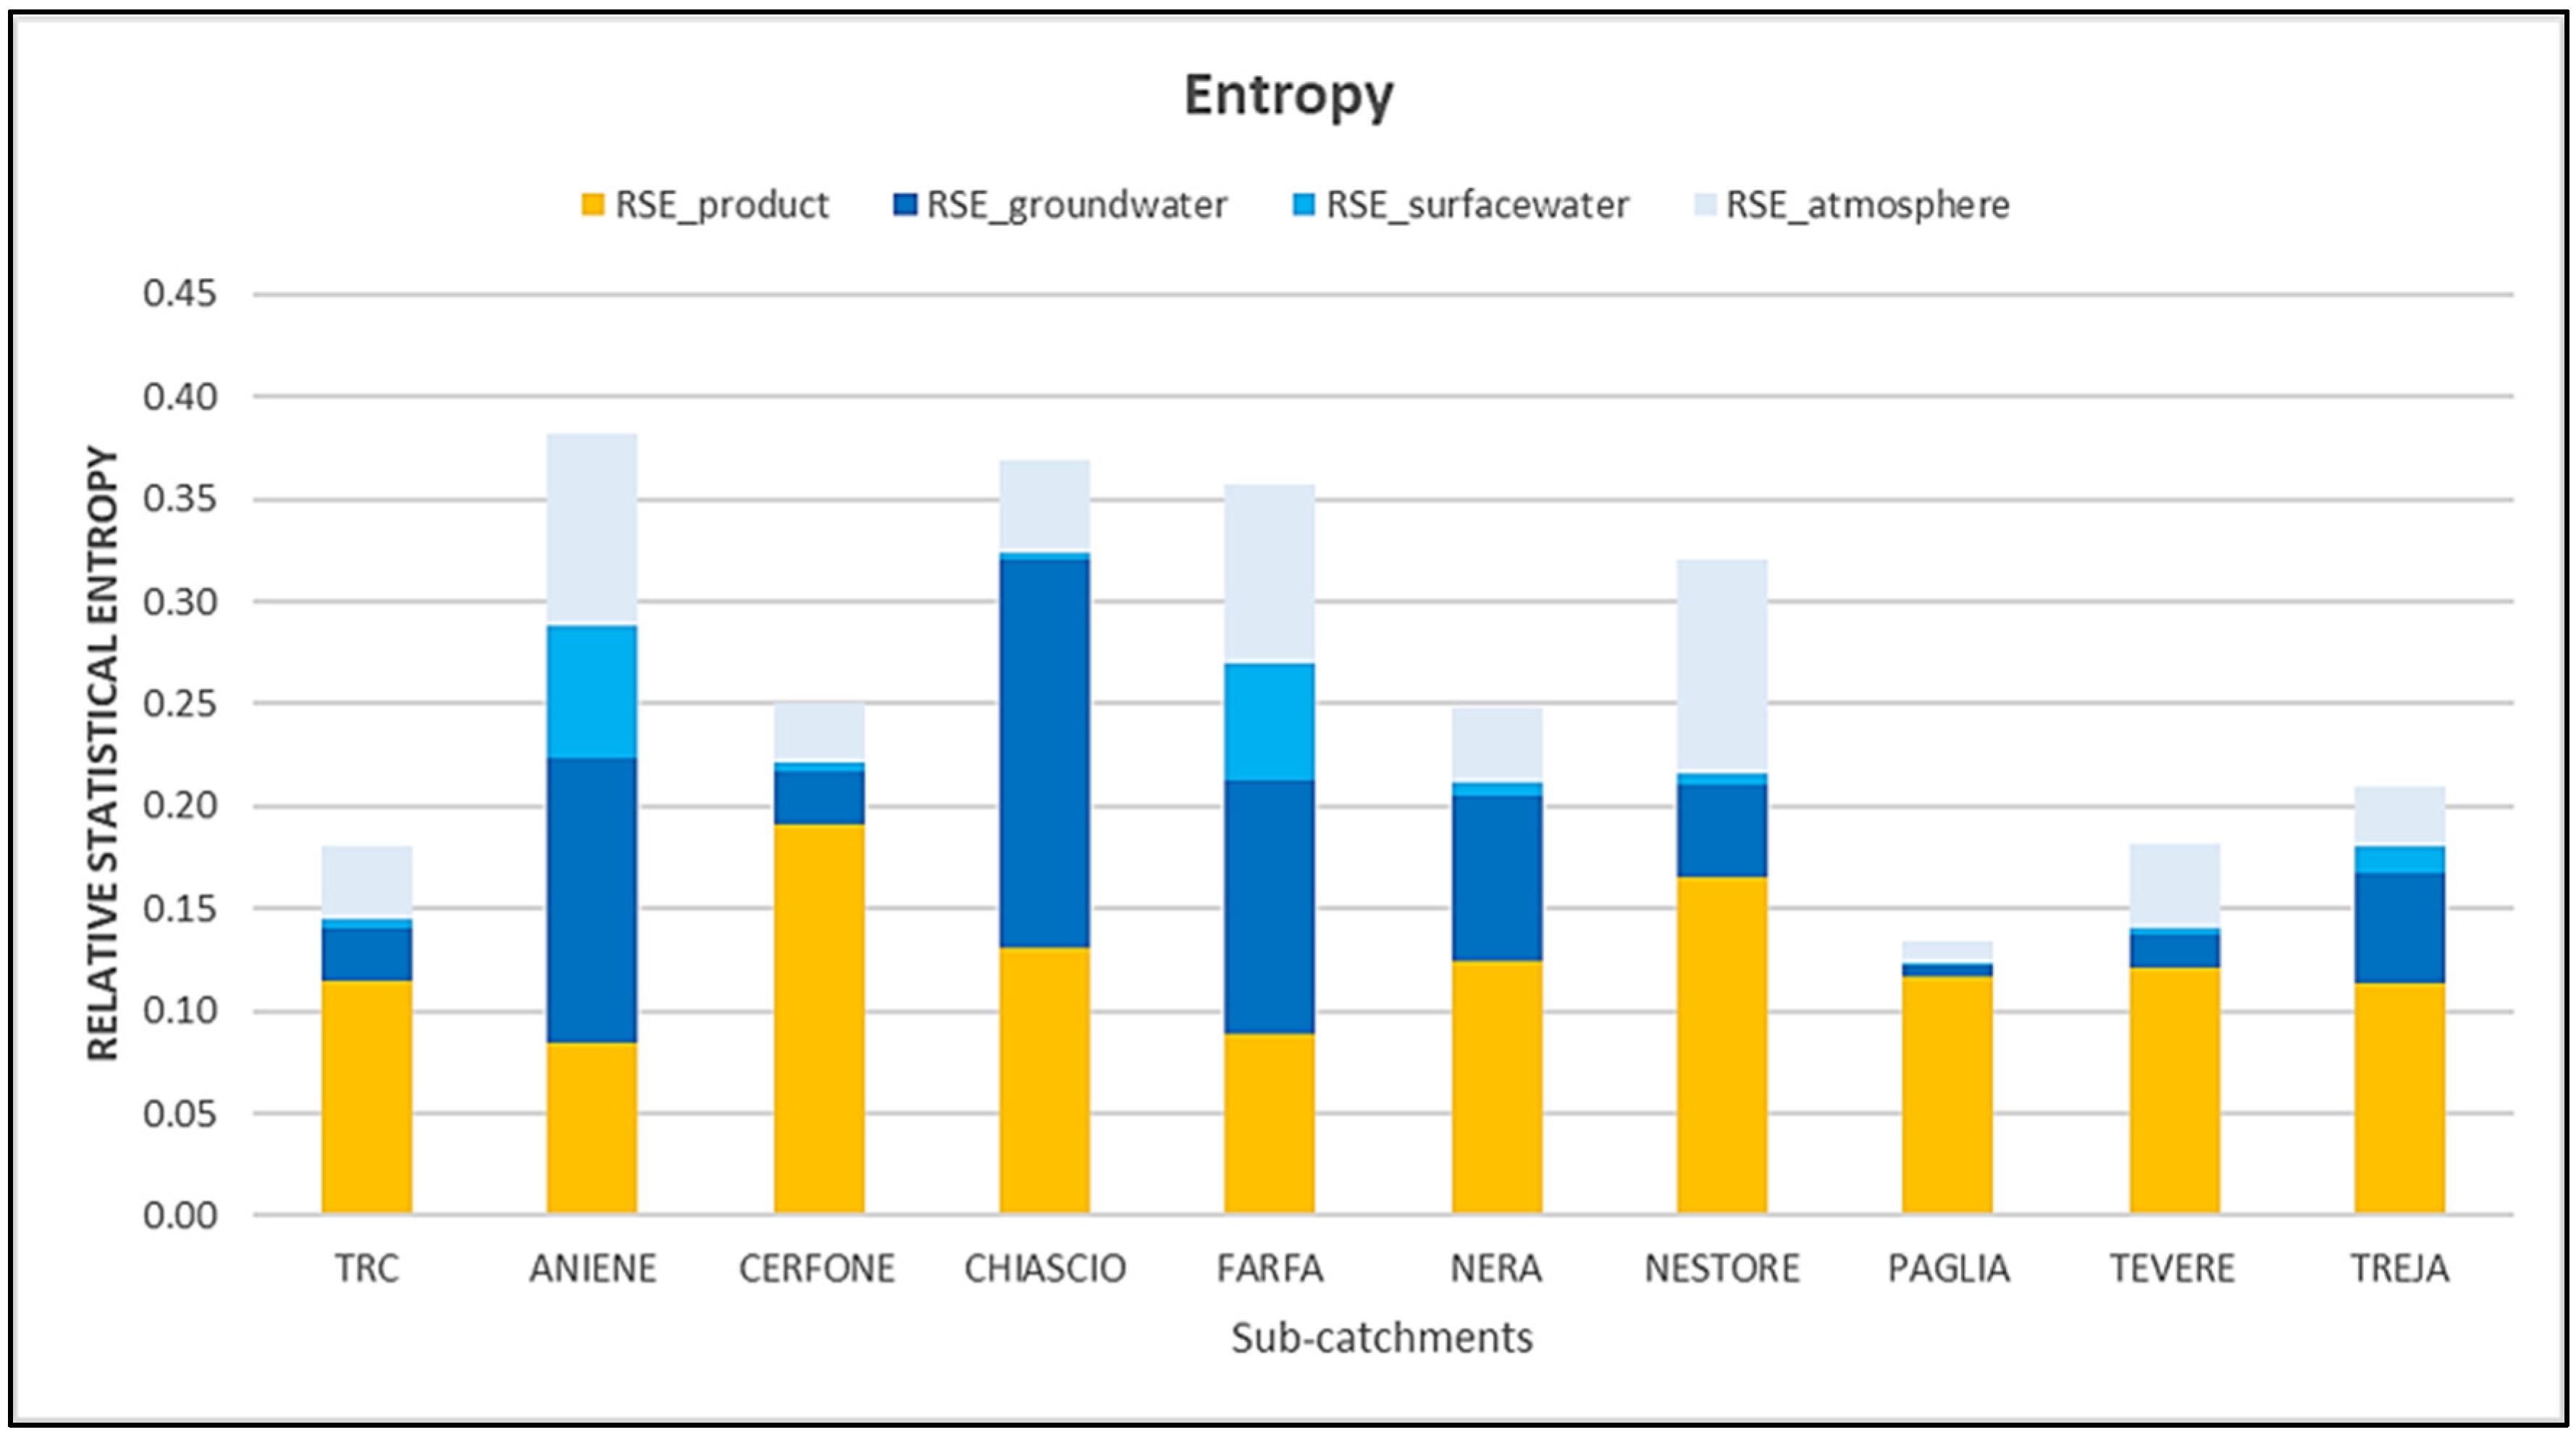
3.4. The Relative Statistical Entropy Analysis: Actual Management Scenario

The N performances of the Tiber River Catchment (TRC) system and its sub-catchments were evaluated by relative statistical entropy (RSE) analysis and by Nitrogen Use Efficiency (NUE) [77], the values of which are shown in Table 4. The Nin and Nout values for the TRC showed a satisfactory N efficiency (ΔH = 33%), and all of the sub-catchments, excluding the Aniene and Farfa, performed close to their optimum values (Table 4).
It is important to note that the NUE values did not give any information about the system’s ability to metabolise different nitrogen forms, which, in turn, could be assessed by RSEout and ΔH values. The Paglia sub-catchment showed a very high efficiency of N (ΔH = 6%), where the incoming N was mainly transformed into products (70.67%); the others (the Cerfone, Nera, Nestore, and the Tiber) showed average middle-efficiency values of N of about 59 ± 18% (Table 4). The Chiascio and Treja sub-catchments showed high values of ∆H, at 200% and 109%, respectively. Very high values of ∆H were instead found in the Aniene (833%) and Farfa (1508%) sub-catchments. The largest contributions to entropy found in the Aniene, Chiascio, Farfa and Treja sub-catchments were due to the significant nitrogen dilution in the atmosphere, surface water, and groundwater. In the Aniene sub-catchment, the major contribution was due to the nitrogen dilution in the groundwater (77%) and the atmosphere (51%) (Figure 5). In the Chiascio sub-catchment, the contribution to the high value of ΔH is related mainly to the dilution of the nitrogen load in the groundwater (105%); the same is true for the Treja sub-catchment (ΔH_groundwater = 30%). For the Farfa sub-catchment, the contribution to ΔH is due to the high N dilution in all of the environmental compartments (69% for groundwater, 31% for surface water and 48% for atmosphere) (Figure 5). Their high entropy values could be a consequence of high human activity pressures in the sub-catchments positioned in the southern areas of the TRC system, where more than 70% of the total population lives [78]. Besides this, the high contribution to entropy due to the N dilution in the groundwater—especially for the Farfa area—could be justified by the soil type, Chromic Cambisol, which is characterized by high N retention.
Although N converted into a product cannot be considered to be diluted, it contributed to the generation of entropy because the primarily nitrogen contained in the synthetic fertilizers was more concentrated than the nitrogen contained in the products. Therefore, an agricultural production system will always have an H > 0 [72]. The entropy related to the transformation of Norg in the product contributed to 63% of the total entropy of the TRC system. The remaining entropy contribution to the N losses in the groundwater, surface water and atmosphere were 14%, 9% and 20%, respectively (Figure 5).

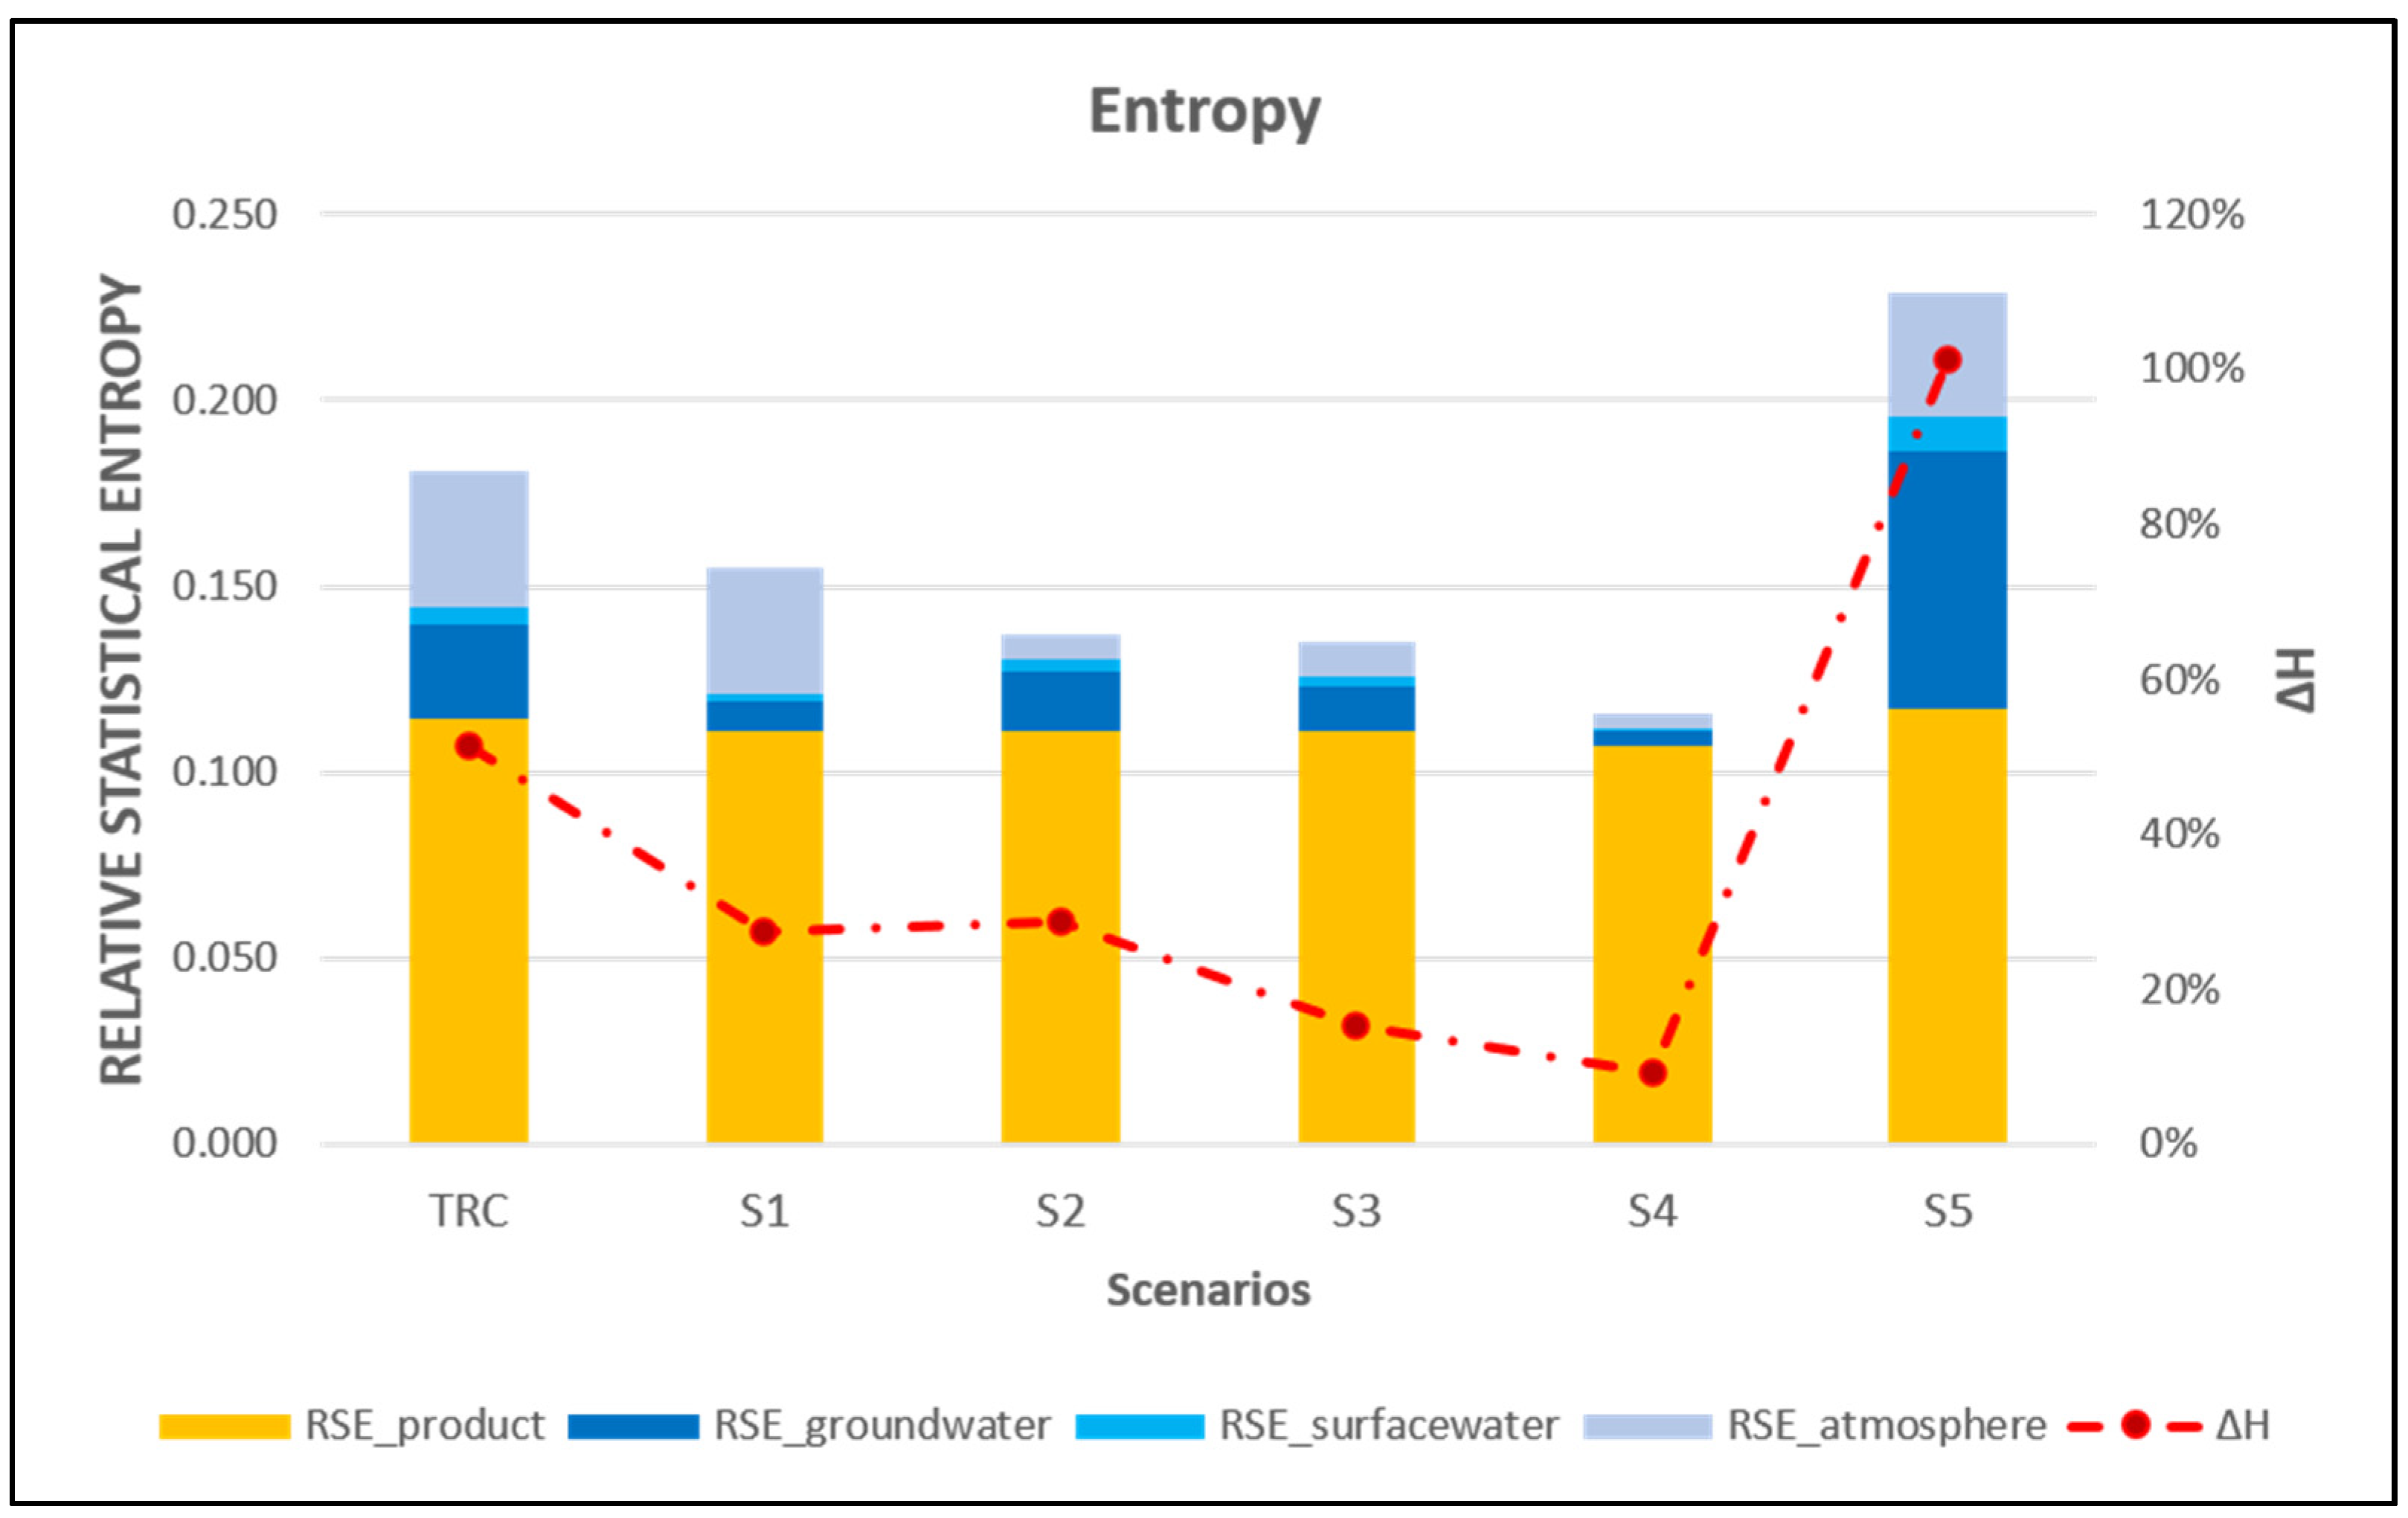
3.5. The Relative Statistical Entropy Analysis: Different Management Scenarios

Looking at the simulations (Figure 6), in the scenarios where a reduction in the input nitrogen loads is achieved, a lower Norg amount in the products was obtained by about −3% for the S1, S2 and S3 scenarios, and −6% for the S4 scenario. With the 50% increase in nitrogen loading from both synthetic fertilization and livestock manure (S5 scenario), we estimated an increase of 2% in the Norg amount in the products. The differences between the S1 and S2 scenarios in entropy were characterised by an increase of N efficiency (ΔH) from 27% to 29%, respectively. With the reduction of chemical fertilisers (S1 scenario), the entropy contribution to the groundwater and surface water decreased by 68% and 54% compared to the current scenario, but it had a low impact on the entropy contribution to the atmosphere (−7%). The reduction by 50% of the nitrogen load (S2 scenario) involved a reduction of the relative entropy (ΔH = 29%) concerning TRC, with this being mainly due to a reduction of the N losses to groundwater, surface water and atmosphere by 38%, 37% and 80%, respectively (Figure 6). In the S3 and S4 scenarios, the reduction of nitrogen loads by acting on chemical fertilisation and livestock manure yielded a further enhancement of the N efficiency (ΔH = 15% and 9% for S3 and S4, respectively) of the overall system (Figure 6). In these scenarios, the nitrogen included was almost entirely converted into the products as Norg, with minimal N losses towards the groundwater and atmosphere compartments. The contribution of Norg to entropy in the S3 scenario was higher than that in the S4 scenario (RSE_product = 0.111 for S3 and 0.107 for S4), although S4 showed a minor dilution capacity for N into the atmosphere, groundwater, and surface water compartments (Figure 6). On the other hand, an increase in the nitrogen loads (S5 scenario) implied a reduction of the N efficiency (ΔH = 101%) in the TRC system, although we observed an increase in Norg (2%) in the products compared to the actual scenario (Figure 6). This could be explained by a strong entropy contribution due to the increase of N forms in the groundwater (170%) and in the surface water (103%), despite the best yield. Finally, the S4 scenario was the best one. Hence, a reduction of 50% in the N loads within the TRC would allow for a better system performance, which would be able to maximize the yields through the significant reduction of nitrogen losses in the environment.

4. Discussion

The Tiber catchment showed low nitrogen retention. This phenomenon could be due to several reasons, including (1) the type of soil having a low N retention capacity (prevalently Cambisols and Leptosols), and (2) nitrogen loads coming from atmospheric deposition, biological fixation, and the livestock industry. The use of conventional agricultural practices makes soils more compressed, decreasing the mineral component uptakes, such as the nitrogen uptake. An additional consequence of the conventional agricultural practices is to increase the run-off and enhance the nitrogen load in the surface- and in drainage waters. UAA is a very important variable in the determination of the N balance in the sub-catchments. UAA is linked to zoo-technical and agricultural activities, such as the Total N loads due to the livestock industry and the Total N losses (denitrification) by livestock and agricultural practices, which, in turn, control the N release out of the catchment or among the sub-catchments. Nitrogen loads due to wastewater, which are directly linked to the residents’ number, did not seem to affect the nitrogen budget. The RSE analysis showed a good N efficiency for the Tiber River catchment, despite its low nitrogen retention value.
The best efficiency observed in the Paglia sub-catchment was due to its ability to concentrate almost all of the N loads into the products (yields), unlike the Aniene and Farfa sub-catchments, which instead highlighted powerful N losses in the environmental matrices. Importantly, the worst N efficiency of the Farfa area was due to the lithological nature of the soil, which made it a system with a high N retention. In order to increase the N retention capacity and NUE, agricultural coverage should be increased in the area and managed through best practices oriented to the reduction of impacts through soft-or-not-soil tillage. The reduction of the N-based chemical fertilisers would be the best practice to aim to increase the percentage of non-symbiotic—and therefore biological—N fixation, and to reduce N loads by a decrease of the livestock number, in order to further practice crop rotation in a more spread-out way, and to maximize the use of crop species which are able to increase the efficiency of nitrogen uptake. A reduction of 25% or 50% of the N loads increased the N efficiency of the Tiber River catchment system, as demonstrated by the RSE simulations. The first intercomparison exercise was carried out by comparing the values obtained for the Tiber River Catchment with those obtained for the Austrian catchments of Wulka and Ybbs [73]. We observed that the TRC system has a greater nitrogen management efficiency, with a delta surplus = 15.83% (19 kg N/ha yr), NUE = 84% and ΔH = 51%, despite the greater surface area of the catchment and UAA. The Wulka catchment showed delta surplus values of 37% (21 kg N/ha yr), and NUE and ΔH values of 67% and 180%, respectively, while the Ybbs catchment had delta surplus, NUE and ΔH values equal to 57% (79 kg N/ha yr), 43% and 335%, respectively. This intercomparison highlights the homogeneity of the values and the usefulness of the RSE analysis, which is a method to evaluate the system’s efficiency and dispersion of various nitrogen compounds into the systemic environmental matrices. The recommendation reported in [73] concerning the use of SEA as an agri-environmental indicator to be integrated into the decision-making processes regarding nitrogen management strategies is here renewed.
The surplus calculation may be considered a good indicator of the environmental impacts due to agricultural practices, but its integration with the information about the type of N that is released into the environmental matrices, and in nitrogen compounds and load variations, allows a more detailed analysis of N input and output fluxes, enabling more effective management actions.
In conclusion, the important points of this study are related to the importance of the environmental matrix in the determination of the nitrogen budget at the river basin level. This matrix is mainly characterized by the different types of soil, by the mosaic of agricultural and forest coverings, and therefore, by the current land use. In this environmental complexity, the approach based on the integration of nitrogen budget calculation—based on the soil budget system, with the random forest and Statistical Entropy Analysis—provides a powerful analysis and monitoring tool for future land-use changes. It will soon be possible to carry out a historical analysis aimed at comparing the management and land-use changes, and the effects on the nitrogen budget on the Tiber River Catchment with the release of the seventh general agricultural census provided by the Italian National Institute of Statistics (ISTAT) in March 2022.

Supplementary Materials

The following supporting information can be downloaded at: https://www.mdpi.com/article/10.3390/soilsystems6010017/s1, File S1: Animal categories that are considered in the ISTAT database for calculating the N contribution by livestock manure; File S2: The GAINS model: an overview; File S3: Predictors used in the Random Forest (RF) analysis.

Author Contributions

Conceptualization, A.D.M.; methodology, M.V. and D.L.; software, D.L.; formal analysis, M.V. and D.L.; resources, A.D.M.; data curation, M.F.F. and A.S.; writing—original draft preparation, A.D.M.; writing—review and editing, M.V.; visualization, M.F.F. and A.S.; supervision, M.V. and A.D.M. All authors have read and agreed to the published version of the manuscript.

Funding

This research received no external funding.

Institutional Review Board Statement

Not applicable.

Informed Consent Statement

Not applicable.

Data Availability Statement

The data utilized in this work came from the sixth Agricultural Census for 2010 (http://dati-censimentoagricoltura.istat.it/Index.aspx), which was supplied by The Italian National Institute of Statistics.

Acknowledgments

The authors wish to thank the International Nitrogen Management System (INMS) project for its support, and all of the Italian personnel involved in the national network for nitrogen studies (Italian Nitrogen Network, INN).

Conflicts of Interest

The authors declare no conflict of interest.

References

  1. Alkan, A.; Serdar, S.; Fidan, D.; Akbaş, U.; Zengin, B.; Kılıç, M.B. Physico-Chemical Characteristics and Nutrient Levels of the Eastern Black Sea Rivers Ali. Turkish J. Fish. Aquat. Sci. 2013, 13, 847–859. [Google Scholar]
  2. Kumar, R.N.; Solanki, R.; Nirmal Kumar, J.I. An assessment of seasonal variation and water quality index of Sabarmati River and Kharicut canal at Ahmedabad, Gujarat. Electron. J. Environ. Agric. Food Chem. 1970, 10, 2771–2782. [Google Scholar]
  3. Venkatesharaju, K.; Ravikumar, P.; Somashekar, R.; Prakash, K. Physico-Chemical and Bacteriological Investigation on the River Cauvery of Kollegal Stretch in Karnataka. Kathmandu Univ. J. Sci. Eng. Technol. 1970, 6, 50–59. [Google Scholar] [CrossRef] [Green Version]
  4. Ananthan, G.; Sampathkumar, P.; Palpandi, C.; Kannan, L. Distribution of heavy metals in Vellar estuary, Southeast coast of India. J. Ecotoxicol. Environ. Monit. 2006, 16, 501–506. [Google Scholar]
  5. Shin, J.Y.; Artigas, F.; Hobble, C.; Lee, Y.S. Assessment of anthropogenic influences on surface water quality in urban estuary, northern New Jersey: Multivariate approach. Environ. Monit. Assess. 2013, 185, 2777–2794. [Google Scholar] [CrossRef]
  6. Valença, A.P.M.C.; Santos, P.J.P. Macrobenthic community for assessment of estuarine health in tropical areas (Northeast, Brazil): Review of macrofauna classification in ecological groups and application of AZTI Marine Biotic Index. Mar. Pollut. Bull. 2012, 64, 1809–1820. [Google Scholar] [CrossRef]
  7. Tanriverdi, Ç.; Alp, A.; Demirkiran, A.R.; Üçkardeş, F. Assessment of surface water quality of the Ceyhan River basin, Turkey. Environ. Monit. Assess. 2010, 167, 175–184. [Google Scholar] [CrossRef]
  8. Hadjikakou, M. Modelling nitrogen in the Yeilirmak River catchment in Northern Turkey: Impacts of future climate and environmental change and implications for nutrient management. Sci. Total Environ. 2011, 409, 2404–2418. [Google Scholar] [CrossRef]
  9. Fowler, D.; Coyle, M.; Skiba, U.; Sutton, M.A.; Cape, J.N.; Reis, S.; Sheppard, L.J.; Jenkins, A.; Grizzetti, B.; Galloway, J.N.; et al. The global nitrogen cycle in the twenty-first Century. Philos. Trans. R. Soc. B Biol. Sci. 2013, 368, 20130164. [Google Scholar] [CrossRef]
  10. Billen, G.; Thieu, V.; Garnier, J.; Silvestre, M. Modelling the N cascade in regional watersheds: The case study of the Seine, Somme, and Scheldt rivers. Agric Ecosyst. Environ. 2009, 133, 234–246. [Google Scholar] [CrossRef]
  11. Campbell, J.L.; Hornbeck, J.W.; Mitchell, M.J.; Adams, M.B.; Castro, M.S.; Driscoll, C.T.; Kahl, J.S.; Kochenderfer, J.N.; Likens, G.E.; Lynch, J.A.; et al. Input-output budgets of inorganic nitrogen for 24 forest watersheds in the Northeastern United States: A review. Water Air Soil Pollut. 2004, 151, 373–396. [Google Scholar] [CrossRef]
  12. Passy, P.; Gypens, N.; Billen, G.; Garnier, J.; Thieu, V.; Rousseau, V.; Callens, J.; Parent, J.-Y.; Lancelot, C. A model reconstruction of riverine nutrient fluxes and eutrophication in the Belgian Coastal Zone since 1984. J. Mar. Syst. 2013, 128, 106–122. [Google Scholar] [CrossRef]
  13. Liu, C.; Kroeze, C.; Hoekstra, A.Y.; Gerbens-Leenes, W. Past and future trends in grey water footprints of anthropogenic nitrogen and phosphorus inputs to major world rivers. Ecol. Indic. 2012, 18, 42–49. [Google Scholar] [CrossRef]
  14. Paerl, H.W. Controlling eutrophication along the freshwater-Marine continuum: Dual nutrient (N and P) reductions are essential. Estuaries Coasts 2009, 32, 593–601. [Google Scholar] [CrossRef] [Green Version]
  15. Vitousek, P.M.; Aber, J.D.; Howarth, R.W.; Likens, G.E.; Matson, P.A.; Schindler, D.W.; Schlesinger, W.H.; Tilman, D.G. Human alteration of the global nitrogen cycle: Sources and consequences. Ecol. Appl. 1997, 7, 737–750. [Google Scholar] [CrossRef] [Green Version]
  16. Puckett, L.J. Identifying the Major Sources of Nutrient Water Pollution: A national watershed-based analysis connects nonpoint and point sources of nitrogen and phosphorus with regional land use and other factors. Environ. Sci. Technol. 1995, 29, 408A–414A. [Google Scholar] [CrossRef]
  17. Cassman, K.G.; Dobermann, A.; Walters, D.T. Agroecosystems, nitrogen-use efficiency, and nitrogen management. Ambio 2002, 31, 132–140. [Google Scholar] [CrossRef]
  18. Galloway, J.N.; Townsend, A.R.; Erisman, J.W.; Bekunda, M.; Cai, Z.; Freney, J.R.; Martinelli, L.A.; Seitzinger, S.P.; Sutton, M.A. Transformation of the nitrogen cycle: Recent trends, questions, and potential solutions. Science 2008, 320, 889–892. [Google Scholar] [CrossRef] [Green Version]
  19. Hertel, O.; Skjøth, C.A.; Reis, S.; Bleeker, A.; Harrison, R.M.; Cape, J.N.; Fowler, D.; Skiba, U.; Simpson, D.; Jickells, T.; et al. Governing processes for reactive nitrogen compounds in the European atmosphere. Biogeosciences 2012, 9, 4921–4954. [Google Scholar] [CrossRef] [Green Version]
  20. Somma, F. River Basin Network on Water Framework Directive and Agriculture: Practical Experiences and Knowledge Exchange in Support of the WFD Implementation (2010–2012); European Commission-Joint Research Centre-Institute for Environment and Sustainability, Reference JRC78538 Luxembourg; Publications Office of the European Union: Ispra, Italy, 2013. [Google Scholar]
  21. Balestrini, R.; Arese, C.; Delconte, C.A.; Lotti, A.; Salerno, F. Nitrogen removal in subsurface water by narrow buffer strips in the intensive farming landscape of the Po River watershed, Italy. Ecol. Eng. 2011, 37, 148–157. [Google Scholar] [CrossRef]
  22. Böhlke, J.K.; Verstraeten, I.M.; Kraemer, T.F. Effects of surface-water irrigation on sources, fluxes, and residence times of water, nitrate, and uranium in an alluvial aquifer. Appl. Geochem. 2007, 22, 152–174. [Google Scholar] [CrossRef]
  23. Maher, K. The dependence of chemical weathering rates on fluid residence time. Earth Planet. Sci. Lett. 2010, 294, 101–110. [Google Scholar] [CrossRef]
  24. Böhlke, J.K.; O’Connell, M.E.; Prestegaard, K.L. Groundwater stratification and delivery of nitrate to an incised stream under varying flow conditions. J. Environ. Qual. 2008, 36, 664–680. [Google Scholar] [CrossRef] [PubMed]
  25. Mulholland, P.J.; Helton, A.M.; Poole, G.; Hall, R.O.; Hamilton, S.K.; Peterson, B.J.; Tank, J.L.; Ashkenas, L.R.; Cooper, L.; Dahm, C.N.; et al. Stream denitrification across biomes and its response to anthropogenic nitrate loading. Nature 2008, 452, 202–205. [Google Scholar] [CrossRef]
  26. Ward, M.H.; Dekok, T.M.; Levallois, P.; Brender, J.; Gulis, G.; Nolan, B.T.; VanDerslice, J. Workgroup report: Drinking-water nitrate and health-Recent findings and research needs. Environ. Health Perspect. 2005, 113, 1607–1614. [Google Scholar] [CrossRef] [Green Version]
  27. Davidson, E.A. The contribution of manure and fertilizer nitrogen to atmospheric nitrous oxide since 1860. Nat. Geosci. 2009, 2, 659–662. [Google Scholar] [CrossRef]
  28. Rock, L.; Mayer, B. Nitrogen budget for the Oldman River Basin, southern Alberta, Canada. Nutr. Cycl. Agroecosystems 2006, 75, 147–162. [Google Scholar] [CrossRef]
  29. Wollheim, W.M.; Vörösmarty, C.J.; Bouwman, A.F.; Green, P.; Harrison, J.; Linder, E.; Peterson, B.J.; Seitzinger, S.P.; Syvitski, J.P.M. Global N removal by freshwater aquatic systems using a spatially distributed, within-basin approach. Global Biogeochem. Cycles 2008, 22, 1–14. [Google Scholar] [CrossRef] [Green Version]
  30. Neal, C.; Jarvie, H.P.; Neal, M.; Hill, L.; Wickham, H. Nitrate concentrations in river waters of the upper Thames and its tributaries. Sci. Total Environ. 2006, 365, 15–32. [Google Scholar] [CrossRef]
  31. Neal, C.; Jarvie, H.P.; Love, A.; Neal, M.; Wickham, H.; Harman, S. Water quality along a river continuum subject to point and diffuse sources. J. Hydrol. 2008, 350, 154–165. [Google Scholar] [CrossRef]
  32. Ribbe, L.; Delgado, P.; Salgado, E.; Flügel, W.A. Nitrate pollution of surface water induced by agricultural non-point pollution in the Pocochay watershed, Chile. Desalination 2008, 226, 13–20. [Google Scholar] [CrossRef]
  33. Lassaletta, L.; García-Gómez, H.; Gimeno, B.S.; Rovira, J.V. Agriculture-induced increase in nitrate concentrations in stream waters of a large Mediterranean catchment over 25 years (1981–2005). Sci. Total Environ. 2009, 407, 6034–6043. [Google Scholar] [CrossRef] [PubMed]
  34. Flohre, A.; Fischer, C.; Aavik, T.; Bengtsson, J.; Berendse, F.; Bommarco, R.; Ceryngier, P.; Clement, L.W.; Dennis, C.; Eggers, S.; et al. Agricultural intensification and biodiversity partitioning in European landscapes comparing plants, carabids, and birds. Ecol. Appl. 2011, 21, 1772–1781. [Google Scholar] [CrossRef] [PubMed] [Green Version]
  35. Carstensen, J.; Andersen, J.H.; Gustafsson, B.G.; Conley, D.J. Deoxygenation of the Baltic Sea during the last century. Proc. Natl. Acad. Sci. USA 2014, 111, 5628–5633. [Google Scholar] [CrossRef] [Green Version]
  36. Mockler, E.M.; Deakin, J.; Archbold, M.; Gill, L.; Daly, D.; Bruen, M. Sources of nitrogen and phosphorus emissions to Irish rivers and coastal waters: Estimates from a nutrient load apportionment framework. Sci. Total Environ. 2017, 601, 326–339. [Google Scholar] [CrossRef]
  37. Morales-Marín, L.A.; Wheater, H.S.; Lindenschmidt, K.E. Assessment of nutrient loadings of a large multipurpose prairie reservoir. J. Hydrol. 2017, 550, 166–185. [Google Scholar] [CrossRef]
  38. Reichard, J.S.; Brown, C.M. Detecting groundwater contamination of a river in Georgia, the USA using baseflow sampling. Hydrogeol. J. 2009, 17, 735–747. [Google Scholar] [CrossRef]
  39. Ouyang, Y. Estimation of shallow groundwater discharge and nutrient load into a river. Ecol. Eng. 2012, 38, 101–104. [Google Scholar] [CrossRef]
  40. Alexander, R.B.; Bohlke, J.K.; Boyer, E.; David, M.B.; Harvey, J.; Mulholland, P.J.; Seitzinger, S.P.; Tobias, C.R.; Tonitto, C.; Wollheim, W. Dynamic modeling of nitrogen losses in river networks unravels the coupled effects of hydrological and biogeochemical processes. Biogeochemistry 2009, 93, 91–116. [Google Scholar] [CrossRef] [Green Version]
  41. Luo, G.; Bu, F.; Xu, X.; Cao, J.; Shu, W. Seasonal variations of dissolved inorganic nutrients transported to the Linjiang Bay of the Three Gorges Reservoir, China. Environ. Monit. Assess. 2011, 173, 55–64. [Google Scholar] [CrossRef]
  42. Van Breemen, N.V.; Boyer, E.W.; Goodale, C.L.; Jaworski, N.A.; Paustian, K.; Seitzinger, S.P.; Lajtha, K.; Mayer, B.; Van Dam, D.; Howarth, R.W.; et al. Where did all the nitrogen go? Fate of nitrogen inputs to large watersheds in the north-eastern USA. Biogeochemistry 2002, 57, 267–293. [Google Scholar] [CrossRef]
  43. Puckett, L.J.; Tesoriero, A.J.; Dubrovsky, N.M. Nitrogen contamination of surficial aquifers-A growing legacy. Environ. Sci. Technol. 2011, 45, 839–844. [Google Scholar] [CrossRef] [PubMed]
  44. European Commission. Common implementation strategy for the water framework directive (2000/60/EC). In Guidance document no. 7—Monitoring under the Water Framework Directive; Office for Official Publications of the Europe: Luxembourg, 2003. [Google Scholar]
  45. Teodosiu, C.; Barjoveanu, G.; Teleman, D. Sustainable water resources management 1. River basin management and the EC water framework directive. Environ. Eng. Manag. J. 2003, 2, 377–394. [Google Scholar] [CrossRef]
  46. European Commission. Report from the Commission to the European Parliament and the Council on the implementation of the European Statistical Programme 2013–2017; European Commission: Brussels, Belgium; Luxembourg, 2015. [Google Scholar]
  47. Sánchez-Montoya, M.D.M.; Arce, M.I.; Vidal-Abarca, M.R.; Suárez, M.L.; Prat, N.; Gómez, R. Establishing physico-chemical reference conditions in Mediterranean streams according to the European Water Framework Directive. Water Res. 2012, 46, 2257–2269. [Google Scholar] [CrossRef]
  48. European Commission. Report from the commission to the European parliament and the council on the implementation of the Water Framework Directive (2000/60/EC). In River Basin Management Plans; European Commission: Brussels, Belgium; Luxembourg, 2012. [Google Scholar]
  49. Galloway, J.N.; Hiram Levy, I.I.; Kasibhatla, P.S. Year 2020: Consequences of population growth and development on deposition of oxidized nitrogen. Ambio 1994, 23, 120–123. [Google Scholar]
  50. Rizzoni, M.; Gustavino, B.; Ferrari, C.; Gatti, L.G.; Fano, E.A. An integrated approach to the assessment of the environmental quality of the Tiber River in the urban area of Rome: A mutagenesis assay (micronucleus test) and an analysis of macrobenthic community structure. Sci. Total Environ. 1995, 162, 127–137. [Google Scholar] [CrossRef]
  51. Istituto di ricerca sulle acque Roma. Indagini Sull’inquinamento del Fiume Tevere; Istituto di ricerca sulle acque Roma: Roma, Italy, 1978. [Google Scholar]
  52. Casini, M.; Giussani, E. Il Tevere a Roma. Autorità di Bacino del Fiume Tevere—Citera; Edizioni Ambiente: Milano, Italy, 2006. [Google Scholar]
  53. Oenema, O.; Kros, H.; De Vries, W. Approaches, and uncertainties in nutrient budgets: Implications for nutrient management and environmental policies. Eur. J. Agron. 2003, 20, 3–16. [Google Scholar] [CrossRef]
  54. ERSAF Lombardia. ERSAF Lombardia (2016) Allegato A—“Programma d’Azione regionale per la protezione delle acque dall’inquinamento provocato dai nitrati provenienti da fonti agricole nelle zone vulnerabili ai sensi della Direttiva nitrati 91/676/CEE”. Available online: https://www.ersaf.lombardia.it/it/file/2103/08bbc92c/Allegato+A+Programma+d%27Azione+Nitrati+2016-2019.pdf (accessed on 29 January 2022).
  55. Regione Emilia Romagna, Deliberazione dell’Assemblea Legislativa della Regione Emilia-Romagna del 16 gennaio 2007, n. 96-Attuazione del decreto del Ministro delle Politiche agricole e forestali 7 aprile 2006. Programma d’azione per le zone vulnerabili ai nitrati da fonte agricola. Bollettino Ufficiale Regione Emilia-Romagna. 2007. Available online: https://bur.regione.emilia-romagna.it/archivio/bollettino_download?anno=2007&num_boll=16. (accessed on 27 January 2022).
  56. McKee, L.J.; Eyre, B.D. Nitrogen and phosphorus budgets for the sub-tropical Richmond River catchment, Australia. Biogeochemistry 2000, 50, 207–239. [Google Scholar] [CrossRef]
  57. De Falco, E.; Landi, G.; Sassano, A.; De Franchi, A.S. Harvest management effects on lucerne (Medicago sativa L.) forage production and quality in a hilly environment in southern Italy. In Optimal Forage Systems for Animal Production and the Environment, Proceedings of the 12th Symposium of the European Grassland Federation, Pleven, Bulgaria, 26–28 May 2003; Bulgarian Association for Grassland and Forage Production (BAGFP): Bulgaria, Balkans, 2003; pp. 348–351. [Google Scholar]
  58. Herridge, D.F.; Peoples, M.B.; Boddey, R.M. Global inputs of biological nitrogen fixation in agricultural systems. Plant Soil 2008, 311, 1–18. [Google Scholar] [CrossRef]
  59. Salvagiotti, F.; Cassman, K.; Specht, J.; Walters, D.; Weiss, A.; Dobermann, A. Nitrogen uptake, fixation, and response to fertilizer N in soybeans: A review. F Crop Res. 2008, 108, 1–13. [Google Scholar] [CrossRef] [Green Version]
  60. Jordan, T.E.; Weller, D.E. Human contributions to terrestrial nitrogen flux. Bioscience 1996, 46, 655–664. [Google Scholar] [CrossRef] [Green Version]
  61. Van Der Weerden, T.J.; Jarvis, S.C. Ammonia emission factors for N fertilizers applied to two contrasting grassland soils. Environ. Pollut. 1997, 95, 205–211. [Google Scholar] [CrossRef]
  62. Bussink, D.W.; Oenema, O. Ammonia volatilization from dairy farming systems in temperate areas: A review. Nutr. Cycl. Agroecosystems 1998, 51, 19–33. [Google Scholar] [CrossRef]
  63. Asman, W.A.H. Factors influencing local dry deposition of gases with special reference to ammonia. Atmos Env. 1998, 32, 415–421. [Google Scholar] [CrossRef]
  64. Smil, V. Nitrogen in crop production: An account of global flows. Glob. Biogeochem Cycles 1999, 13, 647–662. [Google Scholar] [CrossRef] [Green Version]
  65. Panagos, P.; Van Liedekerke, M.; Jones, A.; Montanarella, L. European Soil Data Centre: Response to European policy support and public data requirements. Land Use Policy 2012, 29, 329–338. [Google Scholar] [CrossRef]
  66. Velthof, G.; Oudendag, D.; Witzke, H.; Asman, W.; Klimont, Z.; Oenema, O. Integrated Assessment of Nitrogen Losses from Agriculture in EU-27 using MITERRA-EUROPE. J. Environ. Qual. 2009, 38, 402–417. [Google Scholar] [CrossRef]
  67. Breiman, L. Bagging Predictors. Mach. Learn. 1996, 24, 123–140. [Google Scholar] [CrossRef] [Green Version]
  68. Breiman, L. ST4_Method_Random_Forest. Mach. Learn. 2001, 45, 5–32. [Google Scholar] [CrossRef] [Green Version]
  69. Breiman, L.; Cutler, A. Manual--Setting Up, Using, And Understanding Random Forests V4.0, Technical report, University of California, Berkeley. 2003. Available online: https://www.stat.berkeley.edu/~breiman/Using_random_forests_v4.0.pdf (accessed on 15 December 2021).
  70. Vitale, M.; Proietti, C.; Cionni, I.; Fischer, R.; De Marco, A. Random forests analysis: A useful tool for defining the relative importance of environmental conditions on crown defoliation. Water. Air. Soil Pollut. 2014, 225, 1992. [Google Scholar] [CrossRef]
  71. Rechberger, H.; Brunner, P.H. A new, entropy-based method to support waste and resource management decisions. Environ. Sci. Technol. 2002, 36, 809–816. [Google Scholar] [CrossRef] [PubMed]
  72. Sobańtka, A.P.; Zessner, M.; Rechberger, H. The extension of statistical entropy analysis to chemical compounds. Entropy 2012, 14, 2413–2426. [Google Scholar] [CrossRef] [Green Version]
  73. Sobańtka, A.P.; Thaler, S.; Zessner, M.; Rechberger, H. Extended statistical entropy analysis for the evaluation of nitrogen budgets in Austria. Int. J. Environ. Sci. Technol. 2014, 11, 1947–1958. [Google Scholar] [CrossRef] [Green Version]
  74. Bürgmann, H.; Widmer, F.; Sigler, W.V.; Zeyer, J. mRNA extraction and reverse transcription-PCR protocol for detection of nifH gene expression by Azotobacter vinelandii in soil. Appl. Environ. Microbiol. 2003, 69, 1928–1935. [Google Scholar] [CrossRef] [Green Version]
  75. De Marco, A.; Screpanti, A.; Attorre, F.; Proietti, C.; Vitale, M. Assessing ozone and nitrogen impact on net primary productivity with a Generalised Non-Linear Model. Environ. Pollut. 2013, 172, 250–263. [Google Scholar] [CrossRef]
  76. IUSS Working Group WRB. World Reference Base for Soil Resources 2014, update 2015. International soil classification system for naming soils and creating legends for soil maps. In World Soil Resources Reports No. 106; FAO: Rome, Italy, 2015. [Google Scholar]
  77. Oenema, O.; Brentrup, F.; Lammel, J.; Bascou, P.; Billen, G.; Dobermann, A.; Erisman, J.W.; Garnett, T.; Hammel, M.; Haniotis, T.; et al. Nitrogen Use Efficiency (NUE)—An Indicator for the Utilization of Nitrogen in Agriculture and Food Systems; EU Nitrogen Expert Panel; Wageningen University: Wageningen, The Netherlands, 2015; p. 47. [Google Scholar]
  78. Gozzi, C.; Filzmoser, P.; Buccianti, A.; Vaselli, O.; Nisi, B. Statistical methods for the geochemical characterisation of surface waters: The case study of the Tiber River basin (Central Italy). Comput. Geosci. 2019, 131, 80–88. [Google Scholar] [CrossRef]
Figure 1. The Tiber River catchment area and the tributaries’ sub-catchments.
Soilsystems 06 00017 g001
Figure 2. Tiber river catchment system’s N budget. The four input fluxes were synthetic fertilization, farming animals, atmospheric deposition, and N fixation. Three fluxes were the outputs: ammonia volatilization, denitrification in soil, and crop uptake product) (a); worst entropy Hmax scenario (b); minimal entropy scenario Hopt (c). All of the data were normalized to 1 Kg N/ha year anthropogenic input (animal farming, synthetic fertilization, and N fixation from seeds) (modified from [72]).
Soilsystems 06 00017 g002
Figure 3. Relative percentages of residential people (a) and land extensions (b) for each sub-catchment.
Soilsystems 06 00017 g003
Figure 4. Repartition of the land-use categories among the sub-catchments.
Soilsystems 06 00017 g004
Figure 5. RSE output contributions for the TRC system and its sub-catchments. The RSE product represents nitrogen converted mainly into biomass (crop uptake, in our case). It corresponds to the system’s ability to concentrate the input nitrogen into the product. RSE_groundwater, RSE_surfac water and RSE_atmosphere indicate the loss of nitrogen by the system in the various environmental matrices. The total relative statistical entropy of each sub-basin and the whole TRC is given by the sum of the single components. A high system efficiency regarding the handling of nitrogen is indicated by low RSE values. Such values indicate that most of the nitrogen is converted into a product with minimal dispersion (“dilution”) in the environment.
Soilsystems 06 00017 g005
Figure 6. Simulated relative statistical entropy output contributions for the Tiber River Catchment system (RTC) with the relative efficiency values ΔH, expressed as a percentage, in different management scenarios compared to the actual TRC scenario.
Soilsystems 06 00017 g006
Table 1. Data regarding the Tiber River catchment (TRC) and its sub-catchments. All of the data come from the database of the Italian National Institute of Statistics (ISTAT), which was produced as part of the sixth agricultural census in 2010.
Sub-CatchmentArea
(ha)
Population
(×106)
Utilised Agricultural Area (UAA)
(ha)
Total N Input
(t N/yr)
Total N Input/UAA
t N/(ha yr)
Total N Output
(t N/yr)
Total N Output/UAA
t N/(ha yr)
Tiber560,5022.874267,82135,3510.13228,4550.106
Nera411,4290.389133,31513,3210.10095200.071
Chiascio163,0520.21576,47510,3950.13672790.095
Paglia129,7460.07950,35652490.10461790.123
Aniene114,5600.35830,90424590.08011570.037
Nestore87,1370.08636,08749720.13837160.103
Treja40,2230.05918,98020940.11021960.116
Cerfone29,7940.01311,16110110.0918650.077
Farfa18,0110.017856211090.1304320.050
TRC1,554,4544.090633,66275,9610.12059,7980.094
Table 2. The Soil System Budget Model for the Tiber River Catchment (TRC).
INPUTt N/year% of the total
Animal farming14,649.7319.25%
Synthetic fertilization23,400.3630.75%
Biological fixation34,496.5545.33%
Atmospheric deposition3552.674.67%
Σinput76,099.31100%
OUTPUTt N/year% of the total
Food, horticulture and industrial crops uptake50,874.4679.43%
Nitrogen leaching2645.054.13%
Ammonia volatilization5203.138.12%
Denitrification in soil3805.015.94%
Runoff1522.002.38%
Σoutput64,046.66100%
Σinput − Σoutput12,052.65
Table 3. The most important variables affecting the N retention are sorted by their importance in the Tiber catchment and its sub-catchments. The Random Forest analysis was not able to fulfil the minimal threshold of the monitoring sites (equal to or above 20 sites) for the sub-catchments Nestore, Cerfone, Farfa, and Treja; therefore, these were not reported in this analysis.
Importance RankTiber River CatchmentSub-Catchments
TiberAnienePagliaNeraChiascio
1Total N loss by denitrification (Livestock + Agriculture)Total N loss by denitrification (Livestock + Agriculture)N load by atmospheric depositionAnimal husbandry load densityN load by atmospheric depositionTotal N load by biological fixation
2N load by atmospheric depositionTotal N load by biological fixationTotal N load by biological fixationTotal N load due to livestock industryTotal N load due to livestock industry
3Utilised
Agricultural Area
N load by atmospheric depositionTotal N loss by denitrification (Livestock + Agriculture)Total N load by biological fixationUtilised
Agricultural Area
4Total N load due to livestock industryUtilised
Agricultural Area
N load by residentsTotal N loss by denitrification (Livestock + Agriculture)
5Total N loss (sum of fractions effectively lost)Total N load due to livestock industry
6Nitrogen losses from non-nitrogen fixing plantsTotal N loss (sum of fractions effectively lost)
7Total N load by biological fixation
Table 4. Input and output entropy (Hin and Hout, respectively), RSE, and NUE values for the assessment of the N performance concerning the Tiber River Catchment (TRC) system and its sub-catchments. Relative Statistical Entropy, RSEx = Hx/Hmax (x = in, out), ΔH = (HoutHin/Hin) × 100 and NUE = Nout/Nin. The values of Nin and Nout for the TRC refer to those in Table 1. The values of Nin and Nout for each sub-basin are not reported here.
HinHoutHmaxΔHRSEinRSEoutNUE
Aniene0.8437.86110.914833%0.0770.72024%
Cerfone1.6882.3239.81446%0.1710.25188%
Chiascio1.7215.15813.085200%0.1320.39484%
Farfa0.5879.4369.5031508%0.0620.99323%
Nera1.9673.45513.41676%0.1470.25760%
Nestore2.2103.83011.89673%0.1860.32296%
Paglia1.6071.69812.6166%0.1270.135119%
Tiber1.9172.69214.84240%0.1290.18192%
Treja1.1322.36111.282109%0.1000.20965%
Tiber River Catchment1.9062.88515.96751%0.1190.18184%
Publisher’s Note: MDPI stays neutral with regard to jurisdictional claims in published maps and institutional affiliations.

