Article

Long-Term Crop–Livestock Systems Improve Water Infiltration and Soil Physical Properties

by
Elói Panachuki
1,2,*,
Dorly Scariot Pavei
1,
Roniedison da Silva Menezes
1,
Wander Cardoso Valim
1,
Júlio César Salton
3,
Sonia Armbrust Rodrigues
1 and
Wilk Sampaio de Almeida
4,5,*
1
Agronomy Department, Aquidauana Campus, State University of Mato Grosso do Sul (UEMS), Aquidauana 79200-000, MS, Brazil
2
Tutorial Education Program, PETAGRO/UEMS Group, Ministry of Education, Aquidauana 79200-000, MS, Brazil
3
Western-Region Agriculture Unit, Brazilian Agricultural Research Corporation (Embrapa), Dourados 79804-970, MS, Brazil
4
Efficient Use of Water in Agriculture Program, Institute of Agrifood Research and Technology (IRTA), 25003 Lleida, Spain
5
LEAF—Linking Landscape, Environment, Agriculture and Food Research Center, Associate Laboratory TERRA, Instituto Superior de Agronomia, Universidade de Lisboa, Tapada da Ajuda, 1349-017 Lisboa, Portugal
*
Authors to whom correspondence should be addressed.
Soil Syst. 2026, 10(6), 63; https://doi.org/10.3390/soilsystems10060063

Submission received: 1 March 2026 / Revised: 13 May 2026 / Accepted: 15 May 2026 / Published: 28 May 2026

Abstract

The long-term effects of agricultural management systems (AMS) on soil physical properties and water infiltration in tropical Ferralsols remain incompletely understood. We assessed steady-state infiltration rates and soil physical properties in a Ferralsol after 20 years under five AMS in a Cerrado–Atlantic Forest transition area in Brazil: no-tillage (NT), conventional tillage (CT), integrated crop–livestock in crop (CL-C) and livestock (CL-L) phases, and permanent pasture (PP). Soil samples were collected at four depths, and infiltration was measured using the InfiAsper simulator at 60 mm h−1. Integrated systems showed the best topsoil (0–0.05 m) physical condition, with higher macroporosity, aggregate stability, and organic carbon than NT and CT. Surface bulk density under PP was similar to integrated systems; higher bulk density values were observed under NT and CT at 0.10–0.20 m. Steady-state infiltration rates ranged from 26.40 mm h−1 (PP) to 54.32 mm h−1 (NT), with integrated systems averaging 59% higher than PP. Total SOC stocks (0–0.40 m) were significantly greater under CL-L (92.7 Mg C ha−1) and CL-C (88.1 Mg C ha−1) than PP (73.5 Mg C ha−1; p = 0.004), driven by higher subsoil SOC concentrations under integrated systems; the lower subsoil bulk density under PP partially attenuated its calculated stock. These results demonstrate that integrated crop–livestock systems simultaneously improve soil physical condition, water infiltration, and carbon accumulation per unit land area, supporting sustainable intensification in the Brazilian Cerrado and Atlantic Forest biomes.

1. Introduction

Sustainable agricultural practices—including crop rotation, intercropping, no-tillage, and integrated crop–livestock–forest systems—play a central role in recovering soil organic carbon and mitigating land degradation. Brazil is uniquely positioned to drive global emissions reductions, inform low-carbon agricultural policy, and emerge as a key player in the growing international carbon market [1]. Within this context, soil water infiltration (SWI) is a fundamental process underpinning hydrology, agricultural engineering, irrigation design, and soil and water conservation [2,3,4,5,6]. SWI is defined as the entry of water into the soil surface and its subsequent downward movement through the soil profile [2,7,8,9] and is widely recognized as a sensitive indicator of soil health [10], closely linked to soil organic carbon content and physical structure. Key soil properties influencing SWI include pore structure, bulk density, organic carbon content, aggregate stability, and mean weight diameter [6,11]. Land-use, land cover, and tillage management all affect these properties and, consequently, infiltration rates. Improving SWI through conservation practices contributes directly to reducing land degradation, preventing desertification, and restoring degraded soils [12,13,14].
Soil erosion remains one of the most serious threats to soil function globally, driving declining land productivity and a range of off-site environmental consequences [15]. The loss of topsoil reduces crop yields, degrades ecosystem services, and imposes substantial economic costs [15,16,17,18,19]. Projections suggest that global soil erosion by water will increase by 30–66% by 2070, with the greatest impacts concentrated in the Global South [19]. These trends underscore the need for continued research into the factors controlling erosion across diverse geographical and climatic contexts [20].
The growing global demand for food, energy, and fibre—compounded by the urgency of climate change adaptation and mitigation—has intensified the search for agricultural systems that reconcile high productivity with low environmental impact [21]. The Brazilian Midwest is among the largest agricultural production regions in the world and encompasses two biomes of exceptional biodiversity: the Cerrado (“Brazilian Savanna”) and the Atlantic Forest. In these regions, adopting conservation-oriented management practices is essential to sustain food production while protecting soil, water, and biodiversity in the long term [22].
In the Cerrado, the rapid conversion of native vegetation to agricultural land, combined with inadequate soil management, has accelerated erosion and organic carbon loss [1] and increased CO2 emissions [23]. Land-use-change also substantially alters surface water and energy fluxes, with pastures and plantation systems showing markedly different evapotranspiration, carbon exchange, and energy partitioning compared to native Cerrado vegetation [24]. Land-use-change reduces surface cover and hastens the decomposition and cycling of plant residues, creating conditions that favour erosion. The water erosion process is driven by multiple interacting factors: reduced soil water infiltration, the absence of vegetation cover, high rainfall erosivity, and the susceptibility of the soil to erosive agents. Surface cover plays a decisive role in erosion control by intercepting and dissipating the kinetic energy of raindrops, thereby reducing surface sealing, aggregate breakdown, and runoff generation [25,26]. Changes in land cover and land-use are among the primary drivers of erosion and runoff at the landscape scale [25]. The accurate characterization of infiltration dynamics is therefore valuable not only for erosion prediction but also for monitoring changes in soil physical attributes induced by management practices over time [6].
When properly managed, integrated agricultural systems—including crop–livestock and crop–livestock–forest combinations—promote erosion control by maintaining continuous soil cover from crop residues and improving soil structure through root activity and organic matter inputs. International evidence supports this finding: Well-managed grazing under no-till systems has been shown to maintain soil physical properties, including infiltration capacity in temperate pastoral systems [27,28], consistent with the absence of trampling-induced compaction observed under well-managed permanent pastures in the present study. These systems also contribute to soil and water conservation, increased productivity, and progress toward carbon-neutral agriculture. Integrated crop–livestock–forest systems have been identified as among the most efficient approaches for minimizing the agricultural environmental footprint [29]. Several studies have demonstrated the effectiveness of conservation systems in controlling water erosion. For instance, reductions in soil losses of up to 100% relative to conventional systems have been documented under conservation management [29,30]. Additional benefits of integrated systems include increased organic matter accumulation, improved nutrient cycling, enhanced soil fertility, and the disruption of pest and disease cycles [31]. In a transition area between the Amazon and Cerrado biomes, integrated systems incorporating a forestry component were more effective in reducing water and soil losses than monoculture systems [32]. In the Cerrado specifically, long-term integrated crop–livestock–forest systems with active crop cultivation at the time of measurement have been found to produce higher SWI and lower erosion rates than continuous pasture, with infiltration values approaching those of native Cerrado vegetation [5]. In the Brazilian semi-arid Caatinga biome, integrated livestock–forest systems have similarly been shown to improve soil aggregate stability and water infiltration relative to degraded pastures and conventional tillage, demonstrating that these benefits extend across contrasting Brazilian biomes and soil types [33]. Meta-analyses of grazing intensity effects on soil organic carbon and physical properties across global grassland systems confirm that grazing management intensity is the primary driver of soil physical degradation, and that well-managed systems can maintain or improve soil quality relative to ungrazed controls [34]. A comprehensive review of soil health assessments across pasture management systems in Brazil further confirms that well-managed pastures maintain or improve aggregate stability, organic carbon, and hydraulic properties relative to degraded systems, while integrated crop–livestock systems promote more uniform soil physical quality throughout the profile [35]. Similarly, after 20 years of contrasting management, integrated crop–livestock systems showed the greatest reductions in soil erosion and the best overall soil physical condition relative to monoculture and conventional tillage [29].
There is a broad scientific consensus that integrated agricultural systems improve soil quality and health across diverse global contexts [1,21,33,35,36,37,38]. Long-term studies in the southeastern United States have demonstrated that integrated crop–livestock systems under conservation tillage accumulate significantly more soil organic carbon than monoculture systems over decadal timescales [38], a finding consistent with the 20-year carbon stock data reported here. Nevertheless, soils with exposed surfaces remain widespread in drylands and savannas, highlighting the urgent need for conservation-oriented management in these vulnerable environments [32]. It is important to note that integrated systems are highly context-dependent, and local adaptations lend each study its own scientific value. Compounding the challenge, regions characterized by high deforestation rates, severe erosion, and significant climate change exposure remain underrepresented in soil health research, underscoring the need for scientific partnerships that empower local leadership and develop regionally tailored practices to restore soil health within a meaningful timeframe [31]. A further gap in the literature concerns long-term assessments of the effects of agricultural management systems on soil health indicators, a gap this study addresses directly.
Although the effects of agricultural management on soil attributes and erosion processes in Brazil have been documented [39,40], relatively few studies have evaluated the long-term impacts of integrated crop–livestock systems on water infiltration and soil physical properties, particularly in Ferralsols within the Cerrado and Atlantic Forest biomes. To the authors’ knowledge, only two studies in the Cerrado have examined soil water infiltration and soil physical properties across short-to-medium [41] and long-term [5] timeframes, and the integrated systems evaluated in those studies differ from those investigated here.
To address these knowledge gaps and support evidence-based decision-making in sustainable land management, this study evaluates the long-term (20-year) effects of integrated crop–livestock systems on soil water infiltration and the physical properties of a Ferralsol in a transition area between the Brazilian Cerrado and Atlantic Forest biomes. Soil water infiltration was measured using the portable InfiAsper infiltrometer/rainfall simulator [42], which enables rapid, standardized data collection under rigorously controlled rainfall conditions.
This study makes four explicit contributions that distinguish it from previously published work at this experimental site and in the broader literature. First, while Pavei et al. [29] reported soil physical properties and inter-rill erosion rates under the same management systems, the present study reports steady-state infiltration rates from rainfall simulation—a fundamentally different measurement of the soil hydraulic response—alongside Horton model parameterization, which has not been reported for this site. Second, the integration of infiltration dynamics with soil organic carbon stocks estimated across four depth layers, and the multivariate analysis linking infiltration performance to soil physical quality through principal component analysis, represent analytical approaches that have not been previously applied to this long-term experimental platform. Third, the surface-layer impedance mechanism proposed here for permanent pasture—supported by above-ground biomass data, bulk density profiles, and evidence of litter hydrophobicity—provides a mechanistic interpretation of infiltration deficits under well-managed pasture that moves beyond the compaction paradigm dominant in the literature. Fourth, this study represents the first assessment of SWI and soil physical properties under contrasting long-term integrated agricultural systems in a transition zone between two biomes that together cover 36.9% of Brazil’s territory and encompass the country’s largest agricultural areas: 93 Mha in the Cerrado and 72 Mha in the Atlantic Forest [1]. The InfiAsper simulator—the second most widely used device for erosion research under simulated rainfall in Brazil [40]—supports the careful evaluation of infiltration dynamics needed to guide farmers, technicians, and policymakers in the adoption of conservation agriculture and spatial planning for the sustainable intensification of agricultural systems in these globally significant regions.

2. Materials and Methods

2.1. Experimental Site and Agricultural Management Systems (AMS; Treatments)

The experimental area is located at the Western Agriculture Center of the Brazilian Agricultural Research Corporation (Embrapa), Dourados, Brazil (22°16′55.0′′ S and 54°48′18.1′′ W; 452 m a.s.l.). Embrapa Western Agriculture has maintained different crop–livestock integration systems in this area since 1995 [29,31].
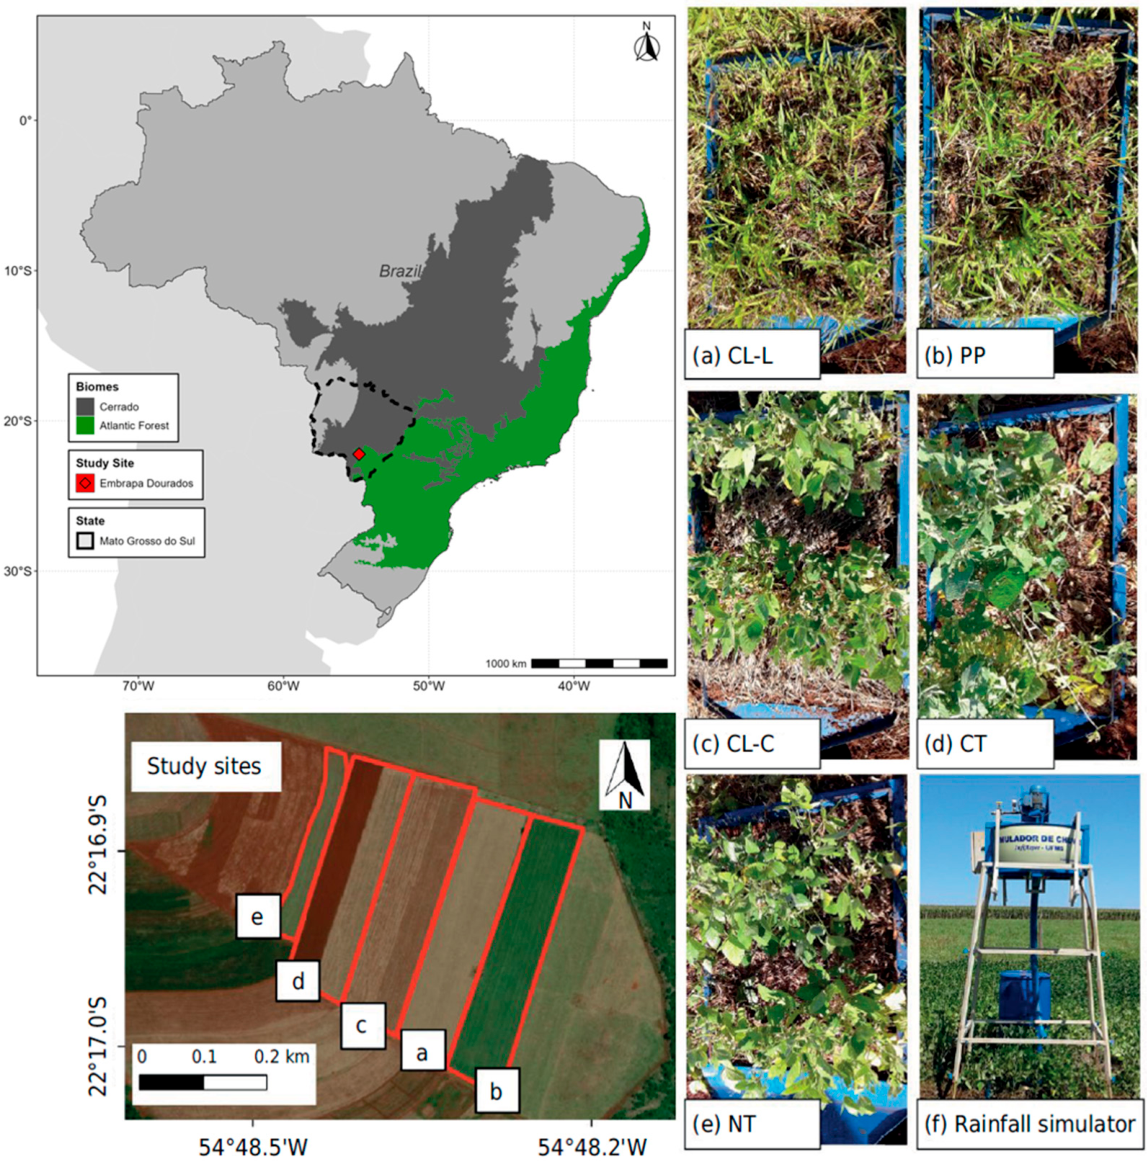
The predominant soil is a LATOSSOLO VERMELHO Distroférrico típico, with a very clay texture according to the Brazilian Soil Classification System [41], equivalent to a Ferralsol in the World Reference Base for Soil Resources (WRB) [43]. Using the USDA triangle method [44], the soil textural class is clay, with 630, 215, and 155 g kg−1 of clay, silt, and sand, respectively [29]. Ferralsols are the second most important soil order in Brazil, occupying 31.61% of its territory [45]. The study area is situated in the Cerrado-Atlantic Forest transition zone (Figure 1). The predominant climate is Köppen type Cwa [46], a humid mesothermal climate characterized by hot summers and dry winters, with a mean annual rainfall of 1500 mm and a mean temperature of 22 °C [29,47]. The mean slope of the experimental area is 0.03 m m−1 [29,47].
The experimental design was a randomized complete block with five treatments (AMS) and five replicates per treatment. The AMS evaluated were:
  • CT—Conventional tillage: Soybean (Glycine max cv. BRS 359 RR) cultivated in summer and oats (Avena sativa) in winter. Sowing followed land contours with 0.45 m row spacing and 14–15 seeds m−1. Soil was prepared using a heavy disc harrow followed by a levelling disc harrow before each sowing season.
  • NT—No-tillage: Soybean and maize (Zea mays) cultivated in summer, wheat (Triticum aestivum) and oats for grain, and turnip (Raphanus sativus) and oats for straw production in the fall–winter season. Crop rotation sequence: turnip—maize—oats—soybean—wheat—soybean. Soybeans sown following land contours with 0.45 m row spacing and 14–15 seeds m−1.
  • CL-L—Crop–livestock integration, livestock phase: A two-year crop phase (soybean/oats under no-tillage, as per NT above) alternating with a two-year livestock phase. During the livestock phase, Nellore steers rotationally grazed a Urochloa decumbens (syn. Brachiaria decumbens) pasture under the put-and-take stocking method [48], with a minimum forage availability of 7 kg dry biomass per 100 kg live animal weight per day (mean live weight 300 kg). Evaluations were carried out during the livestock phase.
  • CL-C—Crop–livestock integration, crop phase: Identical rotation structure to CL-L, but evaluations were carried out during the two-year soybean cropping phase that followed the livestock phase.
  • PP—Permanent pasture: Monoculture U. decumbens under continuous rotational grazing and put-and-take stocking, with a minimum forage availability of 7 kg dry biomass per 100 kg live animal weight per day (mean live weight 300 kg). No fertilization was applied since the experiment was established in 1995.
The treatment description follows [29], which assessed soil erosion rates at the same experimental site and period. All evaluations in the present study were conducted in February 2015, during soybean phenological stage R5.1 (82 days from sowing).

2.2. Soil Sampling for Physical Property Characterization

Undisturbed (core) and disturbed soil samples were collected at four depths: 0–0.05, 0.05–0.10, 0.10–0.20, and 0.20–0.40 m, using volumetric rings with a volume of 100 cm3. Soil bulk density (Bd), total porosity, macroporosity, microporosity, and gravimetric soil water content (SWC) were determined following the Brazilian Manual of Methods and Soil Analysis [49]. Mean weight diameter (MWD) indices were obtained by the dry sieving method (9.52 and 4.76 mm sieves) [49] using five replicates. In addition, five replicate samples were collected to determine soil organic carbon content (SOC) by dry combustion, and dry biomass (DBM) was determined according to the methods described in [49].
Soil penetration resistance (PR) was measured using a Marconi MA-933 digital bench penetrometer at a constant insertion velocity of 0.1667 mm s−1 with a 4 mm base-diameter tapered stem. Three readings were performed on each soil core at SWC corresponding to field capacity [6,50].
The uniformity of initial SWC across plots before rainfall application is a prerequisite for valid treatment comparison in rainfall simulation experiments [6,47,51]. In this study, a natural rainfall of 39.8 mm occurred the day before the evaluations, uniformly bringing all plots to field capacity. Infiltration measurements, therefore, commenced 24 h after the natural rainfall, when the SWC corresponded to field capacity across all treatments and depths.

2.3. Soil Organic Carbon Stock Estimation

Soil organic carbon stocks were estimated for each treatment and depth layer using the standard volumetric method (Equation (1)) [49,52]:
SOC stock (Mg C ha−1) = (C/100) × Bd × e × 10,000
where C is the SOC concentration (%), Bd is the soil bulk density (Mg m−3), and e is the soil layer thickness (m). The factor 10,000 converts from Mg C m−2 to Mg C ha−1. Stocks were estimated for four depth layers (0–0.05, 0.05–0.10, 0.10–0.20, and 0.20–0.40 m) and summed to obtain the total profile stock (0–0.40 m). SOC concentration values were replicate-level measurements (n = 5 per treatment per depth), while bulk density values were treatment means per depth layer obtained from the same experimental plots. Carbon stocks per replicate were calculated using the corresponding treatment mean bulk density and subsequently summarised as treatment means ± standard error. Statistical differences in total SOC stock among treatments were tested using a one-way ANOVA with Tukey’s HSD post hoc test, complemented by the Kruskal–Wallis test. Treatment × Depth interactions in carbon stocks were assessed using the linear mixed-effects model framework described in Section 2.6.

2.4. Soil Water Infiltration Measurements

Water infiltration was evaluated in each AMS using the InfiAsper infiltrometer/rainfall simulator (InfiAsper/UFMS, manufacturer JP Ferragens, Campo Grande, Brazil) [42] (Figure 1f) applied to plot areas of 0.70 m2. Before field measurements, the InfiAsper was calibrated in the laboratory using a grid with 25 collectors over an area of 50 square centimeters, and uniformity coefficients above 80% were obtained, as described in [53,54]. In the calibration tests, the InfiAsper was set to deliver a constant rainfall intensity of 60 mm h−1. This intensity was achieved by adjusting the aperture and number of slits in the obturator at a service pressure of 32 kPa and a drop height of 2.30 m. The applied intensity (60 mm h−1) corresponds to the natural rainfall intensity for the Dourados region for a 60 min duration (58.6 mm h−1) [55,56], equivalent to a return period of approximately 6.5 years (exceedance probability ≈ 15% per year) based on the intensity–duration–frequency (IDF) equation of Pereira et al. [55,56]. The applied intensity also exceeds the threshold for generating surface runoff, enabling the simultaneous assessment of water infiltration and soil erosion potential. The design, construction, and operation characteristics of the InfiAsper are described in detail elsewhere [42,53,54]. The InfiAsper simulator reproduces more than 88% of the kinetic energy of equivalent natural rainfall [6,42,53], exceeding the 75% reference threshold proposed by [57]. This confirms the simulator’s suitability for generating outputs that are comparable to natural rainfall, meeting the validation standard advocated by [58].
Steady-state infiltration rate (SIR) was defined as the mean of the last three consecutive infiltration rate values recorded (minutes 58, 59, and 60 after runoff onset). At that point, surface runoff had stabilized. For each minute, the infiltration rate was calculated as the difference between the water depth applied by the InfiAsper (WDA) and the surface runoff depth (SRD), divided by the collection time interval. Surface runoff was collected in 1 L bottles at one-minute intervals throughout each rainfall event, beginning at the onset of visible flow in the collection channel and ending at minute 60. Runoff volume was divided by the plot area (0.70 m2) to obtain SRD. The time elapsed from the start of rainfall application to the first visible runoff in the collection channel was recorded as the time to runoff onset.
The kinetic energy of the simulated precipitation was calculated using the EnerChuva software (version 2.0) [59], considering a nozzle height of 2.30 m, an operating pressure of 32 kPa, a total rainfall duration of 60 min after runoff onset, and a rainfall intensity of 60 mm h−1.

2.5. Infiltration Rate Modelling

Infiltration rate was recorded at one-minute intervals from runoff onset for each replicate plot, defined as the moment surface flow was first observed in the collection channel. Since all replicate time series share a runoff onset at t = 0, treatment mean infiltration curves were calculated as the arithmetic mean of the five replicate infiltration rates at each one-minute interval. Horton’s model [7,8] was then fitted to the resulting treatment mean curve by non-linear least squares (nls function in R (version 4.5.1) [60]). In the Horton model fitting, time t was measured from the onset of surface runoff for each plot, so that f0 represents the initial infiltration rate at the onset of runoff rather than at the start of rainfall application. This convention is consistent with previous applications of the model to InfiAsper simulator data [5,6,47]. Horton’s model provides a better fit than the Kostiakov–Lewis and Philip models in similar experimental conditions [6]. It should be noted that the empirically determined SIR (mean of observed readings at minutes 58–60) and the Horton model parameter fc (theoretical steady-state asymptote from non-linear fitting) are related but distinct quantities. Both are reported in this study: SIR is used for statistical comparisons among treatments, while fc is reported as a Horton model parameter. The close agreement between SIR and fc values across treatments confirms that steady-state conditions were effectively reached by minute 58 in all cases. The equation parameters were estimated by fitting the experimental data using nonlinear regression based on the generalized reduced gradient method [5,6]:
f ( t ) = f c + ( f 0 f c ) e k t
where f(t) is the estimated instantaneous infiltration rate (mm h−1); t is the infiltration time (min); f0 is the initial infiltration rate at runoff onset; fc is the theoretical steady-state infiltration rate estimated by the model (mm h−1); and k is the decay constant. Model goodness-of-fit was evaluated using the coefficient of determination (R2) and the root mean square error (RMSE, mm h−1), following the model evaluation guidelines of [61] and the modelling efficiency (EF) criterion of Nash and Sutcliffe [62].

2.6. Statistical Analysis

All statistical analyses were performed in R version 4.5 [60]. Before hypothesis testing, data normality was assessed using the Shapiro–Wilk test [63] for each treatment group. Homogeneity of variances was evaluated using Levene’s test [64]. Treatment effects on SIR, SOC, and mean weight diameter (MWD) were assessed by one-way analysis of variance (ANOVA), followed by Tukey’s Honestly Significant Difference (HSD) post hoc test [65] at p < 0.05, using the agricolae package. As a non-parametric alternative, the Kruskal–Wallis test followed by Dunn’s post hoc test with Bonferroni correction were applied when normality assumptions were not satisfied.
To account for the hierarchical data structure—comprising multiple depth layers and replicate plots—linear mixed-effects models (LMM) were fitted using the lme4 and lmerTest packages. Treatment and soil depth were included as fixed effects, and replicate plots were included as random effects to account for within-plot correlation. Type III ANOVA assessed the significance of fixed effects with Satterthwaite’s method for denominator degrees of freedom. Pairwise comparisons among treatment means were obtained using the emmeans package with Tukey adjustment.

2.6.1. Correlation and Regression Analyses

To quantitatively assess the relationship between SOC and SIR, as suggested by previous studies, Spearman’s rank correlation and simple linear regression were performed on treatment means (n = 5 treatment groups) at the 0–0.05 m depth. The use of treatment means rather than individual replicates is consistent with the between-treatment nature of the comparison. Given the small sample size (n = 5), results were interpreted with caution due to limited statistical power. A Spearman correlation matrix was additionally computed among all measured soil physical properties (SIR, SOC, MWD, bulk density, macroporosity, microporosity, total porosity, and penetration resistance) at the 0–0.05 m depth to explore multivariate associations. p-value matrices were computed using the corrplot package and visualised as a correlogram.

2.6.2. Principal Component Analysis

A principal component analysis (PCA) was performed to explore the multivariate relationships among SIR and soil physical properties at the 0–0.05 m depth, using treatment means as observations (n = 5). Variables included in the PCA were SIR, SOC, bulk density (Bd), macroporosity, and MWD. All variables were standardized to a mean of 0 and unit variance before analysis (scale.unit = TRUE) to remove the effects of different measurement units and scales. PCA was performed using the FactoMineR package and visualised using factoextra. The quality of variable representation was assessed by the squared cosine (cos2), and the contribution of each variable to principal components was calculated as a percentage of the total inertia explained by each component. Biplots, variable correlation circles, and treatment score plots were generated to facilitate the interpretation of the principal components.

2.6.3. Power Analysis

To formally justify the sample size of five replicates per treatment (n = 5), a post hoc power analysis was performed using the pwr package. The observed effect size (Cohen’s f) was derived from the one-way ANOVA on SIR, and statistical power was calculated for a balanced one-way ANOVA design with five treatment groups at a significance level of α = 0.05. The minimum sample size required to achieve 80% statistical power was also determined.

3. Results

3.1. Soil Physical Properties, Soil Organic Carbon, and Soil Penetration Resistance

After 20 years of contrasting management, significant differences among AMS were observed in soil bulk density (Bd), macroporosity, soil organic carbon (SOC), and penetration resistance (PR) at one or more depths (Table 1). Microporosity and total porosity did not differ significantly among treatments at any depth (p > 0.05, Tukey’s test).
At the topsoil layer (0–0.05 m), CT showed the lowest Bd (1.22 Mg m−3) and the highest macroporosity (0.196 m3 m−3) among all treatments, reflecting the mechanical loosening of the surface layer by disc harrowing. Conversely, CT exhibited the highest Bd and lowest macroporosity at 0.10–0.20 m depth (1.44 Mg m−3; 0.070 m3 m−3), consistent with the formation of a tillage pan below the working depth of agricultural implements. Consequently, PR under CT was lowest at 0–0.05 m (0.91 MPa) but highest at 0.10–0.20 m (3.02 MPa), demonstrating the depth-dependent trade-off inherent to periodic inversion tillage.
Under NT, Bd was intermediate at the surface (1.31 Mg m−3) but increased progressively with depth, reaching 1.39 Mg m−3 at 0.10–0.20 m. Macroporosity values below 0.10 m3 m−3 were recorded at 0.10–0.20 m under both CT (0.070 m3 m−3) and NT (0.082 m3 m−3), values considered restrictive for adequate root growth in Ferralsols [66]. No such restriction was observed in the integrated systems or PP at any depth.
Under PP, the highest Bd and lowest macroporosity were recorded at the topsoil (1.33 Mg m−3; 0.108 m3 m−3), and PR at 0–0.05 m was the highest among all treatments (2.26 MPa), consistent with the cumulative effect of animal trampling on surface soil structure. At 0.05–0.10 m, however, PP presented the lowest Bd (1.25 Mg m−3) of all treatments, indicating that compaction was concentrated in the uppermost layer. In the integrated systems (CL-L and CL-C), Bd values were lower in the deepest layer (1.31–1.32 Mg m−3 at 0.20–0.40 m) than under CT and NT, suggesting that the combination of crop and pasture phases promoted better subsoil structure over time. All Bd values recorded across treatments and depths were below the critical threshold of 1.45 Mg m−3 reported for root growth restriction in Ferralsols [67].
SOC concentration was highest in the topsoil (0–0.05 m) for all treatments and declined with depth. At 0–0.05 m, integrated systems (CL-C: 43.58 g kg−1; CL-L: 42.18 g kg−1) and PP (41.72 g kg−1) showed significantly higher SOC than CT (31.72 g kg−1) and NT (33.74 g kg−1; p < 0.05). At the deepest layer (0.20–0.40 m), PP showed the lowest SOC (19.63 g kg−1), significantly lower than all other treatments (p < 0.05), reflecting the limited depth of carbon inputs under monoculture pastures relative to the diverse root systems of integrated systems. CT, despite incorporating plant residues through tillage, maintained relatively uniform SOC across depths, consistent with the redistribution of organic matter through the arable layer [52,68,69].

3.2. Rainfall Simulation Characteristics and Time to Runoff Onset

SWC before rainfall application did not differ significantly among treatments or depths (p > 0.05), confirming that the natural rainfall event of 39.8 mm that occurred 24 h before the evaluations uniformly brought all plots to field capacity (Table 2). Consequently, initial SWC did not confound treatment comparisons of infiltration or runoff onset.
The kinetic energy ratio of simulated to natural rainfall (Ecs/Ecn) was 96.6% for all treatments, confirming that the InfiAsper simulator closely reproduces the physical characteristics of natural rainfall, well above the 75% reference threshold proposed by [57].
Above-ground dry biomass differed significantly among treatments (p < 0.05), with integrated systems (CL-L: 14.95, CL-C: 12.08 Mg ha−1) accumulating approximately 3.8-fold more biomass than PP (3.90 Mg ha−1), which had the lowest value. NT (11.48 Mg ha−1) and CT (8.43 Mg ha−1) showed intermediate values. The time to runoff onset was strongly influenced by surface biomass and management. NT had the longest time to runoff onset (150.24 min), which was 74%, 77%, 141%, and 197% longer than CT (17.87 min), CL-C (17.32 min), CL-L (9.94 min), and PP (7.27 min), respectively, reflecting the superior capacity of no-tillage with diverse crop residues to retard surface sealing and runoff initiation.

3.3. Normality and Homogeneity of Variances

The Shapiro–Wilk test indicated that steady-state infiltration rate (SIR) data were normally distributed within all treatment groups (W ranging from 0.834 to 0.991, p > 0.05 in all cases). Similarly, SOC concentrations at 0–0.05 m were normally distributed across all treatments (W = 0.908–0.998, p > 0.05). MWD at 0–0.05 m also showed no significant departures from normality (p > 0.05). Total SOC stocks (0–0.40 m) were normally distributed across all treatments (W = 0.805–0.916, p > 0.05). Levene’s test confirmed homogeneity of variances among treatments for SIR (F4,20 = 1.23, p = 0.331), supporting the use of parametric tests.

3.4. Steady-State Infiltration Rate (SIR)

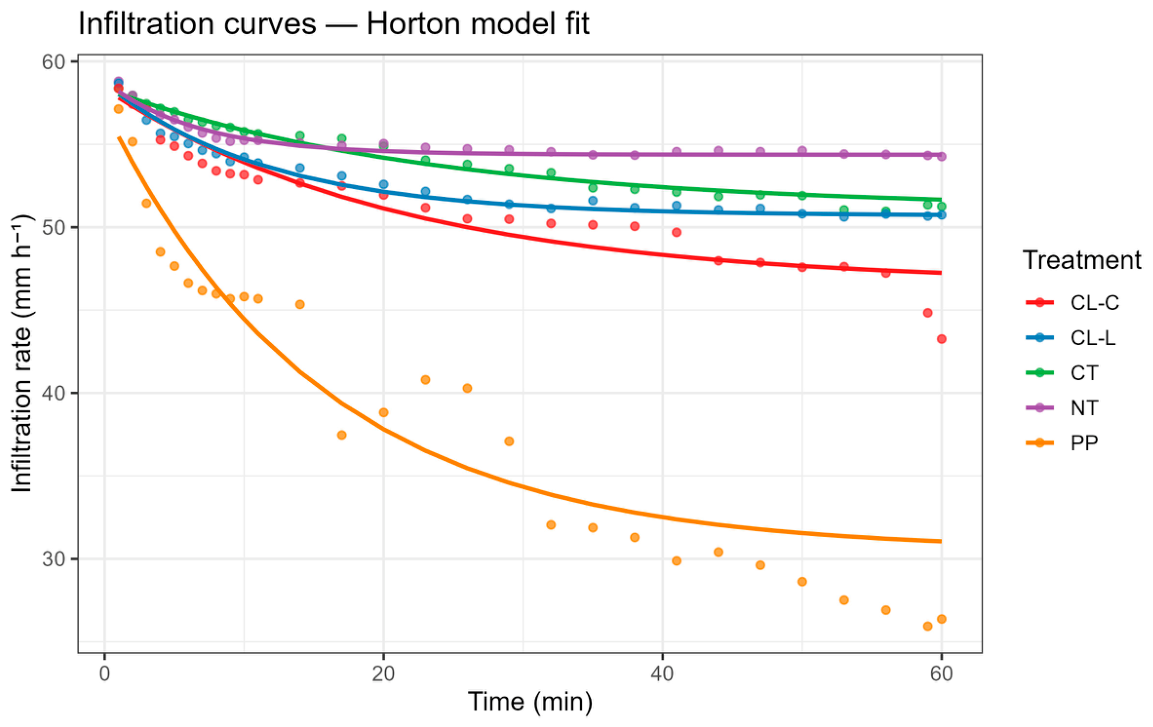
Treatment had a highly significant effect on SIR (one-way ANOVA: F4,20 = 10.44, p < 0.001; Table 3). The linear mixed-effects model confirmed this result (LMM Type III ANOVA: F4,25 = 13.05, p < 0.001). NT presented the highest mean SIR (54.32 ± 2.08 mm h−1), followed by CT (51.18 ± 1.48 mm h−1), CL-L (50.74 ± 2.11 mm h−1), and CL-C (45.11 ± 4.42 mm h−1). PP showed the lowest SIR (26.40 ± 5.44 mm h−1), significantly lower than all other treatments (Tukey’s HSD, p < 0.01 in all cases). The mean SIR of the integrated systems (CL-L and CL-C combined) was 59% higher than that of PP. The Kruskal–Wallis test confirmed the significant treatment effect (χ2 = 13.16, df = 4, p = 0.011), with Dunn’s post hoc test (Bonferroni correction) identifying PP as the only treatment in a distinct group (b), while CT, NT, CL-L, and CL-C shared group a (Table 3; Figure 2).

3.5. Statistical Power and Sample Size Justification

A post hoc power analysis confirmed that n = 5 replicates per treatment was adequate. The observed effect size (Cohen’s f = 1.44, η2 = 0.68) yielded a statistical power of 0.9999 at α = 0.05 for a balanced one-way ANOVA with five treatment groups. The minimum sample size required to achieve 80% statistical power was n = 2.3 per group, confirming that n = 5 substantially exceeded the threshold for adequate statistical inference (Figure S1, Supplementary Materials).

3.6. Horton Infiltration Model

Horton’s model provided an excellent fit to the observed infiltration rate data for all treatments (Table 4; Figure 2). R2 values ranged from 0.920 (CL-C) to 0.987 (CT), and RMSE from 0.163 mm h−1 (NT) to 1.848 mm h−1 (PP), indicating good to excellent model performance across all AMS [61,62]. The Horton steady-state parameter (fc) ranged from 20.47 mm h−1 (PP) to 54.55 mm h−1 (NT), closely reflecting the treatment ranking observed for mean SIR (Table 3). Initial infiltration rates (f0) were similar across treatments (54.28–59.65 mm h−1), indicating comparable infiltration conditions at runoff onset. The decay constant k was highest for NT (0.2035 min−1), indicating a rapid transition to steady-state flow, consistent with efficient near-surface water transmission under no-tillage. The largest RMSE was recorded for PP (1.848 mm h−1), reflecting greater temporal variability in infiltration rates under continuous pasture.

3.7. Spearman Correlation: SOC vs. SIR

The Spearman rank correlation between treatment mean SOC (0–0.05 m) and SIR was negative (ρ = −0.60, p = 0.285). The Pearson correlation was also negative (r = −0.51, t3 = −1.04, p = 0.377). Linear regression of SIR on SOC yielded a negative slope (β = −18.50, SE = 17.86, p = 0.377, R2 = 0.263, F1,3 = 1.07). None of these associations reached statistical significance, consistent with the limited power of treatment mean analyses at n = 5. The negative direction was driven by the position of PP, which combined the highest surface SOC concentration (2.42%) with the lowest SIR (26.40 mm h−1), demonstrating that surface-layer impedance in PP suppressed infiltration independently of organic matter content, a decoupling consistent with the sparse above-ground biomass (3.90 Mg ha−1) and potential transient hydrophobicity of senescent Urochloa decumbens litter inferred under this treatment (Figure S2, Supplementary Materials).

3.8. Spearman Correlation Matrix Among Soil Properties

Spearman correlation coefficients among treatment means at 0–0.05 m are presented in Table S1 (Supplementary Materials). None of the pairwise correlations reached statistical significance, which is expected given the limited power of treatment mean analyses at n = 5 (df = 3); the direction and magnitude of the coefficients are therefore interpreted as indicative rather than inferential. SOC and MWD were positively correlated (ρ = 0.80), consistent with the well-established role of organic matter in promoting macroaggregate formation at the soil surface [70]. Biomass showed moderate positive correlations with both SOC (ρ = 0.60) and MWD (ρ = 0.60), reflecting the contribution of surface plant material to organic matter inputs and aggregate stabilization across treatments. SIR showed negative correlations with SOC (ρ = −0.60) and MWD (ρ = −0.60), and only a weak positive correlation with biomass (ρ = 0.20). These apparently counterintuitive patterns were largely driven by the position of PP in the dataset, which combined the lowest SIR (26.40 mm h−1) and lowest biomass (3.90 Mg ha−1) with SOC (2.42%) and MWD (4.23 mm) values comparable to those of integrated systems. The weak biomass–SIR association indicates that biomass quantity alone does not explain the infiltration deficit under PP at the treatment mean scale. Rather, the multivariate pattern suggests that surface-layer impedance under PP operates through mechanisms not fully captured by bulk biomass, including the potential transient hydrophobicity of sparse senescent litter [71] and lateral routing of water through the dense fibrous root mat [72,73], which decouple SIR from the soil quality gradient represented by SOC and MWD.

3.9. Mixed-Effects Models: Treatment × Depth Interactions

Linear mixed-effects models revealed highly significant Treatment × Depth interactions for all soil properties analysed. For MWD: the effects of treatment (F4,76 = 251.80, p < 0.001), depth (F3,76 = 94.86, p < 0.001), and interaction (F12,76 = 14.22, p < 0.001). For SOC: treatment (F4,95 = 6.15, p < 0.001), depth (F3,95 = 65.46, p < 0.001), and interaction (F12,95 = 2.90, p = 0.002).
At 0–0.05 m, CL-C and CL-L had significantly higher SOC than CT (p = 0.001 and p = 0.003, respectively) and NT (p = 0.005 and p = 0.025, respectively), while PP did not differ significantly from the integrated systems (p > 0.96). No significant differences in SOC were detected among treatments at deeper layers (p > 0.05). For MWD, integrated systems (CL-C and CL-L) and PP had significantly greater aggregate stability than CT and NT at all depths (p < 0.001), while CT and NT did not differ from each other at the 0–0.05 m layer.

3.10. Principal Component Analysis of SIR and Soil Properties

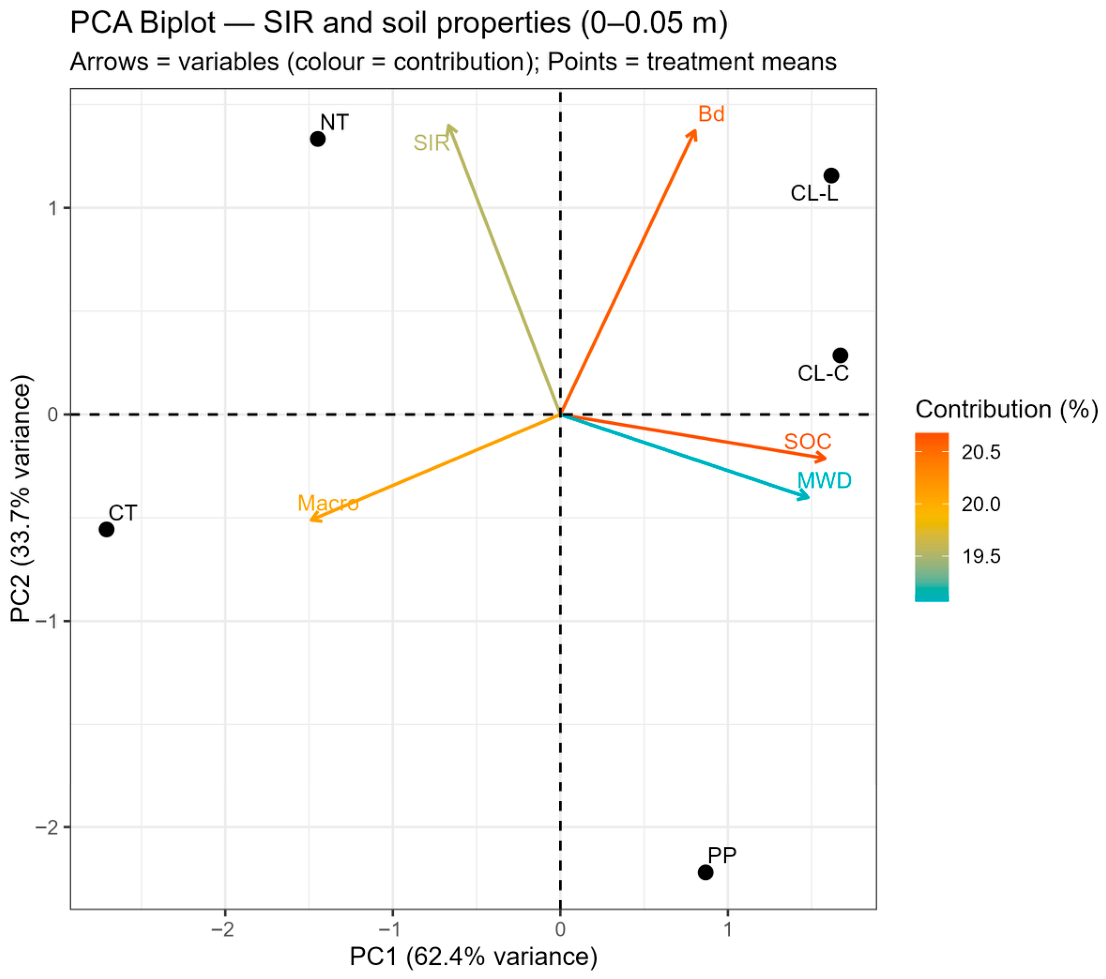
The PCA integrating SIR and four soil properties (SOC, Bd, macroporosity, and MWD) at the 0–0.05 m depth explained 96.1% of total variance in the first two components: PC1 accounted for 62.4% and PC2 for 33.7% of total variance (Figure 3 and Figure S3, Supplementary Materials). PC1 was dominated by SOC (31.3%), macroporosity (27.7%), and MWD (27.4%), forming a soil quality gradient that separated integrated systems (positive PC1: CL-L = 1.618; CL-C = 1.671) from CT (strongly negative PC1 = −2.708). PC2 was dominated by SIR (45.4%) and Bd (43.8%), forming an infiltration–compaction axis independent of PC1. SOC showed the highest quality of representation on PC1 (cos2 = 0.976), while SIR (cos2 = 0.765) and Bd (cos2 = 0.738) were well represented on PC2, confirming adequate variable representation in the two-component space.
CL-L and CL-C scored positively on both PC1 and PC2, reflecting simultaneously high soil quality and high SIR. NT scored positively on PC2 (PC2 = 1.333, high SIR = 54.32 mm h−1) but negatively on PC1 (PC1 = −1.448), reflecting lower SOC and aggregate stability relative to integrated systems. CT scored the most MWD negatively on PC1 (PC1 = −2.708), indicating the lowest SOC and MWD among all treatments, while its intermediate PC2 score (−0.556) reflects moderate infiltration despite a higher bulk density zone at 0.10–0.20 m. PP occupied an anomalous position in the biplot—moderately positive on PC1 (0.867), consistent with its relatively high surface SOC (2.42%) and aggregate stability comparable to integrated systems [74,75], but strongly negative on PC2 (−2.219, SIR = 26.40 mm h−1). This decoupling between soil quality indicators and SIR under PP are not attributable to trampling-induced compaction, as PP bulk density at 0–0.05 m was similar to that of integrated systems. Rather, it suggests that surface-layer impedance—potentially associated with the transient hydrophobicity of senescent Urochloa decumbens litter [71] and lateral routing of water through the dense fibrous root mat [72,73]—restricted vertical water entry independently of the bulk soil physical properties captured by PC1 (Figure 3).

3.11. Soil Organic Carbon Stocks (0–0.40 m)

Total SOC stocks in the 0–0.40 m profile differed significantly among treatments (one-way ANOVA: F4,20 = 5.33, p = 0.004; Table 5). CL-L accumulated the highest total stock (92.7 ± 3.68 Mg C ha−1), followed by CL-C (88.1 ± 1.95 Mg C ha−1), NT (84.1 ± 2.28 Mg C ha−1), and CT (79.0 ± 3.56 Mg C ha−1). PP presented the lowest total stock (73.5 ± 4.20 Mg C ha−1). Tukey’s HSD indicated that CL-L and CL-C were significantly superior to PP (group a vs. group b, p < 0.05), while NT and CT occupied intermediate positions (group ab). The Kruskal–Wallis test confirmed the treatment effect (χ2 = 13.57, df = 4, p = 0.009), with Dunn’s post hoc test with Bonferroni correction further resolving the grouping: CL-L > CL-C > NT > CT > PP (Table 5).
The LMM for SOC stocks per depth layer confirmed the highly significant effects of treatment (F4,100 = 9.56, p < 0.001), depth (F3,100 = 360.30, p < 0.001), and the Treatment × Depth interaction (F12,100 = 5.74, p < 0.001). The 0.20–0.40 m layer was the dominant contributor to total stocks across all treatments, accounting for approximately 50% of the total profile stock, and showed the most pronounced treatment differences. At this depth, CL-L (38.66 ± 1.91 Mg C ha−1), CL-C (38.07 ± 1.50 Mg C ha−1), NT (38.89 ± 1.75 Mg C ha−1), and CT (34.33 ± 2.65 Mg C ha−1) all stored significantly more carbon than PP (26.15 ± 3.01 Mg C ha−1; p < 0.001 in all pairwise comparisons). At 0.10–0.20 m depth, CL-L (25.21 ± 1.14 Mg C ha−1) stored significantly more carbon than NT (p = 0.048) and PP (p = 0.037). No significant differences were detected at the 0–0.05 m or 0.05–0.10 m layers.
The lower total SOC stock under PP requires careful interpretation as it reflects the combined effect of SOC concentration, bulk density, and layer thickness, all of which are incorporated into the volumetric stock calculation [52]. When SOC concentration alone is considered, the pattern is more coherent with field expectations: PP presented the highest surface SOC concentration (2.42% at 0–0.05 m) and comparable values to integrated systems at 0.05–0.10 m (1.98%), consistent with the long-term input of organic matter from dense grass roots and surface litter (Table 6). The divergence between PP and integrated systems becomes evident only at 0.20–0.40 m, where PP showed both the lowest SOC concentration (1.14%) and the lowest bulk density (Bd = 1.1482 Mg m−3) of all treatments. As this layer contributes approximately 50% of the total profile stock, even modest reductions in Bd substantially attenuate the calculated stock, meaning that part of the apparent stock deficit in PP at depth is a mathematical consequence of lower bulk density rather than a biological reduction in carbon content per unit volume of soil.
Integrated crop–livestock systems, by contrast, maintained higher SOC concentrations at depth (CL-L: 1.50%; CL-C: 1.42% at 0.20–0.40 m) combined with intermediate bulk density values (1.29–1.34 Mg m−3), resulting in the highest calculated stocks in the deepest layer. These results highlight that the volumetric stock method is sensitive to bulk density variation, particularly in the deepest and heaviest-weighted layer, and that stock comparisons among treatments with contrasting Bd values at depth should be interpreted alongside SOC concentration data to avoid misleading conclusions about carbon accumulation capacity [52] (Figure S4, Supplementary Materials).

4. Discussion

4.1. PP Infiltration Deficit: Surface-Layer Impedance

The significantly lower steady-state infiltration rate (SIR) observed under permanent pasture (PP; 26.40 ± 5.44 mm h−1) compared to all other management systems (NT: 54.32, CT: 51.18, CL-L: 50.74, CL-C: 45.11 mm h−1; Tukey’s HSD, p < 0.01) represents the most striking finding of this study, particularly because the PP treatment is a well-managed rotational grazing system with continuous vegetation cover and regulated stocking rate. This is consistent with [35], whose comprehensive review of pasture management systems in Brazil demonstrates that well-managed rotational grazing maintains soil physical quality—including bulk density and aggregate stability—at levels comparable to integrated systems, with soil degradation occurring primarily under poorly managed or overgrazed conditions. Bulk density and macroporosity values at 0–0.05 m under PP were similar to those of the integrated systems (Bd = 1.23 Mg m−3), indicating that the low SIR cannot be attributed to soil structural degradation or the compaction of the mineral profile induced by trampling [74,75]. This interpretation is further supported by the PCA, which places PP in a position of high soil quality on PC1 (high SOC = 2.42%, high aggregate stability: MWD = 4.23 mm at 0–0.05 m) while simultaneously scoring strongly negative on PC2, the infiltration–bulk density axis. The decoupling of infiltration from mineral soil structure in PP suggests that the primary hydraulic limitation operates at or above the soil surface rather than within the profile.
Above-ground dry biomass differed significantly among treatments at the time of measurement (CT: 8.43 Mg ha−1; NT: 11.48 Mg ha−1; CL-L: 14.95 Mg ha−1; CL-C: 12.08 Mg ha−1; PP: 3.90 Mg ha−1), with PP presenting the lowest value, less than half that of CT and approximately one quarter of CL-L. The markedly reduced surface biomass under PP is consistent with grazing at the time of measurement and indicates sparse surface cover at the soil–atmosphere interface. Low surface biomass reduces the canopy’s capacity to intercept and dissipate raindrop kinetic energy, promoting surface sealing and aggregate disruption that restrict infiltration independently of bulk soil physical properties [6]. This finding reinforces the surface-layer impedance interpretation for PP: the combination of sparse above-ground biomass (3.90 Mg ha−1), the potential for transient hydrophobicity in senescent Urochloa litter [71], and possible lateral routing through the dense fibrous root mat [72,73] are proposed as candidate mechanisms contributing to the low SIR under PP. However, as ground cover percentage, litter water repellence, and lateral flow paths were not directly measured in this study, this interpretation remains a working hypothesis that requires targeted experimental validation, through contact angle measurements on field-collected litter, paired large-plot and small-plot infiltration comparisons, or dye tracer experiments to visualize flow paths under the grass mat, for example.

4.2. The CT–NT Paradox

A notable result of this study is that CT, despite exhibiting a lower bulk density (Bd = 1.22 Mg m−3) and higher macroporosity (19.6%) at 0–0.05 m than all other treatments, did not achieve the highest SIR; instead, the highest SIR was observed under NT (54.32 vs. 51.18 mm h−1). The PCA provides a mechanistic framework for this apparent paradox. PC2, which explained 33.7% of the total variance and was dominated by SIR (45.4%) and bulk density (Bd; 43.8%), represented a hydraulic continuity axis independent of the soil-quality gradient captured by PC1 (SOC, macroporosity, aggregate stability). CT scored strongly negative on PC1 (lowest SOC and aggregation among all treatments) but intermediately on PC2, whereas NT scored positively on PC2 despite intermediate PC1 scores. This pattern indicates that NT benefits from an uninterrupted soil profile, which facilitates vertical water movement under prolonged simulated rainfall [5,11]. Under the 60 min rainfall simulation, the wetting front is likely to reach the 0.10–0.20 m layer, where bulk density under CT (1.38 Mg m−3) slightly exceeds that under NT (1.35 Mg m−3), creating a hydraulic resistance zone resulting from periodic tillage-induced reconsolidation that limits infiltration at steady state independently of favourable surface properties [50,76]. This finding underscores how surface soil characterization alone is insufficient to predict steady-state infiltration under prolonged rainfall, and that profile-scale hydraulic continuity is the governing factor [2,10].

4.3. Integrated Crop–Livestock Systems and the Decoupling of SOC and SIR

The negative Spearman correlation between treatment mean surface SOC and SIR (ρ = −0.60, p = 0.285) and the non-significant linear regression (β = −18.50, R2 = 0.263, p = 0.377) might appear to contradict the widely documented positive role of organic matter in improving soil hydraulic properties [10,11,70]. However, this pattern was largely driven by the anomalous position of PP in the bivariate space: PP combines the highest surface SOC concentration (2.42 ± 0.69%) with the lowest SIR (26.40 mm h−1), while CT and NT have lower surface SOC (1.85–1.96%) but markedly higher SIR (51–54 mm h−1). When PP is recognized as a system in which surface-layer impedance—rather than mineral soil degradation—limits water entry, the remaining four treatments follow the expected positive relationship between SOC and SIR. This result highlights a critical conceptual distinction: the positive effect of SOC on infiltration operates through its role in promoting aggregate stability, macroporosity, and biopore formation [70], but these mechanisms are effectively bypassed when a physically distinct surface layer restricts water entry before it can interact with the mineral soil. The Spearman correlation matrix supports this interpretation: SOC was positively correlated with MWD (ρ = 0.80, p = 0.133), consistent with its role in aggregate formation, yet SIR was negatively correlated with SOC (ρ = −0.60, p = 0.350), driven mainly by PP’s position as a high-SOC, low-SIR outlier.

4.4. Aggregate Stability and Depth-Dependent Responses

The significant Treatment × Depth interaction for mean weight diameter (MWD; F12,76 = 14.22, p < 0.001) indicates that the effect of management system on aggregate stability was not uniform across the soil profile. At the 0–0.05 m depth, integrated systems (CL-C and CL-L) and PP showed significantly greater MWD than CT and NT (p < 0.001), reflecting the combined effects of permanent or semi-permanent soil cover, root turnover, and continuous organic matter inputs on near-surface aggregate formation [70]. At the 0.05–0.10 m depth, CL-C showed significantly higher MWD than PP (p = 0.043), suggesting that the alternation between crop and pasture phases in integrated systems promotes aggregate stability at intermediate depths through a combination of deep root activity and organic matter redistribution, a dynamic absent in the monospecific grass sward of PP [77,78]. These findings are consistent with [33], which reported significantly greater water-stable aggregate stability under integrated livestock–forest systems compared to degraded pastures and conventional tillage in the Brazilian semi-arid Caatinga biome, confirming that the positive effect of integrated systems on near-surface aggregate formation is not restricted to the Cerrado biome context but extends across contrasting Brazilian biomes and soil types. The absence of significant differences between CT and NT at the surface for aggregate stability, despite their contrasting tillage histories, suggests that 20 years of surface residue accumulation under NT has not yet fully compensated for the legacy effects of tillage on aggregate formation at this site [29,41]. Notably, MWD were perfectly correlated across all treatments and depths (Spearman ρ = 1.00, p = 0.017); accordingly, only MWD is reported here to avoid redundancy in the presentation and subsequent multivariate analyses [79].

4.5. SOC Concentration, Stocks, and the Role of Bulk Density in Stock Calculations

When management effects on soil organic carbon are considered in terms of SOC concentration by depth layer—the most direct measurement—a clear pattern emerges that is consistent with field observations: PP presented the highest surface SOC concentration (2.42 ± 0.69% at 0–0.05 m), not significantly different from the integrated systems (CL-C: 2.53%, CL-L: 2.45%, p > 0.96), while CT and NT showed substantially lower surface SOC (1.85–1.96%), reflecting the positive effect of permanent grass cover on near-surface organic matter accumulation [70,80]. Castro et al. [35] corroborate this finding at the national scale, reporting that well-managed pastures consistently present higher near-surface SOC concentrations than cropping systems across diverse Brazilian regions, while integrated systems combining crop and livestock phases tend to promote more uniform carbon distribution throughout the soil profile. At deeper layers (0.10–0.20 m and 0.20–0.40 m), integrated systems maintained higher SOC concentrations (CL-L: 1.88% and 1.50%; CL-C: 1.54% and 1.42%) than PP (1.68% and 1.14%), consistent with the contribution of deeper and more diverse root systems in crop–livestock rotations to organic matter inputs at depth [21,23,72,81]. These concentration data confirm the field observation that permanent grass cover promotes surface carbon accumulation, while integrated systems promote carbon distribution throughout the profile over the 20-year experiment.
SOC stocks—expressed as carbon mass per unit land area (Mg C ha−1)—are calculated as the product of SOC concentration, bulk density (Bd), and layer thickness: stock = (C% ÷ 100) × Bd (Mg m−3) × depth (m) × 10,000. It is therefore essential to interpret stock differences in conjunction with the underlying Bd values, as any treatment difference in Bd will amplify, attenuate, or potentially reverse apparent differences in carbon accumulation per unit area [52]. In the present study, PP exhibited notably lower bulk density at 0.20–0.40 m (Bd = 1.148 Mg m−3) than the integrated systems (CL-L: 1.292, CL-C: 1.340 Mg m−3), NT (1.360 Mg m−3), and CT (1.277 Mg m−3). This lower Bd in PP at depth—likely reflecting the influence of a dense fine-root system on soil porosity and structure—arithmetically attenuates the calculated PP stock in this layer relative to what would be obtained if Bd were equal across treatments. The stock difference between PP and integrated systems at 0.20–0.40 m is therefore driven by the combination of genuinely lower C% in PP (1.14% vs. 1.42–1.50% in integrated systems) and the compensating effect of lower Bd, which partially offsets the carbon concentration deficit in the stock calculation. Had PP exhibited Bd values similar to those of integrated systems at this depth, its stock disadvantage would have been even more pronounced. The 0.20–0.40 m layer contributes approximately 50% of the total 0–0.40 m stock, and given its distance from the primary zone of surface management influence and the inherently greater variability in both C% and Bd at this depth, its contribution to total stock comparisons should be interpreted with appropriate caution [52].
When total SOC stocks across the 0–0.40 m profile are compared, CL-L (92.7 ± 3.68 Mg C ha−1) and CL-C (88.1 ± 1.95 Mg C ha−1) accumulated significantly greater carbon per unit area than PP (73.5 ± 4.20 Mg C ha−1; Tukey’s HSD, p < 0.05; ANOVA: F4,20 = 5.33, p = 0.004), while NT (84.1 Mg C ha−1) and CT (79.0 Mg C ha−1) were intermediate. The stock advantage of integrated systems over PP stems primarily from their higher SOC concentrations at the 0.10–0.20 m and 0.20–0.40 m layers, combined with intermediate to higher Bd values in the subsoil, which translate those concentrations into greater carbon mass per unit area. If the lower Bd under PP at 0.20–0.40 m reflects a genuine management-induced difference in soil structure rather than natural pedological variability at this depth, the calculated stock disadvantage of PP relative to integrated systems would be partially attenuated by the bulk density effect. The difference in carbon concentration per unit volume would be the more appropriate comparison metric. However, attributing the Bd difference at 0.20–0.40 m to management effects with confidence requires caution [52,82] given the inherently greater spatial variability of both Bd and SOC at this depth and its distance from the primary zone of surface management influence.

4.6. PCA: Structure, Variable Selection, and the SIR–Soil Quality Decoupling

The PCA explained 96.1% of the total variance across the five management systems, with two components: PC1 = 62.4% and PC2 = 33.7%. PC1 captured a soil quality gradient dominated by SOC (31.3%), MWD (27.4%), and macroporosity (27.7%), along which CT scored most negatively (PC1 = −2.708) and CL-L and CL-C most positively (PC1 = 1.618 and 1.671, respectively). Bd loaded positively on PC1 alongside SOC and MWD, which may appear counterintuitive given the classical negative relationship between bulk density and organic matter; however, in this dataset CT—the treatment with the lowest SOC and aggregation—also presented the lowest surface Bd (1.22 Mg m−3) due to mechanical loosening by tillage, while integrated systems maintained intermediate Bd values (1.30–1.34 Mg m−3) alongside higher SOC and aggregate stability. This loading pattern, therefore, reflects the management context of this specific experiment rather than a general positive relationship between Bd and soil organic matter and reinforces the importance of not interpreting Bd in isolation from the tillage history of each treatment. Macroporosity loaded in the opposite direction to Bd and SOC on PC1, consistent with the mechanical origin of CT’s high surface macroporosity through tillage rather than through biological structuring. PC2 was dominated by SIR (45.4%) and Bd (43.8%), largely orthogonal to the soil quality gradient defined by PC1, indicating that surface infiltration performance is governed by distinct processes from those controlling SOC accumulation and aggregate stability in the mineral soil. This two-component structure—a soil quality axis (PC1) independent of a hydraulic axis (PC2)—was achieved with a parsimonious variable set (SOC, MWD, macroporosity, SIR, and Bd) free of the redundancies present in the full variable set (SOC, MWD near-perfect collinearity; macroporosity–microporosity–total porosity interdependence), and is therefore directly interpretable without confounders from collinear variables [79].
The most scientifically informative pattern in the biplot is the anomalous position of PP: it scored moderately positively on PC1 (PC1 = 0.867, reflecting high surface SOC and aggregate stability comparable to integrated systems) but strongly negatively on PC2 (PC2 = −2.219, SIR = 26.40 mm h−1). All other treatments showed a broadly positive association between the two axes: higher soil quality corresponded to higher or moderate SIR. The PP anomaly demonstrates that, in this well-managed pasture system, the mineral soil structural quality captured by PC1 is not translated into infiltration performance, because the hydraulic bottleneck operates at the surface cover layer rather than within the mineral soil. This is consistent with PP’s markedly low above-ground biomass (3.90 Mg ha−1) relative to all other treatments, which indicates sparse surface cover at the time of measurement and supports the surface-layer impedance mechanism discussed in Section 4.1. NT, by contrast, scored positively on PC2 (PC2 = 1.333) despite moderate PC1 scores (PC1 = −1.448), reflecting the capacity of diverse crop residues under no-tillage to promote rapid vertical water entry independently of the longer-term soil quality gradient. This multivariate evidence strengthens the interpretation that PP’s low SIR reflects surface impedance—consistent with sparse biomass cover, potential litter hydrophobicity [71], and lateral root mat routing [72,73]—rather than bulk soil degradation, and identifies PP as an ecologically important outlier in the SOC–SIR relationship for this experimental system.

4.7. Horton Model Performance and the Temporal Dynamics of Infiltration

Horton’s model provided excellent fits to the observed infiltration rate data for all treatments (R2 = 0.920–0.987), validating its use for parameterizing and comparing infiltration dynamics under standardized simulated rainfall at this site [6,7,8]. The highest RMSE was observed for PP (1.848 mm h−1) and CL-C (1.020 mm h−1), while NT showed the lowest temporal variability (RMSE = 0.163 mm h−1). The elevated RMSE for PP likely reflects the heterogeneous and temporally variable nature of surface impedance associated with the grass litter mat, whose hydraulic resistance may shift during a rainfall event as the mat becomes progressively wetted and swells, temporarily altering its permeability [71]. This contrasts with the near-perfect fit for NT (R2 = 0.980), where the smooth monotonic decline from f0 to fc expected by Horton’s model is consistent with a structurally continuous mineral soil profile controlling infiltration throughout the event. The Green–Ampt and Philip models, which parameterize infiltration in terms of soil hydraulic conductivity and matric potential, would require saturated hydraulic conductivity at multiple depths and initial moisture content data not collected in this study; however, their application in future work would allow the separation of surface and subsurface hydraulic controls, which is particularly relevant for the PP treatment [2].
Furthermore, ref. [58] emphasized that the systematic validation of rainfall simulator output against natural rainfall characteristics—including kinetic energy, drop size distribution, and spatial uniformity—is a prerequisite for the generalizability of infiltration findings from simulated rainfall experiments. The InfiAsper meets these validation criteria in the present study (kinetic energy ratio = 96.6%; Christiansen’s Uc > 0.80 [42,53,54]), which supports confidence in the comparability of our SIR values with those obtained under natural rainfall. Future work should nevertheless test additional rainfall intensities and durations representative of Cerrado convective events to extend the applicability of these findings fully.

4.8. Soil Texture and the Context of a High-Clay Ferralsol

All five management systems were established on the same high-clay Ferralsol (clay content ~590–660 g kg−1), as confirmed by texture analyses that showed no significant differences among treatments (p > 0.05). The uniformity of texture across plots is essential for attributing observed differences in SIR, aggregate stability, and SOC stocks to management rather than pedological variability. In Ferralsols, the microaggregated structure formed by the association of kaolinite clay minerals with iron and aluminium oxides confers inherent aggregate stability, moderating the sensitivity of macroporosity to tillage-induced disturbance [66,83]. This may partly explain why CT maintained macroporosity and aggregate stability values closer to those of NT than might be expected in less structured soils, despite periodic tillage. The significant treatment effects observed for SIR, MWD, SOC concentration, and carbon stocks across all depths nonetheless confirm that management practices exerted substantial effects on soil physical properties beyond the baseline stabilization provided by the Ferralsol mineralogy [5,29,41].

4.9. Long-Term Carbon Accumulation and Implications for Sustainable Management

The 20-year duration of this experiment provides a robust basis for evaluating the long-term trajectory of soil physical quality and carbon accumulation under contrasting management systems in the Brazilian Cerrado. Across the three dimensions assessed—SIR, aggregate stability, and profile-level SOC—the integrated crop–livestock systems (CL-L and CL-C) consistently outperformed conventional tillage and, at the profile level, accumulated more carbon per unit area than well-managed permanent pasture. The key agronomic finding on SOC is that integrated systems maintain both high surface C% (comparable to PP) and substantially higher C% at depth (0.10–0.40 m), resulting in higher total carbon per hectare. It is important to emphasize that these differences in carbon accumulation per unit land area result from the combination of C concentration and bulk density effects at each depth layer, and that the primary management-driven difference is the depth distribution of C%, not a difference in bulk density per se.
The significantly higher total carbon stocks under CL-L (92.7 Mg C ha−1) and CL-C (88.1 Mg C ha−1) than under PP (73.5 Mg C ha−1; F4,20 = 5.33, p = 0.004) represent a difference in carbon accumulation per unit land area of 19–26% over two decades, consistent with reported rates of soil organic carbon gain under integrated systems in tropical regions [78,84,85]. When expressed as a mean annual difference relative to PP over the 20 years, this corresponds to approximately 0.95–1.15 Mg C ha−1 yr−1. This figure should be interpreted with considerable caution: it is derived from a single time-point stock measurement, assumes linear carbon accumulation over 20 years, and does not account for the absence of a pre-treatment baseline measurement. It is therefore more appropriately described as a long-term stock difference per year of experiment duration than as a carbon sequestration rate in the biogeochemical sense. The combination of higher SIR, greater aggregate stability throughout the profile, and deeper carbon accumulation under integrated systems suggests improved water regulation, reduced surface runoff, and greater erosion resistance at the landscape scale, with direct implications for water resource management and agricultural sustainability in a region increasingly exposed to extreme rainfall events [5,25,86]. These results support the role of integrated crop–livestock systems as a dual-benefit conservation strategy for the Brazilian Cerrado: improving soil physical function while accumulating substantially more carbon per hectare than either continuous pasture or conventional tillage over a 20-year horizon.

4.10. Limitations and Future Research Directions

Several limitations of this study should be acknowledged. First, surface cover variables—particularly percentage ground cover at the time of measurement—were not recorded, limiting the ability to test the surface impedance hypothesis for PP quantitatively; their inclusion as covariates would substantially strengthen the mechanistic interpretation of SIR differences. Second, the rainfall simulation was conducted at a single intensity (60 mm h−1), which prevents extrapolation to high-intensity convective events (>80–100 mm h−1) that are common in the Cerrado wet season and are likely to induce surface sealing under some management systems. Third, comparing CL-C (crop phase) and CL-L (livestock phase) at a single point in time conflates management system effects with rotation-phase effects; measurements repeated across full rotation cycles would allow these to be disentangled. Fourth, the 0.20–0.40 m layer, which accounts for approximately 50% of total profile stock, showed the largest treatment differences in SOC concentration and stock, yet is the layer most distant from the primary zone of management influence; attributing these large differences to management with confidence would require isotopic or radiocarbon-based attribution. Finally, the absence of a native Cerrado reference plot prevents the direct assessment of soil recovery relative to the undisturbed system baseline; future experiments in this network should incorporate a paired native vegetation reference.

5. Conclusions

This study evaluated the long-term (20-year) effects of five contrasting agricultural management systems (AMS) on the physical properties and water infiltration of a Ferralsol in the Cerrado–Atlantic Forest transition area of Brazil. Simulated rainfall was applied at a constant intensity of 60 mm h−1 using the InfiAsper portable infiltrometer/rainfall simulator across five treatments: no-tillage (NT), conventional tillage (CT), integrated crop–livestock systems in the crop phase (CL-C) and livestock phase (CL-L), and permanent pasture (PP).
The main findings of this study are as follows:
(i)
Integrated crop–livestock systems (CL-C and CL-L) showed the best topsoil physical condition, with higher SOC, aggregate stability, and macroporosity than NT and CT, and steady-state infiltration rates 59% higher than permanent pasture.
(ii)
The low SIR under PP was not attributable to bulk soil compaction—surface bulk density was similar to integrated systems—but was consistent with a hypothesized surface-layer impedance mechanism associated with sparse senescent Urochloa litter and lateral routing through the fibrous root mat.
(iii)
Despite lower surface bulk density and higher macroporosity, CT achieved lower SIR than NT, explained by a subsurface zone of higher bulk density at 0.10–0.20 m that acted as a hydraulic bottleneck under prolonged rainfall, a profile-scale control independent of surface soil quality.
(iv)
Permanent grass cover—whether under PP or integrated systems—promoted the highest near-surface SOC concentrations. Integrated systems additionally maintained higher SOC at depth, resulting in significantly greater total profile stocks (CL-L: 92.7; CL-C: 88.1 vs. PP: 73.5 Mg C ha−1; p = 0.004). Stock comparisons should be interpreted alongside bulk density data, as the lower subsoil Bd under PP partially attenuates its calculated stock.
(v)
Horton’s model provided excellent fits across all treatments (R2 = 0.920–0.987), confirming its suitability for comparative infiltration studies under simulated rainfall in Ferralsols.
These findings demonstrate that integrated crop–livestock systems are a viable conservation-oriented strategy for simultaneously improving soil physical condition, water infiltration, and carbon accumulation per unit land area in the Ferralsols of the Brazilian Cerrado and Atlantic Forest biomes. Adoption of these systems by farmers and support from policymakers for their spatial planning and incentives represent promising pathways for sustainable agricultural intensification in these globally significant regions.

Supplementary Materials

The following supporting information can be downloaded at: https://www.mdpi.com/article/10.3390/soilsystems10060063/s1, Figure S1: Statistical power curve; Figure S2: Scatter plot: SOC vs. SIR; Figure S3: PCA scree plot; Table S1: Spearman Correlation Matrix; Figure S4.1: Soil organic carbon (SOC) stocks by depth per treatment; Figure S4.2: Soil organic carbon (SOC) stocks by depth layer and treatment.

Author Contributions

Conceptualization, E.P., J.C.S. and W.S.d.A.; methodology, E.P., J.C.S., D.S.P. and W.S.d.A.; software, E.P., D.S.P. and W.S.d.A.; validation, E.P., D.S.P. and W.S.d.A.; formal analysis, E.P., D.S.P., R.d.S.M., W.C.V. and S.A.R.; investigation, E.P., D.S.P., R.d.S.M., W.C.V., S.A.R. and J.C.S.; resources, E.P. and J.C.S.; data curation, E.P., D.S.P. and W.S.d.A.; writing—original draft preparation, E.P., D.S.P. and W.S.d.A.; writing—review and editing, E.P., D.S.P., R.d.S.M., W.C.V., S.A.R., J.C.S. and W.S.d.A.; visualization, D.S.P. and W.S.d.A.; supervision, E.P., J.C.S. and W.S.d.A.; project administration, E.P.; funding acquisition, E.P. All authors have read and agreed to the published version of the manuscript.

Funding

This research received partial financial support from the first author.

Institutional Review Board Statement

Not applicable.

Informed Consent Statement

Not applicable.

Data Availability Statement

The research data will be available upon request.

Acknowledgments

The authors thank the Brazilian funding agencies, the National Council for Scientific and Technological Development (Conselho Nacional de Desenvolvimento Científico e Tecnológico—CNPq) and the Federal Agency for the Support and Evaluation of Graduate Education (Coordenação de Aperfeiçoamento de Pessoal de Nível Superior—CAPES) (Finance Code 001), whose partial financial support made the conduct of this study possible. We are also grateful to the three anonymous reviewers and the editorial committee for their suggestions, which significantly improved the paper’s quality. During the preparation of this manuscript/study, the authors used Claude.ai (https://claude.ai/) to improve the development of R scripts for the statistical analysis of data and the graphical design of all Figures. The authors reviewed and edited all outputs and take full responsibility for the content of this publication.

Conflicts of Interest

The Author Júlio César Salton, is employed by the Brazilian Agricultural Research Corporation (Empresa Brasileira de Pesquisa Agropecuária—Embrapa). The remaining authors declare that the research was conducted in the absence of any commercial or financial relationships that could be construed as potential conflicts of interest. The funders had no role in the design of the study, in the collection, analysis, or interpretation of data, in the writing of the manuscript, or in the decision to publish the results.

References

  1. Villela, J.M.; Damian, J.M.; Gonçalves, D.R.P.; Barioni, L.G.; Cherubin, M.R.; Cerri, C.E.P. Soil Carbon Debt from Land Use Change in Brazil. Nat. Commun. 2026, 17, 1626. [Google Scholar] [CrossRef] [PubMed]
  2. Assouline, S. Infiltration into Soils: Conceptual Approaches and Solutions. Water Resour. Res. 2013, 49, 1755–1772. [Google Scholar] [CrossRef]
  3. Yang, M.; Zhang, Y.; Pan, X. Improving the Horton Infiltration Equation by Considering Soil Moisture Variation. J. Hydrol. 2020, 586, 124864. [Google Scholar] [CrossRef]
  4. Atta-Darkwa, T.; Asare, A.; Amponsah, W.; Oppong, E.D.; Agbeshie, A.A.; Budu, M.; Larbi, I.; Akolgo, G.A.; Quaye, D.N.D. Performance Evaluation of Infiltration Models under Different Tillage Operations in a Tropical Climate. Sci. Afr. 2022, 17, e01318. [Google Scholar] [CrossRef]
  5. Sone, J.S.; Sanches De Oliveira, P.T.; Pereira Zamboni, P.A.; Motta Vieira, N.O.; Altrão Carvalho, G.; Motta Macedo, M.C.; Romeiro De Araujo, A.; Baptaglin Montagner, D.; Alves Sobrinho, T. Effects of Long-Term Crop-Livestock-Forestry Systems on Soil Erosion and Water Infiltration in a Brazilian Cerrado Site. Sustainability 2019, 11, 5339. [Google Scholar] [CrossRef]
  6. Almeida, W.S.; Panachuki, E.; de Oliveira, P.T.S.; da Silva Menezes, R.; Sobrinho, T.A.; de Carvalho, D.F. Effect of Soil Tillage and Vegetal Cover on Soil Water Infiltration. Soil Tillage Res. 2018, 175, 130–138. [Google Scholar] [CrossRef]
  7. Horton, R.E. The Role of Infiltration in the Hydrological Cycle. Eos Trans. Am. Geophys. Union 1933, 14, 446–460. [Google Scholar] [CrossRef]
  8. Horton, R.E. Analysis of Runoff Plot Experiments with Varying Infiltration Capacity. Eos Trans. Am. Geophys. Union 1939, 20, 693–711. [Google Scholar] [CrossRef]
  9. Brutsaert, W. Hydrology: An Introduction; Cambridge University Press: Cambridge, UK, 2005. [Google Scholar]
  10. Bagnall, D.K.; Morgan, C.L.S.; Cope, M.; Bean, G.M.; Cappellazzi, S.B.; Greub, K.L.H.; Liptzin, D.; Norris, C.L.; Rieke, E.; Tracy, P.W.; et al. Carbon-Sensitive Pedotransfer Functions for Plant Available Water. Soil Sci. Soc. Am. J. 2022, 86, 612–629. [Google Scholar] [CrossRef]
  11. Basset, C.; Abou Najm, M.; Ghezzehei, T.; Hao, X.; Daccache, A. How Does Soil Structure Affect Water Infiltration? A Meta-Data Systematic Review. Soil Tillage Res. 2023, 226, 105577. [Google Scholar] [CrossRef]
  12. Olsson, L.; Barbosa, H.; Bhadwal, S.; Cowie, A.; Delusca, K.; Flores-Renteria, D.; Hermans, K.; Jobbagy, E.; Kurz, W.; Li, D.; et al. Land Degradation. In Climate Change and Land: An IPCC Special Report on Climate Change, Desertification, Land Degradation, Sustainable Land Management, Food Security, and Greenhouse Gas Fluxes in Terrestrial Ecosystems; Cambridge University Press: Cambridge, UK, 2022; pp. 345–436. [Google Scholar] [CrossRef]
  13. Eekhout, J.P.C.; de Vente, J. Global Impact of Climate Change on Soil Erosion and Potential for Adaptation through Soil Conservation. Earth-Sci. Rev. 2022, 226, 103921. [Google Scholar] [CrossRef]
  14. Mihretie, F.A.; Tsunekawa, A.; Haregeweyn, N.; Adgo, E.; Tsubo, M.; Ebabu, K.; Masunaga, T.; Kebede, B.; Meshesha, D.T.; Tsuji, W.; et al. Tillage and Crop Management Impacts on Soil Loss and Crop Yields in Northwestern Ethiopia. Int. Soil Water Conserv. Res. 2022, 10, 75–85. [Google Scholar] [CrossRef]
  15. Borrelli, P.; Panagos, P.; Alewell, C.; Ballabio, C.; Fagundes, H.O.; Haregeweyn, N.; Lugato, E.; Maerker, M.; Poesen, J.; Vanmaercke, M.; et al. Policy implications of multiple concurrent soil erosion processes in European farmland. Nat. Sustain. 2023, 6, 103–112. [Google Scholar] [CrossRef]
  16. Montanarella, L.; Pennock, D.J.; McKenzie, N.; Badraoui, M.; Chude, V.; Baptista, I.; Mamo, T.; Yemefack, M.; Aulakh, M.S.; Yagi, K.; et al. World’s Soils Are under Threat. Soil 2016, 2, 79–82. [Google Scholar] [CrossRef]
  17. Borrelli, P.; Robinson, D.A.; Fleischer, L.R.; Lugato, E.; Ballabio, C.; Alewell, C.; Meusburger, K.; Modugno, S.; Schütt, B.; Ferro, V.; et al. An Assessment of the Global Impact of 21st Century Land Use Change on Soil Erosion. Nat. Commun. 2017, 8, 2013. [Google Scholar] [CrossRef]
  18. Borrelli, P.; Robinson, D.A.; Panagos, P.; Lugato, E.; Yang, J.E.; Alewell, C.; Wuepper, D.; Montanarella, L.; Ballabio, C. Land Use and Climate Change Impacts on Global Soil Erosion by Water (2015–2070). Proc. Natl. Acad. Sci. USA 2020, 117, 21994–22001. [Google Scholar] [CrossRef]
  19. Borrelli, P.; Alewell, C.; Alvarez, P.; Anache, J.A.A.; Baartman, J.; Ballabio, C.; Bezak, N.; Biddoccu, M.; Cerdà, A.; Chalise, D.; et al. Soil Erosion Modelling: A Global Review and Statistical Analysis. Sci. Total Environ. 2021, 780, 146494. [Google Scholar] [CrossRef] [PubMed]
  20. Ebabu, K.; Tsunekawa, A.; Haregeweyn, N.; Tsubo, M.; Adgo, E.; Fenta, A.A.; Meshesha, D.T.; Berihun, M.L.; Sultan, D.; Vanmaercke, M.; et al. Global analysis of cover management and support practice factors that control soil erosion and conservation. Int. Soil Water Conserv. Res. 2022, 10, 161–176. [Google Scholar] [CrossRef]
  21. de Oliveira, J.d.C.; de Freitas, I.C.; Duarte, A.C.S.; Moreira, J.G.F.; Couto, A.J.S.; Lessa, M.F.G.; Gontijo Neto, M.M.; Santos, M.V.; Cherubin, M.R.; Cerri, C.E.P.; et al. Fertility and Carbon Stocks in Oxisols under Urochloa Pastures and Eucalyptus-Based Agrosilvopastoral Systems Established in the Brazilian Cerrado. Soil Tillage Res. 2025, 253, 106663. [Google Scholar] [CrossRef]
  22. Colman, C.B.; Guerra, A.; Almagro, A.; De Oliveira Roque, F.; Rosa, I.M.D.; Fernandes, G.W.; Oliveira, P.T.S. Modeling the Brazilian Cerrado Land Use Change Highlights the Need to Account for Private Property Sizes for Biodiversity Conservation. Sci. Rep. 2024, 14, 4559. [Google Scholar] [CrossRef] [PubMed]
  23. dos Santos, C.C.; da Silva, T.S.; Cavalcante, M.; da Silva, R.G.; de Camargo, P.B.; Cherubin, M.R.; Cerri, C.E.P.; Maia, S.M.F. Changes in Carbon Stocks and Quality of the Soil Organic Matter under Different Arrangements of Integrated Livestock-Forest Systems in the Semi-Arid Region of Brazil. Soil Tillage Res. 2026, 256, 106882. [Google Scholar] [CrossRef]
  24. Alves, J.D.N.; Ribeiro, A.; Rody, Y.P.; Cardoso, L.A.S.; Reis, M.G.D.; Loos, R.A. Dynamics of Carbon, Water, and Energy Fluxes in Pasture and Eucalyptus Plantations in the Brazilian Cerrado. Agric. For. Meteorol. 2026, 383, 111152. [Google Scholar] [CrossRef]
  25. Schwamback, D.; Amorim Brandão, A.R.; Rosalem, L.M.P.; Oliveira, P.T.S.; Anache, J.A.A.; Wendland, E.; Berndtsson, R.; Persson, M. Land Use Transformations in the Brazilian Savanna: A Decade of Soil Erosion and Runoff Measurements. CATENA 2024, 246, 108412. [Google Scholar] [CrossRef]
  26. Dechen, S.C.F.; Telles, T.S.; Guimarães, M.d.F.; Maria, I.C.d. Losses and costs associated with water erosion according to soil cover rate. Bragantia 2015, 74, 224–233. [Google Scholar] [CrossRef]
  27. Franzluebbers, A.; Stuedemann, J. Soil Physical Responses to Cattle Grazing Cover Crops under Conventional and No Tillage in the Southern Piedmont USA. Soil Tillage Res. 2008, 100, 141–153. [Google Scholar] [CrossRef]
  28. Greenwood, K.L.; McKenzie, B.M. Grazing Effects on Soil Physical Properties and the Consequences for Pastures: A Review. Aust. J. Exp. Agric. 2001, 41, 1231–1250. [Google Scholar] [CrossRef]
  29. Pavei, D.S.; Panachuki, E.; Salton, J.C.; Sone, J.S.; Alves, T.; Valim, W.C.; Oliveira, P.T.S.D. Soil Physical Properties and Interrill Erosion in Agricultural Production Systems after 20 Years of Cultivation. Rev. Bras. Ciência Solo 2021, 45, e0210039. [Google Scholar] [CrossRef]
  30. de Paula, A.M.; de Siqueira, J.O.; Soares, C.R.F.S. Soil contamination with anthracene and creosote: Impact on plant growth and mycorrhizal colonization by Glomus etunicatum. Rev. Bras. Ciência Solo 2007, 31, 781–792. [Google Scholar] [CrossRef]
  31. Salton, J.C.; Mercante, F.M.; Tomazi, M.; Zanatta, J.A.; Concenço, G.; Silva, W.M.; Retore, M. Integrated Crop-Livestock System in Tropical Brazil: Toward a Sustainable Production System. Agric. Ecosyst. Environ. 2014, 190, 70–79. [Google Scholar] [CrossRef]
  32. Rieger, F.A.; Zolin, C.A.; Paulino, J.; Souza, A.P.D.; Matos, E.D.S.; Magalhães, C.A.D.S.; Farias Neto, A.L.D. Water Erosion on an Oxisol under Integrated Crop-Forest Systems in a Transitional Area between the Amazon and Cerrado Biomes. Rev. Bras. Ciênc. Solo 2016, 40. [Google Scholar] [CrossRef]
  33. De Lima, H.B.M.; Cavalcante, M.; Dos Santos, R.D.; Cherubin, M.R.; Cerri, C.E.P.; Maia, S.M.F. Soil Aggregate Stability Influenced by Different Integrated Livestock-Forest Systems, Pastures, and Tillage in the Brazilian Semi-Arid Areas. J. Arid Land 2026, 18, 477–500. [Google Scholar] [CrossRef]
  34. Abdalla, M.; Hastings, A.; Chadwick, D.R.; Jones, D.L.; Evans, C.D.; Jones, M.B.; Rees, R.M.; Smith, P. Critical Review of the Impacts of Grazing Intensity on Soil Organic Carbon Storage and Other Soil Quality Indicators in Extensively Managed Grasslands. Agric. Ecosyst. Environ. 2018, 253, 62–81. [Google Scholar] [CrossRef]
  35. Castro, J.I.A.; Bieluczyk, W.; Greschuck, L.T.; Souza, V.S.; Cerri, C.E.P.; Cherubin, M.R. Soil Health Assessments across Pasture Management Systems in Brazil: A Comprehensive Review. Soil Secur. 2026, 23, 100233. [Google Scholar] [CrossRef]
  36. Cherubin, M.R.; Pinheiro Junior, C.R.; Souza, L.F.N.; Canisares, L.P.; Ferreira, T.O.; Cerri, C.E.P.; Minasny, B.; Smith, P. Global Blind Spots in Soil Health Research Overlap with Environmental Vulnerability Hotspots. Commun. Earth Environ. 2025, 6, 651. [Google Scholar] [CrossRef]
  37. Cherubin, M.R.; Canisares, L.P.; Souza, L.N.; Pinheiro Junior, C.R.; Moraes, M.T.D.; Bertol, F.; Bortolo, L.; Menillo, R.B.; Cerri, C.E.P. Long-Term Effects of Crop Diversification on Soil Health, Crop Yield and Resilience of Tropical Agroecosystems. J. Environ. Manag. 2025, 392, 126845. [Google Scholar] [CrossRef]
  38. Franzluebbers, A.J. Achieving Soil Organic Carbon Sequestration with Conservation Agricultural Systems in the Southeastern United States. Soil Sci. Soc. Am. J. 2010, 74, 347–357. [Google Scholar] [CrossRef]
  39. Almagro, A.; de Oliveira, P.T.S.; Nearing, M.A.; Hagemann, S. Projected Climate Change Impacts in Rainfall Erosivity over Brazil. Sci. Rep. 2017, 7, 8130. [Google Scholar] [CrossRef]
  40. Luz, C.C.D.S.; Almeida, W.S.D.; Souza, A.P.D.; Schultz, N.; Anache, J.A.A.; Carvalho, D.F.D. Simulated Rainfall in Brazil: An Alternative for Assesment of Soil Surface Processes and an Opportunity for Technological Development. Int. Soil Water Conserv. Res. 2024, 12, 29–42. [Google Scholar] [CrossRef]
  41. Bono, J.A.M.; Macedo, M.C.M.; Tormena, C.A. Qualidade Física Do Solo Em Um Latossolo Vermelho Da Região Sudoeste Dos Cerrados Sob Diferentes Sistemas de Uso e Manejo. Rev. Bras. Ciência Solo 2013, 37, 743–753. [Google Scholar] [CrossRef]
  42. Alves Sobrinho, T.; Gómez-Macpherson, H.; Gómez, J.A. A Portable Integrated Rainfall and Overland Flow Simulator. Soil Use Manag. 2008, 24, 163–170. [Google Scholar] [CrossRef]
  43. IUSS Working Group WRB. World Reference Base for Soil Resources. In International Soil Classification System for Naming Soils and Creating Legends for Soil Maps, 4th ed.; International Union of Soil Sciences (IUSS): Vienna, Austria, 2022. [Google Scholar]
  44. USDA. Web Soil Survey. Available online: https://websoilsurvey.nrcs.usda.gov/app/ (accessed on 13 May 2026).
  45. Santos, H.G.; Jacomine, P.K.T.; Anjos, L.H.C.; Oliveira, V.A.; Oliveira, J.B.; Coelho, M.R.; Lumbreras, J.F.; Cunha, T.J.F. Sistema Brasileiro de Classificação de Solos; Embrapa: Brasília, DF, Brazil, 2011; pp. 1–353.
  46. Alvares, C.A.; Stape, J.L.; Sentelhas, P.C.; Gonçalves, J.L.M.; Sparovek, G. Köppen’s Climate Classification Map for Brazil. Meteorol. Z. 2013, 22, 711–728. [Google Scholar] [CrossRef]
  47. Panachuki, E.; Alves Sobrinho, T.; Vitorino, A.C.T.; Carvalho, D.F.; Urchei, M.A. Physical Parameters of Soil and Erosion Under Simulated Rainfall, in Pasture-Agriculture Integration System. Rev. Bras. Eng. Agríc. Ambient. 2006, 10, 261–268. [Google Scholar] [CrossRef]
  48. Mott, G.O.; Lucas, H.L. The Design, Conduct, and Interpretation of Grazing Trials on Cultivated and Improved Pastures. In Proceedings of the 6th International Grassland Congress, Pennsylvania State College, Hershey, PA, USA, 17–23 August 1952. [Google Scholar]
  49. Teixeira, P.C.; Donagemma, G.K.; Fontana, A.; Teixeira, W.G. (Eds.) Manual de Métodos de Análise de Solo, 3rd ed.; Embrapa: Brasília, Brazil, 2017.
  50. Tormena, C.A.; Araújo, M.A.; Fidalski, J.; Costa, J.M. Variação Temporal Do Intervalo Hídrico Ótimo de Um Latossolo Vermelho Distroférrico Sob Sistemas de Plantio Direto. Rev. Bras. Ciência Solo 2007, 31, 211–219. [Google Scholar] [CrossRef]
  51. Cogo, N.P.; Moldenhauer, W.C.; Foster, G.R. Soil Loss Reductions from Conservation Tillage Practices. Soil Sci. Soc. Am. J. 1984, 48, 368–373. [Google Scholar] [CrossRef]
  52. Ellert, B.H.; Bettany, J.R. Calculation of Organic Matter and Nutrients Stored in Soils under Contrasting Management Regimes. Can. J. Soil Sci. 1995, 75, 529–538. [Google Scholar] [CrossRef]
  53. Macedo, P.M.S.; Pinto, M.F.; Alves Sobrinho, T.; Schultz, N.; Coutinho, T.A.R.; Carvalho, D.F. A Modified Portable Rainfall Simulator for Soil Erosion Assessment under Different Rainfall Patterns. J. Hydrol. 2021, 596, 126052. [Google Scholar] [CrossRef]
  54. Iserloh, T.; Ries, J.B.; Arnáez, J.; Boix-Fayos, C.; Butzen, V.; Cerdà, A.; Echeverría, M.T.; Fernández-Gálvez, J.; Fister, W.; Geißler, C.; et al. European Small Portable Rainfall Simulators: A Comparison of Rainfall Characteristics. Catena 2013, 110, 100–112. [Google Scholar] [CrossRef]
  55. Pereira, S.B.; Fietz, C.R.; Peixoto, P.P.P.; Alves Sobrinho, T.; Santos, F.M. Equação de Intensidade, Duração e Frequência da Precipitação para a Região de Dourados, MS. Bol. Pesqui. Desenvolv. 2007, 44, 1–18. [Google Scholar]
  56. Pereira, S.B.; Nóia, C.P.Z.; Almeida, R.A.; Coelho, C.D. Method Adjustment and Equation Set of Maximum Rainfall Intensity, Duration and Frequency in the Mato Grosso Do Sul State. Eng. Agríc. 2014, 34, 716–726. [Google Scholar] [CrossRef]
  57. Meyer, L.D.; McCune, D.L. Rainfall Simulator for Runoff Plots. Agric. Eng. 1958, 39, 644–648. [Google Scholar]
  58. Dunkerley, D. The Case for Increased Validation of Rainfall Simulation as a Tool for Researching Runoff, Soil Erosion, and Related Processes. CATENA 2021, 202, 105283. [Google Scholar] [CrossRef]
  59. Alves Sobrinho, T.; Carvalho, D.F.D.; Aquino, R.N.; Montebeller, C.A. Programa Computacional Para a Definição de Parâmetros Hidráulicos Utilizados Na Determinação Da Energia Cinética Da Chuva Simulada Em Infiltrômetros de Aspersão. Eng. Rural 2001, 12, 28–35. [Google Scholar]
  60. R Core Team. R: A Language and Environment for Statistical Computing; R Foundation for Statistical Computing: Vienna, Austria, 2026. [Google Scholar]
  61. Moriasi, D.N.; Arnold, J.G.; Van Liew, M.W.; Bingner, R.L.; Harmel, R.D.; Veith, T.L. Model Evaluation Guidelines for Systematic Quantification of Accuracy in Watershed Simulations. Trans. ASABE 2007, 50, 885–900. [Google Scholar] [CrossRef]
  62. Nash, J.E.; Sutcliffe, J.V. River Flow Forecasting through Conceptual Models Part I—A Discussion of Principles. J. Hydrol. 1970, 10, 282–290. [Google Scholar] [CrossRef]
  63. Shapiro, S.S.; Wilk, M.B. An Analysis of Variance Test for Normality (Complete Samples). Biometrika 1965, 52, 591–611. [Google Scholar] [CrossRef]
  64. Levene, H. Robust Tests for Equality of Variances. In Contributions to Probability and Statistics; Olkin, I., Ed.; Stanford University Press: Redwood City, CA, USA, 1960; pp. 278–292. [Google Scholar]
  65. Tukey, J.W. Comparing Individual Means in the Analysis of Variance. Biometrics 1949, 5, 99–114. [Google Scholar] [CrossRef] [PubMed]
  66. Reynolds, W.D.; Drury, C.F.; Tan, C.S.; Fox, C.A.; Yang, X.M. Use of Indicators and Pore Volume-Function Characteristics to Quantify Soil Physical Quality. Geoderma 2009, 152, 252–263. [Google Scholar] [CrossRef]
  67. Corsini, P.C.; Ferraudo, A.S. Efeitos de sistemas de cultivo na densidade e macroporosidade do solo e no desenvolvimento radicular do milho em latossolo roxo. Pesq. Agropec. Bras. 1999, 34, 289–298. [Google Scholar] [CrossRef]
  68. Ferreira, A.O.; Amado, T.J.C.; Nicoloso, R.S.; Sá, J.C.M.; Fiorin, J.E.; Hansel, D.S.S.; Menefee, D. Soil Carbon Stratification Affected by Long-Term Tillage and Cropping Systems in Southern Brazil. Soil Tillage Res. 2013, 133, 65–74. [Google Scholar] [CrossRef]
  69. Bayer, C.; Martin-Neto, L.; Mielniczuk, J.; Pavinato, A.; Dieckow, J. Carbon Sequestration in Two Brazilian Cerrado Soils under No-Till. Soil Tillage Res. 2006, 86, 237–245. [Google Scholar] [CrossRef]
  70. Tisdall, J.M.; Oades, J.M. Organic Matter and Water-Stable Aggregates in Soils. J. Soil Sci. 1982, 33, 141–163. [Google Scholar] [CrossRef]
  71. Dekker, L.W.; Ritsema, C.J. How Water Moves in a Water Repellent Sandy Soil: 1. Potential and Actual Water Repellency. Water Resour. Res. 1994, 30, 2507–2517. [Google Scholar] [CrossRef]
  72. Alaoui, A.; Caduff, U.; Gerke, H.H.; Weingartner, R. Preferential Flow Effects on Infiltration and Runoff in Grassland and Forest Soils. Vadose Zone J. 2011, 10, 367–377. [Google Scholar] [CrossRef]
  73. Drewry, J.J.; Cameron, K.C.; Buchan, G.D. Pasture Yield and Soil Physical Property Responses to Soil Compaction from Treading and Grazing—A Review. Aust. J. Soil Res. 2008, 46, 237–256. [Google Scholar] [CrossRef]
  74. Collares, G.L.; Reinert, D.J.; Reichert, J.M.; Kaiser, D.R. Compactação Superficial de Latossolos Sob Integração Lavoura: Pecuária de Leite No Noroeste Do Rio Grande Do Sul. Ciência Rural 2011, 41, 453–459. [Google Scholar] [CrossRef]
  75. Cecagno, D.; de Andrade Costa, S.E.V.G.; Anghinoni, I.; Kunrath, T.R.; Martins, A.P.; Reichert, J.M.; Gubiani, P.I.; Balerini, F.; de Faccio Carvalho, P.C.; Bayer, C. Least Limiting Water Range and Soybean Yield in a Long-Term, No-till Integrated Crop-Livestock System under Different Grazing Intensities. Soil Tillage Res. 2016, 156, 54–62. [Google Scholar] [CrossRef]
  76. Klein, V.A.; Camara, R.K. Rendimento Da Soja e Intervalo Hídrico Ótimo Em Latossolo Vermelho Sob Plantio Direto Escarificado. Rev. Bras. Ciênc. Solo 2007, 31, 221–227. [Google Scholar] [CrossRef]
  77. Marchão, R.L.; Becquer, T.; Brunet, D.; Balbino, L.C.; Vilela, L.; Brossard, M. Carbon and Nitrogen Stocks in a Brazilian Clayey Oxisol: 13-Year Effects of Integrated Crop–Livestock Management Systems. Soil Tillage Res. 2009, 103, 442–450. [Google Scholar] [CrossRef]
  78. De Sant-Anna, S.A.C.; Jantalia, C.P.; Sá, J.M.; Vilela, L.; Marchão, R.L.; Alves, B.J.R.; Urquiaga, S.; Boddey, R.M. Changes in Soil Organic Carbon during 22 Years of Pastures, Cropping or Integrated Crop/Livestock Systems in the Brazilian Cerrado. Nutr. Cycl. Agroecosyst. 2017, 108, 101–120. [Google Scholar] [CrossRef]
  79. Legendre, P.; Legendre, L. Numerical Ecology, 3rd ed.; Elsevier: Amsterdam, The Netherlands, 2012; ISBN 978-0-444-53869-7. [Google Scholar]
  80. Loss, A.; Pereira, M.G.; Perin, A.; Beutler, S.J.; Anjos, L.H.C. Oxidizable carbon and humic substances in rotation systems with brachiaria/livestock and pearl millet/no livestock in the Brazilian Cerrado. Span. J. Agric. Res. 2013, 11, 217–231. [Google Scholar] [CrossRef]
  81. Salton, J.C.; Mielniczuk, J.; Bayer, C.; Fabrício, A.C.; Macedo, M.C.M.; Broch, D.L. Teor e Dinâmica Do Carbono No Solo Em Sistemas de Integração Lavoura-Pecuária. Pesq. Agropec. Bras. 2011, 46, 1349–1356. [Google Scholar] [CrossRef]
  82. Poeplau, C.; Don, A.; Vesterdal, L.; Leifeld, J.; Van Wesemael, B.; Schumacher, J.; Gensior, A. Temporal Dynamics of Soil Organic Carbon after Land-Use Change in the Temperate Zone—Carbon Response Functions as a Model Approach. Glob. Change Biol. 2011, 17, 2415–2427. [Google Scholar] [CrossRef]
  83. Brady, N.C.; Weil, R.R. The Nature and Properties of Soils, 14th ed.; Prentice Hall: Upper Saddle River, NJ, USA, 2008. [Google Scholar]
  84. De Moraes, A.; Carvalho, P.C.D.F.; Anghinoni, I.; Lustosa, S.B.C.; Costa, S.E.V.G.D.A.; Kunrath, T.R. Integrated Crop–Livestock Systems in the Brazilian Subtropics. Eur. J. Agron. 2014, 57, 4–9. [Google Scholar] [CrossRef]
  85. Ayarza, M.; Rao, I.; Vilela, L.; Lascano, C.; Vera-Infanzón, R. Chapter Three—Soil Carbon Accumulation in Crop-Livestock Systems in Acid Soil Savannas of South America: A Review. Adv. Agron. 2022, 173, 163–226. [Google Scholar] [CrossRef]
  86. Anache, J.A.A.; Flanagan, D.C.; Srivastava, A.; Wendland, E.C. Land Use and Climate Change Impacts on Runoff and Soil Erosion at the Hillslope Scale in the Brazilian Cerrado. Sci. Total Environ. 2018, 622–623, 140–151. [Google Scholar] [CrossRef]
Figure 1. The study area in the Cerrado–Atlantic Forest ecotone and the portable InfiAsper infiltrometer/rainfall simulator used for soil water infiltration measurements under different agricultural land-use systems: (a) crop–livestock integration in the livestock phase (CL-L), (b) well-managed permanent pasture of Urochloa decumbens (PP), (c) crop–livestock integration in the cropping phase (CL-C), (d) soybean cropping under conventional tillage (CT), (e) soybean cropping under no-tillage (NT), and (f) portable InfiAsper infiltrometer/rainfall simulator. Source: modified from [29] under the Creative Commons Attribution License (CC BY 4.0; https://creativecommons.org/licenses/by/4.0/, accessed on 1 May 2026).
Soilsystems 10 00063 g001
Figure 2. Observed soil water infiltration rate (points) versus values estimated by Horton’s model (lines) for a LATOSSOLO VERMELHO Distroférrico típico (Ferralsol) after 20 years under different agricultural management systems: CT = conventional tillage; NT = no-tillage; CL-L and CL-C = integrated crop–livestock systems in the livestock and crop phases, respectively; PP = a well-managed Urochloa decumbens permanent pasture, Dourados, MS, Brazil. Values are means of five replicates per treatment.
Soilsystems 10 00063 g002
Figure 3. Principal component analysis (PCA) biplot integrating steady-state infiltration rate (SIR) and soil properties at 0–0.05 m depth (treatment means, n = 5). Arrows = variables (coloured by contribution to each PC); points = treatment means. PC1 (62.4%) represents soil quality gradient; PC2 (33.7%) represents independent infiltration–compaction axis. Inset: scree plot showing variance explained per principal component. CT = conventional tillage; NT = no-tillage; CL-L = crop–livestock, livestock phase; CL-C = crop–livestock, crop phase; PP = well-managed Urochloa decumbens permanent pasture. SIR is steady-state soil water infiltration; Bd is soil bulk density; Macro is soil macroporosity; SOC is soil organic carbon; and MWD is mean weight diameter.
Soilsystems 10 00063 g003
Table 1. Physical properties of the LATOSSOLO VERMELHO Distroférrico típico (Ferralsol) after 20 years under different agricultural management systems, Dourados, MS, Brazil.
Management SystemsSoil BulkMacroporosityMicroporosityTotal PorositySoil Organic Carbon (g kg−1)Soil PenetrationMWD
Density (g cm−3)m3 m−3Resistance (MPa)
0–0.05 m
CT1.22 a0.196 a0.346 a0.542 a31.72 b0.91 c1.74 b
NT1.31 ab0.159 b0.350 a0.509 a33.74 b1.77 b1.40 b
CL-L1.34 a0.148 b0.399 a0.546 a42.18 a1.73 b4.22 a
CL-C1.30 ab0.152 b0.369 a 0.521 a43.58 a1.70 b4.19 a
PP1.33 a0.108 b0.429 a0.536 a41.72 a2.26 a3.91 a
0.05–0.10 m
CT1.38 a0.174 a0.382 a0.556 a29.32 b1.35 b2.65 b
NT1.39 a0.137 b0.392 a0.529 a30.95 b1.49 b1.33 c
CL-L1.40 a0.150 a0.375 a0.525 a32.58 ab1.56 b3.11 b
CL-C1.36 a0.149 a0.361 a0.510 a30.06 b1.66 b3.28 b
PP1.25 b0.118 c0.395 a0.513 a34.20 a1.82 a4.33 a
0.10–0.20 m
CT1.44 a0.070 c0.440 a0.510 a26.57 b3.02 a2.30 b
NT1.39 b0.082 b0.436 a0.519 a25.30 b2.96 a1.16 c
CL-L1.36 c0.104 a0.425 a0.529 a32.34 a1.71 b2.12 b
CL-C1.34 c0.098 ab0.446 a0.544 a26.54 ab1.71 b2.51 b
PP1.27 d0.118 a0.410 a0.528 a28.97 b1.38 c3.83 a
0.20–0.40 m
CT1.41 a0.075 c0.442 a0.518 a23.19 a1.52 a1.35 cd
NT1.38 a0.080 c0.423 a0.503 a24.65 a1.48 b1.16 d
CL-L1.32 b0.106 b0.412 a0.518 a25.79 a1.47 b1.65 c
CL-C1.31 b0.111 b0.414 a0.526 a24.50 a1.48 b2.10 b
PP1.30 b0.140 a0.401 a0.540 a19.63 b1.56 a3.22 a
Values followed by different letters within a column, for the same soil depth, are significantly different (p < 0.05, Tukey’s test). CT and NT are integrated crop rotation systems under conventional tillage and no-till, respectively. CL-L and CL-C are crop–livestock integration systems in the livestock and cropping phases, respectively. PP is a well-managed Urochloa decumbens permanent pasture. MWD is the mean weight diameter. The soil property values are the average of five replicates at each soil depth for each treatment. Source: modified from [29] under the Creative Commons Attribution License (CC BY 4.0; https://creativecommons.org/licenses/by/4.0/, accessed on 1 May 2026).
Table 2. Mean values of above-ground dry biomass, soil water content before rainfall application (SWC), kinetic energy of simulated rainfall, percentage ratio between the kinetic energy of simulated and natural rainfall (Ecs/Ecn), and time to runoff onset in a LATOSSOLO VERMELHO Distroférrico típico (Ferralsol) after 20 years under crop rotation and integrated crop–livestock systems in Dourados, MS, Brazil.
Soil Depth (m)CTNTCL-LCL-CPP
Soil water content before rainfall application—SWC (kg kg−1)
0–0.050.175 a0.178 a0.199 a0.195 a0.190 a
0.05–0.100.181 a0.184 a0.201 a0.208 a0.212 a
0.10–0.200.180 a0.183 a0.204 a0.202 a0.207 a
0.20–0.400.205 a0.207 a0.210 a0.221 a0.218 a
Kinetic energy of simulated rainfall (kJ m−2)
1.99 b5.36 a1.79 c1.97 b1.73 c
Ecs/Ecn (%)
96.59 a96.59 a96.59 a96.59 a96.59 a
Above-ground biomass (dry weight, Mg ha−1)
8.43 c11.48 bc14.95 a12.08 ab3.90 d
Time to runoff onset (min)
17.87 b150.24 a9.94 b17.32 b7.27 b
Equal letters within the same row—and within the same column for soil water content—indicate no significant difference by Tukey’s test (p < 0.05). CT and NT are integrated crop rotation systems under conventional tillage and no-till, respectively. CL-L and CL-C are crop–livestock integration systems in the livestock and cropping phases, respectively. PP is a well-managed Urochloa decumbens permanent pasture. Ecs/Ecn (%) is the percentage ratio between the kinetic energy of simulated and natural rainfall. Mean values are the averages of five replicates per treatment. For soil water content, the mean values are the averages of five replicates per treatment and soil depth. Kinetic energy of simulated rainfall (kJ m−2) and above-ground biomass (dry weight, Mg ha−1) are modified from [29] under the Creative Commons Attribution License (CC BY 4.0; https://creativecommons.org/licenses/by/4.0/, accessed on 1 May 2026).
Table 3. Treatment means (± SD and SE) for steady-state infiltration rate (SIR) in a LATOSSOLO VERMELHO Distroférrico típico (Ferralsol) after 20 years under different agricultural management systems, Dourados, MS, Brazil.
TreatmentnMean SIR
(mm h−1)
SDSETukey
NT554.324.662.08a
CT551.183.311.48a
CL-L550.744.722.11a
CL-C545.119.884.42a
PP526.4012.175.44b
Different letters indicate significant differences (Tukey’s HSD, p < 0.05). n = 5 replicates per treatment. CT = conventional tillage; NT = no-tillage; CL-L = crop–livestock integration, livestock phase; CL-C = crop–livestock integration, crop phase; PP = a well-managed Urochloa decumbens permanent pasture.
Table 4. Horton model parameters and goodness-of-fit statistics by treatment in a LATOSSOLO VERMELHO Distroférrico típico (Ferralsol) after 20 years under different agricultural management systems, Dourados, MS, Brazil.
Treatmentf0 (mm h−1)fc (mm h−1)k (min−1)R2RMSE (mm h−1)
CT58.1349.370.02730.9870.265
NT59.6554.550.20350.9800.163
CL-L58.4650.870.08680.9790.324
CL-C56.4535.490.01180.9201.020
PP54.2820.470.02900.9601.848
f0 = initial infiltration rate; fc = steady-state infiltration rate; k = decay constant; R2 = coefficient of determination; RMSE = root mean square error. All values were derived from non-linear least squares fitting of Horton’s model to treatment mean observed infiltration data (n = 5 replicates per treatment).
Table 5. Total SOC stock (0–0.40 m) per treatment for a LATOSSOLO VERMELHO Distroférrico típico (Ferralsol) after 20 years under different agricultural management systems, Dourados, MS, Brazil.
TreatmentTotal Stock (Mg C ha−1)SDSETukeyDunn (Bonferroni)
CL-L92.78.233.68aa
CL-C88.14.371.95aab
NT84.15.112.28ababc
CT79.07.973.56abbc
PP73.59.394.20bc
ANOVA F4,20 = 5.33, p = 0.004; Kruskal–Wallis χ2 = 13.57, p = 0.009. SD is the standard deviation. SE is the standard error. Different letters indicate significant differences at p < 0.05. CT = conventional tillage; NT = no-tillage; CL-L = crop–livestock integration, livestock phase; CL-C = crop–livestock integration, crop phase; PP = well-managed Urochloa decumbens permanent pasture. The SOC stocks are mainly affected by the soil bulk density (Bd) at each agricultural management system, especially for the deepest depth.
Table 6. Soil organic carbon stocks (SOC stocks, Mg C ha−1) per treatment and depth layer (mean ± SE, n = 5) for a LATOSSOLO VERMELHO Distroférrico típico (Ferralsol) after 20 years under different agricultural management systems, Dourados, MS, Brazil.
Treatment0–0.05 m0.05–0.10 m0.10–0.20 m0.20–0.40 m
CL-L15.96 ± 1.3812.86 ± 0.8525.21 ± 1.1438.66 ± 1.91
CL-C16.88 ± 1.2512.19 ± 0.3720.97 ± 0.2538.07 ± 1.50
NT12.79 ± 0.3512.52 ± 0.3719.86 ± 0.7238.89 ± 1.75
CT11.32 ± 0.1512.05 ± 0.4621.33 ± 0.7134.33 ± 2.65
PP14.84 ± 1.8912.85 ± 0.4019.68 ± 0.9426.15 ± 3.01
Stocks calculated as (C%/100) × Bd (Mg m−3) × layer thickness (m) × 10,000. CT = conventional tillage; NT = no-tillage; CL-L = crop–livestock integration, livestock phase; CL-C = crop–livestock integration, crop phase; PP = well-managed Urochloa decumbens permanent pasture.
Disclaimer/Publisher’s Note: The statements, opinions and data contained in all publications are solely those of the individual author(s) and contributor(s) and not of MDPI and/or the editor(s). MDPI and/or the editor(s) disclaim responsibility for any injury to people or property resulting from any ideas, methods, instructions or products referred to in the content.