
Article

Land Use and Soil Properties Drive Earthworm Community Assembly in Recently Irrigated Semi-Arid Soils of Northern Patagonia, Argentina

by
Marina Quiroga
1,2,
Julia L. Bazzani
1,*,
Roberto S. Martínez
1,3,
Anahí Domínguez
4 and
José C. Bedano
4
1
Centro de Investigaciones y Transferencia de Río Negro, Universidad Nacional de Río Negro (UNRN), Rotonda Cooperación y Ruta Provincial N° 1, Viedma 8500, Río Negro, Argentina
2
Consejo Nacional de Investigaciones Científicas y Técnicas (CONICET), Centro de Investigaciones y Transferencia de Río Negro, Rotonda Cooperación y Ruta Provincial N° 1, Viedma 8500, Río Negro, Argentina
3
Estación Experimental Agropecuaria del Valle Inferior del Río Negro (EEAVi), Instituto Nacional de Tecnología Agropecuaria (INTA), Ruta Nacional 3 Km 971-Camino 4, Viedma 8500, Río Negro, Argentina
4
Instituto de Ciencias de la Tierra, Biodiversidad y Ambiente (ICBIA), Consejo Nacional de Investigaciones Científicas y Técnicas (CONICET), Universidad Nacional de Río Cuarto (UNRC), Ruta Nacional 36, Km 601, Río Cuarto 5800, Córdoba, Argentina
*
Author to whom correspondence should be addressed.
Soil Syst. 2026, 10(4), 48; https://doi.org/10.3390/soilsystems10040048
Submission received: 30 December 2025 / Revised: 24 March 2026 / Accepted: 1 April 2026 / Published: 10 April 2026
(This article belongs to the Special Issue Effects of Earthworms on Soil Systems)

Abstract

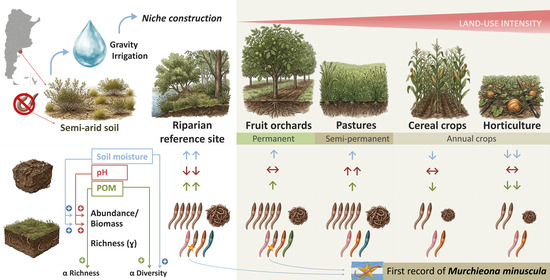
Earthworms are ecosystem engineers that are sensitive to land-use intensification and edaphic conditions, yet their ecology remains poorly understood in transformed semi-arid landscapes. We hypothesized that, in recently colonized agroecosystems, land-use intensity and physicochemical soil conditions jointly filter the earthworm assembly. In the recently irrigated Lower Valley of the Negro River, Patagonia, Argentina, we sampled earthworms and soils across five land uses—riparian reference sites, fruit orchards, pastures, cereal crops, and horticulture plots—in landscapes dominated by Natrargid Ustolls and Fluventic Haplocambids. We found five species, all of which were exotic Lumbricidae, including the first Argentine record for Murchieona minuscula, indicating a recent colonization following human-mediated niche construction that created an ecological island. The earthworm abundance and biomass were highest in permanent and semi-permanent uses and were driven primarily by soil moisture, pH, and particulate organic matter. Crucially, our results reveal that land-use intensity filters communities by restricting the initial colonization rather than through local extinctions. These findings confirm that soil properties mediate the impact of land use on earthworm assemblages. The inclusion of pastures and fruit orchards in the rotations favors the earthworm populations that, despite low diversity, enhance soil functioning and contribute to agricultural sustainability in semi-arid irrigated agroecosystems.

Graphical Abstract

1. Introduction

Earthworms are ecosystem engineers as they have the ability to modify the physicochemical and biological attributes of soil, producing cascading effects on organic matter dynamics, water infiltration, and microhabitat availability [1,2]. These transformations influence soil community structure and key ecosystem processes such as carbon and nutrient cycling [3,4,5]. In turn, earthworm presence, abundance, and community composition are strongly conditioned by soil properties, including texture, pH, organic matter, and moisture [6,7,8]. This feedback between earthworms and the soil environment is fundamental for understanding and guiding the sustainable management of agricultural soils [9,10].
Globally, earthworm distribution is strongly constrained by water availability, which regulates both the biological activity and the supply of organic resources to the soil [11,12,13]. In semi-arid regions, low primary productivity and severe moisture limitations reduce soil biodiversity and increase vulnerability to land-use change and agricultural intensification [5,14,15,16,17]. Northeastern Patagonia exemplifies these constraints: rainfall is concentrated in winter (≈120–380 mm yr−1), soils are clayey and often sodic on flat surfaces, and soils in fluvial microreliefs are sandy Fluvisols [18,19]. Phytogeographically, the region belongs to the Austral Monte biogeographic region [20,21,22]. In this naturally water-limited context, soil moisture represents the main factor preventing earthworm establishment and persistence [23].
Within this region, the Lower Valley of the Negro River (VIRN; Spanish acronym) represents a unique case of anthropogenic transformation. The large-scale irrigation system that was implemented in the mid-20th century converted a pristine semi-arid landscape into a productive agricultural mosaic under gravity irrigation [24,25,26,27]. This process of human-driven niche construction [28,29,30] created unprecedented moisture and fertility conditions, likely enabling the establishment of new communities in soils that were previously unsuitable for moisture-dependent organisms. As a result, the irrigated valley now functions as an “ecological island” within an arid matrix, offering a unique opportunity to investigate how colonization and community assembly processes occur across contrasting land uses and soil environments in recently colonized soils, a context in which previous studies have reported a strong prevalence of introduced earthworm species [31,32].
Within the VIRN, the land uses range from high-intensity annual crops (corn and squash) to semi-permanent systems (pastures), permanent systems (fruit orchards), and remnants of natural vegetation [18,33]. These land uses differentially affect the soil physicochemical properties and the earthworm communities, depending on disturbance intensity, residue inputs, and soil cover [34,35]. Despite the recognized importance of soil macrofauna in agroecosystems, studies in Patagonia—and particularly in the VIRN—remain remarkably scarce, limiting the understanding of how irrigation-driven land uses and management practices affect soil biodiversity and soil–earthworm interactions in these newly created environments.
Therefore, this study aimed to analyze how different land uses and soil properties drive earthworm communities in recently irrigated semi-arid landscapes of northeastern Patagonia, providing evidence of their role in structuring biodiversity and influencing soil functioning in newly transformed agricultural ecosystems. We hypothesized that both land-use intensity and soil physicochemical properties act as key environmental filters driving the assembly and dominance patterns of earthworm communities in these recently colonized soils.

2. Materials and Methods

2.1. Study Area

The study area was located in the Lower Valley of the Negro River (40°45′ S, 63°10′ W), within the semi-arid region of northeastern Patagonia (Figure 1), where the dominant soils are Natrargid Ustolls in the flat areas and Fluventic Haplocambids in the microrelief positions [18]. The valley had a mean annual temperature of 14.1 °C, with the mean annual maximum and minimum temperatures of 20.9 °C and 7.9 °C, respectively [18]. The cropping area covered 20,000 ha, which was leveled and equipped for gravity-fed irrigation and operated with an estimated efficiency of 20–30%, with farms ranging from 20 to 300 ha [24,25]. This transformed landscape was characterized by a mosaic of temporary, semi-permanent, and permanent land uses that were interspersed with remnants of natural or semi-natural vegetation.

2.2. Land Uses

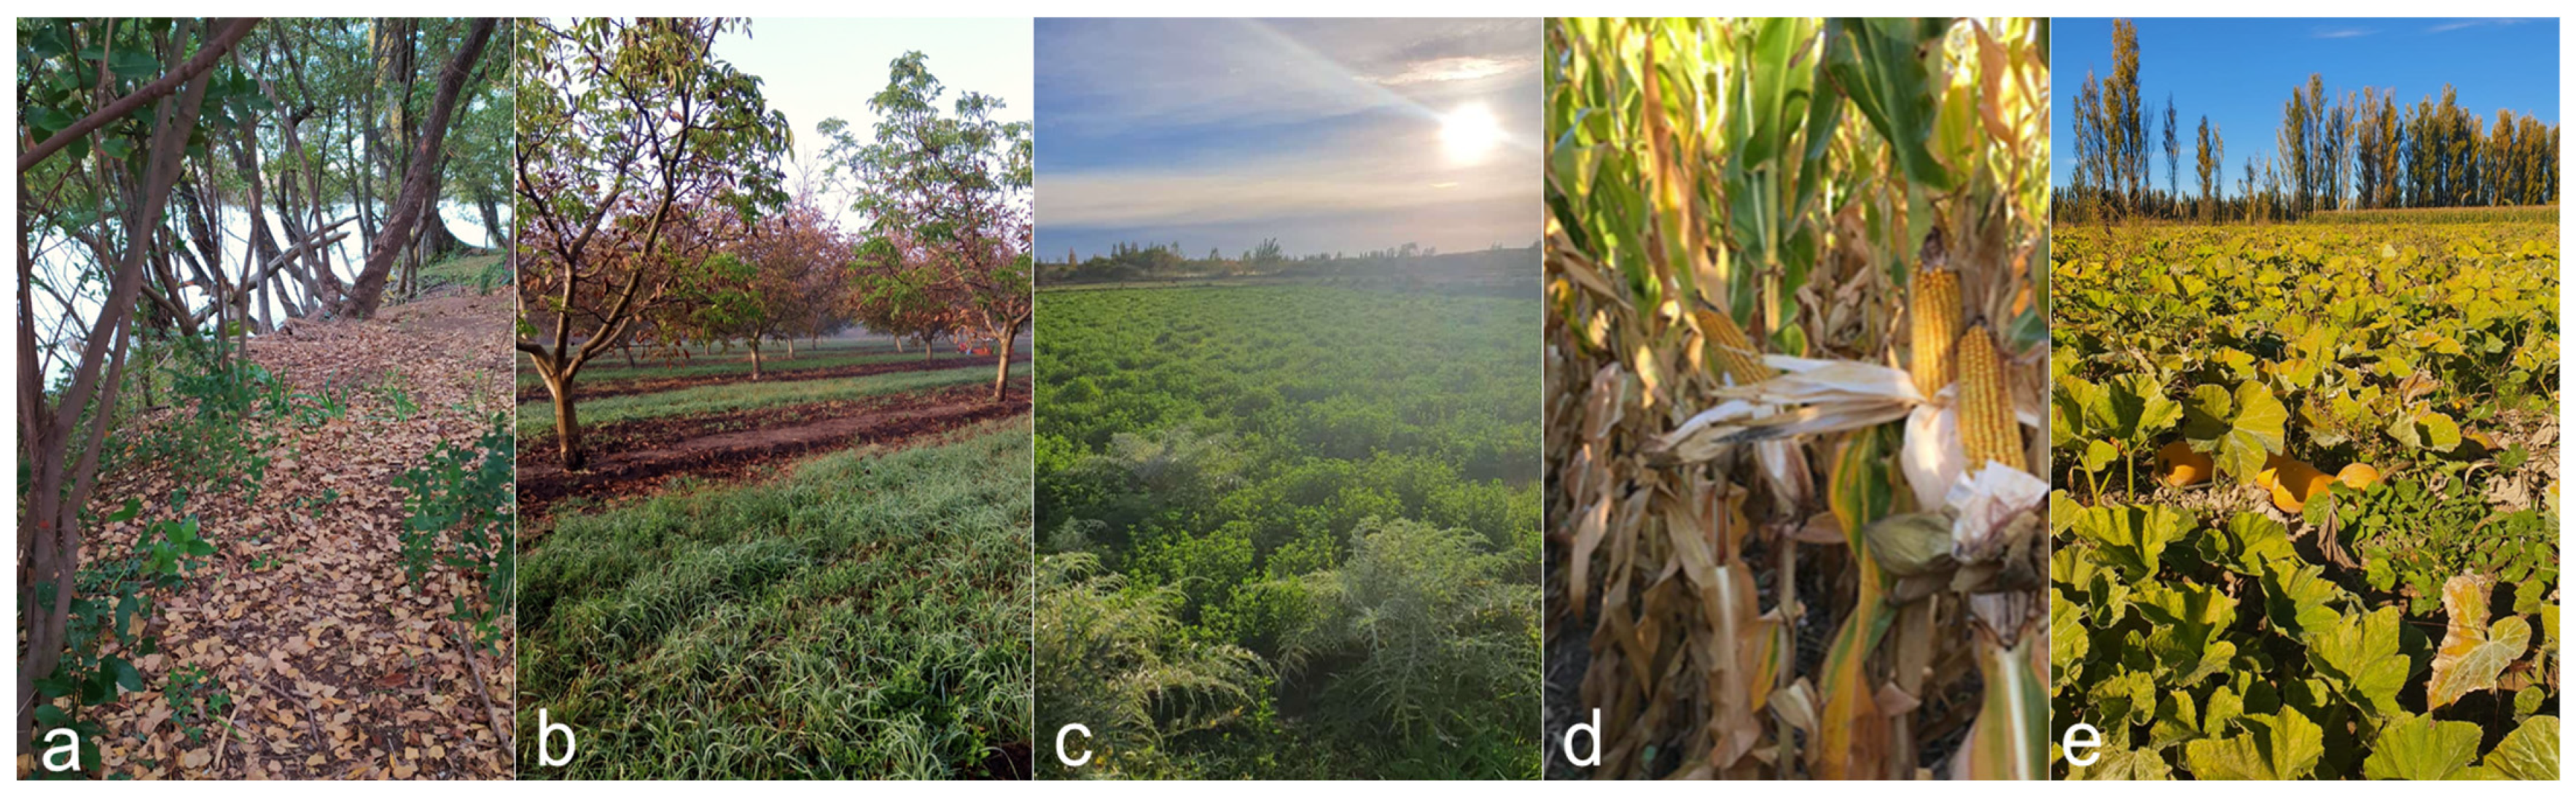
Four agricultural land uses were selected, each represented by a dominant crop typical of the region: fruit orchards (permanent; walnut, Juglans regia), pastures (semi-permanent; mixed forage species), cereal crops (annual; corn, Zea mays), and horticulture plots (annual; squash, Cucurbita sp.). We analyzed a gradient ranging from permanent (orchards established > 10 years ago) to semi-permanent (pastures with 3–5 years of stability) to annual land use (representing the current irrigation cycle within long-term agricultural plots). In addition, reference sites with riparian vegetation representing the most stable and least disturbed conditions were also included for comparison (Figure 2). The key management practices are summarized in Table 1.
For each land use, four fields were selected, and a 100 × 50 m plot was established in the center of each field to measure all variables. Within each plot, a transect was established with five equally spaced sampling points (SP) located 20 m apart. For the riparian reference, two sites (replicates) were sampled. In total, 18 experimental units (EUs) were sampled.

2.3. Earthworms

The sampling was conducted in April and May 2021, coinciding with the peak reproductive season when adult individuals are most abundant. At each EU, five soil monoliths (25 × 25 cm) were extracted for 0–10 cm and 10–20 cm for earthworm sampling through careful hand-sorting (in total 180 monoliths), according to the ISO 23611-1:2018 method ([38]; Figure S1). The specimens were counted and identified to the species level using standard taxonomic keys [39,40,41,42,43,44,45]. When reproductive characters were insufficiently developed, individuals were classified as morphospecies or undetermined juveniles. Abundance, biomass, and community composition indices—species richness (S), Shannon diversity (H′), and Berger–Parker dominance (d)—were calculated for each sampling depth. Each EU was treated as an independent local community, thus representing local-scale values of richness, diversity, and dominance (α-diversity).

2.4. Soil Properties

At each earthworm extraction point, soil samples were collected to determine the soil properties. The variables considered were soil moisture (SM), bulk density (BD), electrical conductivity (EC), pH, particulate organic matter (POM), mineral-associated organic matter (MAOM), and coarse fraction (CF). The soil samples were air-dried and sieved (2 mm) prior to the laboratory analyses. The bulk density (g cm−3) was determined using the cylinder method, and the SM (%) was measured via the gravimetric method after oven-drying at 105 °C for 24 h. The electrical conductivity (dS m−1) and pH were determined in a 1:2.5 soil-to-water suspension using a benchtop conductivity meter and a pH meter, respectively. The POM and MAOM fractions, together with the proportions of coarse (>53 µm) and fine (<53 µm) fractions, were determined following the physical fractionation protocol [46]. Briefly, the soil samples were subjected to wet sieving through a 53 µm mesh after chemical dispersion with sodium hexametaphosphate (0.5%). The percentages of the CF and fine fraction (FF) were calculated from the oven-dry soil mass that was retained or passed through the sieve, relative to the initial dry mass. The POM and MAOM were quantified by muffle combustion [47] using aliquots of the CF and the FF, respectively. Because the CF and the FF are complementary (CF + FF = 100%), only the CF values are reported. In total, 180 soil samples were analyzed.

2.5. Statistical Analysis

The earthworm metrics (abundance, biomass, richness, diversity, and dominance) and soil variables were analyzed using generalized linear mixed models (GLMMs) implemented in the glmmTMB package [48], considering the land use and depth as fixed effects and the hierarchical structure of replicates as random effects: response variable ~ land use * depth + (1|EU/SP). The distributions and transformations were adjusted according to the nature of each variable: abundance and richness with a negative binomial distribution (the latter was truncated and accounted for zero inflation by the treatment), biomass with a Gaussian distribution (log10-transformed to reduce skewness), Shannon diversity and dominance with a Student’s t-distribution (the latter was square root-transformed). For the soil variables, the SM and EC were modeled with a gamma distribution; BD, pH, POM, MAOM and CF with a Gaussian distribution, with POM ln-transformed. The model assumptions were evaluated using simulated residual diagnostics implemented in the DHARMa package [49]. The model diagnostics indicated no outliers requiring exclusion or correction; therefore, all observations were retained. The missing data (<1.5% of the total) were imputed for the MAOM and the CF using the mice package [50].
The earthworm community composition was assessed using redundancy analysis (RDA) applied to Hellinger-transformed abundances with the vegan package [51]. In addition, a PERMANOVA test [52] was used to compare land uses, with pairwise comparisons performed on the data subsets.
The effect of edaphic variables (SM, BD, EC, pH, POM, MAOM, and CF) on earthworm metrics was evaluated through a multimodel inference based on the Akaike information criterion (AIC) [53,54]. The initial model included the soil variables as fixed effects and the extraction points that were nested within the experimental units as random effects: response variable ~ edaphic variables + (1|EU/SP). The missing values (<1.5%) were imputed using the mice package [50]. The model assumptions were checked with graphical and statistical tests using DHARMa [49]. The models with ΔAIC ≤ 2 were averaged with MuMIn [55].
All the analyses were conducted in R version 4.4.1 [56]. No generative artificial intelligence tools were used for data collection, analysis, or interpretation; AI was only employed for the language editing of the manuscript.

3. Results

3.1. Earthworms

A total of 1307 earthworms were collected across all experimental units, of which 10% of the specimens were adults. Five morphotypes were identified, four of which were determined at the species level, all belonging to Lumbricidae: Aporrectodea rosea, A. trapezoides, A. caliginosa, and Murchieona minuscula (Table 2). The most abundant species was A. rosea (52.7%), followed by M. minuscula (14.1%), A. trapezoides (9.9%), A. caliginosa (6.1%), and an unidentified Haplotaxida morphotype (0.5%), the latter found exclusively in fruit orchards. The remaining 16.8% of individuals could not be identified to the species level due to the absence of diagnostic characters. The regional (γ) richness was highest in the reference soils and the fruit orchards (four species), followed by the pastures (three), and the cereal crops and horticulture plots (two each). The mean (±SD) values of earthworm abundance, biomass, richness, diversity, and dominance for each land-use type and soil depths (0–10 and 10–20 cm) are presented in Table 3.
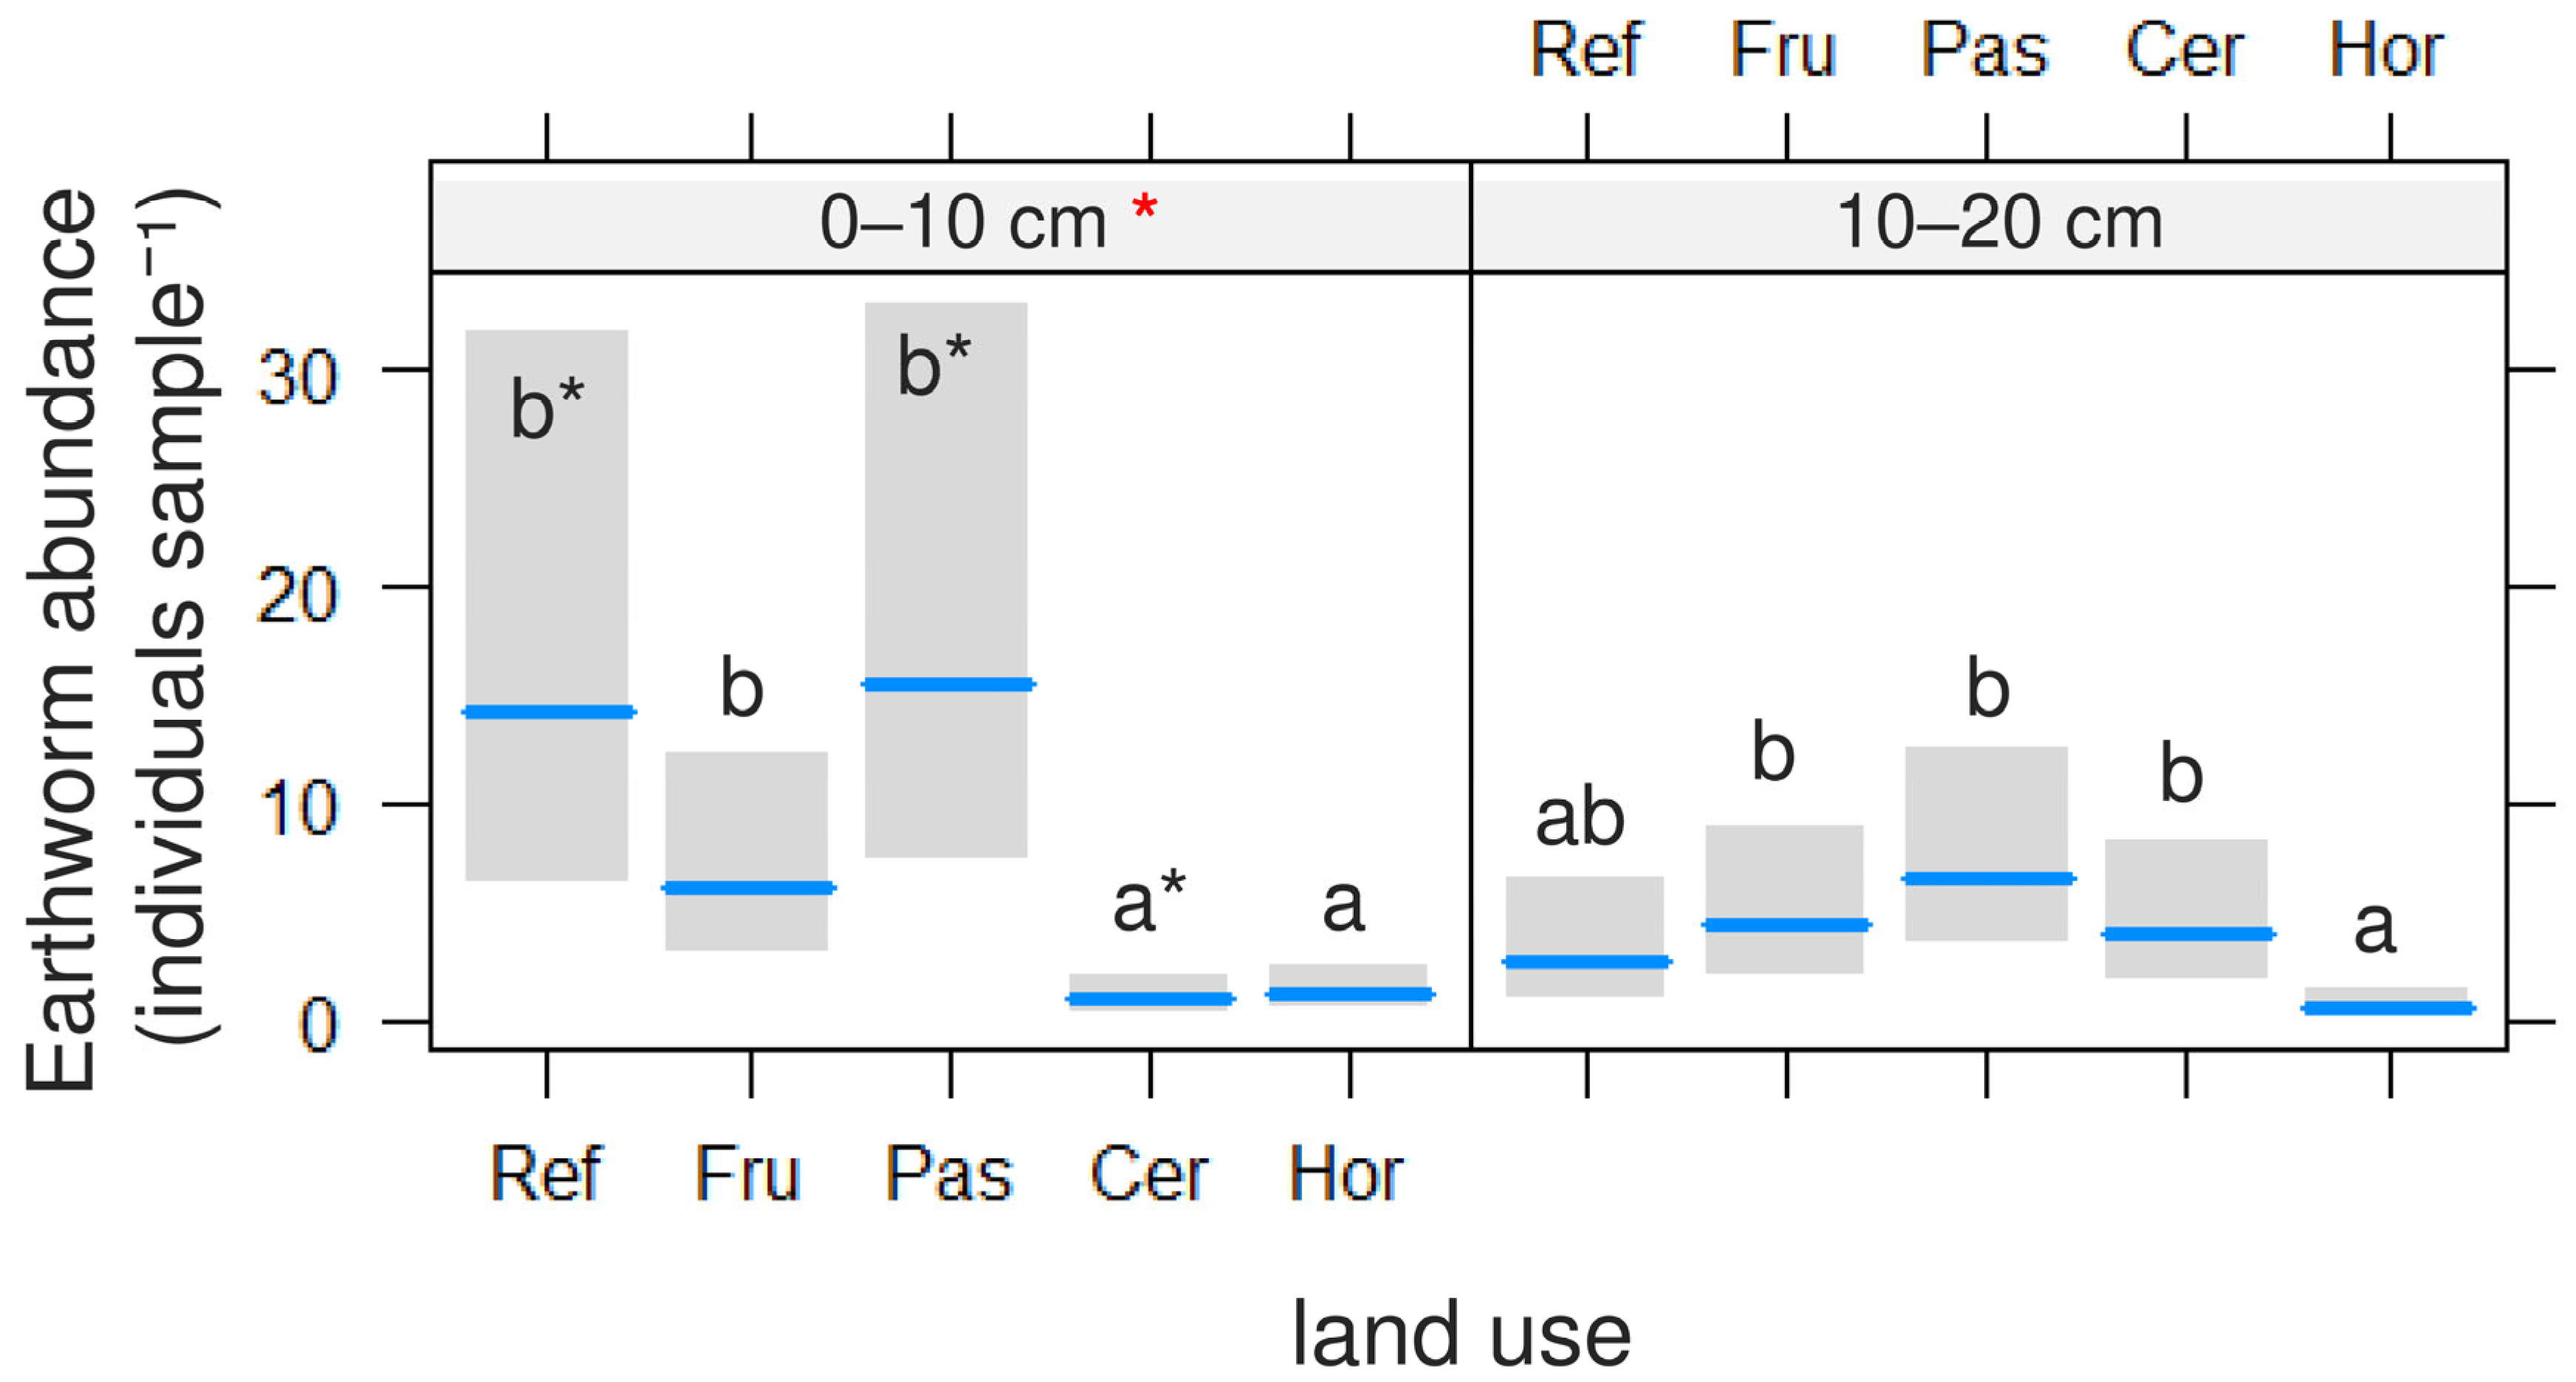
The mean earthworm densities were 332 ± 488.2 ind/m2 in the reference soils, 117.2 ± 164.6 ind/m2 in the fruit orchards (walnut), 260.4 ± 432.6 ind/m2 in the pastures, 43.6 ± 74.7 ind/m2 in the cereal crops (corn), and 16.8 ± 30.7 ind/m2 in the horticulture plots (squash). The total earthworm abundance was significantly affected by the interaction between the land use and soil depth (Figure 3, Tables S1 and S2). At the 0–10 cm layer, the abundances in the reference soils, the fruit orchards, and the pastures were similar and higher than in the cereal crops and the horticulture plots. At the 10–20 cm layer, the fruit orchards, the pastures, and the cereal crops showed similar abundances, all higher than those in the horticulture plots, while the reference soils had intermediate values. The simple-effects analysis revealed that the soil depth significantly reduced abundance in the pastures and the reference soils (p = 0.05 and 0.005, respectively), whereas the cereal crops exhibited a significant inverse pattern with a higher abundance at the 10–20 cm layer (p = 0.002). For the remaining land uses, no significant vertical differences were observed (p > 0.05).
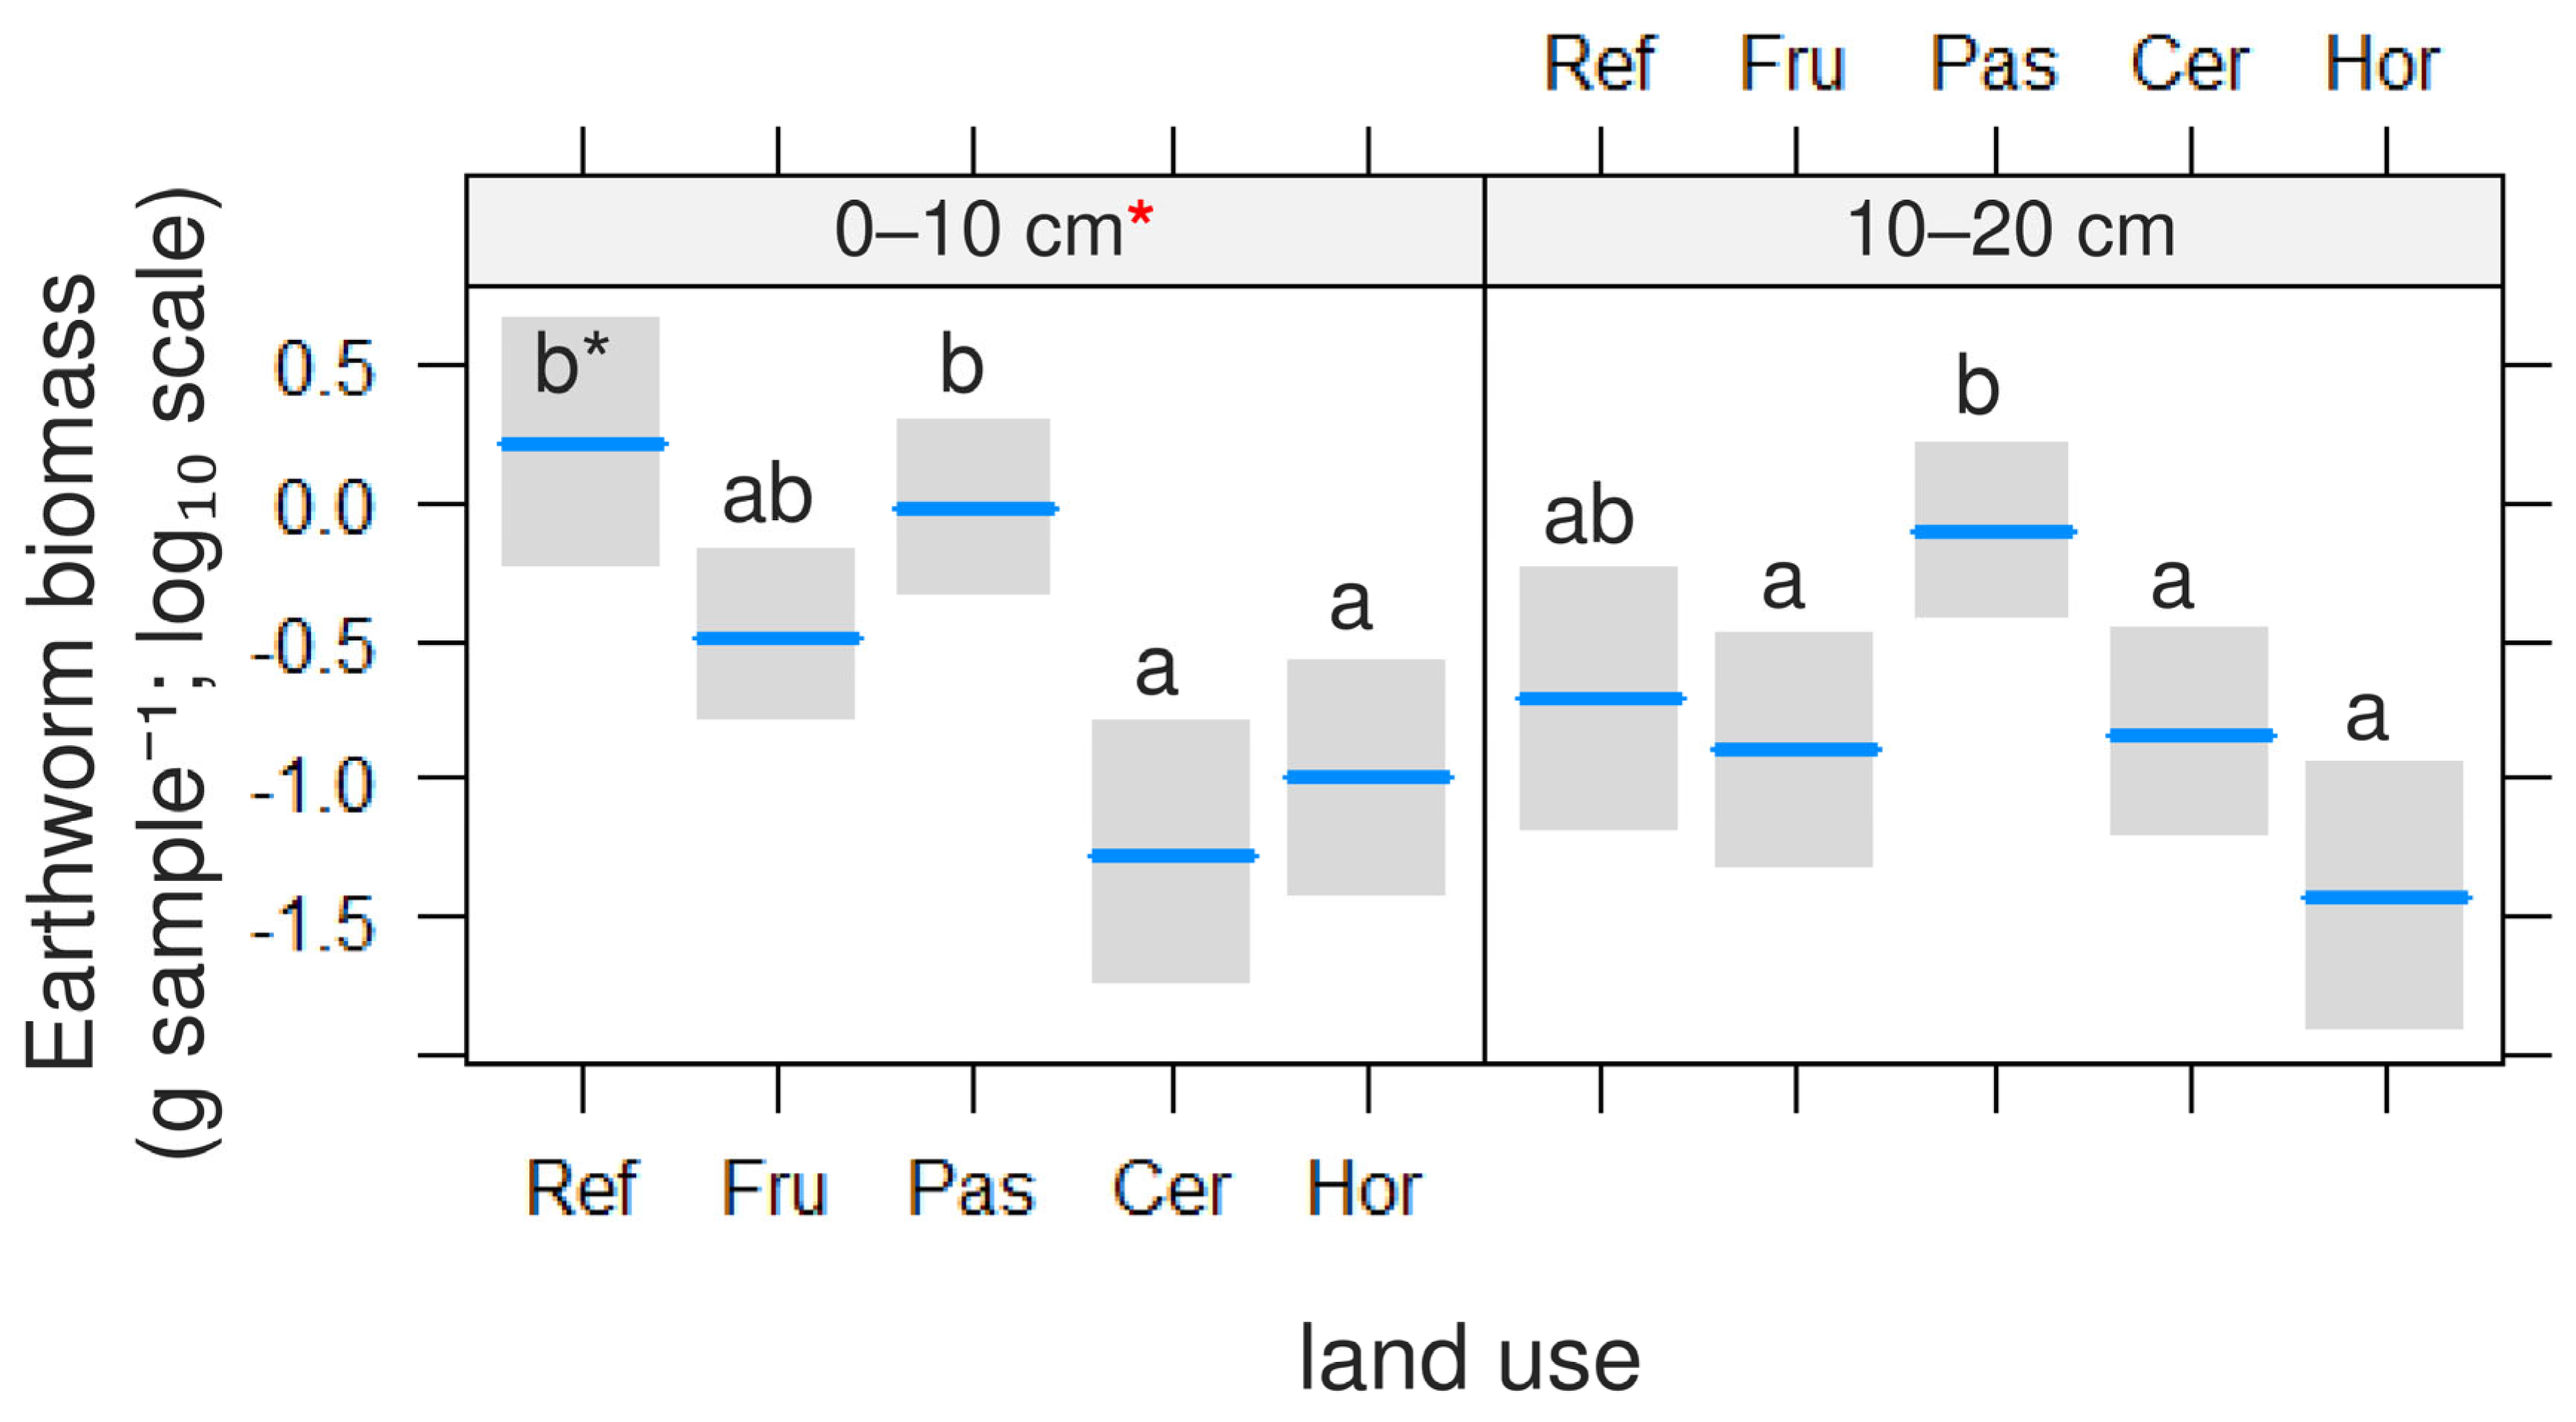
The earthworm biomass varied significantly with the soil depth and land use (Figure 4, Tables S3 and S4). The soil depth significantly reduced the biomass only in the reference site (p = 0.007), whereas no significant vertical differences were observed for the other land uses (p > 0.05). Regarding the land-use patterns, at 0–10 cm, the biomass was the highest in the pastures and the reference soils, intermediate in the fruit orchards, and the lowest in the cereal crops and horticulture plots. At 10–20 cm, the pattern shifted: the pastures remained the highest, the reference soils were intermediate, and the cereal crops, fruit orchards, and horticulture plots were clustered at the lowest values.
The earthworm species richness, Shannon diversity, and Berger–Parker dominance were not significantly affected by the land use or soil depth (Tables S5–S7).
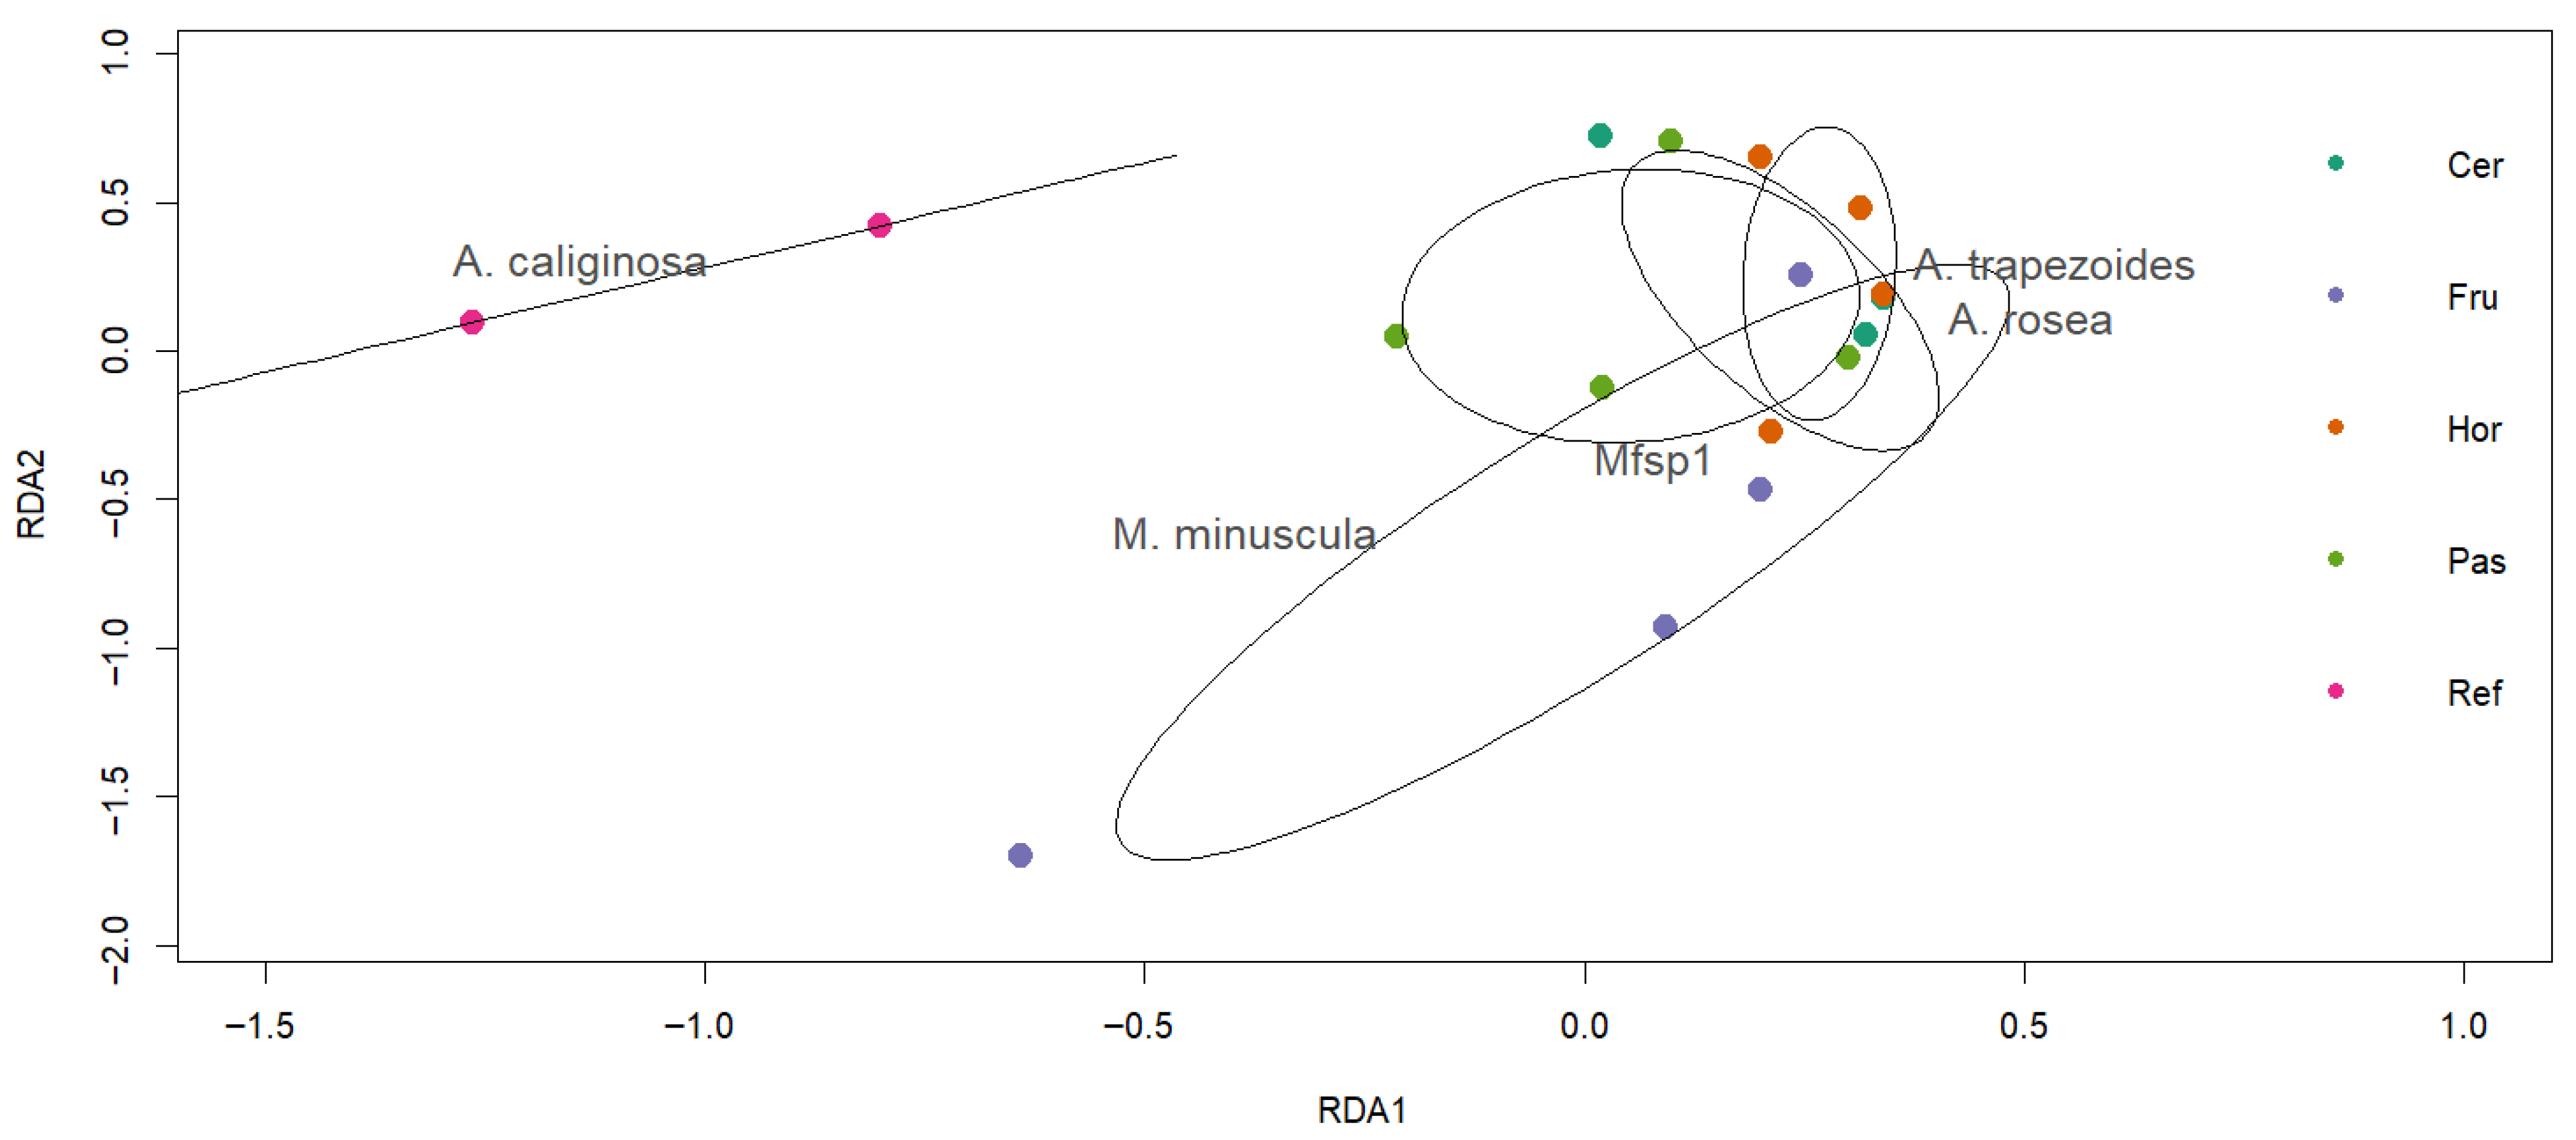
The species composition did not differ significantly among the land uses (PERMANOVA, F = 1.11, p = 0.37), although the land use explained 25.4% of the total variation, suggesting underlying trends. The RDA showed how this variation was distributed: the first two axes (RDA1 and RDA2, Figure 5) accounted for 93.5% of the variance attributable to the land use (RDA1 = 68%, RDA2 = 25.5%). In the ordination space, communities exhibited a partial overlap; however, a clear separation was observed between the reference soils and the agricultural uses, as well as between the fruit orchards, the cereal crops, and the horticulture plots. At the species level, the Haplotaxida morphotype and M. minuscula were associated with the fruit orchards, whereas A. caliginosa was linked to the reference soils.

3.2. Soil Properties

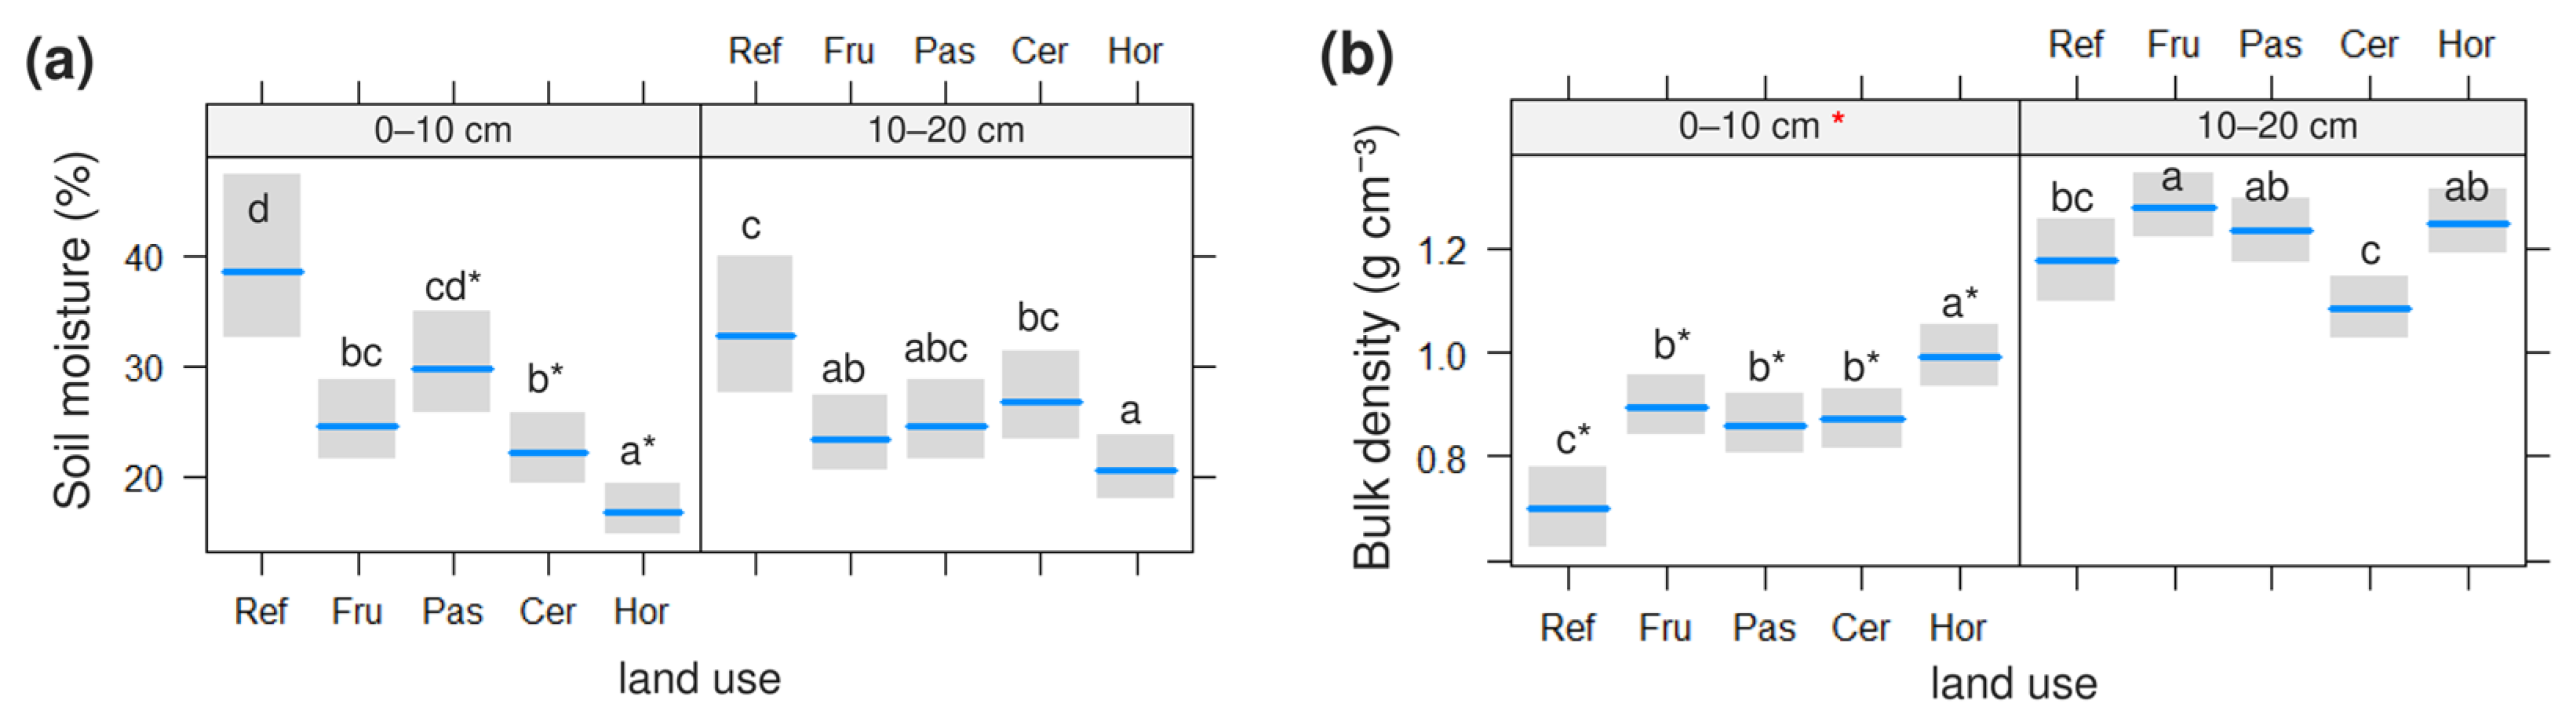
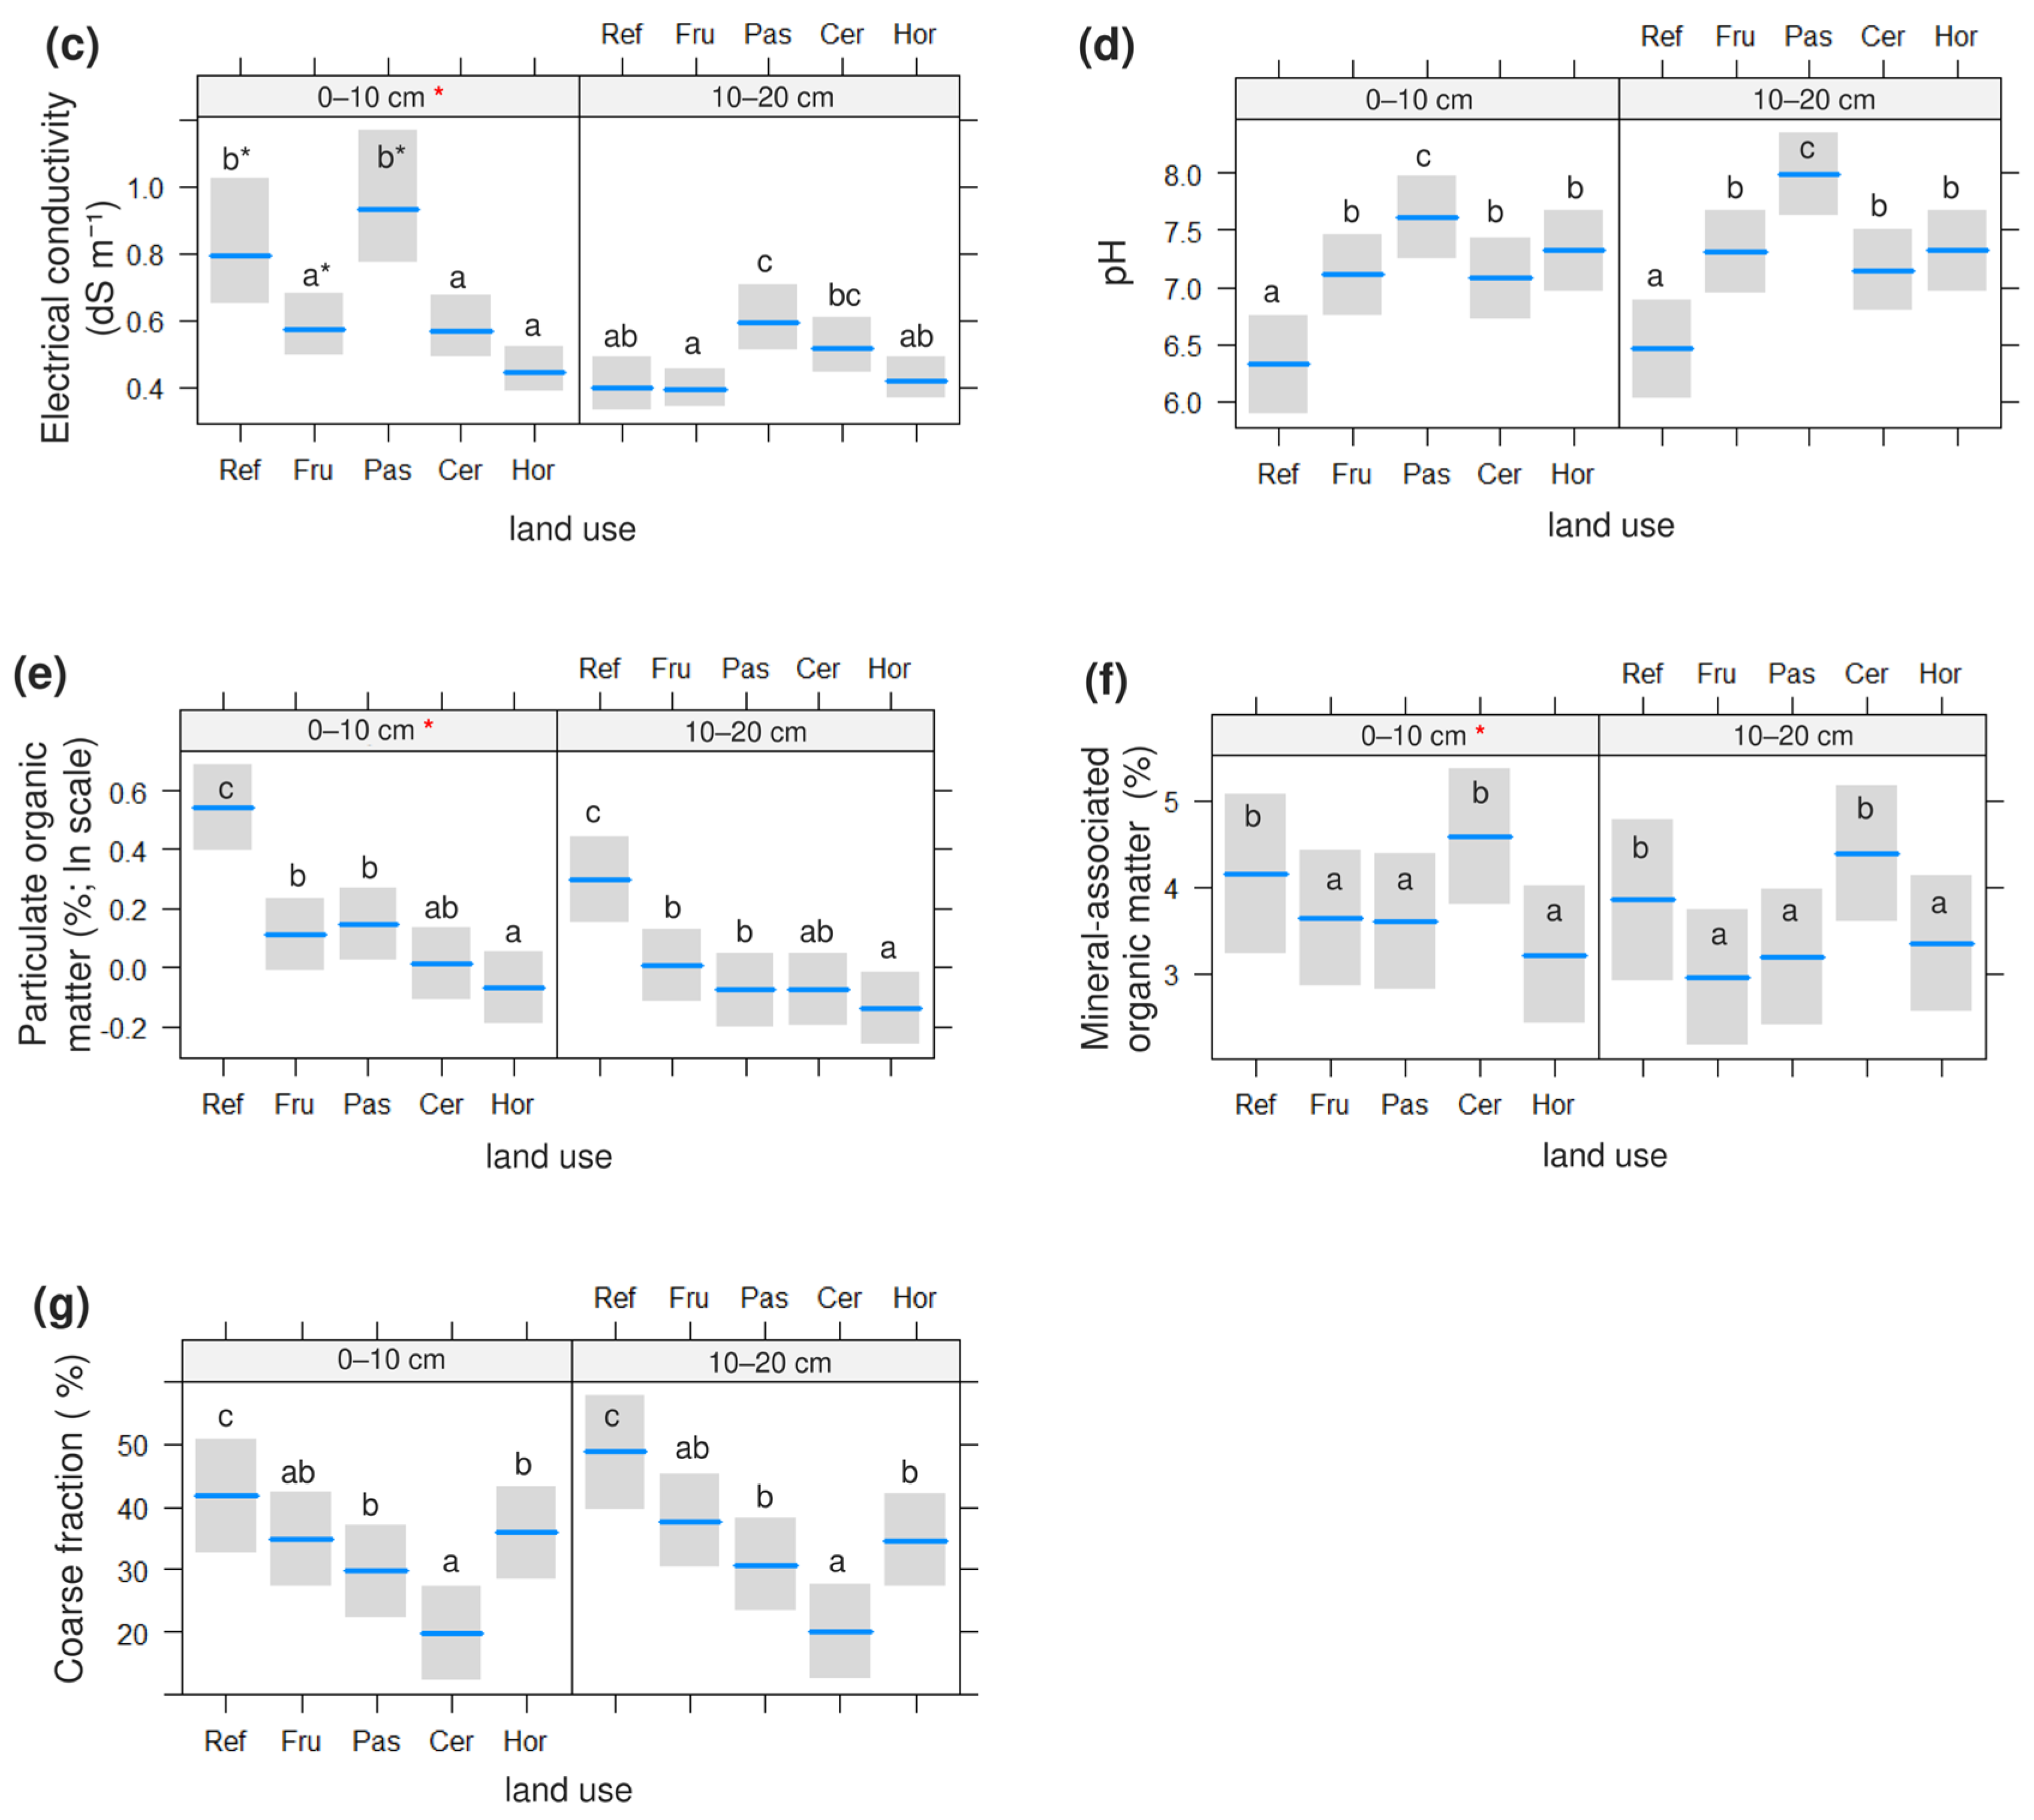
All the edaphic variables differed significantly among the land uses and, in most cases, between the soil depths. The mean (±SD) values are summarized in Table 4, while the effects of the land use and soil depth estimated by the GLMMs are reported in Tables S8–S17. The soil moisture was highest in the reference and pasture soils, intermediate in the fruit orchards, and lowest in the cereal crops and horticulture plots, which is a pattern that is broadly consistent for both depths. The bulk density was the highest in the horticulture plots and fruit orchards and the lowest in the reference soils. The electrical conductivity reached the highest values in the pasture and reference soils, followed by the cereal crops, while the fruit orchards and horticulture plots showed the lowest values. The soil pH exhibited a stable gradient in both depths, being more acidic in the reference soils and more alkaline in the pastures. The particulate organic matter was highest in the reference soils and lowest in the horticulture plots, whereas the mineral-associated organic matter was greater in the cereal crops and the reference soils than in the other land uses. The coarse fraction was the highest in the reference soils and the lowest in the cereal crops, showing a consistent pattern between the depths. The soil properties across the land uses and depths are shown in Figure 6.

3.3. Influence of Soil Properties on Earthworms

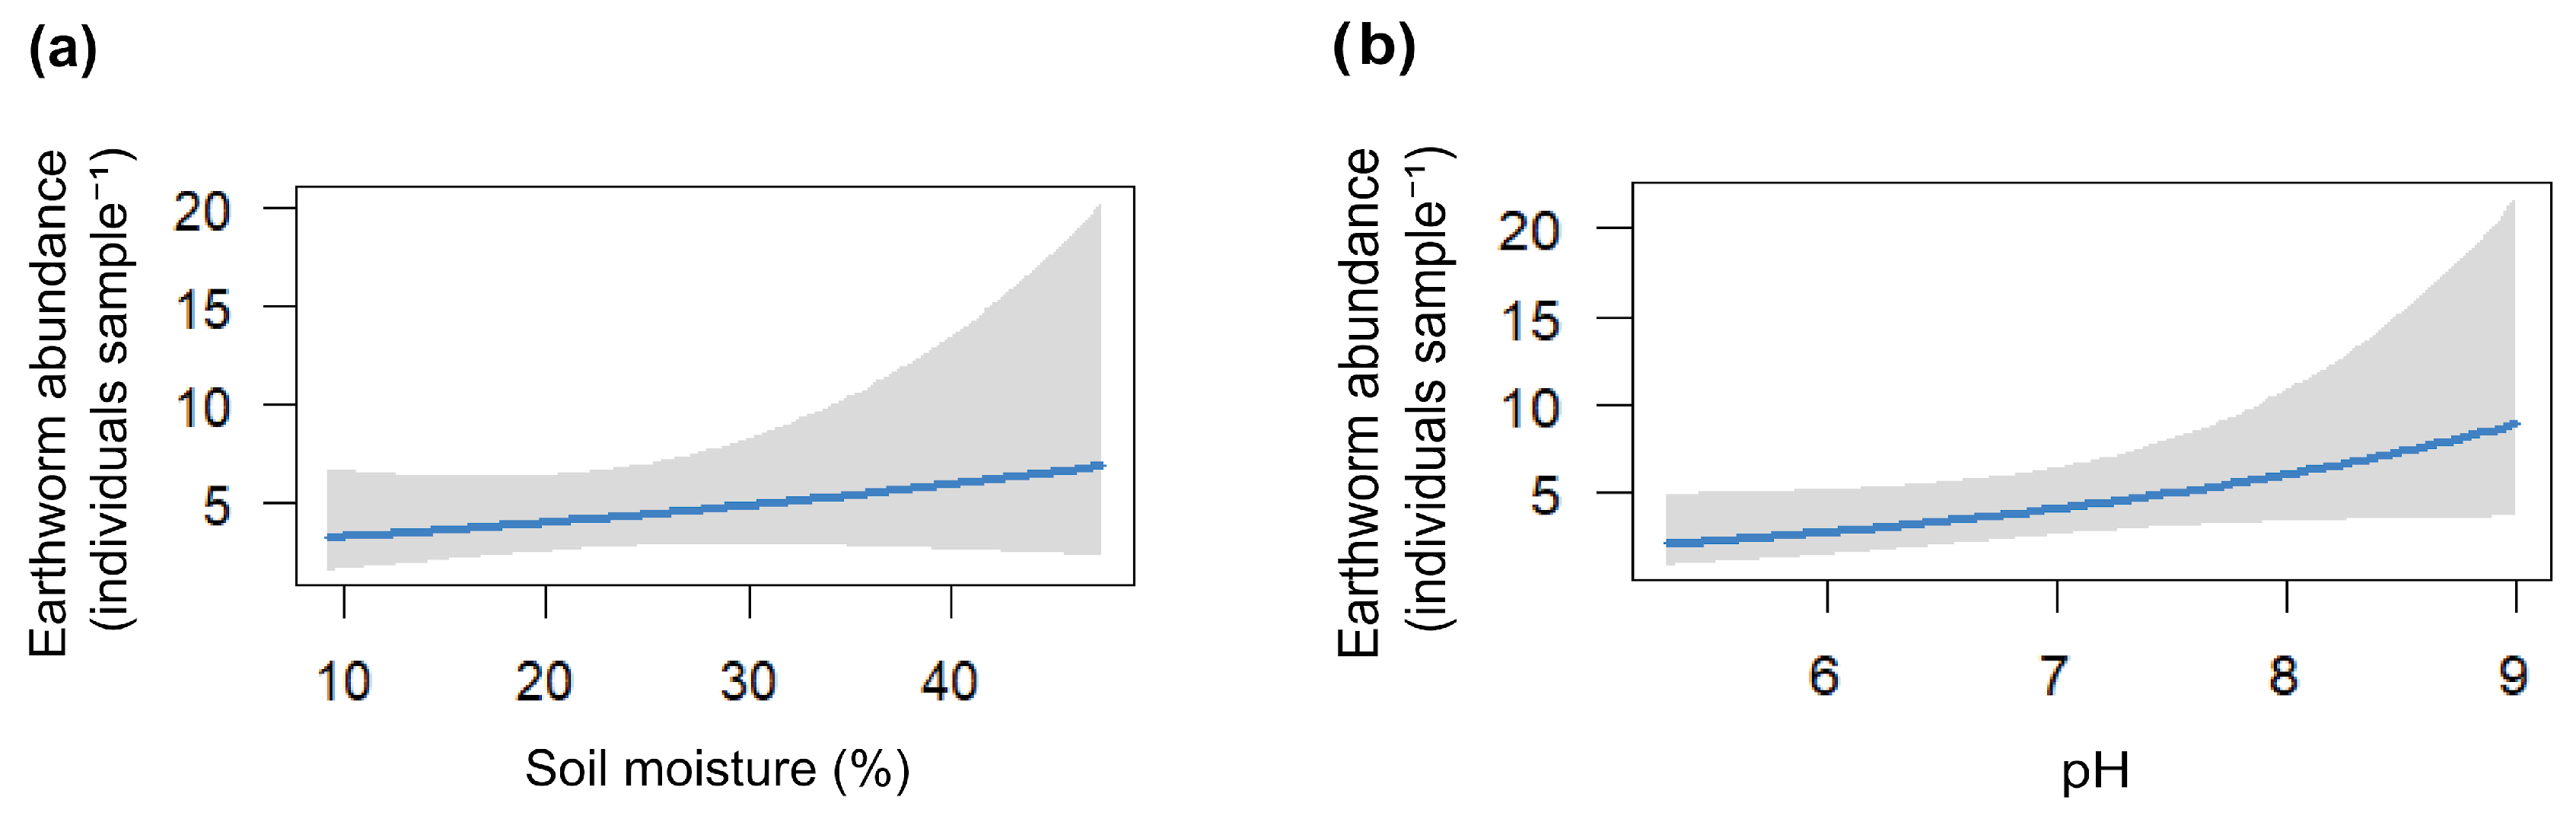
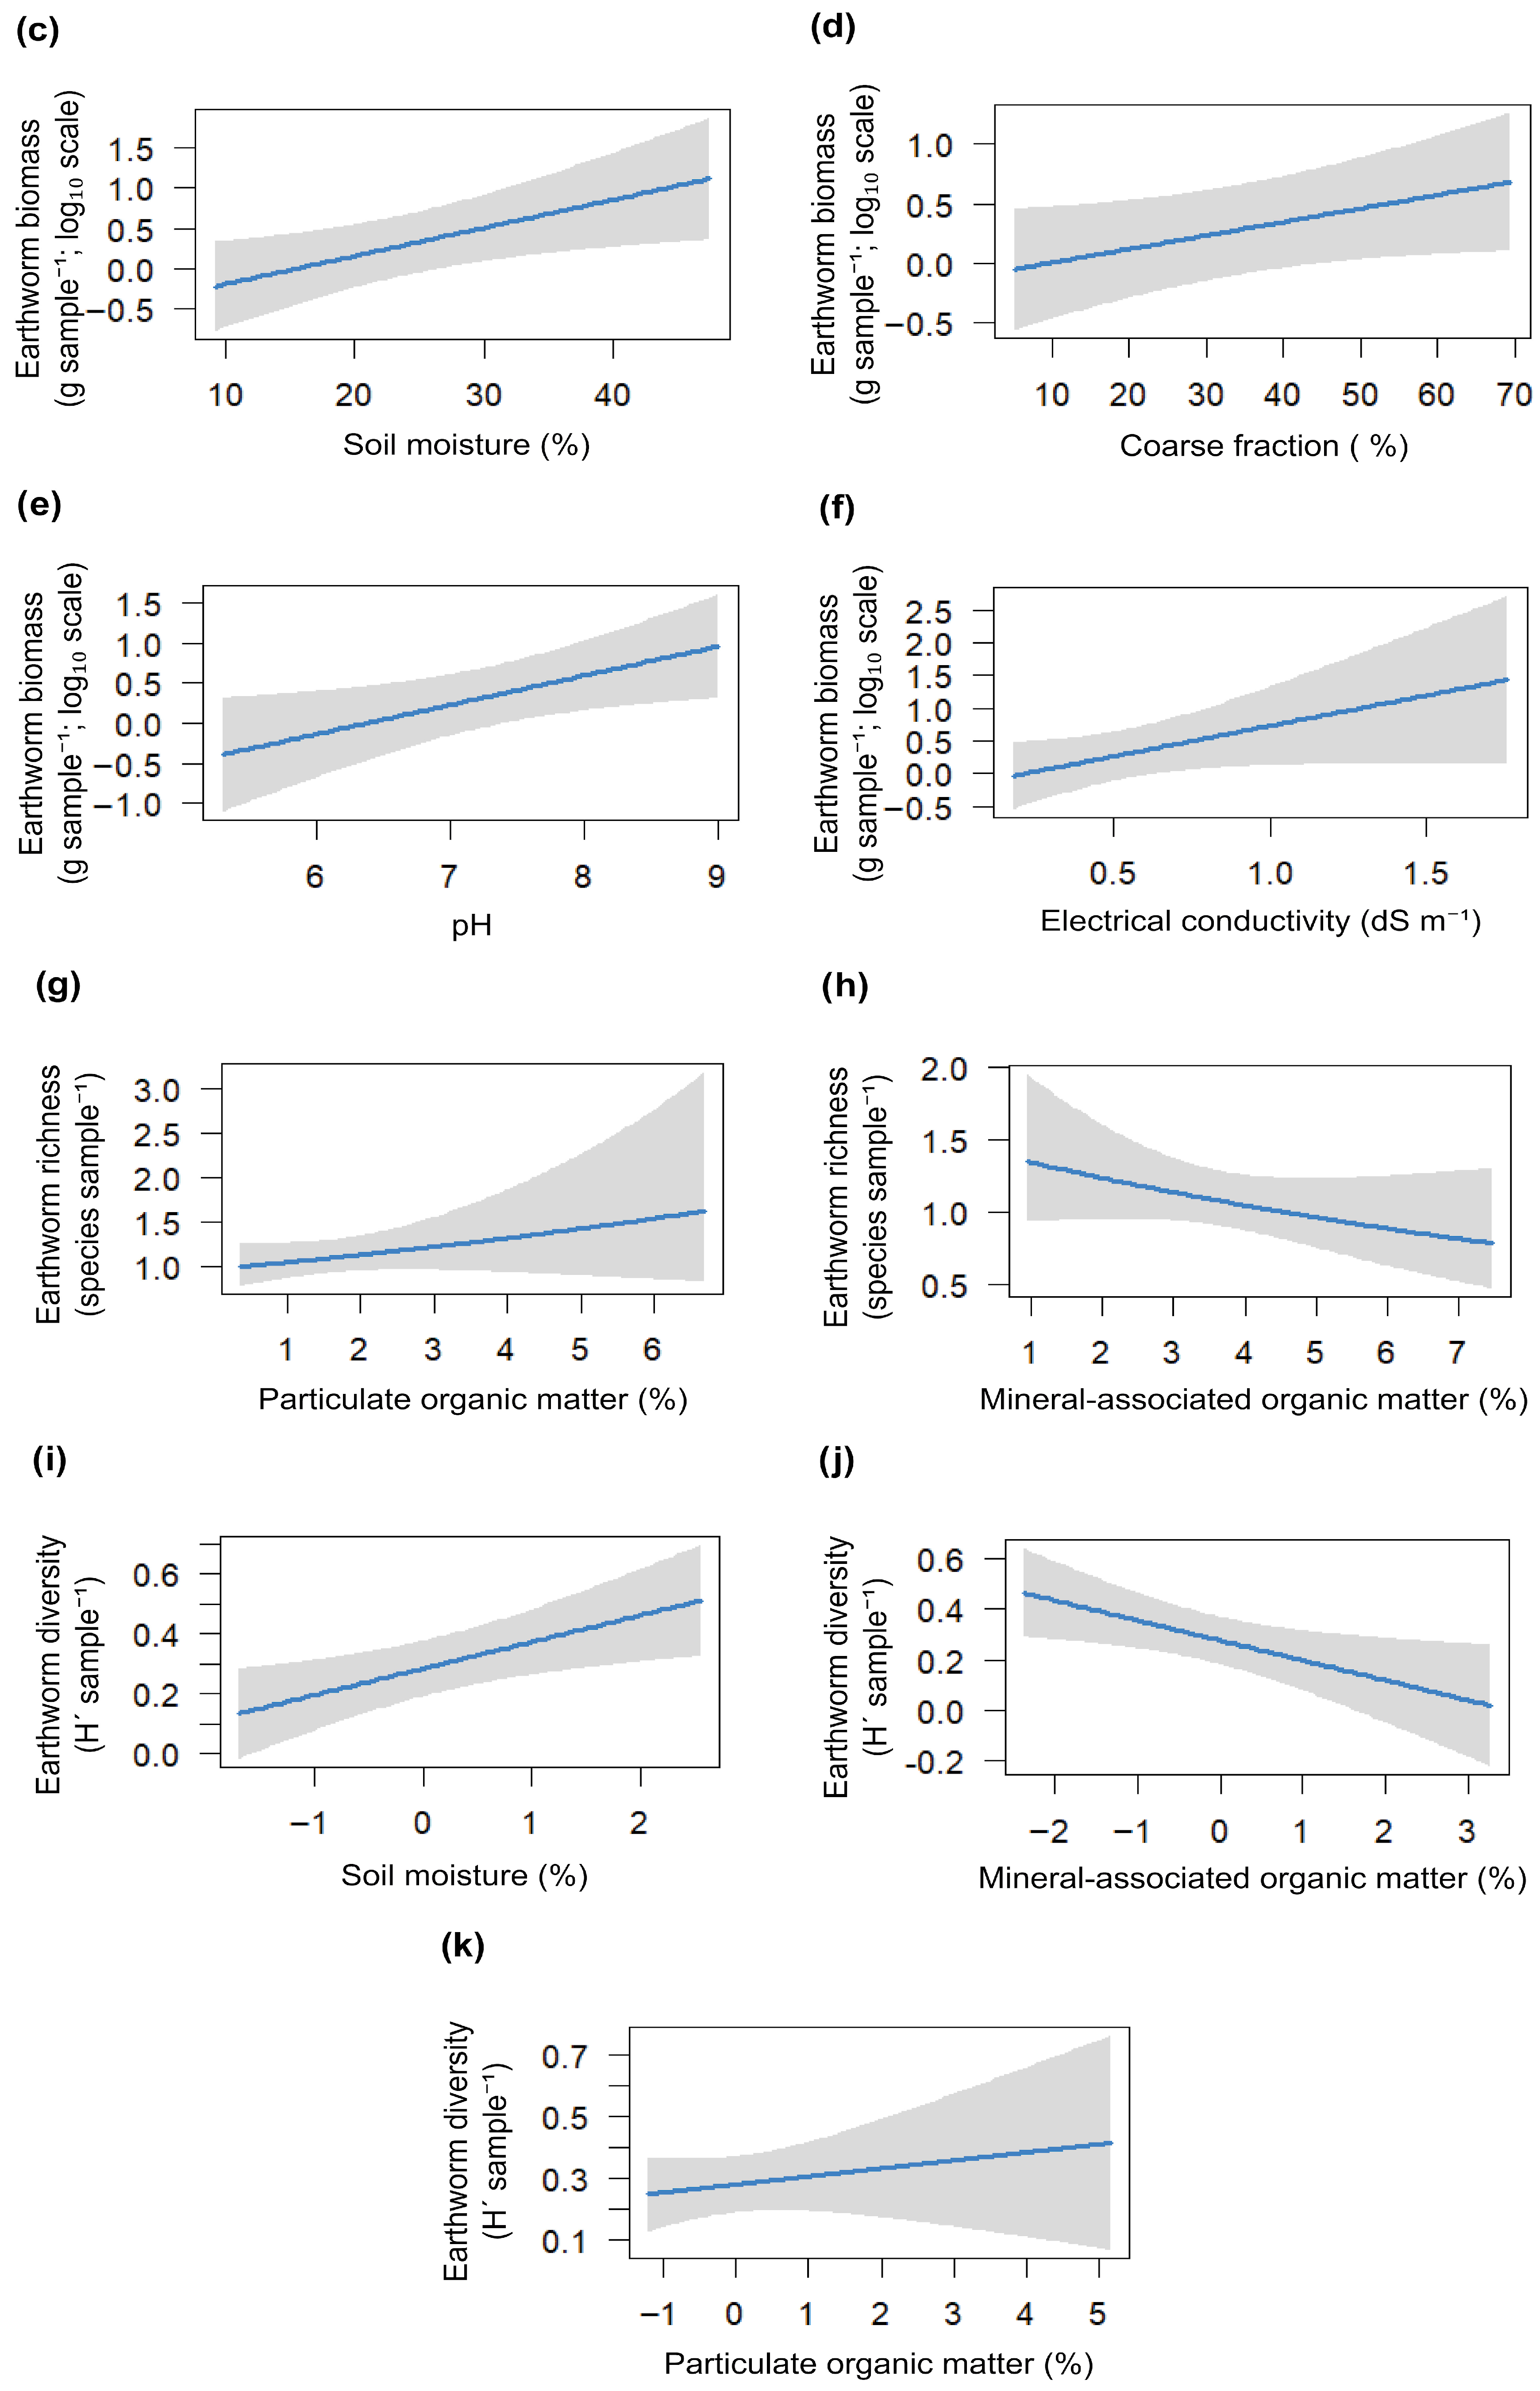
The relationships between the edaphic variables and earthworms that were derived from the multimodel inference analysis are summarized in Table 5 and Figure 7 (Table S17). The earthworm abundance was significantly and positively associated with the soil moisture and pH, whereas a similar trend was found for the EC, the POM, and the MAOM, although without statistical significance. On the other hand, the BD had a negative, non-significant effect. The earthworm biomass increased significantly with the EC, the CF, the SM, and the pH. The POM showed a positive, yet non-significant relationship with the biomass. The species richness increased significantly with the POM and decreased with the MAOM, while the BD exhibited a weak, non-significant negative trend. Finally, the diversity (H′) increased significantly with the SM and the POM, and it decreased significantly with the MAOM, whereas the effect of the BD was non-significant.

4. Discussion

The recently irrigated soils of the Lower Valley of the Negro River represent a striking example of human niche construction in a semi-arid landscape. This process involves deliberate environmental modification, creating novel ecological contexts that reshape selection pressures and drive community assembly [28,29,30]. The observed low regional (γ) earthworm species richness (five Lumbricidae species) and the complete dominance of the introduced taxa indicate that the current community was primarily assembled through anthropogenic introductions following irrigation, rather than natural dispersal. This pattern is consistent with the reports from regions that were naturally devoid of earthworms and subsequently colonized through human-mediated dispersal [31,32,57]. Specifically, Tiunov et al. [31] show that in previously earthworm-free regions of northeastern Europe and North America, species distributions are driven more by human activity and land use than by post-glacial dispersal history. Similarly, in irrigated arid agroecosystems of Morocco, Hallam et al. [32] found that earthworm occurrence—including the frequent detection of Aporrectodea. rosea and A. caliginosa—was strongly linked to localized irrigation inputs rather than to broad biogeographic patterns. In India, Suthar [57] also observed that human activities act as a key driver of earthworm invasion in arid lands, where exotic species are mainly associated with improved soil moisture conditions. In this context, our findings reinforce the view that human-mediated niche construction can effectively override the historical earthworm absence in arid landscapes by creating suitable conditions for colonization. The occurrence of Murchieona minuscula, the first record for Argentina, extends its known distribution in South America and further supports the role of human activity in shaping these novel communities. Its occurrence is restricted to reference soils, and the less intensive land use suggests a sensitivity to agricultural disturbance. However, the previous reports from conventional agriculture and post-fire habitats indicate some degree of ecological plasticity and colonization capacity [58,59,60,61]. In contrast, the dominance of A. rosea, present across all land uses, further confirms that generalist, disturbance-tolerant species prevail in communities under agricultural management [34]. This is consistent with the reports from other irrigated arid agroecosystems where A. rosea is among the most frequent taxa [32], reinforcing the impoverished and ecologically simplified nature of these assemblages.
Although plot-scale (α) richness did not differ significantly among the land uses, accumulated regional (γ) richness and diversity at the land-use scale showed a clear intensification gradient, declining from reference soils to annual crops. Compared to the reference soils, the γ richness remained unchanged in the fruit orchards, but declined by 25% in the pastures, and 50% in both the cereal and horticultural crops, while the γ diversity decreased by 22–66% along the same gradient. Together with the consistently high dominance across the land uses, this pattern strongly supports our hypothesis that land-use intensification acts as a strong environmental filter that simplifies earthworm assemblages and reduces regional diversity. However, in this system of recently established exotic communities, the land-use filter operates through a fundamentally different mechanism. Rather than simplifying pre-existing assemblages, it restricts the initial colonization, determining which species can establish themselves from the outset. Our results are consistent with the regional and global evidence documenting the decreasing biodiversity with increasing agricultural intensity [14,17,34,62,63,64] while highlighting a potentially generalizable assembly mechanism, which is specific to newly transformed ecosystems where communities are still being assembled. Additionally, the restriction in the colonization process explains the differential species distribution observed across the land-use gradient. Although the land uses did not differ significantly in community composition, they accounted for a substantial proportion of the total variation (25.4%). This suggests a biologically relevant structuring effect despite the high intra-group variability. The redundancy analysis illustrates this structuring effect, clearly separating the reference soils and fruit orchards from the more intensive land uses in the ordination space. This differentiation was driven mainly by the exclusive occurrence of M. minuscula and a Haplotaxida morphotype in these less intensive systems, as well as the dominance of A. caliginosa in the reference soils. Conversely, A. rosea and A. trapezoides occurred across all land uses, reflecting their wide ecological tolerance and generalist habits. Overall, these differential occurrence patterns among the land uses and the γ-diversity gradients described above reinforce the idea that vegetation cover and disturbance intensity act as key ecological filters shaping earthworm assemblages, even in recently established, exotic-dominated communities. The effects of land-use intensification on soil fauna have been previously studied [14,17,34,64], but our study underscores that in novel ecosystems, the identity of the colonizing pool, not just the loss of residents, determines the community outcomes.
Furthermore, the higher abundance that was recorded in the reference soils and in the land uses with permanent or semi-permanent vegetation cover (walnut orchards and pastures) supports our hypothesis that temporally stable habitats and reduced disturbance favor earthworm populations. These findings align with the previous studies documenting the positive effects of habitat persistence on earthworms [63,65,66]. Notably, abundances in reference soils and lower-intensity systems fall within the range typically reported for humid temperate regions [14], underscoring the profound habitat transformation that is achieved by irrigation in this semi-arid landscape. Conversely, the consistently lower values found in the cereal and horticultural crops reflect how intensive tillage, agrochemical inputs, and reduced organic inputs create suboptimal conditions for soil macrofauna [67,68]. The biomass largely followed the same trend, although it was intermediate in fruit orchards, more due to the dominance of small and medium-sized species, such as M. minuscula and A. rosea, than to a low number of individuals. The distinct vertical distribution observed in the cereal crops, with more individuals at 10–20 cm, reflects a behavioral response to resource depletion and microclimatic stress in surface horizons [69,70]. This vertical shift reduces the benefits of earthworm ecosystem engineering in the top 10 cm, potentially limiting the organic matter incorporation and structural improvement in the surface layer, which is critical for soil health and crop productivity.
As expected, soil properties mediated the influence of the land use on earthworms, acting as key environmental filters. The reference soils exhibited a combination of higher moisture and particulate organic matter (POM), lower bulk density (BD), and slightly more acidic pH, properties typically indicative of higher habitat suitability under minimal intervention [71,72,73,74]. The fruit orchards and pastures presented intermediate conditions, consistent with their lower disturbance levels and continuous vegetation cover [75,76]. However, in the pastures, the higher pH values and electrical conductivity differed from the reports where leguminous cover reduces salinity and alkalinity [77], likely reflecting the specific features of local soils and/or irrigation water quality. In contrast, the cereal and horticultural soils showed less favorable conditions for soil fauna (higher BD and lower moisture and POM) [74]. In the cereal crops, the elevated MAOM, comparable to that of the riparian reference sites, is probably attributable to finer soil texture (lower coarse fraction) rather than management practices [78,79]. This reflects the well-established relationship between silt and clay content and the formation of stable forms of OM. This physically driven pathway towards MAOM formation may help explain the low POM content observed in these intensive systems.
Furthermore, as hypothesized, multimodel inference indicates that the soil moisture, pH, and POM are the key drivers of earthworm communities in irrigated semi-arid landscapes. This finding is consistent with the previous results from diverse agroecosystems worldwide, confirming that these soil properties consistently shape earthworm distribution and abundance across biogeographic and climatic contexts [11,12,80]. In the studied systems, soil moisture emerged as the dominant driver of earthworm abundance, biomass, and diversity. This underscores that water availability is the primary constraint in this historically dry system and that irrigation is pivotal for sustaining earthworm colonization and persistence. In turn, the positive association between the POM and both species richness and diversity emphasizes the role of labile organic matter as a critical food resource and a key habitat component for earthworms in these transformed soils [23,81]. By contrast, the negative response of these community metrics to the MAOM likely reflects its inverse relationship with the POM in our study systems rather than a direct adverse effect. The positive relationships between the biomass and both the coarse fraction (CF) and the electrical conductivity (EC) suggest a potential functional trait divergence among the larger-bodied species that may facilitate niche partitioning [23]. Consequently, the land uses that sustain higher soil moisture and POM levels while preventing strong acidification, such as permanent and semi-permanent systems, foster more abundant and diverse earthworm communities. Given the bidirectional nature of the earthworm–soil interactions, these favorable soil conditions may be further reinforced through positive feedback loops as populations establish themselves, thereby enhancing the organic matter cycling and the soil structure formation.
While this study represents a single-season snapshot, it provides an important baseline for understanding earthworm assembly in recently irrigated systems. Given the scarcity of prior data in semi-arid Patagonia, our findings offer valuable evidence of early colonization patterns. Future long-term monitoring across multiple seasons will be essential to capture the temporal dynamics and their ecological consequences.

5. Conclusions

This study provides the first characterization of earthworm communities in the Lower Valley of the Negro River, a recently irrigated semi-arid environment that now functions as a human-constructed ecological island. The low richness and the complete dominance of exotic species reflect a newly assembled community, shaped by human-mediated dispersal rather than natural biogeographic processes. In this system, the land use intensity, mediated by its effects on soil properties, acted as a major environmental filter determining the earthworm communities. A particularly novel aspect is the directionality of this filter, whereas the land-use intensification in long-established agroecosystems typically simplifies the pre-existing communities by excluding the sensitive species, as here it primarily restricts the initial assembly process. The intensive land uses created edaphic conditions that filtered the potential colonizers, allowing the establishment of only a subset of highly tolerant lumbricid species (e.g., A. rosea and A. trapezoides), resulting in extremely simplified communities. In contrast, the less intensive uses, with lower disturbance and greater habitat stability, presented a weaker filter, allowing a broader subset of species, including more sensitive taxa such as M. minuscula, to successfully establish themselves. Therefore, the diversity patterns are not limited by local extinctions, but by restricted colonization opportunities during early community development.
Despite the low species diversity that was found, earthworm abundances in the less intensive land uses matched those typical of wetter regions [35,74,82]. This provides evidence that even simple communities, entirely composed of exotic species, can significantly improve soil functioning following colonization. In the absence of native earthworms, these exotic species fulfill a critical functional role by promoting soil aggregation, organic matter decomposition, and nutrient cycling in these water-limited irrigated systems.
From a management perspective, our findings draw attention to the critical importance of adopting management strategies that ensure habitat continuity and minimize soil disturbance, such as the cultivation of walnut orchards and pastures in permanent or semi-permanent rotations. Such practices not only favor earthworm communities but also strengthen the resilience and long-term sustainability of irrigated agroecosystems in semi-arid contexts.

Supplementary Materials

The following supporting information can be downloaded at https://www.mdpi.com/article/10.3390/soilsystems10040048/s1, Supplementary Materials Figure S1, Tables S1–S18 (PDF). Figure S1: Earthworm field sampling and processing: (a) soil pit excavation and monolith extraction, (b) hand-sorting, (c) recovered specimen, (d) representative individual immediately after collection, Table S1: Effects of land use and soil depth on earthworm abundance, as estimated by a generalized linear mixed model (GLMM), Table S2: Effects of land use and soil depth on earthworm abundance: post-hoc pairwise comparisons (Tukey/Sidak-adjusted), Table S3: Effects of land use and soil depth on earthworm biomass, as estimated by a generalized linear mixed model (GLMM), Table S4: Effects of land use and soil depth on earthworm biomass: post-hoc pairwise comparisons (Tukey/Sidak-adjusted), Table S5: Effects of land use and soil depth on earthworm species richness, as estimated by a generalized linear mixed model (GLMM), Table S6: Effects of land use and soil depth on Shannon diversity (H′), as estimated by a generalized linear mixed model (GLMM), Table S7: Effects of land use and soil depth on Berger–Parker dominance, as estimated by a generalized linear mixed model (GLMM), Table S8: Effects of land use and soil depth on soil moisture (SM; %), as estimated by a generalized linear mixed model (GLMM), Table S9: Effects of land use and soil depth on soil moisture (SM; %): post-hoc pairwise comparisons (Tukey/Sidak-adjusted), Table S10: Effects of land use and soil depth on bulk density (BD; g cm−3), as estimated by a linear mixed model (LMM), Table S11: Effects of land use and soil depth on bulk density (BD; g cm−3): post-hoc pairwise comparisons (Tukey/Sidak-adjusted), Table S12: Effects of land use and soil depth on soil pH, as estimated by a linear mixed model (LMM), Table S13: Effects of land use and soil depth on electrical conductivity (EC; dS m−1), as estimated by a generalized linear mixed model (GLMM), Table S14: Effects of land use and soil depth on electrical conductivity (EC; dS m−1): post-hoc pairwise comparisons (Tukey/Sidak-adjusted), Table S15: Effects of land use and soil depth on particulate organic matter (POM; %), as estimated by a linear mixed model (LMM), Table S16: Effects of land use and soil depth on mineral-associated organic matter (MAOM; %), as estimated by a linear mixed model (LMM), Table S17: Effects of land use and soil depth on coarse fraction (CF; >53 µm; % of oven-dry soil mass), as estimated by a linear mixed model (LMM), Table S18: Best models explaining the effects of soil physicochemical properties on earthworm abundance, biomass, species richness, and Shannon diversity, according to GLMM.

Author Contributions

Conceptualization, J.C.B., J.L.B., A.D., R.S.M. and M.Q.; methodology, J.C.B., J.L.B., A.D. and M.Q.; software, M.Q.; validation, J.L.B. and M.Q.; formal analysis, J.C.B., J.L.B., A.D. and M.Q.; investigation, J.L.B., R.S.M. and M.Q.; data curation, M.Q.; writing—original draft preparation, J.C.B., J.L.B., A.D. and M.Q.; writing—review and editing, J.C.B., J.L.B., A.D. and M.Q.; visualization, J.L.B. and M.Q.; funding acquisition, J.C.B., J.L.B. and R.S.M. The authors are listed alphabetically within each contribution. All authors have read and agreed to the published version of the manuscript.

Funding

This research was funded by the Universidad Nacional de Río Negro (UNRN), grant number 40-C-1201. This work was supported by Research Project 40-C-1062 of the National University of Río Negro (UNRN) and by the first author’s PhD fellowship from the National Scientific and Technical Research Council (CONICET), whose support is essential for the development of public science in Argentina.

Institutional Review Board Statement

Not applicable.

Informed Consent Statement

Not applicable.

Data Availability Statement

The original data presented in this study are openly available in the institutional repository of the Universidad Nacional de Río Negro (RID-UNRN) at https://rid.unrn.edu.ar/handle/20.500.12049/14093 (accessed on 12 March 2026).

Acknowledgments

We thank everyone who contributed to the completion of this work, especially the technician José Luis Román, Ana Paula Sylvester, and Joaquín Elizondo for their valuable assistance during field sampling and sample processing. We also acknowledge the Valle Inferior del Río Negro Agricultural Experiment Station of INTA for the logistical support provided and UNRN faculty researchers Silvia Torres Robles and Martín Luna for lending their equipment. During the preparation of this manuscript, the author(s) used ChatGPT (OpenAI; model GPT-5.2 Thinking) for the purposes of translating sections of the text and performing English language editing to improve the clarity, concision, and consistency of scientific terminology and style. The authors have reviewed and edited the output and take full responsibility for the content of this publication.

Conflicts of Interest

The authors declare no conflicts of interest.

Abbreviations

The following abbreviations are used in this manuscript:
VIRNValle Inferior del Río Negro (Lower Valley of the Negro River)
EUExperimental unit
SPSampling point
SMSoil moisture
BDBulk density
ECElectrical conductivity
POMParticulate organic matter
MAOMMineral-associated organic matter
CFCoarse fraction
GLMMGeneralized linear mixed model
LMMLinear mixed model
RDARedundancy analysis
PERMANOVAPermutational multivariate analysis of variance
AICAkaike information criterion
AICcCorrected Akaike information criterion
RIRelative importance
RefReference (riparian) sites
FruFruit orchards
PasPastures
CerCereal crops
HorHorticulture

References

  1. Jones, C.G.; Lawton, J.H.; Shachak, M. Organisms as Ecosystem Engineers. In Ecosystem Management: Selected Readings; Samson, F.B., Knopf, F.L., Eds.; Springer: New York, NY, USA, 1994; pp. 130–147. ISBN 978-1-4612-4018-1. [Google Scholar]
  2. Lavelle, P.; Spain, A.; Blouin, M.; Brown, G.; Decaëns, T.; Grimaldi, M.; Jiménez, J.J.; McKey, D.; Mathieu, J.; Velasquez, E. Ecosystem Engineers in a Self-Organized Soil: A Review of Concepts and Future Research Questions. Soil Sci. 2016, 181, 91–109. [Google Scholar] [CrossRef] [Scilit]
  3. Lavelle, P.; Decaëns, T.; Aubert, M.; Barot, S.; Blouin, M.; Bureau, F.; Margerie, P.; Mora, P.; Rossi, J.-P. Soil Invertebrates and Ecosystem Services. Eur. J. Soil Biol. 2006, 42, S3–S15. [Google Scholar] [CrossRef] [Scilit]
  4. Decaëns, T.; Bureau, F.; Margerie, P. Earthworm Communities in a Wet Agricultural Landscape of the Seine Valley (Upper Normandy, France): The 7th International Symposium on Earthworm Ecology Cardiff Wales 2002. Pedobiologia 2003, 47, 479–489. [Google Scholar] [CrossRef] [Scilit]
  5. Decaëns, T. Macroecological Patterns in Soil Communities. Glob. Ecol. Biogeogr. 2010, 19, 287–302. [Google Scholar] [CrossRef] [Scilit]
  6. Edwards, C.A.; Thompson, A.R. Pesticides and the Soil Fauna. In Residue Reviews: Residues of Pesticides and Other Contaminants in the Total Environment; Gunther, F.A., Gunther, J.D., Eds.; Springer: New York, NY, USA, 1973; pp. 1–79. ISBN 978-1-4615-8493-3. [Google Scholar]
  7. Postma-Blaauw, M.B.; de Goede, R.G.M.; Bloem, J.; Faber, J.H.; Brussaard, L. Agricultural Intensification and De-Intensification Differentially Affect Taxonomic Diversity of Predatory Mites, Earthworms, Enchytraeids, Nematodes and Bacteria. Appl. Soil Ecol. 2012, 57, 39–49. [Google Scholar] [CrossRef] [Scilit]
  8. Tsiafouli, M.A.; Thébault, E.; Sgardelis, S.P.; de Ruiter, P.C.; van der Putten, W.H.; Birkhofer, K.; Hemerik, L.; de Vries, F.T.; Bardgett, R.D.; Brady, M.V.; et al. Intensive Agriculture Reduces Soil Biodiversity across Europe. Glob. Change Biol. 2015, 21, 973–985. [Google Scholar] [CrossRef] [Scilit] [PubMed]
  9. Kibblewhite, M.; Ritz, K.; Swift, M.J. Soil Health in Agricultural Systems. Philos. Trans. R. Soc. B Biol. Sci. 2008, 363, 685–701. [Google Scholar] [CrossRef] [Scilit]
  10. Marichal, R.; Grimaldi, M.; Feijoo M., A.; Oszwald, J.; Praxedes, C.; Ruiz Cobo, D.H.; del Pilar Hurtado, M.; Desjardins, T.; da Silva Junior, M.L.; da Silva Costa, L.G.; et al. Soil Macroinvertebrate Communities and Ecosystem Services in Deforested Landscapes of Amazonia. Appl. Soil Ecol. 2014, 83, 177–185. [Google Scholar] [CrossRef] [Scilit]
  11. Ivask, M.; Kuu, A.; Truu, M.; Truu, J. The Effect of Soil Type and Soil Moisture on Earthworm Communities. Agraarteadus 2006, 17, 3–33. [Google Scholar]
  12. Domínguez, A.; Bedano, J.C. Earthworm and Enchytraeid Co-Occurrence Pattern in Organic and Conventional Farming: Consequences for Ecosystem Engineering. Soil Sci. 2016, 181, 148. [Google Scholar] [CrossRef] [Scilit]
  13. Torppa, K.A.; Castaño, C.; Glimskär, A.; Skånes, H.; Klinth, M.; Roslin, T.; Taylor, A.R.; Viketoft, M.; Clemmensen, K.E.; Maaroufi, N.I. Soil Moisture and Fertility Drive Earthworm Diversity in North Temperate Semi-Natural Grasslands. Agric. Ecosyst. Environ. 2024, 362, 108836. [Google Scholar] [CrossRef] [Scilit]
  14. Phillips, H.R.P.; Guerra, C.A.; Bartz, M.L.C.; Briones, M.J.I.; Brown, G.; Crowther, T.W.; Ferlian, O.; Gongalsky, K.B.; van den Hoogen, J.; Krebs, J.; et al. Global Distribution of Earthworm Diversity. Science 2019, 366, 480–485. [Google Scholar] [CrossRef] [Scilit]
  15. Lal, R. Restoring Soil Quality to Mitigate Soil Degradation. Sustainability 2015, 7, 5875–5895. [Google Scholar] [CrossRef] [Scilit]
  16. Maestre, F.T.; Le Bagousse-Pinguet, Y.; Delgado-Baquerizo, M.; Eldridge, D.J.; Saiz, H.; Berdugo, M.; Gozalo, B.; Ochoa, V.; Guirado, E.; García-Gómez, M.; et al. Grazing and Ecosystem Service Delivery in Global Drylands. Science 2022, 378, 915–920. [Google Scholar] [CrossRef] [Scilit]
  17. Lavelle, P.; Mathieu, J.; Spain, A.; Brown, G.; Fragoso, C.; Lapied, E.; De Aquino, A.; Barois, I.; Barrios, E.; Barros, M.E.; et al. Soil Macroinvertebrate Communities: A World-Wide Assessment. Glob. Ecol. Biogeogr. 2022, 31, 1261–1276. [Google Scholar] [CrossRef] [Scilit]
  18. Godagnone, R.E.; Bran, D. (Eds.) Inventario Integrado de Los Recursos Naturales de La Provincia de Rio Negro: Geología, Hidrogeología, Geomorfología, Suelos, Clima, Vegetación y Fauna; Instituto Nacional de Tecnología Agropecuaria Provincia de Río Negro, INTA: Buenos Aires, Argentina, 2008. [Google Scholar]
  19. Martín, D.M. Información Técnica N° 27: Estadísticas Climáticas del Valle de Viedma; E.E.A. Valle Inferior (Convenio Provincia de Río Negro–INTA): Viedma, Argentina, 2009. [Google Scholar]
  20. Torres Robles, S.S.; Arturi, M.F.; Contreras, C.; Peter, G.; Zeberio, J.M. Variaciones geográficas de la estructura y composición de la vegetación leñosa en el límite entre el espinal y el monte en el Noreste de la Patagonia (Argentina). Bol. Soc. Argent. Bot. 2015, 50, 209–215. [Google Scholar] [CrossRef] [Scilit]
  21. Arana, M.; Natale, E.; Ferretti, N.; Romano, G.; Oggero, A.; Martínez, G.; Posadas, P.; Morrone, J. Esquema Biogeográfico de La República Argentina; Opera Lilloana; Fundación Miguel Lillo: San Miguel de Tucumán, Argentina, 2021; ISBN 978-950-668-039-8. [Google Scholar]
  22. Morrone, J.J.; Escalante, T.; Rodríguez-Tapia, G.; Carmona, A.; Arana, M.; Mercado-Gómez, J.D. Biogeographic Regionalization of the Neotropical Region: New Map and Shapefile. An. Acad. Bras. Ciências 2022, 94, e20211167. [Google Scholar] [CrossRef] [Scilit]
  23. Krediet, A.; Buskermolen, K.; Ellers, J.; Berg, M.P. Soil Humidity Determines Earthworm Weight to Surface Ratio. SSRN [Preprint]. 2025. Available online: https://papers.ssrn.com/sol3/papers.cfm?abstract_id=5104515 (accessed on 15 March 2026).
  24. Schindler, H. Historia del Valle Inferior del Río Negro; Nota Técnica; Universidad Argentina de la Empresa (UADE): Buenos Aires, Argentina, 2013; Available online: https://www.scribd.com/document/521714632/Schindler-2013-Historia-VIRN (accessed on 29 December 2025).
  25. Reinoso, L.G. Efecto de La Intensificación Agrícola Sobre Las Propiedades Físicas de Los Suelos de La Región Hortícola Del Valle Inferior (Río Negro). Master’s Thesis, Universidad Nacional de La Plata, La Plata, Argentina, 2014. [Google Scholar]
  26. Fernández-Cirelli, A.; Arumí, J.L.; Rivera, D.; Boochs, P.W. Environmental Effects of Irrigation in Arid and Semi-Arid Regions. Chil. J. Agric. Res. 2009, 69, 27–40. [Google Scholar] [CrossRef] [Scilit]
  27. Frene, J.P.; Faggioli, V.; Covelli, J.; Reyna, D.; Gabbarini, L.A.; Sobrero, P.; Ferrari, A.; Gutierrez, M.; Wall, L.G. Agriculture by Irrigation Modifies Microbial Communities and Soil Functions Associated With Enhancing C Uptake of a Steppe Semi-Arid Soil in Northern Patagonia. Front. Soil Sci. 2022, 2, 835849. [Google Scholar] [CrossRef] [Scilit]
  28. Laland, K.N.; Odling-Smee, J.; Feldman, M.W. Cultural Niche Construction and Human Evolution. J. Evol. Biol. 2001, 14, 22–33. [Google Scholar] [CrossRef] [Scilit] [PubMed]
  29. Kendal, J.; Tehrani, J.J.; Odling-Smee, J. Human Niche Construction in Interdisciplinary Focus. Philos. Trans. R. Soc. B Biol. Sci. 2011, 366, 785–792. [Google Scholar] [CrossRef] [Scilit] [PubMed]
  30. Boivin, N.L.; Zeder, M.A.; Fuller, D.Q.; Crowther, A.; Larson, G.; Erlandson, J.M.; Denham, T.; Petraglia, M.D. Ecological Consequences of Human Niche Construction: Examining Long-Term Anthropogenic Shaping of Global Species Distributions. Proc. Natl. Acad. Sci. USA 2016, 113, 6388–6396. [Google Scholar] [CrossRef] [Scilit] [PubMed]
  31. Tiunov, A.V.; Hale, C.M.; Holdsworth, A.R.; Vsevolodova-Perel, T.S. Invasion Patterns of Lumbricidae into the Previously Earthworm-Free Areas of Northeastern Europe and the Western Great Lakes Region of North America. In Biological Invasions Belowground: Earthworms as Invasive Species; Hendrit, P.F., Ed.; Springer: Dordrecht, The Netherlands, 2006; pp. 23–34. ISBN 978-1-4020-5429-7. [Google Scholar]
  32. Hallam, J.; Abail, Z.; Benmrich, A.M.; Bouamair, A.; Lahlali, M. Earthworm Biodiversity in Morocco: First Survey of Earthworm Richness, Diversity and Distribution in the Souss-Massa Region. Zootaxa 2022, 5213, 269–278. [Google Scholar] [CrossRef] [Scilit]
  33. Chiappero, M.F.; Rossetti, M.R.; Moreno, M.L.; Pérez-Harguindeguy, N. A Global Meta-Analysis Reveals a Consistent Reduction of Soil Fauna Abundance and Richness as a Consequence of Land Use Conversion. Sci. Total Environ. 2024, 946, 173822. [Google Scholar] [CrossRef] [Scilit] [PubMed]
  34. Decaëns, T.; Margerie, P.; Aubert, M.; Hedde, M.; Bureau, F. Assembly Rules within Earthworm Communities in North-Western France—A Regional Analysis. Appl. Soil Ecol. 2008, 39, 321–335. [Google Scholar] [CrossRef] [Scilit]
  35. Rodríguez, M.P.; Domínguez, A.; Bedano, J.C. Large-Scale Organic Farming Enhances Soil Properties and Earthworm Communities in Relation to Conventional Farming in the Pampas Region of Argentina. Appl. Soil Ecol. 2025, 206, 105815. [Google Scholar] [CrossRef] [Scilit]
  36. Instituto Geográfico Nacional. Cartografía Base 1:250,000 (SIG 250). Available online: https://www.ign.gob.ar/NuestrasActividades/InformacionGeoespacial/CapasSIG (accessed on 15 October 2025).
  37. DIVA-GIS Free Spatial Data ARG_wat. Available online: https://diva-gis.org/data.html (accessed on 20 October 2025).
  38. ISO 23611-1:2018; Soil Quality—Sampling of Soil Invertebrates—Part 1: Hand-Sorting and Extraction of Earthworms. International Organization for Standardization: Geneva, Switzerland, 2018.
  39. Righi, G. Sobre a Família Glossoscolecidae (Oligochaeta) No Brasil. Arq. Zool. 1971, 20, 1–95. [Google Scholar] [CrossRef] [Scilit]
  40. Mischis, C.C. Las Lombrices de Tierra (Annelida, Oligochaeta) de La Provincia de Cordoba, Argentina. Boletín de la Academia Nacional de Ciencias. 1991. Available online: https://pascal-francis.inist.fr/vibad/index.php?action=getRecordDetail&idt=6466715 (accessed on 23 December 2025).
  41. de Michis, C.C.; Moreno, A.G. Taxonomía de Oligoquetos: Criterios y Metodologías; University Teaching Material; Universidad Nacional de Córdoba: Córdoba, Argentina, 1999. [Google Scholar]
  42. Blakemore, R.J. Cosmopolitan Earthworms: An Eco-Taxonomic Guide to the Peregrine Species of the World; Verm Ecology: Kippax, ACT, Australia, 2002. [Google Scholar]
  43. Christoffersen, M.L. A Catalogue of the Ocnerodrilidae (Annelida, Oligochaeta) from South America. Ital. J. Zool. 2008, 75, 97–107. [Google Scholar] [CrossRef] [Scilit]
  44. Momo, F.R.; Falco, L.B. Biología y Ecología de La Fauna Del Suelo; Imago Mundi: Buenos Aires, Argentina, 2009. [Google Scholar]
  45. James, S.W.; Bartz, M.; Brown, G.G. Apostila Curso de Ecologia e Taxonomia de Minhocas; ELAETAO: Curitiba, Brazil, 2015; 30p. [Google Scholar]
  46. Galantini, J.A.; Suñer, L. Las Fracciones Orgánicas Del Suelo: Análisis En Los Suelos de La Argentina. AgriScientia 2008, 25, 41–55. [Google Scholar] [CrossRef] [Scilit]
  47. Davies, B. Loss-on Ignition as an Estimate of Soil Organic Matter. Soil Sci. Soc. Am. J. 1974, 38, 150–151. [Google Scholar] [CrossRef] [Scilit]
  48. Brooks, M.; Kristensen, K.; van Benthem, K.; Magnusson, A.; Berg, C.; Nielsen, A.; Skaug, H.; Mächler, M.; Bolker, B. glmmTMB Balances Speed and Flexibility Among Packages for Zero-Inflated Generalized Linear Mixed Modeling. R J. 2017, 9, 378–400. [Google Scholar] [CrossRef] [Scilit]
  49. Harting, F. DHARMa: Residual Diagnostics for Hierarchical (Multi-Level/Mixed) Regression Models. In CRAN Contributed Packages; CRAN; R Foundation for Statistical Computing: Vienna, Austria, 2022. [Google Scholar] [CrossRef] [Scilit]
  50. van Buuren, S.; Groothuis-Oudshoorn, K. Mice: Multivariate Imputation by Chained Equations in R. J. Stat. Softw. 2011, 45, 1–67. [Google Scholar] [CrossRef] [Scilit]
  51. Oksanen, J.; Kindt, R.; Legendre, P.; O’Hara, B.; Stevens, M.H.H.; Oksanen, M.J.; Suggests, M. The Vegan Package. Community Ecol. Package 2007, 10, 719. [Google Scholar]
  52. Anderson, M.J. A New Method for Non-Parametric Multivariate Analysis of Variance. Austral Ecol. 2001, 26, 32–46. [Google Scholar] [CrossRef] [Scilit]
  53. Burnham, K.P.; Anderson, D.R. (Eds.) Advanced Issues and Deeper Insights. In Model Selection and Multimodel Inference: A Practical Information-Theoretic Approach; Springer: New York, NY, USA, 2002; pp. 267–351. ISBN 978-0-387-22456-5. [Google Scholar]
  54. Johnson, J.B.; Omland, K.S. Model Selection in Ecology and Evolution. Trends Ecol. Evol. 2004, 19, 101–108. [Google Scholar] [CrossRef] [Scilit]
  55. Bartoń, K. R Package, Version 1.46.0; MuMIn: Multi-Model Inference; R Foundation for Statistical Computing: Vienna, Austria, 2022; Available online: https://CRAN.R-project.org/package=MuMIn (accessed on 29 December 2025).
  56. R Core Team. R: A Language and Environment for Statistical Computing; R Foundation for Statistical Computing: Vienna, Austria, 2024. [Google Scholar]
  57. Suthar, S. Earthworm Biodiversity in Western Arid and Semiarid Lands of India. Environmentalist 2011, 31, 74–86. [Google Scholar] [CrossRef] [Scilit]
  58. Szederjesi, T.; Pavlíček, T.; Csuzdi, C. New Data to the Earthworm Fauna of Israel (Oligochaeta, Lumbricidae). Opusc. Zool. Bp. 2013, 44, 201–209. [Google Scholar]
  59. Valchovski, H.; Misirlioğlu, İ. Murchieona Minuscula (Rosa, 1906): First Finding from Bulgaria with Earthworm diversity and Zoogeography of Yıldız (Strandja) Mountain in Turkey and Bulgaria. Turk. J. Zool. 2017, 41, 731–736. [Google Scholar] [CrossRef] [Scilit]
  60. Jorge-Escudero, G.; Ligrone, A.; Lagerlöf, J.; Martínez, C.; Cadenazzi, M.; Pérez, C.A. Land Use Effect on Dominance of Native and Exotic Earthworm Species in Two Contrasting Rural Landscapes. Eur. J. Soil Biol. 2024, 122, 103618. [Google Scholar] [CrossRef] [Scilit]
  61. McGee, J.M.; Carrera-Martinez, R., Jr.; Callaham, M.; Snyder, B.A. New Records of Earthworms (Clitellata: Oligochaeta) from Georgia, USA, Including Eight New State Records. Zootaxa 2024, 5437, 510–522. [Google Scholar] [CrossRef] [Scilit] [PubMed]
  62. Ivask, M.; Kuu, A.; Sizov, E. Abundance of Earthworm Species in Estonian Arable Soils. Eur. J. Soil Biol. 2007, 43, S39–S42. [Google Scholar] [CrossRef] [Scilit]
  63. Feledyn-Szewczyk, B.; Radzikowski, P.; Stalenga, J.; Matyka, M. Comparison of the Effect of Perennial Energy Crops and Arable Crops on Earthworm Populations. Agronomy 2019, 9, 675. [Google Scholar] [CrossRef] [Scilit]
  64. Henneron, L.; Bernard, L.; Hedde, M.; Pelosi, C.; Villenave, C.; Chenu, C.; Bertrand, M.; Girardin, C.; Blanchart, E. Fourteen Years of Evidence for Positive Effects of Conservation Agriculture and Organic Farming on Soil Life. Agron. Sustain. Dev. 2015, 35, 169–181. [Google Scholar] [CrossRef] [Scilit]
  65. Scullion, J.; Neale, S.; Philipps, L. Comparisons of Earthworm Populations and Cast Properties in Conventional and Organic Arable Rotations. Soil Use Manag. 2002, 18, 293–300. [Google Scholar] [CrossRef] [Scilit]
  66. Riley, H.; Pommeresche, R.; Eltun, R.; Hansen, S.; Korsaeth, A. Soil Structure, Organic Matter and Earthworm Activity in a Comparison of Cropping Systems with Contrasting Tillage, Rotations, Fertilizer Levels and Manure Use. Agric. Ecosyst. Environ. 2008, 124, 275–284. [Google Scholar] [CrossRef] [Scilit]
  67. Domínguez, A.; Bedano, J.C.; Becker, A.R.; Arolfo, R.V. Organic Farming Fosters Agroecosystem Functioning in Argentinian Temperate Soils: Evidence from Litter Decomposition and Soil Fauna. Appl. Soil Ecol. 2014, 83, 170–176. [Google Scholar] [CrossRef] [Scilit]
  68. Bedano, J.C.; Vaquero, F.; Domínguez, A.; Rodríguez, M.P.; Wall, L.; Lavelle, P. Earthworms Contribute to Ecosystem Process in No-till Systems with High Crop Rotation Intensity in Argentina. Acta Oecologica 2019, 98, 14–24. [Google Scholar] [CrossRef] [Scilit]
  69. Capowiez, Y.; Cadoux, S.; Bouchant, P.; Ruy, S.; Roger-Estrade, J.; Richard, G.; Boizard, H. The Effect of Tillage Type and Cropping System on Earthworm Communities, Macroporosity and Water Infiltration. Soil Tillage Res. 2009, 105, 209–216. [Google Scholar] [CrossRef] [Scilit]
  70. Rosas-Medina, M.Á.; de León-González, F.; Flores-Macías, A.; Payán-Zelaya, F.; Borderas-Tordesillas, F.; Gutiérrez-Rodríguez, F.; Fragoso-González, C. Effect of Tillage, Sampling Date and Soil Depth on Earthworm Population on Maize Monoculture with Continuous Stover Restitutions. Soil Tillage Res. 2010, 108, 37–42. [Google Scholar] [CrossRef] [Scilit]
  71. Sullivan, P. Especialista El Manejo Sostenible de Suelos; ATTRA (NCAT—National Center for Appropriate Technology): Butte, MT, USA, 2007. [Google Scholar]
  72. Nicholls, C.; Altieri, M.; Dezanet, A.; Lana, M.; Feistauer, D.; Ouriques, M. A Rapid, Farmer-Friendly Agroecological Method to Estimate Soil Quality and Crop Health in Vineyard Systems. Biodynamics 2004, 33, 822–840. [Google Scholar]
  73. Zaccagnini, M.E. Manual de Buenas Prácticas Para La Conservación Del Suelo, La Biodiversidad y Sus Servicios Ecosistémicos. Area Piloto Aldea Santa María, Entre Ríos; Programa Naciones Unidas para el Desarrollo (PNUD): New York, NY, USA, 2014. [Google Scholar]
  74. Masin, C.; Rodríguez, A.R.; Zalazar, C.; Godoy, J.L. Approach to Assess Agroecosystem Anthropic Disturbance: Statistical Monitoring Based on Earthworm Populations and Edaphic Properties. Ecol. Indic. 2020, 111, 105984. [Google Scholar] [CrossRef] [Scilit]
  75. Pardon, P.; Mertens, J.; Reubens, B.; Reheul, D.; Coussement, T.; Elsen, A.; Nelissen, V.; Verheyen, K. Juglans regia (Walnut) in Temperate Arable Agroforestry Systems: Effects on Soil Characteristics, Arthropod Diversity and Crop Yield. Renew. Agric. Food Syst. 2019, 35, 533–549. [Google Scholar] [CrossRef] [Scilit]
  76. Cardinael, R.; Mao, Z.; Chenu, C.; Hinsinger, P. Belowground Functioning of Agroforestry Systems: Recent Advances and Perspectives. Plant Soil 2020, 453, 1–13. [Google Scholar] [CrossRef] [Scilit]
  77. Alvarez, R.; Gimenez, A.; Pagnanini, F.; Recondo, V.; Gangi, D.; Caffaro, M.; De Paepe, J.L.; Berhongaray, G. Soil Acidity in the Argentine Pampas: Effects of Land Use and Management. Soil Tillage Res. 2020, 196, 104434. [Google Scholar] [CrossRef] [Scilit]
  78. Cotrufo, M.F.; Ranalli, M.G.; Haddix, M.L.; Six, J.; Lugato, E. Soil Carbon Storage Informed by Particulate and Mineral-Associated Organic Matter. Nat. Geosci. 2019, 12, 989–994. [Google Scholar] [CrossRef] [Scilit]
  79. Lavallee, J.M.; Soong, J.L.; Cotrufo, M.F. Conceptualizing Soil Organic Matter into Particulate and Mineral-Associated Forms to Address Global Change in the 21st Century. Glob. Change Biol. 2020, 26, 261–273. [Google Scholar] [CrossRef] [Scilit] [PubMed]
  80. Fonte, S.J.; Winsome, T.; Six, J. Earthworm Populations in Relation to Soil Organic Matter Dynamics and Management in California Tomato Cropping Systems. Appl. Soil Ecol. 2009, 41, 206–214. [Google Scholar] [CrossRef] [Scilit]
  81. Curry, J.P.; Schmidt, O. The Feeding Ecology of Earthworms—A Review. Pedobiologia 2007, 50, 463–477. [Google Scholar] [CrossRef] [Scilit]
  82. Escudero, H.J.; Domínguez, A.; Rodríguez, M.P.; Bedano, J.C. Ecologically Based Agriculture Benefits Earthworms in Argentina’s Large-Scale Systems: Farm-Level Strategies Matter. Agron. Sustain. Dev. 2025, 45, 50. [Google Scholar] [CrossRef] [Scilit]
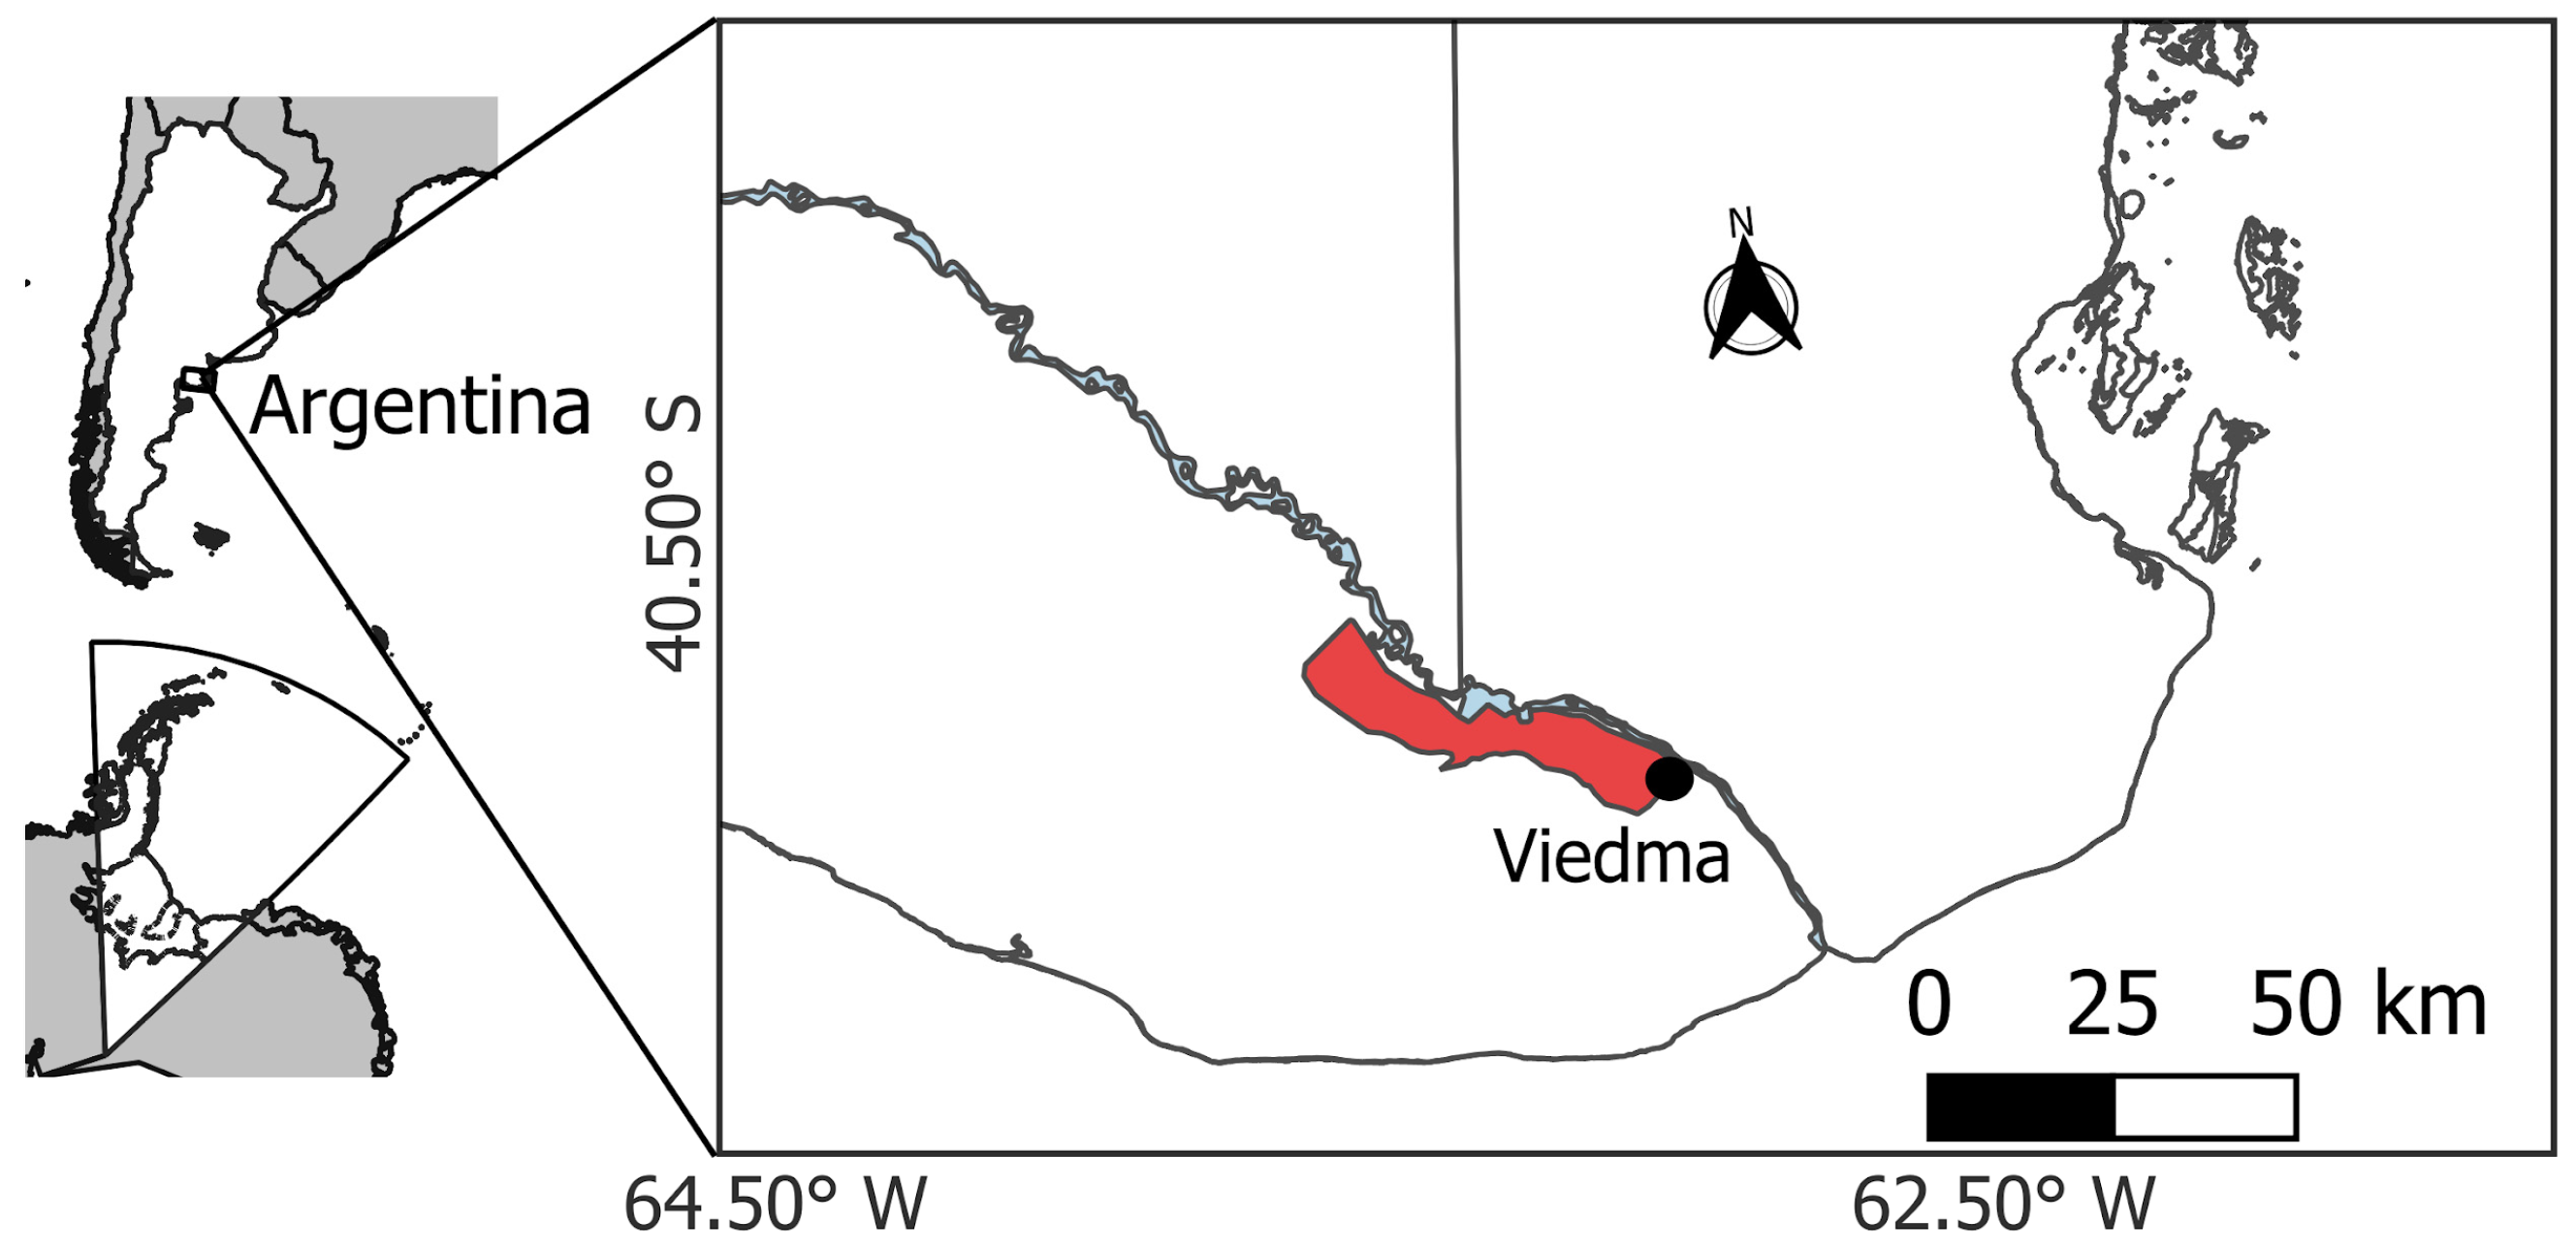
Figure 1. The location of the study area in the Lower Valley of the Negro River (VIRN), northeastern Patagonia, Argentina. The main map shows the irrigated area (red) and the Negro River (light blue), and the black dot indicates the city of Viedma. The inset maps were prepared in QGIS 3.40 using public spatial data from Instituto Geográfico Nacional and DIVA-GIS [36,37].
Soilsystems 10 00048 g001
Figure 2. The land uses assessed: (a) the reference riparian sites (Ref), (b) fruit orchards (Fru), (c) pastures (Pas), (d) cereal crops (Cer), and (e) horticulture plots (Hor).
Soilsystems 10 00048 g002
Figure 3. The earthworm abundance across the land uses and soil depths. The different letters indicate the significant differences among the land uses within each depth (Sidak-adjusted, p < 0.05). Red asterisk, next to the depth label indicates a significant main effect of soil depth. The asterisk above the ref, pas, and cer bar denotes a significant difference between the depths, specifically for the corresponding land use (p < 0.05). The error bars represent the standard error of the mean. Ref: reference, Fru: fruit orchards, Pas: pastures, Cer: cereal crops, and Hor: horticulture.
Soilsystems 10 00048 g003
Figure 4. The earthworm biomass across the land uses and soil depths. The different letters indicate the significant differences among the land uses within each depth (Sidak-adjusted, p < 0.05). Red asterisk, next to the depth label indicates a significant main effect of soil depth. The asterisk above the ref bar denotes a significant difference between depths specifically for that land use (p < 0.05). The error bars represent the standard error of the mean. Ref: reference, Fru: fruit orchards, Pas: pastures, Cer: cereal crops, and Hor: horticulture.
Soilsystems 10 00048 g004
Figure 5. The earthworm community composition across the land uses based on the redundancy analysis (RDA). The sites (points) are colored by the land use, and the ellipses indicate 95% confidence intervals. The species: Aporrectodea rosea, A. trapezoides, A. caliginosa, Murchieona minuscula, Haplotaxida morphotype (MFsp1). Ref: reference, fru: fruit orchards, pas: pastures, cer: cereal crops, and hor: horticulture.
Soilsystems 10 00048 g005
Figure 6. The soil properties across the land uses and depths: (a) soil moisture, (b) bulk density, (c) electrical conductivity, (d) pH, (e) particulate organic matter, (f) mineral-associated organic matter, (g) coarse fraction (>53 µm; % of oven-dry soil mass). The different letters indicate the significant differences among the land uses within each depth (Sidak-adjusted, p < 0.05). Different lowercase letters indicate significant differences among land uses within the same soil depth (Sidak-adjusted p < 0.05). Red asterisks, next to the depth labels, indicate a significant main effect of soil depth for that variable. Black asterisks above specific bars denote significant differences between depths (0–10 cm vs. 10–20 cm) within that land use (p < 0.05). The error bars represent the standard error of the mean. Ref: reference, Fru: fruit orchards, Pas: pastures, Cer: cereal crops, and Hor: horticulture.
Soilsystems 10 00048 g006aSoilsystems 10 00048 g006b
Figure 7. The influence of the soil properties on earthworm abundance (a,b), earthworm biomass (cf), species richness (g,h), and earthworm diversity (ik). The lines show the model predictions, and the shaded areas represent the 95% confidence intervals.
Soilsystems 10 00048 g007aSoilsystems 10 00048 g007b
Table 1. The management practices for agricultural land uses.
PermanentSemi-PermanentAnnual
Land use Fruit orchardsPasturesCereal cropsHorticulture
Crop Walnut
Juglans regia
Mixed forage
Species
Corn
Zea mays
Squash
Cucurbita sp.
Planting date-FebruaryDecemberOctober
DurationMore than 10 years1–5 years6 monthsUp to 5 months
Chemical inputsFertilizers +
Herbicides +
Insecticides +
Fungicides +
Bactericides
Fertilizers + Herbicides + Insecticides
(no Fungicides/Bactericides)
Pre-planting soil managementDisk harrow tillageDisk harrow tillageDisk harrow
tillage (except
under no-tillage
systems)
Disk harrow tillage
Soil tillage
during the crop cycle
Annual tillage with
disk harrow in
inter-row sector
One direct
seeding event
--
Annual irrigation requirement (mm yr−1)600–800~650370–560
Table 2. The earthworm species abundance (mean ind. ± SD) across the land uses.
Aporrectodea
rosea
Murchieona minusculaAporrectodea
trapezoides
Aporrectodea
caliginosa
Haplotaxida MFsp.1Undetermined
Juveniles
Reference1.90 ± 4.990.90 ± 2.990.85 ± 3.573.50 ± 4.85-3.20 ± 5.81
Fruit
Orchards
2.05 ± 3.734.26 ± 10.830.26 ± 0.91-0.15 ± 0.430.67 ± 1.58
Pastures12.13 ± 22.54-1.98 ± 3.440.23 ± 0.62-1.95 ± 5.02
Cereal crops1.73 ± 3.61-0.23 ± 0.83--0.93 ± 1.65
Horticulture0.35 ± 1.05-0.35 ± 1.05--0.35 ± 0.80
Note. ind. = number of individuals.
Table 3. The community-level descriptors of earthworms (abundance, biomass, species richness, Shannon diversity, and Berger–Parker dominance) across the land uses and soil depths (mean ± SD).
Depth
(cm)
Abundance
(ind.)
Biomass
(g)
Species
Richness (S)
Diversity
Shannon (H′)
Dominance
(Berger–Parker)
Reference0–1036.50 ± 36.99 b1.62 ± 1.02 b1.30 ± 0.950.40 ± 0.570.85 ± 0.21
10–201.62 ± 1.02 b0.36 ± 0.55 ab2.00 ± 0.940.83 ± 0.400.73 ± 0.17
Fruit
Orchards
0–101.30 ± 0.950.79 ± 1.21 ab1.15 ± 1.090.60 ± 0.660.77 ± 0.27
10–200.40 ± 0.570.14 ± 0.23 a1.30 ± 0.800.33 ± 0.530.89 ± 0.19
Pastures0–100.85 ± 0.212.47 ± 3.61 b1.70 ± 1.030.60 ± 0.490.81 ± 0.18
10–205.40 ± 7.28 ab0.94 ± 0.76 b1.40 ± 0.750.34 ± 0.390.91 ± 0.12
Cereal crops0–100.36 ± 0.55 ab0.12 ± 0.76 a0.55 ± 0.760.35 ± 0.480.86 ± 0.20
10–202.00 ± 0.940.27 ± 0.42 a1.05 ± 0.760.35 ± 0.440.88 ± 0.16
Horticulture0–100.83 ± 0.400.13 ± 0.29 a0.65 ± 0.810.19 ± 0.400.95 ± 0.11
10–200.73 ± 0.170.05 ± 0.12 a0.50 ± 0.690.21 ± 0.380.93 ± 0.13
Note. ind. = number of individuals. The letters are shown only for the variables with significant differences among the land uses and/or soil depths (p < 0.05).
Table 4. The soil physicochemical properties across the land uses and depths (mean ± SD).
Depth
(cm)
SM
(%)
BD
(g cm−3)
pHEC
(dS m−1)
POM
(%)
MAOM
(%)
CF
(%)
Reference0–1041.01 ± 4.95 d0.69 ± 0.11 c6.01 ± 0.33 a0.76 ± 0.16 b4.09 ± 1.52 c4.99 ± 2.26 b36.73 ± 11.77 c
10–2034.45 ± 2.79 c1.16 ± 0.07 bc6.15 ± 0.35 a0.39 ± 0.12 ab2.17 ± 0.99 c3.79 ± 1.45 b43.76 ± 17.65 c
Fruit
Orchards
0–1023.81 ± 7.73 bc0.91 ± 0.13 b6.81 ± 0.39 b0.58 ± 0.14 a1.71 ± 0.77 b3.43 ± 0.85 a35.71 ± 16.58 ab
10–2022.72 ± 5.49 ab1.30 ± 0.08 a7.01 ± 0.44 b0.39 ± 0.07 a1.34 ± 0.66 b2.87 ± 0.97 a41.45 ± 16.75 ab
Pastures0–1028.68 ± 10.46 cd 0.87 ± 0.20 b7.31 ± 0.61 c0.94 ± 0.36 b2.25 ± 1.68 b3.77 ± 1.01 a31.20 ± 20.58 b
10–2023.86 ± 9.51 abc1.25 ± 0.08 ab7.69 ± 0.51 c0.59 ± 0.27 c1.11 ± 0.46 b3.25 ± 1.22 a29.23 ± 18.80 b
Cereal crops0–1021.42 ± 6.06 b0.88 ± 0.19 b6.78 ± 0.82 b0.57 ± 0.15 a1.28 ± 0.34 ab4.71 ± 0.78 b18.66 ± 10.34 a
10–2025.83 ± 5.75 bc1.10 ± 0.12 c6.85 ± 0.86 b0.52 ± 0.09 bc1.03 ± 0.33 ab4.46 ± 0.80 b18.38 ± 10.35 a
Horticulture0–1016.36 ± 6.53 a1.00 ± 0.11 a7.02 ± 0.77 b0.45 ± 0.13 a1.21 ± 0.62 a3.12 ± 1.23 a35.41 ± 20.73 b
10–2019.92 ± 4.76 a1.26 ± 0.12 ab7.02 ± 0.79 b0.42 ± 0.18 ab0.83 ± 0.32 a3.16 ± 1.17 a36.18 ± 21.61 b
Note. The soil properties: soil moisture (SM), bulk density (BD), electrical conductivity (EC), pH, particulate organic matter (POM), mineral-associated organic matter (MAOM), and coarse fraction (CF; >53 µm; % of oven-dry soil mass). The different letters indicate the significant differences among the land uses within each depth (Sidak-adjusted, p < 0.05).
Table 5. The summary of the influence of soil properties on earthworm attributes based on multimodel inference, presented by the response variables: (a) abundance, (b) biomass, (c) species richness, and (d) diversity.
PredictorsCoefficientsp-ValueRI
(a)intercept−1.820.337-
Abundance
(individual sample−1)
SM0.060.0011.00
POM0.190.1700.41
pH0.390.0580.77
BD−0.890.1500.42
MAOM0.080.4060.28
EC0.330.5490.05
R2 = 0.40
(b)intercept−0.74<2 × 10−161.00
Biomass
(g sample−1; log10 scale)
EC0.150.0161.00
CF0.190.0011.00
SM0.24<2 × 10−161.00
pH0.140.0191.00
POM0.040.4990.29
R2 = 0.225
(c)intercept1.180.006
Species Richness
(species sample−1)
MAOM−0.150.0110.46
POM0.980.0011.00
BD0.350.3080.17
R2 = 0.06
(d)intercept0.320.239-
Diversity
(H′ sample−1)
BD−0.220.1600.31
SM0.010.0060.44
MAOM−0.060.0480.24
POM0.330.0310.42
R2 = 0.02
Note. The estimated coefficients, statistical significance, and relative importance (RI) of the edaphic predictors from the models with ΔAICc < 2. The soil moisture (SM; %); bulk density (BD; g cm−3); electrical conductivity (EC; dS m−1); pH; particulate organic matter (POM; %); mineral-associated organic matter (MAOM; %); and coarse fraction (CF; >53 µm; %) of oven-dry soil mass. Values in bold indicate significant effects (p < 0.05).
Disclaimer/Publisher’s Note: The statements, opinions and data contained in all publications are solely those of the individual author(s) and contributor(s) and not of MDPI and/or the editor(s). MDPI and/or the editor(s) disclaim responsibility for any injury to people or property resulting from any ideas, methods, instructions or products referred to in the content.