1. Introduction
Cereals represent the most important food source of mankind [
1]. Maize, rice, wheat, barley, and sorghum are the most widely grown cereals in the world and cover large agricultural areas [
2]. Depending on the cereal, the root system varies; i.e., the number of primary roots will change among different cereals, for example, from one in the warm climate cereals such as maize and rice to six or seven in the cool climate cereals such as wheat [
3]. This can affect soil compaction, porosity, and other characteristics of the cultivated land in comparison to natural ecosystems covered mostly with perennial plants. Domestication is the process by which plants evolved to fit a human-managed environment in which using these plant species resulted in increasing their productivity and food value [
4,
5]. We know a lot about the effect of domestication on aboveground plant ecophysiology, but the effect on belowground processes is much less understood. Considering the vast areas that cereals occupy, this effect may influence ecosystem behavior on a regional and global scale.
Soil is a major pool of carbon (C). It plays an important role in global biogeochemical cycles, water retention in ecosystems, and many other key ecosystem processes. Carbon storage in the ecosystem is affected by complex processes including various plant–soil interactions [
6]. Plant–soil interactions could be affected in the areas where the domestication of cereals is dominant. Plants can affect soil processes in many ways, of which the effect on the soil carbon cycle represents an important one. Plants can affect the C cycle via production of plant necromass, both aboveground litter and dead roots; however, most of the aboveground part is harvested in crops, so dead roots are particularly important [
7]. In addition, these plants produce rhizodeposits, which may in turn support microbial biomass [
8]. This eventually can turn into microbial necromass (or microbial-processed compounds along with their own biomass), which is now believed to be a major part of soil organic matter [
7,
9,
10].
Another important step in modern agriculture is shifting from organic fertilizer to mineral ones. Type and quantity of fertilizer amendment affect not only crop yields but also the physicochemical properties of the soil [
11,
12]. Using organic fertilizer may bring organic matter on its own, but it may also affect the behavior of plants. Fertilization with organic amendments improves soil fertility and structure [
13,
14]. To get nutrients from organic matter, plants support microbes in the rhizosphere, which then mineralize organic matter and allow plants to take up nutrients in this way. Organic matter can indirectly promote microbial biomass in soil [
15,
16] and eventually also production of microbial necromass and C storage in soil as described above.
Effects of plant domestication and plant breeding on plant productivity and various aspects of plant ecophysiology need to be extensively studied [
4,
5], and the same is true for various plant–soil interactions [
6]; interactions of these two phenomena are understudied. Namely, plant domestication and breeding effect plant–soil interactions and their context specificity remain largely overlooked. Here, we use several cultivars of barley (
Hordeum vulgare L.) at different stages of domestication and breeding in relation to perennial grasses and unaffected soil to explore how growth of the barley, carbon input to the soil and effect of microbial and chemical properties vary with stage of domestication and level of breeding. To explore context dependency of these trends we do this under organic and mineral fertilization. Barley was chosen because it is one of the oldest crops with a long and well documented history of domestication. It is also one of the most abundant cereals cultivated in the Czech Republic. We used three groups of cultivars: wild botanical species of
Hordeum vulgare subsp.
spontaneum, which is a wild form of barley ancestor of domesticated cultivars. Second, we used an extensive cultivar, which was developed before mineral fertilizers came to widespread use (before 1950). Finally, we used contemporary highly productive cultivars. We expect that barley in general will be left with less dead necromass, namely, root necromass in soil compared to perennial grasses, and this trend will be enhanced in more modern cultivars. We also expect that grasses will support more microbial biomass than barley species, and this trend will be enhanced in more modern cultivars. Finally, we will check the effect on soil organic matter although these effects may be low after one year of cultivation.
2. Materials and Methods
2.1. Soil Samples
Experimental soil was “Loess soil”, which was collected from Suchdol, northern part of Prague, Czech Republic, located close to the wide agricultural area (50°12′–50°14′ N, 14°35′–14°39′ E). This soil is predominantly silt-sized sediment that is formed by the accumulation of wind-blown dust. The site was previously used for evaluating soil profiles by the Institute for Environmental Studies, Charles University (Prague, Czech Republic). The surrounding soil had been compiled into a high hill before the construction of local roads close to the wheat farms. Soil was collected from a depth of approximately 5–10 cm below the surface in random spots in a 5–10 m2 area. Then, soils were sieved with a 2 mm mesh sieve, and plant remnants were removed.
2.2. Barley Genetic Resources
We had 3 classes of barley plants: botanical barley (Hordeum vulgare L.) plant species (BS), old cultivars (OC), and modern cultivars (MC). Barley genetic resources were provided by Czech Agrifood Research Center (CARC), Department of Genebank, Drnovská 507/73, 161 00 Praha, Ruzyně, Czech Republic. The BS barley species were three Hordeum vulgare subsp. spontaneum cultivars (one from Azerbaijan and two from Syria with origin access numbers of 01C0509028, 01C0509055, and 01C0509089). The OC barley species were four Hordeum vulgare subsp. vulgare cultivars (one from Azerbaijan, two from Greece, and one from Former Soviet Union with origin access numbers of 01C0500179 (from Azerbaijan), 01C0500222 (from Balkan), 01C0500288 (from Peloponnese), 01C0500547 (Mozdokskij mestnyj). The MC barley species were four Hordeum vulgare subsp. vulgare cultivars (three from Germany and one from France with origin access numbers of 01C0502101 (KWS Meridian), 01C0502137 (Titus), 01C0502208 (KWS Kosmos), 01C0502283 (LG Triumph). In addition to barley two perennial grasses (PG) were also included, and these PG species were two grass species Arrhenantherum elatius L. and Dactylis glomerata L. for comparison with barley. Grass seeds were obtained from local provider of wild plant seeds (Planta Naturalis). In addition, we added one control treatment with no plant species for microbial and chemical measurements. Therefore, we had 11 barley cultivars and or botanical species, 2 grass species, and one control treatment (in total 14).
2.3. Experimental Design
The collected soil was sieved to remove stones larger than 5 mm, mixed and placed in plastic containers (11 cm × 11 cm × 19 cm), each containing 1.4 kg of soil. With these containers, it was possible for plants to fully grow during the experimental time. We had two fertilizer treatments: mineral fertilizer (addition of liquid NPK fertilizer) and organic fertilizer (addition of dry compost). Each treatment was represented by five replicate microcosms. In total, we had 140 plastic containers (2 treatments × 14 plant species including grasses and control × 5 replicates). Compost was added to half of the plastic containers by using 2 mesh-litter bags each including 70 g sieved garden compost, and they were left on each side of plastic pots (140 g compost in each pot) with NPK concentrations of 2.70, 0.48 and 1.52%, respectively, which means that 3.8 g N, 0.7 g P and 2.1 g K were added in each pot. Into half of the plastic containers, liquid fertilizer (Terra Aquatica, Fleurance, France; see
Table S1, Supplementary Materials for details of its composition) was added three times a week. In total 100 mL of undiluted fertilizer was added during whole experiment, which represents 3.92 g N, 0.43 g P and 4.9 g K per pot. We expect that N would be most limiting nutrient, so both treatments were established to receive similar amount of N, considering that pot area it represents in both cases bit over 300 kg ha
−1.
First, a substrate of sand and perlite was used as a medium for seeds [
17,
18]. Seeds on this substrate were kept in the laboratory condition (20 °C, 12/12 light/dark), which was maintained throughout the experiment, and water was added every other day. After 10 days, seedlings had grown completely and were ready for transplant. In each plastic container, we added one seedling of barley plant or grass. After one week, the plants that did not catch up were replaced by new seedlings. There was no need to replace them afterwards. We added water to the containers every other day. We kept the plants in a big cultivation tent (
Figure S1, Supplementary Materials), and then we transferred them to the greenhouse with the same temperature and light regime after 1.5 months. After 4 months, we harvested the plants from the containers by clipping the aboveground parts. Roots were separated by shaking the soil and washing off the attached soil particles. Above- and belowground plant parts were oven-dried at 60° C for 24 h, and then dry weight was measured.
We collected soil samples at the end of experiment and kept them at 4 °C for analyzing microbial respiration and microbial biomass as described in
Section 2.4. We kept 40 g of dry soil for soil fractionation, and the rest of the soil was air-dried and kept for soil chemical analysis.
2.4. Soil Chemical and Microbial Analyses
Soil pH, electrical conductivity, and total soil phosphorus (P) were measured at the end of the experiment. After shaking the 1:5 (soil:water) suspension for 1 h and collecting supernatant, pH was measured with a Mettler Toledo, Columbus, OH, USA pH-meter. Conductivity was also measured using the same method with a HANNA HI conductivity meter (Hanna Instruments, Woonsocket, RI, USA). For measuring total soil P, after shaking the 1:10 (soil:Melich 3) suspension for 30 min and filtering the supernatant, the samples were diluted with a 1:10 color solution. The intensity of blue color corresponding to the amount of P was measured with an ICP-OES 5900 (Agilent Technologies, Inc. Santa Clara, CA, USA). In total, we had 84 samples (2 treatments × 14 plant species including grasses and control × 3 replicates). We also measured soil chemical parameters in 3 extra replicates from the soil at the start of the experiment.
For the isolation of various soil organic matter fractions, the bulk soil samples amounting to 40 g each were sieved through 2 mm sized sieve following wet sieving. For this, the soil samples were placed into water (1:5) soil to water ratio overnight. Following morning, the floating material on the surface of water was aspirated through a water-jet pump and designated as free-floating particulate organic matter (fPOM). The fraction was dried in oven, weighed, and stored for further processing. The remaining material was wet sieved with >250 µm sieve. The material passing through >250 µm sieve was collected in buckets and centrifuged at 3000 rpm for 30 min. Meanwhile, the soil material remaining on top of the sieve designated as macro-aggregates was then sonicated and again sieved to isolate micro-aggregates out of macro-aggregates. For this, the material after sonication was sieved through a mesh of 53 µm, and the material remaining on top of 53 µm sieve was designated as micro-aggregates, while the material (soil + suspension) passing through this sieve was designated as primary particles, collected through centrifuging. This resulted in four fractions: fPOM, macro-aggregates, micro-aggregates, and primary particles (silt + clay) out of macro-aggregates. All fractions were oven-dried at 40 °C and analyzed for C and N content. For measuring C and N (%) in the plant samples (roots and leaves), bulk soil and soil fractions, elemental analyzer (CHNS/O Flash 2000, Thermo, Fisher Scientific, Waltham, MA, USA) was used.
Microbial respiration was determined according to Kang et al. [
19] (see more details in Ardestani et al. [
18]). In brief, using titration method, test soils were incubated for 3 days together with a solution jar of 1 N NaOH. After that, solution was titrated with 8.5 mL of HCl 0.1 N. The amount of titrated acid was equal to the released CO
2 from test sample and marked as a soil respiration value for that soil sample. For measuring microbial biomass, chloroform fumigation–extraction method was used [
20,
21], and microbial biomass C (microbial C) and N (microbial N) were measured with a CN Analyzer (TOC-L CPH/CPN, Shimadzu, Kyoto, Japan).
2.5. Data Analyses
We used two-way analysis of variance (ANOVA) to evaluate the effect of organic and mineral fertilizer addition, plant classes, and their interaction on plant biomass, soil chemical characteristics, and microbial measurements. Following that, individual treatments were compared by one-way ANOVA, and if significant a Tukey post hoc test (p < 0.05) was used to classify the treatments. Data were tested on homogeneity of variance before ANOVA an log transformation (log n + 1) was needed to achieve homogeneity. All analyses were performed with the Statistica 13.3.0 software (TIBCO Statistica®, Tulsa, OK, USA).
3. Results
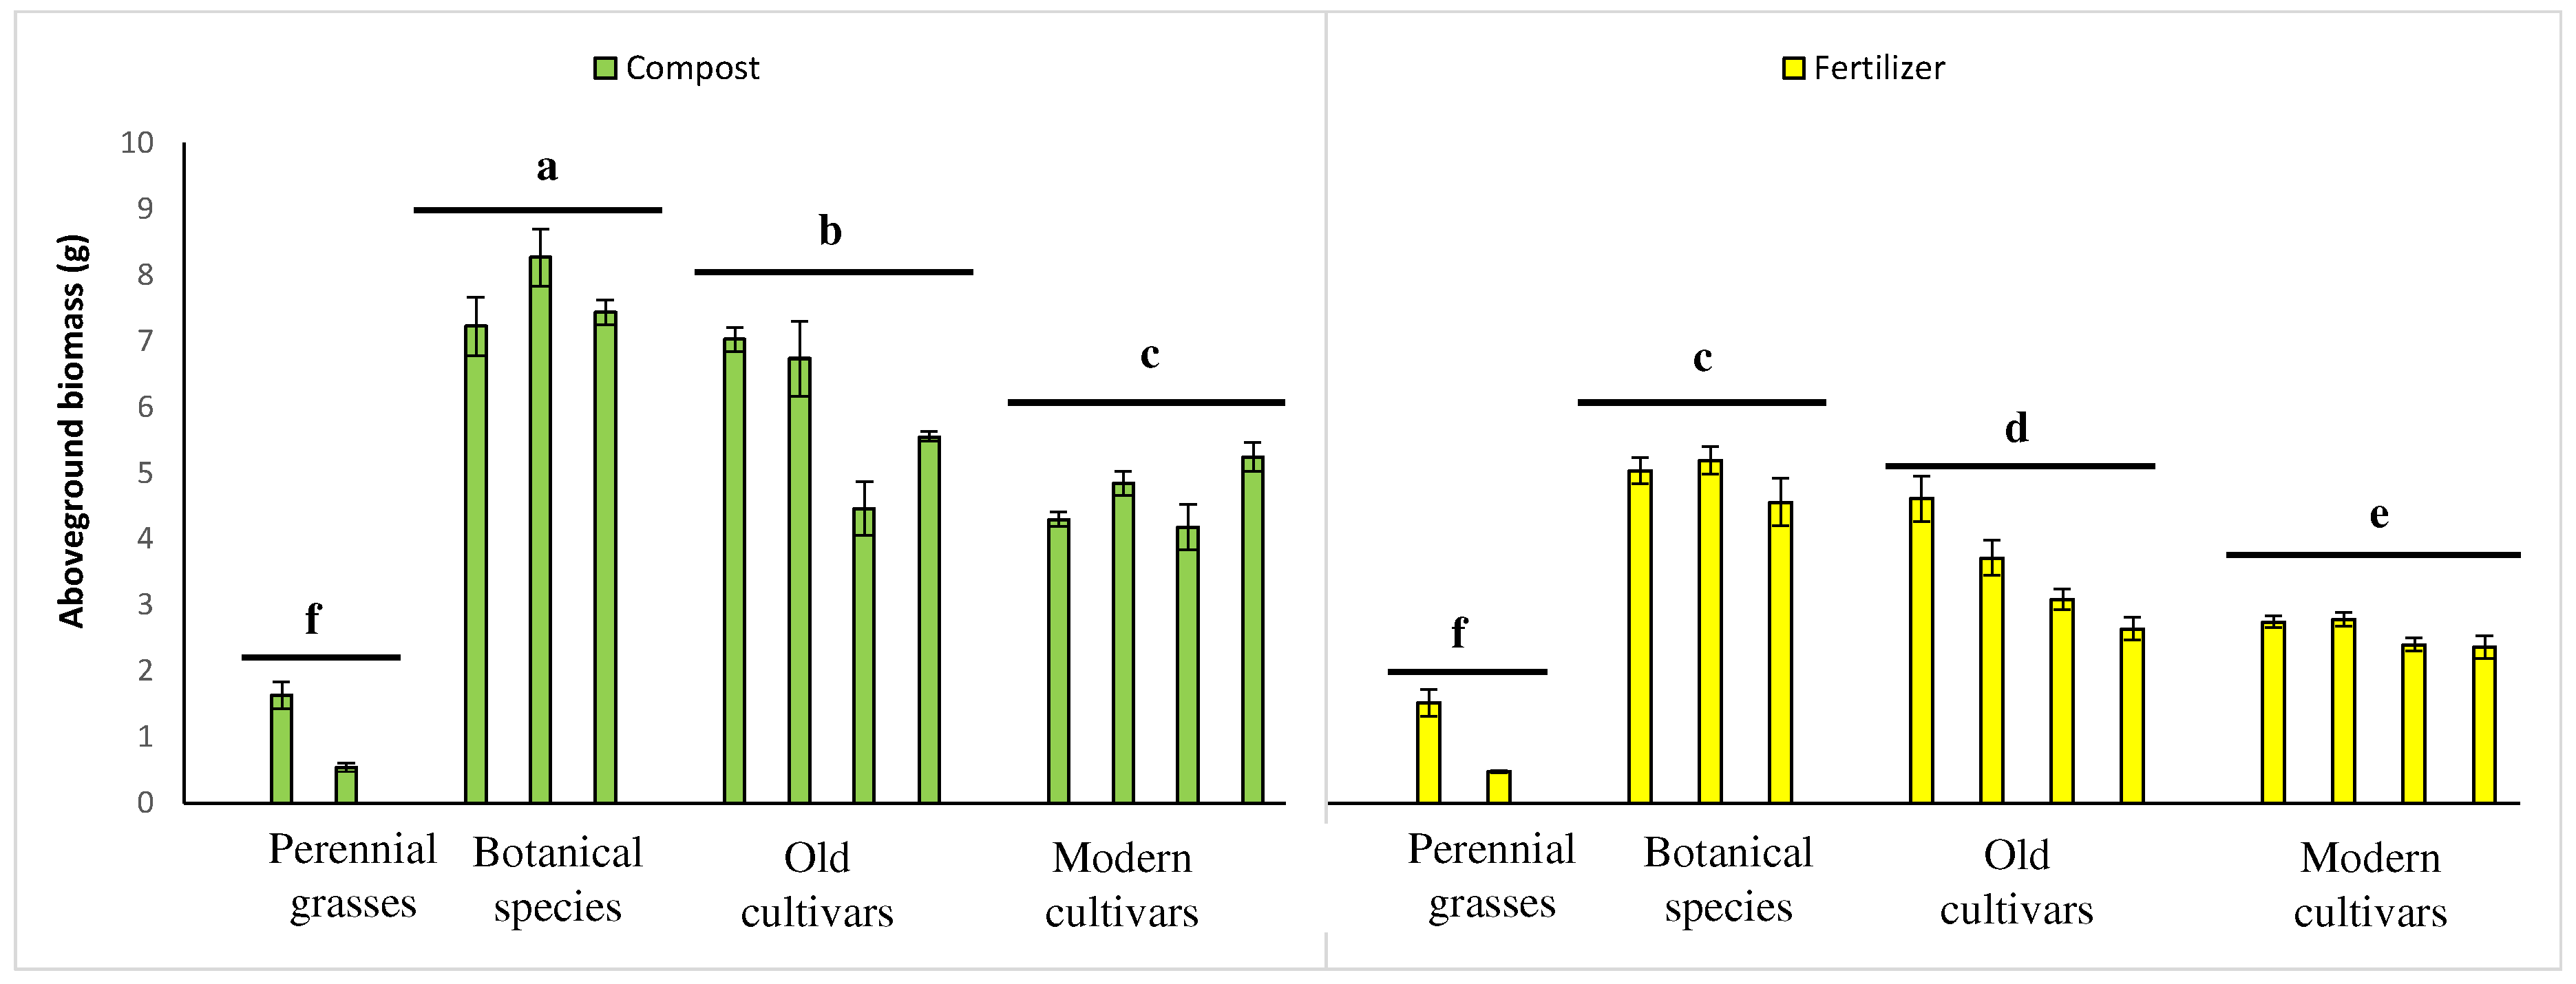
Total aboveground biomass was higher in the organic fertilizer treatments compared to the fertilizer treatments (
Figure 1). In the botanical species and old cultivars of the organic fertilizer treatment, significantly higher aboveground biomass was observed compared to other species in organic and mineral fertilizer treatments. The effect of organic/mineral fertilizer addition and plant classes and their interaction was significant on aboveground biomass (F
1,122 = 151,
p < 0.001; F
3,122 = 178,
p < 0.001; F
1,122 = 12.0,
p < 0.001, respectively;
Table 1). Perennial grasses had similar aboveground biomass in both treatments (
Figure 1).
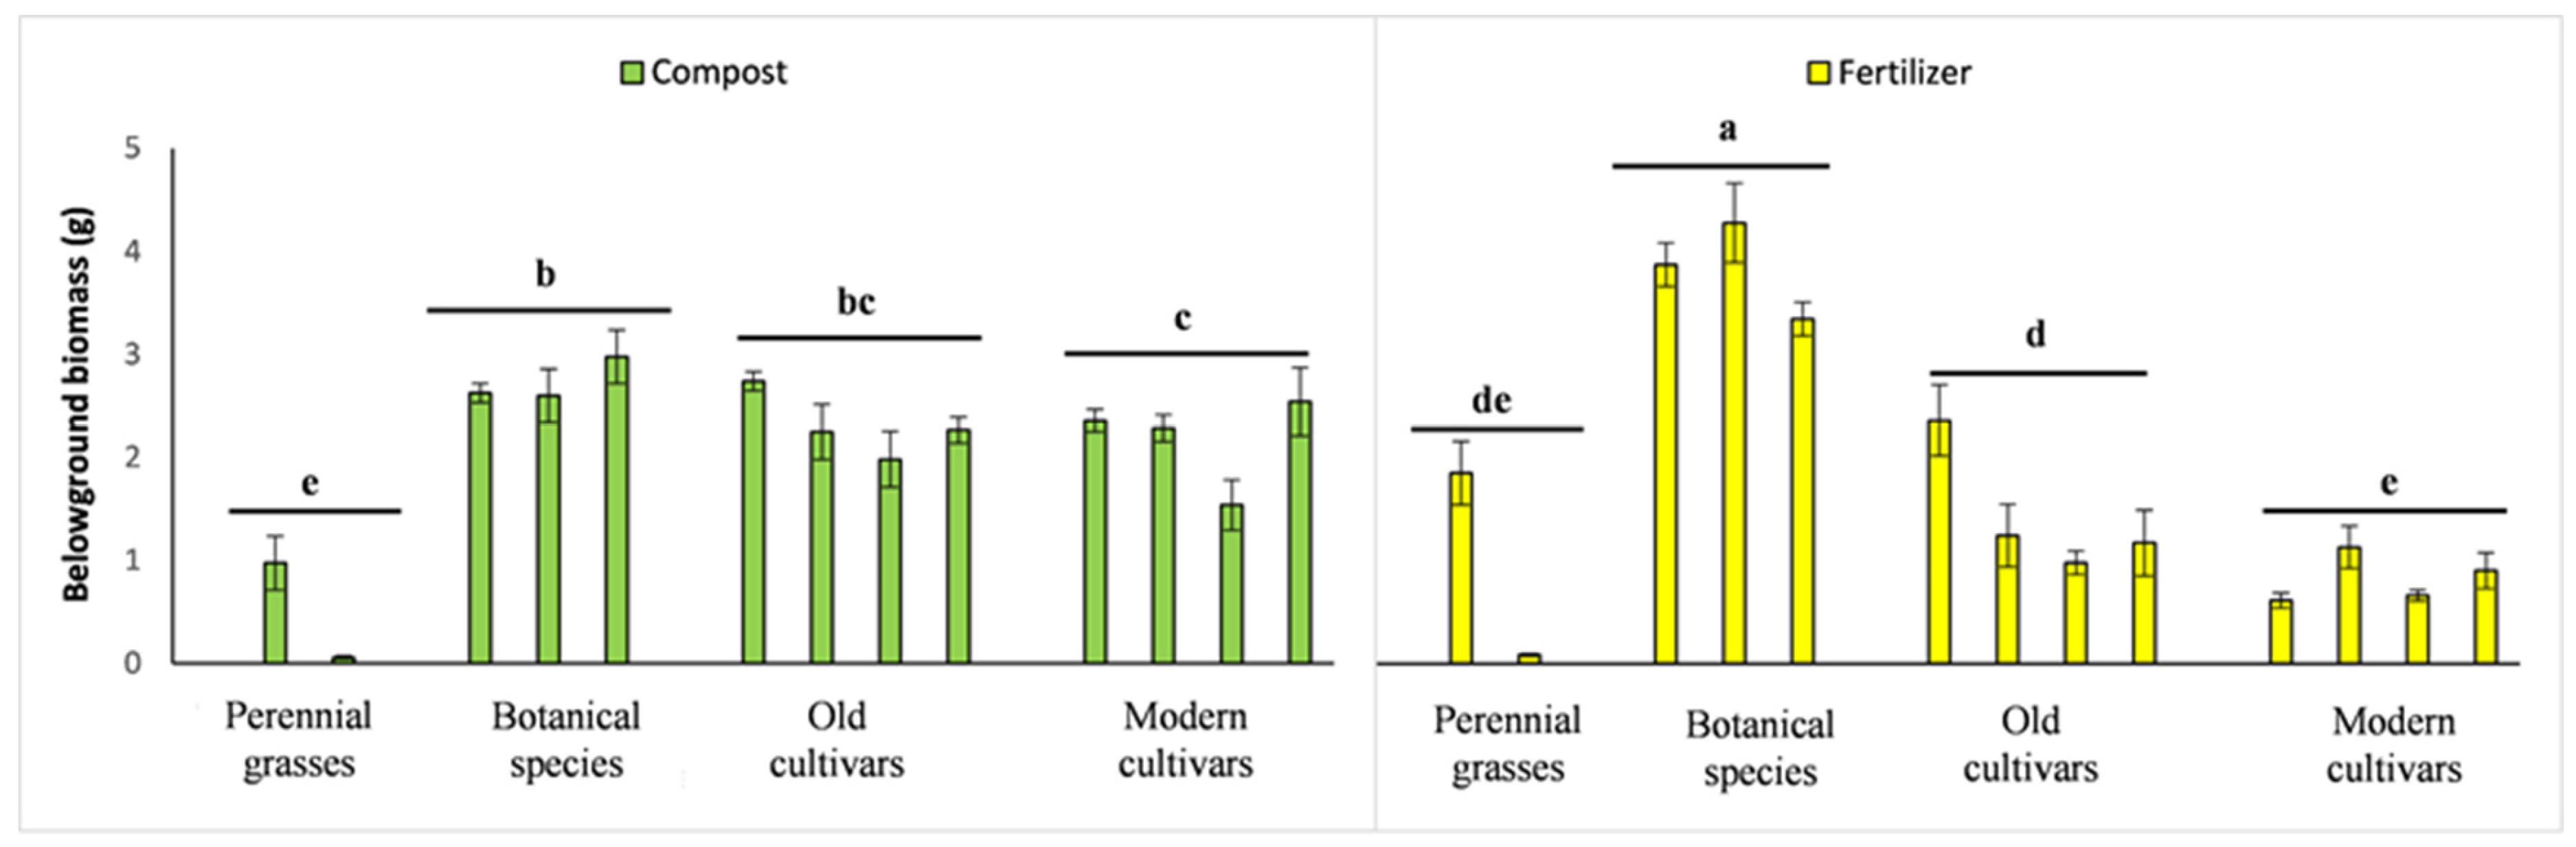
Total belowground biomass was higher in the organic fertilizer treatment compared to the fertilizer treatment, except for the botanical species (
Figure 2). Significant effects of plant classes and interaction between plant classes and organic/mineral fertilizer addition were observed (F
3,122 = 74.1,
p < 0.001; F
1,122 = 25.9,
p < 0.01, respectively), but the effect of organic/mineral fertilizer addition itself was not significant (F
1,122 = 2.09,
p > 0.05;
Table 1). The above-to-belowground biomass ratio was also significantly affected by the addition of treatments, plant classes, and their interactions (F
1,122 = 4.33,
p < 0.05; F
3,122 = 7.99,
p < 0.001; F
1,122 = 6.38,
p < 0.001, respectively;
Table 1).
Soil pH ranged from 7.29 to 8.01 in the organic fertilizer treatment and from 7.98 to 8.09 at the end of the experiment in the mineral fertilizer treatment (
Table 2), and it was 7.99 ± 0.02 at the beginning of the test. The pH values were significantly different between the organic and mineral fertilizer treatments (F
1,70 = 142,
p < 0.001), but the effect of plant classes and the interaction of organic/mineral fertilizer addition and plant classes on pH was not significant (
Table 1; F
3,70 = 1.50,
p > 0.05; F
1,70 = 1.10,
p > 0.05, respectively). Soil electrical conductivity was from 184 ± 5.33 µS to 242 ± 9.50 µS in the organic fertilizer treatment and from 157 ± 0.88 µS to 181 ± 1.67 µS in the mineral fertilizer treatment at the end of the experiment (
Table 2). Conductivity was 215 ± 7.51 µS at the start of the test. Conductivity was significantly affected by the addition of treatments, plant classes, and their interactions (F
1,70 = 239,
p < 0.001; F
3,70 = 6.65,
p < 0.001; F
1,70 = 3.36,
p < 0.05, respectively;
Table 1). Total soil P ranged between 120 ± 4.93 ppm and 146 ± 7.20 ppm for the organic fertilizer treatment and between 88.9 ± 2.66 ppm and 123 ± 13.9 ppm for the mineral fertilizer treatment (
Table 2). These values were significantly different at different treatments and their interactions with different plant classes (F
1,70 = 196,
p < 0.001; F
3,70 = 3.34,
p < 0.05; F
1,70 = 9.34,
p < 0.001;
Table 1). Total soil P at the start of the test was 125 ± 5.66 ppm.
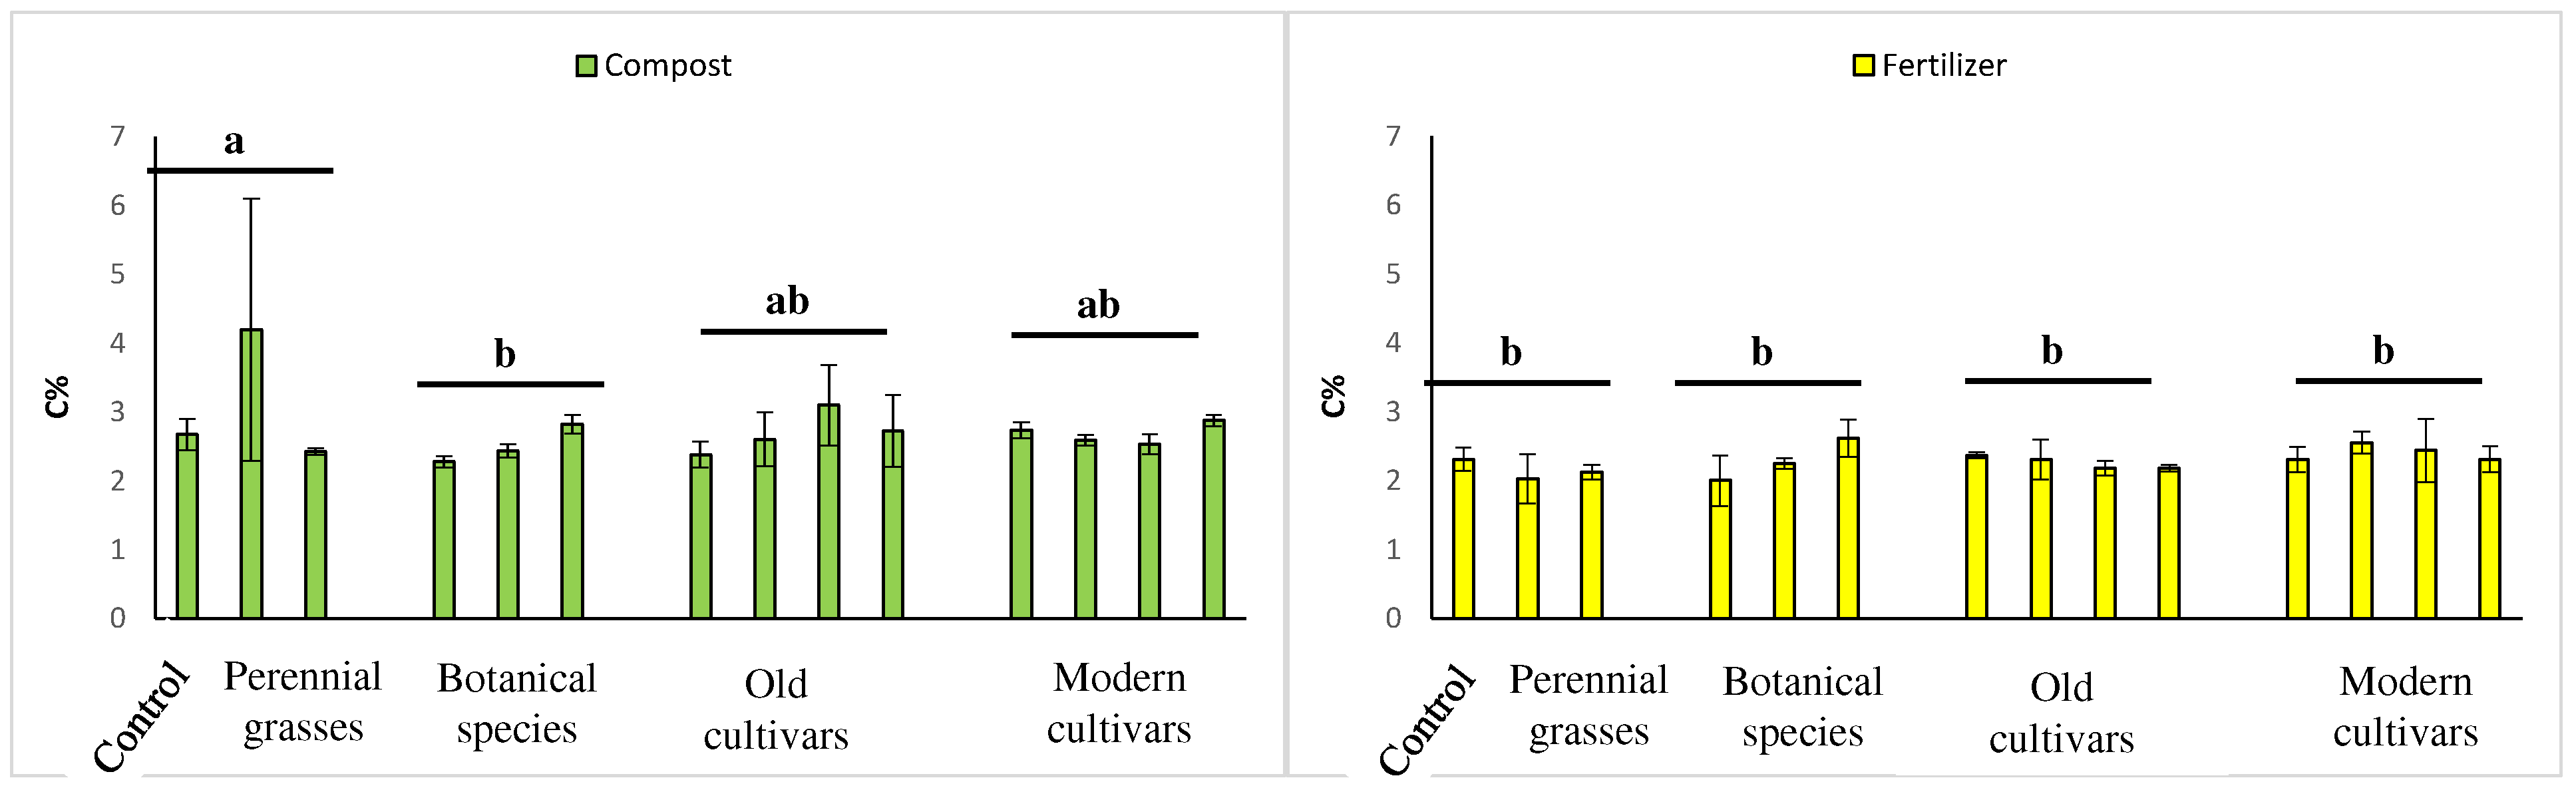
Soil fractions were generally higher in the organic fertilizer treatment compared to the mineral fertilizer treatment (
Table S2). Among different barley cultivars, the old cultivar showed a bit higher value especially in the <53 and 53–250 fractions for both organic and mineral fertilizer treatments. All C/N values for different treatments are shown in
Tables S3 and S4 for different soil fraction samples. For the bulk soil, C (%) was significantly different for C/F addition (F
3,70 = 9.76,
p < 0.001) but not significant for plant classes and the interaction of treatment and plant classes (
Table 1,
Figure 3). In soil fractions, C and N were a bit higher in the organic fertilizer treatment compared to the mineral fertilizer treatment (
Tables S3 and S4). N (%) was significantly affected by addition of organic/mineral fertilizer (F
1,70 = 10.7,
p < 0.001) but again not significant for plant classes and the interaction of treatment and plant classes (
Table 1).
In the leaf samples, C (%) was significantly different at different plant classes (F
3,70 = 25.2,
p < 0.001), and the interaction of the treatment and the plant classes was also significant (F
1,70 = 6.2,
p < 0.001;
Table 1). N (%) was significantly affected by addition of organic/mineral fertilizer, plant classes, and their interactions, respectively (F
1,70 = 44.0,
p < 0.001; F
3,70 = 24.4,
p < 0.001; F
1,70 = 11.8,
p < 0.001; respectively,
Table 1). For the root samples, the percentage of C was only affected by the plant classes (F
3,70 = 5.17,
p < 0.05), but the percentage of N was significantly changed due to the addition of organic/mineral fertilizer, plant classes, and their interactions (F
1,70 = 62.8,
p < 0.001; F
3,70 = 3.21,
p < 0.05; F
1,70 = 3.08,
p < 0.05; respectively,
Table 1 and
Table S5).
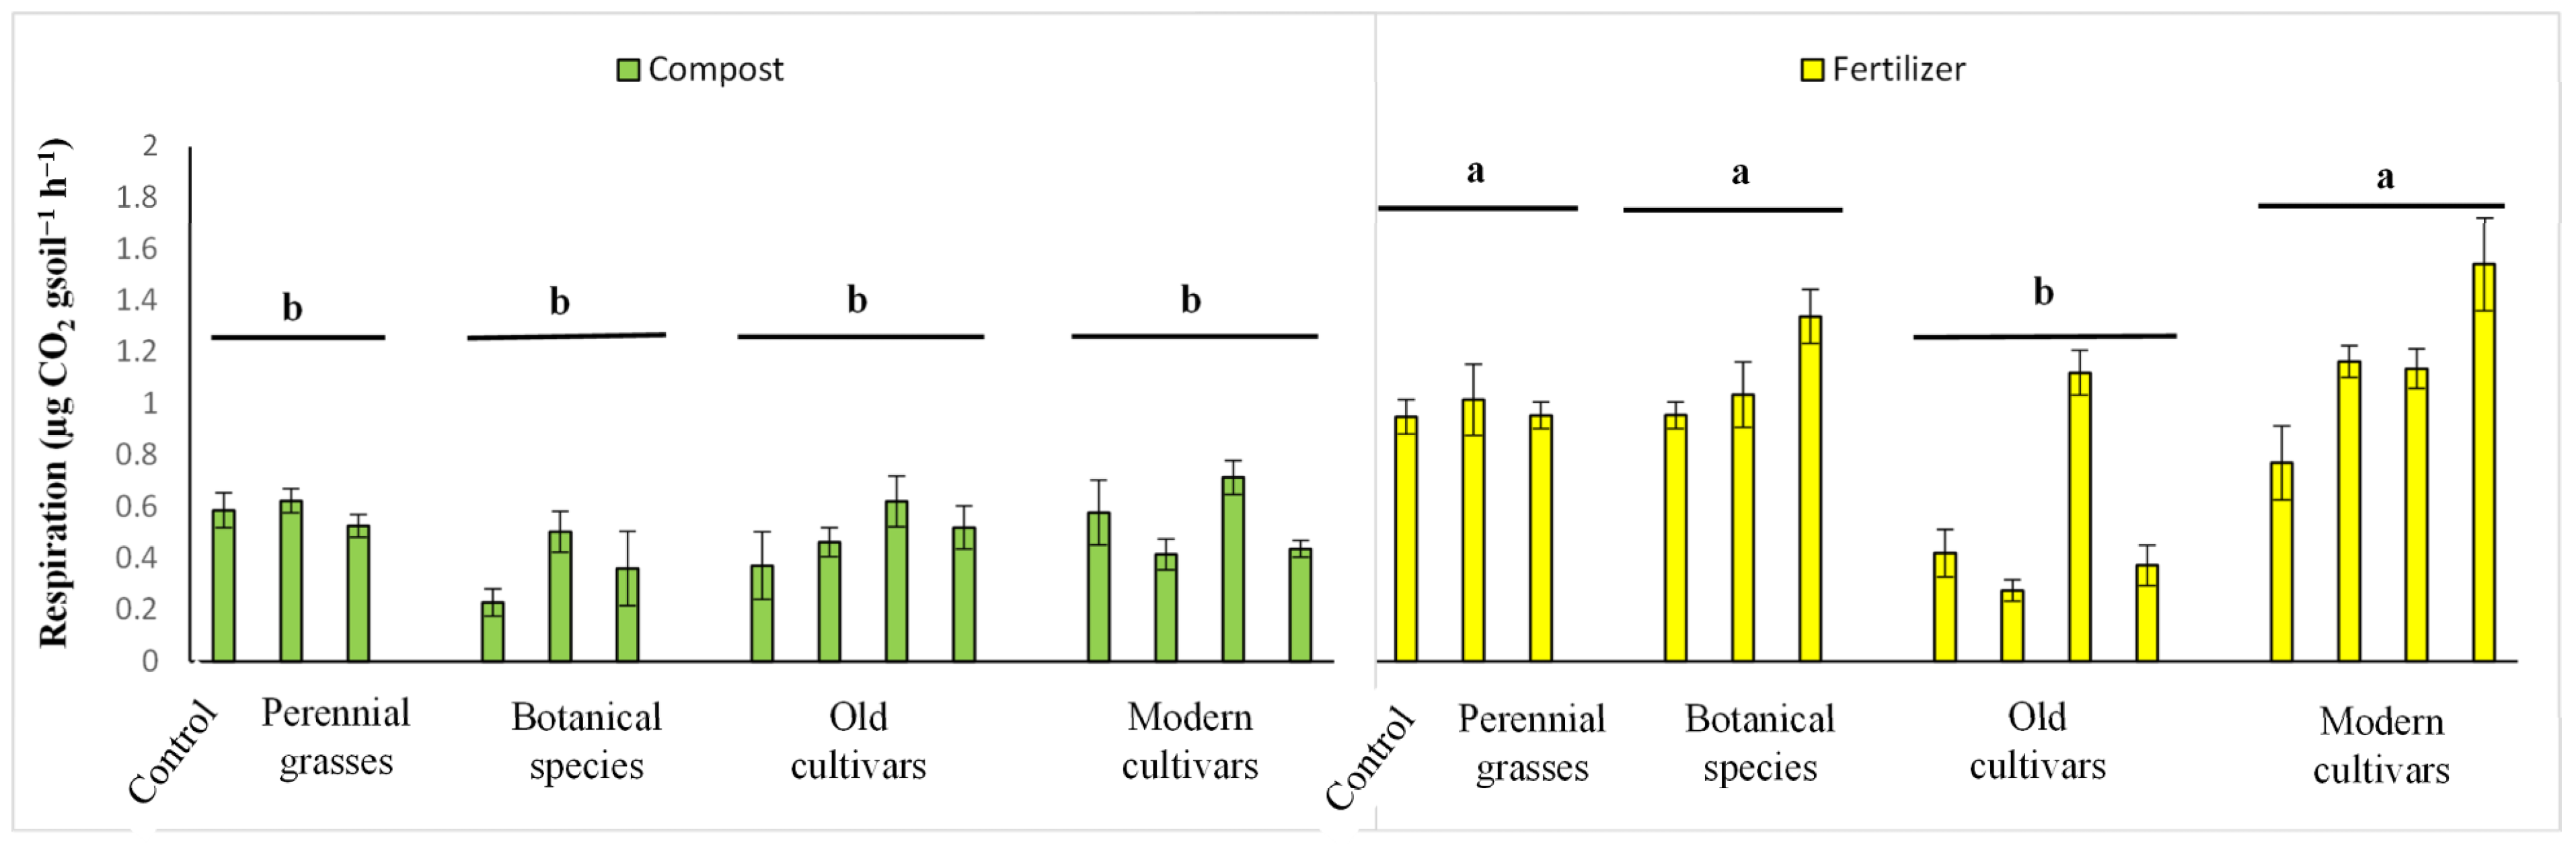
Microbial respiration was significantly higher in the fertilizer treatment compared to the organic fertilizer treatment (
Figure 4,
Table 1; F
1,122 = 79.4,
p < 0.001). Respiration was also significantly different among plant classes (F
3,122 = 9.61,
p < 0.001), and the interaction of organic/mineral fertilizer addition and plant classes was significant (F
1,122 = 10.6,
p < 0.001). Except for one barley old cultivar, generally old cultivars had the lowest respiration compared to other plant species in the fertilizer treatment, but respiration was almost similar in the cultivars in the organic fertilizer treatment (
Figure 4).
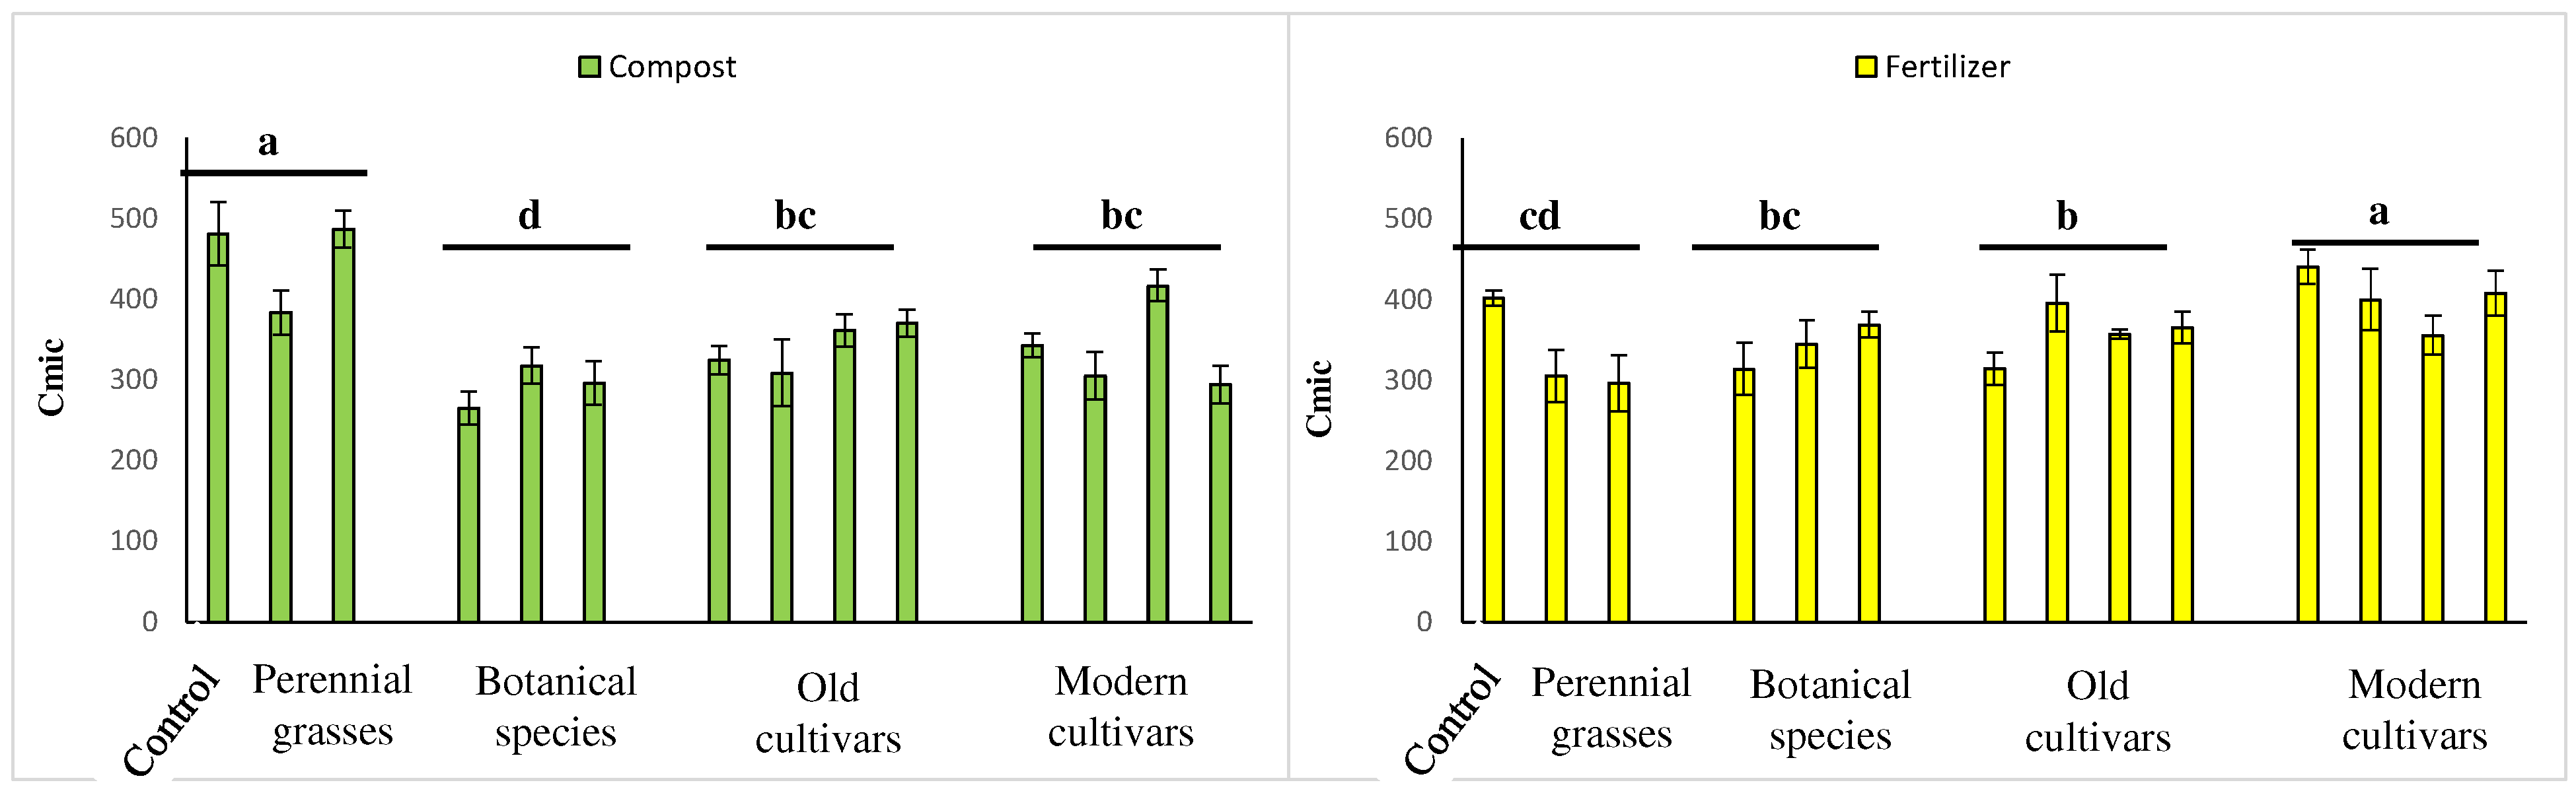
Microbial biomass C was affected by plant classes and the interaction of plant classes and organic/mineral fertilizer addition (F
3,70 = 4.58,
p < 0.01; F
1,70 = 12.1,
p < 0.001; respectively,
Table 1;
Figure 5). However, microbial biomass N was significantly different at different treatments, plant classes, and their interactions (F
1,70 = 39.7,
p < 0.001; F
3,70 = 23.1,
p < 0.001; F
1,70 = 11.6,
p < 0.001; respectively,
Table 1). The values for each treatment and different plant classes are shown in
Table S6. Microbial biomass C and N were mainly highest in the modern cultivars compared to other plant classes. The only exception was high microbial biomass C in the perennial grasses in the organic fertilizer treatment.
4. Discussion
Perennial grasses grew slower than all tested barley variants. This is consistent with well-established findings that growth of annuals is faster than growth of conspecific perennials [
22]. This pattern is similar for both above- and belowground parts of plants, which is in agreement with Garnier’s [
22] findings that showed faster growth of annuals was not entailed by changes in resource allocation between individual plant organs. Garnier [
22] proposed that this difference was due to a higher specific uptake rate in annuals, which promoted their higher growth. In our case, we can expect that smaller seed weight of grasses used in our experiment contributes to their slower seedling growth in comparison with barley cultivars.
In aboveground biomass, there was a general tendency of reduction in barley biomass in more intensive cultivars. This is in agreement with general trends observed in other cereal crops that shortening of plants or dwarfism is happening in breeding of more intensive cultivars [
23,
24,
25]. It allows larger allocation of resources to grains compared to other plant organs, provides lodging resistance, and allows to achieve plant density with better architecture. Dwarf plants are often better at using resources, namely, mineral fertilizers [
23,
24,
25].
Looking at the effect of organic and mineral fertilizers, all barley cultivars grew significantly better with organic than mineral fertilizers. This suggests that, particularly in soils with low organic matter content, mineral fertilizers cannot completely compensate for organic fertilizers. This is in agreement with extensive meta-analysis of Oldfield et al. [
26], who showed that organic matter availability is crucial for nitrogen use by crops. This is also in agreement with results of Sun et al. [
12], who found an inconsistent effect of mineral fertilization in undeveloped post-mining soils. The reduction in growth in mineral vs. organic fertilizer is significant and substantial also for modern cultivars, which are believed to be very efficient in using mineral fertilizers [
23,
24]. This result suggests that potential loss of soil organic matter content is associated with increasing temperature and decreasing organic matter input [
27], and this can drop the yield of the highly intensive barley varieties.
In belowground growth, the pattern is even more complex. In domesticated cultivars, mineral fertilization reduced root biomass, while the opposite was true in the wild cultivars. The reason for this finding is not clear and supports the conclusion of Fageria and Moreira [
28] that the response of root growth on mineral fertilizer may be complex, and fertilizer addition leads to an increase in root biomass in pure soil.
Here it should be noted that the amount of N in both systems was high and comparable or slightly higher in mineral fertilizer form. P was slightly higher in organic treatments and K in mineral ones. However, despite data given in total nutrients, it is likely that a larger proportion of nutrients in mineral fertilizer was in available forms, so a likely amount of available nutrients in mineral fertilizer treatment was likely higher than in organic treatments. On the other hand, mineral fertilizer was applied in regular pulses (every second or third day), and some part of the added fertilizer may be lost by leaching. Also release of nutrients from organic fertilizer may be stimulated by the plant effect on the microbial community and hence more proportional to plant growth.
Microbial biomass as well as C in bulk soil was significantly higher in treatments fertilized by organic fertilizer compared to mineral ones. This is in agreement with many other studies showing that the supply of organic matter in soil increases microbial biomass [
29,
30,
31]. Interestingly, treatment with organic fertilizer and higher microbial biomass also has lower respiration; this may be because of the fact that, as microbial biomass increases, the proportion of active microbes decreases, as well as specific microbial respiration expressed per unit of microbial biomass [
32]. Perennial grasses had significantly higher microbial biomass and C content in bulk soil than all barley varieties in organically fertilized soil but not in minerally fertilized soil. The reason for this pattern is not clear; nevertheless, it may be that root exudate intensity in perennial grasses substantially changes between soils supplied by organic and mineral fertilizer. However, we expect that plants are more likely to affect the activity of some transport mechanisms, which transfer organic matter from hotspots to bulk soil. Fungi, both mycorrhizal as well as saprophytic ones, are known to redistribute organic matter from spots with high organic matter content to spots with low organic matter content [
33]. So, it is possible that perennial grasses somehow promote this redistribution in soil more than tested barley varieties. It is interesting that, against our expectations, wild barley did not support more microbial biomass and C soil in comparison with domesticated varieties.
The results obtained in this study cannot be overinterpreted; this study is based on one simple, short-term greenhouse experiment, which uses a limited set of cultivars, one type of soil with low C content and one dose of fertilizers. Field verification of the results in more comprehensive field settings is needed before more general conclusions can be made. Rather than giving a universal answer, we try to highlight that the effect of plant breeding on plant–soil interactions represents an important and overlooked field with many practical implications for sustainable agriculture, which deserve future research.
5. Conclusions
Aboveground biomass was higher in organic fertilizer treatments, and the difference between botanical species and cultivars was more pronounced in mineral fertilizer treatments. Many modern cultivars perform better on organic than mineral fertilized, suggesting that some level of organic matter is essential for their yield. Aboveground and belowground biomass decreased from botanical species to old cultivars and contemporary cultivars. When hotspots of organic matter were provided, plants transferred this organic matter to the soil; this activity was more pronounced in perennial grasses than in barley treatments. Perennial grasses have a much higher root-shoot ratio than all barley treatments, and the root–shoot ratio decreased from botanical species towards modern cultivars, which means that barley in general provides less belowground litter to soil. This is even more enhanced in modern cultivars, which, in the long term, can together with other factors, contribute to the depletion of cultivated soil for organic matter, which may potentially negatively affect yield as shown above. One should be careful not to overinterpret this data as it is based on a simple laboratory experiment, but when proven in field realistic settings it may have clear implications for plant breeding and fertilization.



 ,
,