Article

Interactive Effects of Tillage, Nitrogen Fertilisation, and Herbicide Management: Impacts on Soil CO2 Emissions and Agroecosystem Dynamics in a Maize Production


by
Zainulabdeen Kh. Al-Musawi
1,2,
Agampodi Gihan S. D. De Silva
1,2,
Jabir Ali Abdinoor
1,
László Bede
1,
Dávid Stencinger
1,
Bálint Horváth
1,
Sándor Zsebő
1,2,
Áron Licskai
1,
Gergő Hegedüs
1,
Viktória Vona
3,
Gyula Pinke
3,
Bahar Makbule Temeltürk
1,2,
Emőke Ruzsics
1 and
István Mihály Kulmány
1,2,4,*
1
Agricultural and Food Research Centre, Széchenyi István University, 9026 Győr, Hungary
2
Department of Plant Sciences, Albert Kázmér Faculty of Agricultural and Food Sciences, Széchenyi István University, 9200 Mosonmagyaróvár, Hungary
3
Department of Water Management and Natural Ecosystems, Albert Kázmér Faculty of Agricultural and Food Sciences in Mosonmagyaróvár, Széchenyi István University, 9200 Mosonmagyaróvár, Hungary
4
HUN-REN-SZE PhatoPlant-Lab, Albert Kázmér Faculty of Agricultural and Food Sciences, Széchenyi István University, 9200 Mosonmagyaróvár, Hungary
*
Author to whom correspondence should be addressed.
Soil Syst. 2026, 10(2), 26; https://doi.org/10.3390/soilsystems10020026
Submission received: 17 December 2025 / Revised: 24 January 2026 / Accepted: 31 January 2026 / Published: 5 February 2026

Abstract

Agriculture must balance productivity with greenhouse gas emissions, biodiversity, and resource concerns. This study examined how tillage (conventional, CT; minimum, MT), nitrogen fertilisation (0–221 kg N ha−1), and herbicide rates (0–100%) interactively affected soil CO2 emissions, vegetation vigour, and weed diversity in maize production during 2022. A factorial experiment was conducted on a 1 ha with 40 plots monitored soil temperature, moisture, penetration resistance, normalised difference vegetation index (NDVI), weed diversity (Simpson’s Index), and CO2 emissions (closed-chamber method). Minimum tillage increased soil water retention (9.3 ± 6.5% vs. 5.4 ± 4.3%), soil temperature (28.0 ± 1.5), and compaction (0.6 ± 0.3 vs. 0.1 ± 0.0 MPa), while enhancing weed diversity (0.53–0.80 vs. 0.38–0.67). MT produced higher CO2 emissions than CT, especially at 147 kg N ha−1 (49.9 ± 15.7 vs. 29.1 ± 11.6 μmol m−2 s−1), peaking under MT-147 kg N ha−1-H75 (79.4 ± 1.2 μmol m−2 s−1). NDVI responses varied between tillage systems; under CT, vegetation vigour peaked at 75% herbicide application, while under MT vegetation was more responsive to nitrogen and more sensitive to herbicide, highlighting nitrogen × herbicide interaction trade-offs. Overall, MT enhanced water conservation and weed diversity but increased short-term CO2 emissions. This study reports first-year, site-specific results from an ongoing multi-year field experiment; therefore, the findings were interpreted as short-term, season-specific responses. This highlights the need for site-specific, climate-smart management that integrates emissions, soil health, biodiversity, and productivity.

1. Introduction

The world is increasingly confronted with food insecurity, water scarcity, land degradation, energy shortages, and climate change, all exacerbated by rising greenhouse gas (GHG) emissions [1,2,3]. GHGs—primarily carbon dioxide (CO2), methane (CH4), and nitrous oxide (N2O)—trap solar radiation and intensify global warming [4,5]. Anthropogenic activities contribute over 55% of global GHG emissions [6,7], with agriculture alone accounting for approximately 20–23% [8,9], including more than 22% from direct agricultural operations [10]. Among these gases, CO2 accounts for the largest proportion. Atmospheric CO2 levels have steadily increased since the pre-industrial era, primarily caused by fossil fuel combustion and land-use change [11,12,13,14,15]. Agricultural activities contribute substantially to CO2 emissions by influencing the soil carbon dynamics [16]. Soils emit CO2 through microbial respiration, organic matter decomposition, and root activity processes intensified by tillage, nitrogen fertilisation, and herbicide use [17,18,19], and are further affected by the changes in organic matter content, soil temperature, moisture, type, the level of residue burning, and microbial metabolism [16,20]. Consequently, soil CO2 emissions are a key indicator of the influence of agricultural management on agroecosystem carbon dynamics.
Although the individual impacts of tillage, nitrogen, and herbicides are well documented [21,22], their combined and interactive effects are unclear. This gap is particularly relevant in maize cultivation, where all three inputs are extensively used, limiting progress toward climate-smart agriculture [23,24,25]. Understanding how these practices interact is essential for developing sustainable systems that reduce GHG emissions while maintaining agroecosystem functionality and productivity. This aligns with the broader European sustainability objectives outlined in the European Green Deal’s “Farm to Fork” strategy, which highlights the importance of precision agriculture, digitalisation, and biodiversity restoration to balance productivity with environmental protection [26].
Tillage operations significantly alter soil structure and organic matter decomposition, directly affecting CO2 emissions. Conventional tillage (CT), which involves intensive soil disturbance, promotes the rapid oxidation of soil organic matter, leading to short-term CO2 peaks [27]. In contrast, no-till and minimum tillage (MT) reduce physical disruption, maintain soil carbon stocks, and moderate emissions over time [9]. Cillis et al. [28] reported that these practices could reduce soil organic carbon losses by up to 63%. Despite these potential benefits, conservation tillage systems also modify soil physical and biological conditions in ways that may alter short-term CO2 emissions, and their interaction with nitrogen and herbicide management requires further investigation.
To address this knowledge gap, this study had the following specific objectives:
  • Quantify the effects of CT and MT systems on soil CO2 emissions and selected soil physical properties.
  • Assess the response of vegetation vigour (NDVI) to different soil management practices, including CT and MT.
  • Evaluate the effects of herbicide dose on vegetation vigour under CT and MT systems at different nitrogen fertilisation rates.
  • Examine the combined effects of nitrogen fertilisation and herbicide dose on vegetation vigour within each tillage system.
  • Analyse weed diversity patterns using Simpson’s Index and explore their relationships with vegetation vigour and soil CO2 emissions under different agricultural practices.
  • Assess soil CO2 emissions under different tillage systems at the same nitrogen fertilisation levels and herbicide doses.
  • Examine the interactive effects of nitrogen fertilisation and herbicide application on soil CO2 emissions within CT and MT systems.
Several studies have shown that reduced tillage improves carbon sequestration compared with CT [29,30,31,32]. A 35% reduction in CO2 emissions under no-till in wheat was reported by Nawaz et al. [16], linked to improved soil properties. Passianoto et al. [33] observed higher short-term CO2 emissions from CT than those from no-till in tropical soils, and Dachraoui and Sombrero [34] noted that tillage intensity influences maize carbon footprints in semi-arid areas. Holland [35] highlighted the potential of conservation tillage to reduce emissions in Europe. However, these findings are not universal across all regions and management contexts.
The reported effects of reduced or no-tillage (NT)on soil CO2 emissions remain inconsistent. Some studies have reported equal or higher CO2 emissions under no-till systems, depending on the climate, crop type, and soil properties [9,36,37,38,39,40]. Smith et al. [20] emphasised that the effectiveness of conservation tillage depends on long-term soil responses and environmental conditions, underscoring the need for evaluation across diverse agroecological contexts.
Although, nitrogen fertilisation essential for productivity, it accelerates soil respiration and CO2 emissions. Nitrogen inputs stimulate microbial activity, with effects varying by the rate, fertiliser formulation, and timing [41,42,43,44,45]. The impacts also depend on soil characteristics, climatic conditions, and management [46]. Therefore, nitrogen management therefore plays a central role in regulating soil biological processes and overall soil health, highlighting the importance of practices that sustain biological functions while minimising environmental harm [47,48]. As nitrogen availability influences both plant growth and microbial metabolism, its interaction with tillage systems is particularly important for understanding soil CO2 emission dynamics.
Herbicide application, which is central to modern weed control, can affect microbial and soil respiration. Kinney et al. [49] reported ambiguous effects on soil CO2. Zabaloy and Gómez [50] found that low doses of glyphosate and 2,4-D temporarily suppressed emissions, whereas higher doses increased emissions by disrupting the microbial communities. Sándor et al. [51] observed that different herbicides formulations affect CO2 differently. As herbicide use directly alters vegetation structure, biomass inputs, and residue composition, it may indirectly affect soil respiration through changes in plant–soil interactions. This study focused on three maize herbicides—Calaris Pro, Eucarol Plus, and Milagro 240—which are effective post-emergence for controlling both broadleaf and grass weeds [52,53,54].
Despite the widespread and simultaneous application of tillage, nitrogen fertilisation, and herbicide use in agricultural systems, their combined effects on CO2 emissions remain under-researched. Most existing studies have examined these inputs individually or in pairs, but their joint impact on soil CO2 emissions remain largely unknown [55].
To address this knowledge gap, this study investigated the interactive effects of CT and MT, nitrogen fertilisation rate, and herbicide doses on soil CO2 emissions, vegetation vigour (including both crops and weeds), and weed diversity in a maize-based agroecosystem at an experimental farm in northwestern Hungary. By addressing this gap under realistic field conditions, this research aims to contribute to sustainable agriculture by strengthening the scientific basis for integrated, site-specific management strategies that balance soil health, and vegetation dynamics and reduce GHG emissions while maintaining productivity.

2. Materials and Methods

2.1. Site Description and Experimental Design

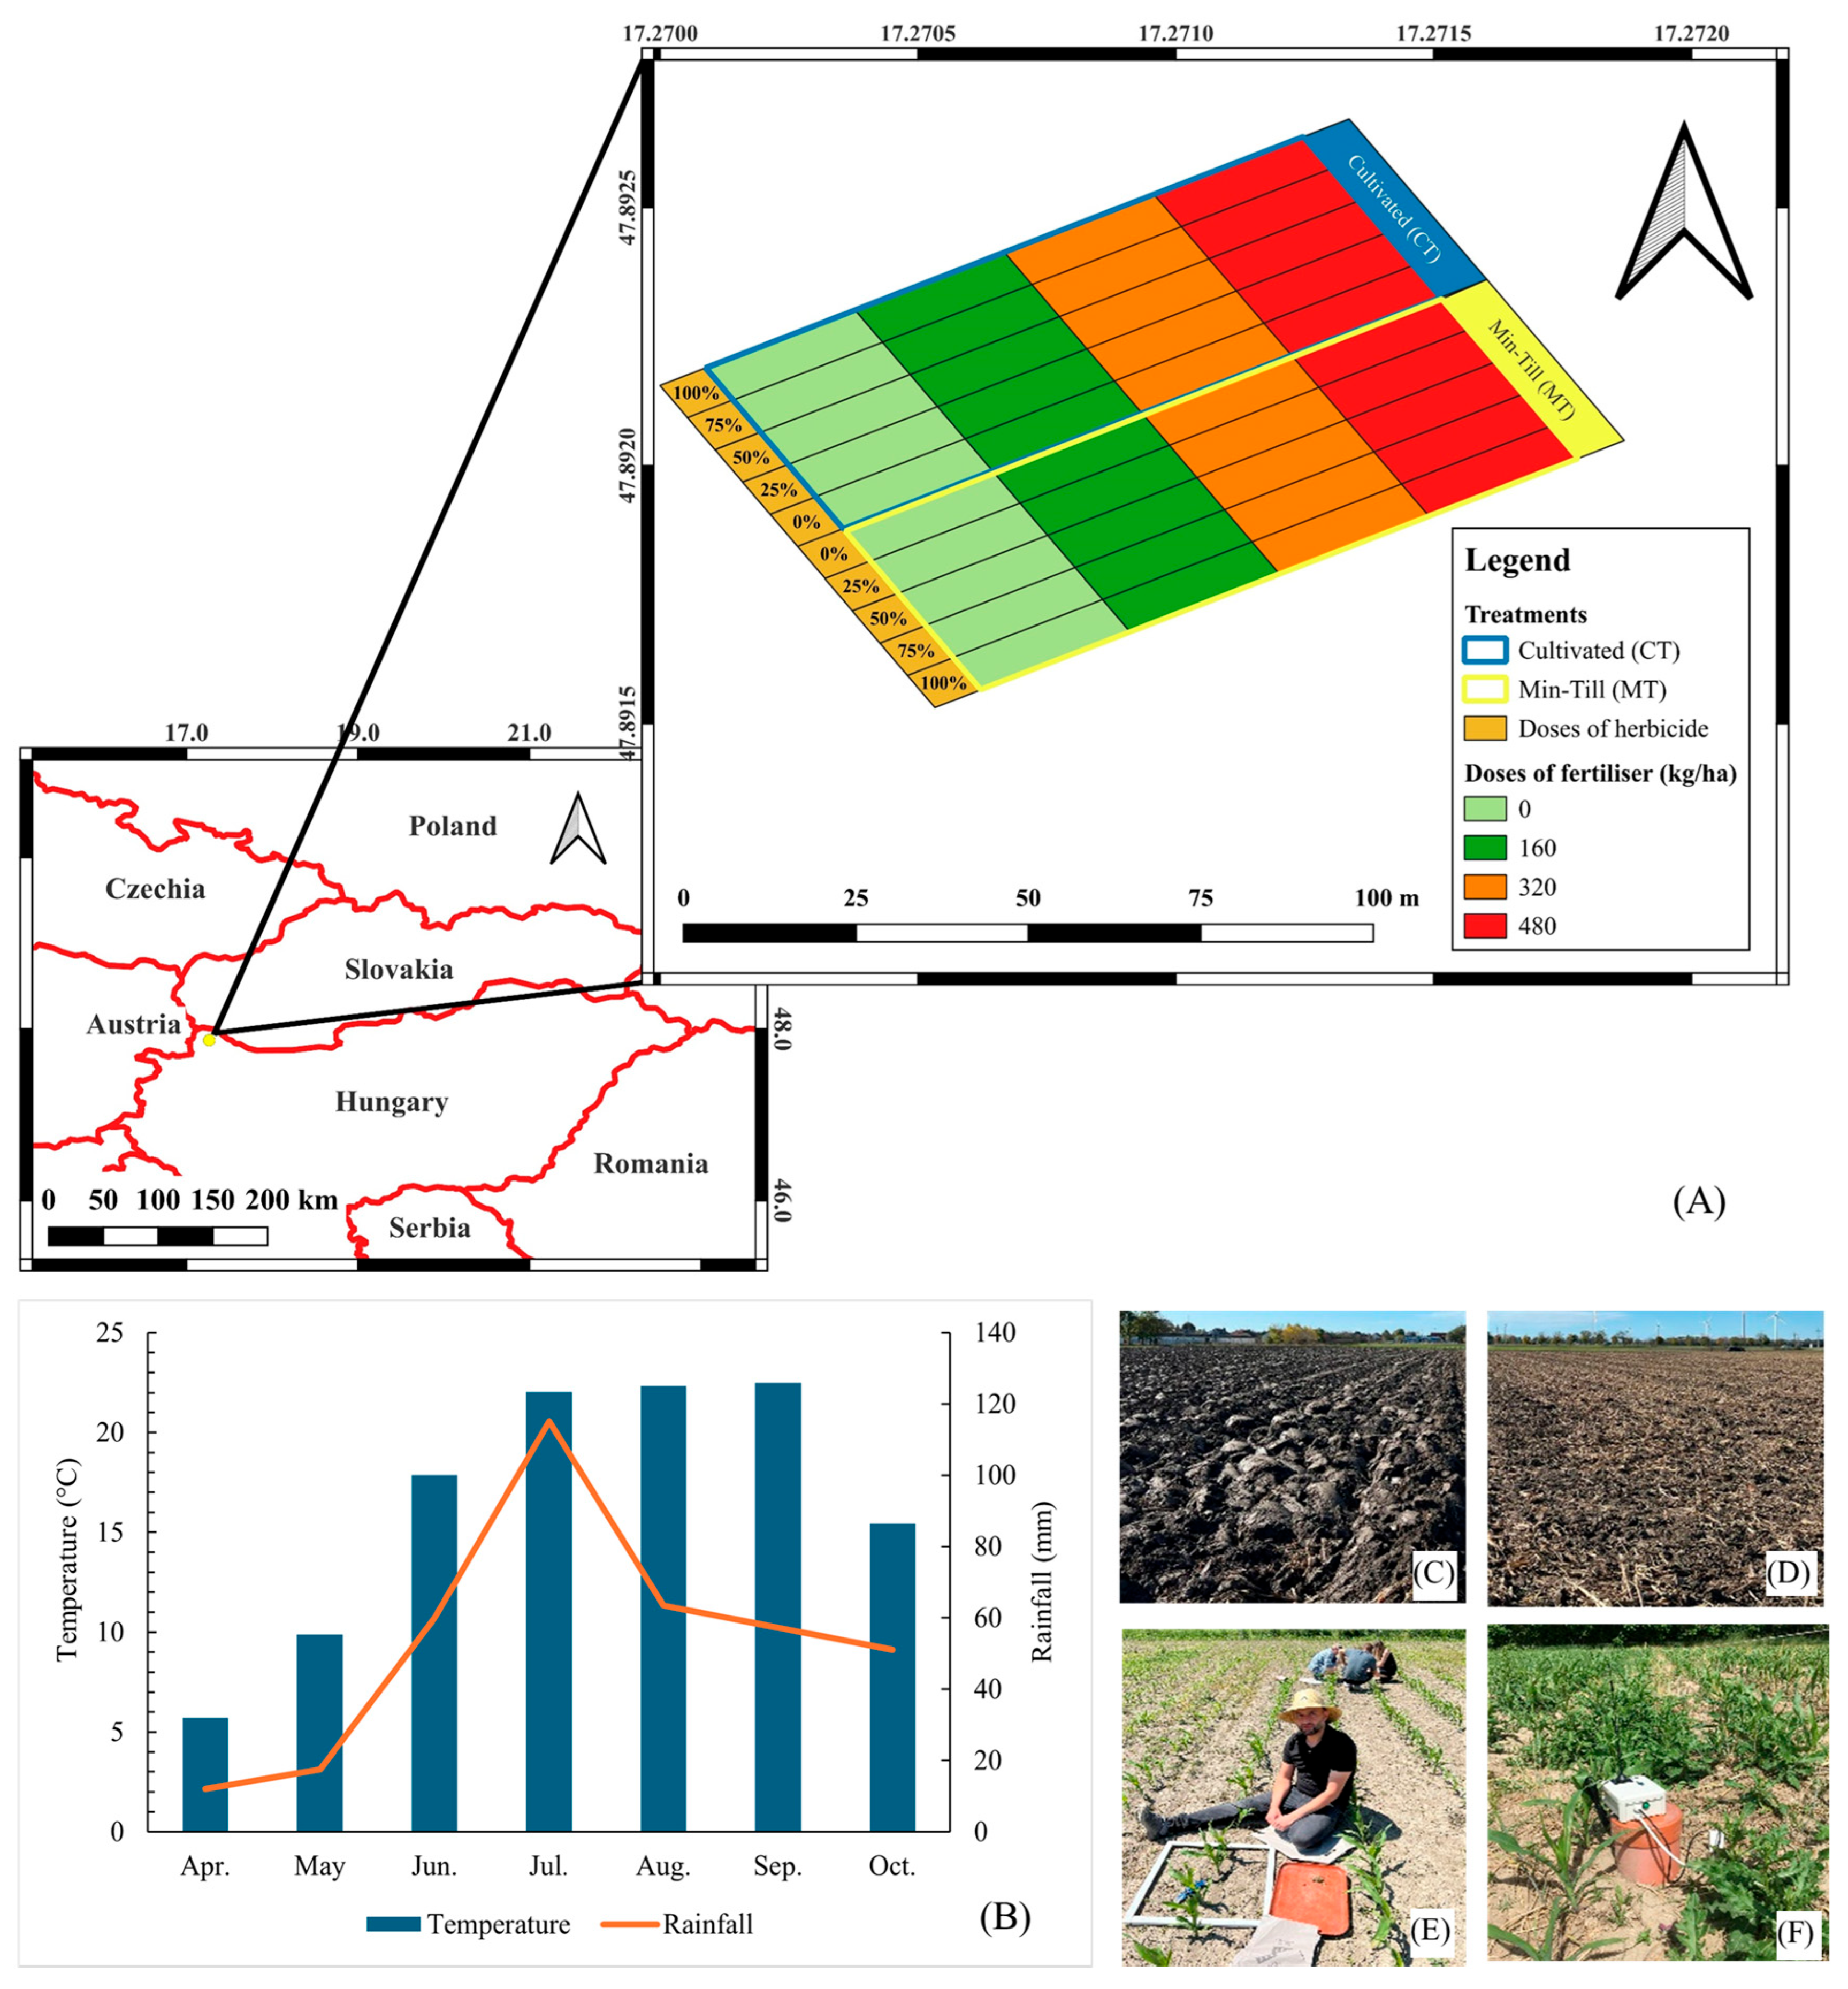
The research was conducted at the Széchenyi István University experimental farm, called Smart Farm, in Mosonmagyaróvár, northwestern Hungary (47°53′30.7″ N, 17°16′16.9″ E), at an elevation of 119 m above mean sea level. The region has a temperate, continental climate with cold winters, no dry season, and warm to hot summers [56]. The monthly average temperatures range from −4 °C to 22 °C, and the annual rainfall averages 594 ± 51 mm [56,57,58] (Figure 1).
During the 2022 growing season, the mean temperature was 16.5 °C and total rainfall was 376.4 mm. Monthly temperatures from April to October averaged 5.7 °C, 9.9 °C, 17.9 °C, 22.0 °C, 22.3 °C, 22.5 °C, and 15.4 °C, with maximum values of 14.8 °C, 15.3 °C, 23.3 °C, 28.7 °C, 29.0 °C, 28.1 °C, and 21.1 °C, respectively. This pattern reflects a steady rise from early spring, peaking in late summer, and declining in the autumn. Monthly precipitation averaged 12.1 mm, 17.5 mm, 60.0 mm, 115.1 mm, 63.4 mm, 57.2 mm, and 51.1 mm, respectively (Figure 1B).
The soil is a Danube alluvial soil with clay loam texture, pH 7.9 ± 0.0 (CV = 0.23%) (both tillage practices), low organic matter (3%), and total nitrogen of 1.9 g kg−1 ± 0.1 (CV = 4.6%) under CT and 1.9 g kg−1 ± 0.1 (CV = 7.6%) under MT (Table 1). The experimental field was characterised by a uniform soil type and texture, and baseline soil properties showed low coefficients of variation across the experimental area.
In 2021, winter wheat (Triticum aestivum L.) was grown, harvested, and the field was managed with stubble discing on 28 July 2021 to incorporate residues at a shallow depth of 5 cm. Winter wheat was sown in autumn 2020 and harvested in summer 2021. The residue cover was not quantitatively assessed and is referenced in this study only as a qualitative characteristic of the preceding crop and tillage system.
The 2022 maize experiment assessed the effects of herbicide dose, nitrogen rate, and tillage systems (CT and MT) on soil CO2 emissions.
The total area was 1.5 ha, with a central 1.0 ha experimental area divided into 40 plots of 250 m2 each (20 plots to CT and 20 to MT) (Figure 1). The remaining 0.5 ha served as a buffer zone to reduce the influence of external environmental and agrotechnological factors. Within each 250 m2 plot, sampling locations and measurement points were selected randomly to minimise local spatial bias. Although each treatment combination (tillage × nitrogen × herbicide) was represented by a single large plot, nitrogen and herbicide treatments within each tillage system were arranged in a predefined factorial grid. The relatively large plot size (250 m2) and intensive within-plot random sampling were used to mitigate the effects of spatial soil heterogeneity. All measurements were replicated at least three times, with three random soil samples (0–20 cm) collected per plot for analysis. Replication was achieved through multiple randomly located measurements within each plot (e.g., three soil samples per plot), which were averaged to obtain a single plot-level value prior to statistical analysis.
The experiment followed a factorial design: two tillage × four nitrogen × five herbicide levels (0%, 25%, 50%, 75%, and 100% of the recommended dose, coded as H0, H25, H50, H75, and H100) = 40 plots (Figure 1A). Plots were assigned to CT or MT according to a predefined field layout, and within each tillage system, the nitrogen and herbicide treatments were arranged in a predefined factorial grid. Replication was achieved through multiple randomly located measurements within each plot, and the individual plot (250 m2) was considered the experimental unit for all statistical analyses. Although the experiment was established as a full factorial design (2 tillage × 4 nitrogen × 5 herbicide), statistical analyses were conducted in a stratified manner to address specific management-related research questions, as described in Section 3.3.
Tillage involved moldboard ploughing (MTZ 820 + KÜHNE plough) for CT, conducted at an operating depth of 30 cm, and disc tillage (MTZ 820 + RXT3 disc harrow) for MT, conducted at a shallower depth of 8 cm. Soil was cultivated on April 5 using a New Holland TM165 tractor (New Holland Agriculture, Basildon, UK) with an Agrikon 6.6 m combinator (AGRIKON KAM Kft., Kiskunmajsa, Hungary), followed by seedbed preparation on April 7 using the same equipment (Table 1).
Nitrogen fertiliser (Genezis Karbamid, 46% N: Péti Nitrokomplex Kft., Pétfürdő, Hungary) was applied at 0, 74, 147, and 221 kg N ha−1), broadcast onto the soil surface and mechanically incorporated to a depth of approximately 3–5 cm to enhance availability and minimise volatilisation losses. The 74 and 147 kg N ha−1 rates represent the practical range of recommended nitrogen doses for maize in Hungary; therefore, our research focused on these levels to reflect the typical field conditions.
Herbicides (Calaris Pro (Syngenta AG, Basel, Switzerland; local representative: Syngenta Kft., Budapest, Hungary), Eucarol Plus (Syngenta S.p.A., Albizzate, Italy; local representative: Syngenta Kft., Budapest, Hungary), Milagro 240 (Syngenta, Budapest, Hungary)) were applied in the afternoon at the 3–5 leaf stage of weeds at 0%, 25%, 50%, 75%, and 100% of the recommended dose (H0–H100) when the air temperature reached 20 °C. The full dose treatment (H100) corresponded to a fixed commercial herbicide package applied to 2000 m2, consisting of 2.3 L ha−1 Calaris Pro (active ingredients: mesotrione and terbuthylazine), 0.2 L ha−1 Milagro 240 (active ingredient: nicosulfuron), and 0.5 L ha−1 Eucarol Plus (adjuvant); reduced herbicide treatments were obtained by proportionally decreasing the application rates of all components while maintaining the same mixture composition and ratios across treatments.
Calaris Pro (2,3 L/h−1), Eucarol Plus (0.0.5 L/ha−1), and Milagro 240 (0.2 L/ha−1) were mixed and applied at 200 L ha−1 using a calibrated field boom sprayer (Biardzki 300, 8 m boom width; Zakład Mechaniki Maszyn i Urządzeń Rolniczych Sławomir Biardzki, Zbuczyn, Poland) equipped with nozzles (11002, yellow, size 02). The sprayer was set to 3 bar pressure, the boom height to 50 cm, and the travel speed to 4.7 km h−1. Calibration included checking the sprayer functionality, verifying nozzle flow rates (0.79 L min−1 at 3 bar), and adjusting the driving speed to deliver the target spray volume of 200 L ha−1 to ensure uniform distribution across the plots. Applications targeted broadleaf weeds (2–4 leaf stage) and grass weeds (3–5 leaf stage) (Table 1).
Maize (SY Minerva, Syngenta) was sown on April 19 at 72,000 seeds ha−1, 50 mm deep, with 25 cm row spacing within rows and 75 cm between rows. No irrigation was applied during the experiment (Table 1).

2.2. Measurements of CO2 Emissions, Soil Temperature, Moisture, and Penetration Resistance

Soil CO2 emissions were quantified using the closed chamber method. A Global Positioning System (GPS) marked a 0.1 m radius circle at each measurement point. CO2 emissions were monitored once on 30 May 2022, 19 days after the herbicide application on 11 May. Weather conditions prior to the soil CO2 measurements were documented to provide context for the sampling period. No rainfall occurred during the four days before sampling (0.0 mm), and cumulative precipitation during the eight days before measurement was minimal 0.77 mm (SD = 1.83). Temperature during the four days prior to sampling averaged 17.28 °C (SD = 3.30 °C), and during the eight days prior to sampling averaged 17.93 °C (SD = 2.22 °C). Polyvinyl chambers (20 cm high and 14 cm in diameter) were placed between crop rows in areas free of wheel traffic, buried 5 cm deep, and sealed hermetically to prevent gas exchange during the measurements. This depth was sufficient to ensure an airtight seal while minimising soil disturbance and lateral-gas diffusion. The chambers were installed 25 min before measurement to allow equilibration, thereby enabling stabilisation of the chamber headspace and soil–atmosphere gas exchange conditions and reducing potential pressure-related artefacts. For each measurement point, CO2 concentration was recorded six consecutive times.
Soil CO2 emissions (µmol m−2 s−1) were calculated from the temporal changes in CO2 concentration using an equation derived from the ideal gas law. Flux calculations explicitly accounted for the chamber volume and surface area, air temperature, and atmospheric pressure. CO2 concentration was recorded during each chamber deployment using an NDIR CO2 sensor (SKU:SEN0220; Gravity: UART Infrared CO2 sensor), while air temperature (°C) and air pressure (Pa) were measured during each chamber deployment using integrated sensors (AM2302/DHT22 air temperature sensor and SEN0251 air pressure sensor); all sensors were sourced from DFRobot (Shanghai, China), and these values were directly incorporated into the flux calculation.
Soil CO2 emissions were measured at a single, standardised time point to enable controlled comparison among tillage, nitrogen, and herbicide treatments under identical environmental conditions; therefore, the reported values represent instantaneous fluxes rather than cumulative, seasonal, or annual emissions.
A portable infrared gas analysis system, developed and calibrated by Kulmány [59] at Széchenyi István University (Győr, Hungary), was used to monitor the CO2 concentrations. Measurements were conducted between 10:00 a.m. and 3:00 p.m. to minimise the diurnal temperature effects on CO2 fluxes. At the same locations and time as the CO2 emission measurements, soil temperature was measured using digital DS18B20 soil temperature sensors (DFRobot, Shanghai, China) inserted into the topsoil at a depth of 5 cm (probe length 5 cm, diameter 6 mm). Four sensors were used for soil temperature measurements and accuracy verification, providing an accuracy of ±0.5 °C. Soil moisture was measured using analogue capacitive soil moisture sensors (SKU: SEN0193, DFROBOT, Shanghai, China) with a sensor length of approximately 10 cm, integrated into the CO2 measurement system [59,60]. On the same day, three random soil samples (0–20 cm) were collected per plot and analysed in the laboratory of Széchenyi István University (9200 Mosonmagyaróvár, Hungary) using an AgroCares scanner (AgroCares B.V., Wageningen, The Netherlands) and near-infrared spectroscopy (NIRS), which provides baseline measurements of soil organic matter and other key soil properties, including soil organic matter (%), total nitrogen (g kg−1), phosphorus (M3), exchangeable potassium, calcium and magnesium, potentially mineralizable nitrogen, cation exchange capacity, total aluminium, total iron, and clay content [61,62].
Soil penetration resistance was measured concurrently using a 06.15SA Penetrologger (Royal Eijkelkamp, Giesbeek, The Netherlands) at a maximum speed of 2 cm s−1 with a 2 cm2 cone. Each point was measured three times for accuracy. The distances between the measurement locations (50–75 cm) and the measurement radius (maximum 2.5 m from the sampling point) were determined according to Campbell and O’Sullivan [63] and the Dutch standard NEN 5140, 1996 [64].

2.3. Aboveground Measurements

Weed biomass and species diversity were assessed to evaluate the effects of nitrogen, tillage, and herbicide doses on weed communities. The sampling of weed biomass conducted on 1 June 2022, one day after the measurements of soil CO2 emissions, Normalised Different Vegetation Index (NDVI), and soil physical properties (30 May 2022). For each treatment plot (250 m2), four random samples of weed vegetation were collected, at least 1 m from field edges, by cutting plants at the soil surface using four randomly placed quadrats per treatment plot, with a 0.5 × 0.5 m quadrat for consistency. The species were separated, weeds were counted to determine abundance, and fresh biomass was recorded. The samples were oven-dried at 75 °C for 72 h and reweighed to the nearest milligram [65].
NDVI values were obtained from Sentinel-2 satellite imagery (Bands 4 and 8) to assess vegetation health (weed and crop) under different treatments and explore potential relationships between the observed biomass and soil CO2 emissions [66,67]. NDVI values were interpreted as indicator of overall vegetation vigour within each plot, reflecting the combined greenness of crop and weed vegetation, rather than crop performance alone.
Weed species diversity was calculated using Simpson’s diversity index expressed as 1 − D Value, where values closer to 1 indicate higher species diversity, accounting for both species richness and relative abundance (Table 2).
    1 D = 1 [ N ( N 1 ) n i ( n i 1 ) ]
where
D = Simpson’s dominance index
n = number of individuals of the i-th species
N = total number of individuals of all species
∑ = summation over all species
Table 2. Interpretation of Simpson’s diversity index values [68,69].
1 − D ValueInterpretation
0.00No diversity (monoculture)
0.01–0.10Very low diversity
0.11–0.30Low to moderate diversity
0.31–0.50Moderate diversity
0.51–0.70High diversity
0.71–0.90Very high diversity
0.91–1.00Maximum diversity

2.4. Statistical Analysis

Although the experiment followed a full factorial design, statistical analyses were conducted in a stratified manner to address specific management questions, including between-tillage comparisons and nitrogen × herbicide interactions within each tillage system. The individual plot (250 m2) was considered the experimental unit for all analyses, and multiple measurements collected within plots were averaged prior to analysis and were not treated as independent replicates. Statistical analyses were conducted according to the experimental design and the data type. The results subsections are organised thematically (soil physical properties, NDVI, weed diversity, and soil CO2 emissions); therefore, the subsection numbering reflects variable-specific groupings rather than a strictly sequential order. Microsoft Excel 2024 with the Data Analysis ToolPak was used for data organisation and initial comparisons, including t-tests. Excel-based t-tests were used exclusively for simple two-group comparisons and were not applied to factorial treatment effects, which were analysed using ANOVA in GenStat. GenStat Twelfth Edition (Procedure Library Release PL20.1, VSN International Ltd., Hemel Hempstead, UK) was used for the analyses of variance (ANOVA) and post hoc comparisons.
For each measured variable—including soil temperature, soil moisture, soil compaction, soil CO2 emissions, and NDVI—the means and standard deviations (SDs) were calculated. Levene’s test was assess the homogeneity of variances. Based on these results, equal-variance or unequal-variance t-tests were conducted in Excel. These tests were applied to the following:
  • Section 3.1: Comparison of soil physical properties (temperature, moisture, and compaction) between CT and MT.
  • Section 3.1.1: Comparison of NDVI under different soil management practices.
  • Section 3.3.1 and Section 3.3.2: Comparison of soil CO2 emissions under CT and MT at the same nitrogen level and herbicide dose, and under the same nitrogen level.
For experiments involving multiple herbicide doses under 74 and 147 kg N ha−1, as well as for weed diversity and biomass, one-way ANOVA was performed using GenStat. This applied to:
To evaluate the combined effects of nitrogen level and herbicide dose on NDVI and soil CO2 emissions within each tillage system, a two-way ANOVA was conducted using GenStat. This applied to:
where significant differences were found (p < 0.05). Fisher’s Protected Least Significant Difference (LSD0.05) test was used for the pairwise comparisons. A significance threshold of p < 0.05 was applied for all tests [70,71,72].

3. Results

3.1. Soil Physical Properties Response to Different Tillage Systems in Agricultural Practices

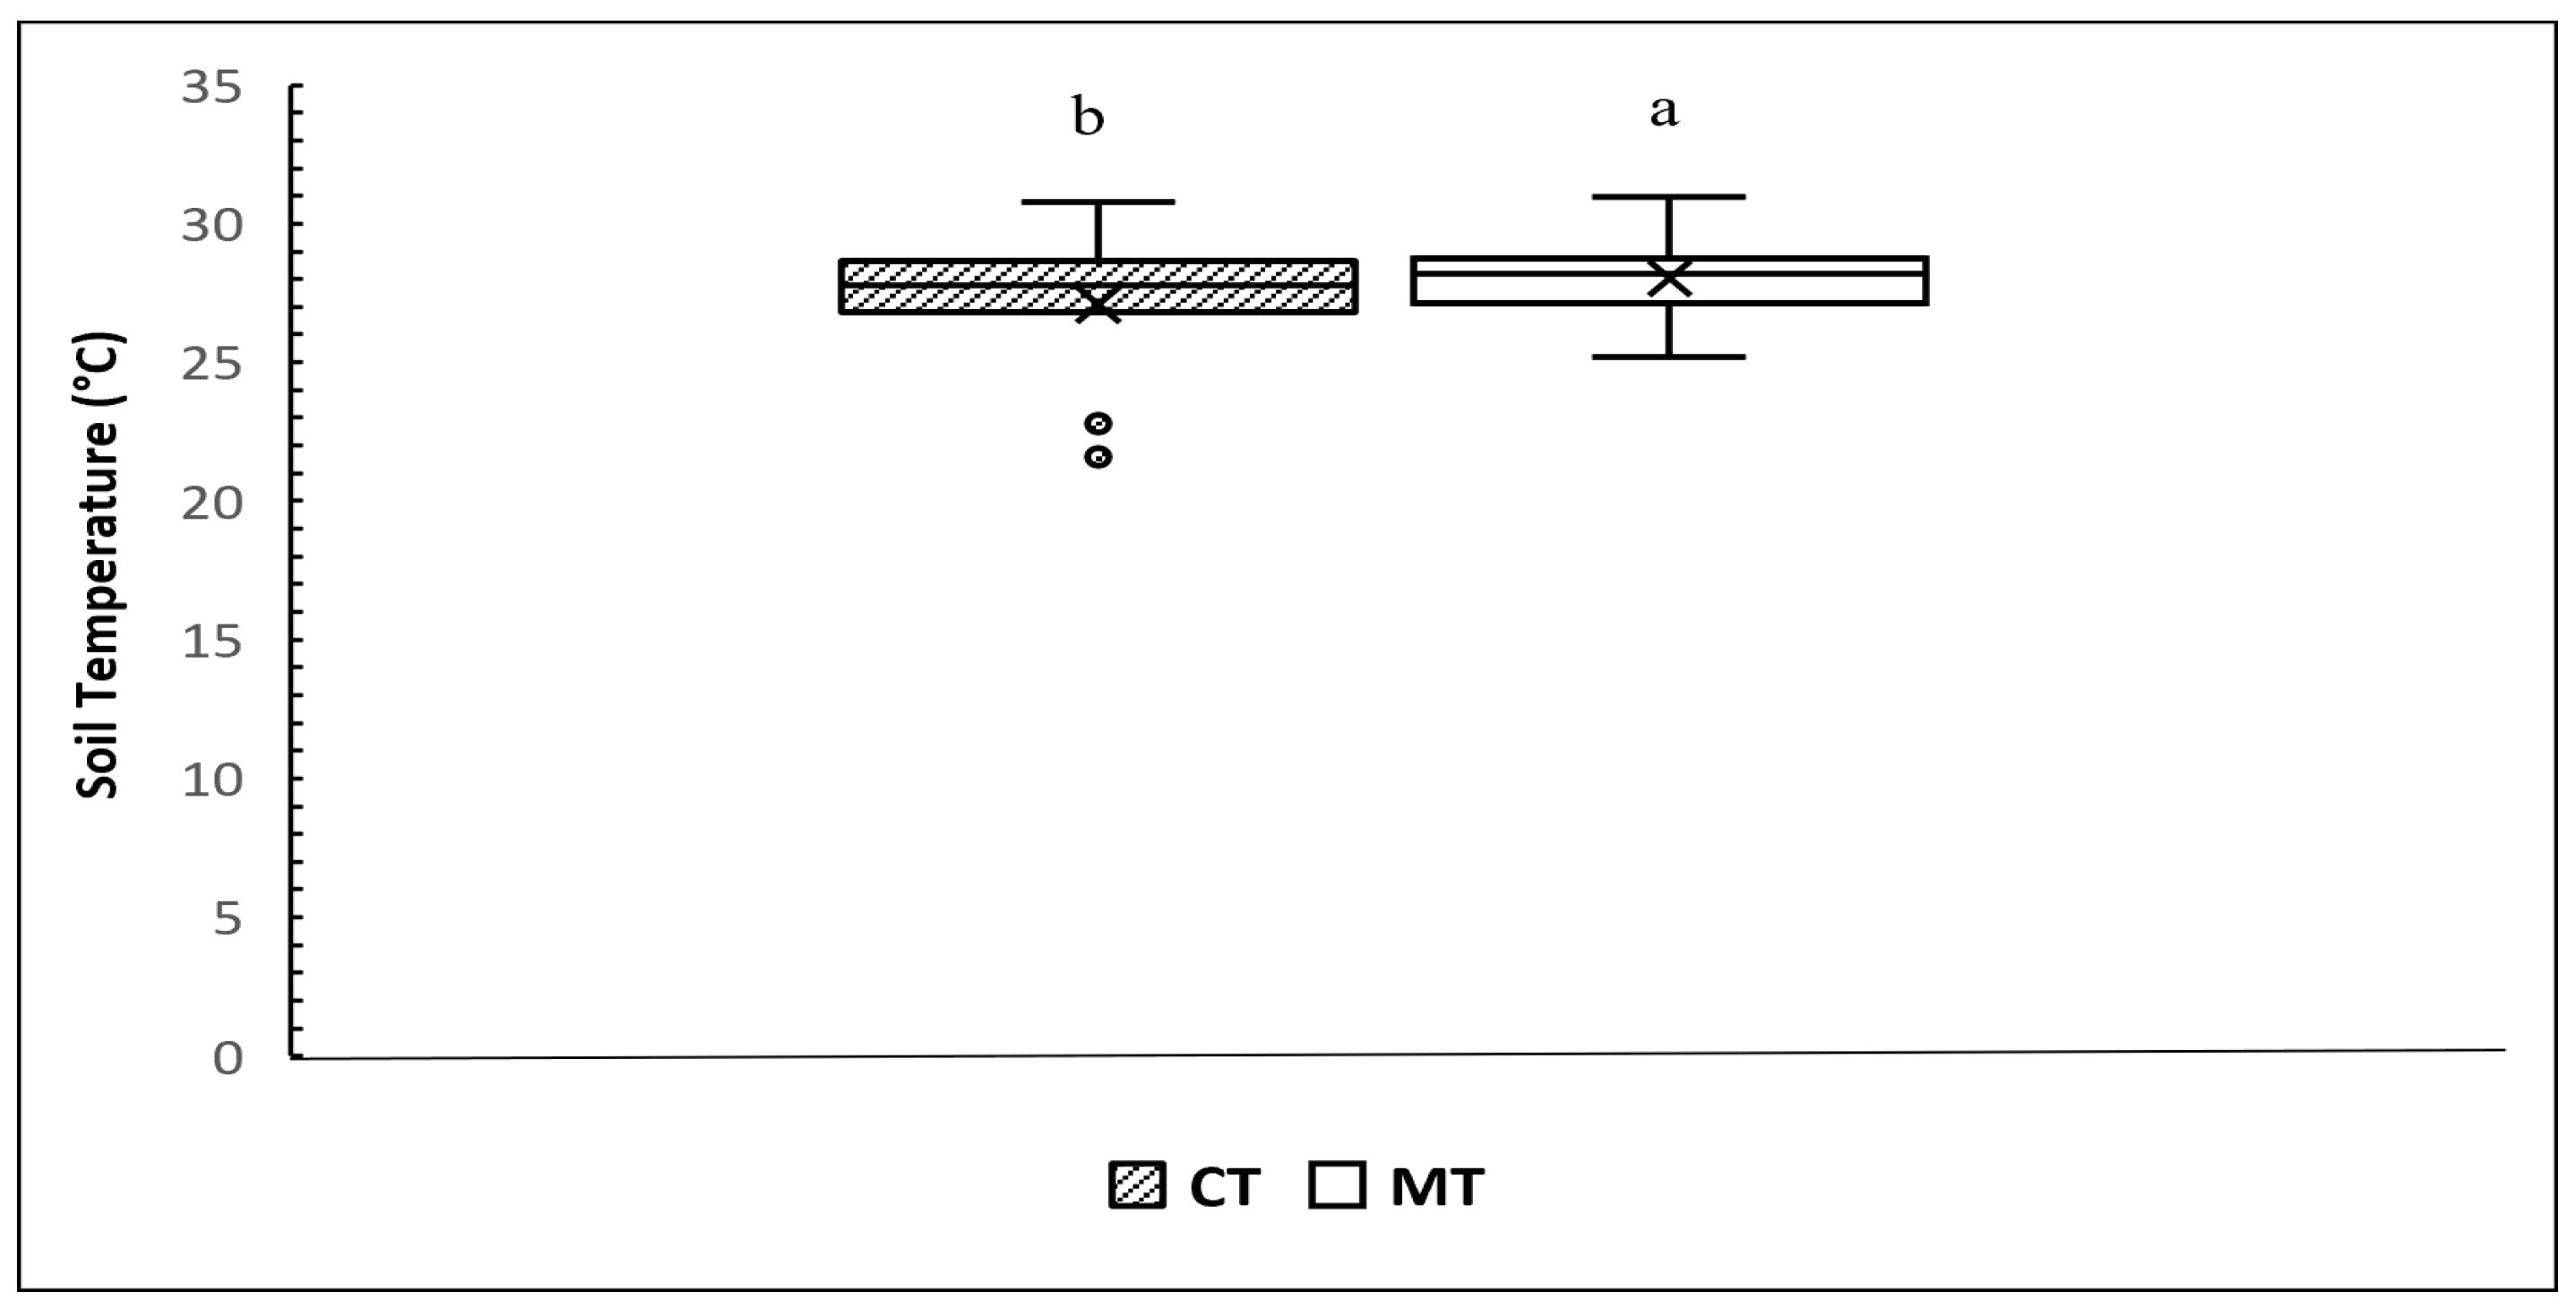
Soil temperature, moisture, and penetration resistance were evaluated under CT and MT. The average soil temperature differed significantly (p < 0.05), with CT recording 27.1 ± 2.5 °C and MT recording 28.0 ± 1.5 °C (Figure 2). Statistical analysis confirmed that MT significantly increased the soil temperature compared to CT.
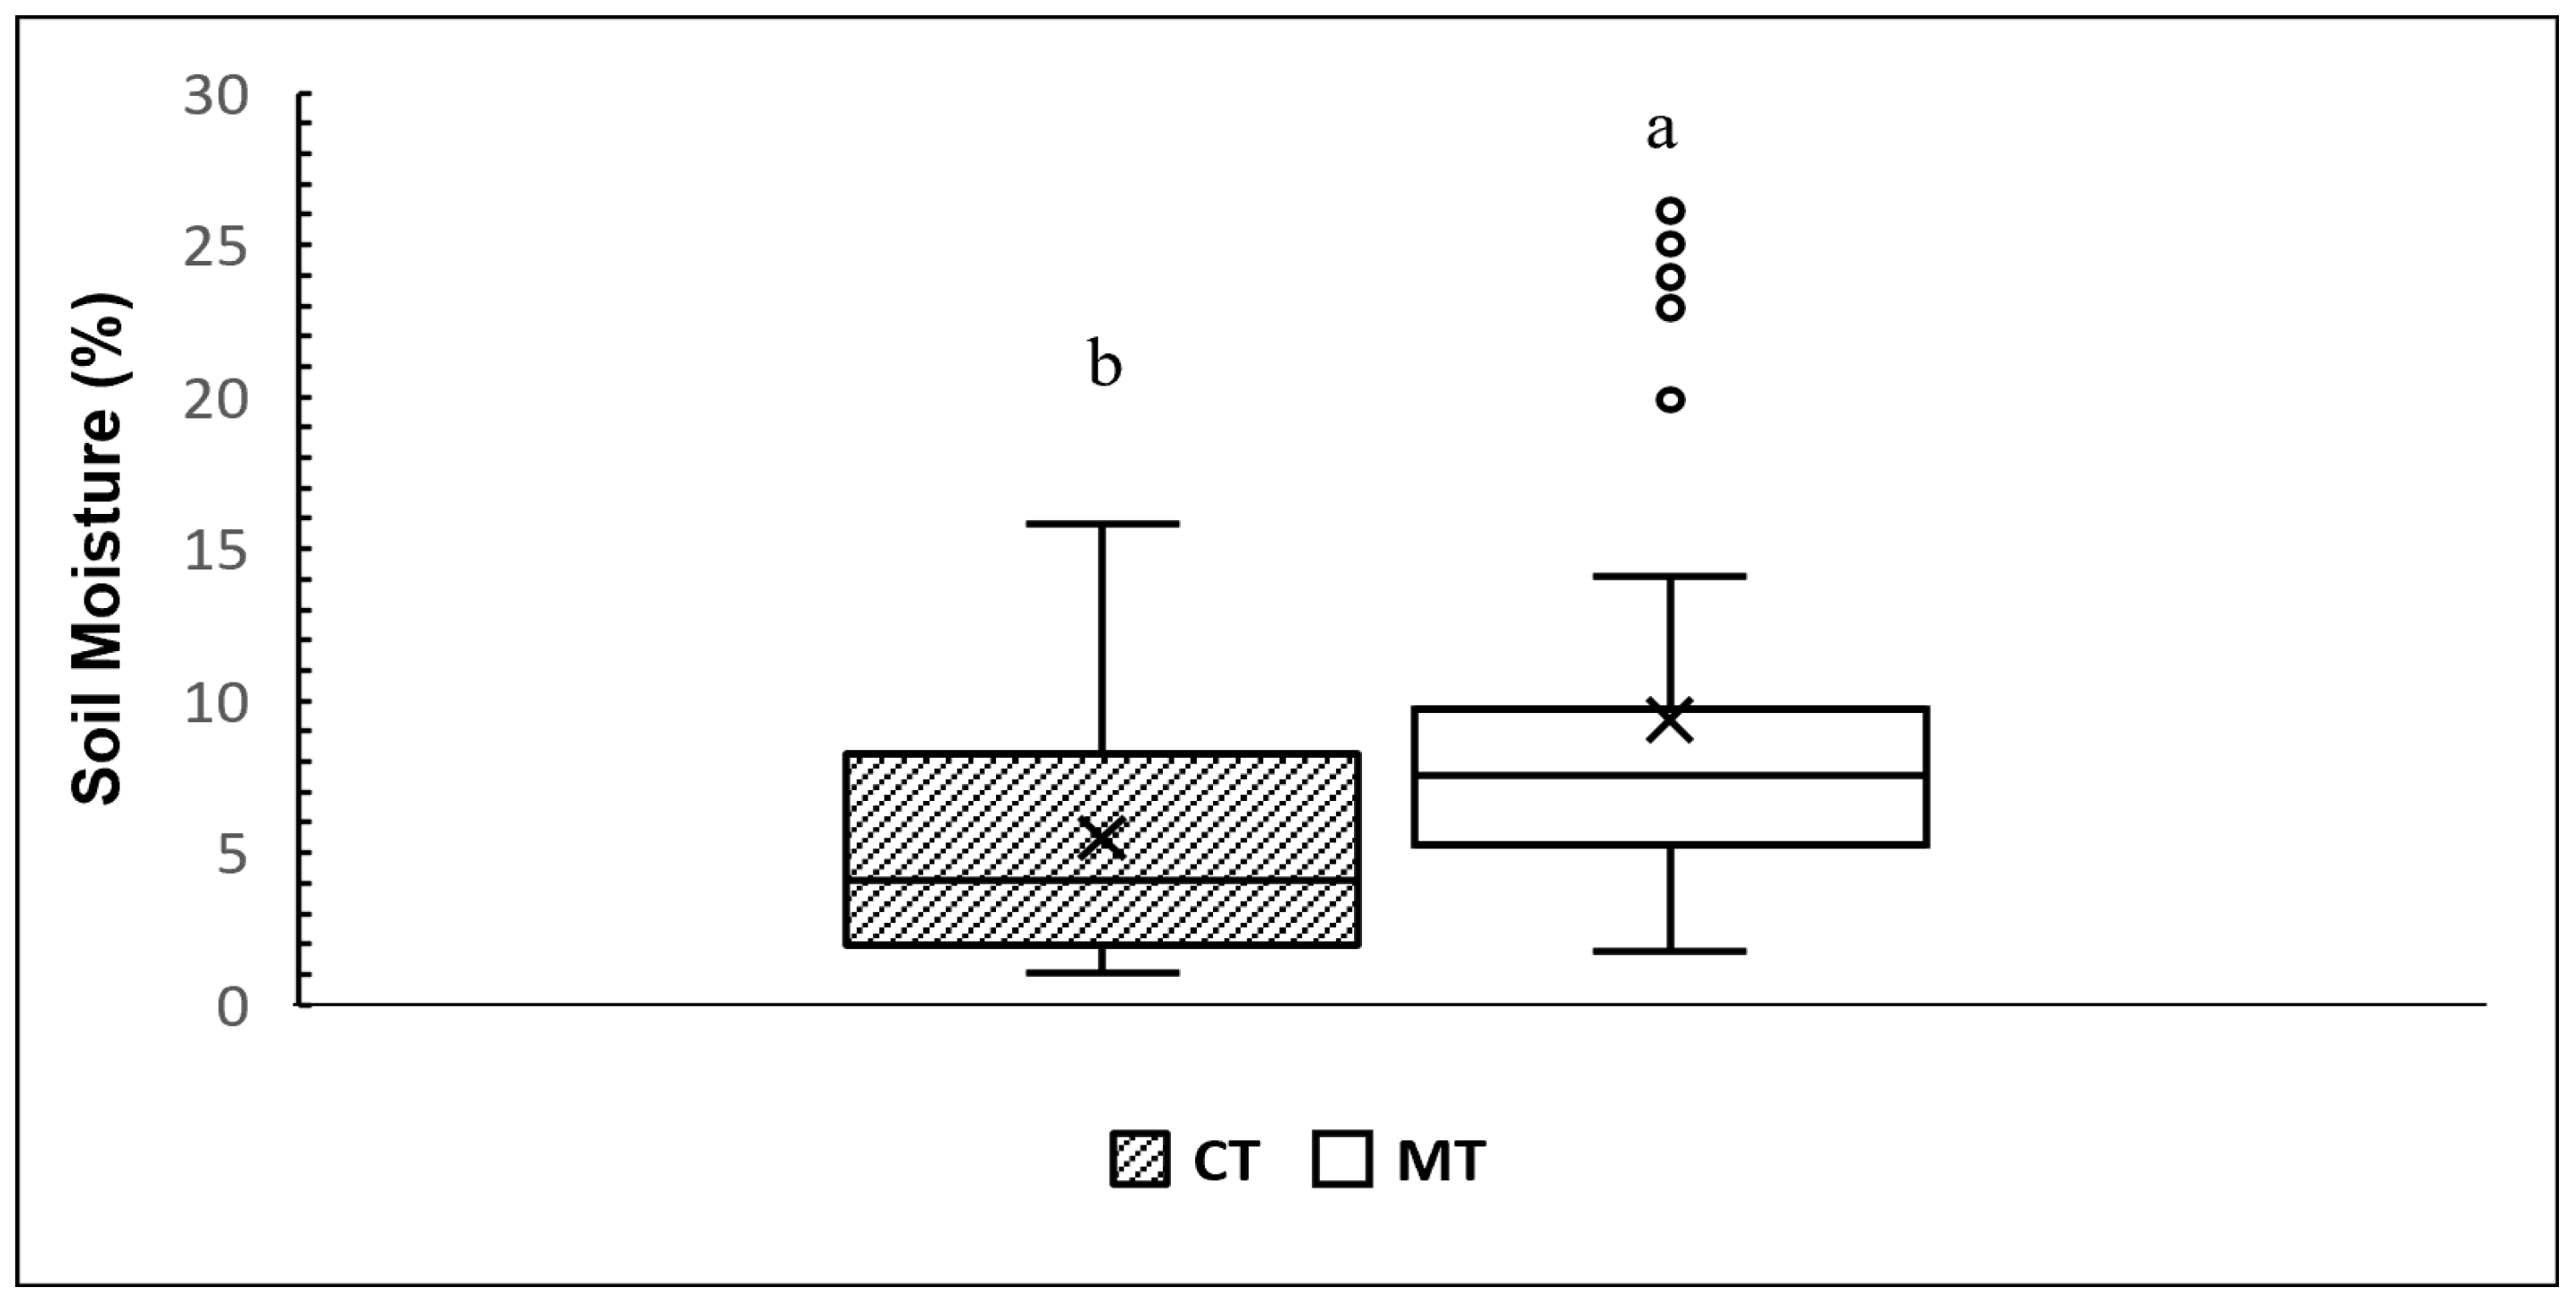
Soil water content (Figure 3) was also significantly influenced by tillage (p < 0.05), with MT retaining higher moisture (9.3 ± 6.5%) than CT (5.4 ± 4.3%).
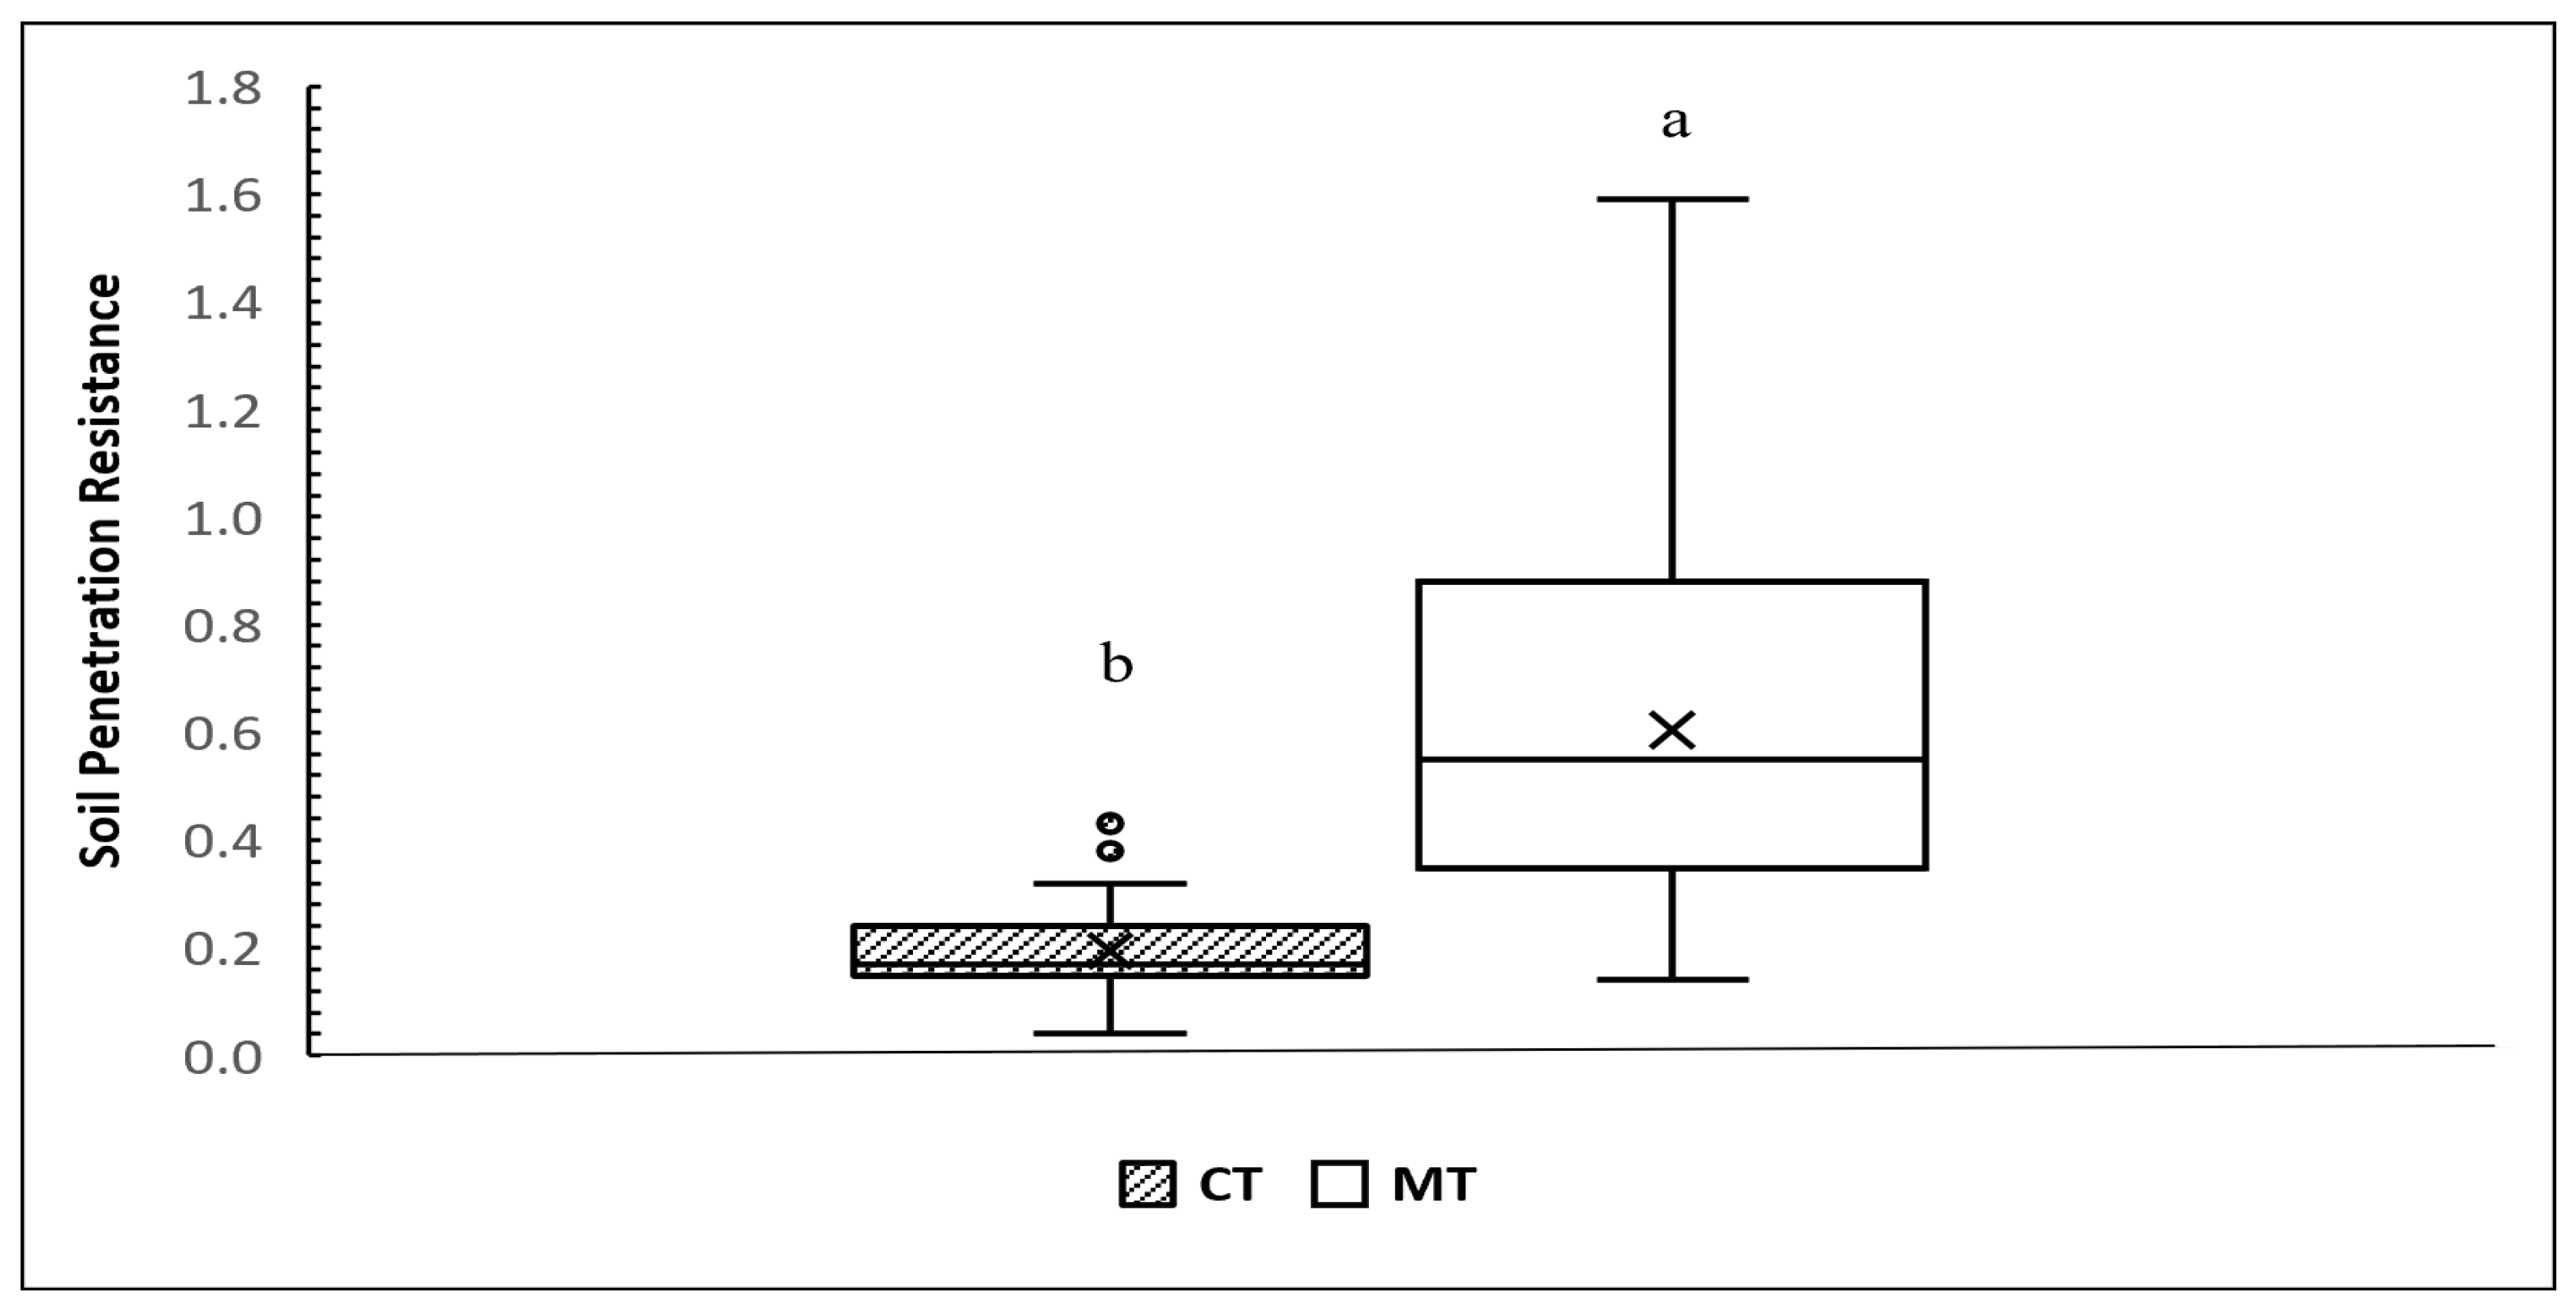
Penetration resistance at 0–10 cm depths showed significant differences (p < 0.05), with MT exceeding CT (0.6 ± 0.3 vs. 0.1± 0.0 MPa; Figure 4). The values under MT were more than double of those under CT, indicating increased soil compaction. These results confirm that tillage systems significantly affect soil penetration resistance, with MT promoting higher resistance than CT.

3.1.1. NDVI Under Different Soil Management Practices

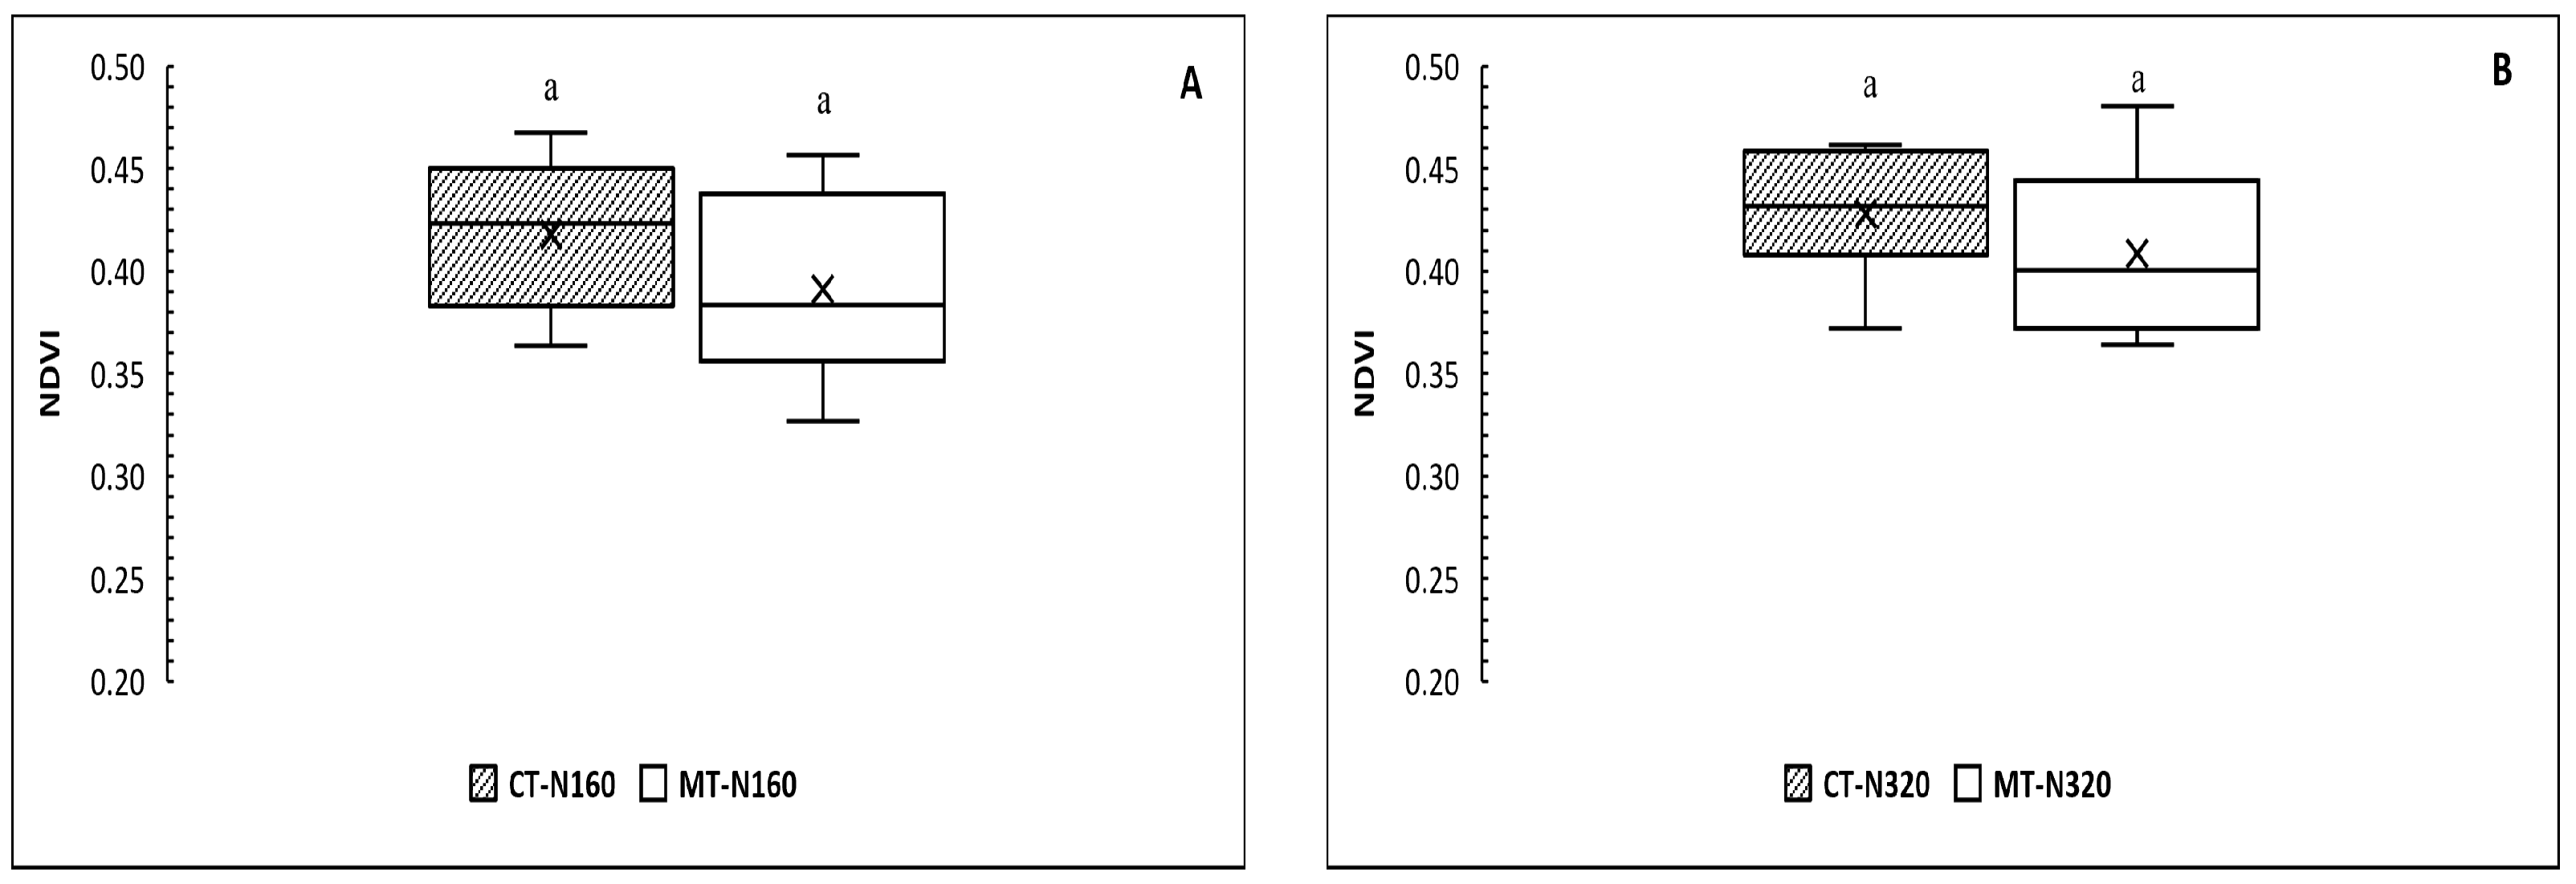
At both nitrogen levels (74 and 147 kg N ha−1), no significant differences (p > 0.05) were observed in NDVI between CT and MT. CT values were slightly higher but not statistically significant. At 74 kg N ha−1, NDVI was 0.41 ± 0.03 under CT and 0.39 ± 0.05 under MT (Figure 5A). At 147 kg N ha−1, NDVI was 0.42 ± 0.03 for CT and 0.40 ± 0.04 for MT (Figure 5B), confirming that tillage systems did not significantly affect NDVI at either nitrogen level. As NDVI captures the spectral signal of all green vegetation, the observed NDVI patterns reflect the combined responses of both crop and weed components to the applied management practices.

3.1.2. Effect of Herbicide Dose on NDVI Under Conventional Tillage with Different Nitrogen Input

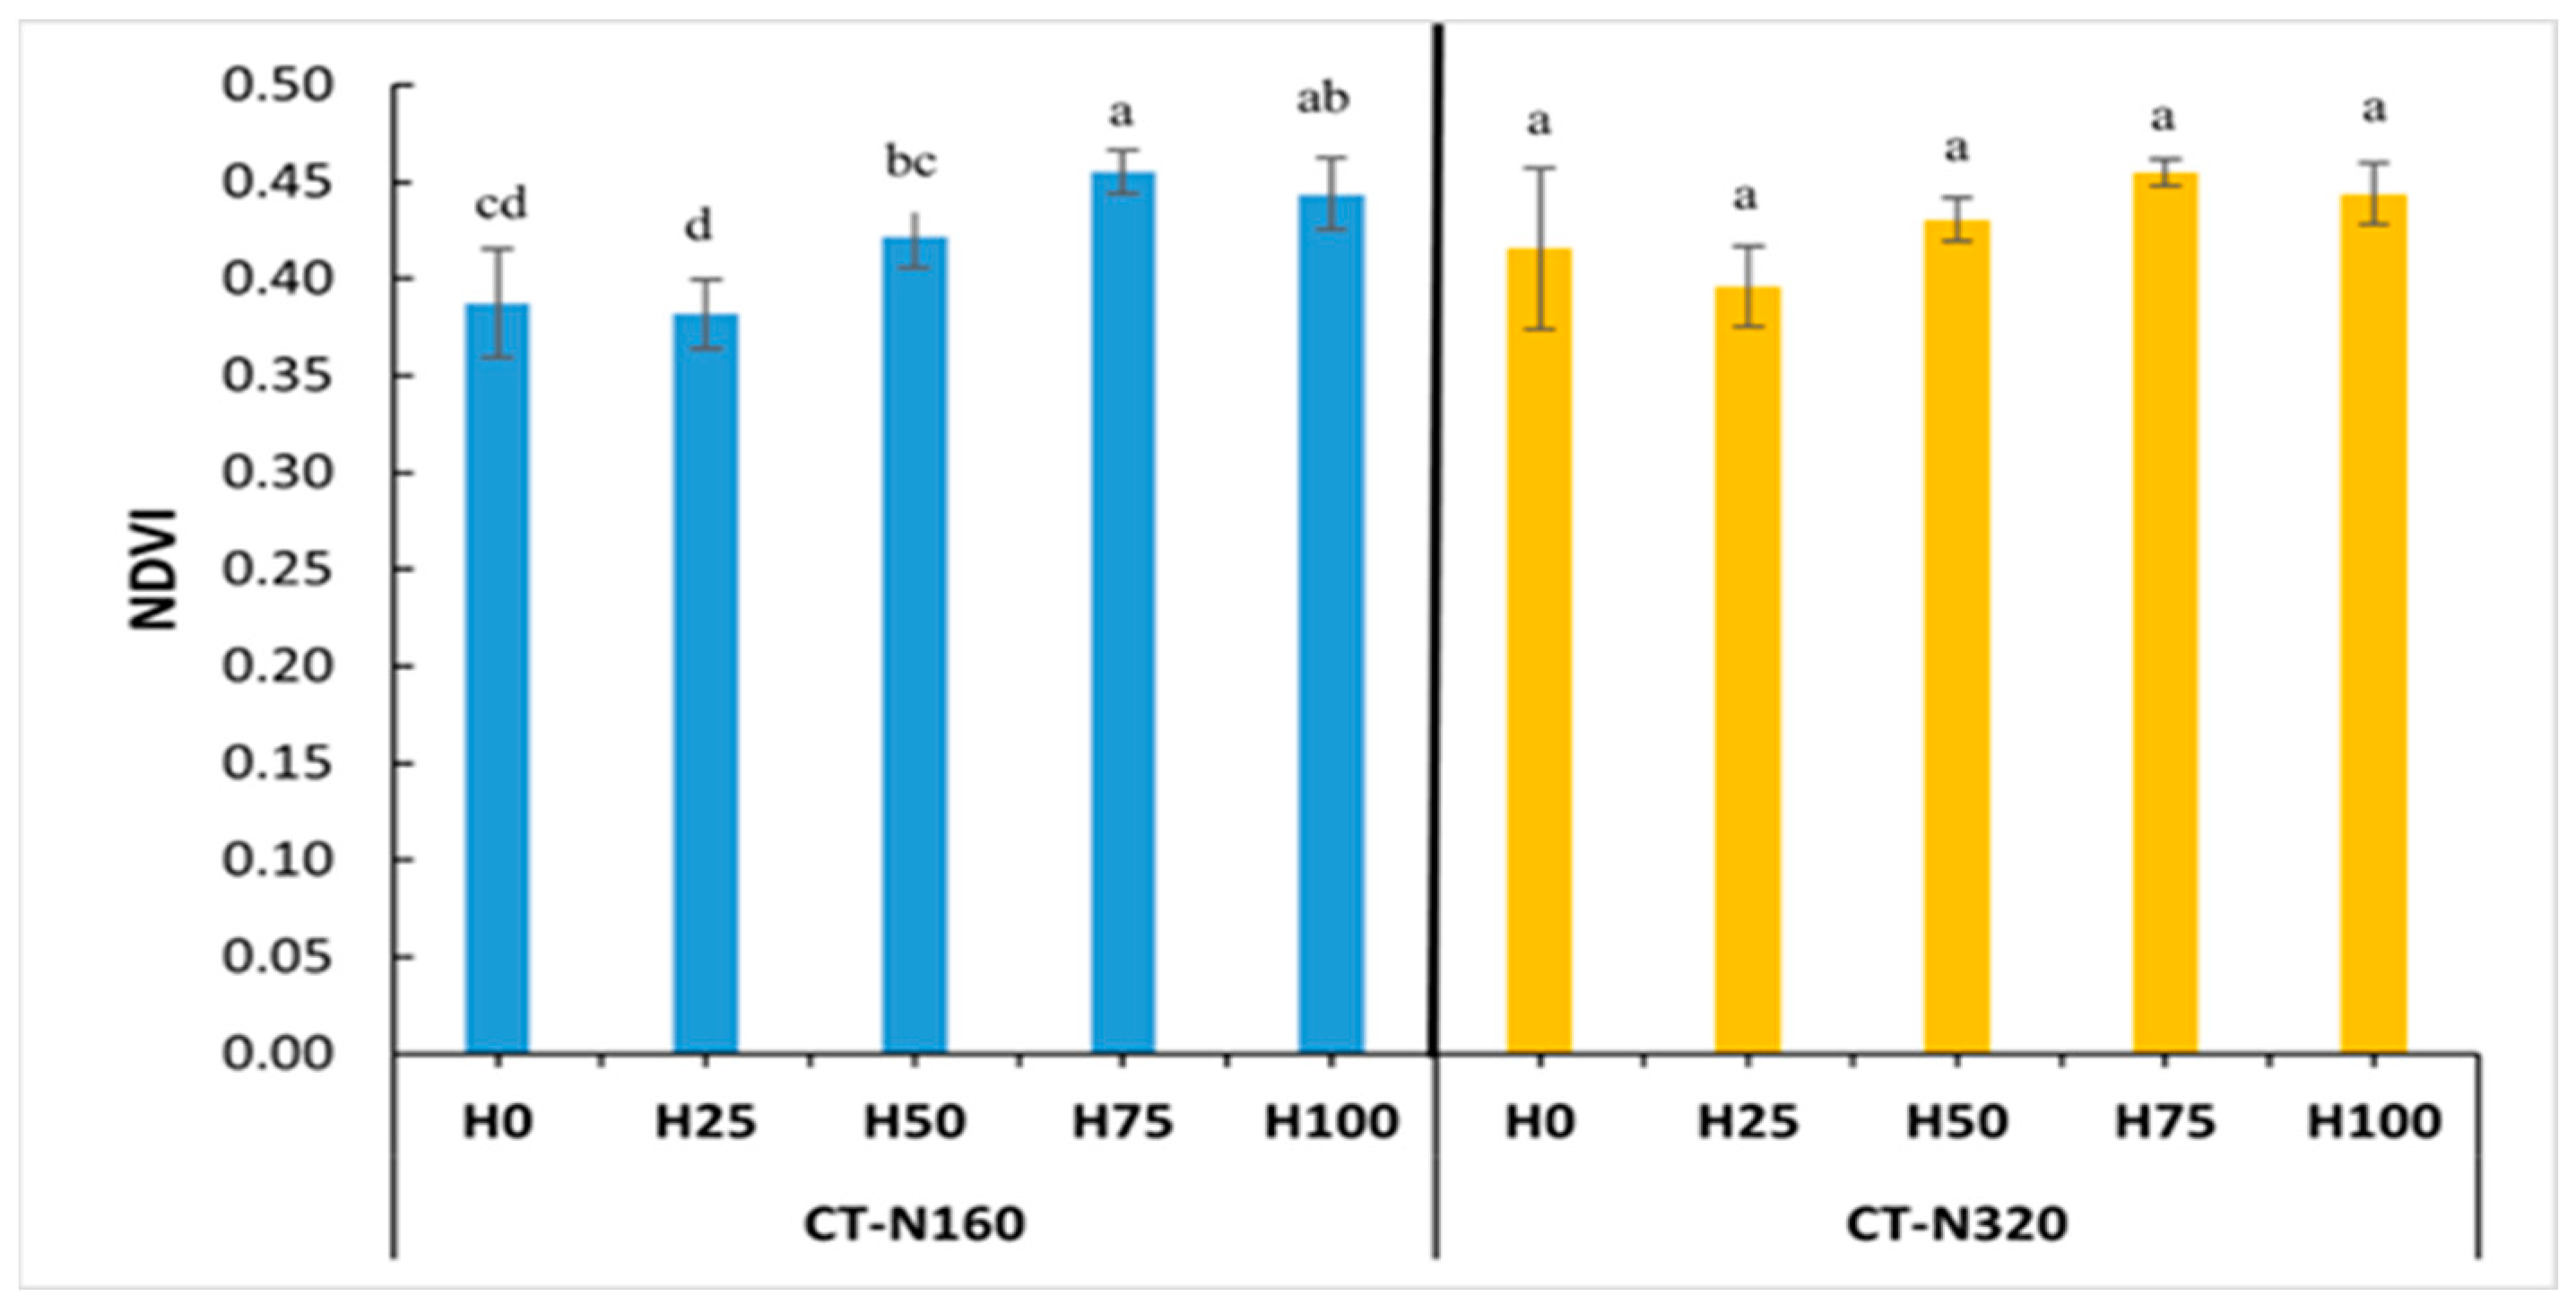
Under CT with 74 kg N ha−1, the herbicide dose significantly affected NDVI (p < 0.05), whereas at 147 kg N ha−1, the effect was marginal and non-significant (Figure 6).
At 74 kg N ha−1, NDVI was highest at CT-H75-74 kg N ha−1 (0.46 ± 0.02), followed by CT-H100-74 kg N ha−1 (0.44 ± 0.02), CT-H50-74 kg N ha−1 (0.42 ± 0.02), CT-H0-74 kg N ha−1 (0.39 ± 0.02), and CT-H25-74 kg N ha−1 (0.38 ± 0.02). One-way ANOVA and LSD0.05 (0.03) confirmed the significant differences. Pairwise comparisons showed that NDVI at CT-H75-74 kg N ha−1 was significantly higher than those at CT-H25-74 kg N ha−1, CT-H0-74 kg N ha−1, and CT-H50-74 kg N ha−1. Similarly, NDVI under CT-H100-74 kg N ha−1 was significantly higher than those under CT-H25-74 kg N ha−1 and CT-H0-74 kg N ha−1, with no difference between those of CT-H100-74 kg N ha−1 and CT-H75-74 kg N ha−1, or between those of CT-H50-74 kg N ha−1 and CT-H0-74 kg N ha−1.
At 147 kg N ha−1, the herbicide effects were not statistically significant (p ≥ 0.05). NDVI values ranged modestly, with CT-H75-147 kg N ha−1 recording the highest (0.45 ± 0.02), followed by CT-H100-147 kg N ha−1 (0.44 ± 0.02), CT-H50-147 kg N ha−1 (0.43 ± 0.02), CT-H0-147 kg N ha−1 (0.42 ± 0.02), and CT-H25-147 kg N ha−1 the lowest (0.40 ± 0.02).

3.1.3. Effect of Herbicide Dose on NDVI Under Minimum Tillage with Different Nitrogen Input

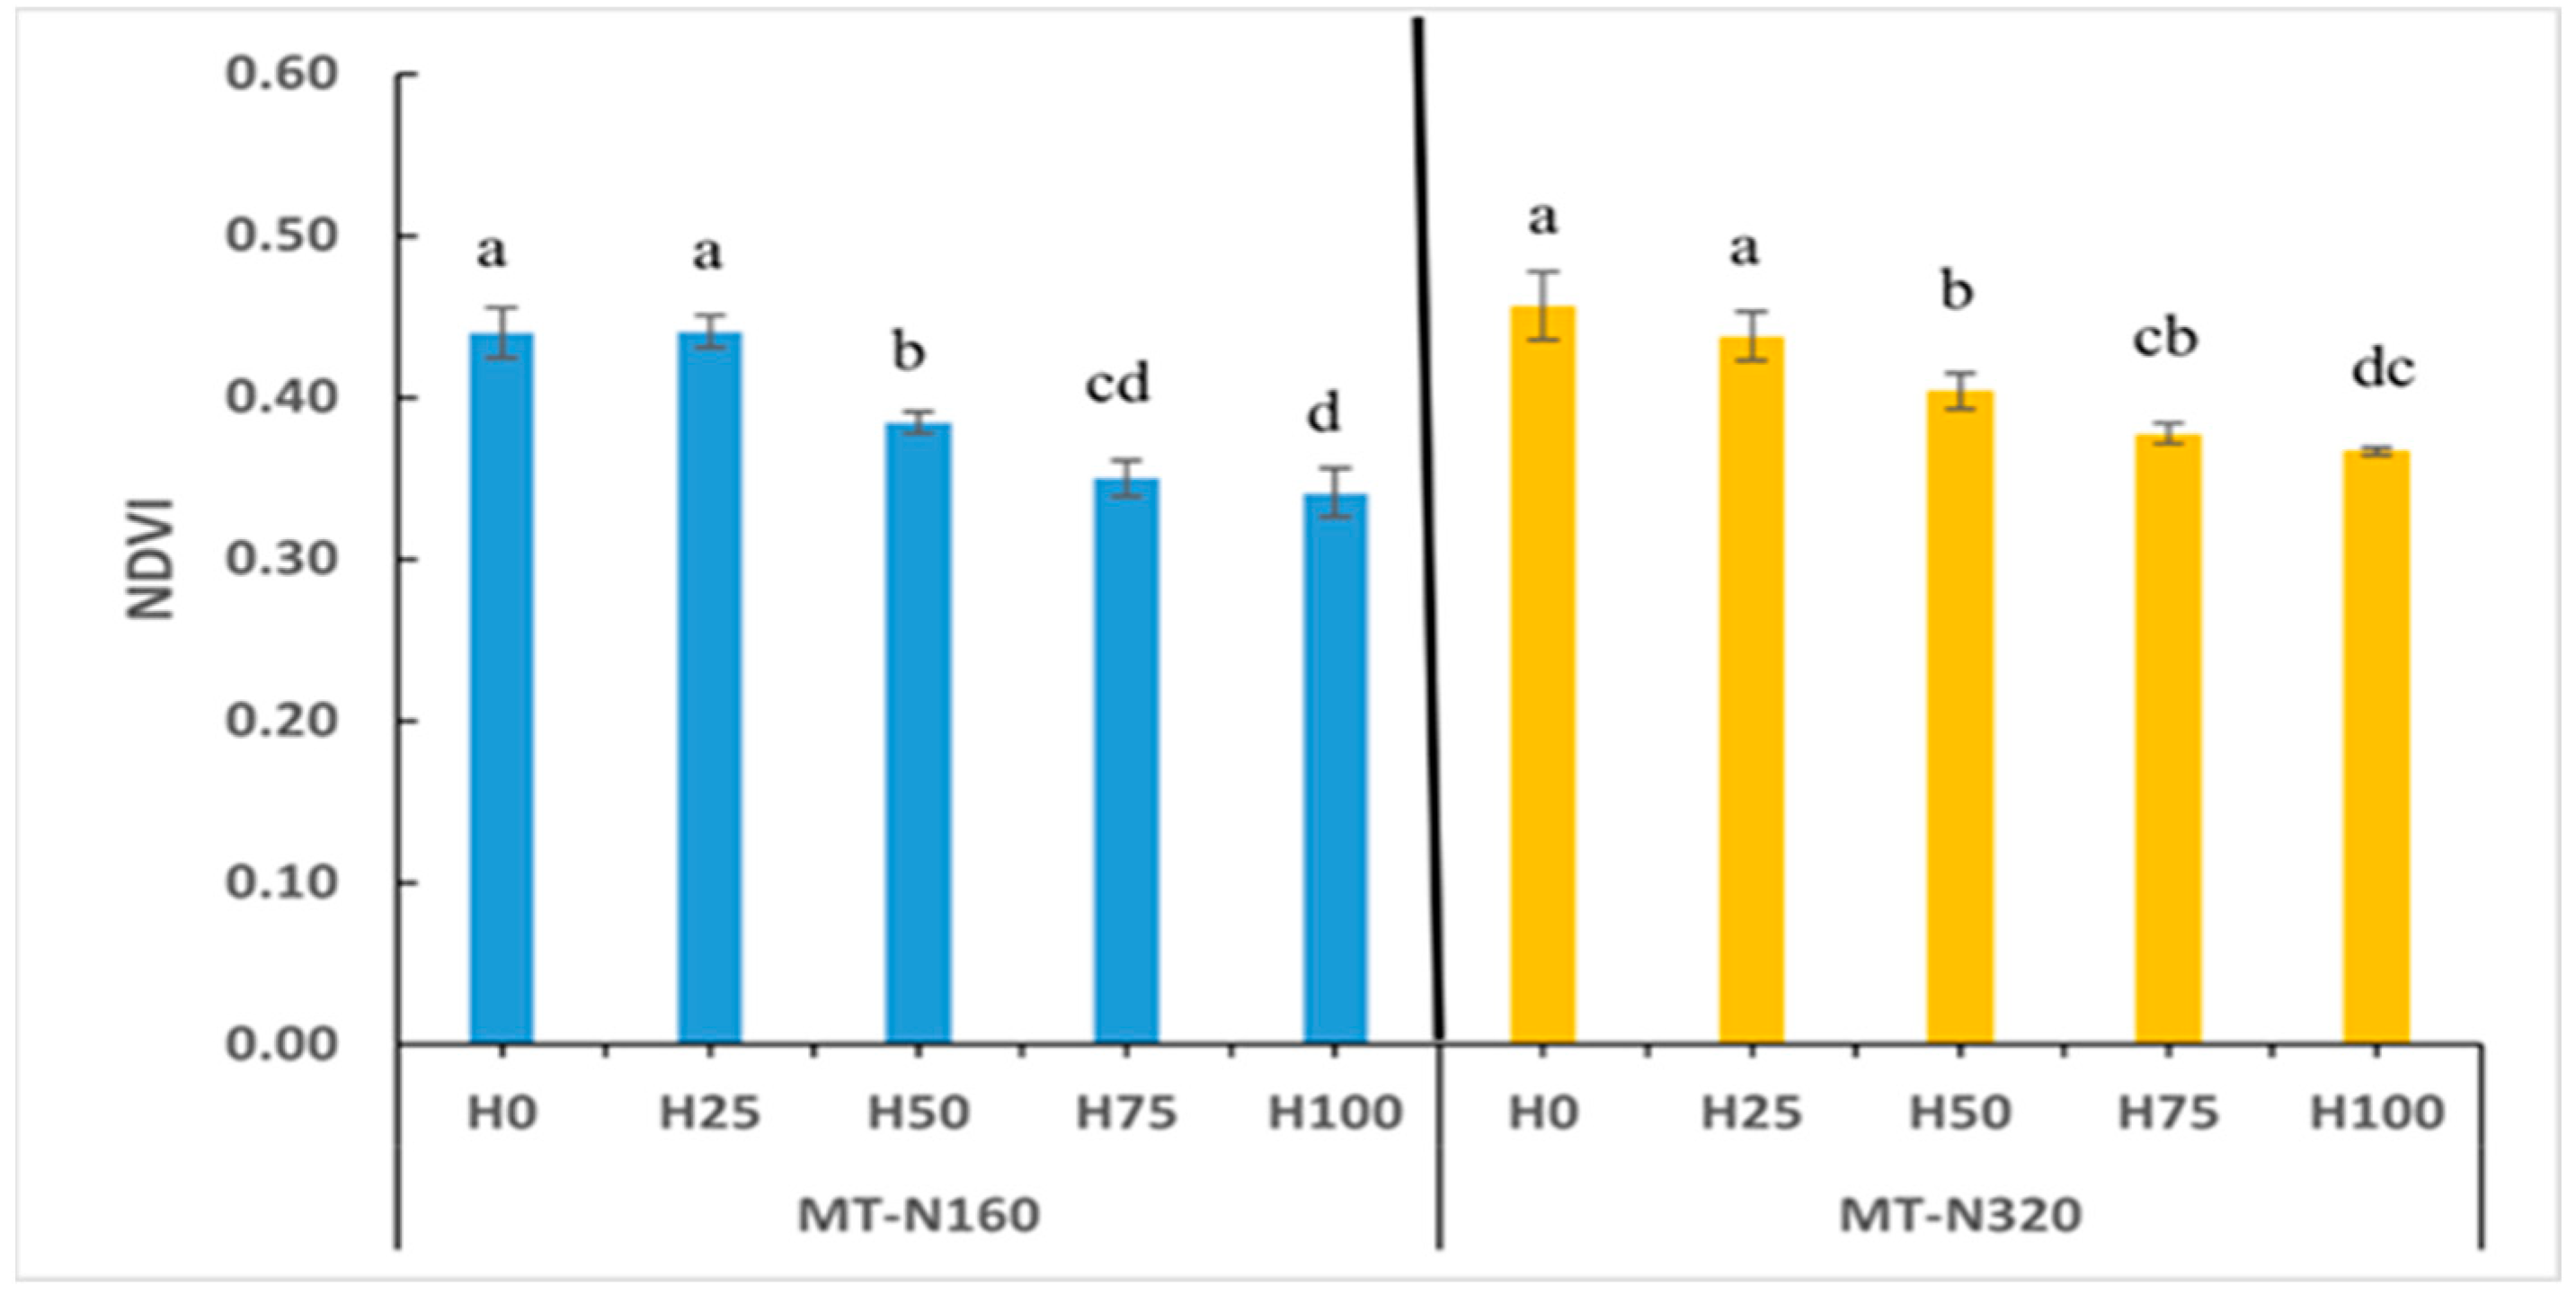
Herbicide dose had a highly significant effect on NDVI under MT at both 74 and 147 kg N ha−1 (p < 0.001; Figure 7). The responses varied slightly among the nitrogen levels. In both cases, lower herbicide doses produced higher NDVI values, whereas higher doses reduced them.
At 74 kg N ha−1, the highest NDVI occurred at MT-H0-74 kg N ha−1 and MT-H25-74 kg N ha−1 (0.44 ± 0.01), while the lowest occurred at MT-H100-74 kg N ha−1 (0.34 ± 0.01). The intermediate values were observed under MT-H50-74 kg N ha−1 (0.38 ± 0.01) and MT-H75-74 kg N ha−1 (0.35 ± 0.01). LSD0.05 (0.022) confirmed that H0 and H25 were significantly higher than H50, H75, and H100, with no differences between those of H0 and H25 or between H75 and H100.
At 147 kg N ha−1, NDVI was the highest at MT-H0-147 kg N ha−1 (0.46 ± 0.01) and MT-H25-147 kg N ha−1 (0.44 ± 0.01), with lower values at MT-H50-147 kg N ha−1 (0.40 ± 0.01), MT-H75-147 kg N ha−1 (0.38 ± 0.01), and MT-H100-147 kg N ha−1 (0.37 ± 0.01). LSD0.05 (0.02) confirmed that H0 and H25 were significantly higher than those at H50, H75, and H100, with no difference between H0 and H25 or between those of H75 and H100.

3.1.4. Effect of Nitrogen and Herbicide Dose on NDVI Under Conventional Tillage

The results show that under CT, NDVI was significantly influenced by herbicide dose (p < 0.05) but not by the nitrogen level. The mean NDVI at 147 kg N ha−1 (0.43 ± 0.02) was slightly higher than that at 74 kg N ha−1 (0.42 ± 0.03), and the nitrogen × herbicide interaction was not significant (Table 3).
Despite the non-significant interaction, variations were observed. At 74 kg N ha−1, NDVI ranged from 0.38 (H25) to 0.46 (H75), whereas at 147 kg N ha−1, values ranged from 0.40 (H25) to 0.45 (H75). The highest NDVI occurred at 74 kg N ha−1-H75 (0.46 ± 0.01) and the lowest at 74 kg N ha−1-H25 (0.38 ± 0.08).

3.1.5. Effect of Nitrogen and Herbicide Dose on NDVI Under Minimum Tillage

Under MT, NDVI was significantly influenced by both the herbicide dose and nitrogen fertilisation. NDVI was higher at 147 kg N ha−1 (0.41 ± 0.04) than at 74 kg N ha−1 (0.39 ± 0.05), as confirmed by the LSD0.05 (0.010), with no significant nitrogen × herbicide interaction (Table 4).
Although the interaction was not significant, variations were observed among the treatment combinations. At 74 kg N ha−1, NDVI ranged from 0.34 (H100) to 0.44 (H0 and H25). At 147 kg N ha−1, NDVI ranged from 0.37 (H100) to 0.46 (H0). The highest NDVI occurred at 147 kg N ha−1-H0 (0.46 ± 0.02) and the lowest at 74 kg N ha−1-H100 (0.34 ± 0.00).

3.2. Simpson’s Index Analysis of Weed Diversity Under Different Agricultural Practices

Weed species diversity was influenced by nitrogen dose, herbicide level, and tillage system, with results presented separately for CT and MT.
  • Conventional tillage
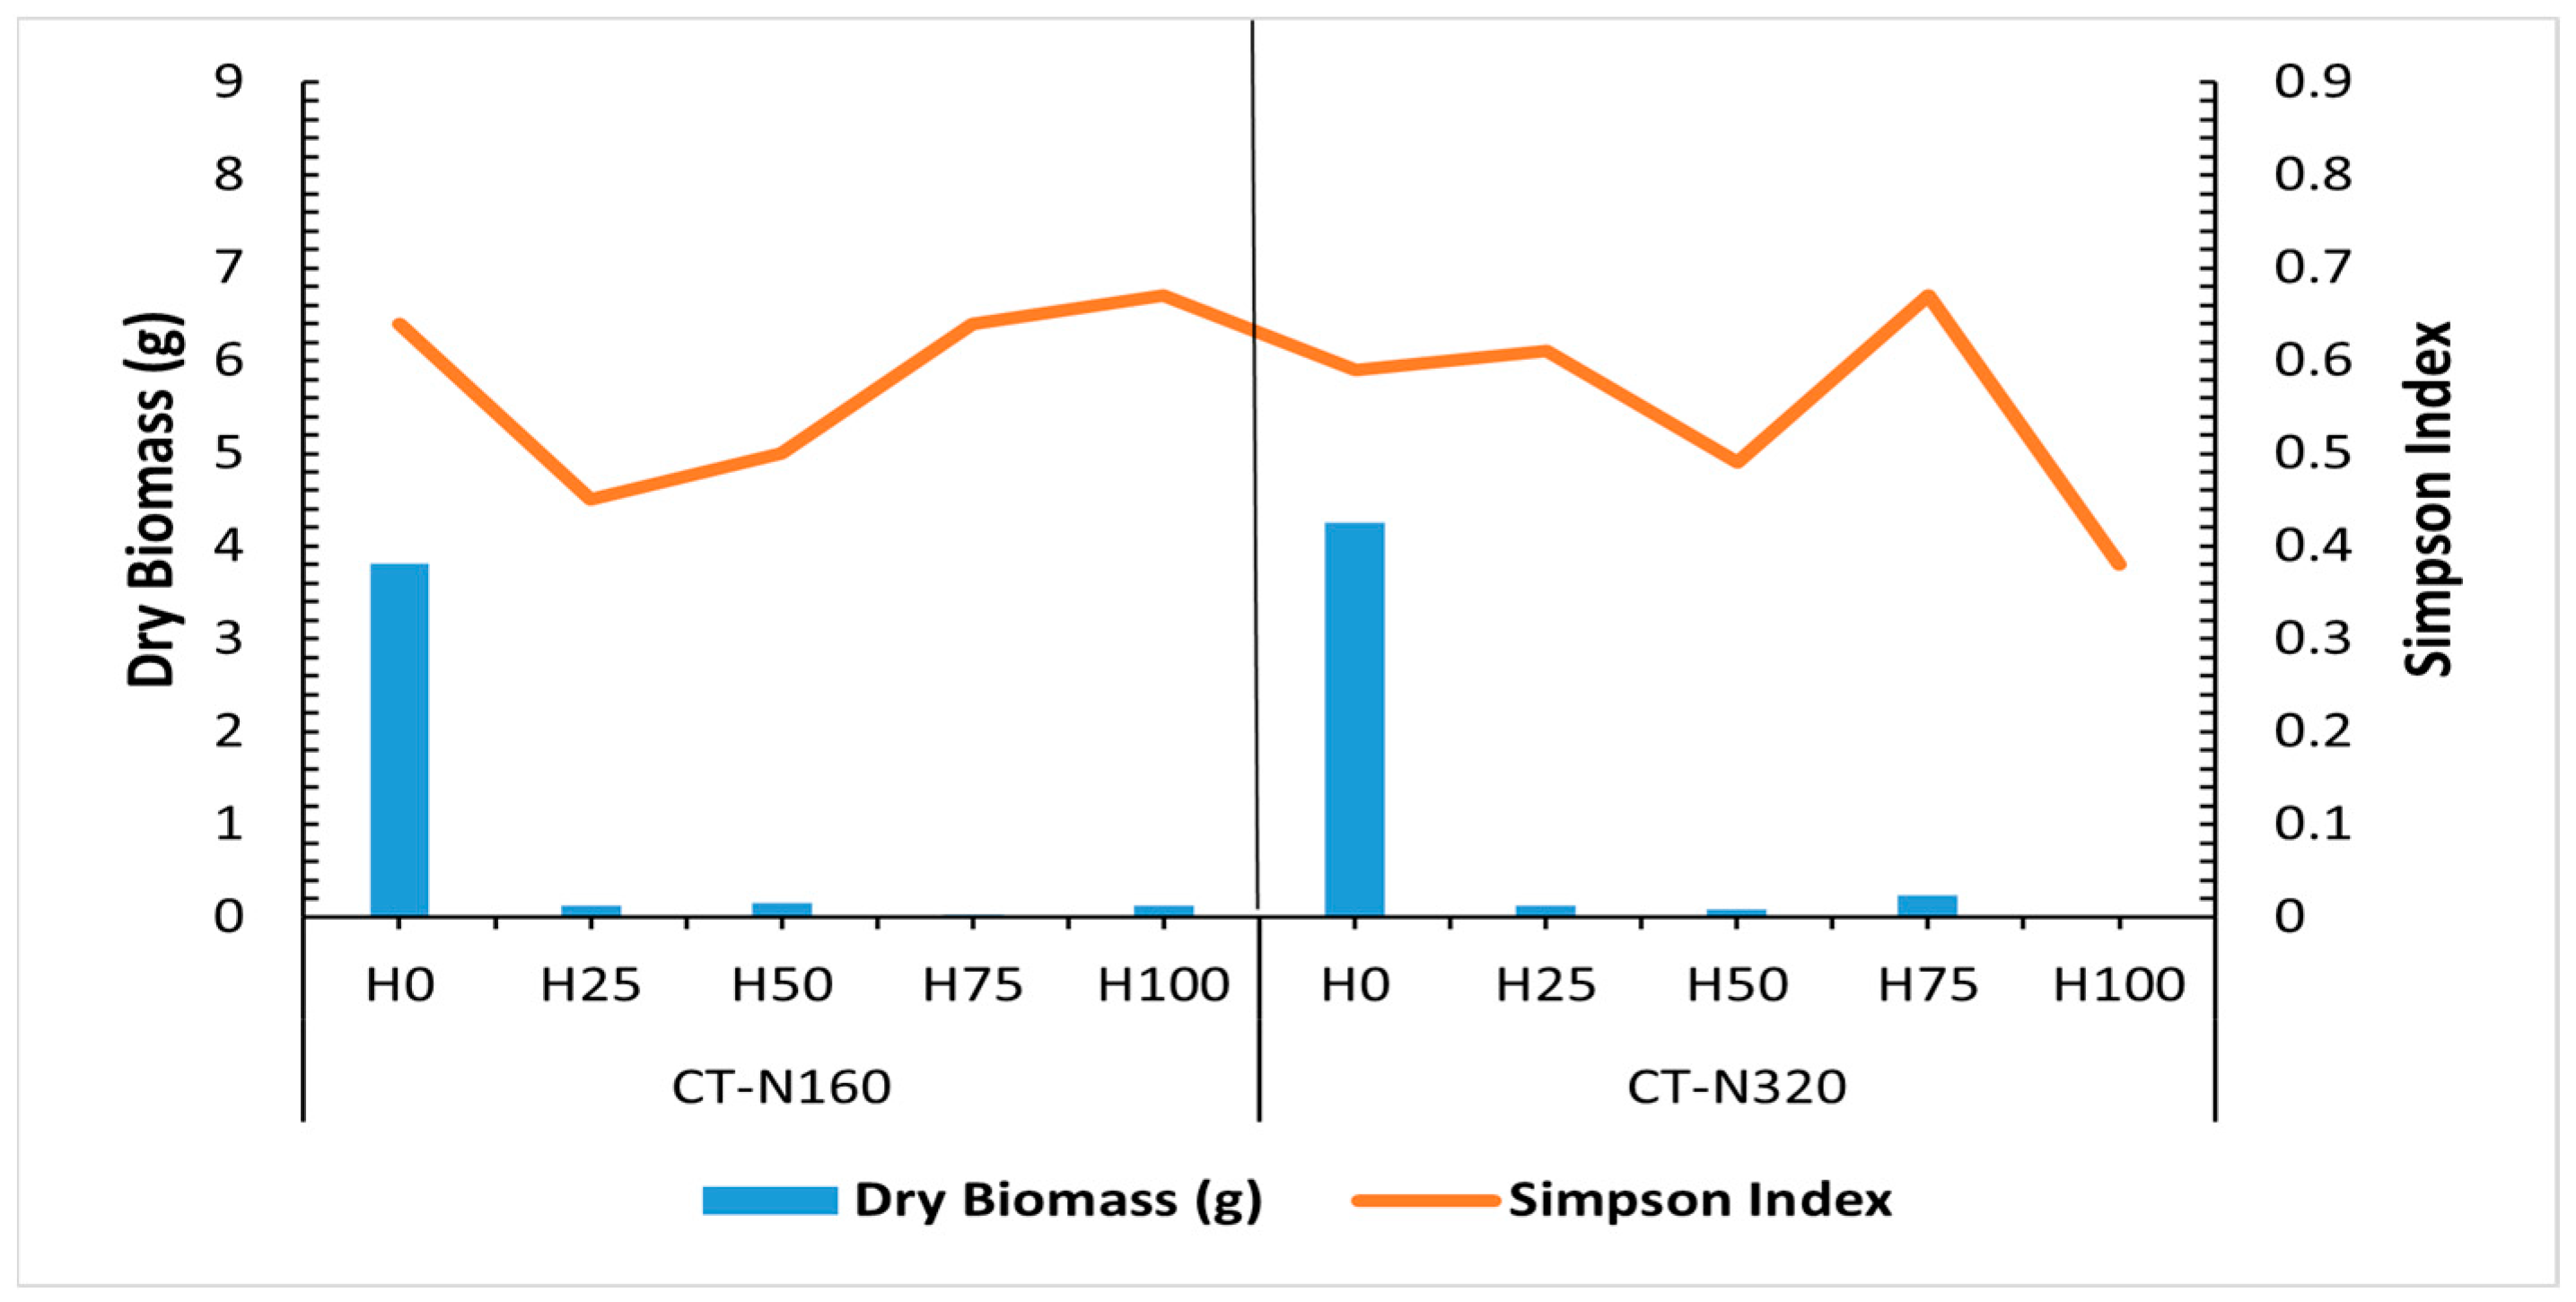
Under CT, both weed diversity and biomass were generally lower. The Simpson Index ranged from 0.38 to 0.67, with corresponding dry biomass ranging from 0.02 to 4.25 g (Figure 8). At 74 kg N ha−1, the highest diversity (0.67) occurred at H100 and the lowest (0.45) at H25. Dry biomass declined sharply with increasing herbicide dose, from 3.81 g at H0 to 0.03–0.12 g at higher doses. At 147 kg N ha−1, weed diversity peaked at H75 (0.67) and was lowest at H100 (0.38), whereas biomass ranged from 4.25 g (H0) to 0.02 g (H100).
  • Minimum tillage
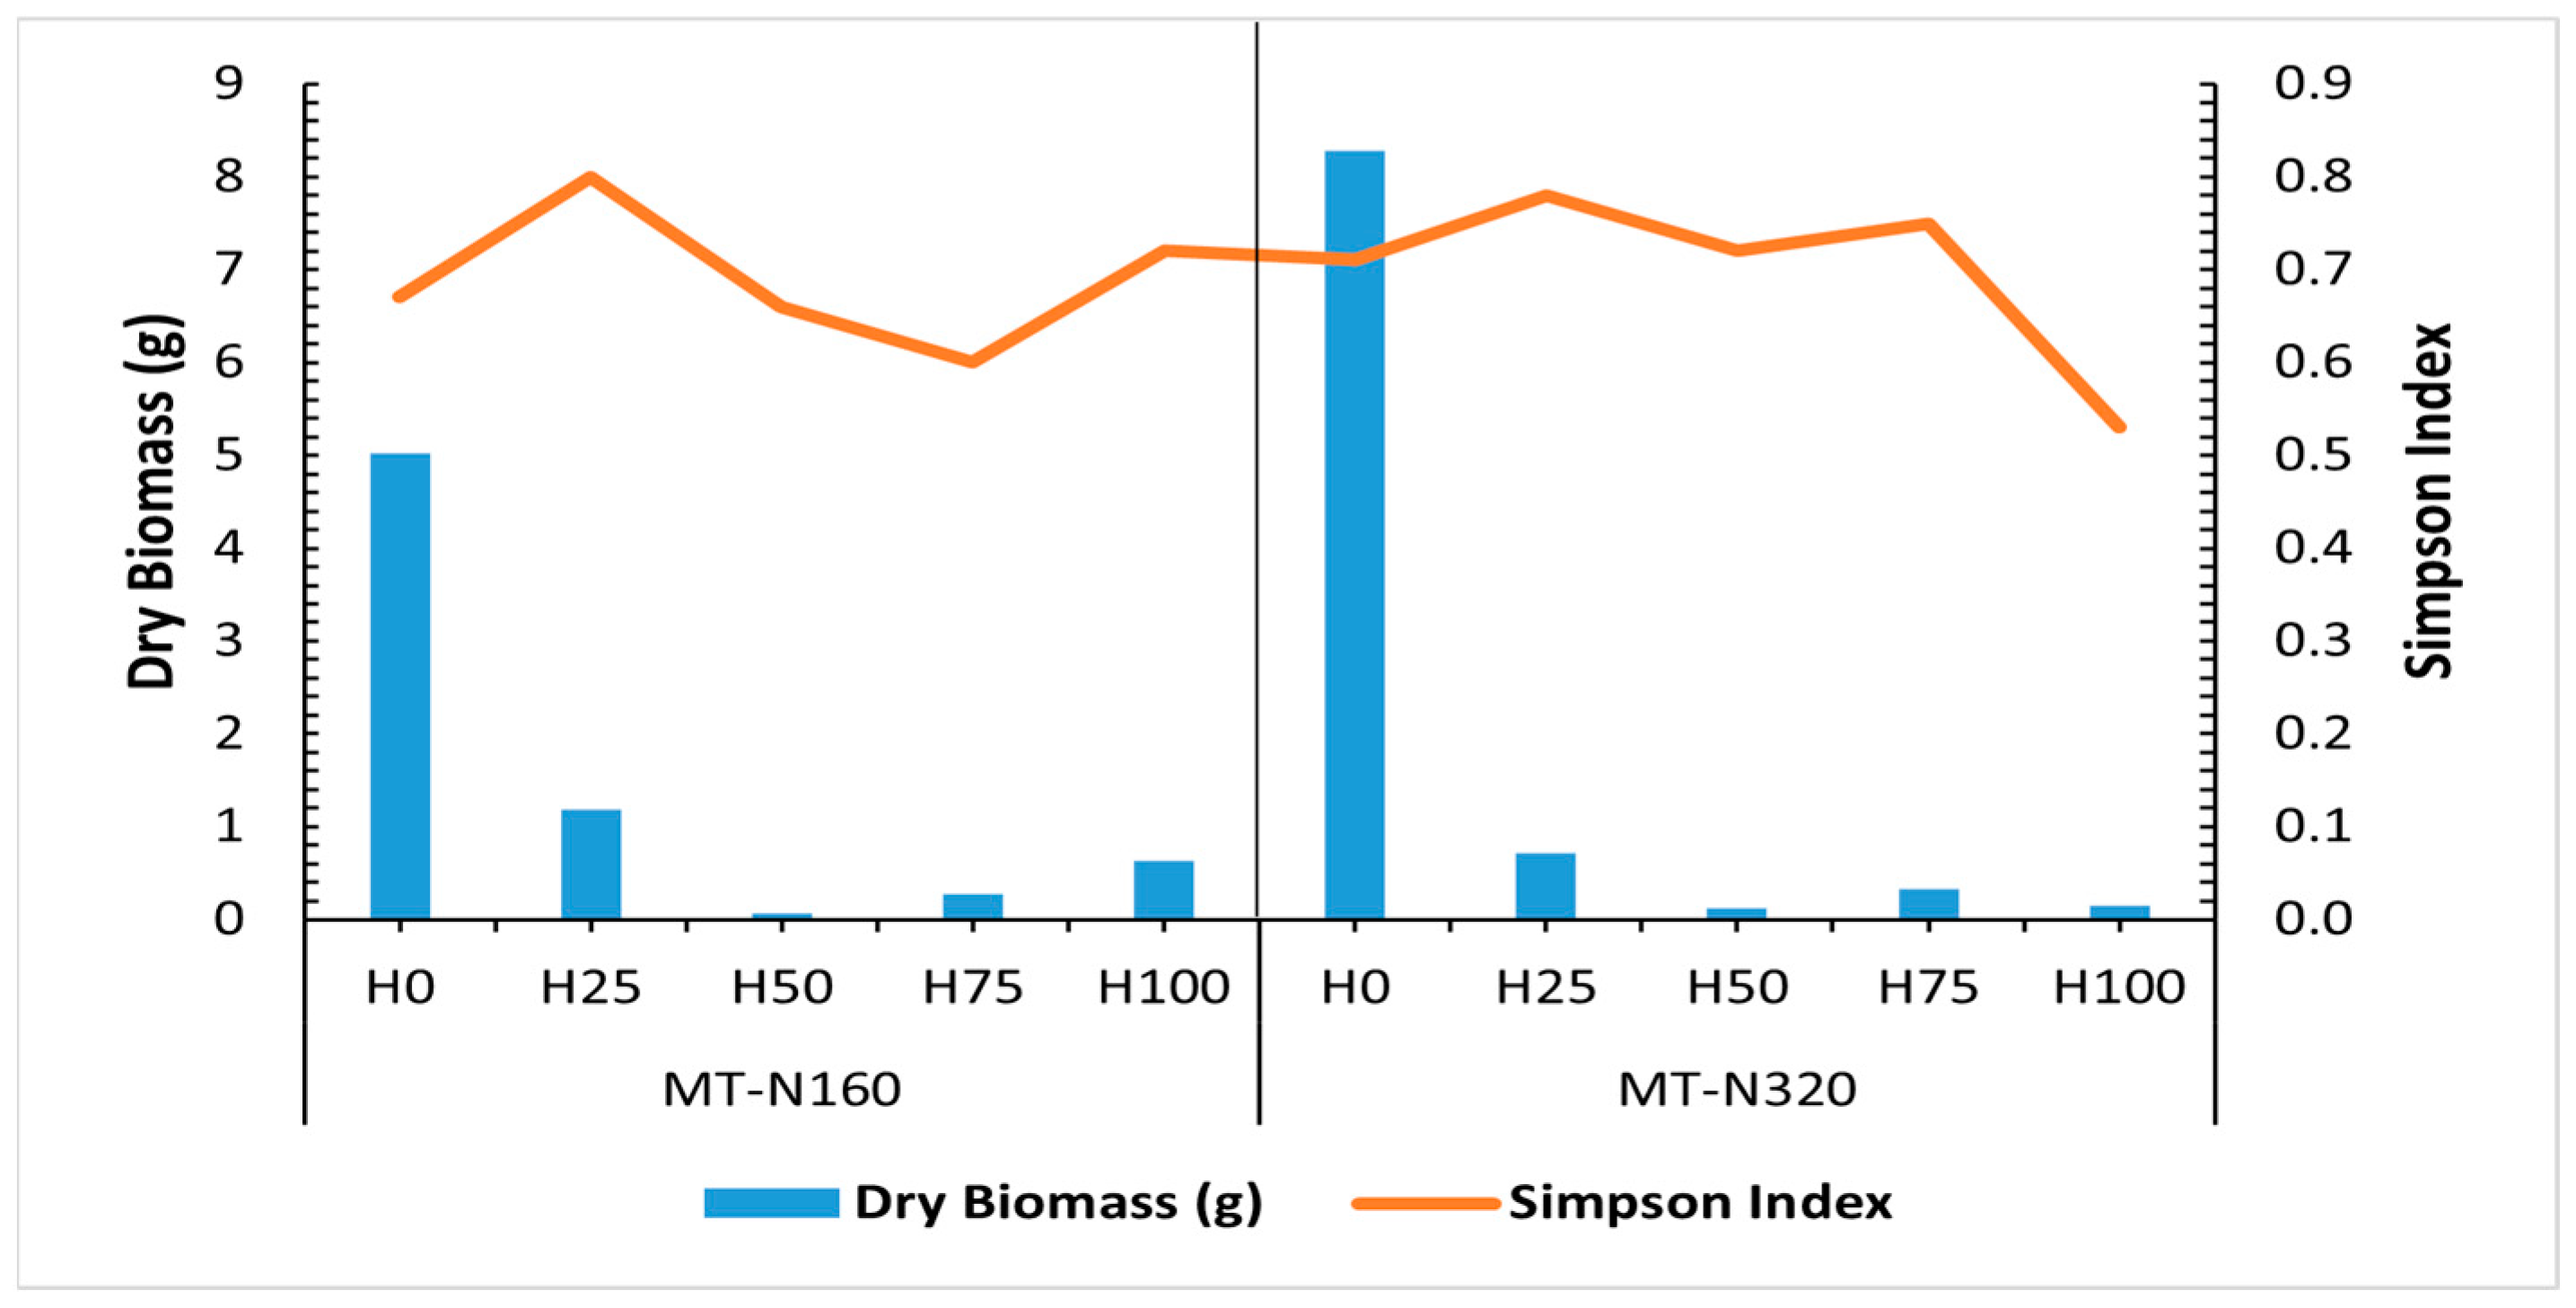
In contrast, MT supported a higher weed diversity across most treatments (Figure 9). Simpson Index values ranged from 0.53 to 0.80, and dry biomass from 0.07 to 8.27 g. At 74 kg N ha−1, diversity peaked at H25 (0.80) and was the lowest at H75 (0.60); even at H100, diversity remained relatively high (0.63). Biomass decreased with herbicide application, from 5.02 g (H0) to 0.07 g (H50). At 147 kg N ha−1, diversity remained high, peaking at H25 (0.78) and decreasing to 0.53 at H100, whereas biomass declined from 8.27 g (H0) to 0.14 g (H100).

Relationships Among Weed Diversity, NDVI, and Soil CO2 Emissions

The observed weed diversity patterns were closely associated with vegetation vigour and the general level of soil CO2 emissions. In MT, treatments with low herbicide doses (H0–H25) recorded both high weed diversity, with Simpson’s Index values up to 0.80, as well as relatively high NDVI values ranging between 0.44 and 0.46 at 74 and 147 kg N ha−1, respectively (Figure 7 and Figure 9). In the same management system, soil CO2 emissions were generally higher across nitrogen levels than under CT (Figure 10 and Figure 11), with the highest emissions observed in the MT–147 kg N ha−1–H75 treatment (79.4 µmol m−2 s−1; as shown in Section 3.3.4. In contrast, lower weed diversity and biomass were found in CT plots, whereas NDVI values were highest at the 75% herbicide dose (H75); overall, CO2 emissions remained lower in CT compared with MT. These combined results indicate simultaneous variation in weed diversity, NDVI, and soil CO2 emissions under tillage, nitrogen, and herbicide treatments.

3.3. Soil CO2 Emissions

3.3.1. Soil CO2 Emissions Under Different Tillage Systems, Same Nitrogen Level, and Herbicide Dose

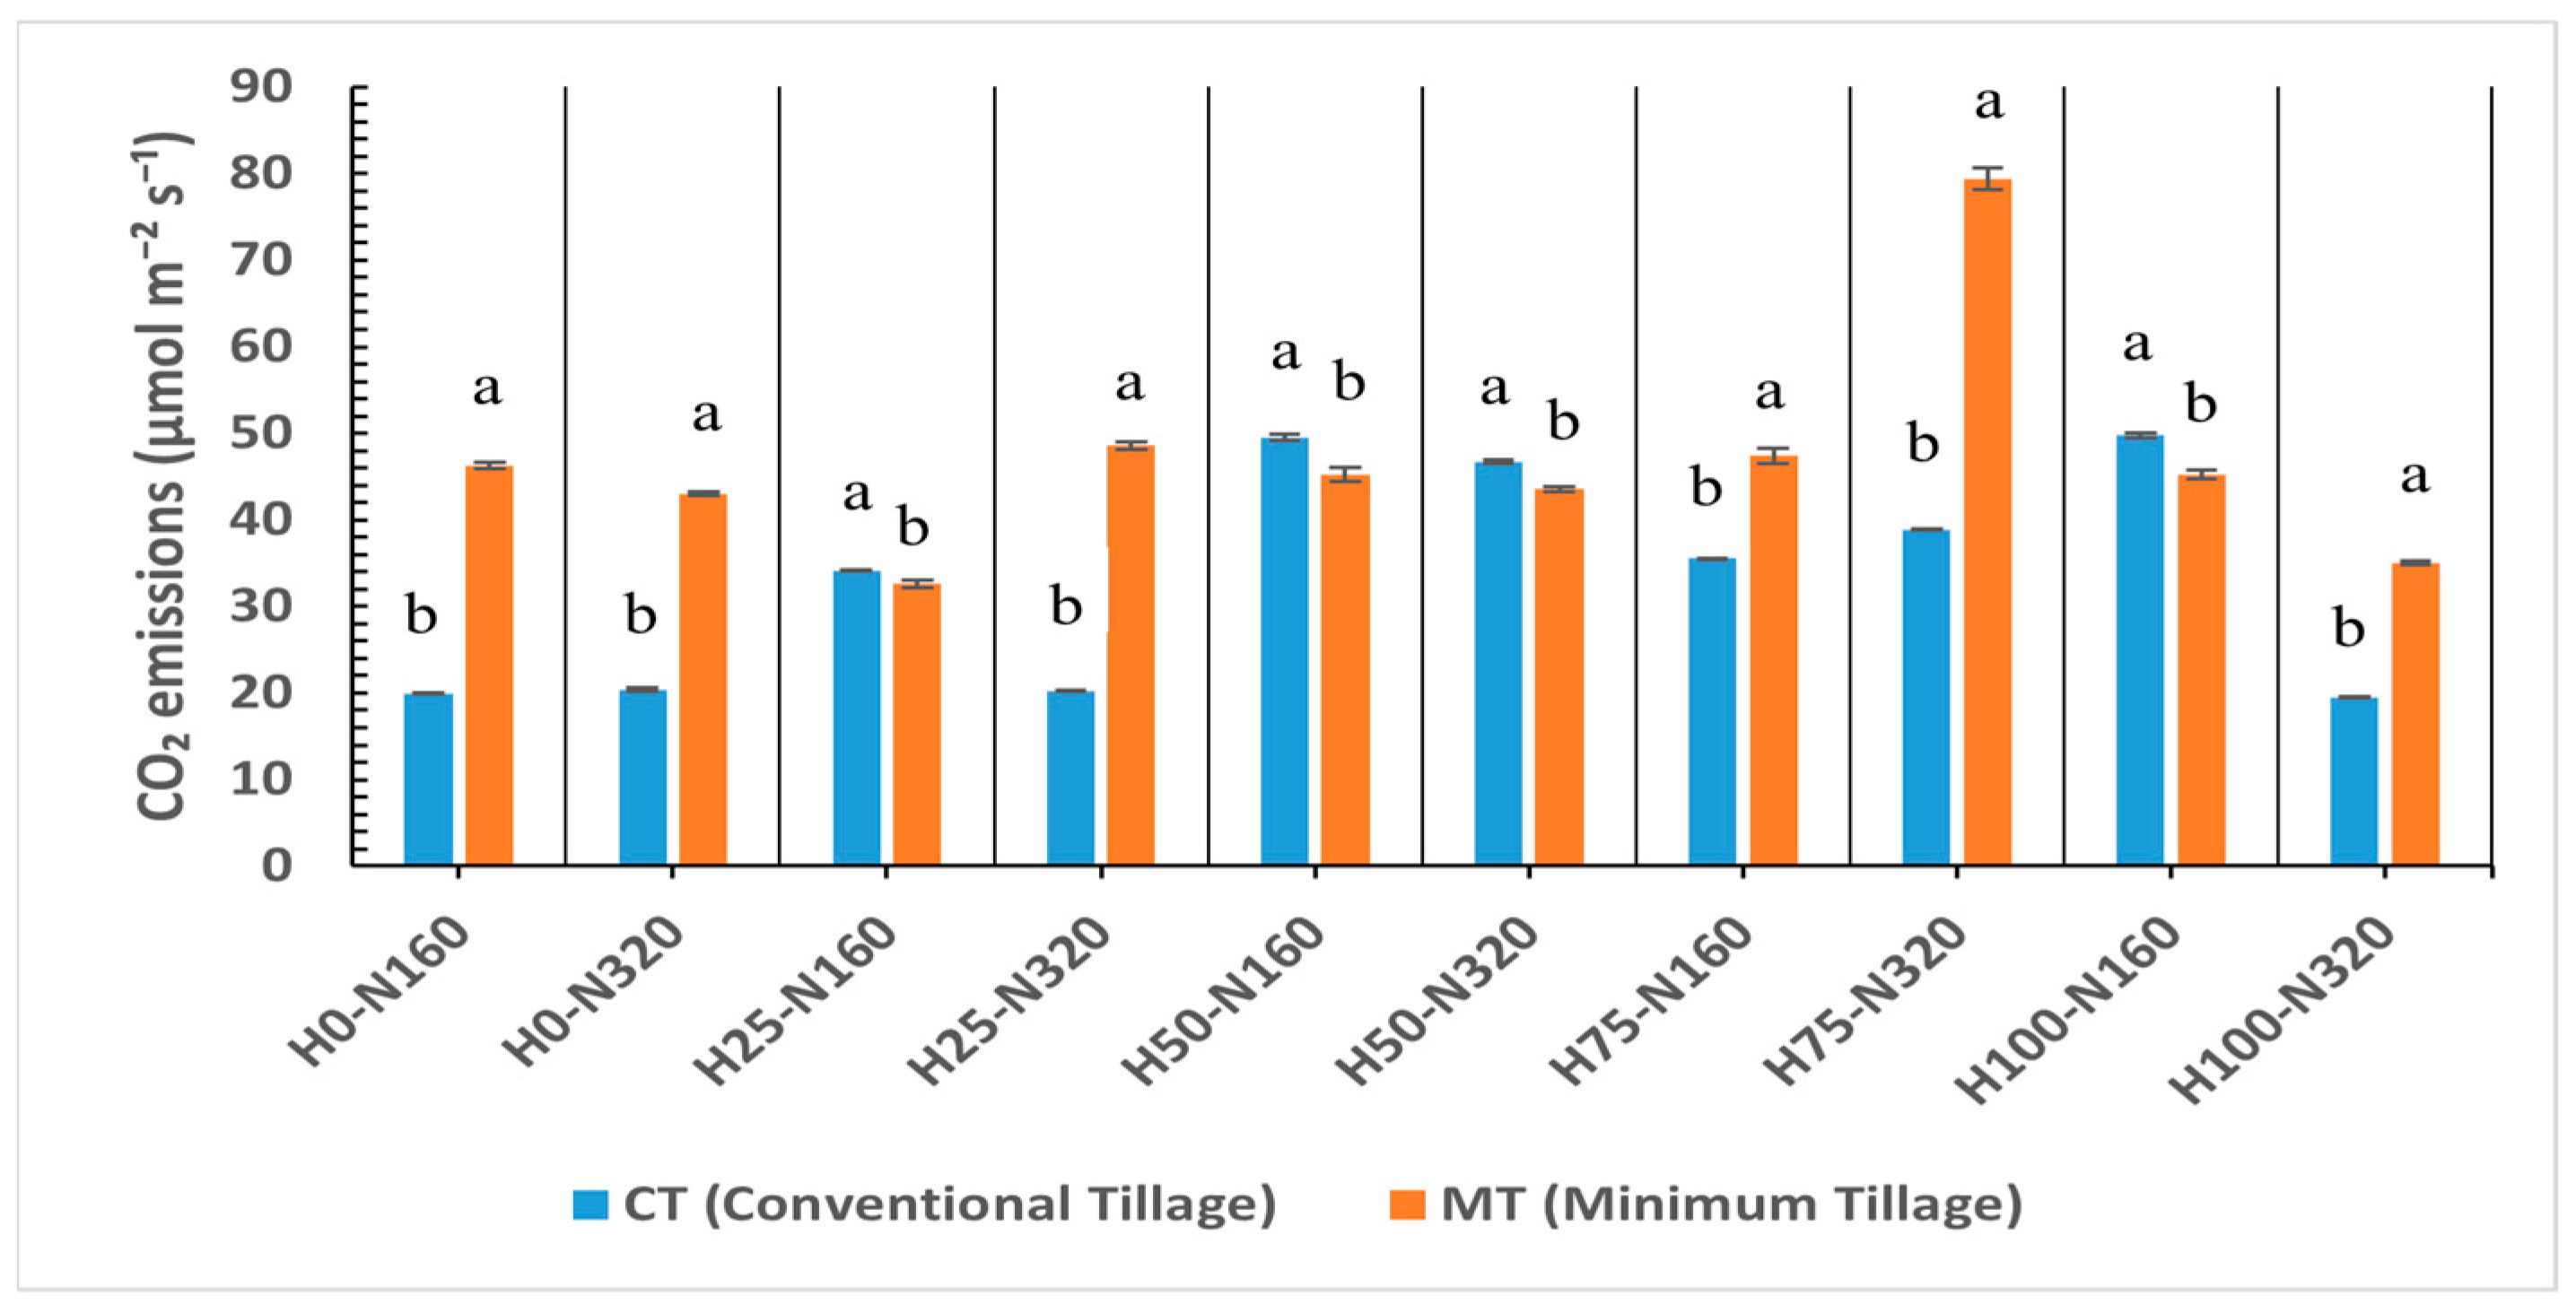
The study examined soil CO2 emissions under CT and MT while maintaining the same nitrogen fertilisation and herbicide dose for each comparison. Soil CO2 emissions differed significantly (p < 0.05) between CT and MT across most of the treatments (Figure 10).
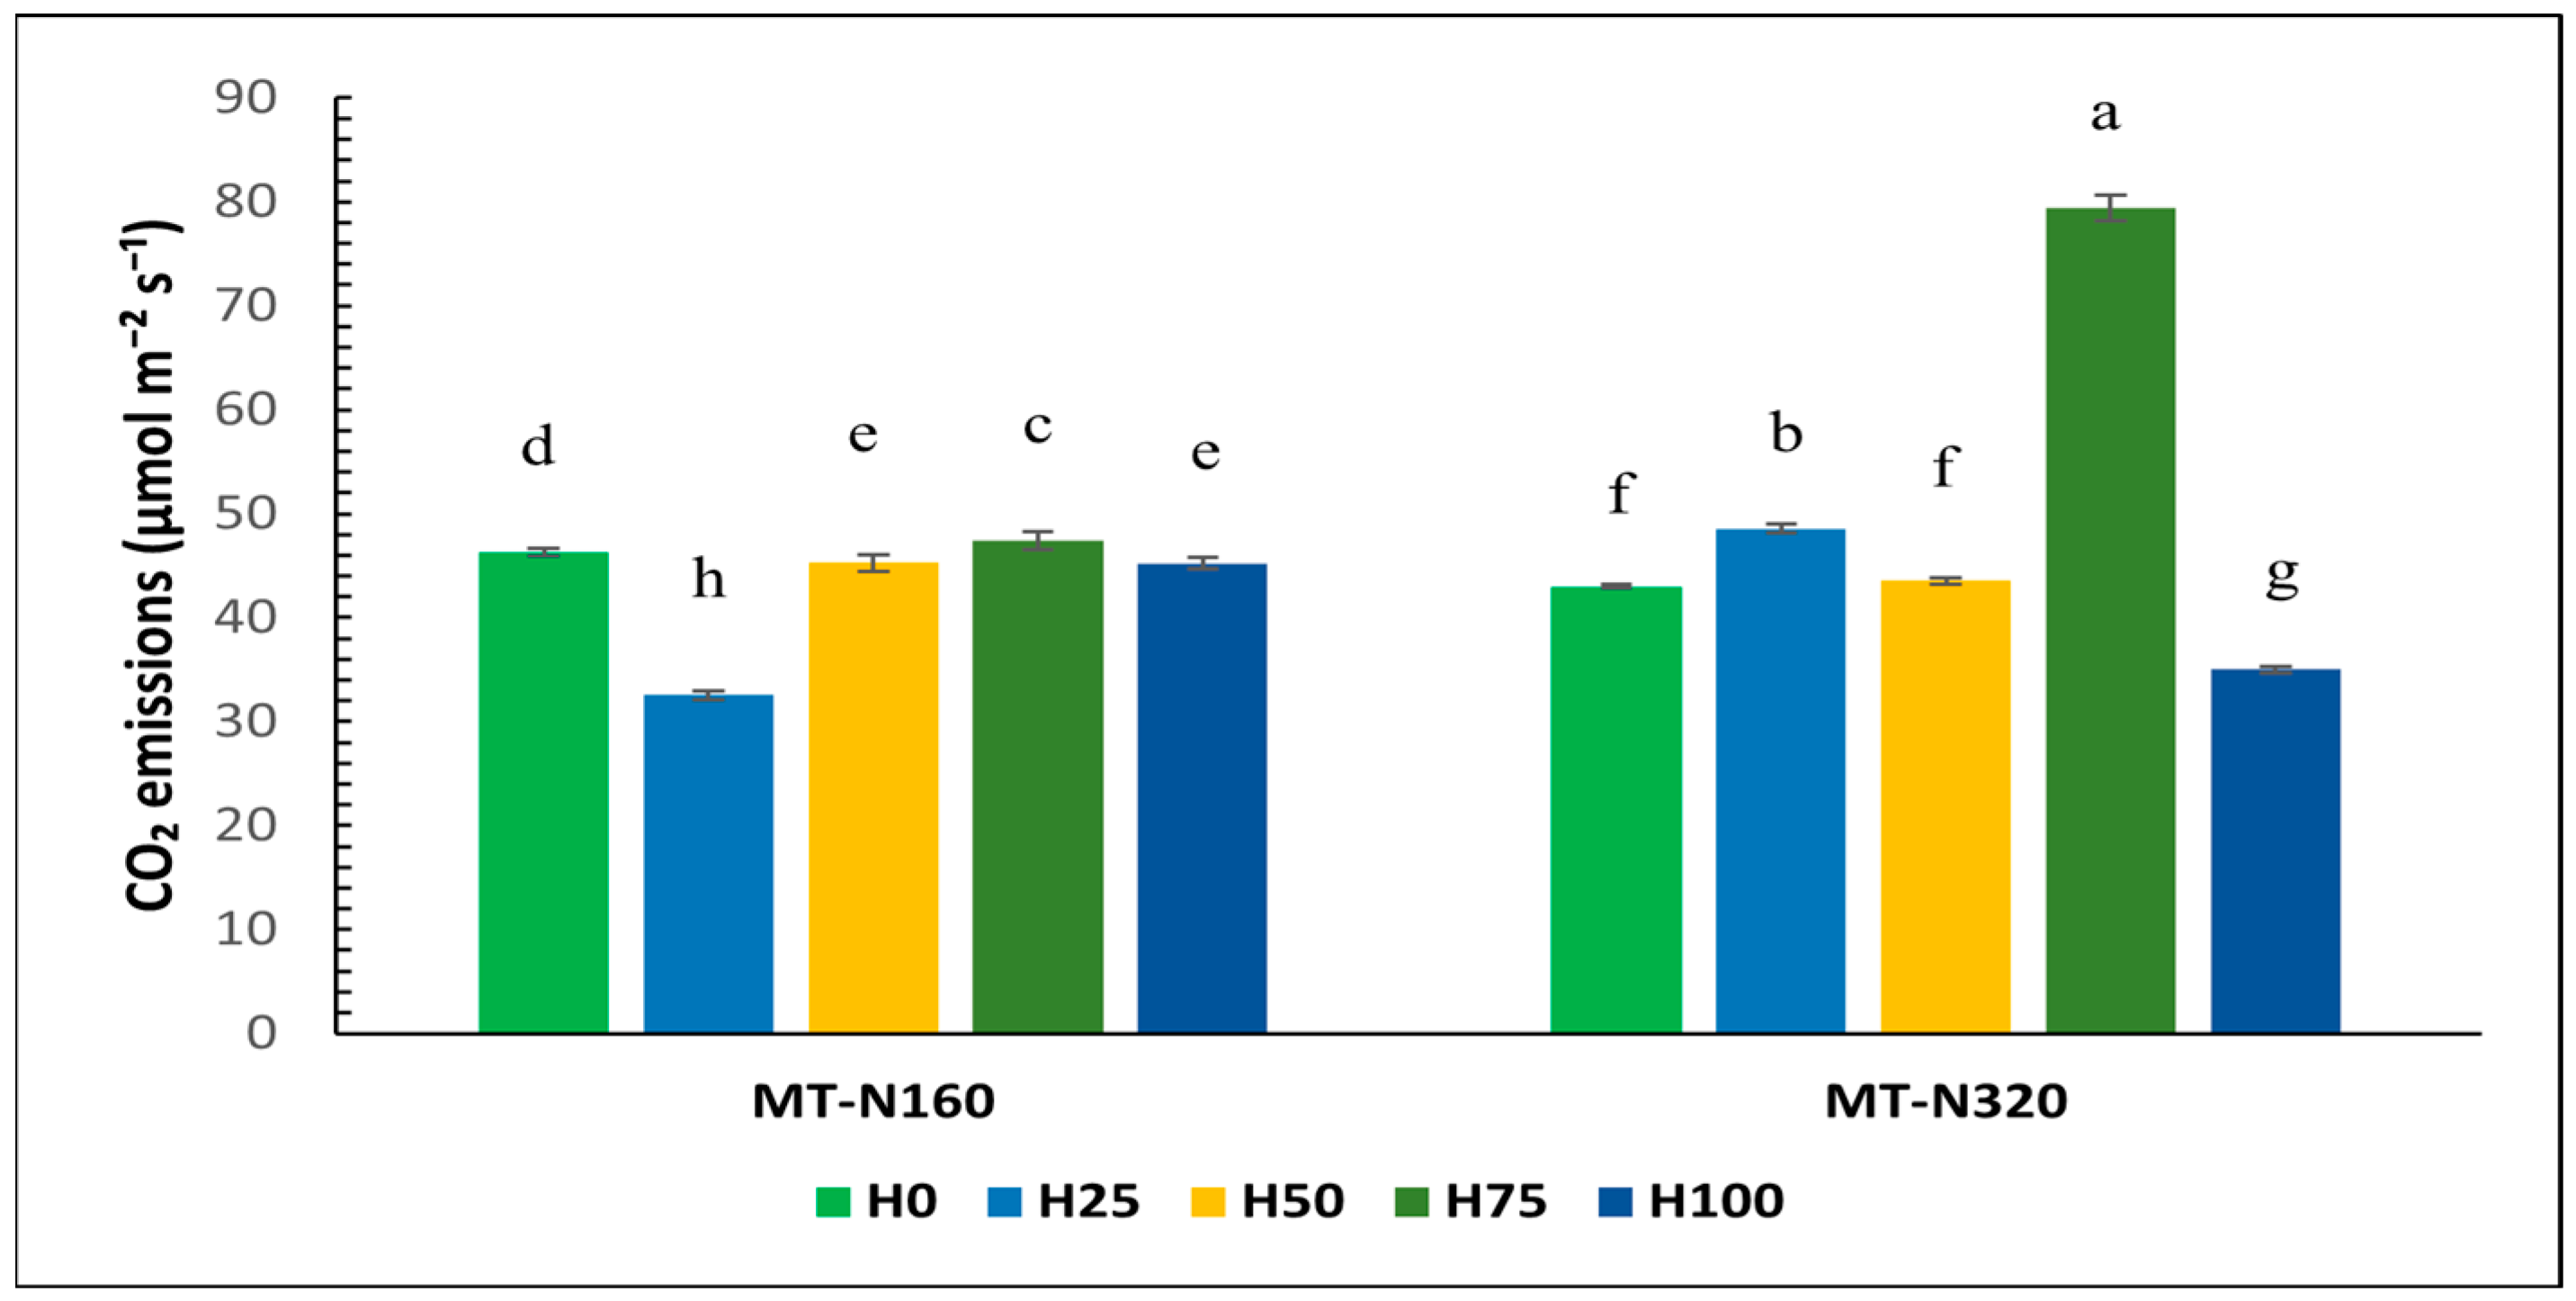
Figure 10 shows that at 74 kg N ha−1, MT emissions were consistently higher than CT, especially at H0 (46.3 ± 0.3 vs. 19.9 ± 0.0 µmol m−2 s−1) and H75 (47.3 ± 0.8 vs. 35.5 ± 0.0 µmol m−2 s−1), although CT slightly exceeded MT at H25, H50, and H100. At 147 kg N ha−1, MT also showed higher emissions at lower herbicide doses—H0 (42.9 ± 0.2 vs. 20.3 ± 0.1 µmol m−2 s−1), H25 (48.5 ± 0.4 vs. 20.2 ± 0.0 µmol m−2 s−1), and H75 (79.4 ± 1.2 vs. 38.9 ± 0.0 µmol m−2 s−1). At H100, MT remained higher (34.9 ± 0.2 vs. 19.4 ± 0.1 µmol m−2 s−1), with CT exceeding MT only at H50 for both nitrogen levels.
Overall, MT generally enhanced CO2 emissions, particularly under higher nitrogen and lower herbicide doses, with exceptions at H50 (both N levels) and H100 (74 kg N ha−1).

3.3.2. Soil CO2 Emissions Under Different Tillage Systems and Same Nitrogen Levels

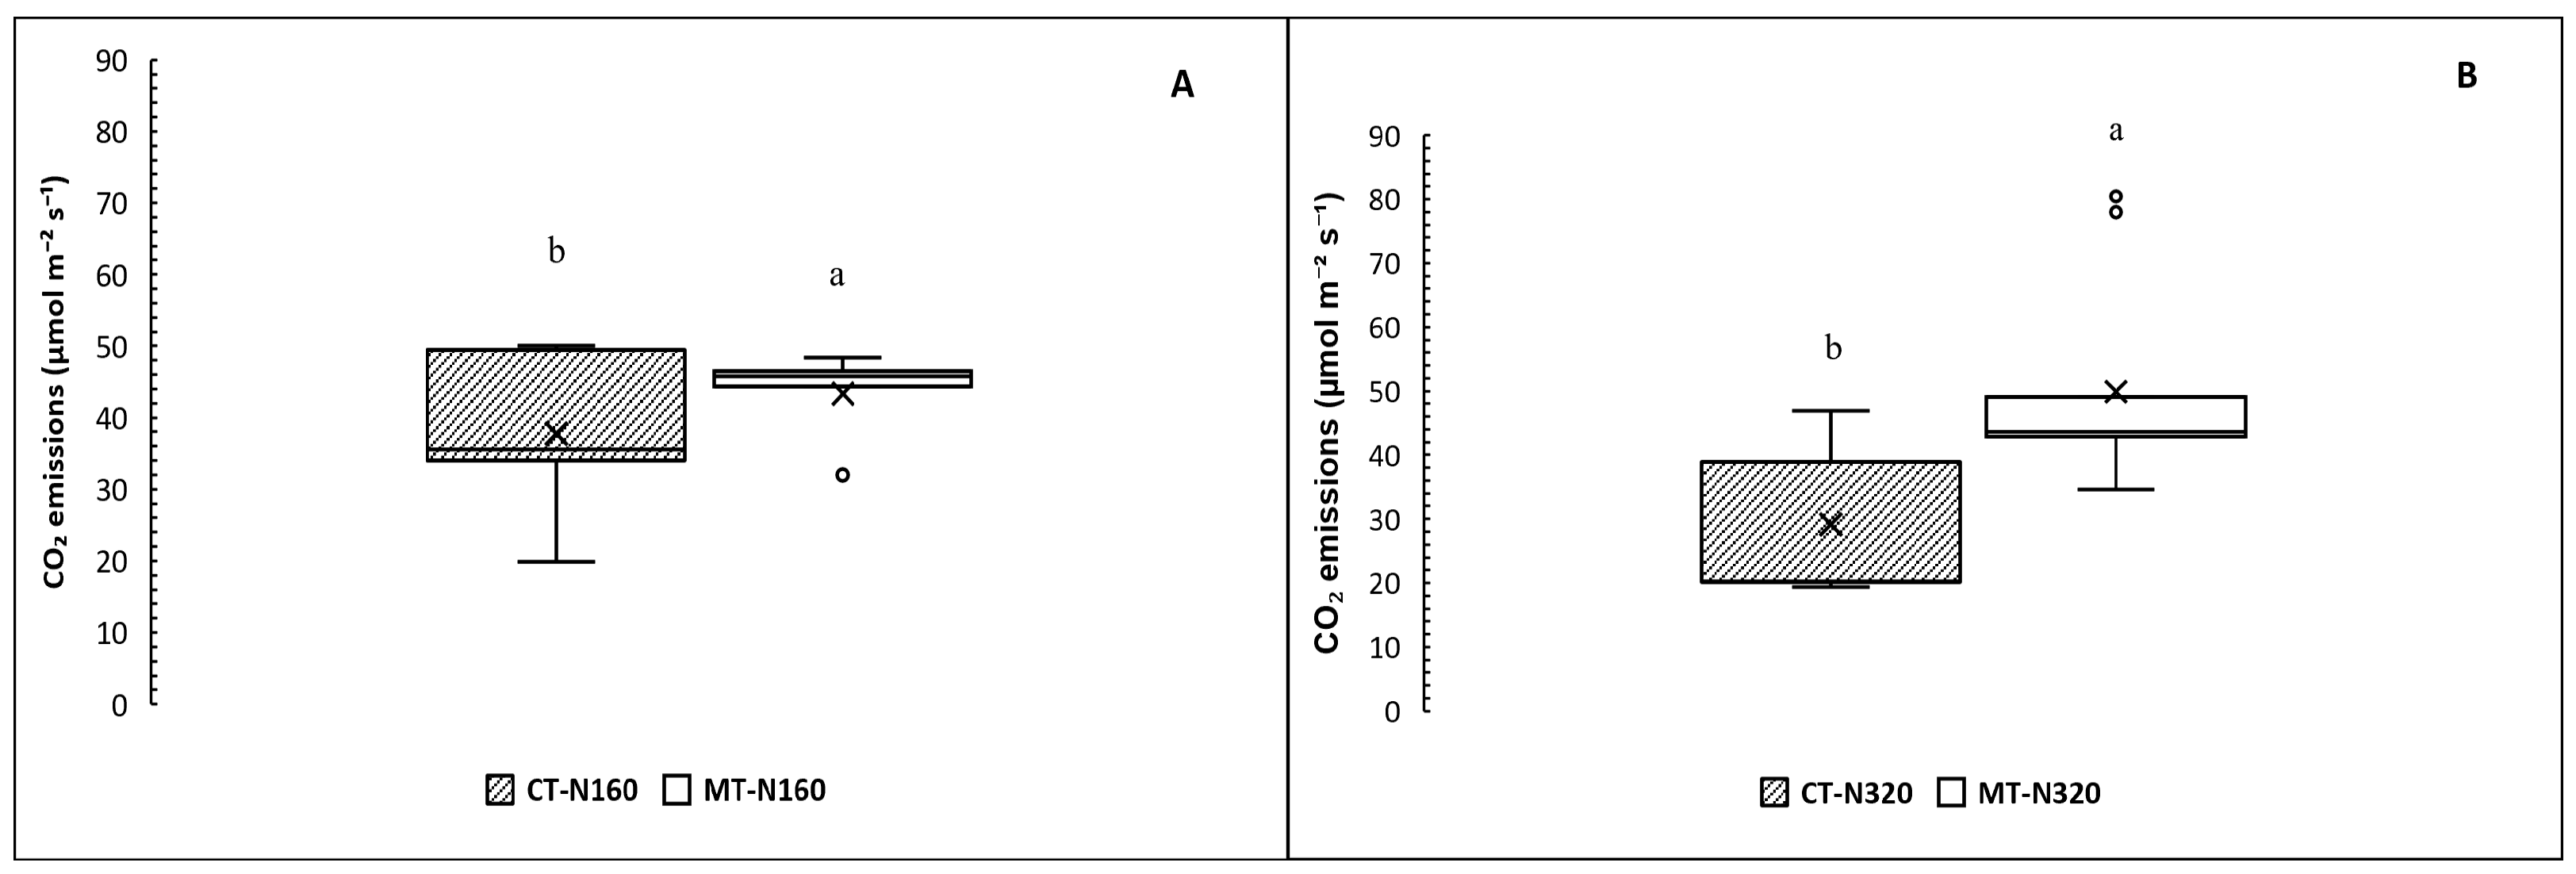
Figure 11 shows significantly higher CO2 emissions (p < 0.05) under MT than under CT at both nitrogen levels. At 74 kg N ha−1, MT averaged 43.3 ± 5.5 µmol m−2 s−1 vs. 37.7 ± 11.3 µmol m−2 s−1 under CT (Figure 11A), with MT consistently exhibiting higher emissions. At 147 kg N ha−1, emissions were 49.9 ± 15.7 µmol m−2 s−1 under MT and 29.1 ± 11.6 µmol m−2 s−1 under CT (Figure 11B).

3.3.3. Effect of Herbicide Dose on Soil CO2 Emissions Under Conventional Tillage Across Two Nitrogen Input Levels

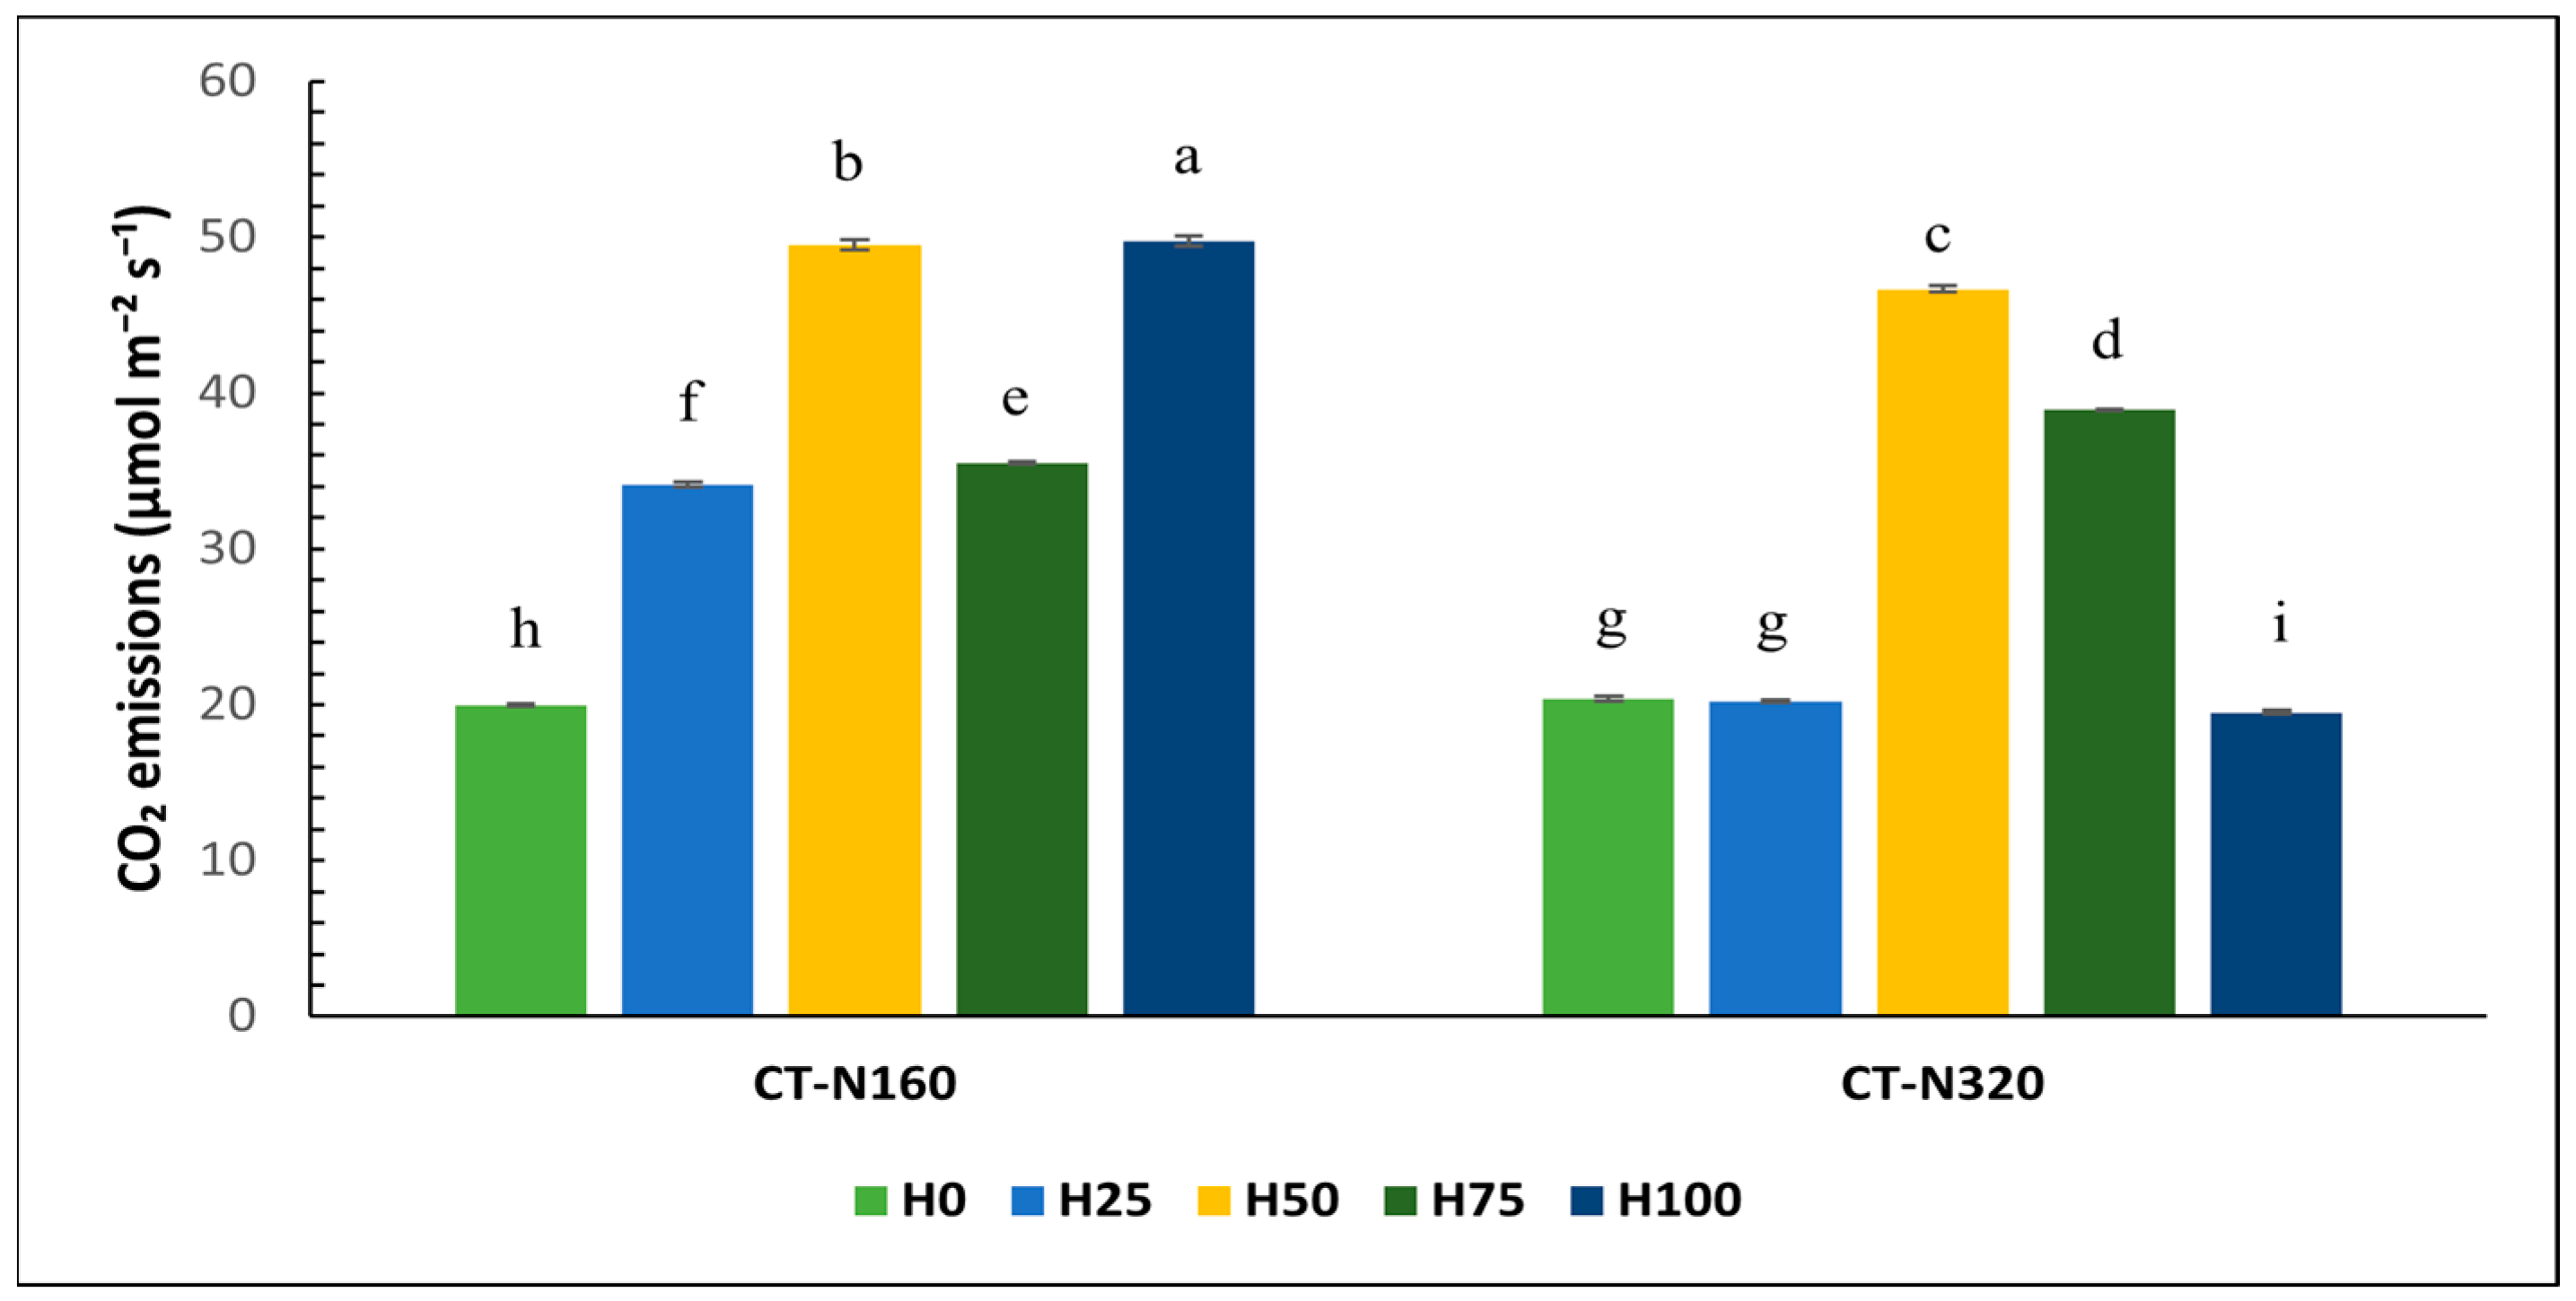
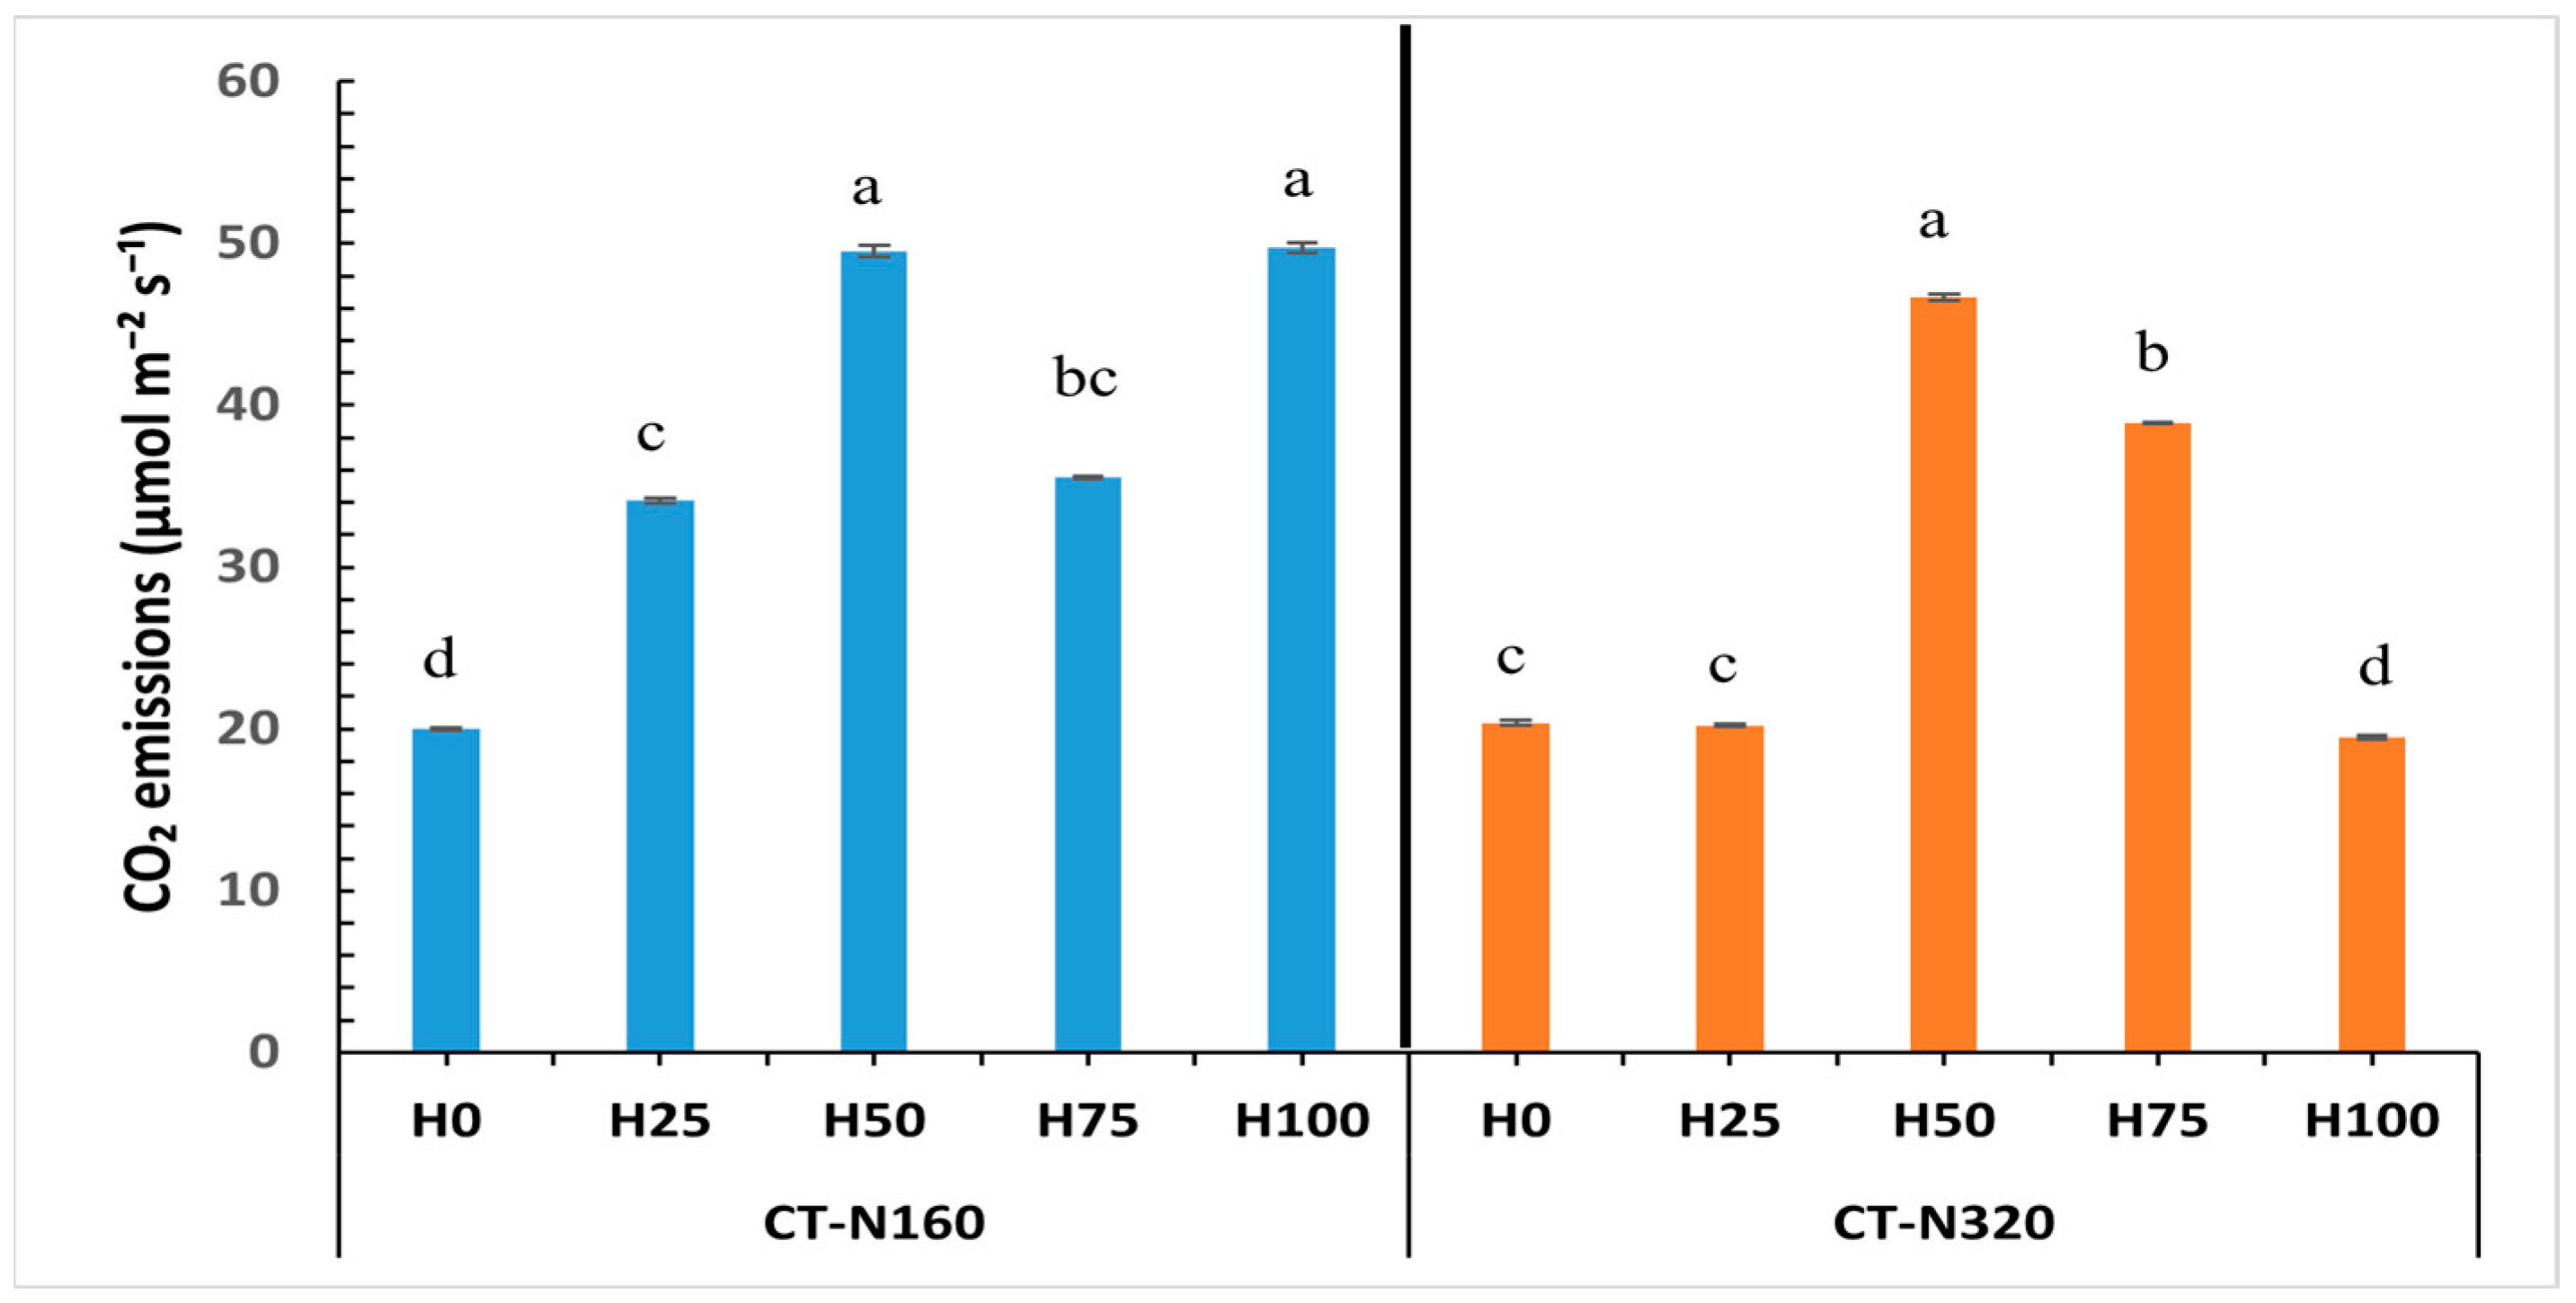
A significant effect (p < 0.05) of herbicide dose on CO2 emissions was observed under CT at both 74 and 147 kg N ha−1 (Figure 12).
At 74 kg N ha−1, emissions were the highest at H100 (49.7 ± 0.03 µmol m−2 s−1) and H50 (49.4 ± 0.3 µmol m−2 s−1), intermediate at H75 (35.5 ± 0.0 µmol m−2 s−1) and H25 (34.1 ± 0.1 µmol m−2 s−1), and the lowest at H0 (19.9 ± 0.0 µmol m−2 s−1). LSD0.05 (0.30) confirmed the emissions of H100 and H50 > H75, H25 > H0, with no difference between those of H100 and H50 or between H75 and H25.
At 147 kg N ha−1, the highest emissions occurred at H50 (46.6 ± 0.2 µmol m−2 s−1), followed by H75 (38.9 ± 0.1 µmol m−2 s−1), and lower emissions at H0 (20.3 ± 0.1 µmol m−2 s−1), H25 (20.2 ± 0.0 µmol m−2 s−1), and H100 (19.4 ± 0.1 µmol m−2 s−1). LSD0.05 (0.18) confirmed emissions of H50 > all others, H75 > H0 and H25, with no significant differences among those of H0, H25, and H100.

3.3.4. Effect of Herbicide Application Rate on Soil CO2 Emissions Under Minimum Tillage with Two Nitrogen Input Levels

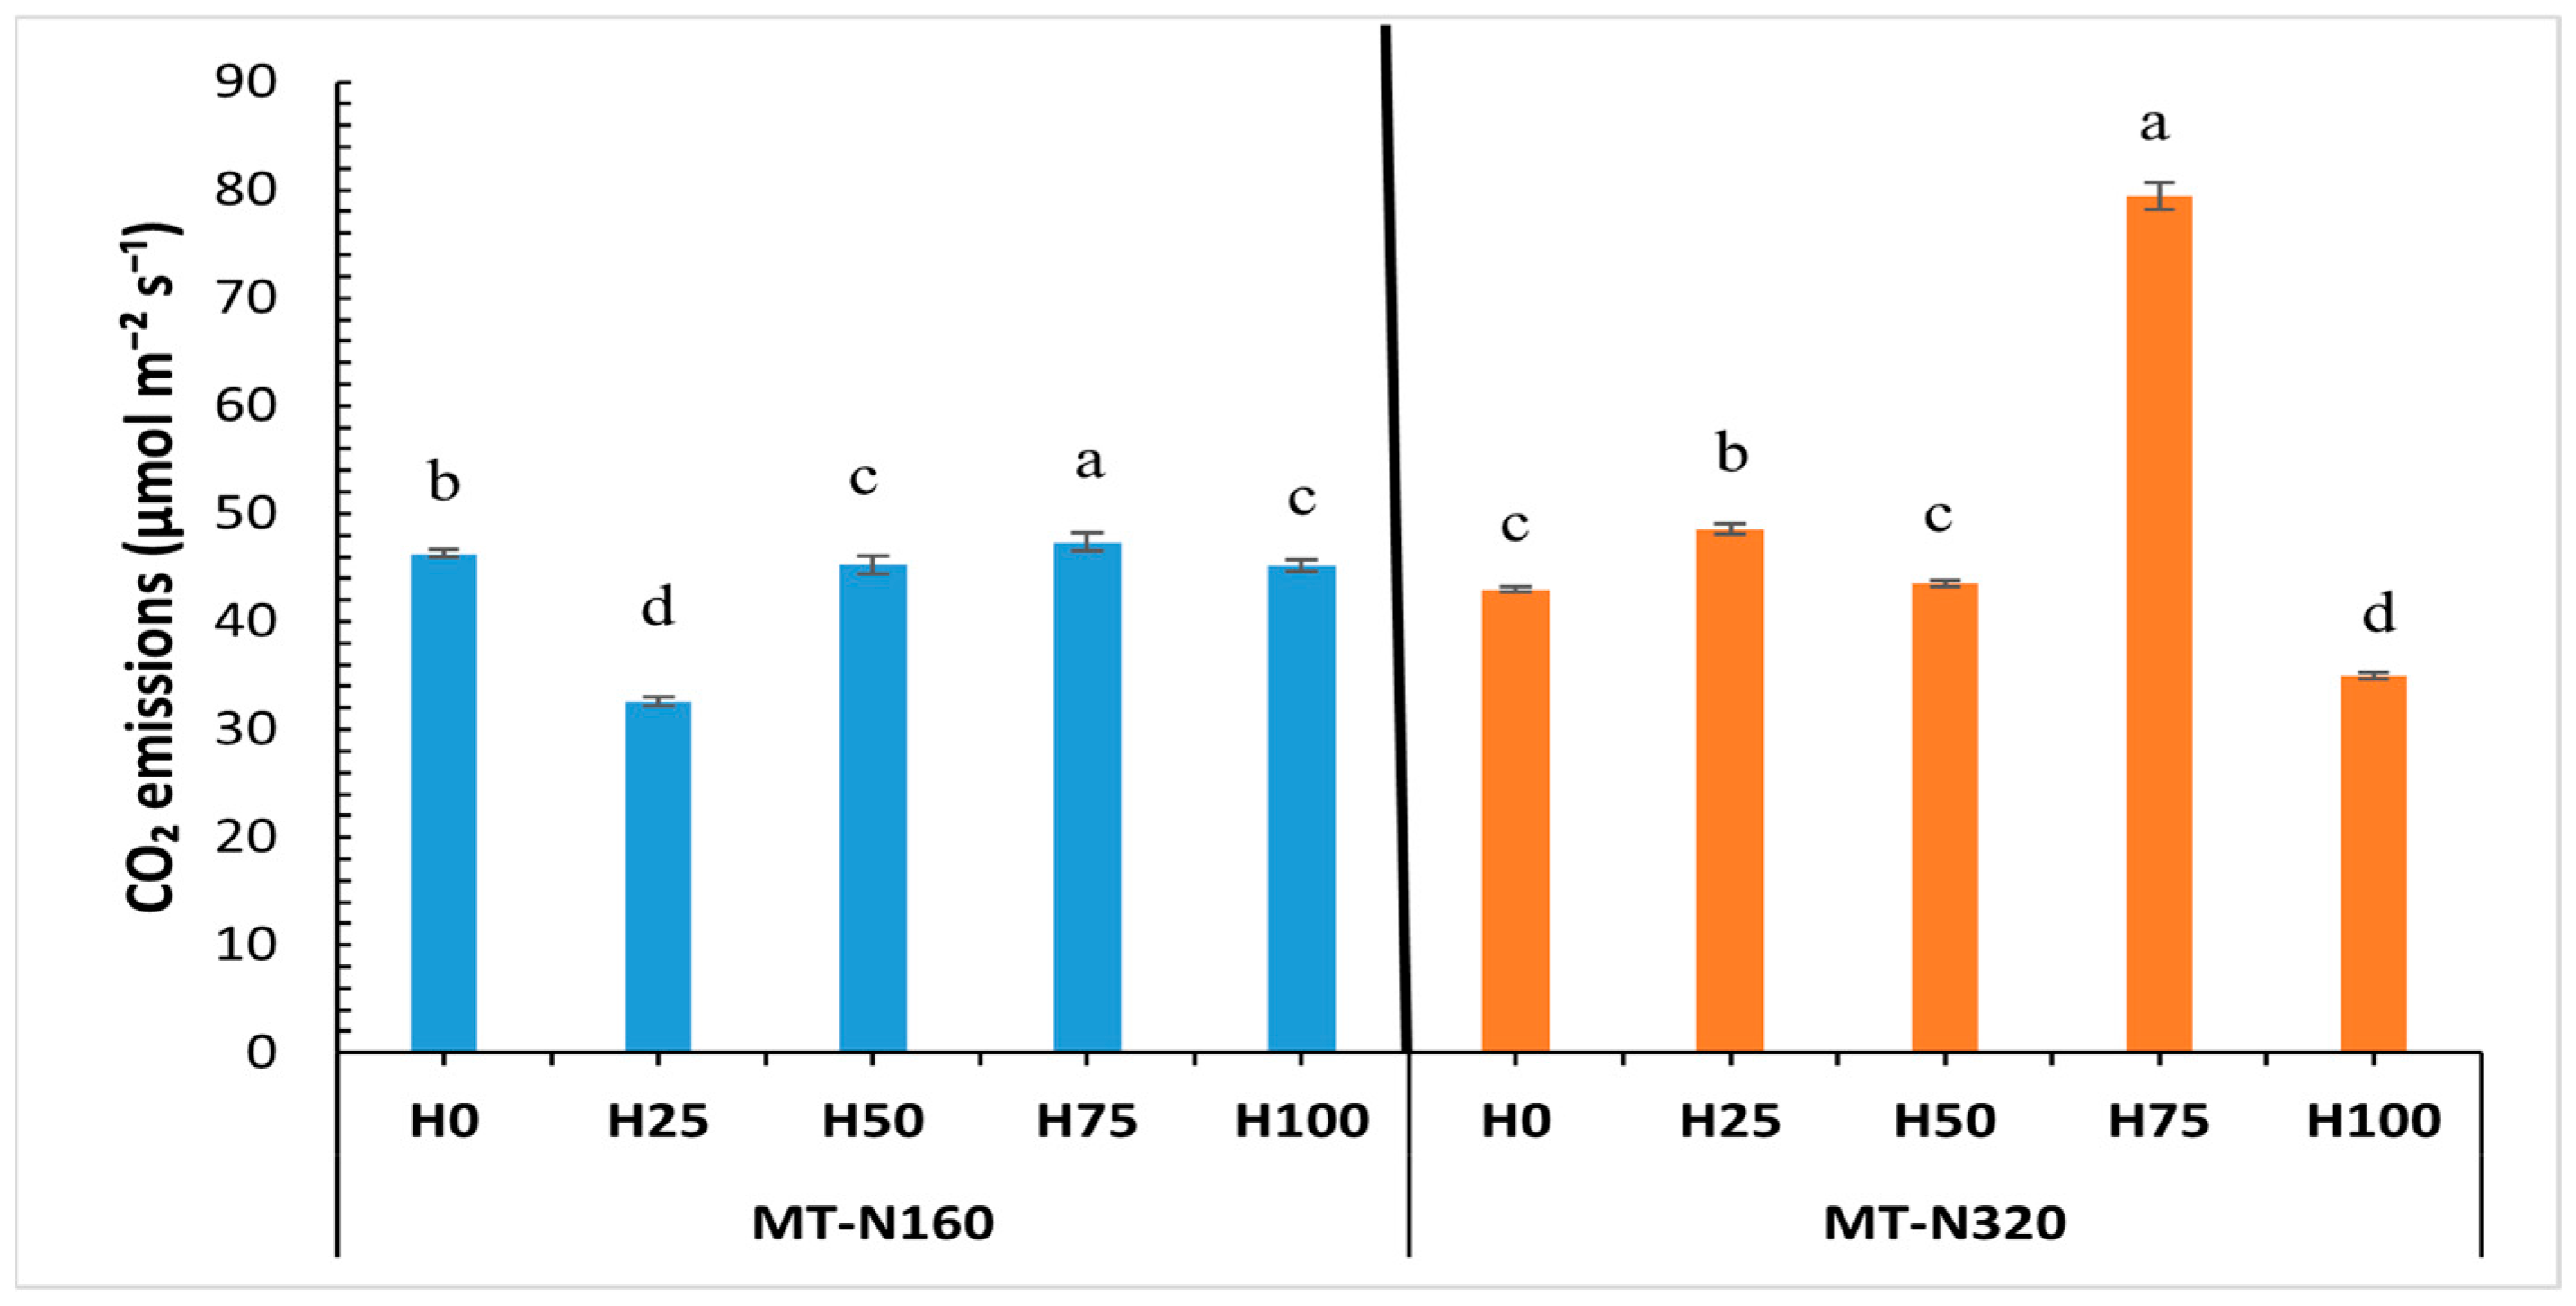
The herbicide dose had a highly significant effect (p < 0.05) on CO2 emissions under MT at both nitrogen levels (Figure 13).
At 74 kg N ha−1, emissions were the highest at H75 (47.3 ± 0.8 µmol m−2 s−1), followed by H0 (46.3 ± 0.3 µmol m−2 s−1), H50 (45.2 ± 0.8 µmol m−2 s−1), and H100 (45.2 ± 0.5 µmol m−2 s−1). The lowest emissions were at H25 (32.5 ± 0.4 µmol m−2 s−1). LSD0.05 (0.84) confirmed the emissions of H75 > H0, H50, and H100, while those of H25 < all others; those of H50 and H100 did not differ.
At 147 kg N ha−1, emissions peaked at H75 (79.4 ± 1.2 µmol m−2 s−1), followed by H25 (48.5 ± 0.4 µmol m−2 s−1), H50 (43.5 ± 0.3 µmol m−2 s−1), and H0 (42.9 ± 0.2 µmol m−2 s−1). The lowest emission occurred at H100 (35.0 ± 0.2 µmol m−2 s−1). LSD0.05 (0.83) confirmed the emissions of H75 > all treatments; H25 > H0, H50, and H100; H50 > H100, while those of H0 and H50 did not differ significantly.

3.3.5. Effect of Nitrogen and Herbicide Dose on Soil CO2 Emissions Under Conventional Tillage

Two-way ANOVA indicated highly significant effects (p < 0.001) of nitrogen level, herbicide dose, and their interaction on CO2 emissions under CT (Table 5). Emissions were higher at 74 kg N ha−1 (37.77 ± 11.32 µmol m−2 s−1) than at 147 kg N ha−1 (29.1 ± 11.6 µmol m−2 s−1), as confirmed by LSD0.05 = 0.12.
The nitrogen × herbicide interaction was also highly significant. The highest emission occurred at 74 kg N ha−1-H100 (49.7 ± 0.3 µmol m−2 s−1) and the lowest at 147 kg N ha−1-H100 (19.4 ± 0.1 µmol m−2 s−1). Emissions were:
  • 74 kg N ha−1: H100 (49.7 ± 0.3 µmol m−2 s−1), H50 (49.4 ± 0.2 µmol m−2 s−1), H75 (35.5 ± 0.0 µmol m−2 s−1), H25 (34.1 ± 0.1 µmol m−2 s−1), H0 (19.9 ± 0.0).
  • 147 kg N ha−1: H100 (19.4 ± 0.1 µmol m−2 s−1), H50 (46.6 ± 0.2 µmol m−2 s−1), H75 (38.9 ± 0.0 µmol m−2 s−1), H25 (20.2 ± 0.0 µmol m−2 s−1), H0 (20.3 ± 13.7 µmol m−2 s−1).
LSD0.05 (0.22) confirmed significant differences among the treatments. Figure 14 shows statistical groupings.

3.3.6. Effect of Nitrogen and Herbicide Dose on Soil CO2 Emissions Under Minimum Tillage

Two-way ANOVA revealed significant effects of nitrogen, herbicide dose, and their interaction on MT (Table 6). Nitrogen increased emissions, with 147 kg N ha−1 (49.9 ± 15.7 µmol m−2 s−1) exceeding 74 kg N ha−1 (43.3 ± 5.5 µmol m−2 s−1), as confirmed by LSD0.05 = 0.48.
A significant nitrogen × herbicide interaction (p < 0.001) was observed. The highest emissions occurred at 147 kg N ha−1-H75 (79.4 ± 1.2 µmol m−2 s−1), and the lowest at 147 kg N ha−1-H100 (35.0 ± 0.2 µmol m−2 s−1).
  • 74 kg N ha−1: H100 (45.2 ± 0.5 µmol m−2 s−1), H75 (47.3 ± 0.8 µmol m−2 s−1), H50 (45.2 ± 0.8 µmol m−2 s−1), H25 (32.5 ± 0.4 µmol m−2 s−1), and H0 (46.3 ± 0.3 µmol m−2 s−1).
  • 147 kg N ha−1: H100 (35.0 ± 0.2 µmol m−2 s−1), H75 (79.4 ± 1.2 µmol m−2 s−1), H50 (43.5 ± 0.3 µmol m−2 s−1), H25 (48.5 ± 0.4 µmol m−2 s−1), and H0 (42.9 ± 0.2 µmol m−2 s−1).
LSD0.05 (0.72) confirmed the significant differences. Figure 15 indicates no significant differences between H50-74 kg N ha−1 and H100-74 kg N ha−1 or between H0-147 kg N ha−1 and H50-147 kg N ha−1.

4. Discussion

4.1. Effect of Tillage on Soil Physical Properties

This study revealed distinct differences in soil physical properties between conventional tillage (CT) and minimum tillage (MT), providing an environmental context for interpreting the soil and plant responses. MT significantly increased the soil temperature (28.0 ± 1.5 °C) compared to CT (27.1 ± 2.5 °C; p < 0.05). This aligns with Yang, Drury, and Reeb [73], who reported warmer overwinter soils under no-till because of insulation from surface residues. In contrast, studies from temperate regions often found cooler seed zone temperatures under conservation tillage because residues reduce solar heat absorption [74,75]. The warmer soil in this northwestern Hungarian system likely reflects the interactions between residue-mediated water retention and the 2022 climatic conditions. Elevated soil temperature, combined with high moisture, suggest favourable conditions for microbial activity and decomposition, potentially leading to greater soil CO2 release.
Soil moisture was also significantly higher under MT (9.3 ± 6.5%) than under CT (5.4 ± 4.3%; p < 0.05), consistent with evidence that conservation tillage improves water use efficiency by reducing evaporation and enhancing infiltration [76,77,78,79,80]. Further noted that residue cover increases resilience in water-limited environments, improving maize yields. In this study, higher water availability under MT likely enhanced crop growth potential, but in combination with elevated temperatures, may also have intensified microbial respiration.
Conversely, MT resulted in more than twice the soil penetration resistance (0.6 ± 0.3 MPa) compared with CT (0.1 ± 0.0 MPa), consistent with studies showing that reduced tillage increases surface compaction [81,82,83]. Greater bulk density in MT arises from the absence of mechanical loosening, natural consolidation, and traffic-induced compaction [84,85]. Although compaction can limit root growth and nutrient uptake, improved soil moisture may partly offset these effects [86]. However, long-term studies have indicated that elevated bulk density and reduced pore connectivity can restrict root development and water uptake [87].
Overall, these findings underscore the trade-offs associated with conservation tillage. CT maintains looser, more porous soil, whereas MT enhances moisture retention and modifies thermal conditions but increases compaction. These contrasting environments shape plant–soil–atmosphere interactions and contextualise the combined effects of tillage, nitrogen, and herbicides observed in this study. The warmer, moister conditions under MT, observed during the measurement period and reflecting short-term conditions from a single growing season, may promote microbial activity and nutrient cycling but also elevate CO2 emissions [55]. Although soil organic carbon is widely recognised as a key parameter influenced by tillage, baseline soil organic matter was measured using (AgroCares scanner), whereas soil organic carbon was not directly quantified in this study and is discussed here only to provide conceptual context for interpreting soil CO2 emissions. Evaluating SOC dynamics was beyond the scope of the present study, which focused on short-term soil CO2 emissions, vegetation responses, and weed diversity during the first year of the experiment. These outcomes reinforce conservation agriculture principles emphasising the balance among water conservation, carbon management, and soil structure [88], while recognising challenges such as nitrogen immobilisation and weed pressure during early adoption [24].

4.2. Vegetation Response to Tillage and Management Practices

In this Hungarian maize system, NDVI did not differ significantly between CT and MT at either nitrogen level (74 kg N ha−1 or 147 kg N ha−1), despite the higher soil moisture under MT (9.3 ± 6.5%) than CT (5.4 ± 4.3%). This contrasts with reports of a higher NDVI under conservation tillage [79,89] but aligns with studies highlighting NDVI’s context-specific responses [90,91].
The slight, non-significant NDVI advantage under CT at both nitrogen levels (0.41 vs. 0.39 at 74 kg N ha−1; 0.42 vs. 0.40 at 147 kg N ha−1) may be related to lower soil penetration resistance (0.1 ± 0.0 MPa) compared with MT (0.6 ± 0.3 MPa), supporting early root growth and nutrient acquisition. Environmental variability, including micro-topography and soil heterogeneity, may overshadow tillage effects [92,93]. NDVI’s limitations such as saturation at high biomass levels and sensitivity to soil background should also be considered [90,94]; therefore, NDVI values in this study were interpreted as relative indicators of vegetation vigour among treatments rather than as direct measures of biomass.
NDVI responses to herbicide rates varied with the tillage type. Under CT, significant effects occurred only at 74 kg N ha−1, where the 75% herbicide dose yielded the highest NDVI (0.46 ± 0.02), suggesting optimal weed suppression with minimal crop stress—consistent with integrated weed management [95]. In MT, NDVI varied across both nitrogen levels, peaking under (H0) and low (H25) herbicide rates but declining to 0.34 ± 0.01 under H100 at 74 kg N ha−1. This pattern indicates greater crop sensitivity to herbicide stress in compacted MT soils, although reduced weed pressure under improved water regimes is an alternative explanation. These trends align with observations of altered weed dynamics, as reduced tillage reshapes soil conditions and alters seed placement. Armengot et al. [96] and Pardo et al. [97] found that less soil disturbance favours small-seeded, perennial, and herbicide-tolerant weeds compared with conventional ploughing, while Pätzold et al. [98] linked soil compaction and lower porosity under minimum tillage to shifts in weed emergence patterns. These changes can influence crop sensitivity to herbicides, which, as Ziska [99] noted, also depends on environmental factors such as temperature, moisture, and soil conditions.
No significant nitrogen–herbicide interaction was detected for either tillage system, indicating mainly additive effects. However, system responsiveness differed: under CT, NDVI primarily depended on the herbicide rate, while under MT, both nitrogen and herbicide significantly influenced NDVI. Higher nitrogen (147 kg N ha−1) under MT produced significantly greater NDVI (0.41 ± 0.04) than did 74 kg N ha−1 (0.39 ± 0.05), confirming that nitrogen availability is critical for crop vigour under conservation tillage [100,101,102]. Enhanced moisture retention under MT [93] likely improves nitrogen uptake efficiency.
Overall, NDVI responses indicate that tillage alters crop sensitivity to nitrogen and herbicide inputs. Under CT, moderate soil moisture and lower compaction make canopy growth mainly weed-limited, with optimal herbicide use at ~75% of the recommended rate. Under MT, higher moisture but greater compaction heightens herbicide sensitivity while enhancing nitrogen responsiveness, suggesting that lower herbicide and adequate nitrogen inputs are preferable. These findings support adaptive conservation agricultural practices to balance weed pressure, nitrogen immobilisation, and environmental variability [24]. Moreover, NDVI-based vegetation vigour reflects root activity and rhizosphere dynamics, influencing the CO2 emissions discussed in the subsequent sections.

4.3. Weed Community Structure and Diversity Responses

Weed diversity was consistently higher under minimum tillage (MT) than conventional tillage (CT), with Simpson’s Index values ranging from 0.53 to 0.80 (moderate to high diversity) in MT and 0.38 to 0.67 (low to moderate diversity) in CT. This pattern aligns with long-term studies showing that reduced soil disturbance promotes species richness and diversity by preserving seed banks, minimising soil inversion, and maintaining heterogeneous germination niches [95,103,104,105,106,107,108,109]. These studies collectively demonstrate that conservation or reduced tillage enhances weed heterogeneity [105,108], enriches soil organic carbon and stability—thereby indirectly supporting more diverse communities [106] while frequent tillage and herbicide use simplify weed communities and reduce ecological resilience [95,107]. Similarly, Pinke et al. [110] showed that tine harrow management reduced weed biomass, while organic fields maintained higher weed diversity, highlighting the value of non-chemical control for sustainable weed management. In Mediterranean systems, minimal tillage has also been shown to sustain high species richness despite stable total diversity over time [109].
Higher soil moisture under MT (9.37 ± 6.55%) than under CT (5.49 ± 4.32%) likely provided more favourable conditions for germination across a broader range of species. Previous studies have also reported increased weed pressure especially from perennials and deep-rooted weeds—during the early stages of conservation agriculture adoption [24], which explains the higher biomass and diversity observed under MT. In the current study, higher moisture availability under MT coincided with increased NDVI values (0.44–0.46 at 74 and 147 kg N ha−1) in plots with high weed diversity (Simpson’s index up to 0.80), suggesting that mixed vegetation canopies contributed to greater overall green cover.
Herbicide application significantly reduced weed biomass under both tillage systems, although the effects on diversity varied. Under CT, diversity fluctuated with herbicide dose and nitrogen level, peaking at H100 under 74 kg N ha−1 and at H75 under 147 kg N ha−1, suggesting species-specific herbicide tolerance, with the suppression of dominant weeds allowing less common, tolerant species to increase in abundance. Cathcart et al. [111] similarly found that plants grown under low nitrogen conditions exhibited greater herbicide resistance, requiring higher doses for control and shifting community composition toward tolerant species.
At low herbicide doses (H25), diversity was highest across nitrogen levels, supporting the concept that moderate inputs prevent dominance by aggressive species while maintaining coexistence [97,105,112,113]. Buhler et al. [112] and Locke et al. [105] reported that reduced tillage promotes diversity by allowing the persistence of both annual and perennial species, whereas Derksen et al. [113] showed that intensive herbicide use under CT homogenises weed communities. Similarly, Pardo et al. [97] found that minimal tillage in Mediterranean systems facilitates a more stratified seedbank and uneven germination, leading to a more diverse and resilient weed flora. This was also reflected in the NDVI and CO2 emission results, in which MT treatments with low to moderate herbicide doses (H0–H75) produced higher NDVI and greater CO2 emissions than those in CT, indicating concurrent variation in vegetation vigour, weed diversity, and soil respiration.
Biomass reduction was more pronounced under MT, decreasing from 5.02 g to 0.07 g at 74 kg N ha−1 and from 8.27 g to 0.14 g at 147 kg N ha−1. Despite this, diversity remained moderate to high at low to intermediate herbicide doses, suggesting that selective suppression under MT can simultaneously reduce biomass and sustain diversity. However, long-term reliance on herbicides risks accelerating the evolution of resistance [95]. Blackshaw et al. [95] demonstrated that integrating reduced herbicide rates with complementary strategies—such as competitive cultivars, higher planting densities, and rotations—can maintain effective weed control while limiting resistance. The increase in CO2 emissions observed with MT, particularly at 147 kg N ha−1–H75 (79.42 µmol m−2 s−1), further supports that higher biological activity and residue retention are characteristic features of reduced tillage systems [5,103].
Weed biomass and diversity also responded to the nitrogen availability. The highest biomass occurred in untreated plots (H0), whereas diversity peaks varied with nitrogen levels, reflecting changes in crop–weed competition dynamics. Anderson et al. [114] reported that no-till nitrogen fertilisation enhanced crop competitiveness and suppressed weed localisation, whereas Swanton et al. [115] concluded that tillage exerted a stronger influence than nitrogen rate. Shchukin et al. [116] further observed that additional herbicide doses may be required to manage increased weed pressure under minimal tillage. In the current study, nitrogen at level (147 kg N ha−1) enhanced both weed biomass and CO2 emissions under MT, supporting the close link between nutrient availability, plant growth, and soil respiration intensity [117,118]. Kuzyakov [117] showed that increased nutrient availability enhances microbial and root activity through priming processes that enhance CO2 emissions from soil organic matter. Simultaneously, Raich and Tufekcioglu [118] concluded that plant productivity and soil respiration are tightly coupled across ecosystems through shared controls on carbon and nutrient cycling.
Weed biomass was particularly high under MT in untreated plots (8.27 g vs. 4.25 g in CT at 147 kg N ha−1-H0), indicating that the absence of mechanical disturbance and favourable soil conditions promoted weed proliferation. Nevertheless, maintaining higher diversity under MT, even with moderate herbicide inputs, may slow the development of herbicide resistance by reducing the dominance of individual species.
These findings highlight a key trade-off: although high herbicide doses effectively reduce weed biomass, they can also create less resilient weed communities. In contrast, MT systems support greater diversity—especially at moderate herbicide rates—which may enhance ecosystem functions such as arthropod habitat provision, improved soil health through varied root systems, and reduced resistance risks [107]. However, the higher overall biomass under MT requires integrated management to balance biodiversity conservation with yield protection. These integrated responses across weed diversity, NDVI, and CO2 emissions indicate that MT enhances biological complexity and carbon turnover potential, consistent with broader evidence that reduced or minimum tillage practices increase soil microbial activity, aggregation, and organic carbon sequestration [119,120]. This highlights the need to combine tillage, nitrogen, and herbicide strategies to sustain productivity while reducing soil carbon loss [119,120].
Herbicides may also influence nitrogen cycling by altering nitrogen-fixing and nitrifying microbial communities [121], further complicating the nitrogen–herbicide–tillage interactions. These dynamics underscore the need for management approaches that sustain both crop productivity and ecosystem function [55,111].
Weed community composition directly affects soil carbon dynamics. Increased diversity and biomass under MT lead to greater root inputs and residues, which stimulate microbial activity and soil respiration. The warmer and moister microclimate in MT amplifies these effects, partially explaining the higher CO2 emissions measured in the MT plots. Overall, these results emphasise the interconnected nature of tillage, nitrogen, and herbicide management in shaping both agronomic and ecological outcomes.

4.4. Soil CO2 Emissions in Response to Management Practices

Across both nitrogen levels, CO2 emissions were consistently higher under minimum tillage (MT) than conventional tillage (CT), with differences being more pronounced at higher nitrogen inputs. At 74 kg N ha−1, MT recorded 43.3 ± 5.5 µmol m−2 s−1 compared with 37.7 ± 11.3 µmol m−2 s−1 under CT, while at 147 kg N ha−1, MT reached 49.9 ± 15.7 µmol m−2 s−1 compared with 29.1 ± 11.6 µmol m−2 s−1 under CT.
Although these results contrast with much of the conservation tillage literature, which reports lower CO2 emissions under reduced tillage [32,33,34,35], they align with Hungarian and international studies showing equal or higher emissions under reduced or no-till systems in certain contexts [36,37,38,39,40,122,123]. For example, Kulmány et al. [124] found that no-tillage systems emitted 23–26% more CO2 than CT during the peak growing seasons of 2020–2021. Higher emissions were attributed to increased soil moisture and penetration resistance, both of which enhance microbial respiration and CO2 release. Similarly, Zsembeli et al. [125] reported higher emissions under reduced tillage in seven of ten years on long-term meadow chernozem soils, with differences disappearing during periods of drought. Consistent with these patterns, Juhász et al. [126] showed, through long-term bare-soil monitoring, that exponential, temperature-driven models best described CO2 emissions, with soil moisture exerting little influence, supporting our observation that temperature is the primary driver of CO2 emissions under Hungarian climatic conditions.
The probable mechanism is that MT created warmer (28.0 °C vs. 27.1 °C) and moister (9.3 ± 6.5% vs. 5.4 ± 4.3%) soils than CT, conditions that enhance microbial activity and organic matter decomposition [127]. In this temperate continental setting, these effects may outweigh the reduced disturbance benefits which are usually associated with conservation tillage. Consistent with this interpretation, recent long-term field studies have shown that soil CO2 emissions under different tillage practices are strongly modulated by weather conditions, particularly temperature and precipitation, highlighting the context-dependent nature of tillage effects rather than uniform emission responses [128].
Nitrogen effects differed between tillage systems. Under CT, high nitrogen (147 kg N ha−1) unexpectedly reduced CO2 emissions compared with 74 kg N ha−1, whereas under MT, 147 kg N ha−1 significantly increased emissions, consistent with nitrogen-stimulated microbial respiration [41,42,43,44,45,46,129]. The MT response likely reflects the synergistic effects of increased nitrogen availability, high soil moisture, and elevated temperature, all of which enhance microbial activity [130,131]. In CT, lower compaction (0.1 ± 0.0 MPa vs. 0.6 ± 0.3 MPa in MT) may have improved plant nitrogen uptake, reducing substrate availability for microbial decomposition and limiting emissions, thereby reducing carbon inputs from roots and microbial respiration, consistent with the mechanisms proposed by Gagnon et al. [132], who observed lower soil CO2 emissions with nitrogen fertilisation due to reduced root activity and microbial decomposition.
Herbicide effects on CO2 emissions varied with tillage and nitrogen input.
  • Under CT, peak emissions occurred at intermediate to high herbicide doses (H50–H100), particularly at 74 kg N ha−1, where H100 recorded 49.7± 0.3 µmol m−2 s−1.
  • Under MT, the highest emissions were consistently observed at H75: 47.3 ± 0.8 µmol m−2 s−1 at 74 kg N ha−1 and 79.4 ± 1.2 µmol m−2 s−1 at 147 kg N ha−1, which were the highest emissions recorded in this study.
These patterns suggest nonlinear microbial responses to herbicides, in which moderate to high doses may accelerate respiration through the decomposition of dead weed biomass or stress-induced changes in microbial communities [50,55]. Such complexity aligns with earlier reports of pesticide effects on soil respiration [49,133].
Significant nitrogen–herbicide interactions highlight the complexity of integrated input management. Under CT, maximum emissions occurred at 74 kg N ha−1–H100, whereas under MT, extreme emissions at 147 kg N ha−1–H75 likely reflected optimal conditions for microbial decomposition: high soil moisture, elevated nitrogen, moderate herbicide stress, abundant residues, and high weed biomass. These outcomes support earlier findings that combined chemical inputs alter nitrogen cycling and greenhouse gas emissions through microbial processes such as ammonification and nitrification [133,134].
Although MT promotes water conservation and weed diversity, its higher short-term CO2 emissions—especially under high nitrogen and moderate herbicide inputs—cast doubt on its net climate benefits under these conditions. As noted by Hendrix et al. [36] and Oorts et al. [38], CO2 emissions are influenced by interactions among climate, soil, and management inputs rather than tillage alone.
The wide variability in emissions (19.49–79.42 µmol m−2 s−1 across treatments) underscores the importance of site-specific, integrated management. Lower herbicide doses (e.g., H25 under MT–74 kg N ha−1) may reduce both inputs and emissions while maintaining effective weed control [95]. Therefore, adaptive nutrient–herbicide strategies are essential for conservation agriculture [24]. Regional variability in climate and soil further reinforces the need for locally tailored management [134,135,136]. These results show that short-term CO2 responses to conservation tillage are dynamic and context-dependent. A long-term systems perspective is required to offset short-term greenhouse gas emissions with the broader goals of soil health, productivity, and sustainability.
Overall, this study highlights the interconnectedness of soil conditions, vegetation vigour, weed diversity, and CO2 emissions. In MT, warmer, moister, and more compact soils fostered microbial activity, influenced crop responses, and affected weed competition. Higher nitrogen responsiveness under MT improved canopy vigour (NDVI) and supported greater weed diversity by reducing disturbances and increasing residue cover. The combination of stronger crop and weed growth increased organic inputs and microbial substrates, amplifying soil CO2 emissions relative to CT. Conversely, CT soils—with lower moisture and bulk density—restricted microbial activity, suppressed weed diversity, and produced lower CO2 emissions at the expense of reduced ecological complexity. This soil–crop–weed–carbon linkage underscores the need to view agronomic practices as interdependent components of an integrated agroecosystem rather than as isolated management factors.

4.5. Study Limitations and Future Research Directions

This study provides valuable insights into the short-term (1-year) effects of integrated management on soil CO2 release in Hungarian maize systems. However, this study has some limitations which should be acknowledged. First, measurements were confined to a single growing season (2022); multi-year studies are required to capture interannual variability under varying climatic conditions. Because soil CO2 emissions were analysed using a single, standardised measurement time point within the growing season, the results should be interpreted as short-term, site- and time-specific treatment comparisons rather than indicators of seasonal emission dynamics or cumulative carbon budgets. Repeated measurements across seasons and years would be required to fully characterise temporal variability, which will be addressed in future phases of this ongoing experiment. Second, only CO2 fluxes were measured; comprehensive assessments should also include N2O and CH4 to better quantify the total greenhouse gas balances better. Finally, long-term monitoring of soil carbon sequestration is essential for evaluating the net climate impact of conservation tillage systems.
To address these limitations, future studies should extend the monitoring duration across multiple years and sites, include additional greenhouse gases (N2O and CH4), and integrate soil carbon sequestration measurements to provide a complete assessment of the climate impacts of conservation tillage.

5. Conclusions

This study provides a comprehensive assessment of how tillage, nitrogen fertilisation, and herbicide application interact to influence soil physical properties, vegetation vigour, weed biodiversity, and soil CO2 emissions in a Hungarian maize production system. The results demonstrate that these management factors function interdependently within the soil–plant–microbe continuum, producing significant agronomic and ecological outcomes.
Minimum tillage (MT) improved soil moisture retention and supported a greater weed species diversity than conventional tillage (CT). However, it also increased soil penetration resistance and consistently produced higher short-term CO2 emissions, particularly when high nitrogen rates were combined with moderate herbicide applications. NDVI analyses indicated that vegetation vigour was driven by nitrogen availability under MT, whereas herbicide management played a greater role under CT.
Weed community responses revealed a trade-off between biodiversity conservation and weed-biomass control. MT maintained higher weed diversity even with moderate herbicide use, potentially delaying herbicide resistance but necessitating integrated management to minimise crop competition. Similarly, soil CO2 emission patterns suggested that the water-conservation and biodiversity benefits of MT could be counterbalanced by elevated greenhouse gas emissions under intensive chemical inputs. Strong nitrogen–herbicide interactions and the fourfold variation in emissions across treatments emphasise the importance of precision and site-specific management over generalised recommendations.
From an economic perspective, these results indicate that increased nitrogen and herbicide inputs do not consistently result in proportional gains in vegetation vigour, particularly under MT. This highlights the importance of optimising input use rather than maximising application rates, with potential implications for reducing fertiliser and herbicide costs while maintaining agronomic performance.
For Hungarian maize systems and similar temperate continental climates, the findings indicate that conservation tillage should be implemented within a broader climate-smart framework that integrates optimised nitrogen use, judicious herbicide application, and adaptive weed management. Precision management, which optimises nitrogen rates and decreases unimportant herbicide inputs, offers a practical pathway to improve environmental outcomes and enhance economic efficiency. Although MT promotes water retention and weed diversification, its high short-term CO2 emissions under certain input combinations cast doubt on its overall climate benefits. Therefore, precision management—optimising nitrogen and reducing herbicide inputs—offers a promising pathway to balance emission reduction with agronomic gains.

Author Contributions

Conceptualization, Z.K.A.-M., I.M.K., A.G.S.D.D.S. and V.V.; data curation, Z.K.A.-M., L.B., G.P. and I.M.K.; formal analysis, Z.K.A.-M. and I.M.K.; investigation, Z.K.A.-M., I.M.K., G.P., D.S., B.H. and V.V.; project administration, Z.K.A.-M., I.M.K., L.B., D.S., B.H., G.H., E.R. and S.Z.; resources, Z.K.A.-M., I.M.K. and V.V.; software, J.A.A., Z.K.A.-M., B.M.T., S.Z. and I.M.K., supervision, I.M.K. and V.V.; validation, Z.K.A.-M., I.M.K. and V.V.; visualisation, Z.K.A.-M., A.G.S.D.D.S., Á.L. and I.M.K.; writing—original draft, Z.K.A.-M.; writing—review and editing, Z.K.A.-M., V.V. and I.M.K. All authors have read and agreed to the published version of the manuscript.

Funding

The research was funded and supported by the CSR (Project ID: 101216573; NRDI ID: 2025-3.1.2-KÖA-2025-00020), the TechCoach (Project ID: 101182908; NRDI ID: 2020-2.1.1-ED-2024-00342) and the Trans4num (project No.: 101081847) Horizon Europe projects.

Data Availability Statement

The data presented in this study are available on request from the corresponding author. The data are not publicly available due to privacy or ethical restrictions.

Conflicts of Interest

The authors declare no conflicts of interest.

Abbreviations

The following abbreviations are used in this manuscript:
CTConventional Tillage
MTMinimum Tillage
NTNo-Tillage
NDVINormalised Difference Vegetation Index
CO2Carbon Dioxide
N2ONitrous Oxide
CH4Methane
N160Nitrogen fertiliser applied at 74 kg N ha−1
N320Nitrogen fertiliser applied at 147 kg N ha−1
H00% Herbicide Dose (No Herbicide)
H2525% Herbicide Dose
H5050% Herbicide Dose
H7575% Herbicide Dose
H100100% Herbicide Dose (Full Recommended Rate)
LSD0.05Least Significant Difference at p < 0.05
ANOVAAnalysis of Variance
SDStandard Deviation
MPaMegapascal
µmol m−2 s−1Micromoles per square metre per second (unit of CO2 flux)
GHGGreenhouse Gas
GISGeographic Information System
CVCoefficient of Variation

References

  1. Alsafadi, K.; Mohammed, S.A.; Ayugi, B.; Sharaf, M.; Harsányi, E. Spatial–temporal evolution of drought characteristics over Hungary between 1961 and 2010. Pure Appl. Geophys. 2020, 177, 3961–3978. [Google Scholar] [CrossRef] [Scilit]
  2. Mohammed, S.; Al-Ebraheem, A.; Holb, I.J.; Alsafadi, K.; Dikkeh, M.; Pham, Q.B.; Linh, N.T.T.; Szabo, S. Soil management effects on soil water erosion and runoff in central Syria—A comparative evaluation of general linear model and random forest regression. Water 2020, 12, 2529. [Google Scholar] [CrossRef] [Scilit]
  3. Mohammed, S.; Alsafadi, K.; Takács, I.; Harsányi, E. Contemporary changes of greenhouse gases emission from the agricultural sector in the EU-27. Geol. Ecol. Landsc. 2020, 4, 282–287. [Google Scholar] [CrossRef] [Scilit]
  4. Tessum, C.W.; Hill, J.D.; Marshall, J.D. Life cycle air quality impacts of conventional and alternative light-duty transportation in the United States. Proc. Natl. Acad. Sci. USA 2014, 111, 18490–18495. [Google Scholar] [CrossRef] [Scilit]
  5. Oertel, C.; Matschullat, J.; Zurba, K.; Zimmermann, F.; Erasmi, S. Greenhouse gas emissions from soils—A review. Geochemistry 2016, 76, 327–352. [Google Scholar] [CrossRef] [Scilit]
  6. Yue, X.L.; Gao, Q.X. Contributions of natural systems and human activity to greenhouse gas emissions. Adv. Clim. Change Res. 2018, 9, 243–252. [Google Scholar] [CrossRef] [Scilit]
  7. Mohammed, S.; Gill, A.R.; Alsafadi, K.; Hijazi, O.; Yadav, K.K.; Hasan, M.A.; Khan, A.H.; Islam, S.; Cabral-Pinto, M.M.S.; Harsanyi, E. An overview of greenhouse gases emissions in Hungary. J. Clean. Prod. 2021, 314, 127865. [Google Scholar] [CrossRef] [Scilit]
  8. Intergovernmental Panel on Climate Change (IPCC). Mitigation of Climate Change; Climate Change; IPCC: Geneva, Switzerland 2022; Available online: https://www.ipcc.ch/report/ar6/wg3/ (accessed on 17 October 2023).
  9. Mohammed, S.; Mirzaei, M.; Pappné Törő, Á.; Anari, M.G.; Moghiseh, E.; Asadi, H.; Szabó, S.; Kakuszi-Széles, A.; Harsányi, E. Soil carbon dioxide emissions from maize (Zea mays L.) fields as influenced by tillage management and climate. Irrig. Drain. 2022, 71, 228–240. [Google Scholar] [CrossRef] [Scilit]
  10. Platis, D.P.; Anagnostopoulos, C.D.; Tsaboula, A.D.; Menexes, G.C.; Kalburtji, K.L.; Mamolos, A.P. Energy analysis, and carbon and water footprint for environmentally friendly farming practices in agroecosystems and agroforestry. Sustainability 2019, 11, 1664. [Google Scholar] [CrossRef] [Scilit]
  11. Follett, R.F.; Shafer, S.R.; Jawson, M.D.; Franzluebbers, A.J. Research and implementation needs to mitigate greenhouse gas emissions from agriculture in the USA. Soil Tillage Res. 2005, 83, 159–166. [Google Scholar] [CrossRef] [Scilit]
  12. Lal, R.; Follett, R.F.; Stewart, B.A.; Kimble, J.M. Soil carbon sequestration to mitigate climate change and advance food security. Soil Sci. 2007, 172, 943–956. [Google Scholar] [CrossRef] [Scilit]
  13. Intergovernmental Panel on Climate Change (Ed.) Climate Change 2013—The Physical Science Basis; Cambridge University Press: Cambridge, UK, 2014. [Google Scholar] [CrossRef] [Scilit]
  14. Wattiaux, M.A.; Uddin, M.E.; Letelier, P.; Jackson, R.D.; Larson, R.A. Invited Review: Emission and mitigation of greenhouse gases from dairy farms: The cow, the manure, and the field. Appl. Anim. Sci. 2019, 35, 238–254. [Google Scholar] [CrossRef] [Scilit]
  15. Ma, S.; Xiong, J.; Cui, R.; Sun, X.; Han, L.; Xu, Y.; Kan, Z.; Gong, X.; Huang, G. Effects of intermittent aeration on greenhouse gas emissions and bacterial community succession during large-scale membrane-covered aerobic composting. J. Clean. Prod. 2020, 266, 121551. [Google Scholar] [CrossRef] [Scilit]
  16. Nawaz, A.; Lal, R.; Shrestha, R.K.; Farooq, M. Mulching affects soil properties and greenhouse gas emissions under long-term no-till and plough-till systems in alfisol of Central Ohio. Land Degrad. Dev. 2017, 28, 673–681. [Google Scholar] [CrossRef] [Scilit]
  17. Al-Kaisi, M.M.; Kruse, M.L.; Sawyer, J.E. Effect of nitrogen fertilizer application on growing season soil carbon dioxide emission in a corn–soybean rotation. J. Environ. Qual. 2008, 37, 325–332. [Google Scholar] [CrossRef] [Scilit]
  18. He, M.; Ma, W.; Zelenev, V.V.; Khodzaeva, A.K.; Kuznetsov, A.M.; Semenov, A.M.; Semenov, V.M.; Blok, W.; van Bruggen, A.H.C. Short-term dynamics of greenhouse gas emissions and cultivable bacterial populations in response to induced and natural disturbances in organically and conventionally managed soils. Appl. Soil Ecol. 2017, 119, 294–306. [Google Scholar] [CrossRef] [Scilit]
  19. Doyeni, M.O.; Stulpinaite, U.; Baksinskaite, A.; Suproniene, S.; Tilvikiene, V. Greenhouse gas emissions in agricultural cultivated soils using animal waste-based digestates for crop fertilization. J. Agric. Sci. 2021, 159, 23–30. [Google Scholar] [CrossRef] [Scilit]
  20. Smith, P.; Martino, D.; Cai, Z.; Gwary, D.; Janzen, H.; Kumar, P.; McCarl, B.; Ogle, S.; O’Mara, F.; Rice, C.; et al. Greenhouse gas mitigation in agriculture. Philos. Trans. R. Soc. Lond. B Biol. Sci. 2008, 363, 789–813. [Google Scholar] [CrossRef] [Scilit]
  21. Ren, X.; Tang, J.; Liu, X.; Liu, Q. Effects of microplastics on greenhouse gas emissions and the microbial community in fertilized soil. Environ. Pollut. 2020, 256, 113347. [Google Scholar] [CrossRef] [Scilit] [PubMed]
  22. Li, H.; Jin, X.; Shan, W.; Han, B.; Zhou, Y.; Tittonell, P. Optimizing agricultural management in China for soil greenhouse gas emissions and yield balance: A regional heterogeneity perspective. J. Clean. Prod. 2024, 452, 142255. [Google Scholar] [CrossRef] [Scilit]
  23. Oertel, C.; von Bodenentgasungen, A. Sachsen Mit Kammersystemen. Ph.D. Thesis, Technische Universität Bergakademie Freiberg, Freiberg, Germany, 2017. [Google Scholar]
  24. Oyeogbe, A.I.; Das, T.K.; Bhatia, A.; Singh, S.B. Adaptive nitrogen and integrated weed management in conservation agriculture: Impacts on agronomic productivity, greenhouse gas emissions, and herbicide residues. Environ. Monit. Assess. 2017, 189, 198. [Google Scholar] [CrossRef] [Scilit]
  25. Rehman, A.; Ma, H.; Irfan, M.; Ahmad, M. Does carbon dioxide, methane, nitrous oxide, and GHG emissions influence the agriculture? Evidence from China. Environ. Sci. Pollut. Res. 2020, 27, 28768–28779. [Google Scholar] [CrossRef] [Scilit]
  26. Popp, J.; Oláh, J.; Neményi, M.; Nyéki, A. Global challenges and the ‘farm to fork’ strategies of the European Green Deal: Blessing or curse. Prog. Agric. Eng. Sci. 2024, 20, 101–111. [Google Scholar] [CrossRef] [Scilit]
  27. Reicosky, D.C.; Lindstrom, M.J. Fall tillage method: Effect on short-term carbon dioxide flux from soil. Agron. J. 1993, 85, 1237–1243. [Google Scholar] [CrossRef] [Scilit]
  28. Cillis, D.; Maestrini, B.; Pezzuolo, A.; Marinello, F.; Sartori, L. Modeling soil organic carbon and carbon dioxide emissions in different tillage systems supported by precision agriculture technologies under current climatic conditions. Soil Tillage Res. 2018, 183, 51–59. [Google Scholar] [CrossRef] [Scilit]
  29. Almaraz, J.J.; Zhou, X.; Mabood, F.; Madramootoo, C.; Rochette, P.; Ma, B.L.; Smith, D.L. Greenhouse gas fluxes associated with soybean production under two tillage systems in southwestern Quebec. Soil Tillage Res. 2009, 104, 134–139. [Google Scholar] [CrossRef] [Scilit]
  30. Fuentes, M.; Hidalgo, C.; Etchevers, J.; De León, F.; Guerrero, A.; Dendooven, L.; Verhulst, N.; Govaerts, B. Conservation agriculture, increased organic carbon in the top-soil macro-aggregates and reduced soil CO2 emissions. Plant Soil 2012, 355, 183–197. [Google Scholar] [CrossRef] [Scilit]
  31. Rutkowska, B.; Szulc, W.; Sosulski, T.; Skowrońska, M.; Szczepaniak, J. Impact of reduced tillage on CO under maize cultivation. Soil Tillage Res. 2018, 180, 21–28. [Google Scholar] [CrossRef] [Scilit]
  32. Bista, P.; Norton, U.; Ghimire, R.; Norton, J.B. Effects of tillage system on greenhouse gas fluxes and soil mineral nitrogen in wheat (Triticum aestivum, L.)-fallow during drought. J. Arid. Environ. 2017, 147, 103–113. [Google Scholar] [CrossRef] [Scilit]
  33. Passianoto, C.C.; Ahrens, T.; Feigl, B.J.; Steudler, P.A.; Do Carmo, J.B.; Melillo, J.M. Emissions of CO2, N2O, and NO in conventional and no-till management practices in Rondônia, Brazil. Biol. Fertil. Soils 2003, 38, 200–208. [Google Scholar] [CrossRef] [Scilit]
  34. Dachraoui, M.; Sombrero, A. Effect of tillage systems and different rates of nitrogen fertilisation on the carbon footprint of irrigated maize in a semiarid area of Castile and León, Spain. Soil Tillage Res. 2020, 196, 104472. [Google Scholar] [CrossRef] [Scilit]
  35. Holland, J.M. The environmental consequences of adopting conservation tillage in Europe: Reviewing the evidence. Agric. Ecosyst. Environ. 2004, 103, 1–25. [Google Scholar] [CrossRef] [Scilit]
  36. Hendrix, P.F.; Han, C.-R.; Groffman, P.M. Soil respiration in conventional and no-tillage agroecosystems under different winter cover crop rotations. Soil Tillage Res. 1988, 12, 135–148. [Google Scholar] [CrossRef] [Scilit]
  37. Fortin, M.C.; Rochette, P.; Pattey, E. Soil carbon dioxide fluxes from conventional and no-tillage small-grain cropping systems. Soil Sci. Soc. Am. J. 1996, 60, 1541–1547. [Google Scholar] [CrossRef] [Scilit]
  38. Oorts, K.; Merckx, R.; Gréhan, E.; Labreuche, J.; Nicolardot, B. Determinants of annual fluxes of CO2 and N2O in long-term no-tillage and conventional tillage systems in northern France. Soil Tillage Res. 2007, 95, 133–148. [Google Scholar] [CrossRef] [Scilit]
  39. Aslam, T.; Choudhary, M.A.; Saggar, S. Influence of land-use management on CO2 emissions from a silt loam soil in New Zealand. Agric. Ecosyst. Environ. 2000, 77, 257–262. [Google Scholar] [CrossRef] [Scilit]
  40. Bilandžija, D.; Zgorelec, Ž.; Kisić, I. Influence of tillage practices and crop type on soil CO2 emissions. Sustainability 2016, 8, 90. [Google Scholar] [CrossRef] [Scilit]
  41. Ma, Y.; Qian, C.; Sun, D.; Deng, L.; Huang, G.; Lu, W. Effect of nitrogen fertilizer application on greenhouse gas emissions from soil in paddy field. Trans. Chin. Soc. Agric. Eng. 2016, 32, 128–134. [Google Scholar] [CrossRef]
  42. Yu, W.J.; Li, X.S.; Chen, Z.J.; Zhou, J.B. Effects of nitrogen fertilizer application on carbon dioxide emissions from soils with different inorganic carbon contents. Ying Yong Sheng Tai Xue Bao 2018, 29, 2493–2500. [Google Scholar] [CrossRef] [Scilit]
  43. Kong, D.; Liu, N.; Ren, C.; Li, H.; Wang, W.; Li, N.; Yang, G. Effect of nitrogen fertilizer on soil CO2 emission depends on crop rotation strategy. Sustainability 2020, 12, 5271. [Google Scholar] [CrossRef] [Scilit]
  44. Wang, J.; Xie, J.; Li, L.; Effah, Z.; Xie, L.; Luo, Z.; Zhou, Y.; Jiang, Y. Fertilization treatments affect soil CO2 emission through regulating soil bacterial community composition in the semiarid Loess Plateau. Sci. Rep. 2022, 12, 20123. [Google Scholar] [CrossRef] [Scilit]
  45. Guo, C.; Liu, X.; He, X. A global meta-analysis of crop yield and agricultural greenhouse gas emissions under nitrogen fertilizer application. Sci. Total Environ. 2022, 831, 154982. [Google Scholar] [CrossRef] [Scilit]
  46. Wilson, H.M.; Al-Kaisi, M.M. Crop rotation and nitrogen fertilization effect on soil CO2 emissions in central Iowa. Appl. Soil Ecol. 2008, 39, 264–270. [Google Scholar] [CrossRef] [Scilit]
  47. Singh, B. Are nitrogen fertilizers deleterious to soil health? Agronomy 2018, 8, 48. [Google Scholar] [CrossRef] [Scilit]
  48. Tahat, M.M.; Alananbeh, K.M.; Othman, Y.A.; Leskovar, D.I. Soil health and sustainable agriculture. Sustainability 2020, 12, 4859. [Google Scholar] [CrossRef] [Scilit]
  49. Kinney, C.A.; Mosier, A.R.; Ferrer, I.; Furlong, E.T.; Mandernack, K.W. Effects of the herbicides prosulfuron and metolachlor on fluxes of CO2, N2O, and CH4 in a fertilized Colorado grassland soil. J. Geophys. Res. 2004, 109, D05. [Google Scholar] [CrossRef] [Scilit]
  50. Zabaloy, M.C.; Gómez, M.A. Microbial respiration in soils of the Argentine Pampas after metsulfuron methyl, 2,4-D, and glyphosate treatments. Commun. Soil Sci. Plant Anal. 2008, 39, 370–385. [Google Scholar] [CrossRef] [Scilit]
  51. Sándor, Z.; Kincses, I.; Tállai, M.; Lowy, D.A.; Melendez, J.R.; Guananga Diaz, N.I.; Guevara Iñiguez, L.E.; Cuenca Nevarez, G.; Talledo Solórzano, V.; Kátai, J. Effect of herbicides on soil respiration: A case study conducted at Debrecen-Látókép Plant Cultivation Experimental Station. F1000Research 2020, 9, 1348. [Google Scholar] [CrossRef] [Scilit]
  52. Goranovska, S. Biological efficacy of herbicide systems tested over local maize hybrid KN 509 and influence over its productivity. Sci. Works 2018, 2, 18. [Google Scholar]
  53. Meseldžija, M.; Dudić, M. Terbuthylazine application with herbicides of different mode of action in maize crop. In Proceedings of the IX International Agricultural Symposium “Agrosym 2018”, East Sarajevo, Bosnia and Herzegovina, 4–7 October 2018; pp. 1019–1025. [Google Scholar]
  54. Schulte, M.; Weichert, H.; Bassermann, K. CALARIS® MAXX—Eine Neuformulierung zur Kontrolle von Unkräutern und Ungräsern unter sich ändernden Anforderungen im Maisanbau. Julius-Kühn-Arch 2022, 468, 258–263. [Google Scholar] [CrossRef]
  55. Hashim, Z.K.; De Silva, A.G.S.D.; Hassouni, A.A.; Vona, V.M.; Bede, L.; Stencinger, D.; Horváth, B.; Zsebő, S.; Kulmány, I.M. Effects of various herbicide types and doses, tillage systems, and nitrogen rates on CO2 emissions from agricultural land: A literature review2 emissions from agricultural land: A literature review. Agriculture 2024, 14, 1800. [Google Scholar] [CrossRef] [Scilit]
  56. Pinke, Z.; Decsi, B.; Demeter, G.; Kalicz, P.; Kern, Z.; Acs, T. Continental lowlands face rising crop vulnerability: Structural change in regional climate sensitivity of crop yields, Hungary (Central and Eastern Europe), 1921–2010. Reg. Environ. Change 2024, 24, 33. [Google Scholar] [CrossRef] [Scilit]
  57. Peel, M.C.; Finlayson, B.L.; McMahon, T.A. Updated world map of the Köppen–Geiger climate classification. Hydrol. Earth Syst. Sci. 2007, 11, 1633–1644. [Google Scholar] [CrossRef] [Scilit]
  58. Izsák, B.; Szentimrey, T.; Lakatos, M.; Pongrácz, R.; Szentes, O. Creation of a representative climatological database for Hungary from 1870 to 2020. Időjárás 2022, 126, 1–26. [Google Scholar] [CrossRef] [Scilit]
  59. Kulmány, I.M. Kukorica Termesztése Során Keletkező Üvegházhatású Gázok Nyomon Követése, Különös Tekintettel a Szén-dioxid-Kibocsátásra. Ph.D. Thesis, Széchenyi István University, Mosonmagyaróvár, Hungary, 2022. [Google Scholar] [CrossRef] [Scilit]
  60. Kulmány, I.M.; Bede-Fazekas, Á.; Beslin, A.; Giczi, Z.; Milics, G.; Kovács, B.; Kovács, M.; Ambrus, B.; Bede, L.; Vona, V. Calibration of an Arduino-based low-cost capacitive soil moisture sensor for smart agriculture. J. Hydrol. Hydromech. 2022, 70, 153–164. [Google Scholar] [CrossRef] [Scilit]
  61. Cohen, M.J.; Prenger, J.P.; DeBusk, W.F. Visible–near infrared reflectance spectroscopy for rapid, nondestructive assessment of wetland soil quality. J. Environ. Qual. 2005, 34, 1422–1434. [Google Scholar] [CrossRef] [Scilit]
  62. Viscarra Rossel, R.A.; Walvoort, D.J.J.; McBratney, A.B.; Janik, L.J.; Skjemstad, J.O. Visible, near infrared, mid infrared or combined diffuse reflectance spectroscopy for simultaneous assessment of various soil properties. Geoderma 2006, 131, 59–75. [Google Scholar] [CrossRef] [Scilit]
  63. Campbell, D.J.; O’Sullivan, M.F. The cone penetrometer in relation to trafficability, compaction and tillage. In Soil Analysis: Physical Methods; Smith, K.A., Mullins, C.E., Eds.; Marcel Dekker Inc.: New York, NY, USA, 1991. [Google Scholar]
  64. NEN 5140:1996 nl; Geotechnics—Determination of the Cone Resistance and the Sleeve Friction of Soil—Electric Penetration Test. NEN: Delft, The Netherlands, 1996; Volume 5140. Available online: https://www.nen.nl/en/nen-5140-1996-nl-19464 (accessed on 17 August 2023).
  65. Krähmer, H.; Andreasen, C.; Economou-Antonaka, G.; Holec, J.; Kalivas, D.; Kolářová, M.; Novák, R.; Panozzo, S.; Pinke, G.; Salonen, J.; et al. Weed surveys and weed mapping in Europe: State of the art and future tasks. Crop. Prot. 2020, 129, 105010. [Google Scholar] [CrossRef] [Scilit]
  66. Veloso, A.; Mermoz, S.; Bouvet, A.; Le Toan, T.; Planells, M.; Dejoux, J.F.; Ceschia, E. Understanding the temporal behavior of crops using Sentinel-1 and Sentinel-2-like data for agricultural applications. Remote Sens. Environ. 2017, 199, 415–426. [Google Scholar] [CrossRef] [Scilit]
  67. Zsebő, S.; Bede, L.; Kukorelli, G.; Kulmány, I.M.; Milics, G.; Stencinger, D.; Teschner, G.; Varga, Z.; Vona, V.; Kovács, A.J. Yield prediction using NDVI values from GreenSeeker and MicaSense cameras at different stages of winter wheat phenology. Drones 2024, 8, 88. [Google Scholar] [CrossRef] [Scilit]
  68. Morris, E.K.; Caruso, T.; Buscot, F.; Fischer, M.; Hancock, C.; Maier, T.S.; Meiners, T.; Müller, C.; Obermaier, E.; Prati, D.; et al. Choosing and using diversity indices: Insights for ecological applications from the German biodiversity exploratories. Ecol. Evol. 2014, 4, 3514–3524. [Google Scholar] [CrossRef] [Scilit]
  69. Guajardo, S.A. Measuring diversity in police agencies. J. Ethn. Crim. Justice 2015, 13, 1–15. [Google Scholar] [CrossRef] [Scilit]
  70. Fisher, R.A. The logic of inductive inference. J. R. Stat. Soc. 1935, 98, 39–82. [Google Scholar] [CrossRef] [Scilit]
  71. Williams, L.J.; Abdi, H. Fisher’s least significant difference (LSD) test. In Encyclopedia of Research Design; Salkind, N.J., Ed.; Sage Publications: Thousand Oaks, CA, USA, 2010; pp. 840–853. Available online: https://www.researchgate.net/publication/242181775 (accessed on 10 October 2024).
  72. Al-Rawi, K.M.; Aziz, A.; Ali, M.K. Design and Analysis of Agricultural Experiments; Ministère de l’Enseignement Supérieur et de la Recherche Scientifique, Gouvernement de la République Algérienne, University of Baghdad: Baghdad, Iraq, 2000; 360p. [Google Scholar]
  73. Yang, X.M.; Drury, C.F.; Reeb, M.R. No-tillage had warmer over-winter soil temperatures than conventional tillage in a Brookston clay loam soils in southwestern Ontario. Soil Sci. Soc. Am. J. 2018, 82, 307–314. [Google Scholar] [CrossRef] [Scilit]
  74. Johnson, M.D.; Lowery, B. Effect of three conservation tillage practices on soil temperature and thermal properties. Soil Sci. Soc. Am. J. 1985, 49, 1547–1552. [Google Scholar] [CrossRef] [Scilit]
  75. Muñoz-Romero, V.; López-Bellido, L.; López-Bellido, R.J. Effect of tillage system on soil temperature in a rainfed Mediterranean vertisol. Int. Agrophys. 2015, 29, 467–473. [Google Scholar] [CrossRef] [Scilit]
  76. Dao, T.H. Tillage system and crop residue effects on surface compaction of a Paleustoll. Agron. J. 1996, 88, 141–148. [Google Scholar] [CrossRef] [Scilit]
  77. Sarkar, S.; Singh, S.R. Interactive effect of tillage depth and mulch on soil temperature, productivity and water use pattern of rainfed barley (Hordium vulgare L.). Soil Tillage Res. 2007, 92, 79–86. [Google Scholar] [CrossRef] [Scilit]
  78. Shen, Y.; McLaughlin, N.B.; Zhang, X.; Xu, M.; Liang, A. Effect of tillage and crop residue on soil temperature following planting for a Black soil in Northeast China. Sci. Rep. 2018, 8, 4500. [Google Scholar] [CrossRef] [Scilit]
  79. Yeom, J.; Jung, J.; Chang, A.; Ashapure, A.; Maeda, M.; Maeda, A.; Landivar, J. Comparison of vegetation indices derived from UAV data for differentiation of tillage effects in agriculture. Remote Sens. 2019, 11, 1548. [Google Scholar] [CrossRef] [Scilit]
  80. Singh, V.K.; Yadvinder-Singh, B.S.; Dwivedi, B.S.; Singh, S.K.; Majumdar, K.; Jat, M.L.; Mishra, R.P.; Rani, M. Soil physical properties, yield trends and economics after five years of conservation agriculture based rice–maize system in north-western India. Soil Tillage Res. 2016, 155, 133–148. [Google Scholar] [CrossRef] [Scilit]
  81. Özgöz, E.; Akbş, F.; Çetin, M.; Erşahin, S.; Günal, H. Spatial variability of soil physical properties as affected by different tillage systems. N. Z. J. Crop Hortic. Sci. 2007, 35, 1–13. [Google Scholar] [CrossRef] [Scilit]
  82. Celik, I. Effects of tillage methods on penetration resistance, bulk density and saturated hydraulic conductivity in clayey soil conditions. J. Agric. Sci. 2011, 17, 143–156. [Google Scholar] [CrossRef] [Scilit]
  83. Kuhwald, M.; Blaschek, M.; Minkler, R.; Nazemtseva, Y.; Schwanebeck, M.; Winter, J.; Duttmann, R. Spatial analysis of long-term effects of different tillage practices based on penetration resistance. Soil Use Manag. 2016, 32, 240–249. [Google Scholar] [CrossRef] [Scilit]
  84. Li, Y.; Li, Z.; Cui, S.; Zhang, Q. Trade-off between soil pH, bulk density and other soil physical properties under global no-tillage agriculture. Geoderma 2020, 361, 114099. [Google Scholar] [CrossRef] [Scilit]
  85. Steponavičienė, V.; Žiūraitis, G.; Rudinskienė, A.; Jackevičienė, K.; Bogužas, V. Long-term effects of different tillage systems and their impact on soil properties and crop yields. Agronomy 2024, 14, 870. [Google Scholar] [CrossRef] [Scilit]
  86. Salem, H.M.; Valero, C.; Muñoz, M.Á.; Rodríguez, M.G.; Silva, L.L. Short-term effects of four tillage practices on soil physical properties, soil water potential, and maize yield. Geoderma 2015, 237–238, 60–70. [Google Scholar] [CrossRef] [Scilit]
  87. Farahani, E.; Emami, H.; Forouhar, M. Effects of tillage systems on soil organic carbon and some soil physical properties. Land Degrad. Dev. 2022, 33, 1307–1320. [Google Scholar] [CrossRef] [Scilit]
  88. Smith, P.; Martino, D.; Cai, Z.; Gwary, D.; Janzen, H.; Kumar, P.; McCarl, B.; Ogle, S.; O’Mara, F.; Rice, C.; et al. Policy and technological constraints to implementation of greenhouse gas mitigation options in agriculture. Agric. Ecosyst. Environ. 2007, 118, 6–28. [Google Scholar] [CrossRef] [Scilit]
  89. Pezzuolo, A.; Cillis, D.; Marinello, F.; Sartori, L. Relationship between satellite-derived NDVI and soil electrical resistivity: A case study. In Proceedings of the 6th International Conference on Trends in Agricultural Engineering, Prague, Czech Republic, 7–9 September 2016. [Google Scholar]
  90. Huang, Y.; Ren, W.; Wang, L.; Hui, D.; Grove, J.H.; Yang, X.; Tao, B.; Goff, B. Greenhouse gas emissions and crop yield in no-tillage systems: A meta-analysis. Agric. Ecosyst. Environ. 2018, 268, 144–153. [Google Scholar] [CrossRef] [Scilit]
  91. Angon, P.B.; Suchi, S.A.; Roy, A.R. Challenges, developments, and perspectives of conservation agriculture (CA) in modern agricultural systems. Int. J. Agron. 2023, 2023, 1939379. [Google Scholar] [CrossRef] [Scilit]
  92. Verhulst, N.; Govaerts, B.; Sayre, K.D.; Deckers, J.; François, I.M.; Dendooven, L. Using NDVI and soil quality analysis to assess influence of agronomic management on within-plot spatial variability and factors limiting production. Plant Soil 2009, 317, 41–59. [Google Scholar] [CrossRef] [Scilit]
  93. Calcagno, F.; Romano, E.; Furnitto, N.; Jamali, A.; Failla, S. Remote sensing monitoring of durum wheat under no tillage practices by means of spectral indices interpretation: A preliminary study. Sustainability 2022, 14, 15012. [Google Scholar] [CrossRef] [Scilit]
  94. Hatfield, J.L.; Prueger, J.H. Value of using different vegetative indices to quantify agricultural crop characteristics at different growth stages under varying management practices. Remote Sens. 2010, 2, 562–578. [Google Scholar] [CrossRef] [Scilit]
  95. Blackshaw, R.E.; O’Donovan, J.T.; Harker, K.N.; Clayton, G.W.; Stougaard, R.N. Reduced herbicide doses in field crops: A review. Weed Biol. Manag. 2006, 6, 10–17. [Google Scholar] [CrossRef] [Scilit]
  96. Armengot, L.; Blanco-Moreno, J.M.; Bàrberi, P.; Bocci, G.; Carlesi, S.; Aendekerk, R.; Berner, A.; Celette, F.; Grosse, M.; Huiting, H.; et al. Tillage as a driver of change in weed communities: A functional perspective. Agric. Ecosyst. Environ. 2016, 222, 276–285. [Google Scholar] [CrossRef] [Scilit]
  97. Pardo, G.; Cirujeda, A.; Perea, F.; Verdú, A.M.C.; Mas, M.T.; Urbano, J.M. Effects of reduced and conventional tillage on weed communities: Results of a long-term experiment in southwestern Spain. Planta Daninha 2019, 37, e019201336. [Google Scholar] [CrossRef] [Scilit]
  98. Pätzold, S.; Hbirkou, C.; Dicke, D.; Gerhards, R.; Welp, G. Linking weed patterns with soil properties: A long-term case study. Precision Agric. 2020, 21, 569–588. [Google Scholar] [CrossRef] [Scilit]
  99. Ziska, L.H. The role of climate change and increasing atmospheric carbon dioxide on weed management: Herbicide efficacy. Agric. Ecosyst. Environ. 2016, 231, 304–309. [Google Scholar] [CrossRef] [Scilit]
  100. Sultana, S.R.; Ali, A.; Ahmad, A.; Mubeen, M.; Zia-Ul-Haq, M.; Ahmad, S.; Ercisli, S.; Jaafar, H.Z.E. Normalized Difference Vegetation Index as a tool for wheat yield estimation: A case study from Faisalabad, Pakistan. Sci. World J. 2014, 2014, 725326. [Google Scholar] [CrossRef] [Scilit]
  101. Hnizil, O.; Baidani, A.; Khlila, I.; Nsarellah, N.; Laamari, A.; Amamou, A. Integrating NDVI, SPAD, and canopy temperature for strategic nitrogen and seeding rate management to enhance yield, quality, and sustainability in wheat cultivation. Plants 2024, 13, 1574. [Google Scholar] [CrossRef] [Scilit] [PubMed]
  102. Chowdhury, M.; Khura, T.K.; Upadhyay, P.K.; Parray, R.A.; Kushwaha, H.L.; Singh, C.; Lama, A.; Mani, I. Assessing vegetation indices and productivity across nitrogen gradients: A comparative study under transplanted and direct-seeded rice. Front. Sustain. Food Syst. 2024, 8, 1351414. [Google Scholar] [CrossRef] [Scilit]
  103. Franzluebbers, A.J.; Hons, F.M.; Zuberer, D.A. Tillage and crop effects on seasonal dynamics of soil CO2 evolution, water content, temperature, and bulk density. Appl. Soil Ecol. 1995, 2, 95–109. [Google Scholar] [CrossRef] [Scilit]
  104. Bàrberi, P.; Lo Cascio, B. Long-term tillage and crop rotation effects on weed seedbank size and composition. Weed Res. 2001, 41, 325–340. [Google Scholar] [CrossRef] [Scilit]
  105. Locke, M.A.; Reddy, K.N.; Zablotowicz, R.M. Weed management in conservation crop production systems. Weed Biol. Manag. 2002, 2, 123–132. [Google Scholar] [CrossRef] [Scilit]
  106. Al-Kaisi, M.M.; Yin, X.; Licht, M.A. Soil carbon and nitrogen changes as affected by tillage system and crop biomass in a corn–soybean rotation. Appl. Soil Ecol. 2005, 30, 174–191. [Google Scholar] [CrossRef] [Scilit]
  107. Légère, A.; Stevenson, F.C.; Benoit, D.L. Diversity and assembly of weed communities: Contrasting responses across cropping systems. Weed Res. 2005, 45, 303–315. [Google Scholar] [CrossRef] [Scilit]
  108. Murphy, S.D.; Clements, D.R.; Belaoussoff, S.; Kevan, P.G.; Swanton, C.J. Promotion of weed species diversity and reduction of weed seedbanks with conservation tillage and crop rotation. Weed Sci. 2006, 54, 69–77. [Google Scholar] [CrossRef] [Scilit]
  109. Plaza, E.H.; Kozak, M.; Navarrete, L.; González-Andújar, J.L. Tillage system did not affect weed diversity in a 23-year experiment in Mediterranean dryland. Agric. Ecosyst. Environ. 2011, 140, 102–105. [Google Scholar] [CrossRef] [Scilit]
  110. Pinke, G.; Giczi, Z.; Vona, V.; Dunai, É.; Vámos, O.; Kulmány, I.; Bede-Fazekas, Á. Weed composition in Hungarian phacelia (Phacelia tanacetifolia Benth.) seed production: Could tine harrow take over chemical management? Agronomy 2022, 12, 891. [Google Scholar] [CrossRef] [Scilit]
  111. Cathcart, R.J.; Chandler, K.; Swanton, C.J. Fertilizer nitrogen rate and the response of weeds to herbicides. Weed Sci. 2004, 52, 291–296. [Google Scholar] [CrossRef] [Scilit]
  112. Buhler, D.D.; Stoltenberg, D.E.; Becker, R.L.; Gunsolus, J.L. Perennial weed populations after 14 years of variable tillage and cropping practices. Weed Sci. 1994, 42, 205–209. [Google Scholar] [CrossRef] [Scilit]
  113. Derksen, D.A.; Thomas, A.G.; Lafond, G.P.; Loeppky, H.A.; Swanton, C.J. Impact of post-emergence herbicides on weed community diversity within conservation-tillage systems. Weed Res. 1995, 35, 311–320. [Google Scholar] [CrossRef] [Scilit]
  114. Anderson, R.L.; Tanaka, D.L.; Black, A.L.; Schweizer, E.E. Weed community and species response to crop rotation, tillage, and nitrogen fertility. Weed Technol. 1998, 12, 531–536. [Google Scholar] [CrossRef] [Scilit]
  115. Swanton, C.J.; Shrestha, A.; Roy, R.C.; Ball-Coelho, B.R.; Knezevic, S.Z. Effect of tillage systems, N, and cover crop on the composition of weed flora. Weed Sci. 1999, 47, 454–461. [Google Scholar] [CrossRef] [Scilit]
  116. Shchukin, S.V.; Gornich, E.A.; Trufanov, A.M.; Voronin, A.N.; Vaganova, N.V. Effect of minimum tillage, fertilizers and herbicides on weed abundance and crop yields. IOP Conf. Ser. Earth Environ. Sci. 2022, 1045, 012161. [Google Scholar] [CrossRef] [Scilit]
  117. Kuzyakov, Y. Priming effects: Interactions between living and dead organic matter. Soil Biol. Biochem. 2010, 42, 1363–1371. [Google Scholar] [CrossRef] [Scilit]
  118. Raich, J.W.; Tufekciogul, A. Vegetation and soil respiration: Correlations and controls. Biogeochemistry 2000, 48, 71–90. [Google Scholar] [CrossRef] [Scilit]
  119. Hobbs, P.R.; Sayre, K.; Gupta, R. The role of conservation agriculture in sustainable agriculture. Philos. Trans. R. Soc. B Biol. Sci. 2008, 363, 543–555. [Google Scholar] [CrossRef] [Scilit] [PubMed]
  120. Lal, R. Soil carbon management and climate change. Carbon Manag. 2013, 4, 439–462. [Google Scholar] [CrossRef] [Scilit]
  121. Brochado, M.G.S.; Silva, L.B.X.D.; Lima, A.C.; Guidi, Y.M.; Mendes, K.F. Herbicides versus nitrogen cycle: Assessing the trade-offs for soil integrity and crop yield—An in-depth systematic review. Nitrogen 2023, 4, 296–310. [Google Scholar] [CrossRef] [Scilit]
  122. Zsembeli, J.; Tuba, G.; Juhász, C.; Nagy, I. CO2-measurements in a soil tillage experiment. Cereal Res. Commun. 2005, 33, 137–140. [Google Scholar] [CrossRef] [Scilit]
  123. Zsembeli, J.; Kovács, G. Dynamics of CO2 emission of the soil in conventional and reduced tillage systems. Cereal Res. Commun. 2007, 35, 1337–1340. [Google Scholar] [CrossRef] [Scilit]
  124. Kulmány, I.M.; Giczi, Z.; Beslin, A.; Bede, L.; Kalocsai, R.; Vona, V. Impact of environmental and soil factors in the prediction of soil carbon dioxide emissions under different tillage systems. Ecocycles 2022, 8, 27–39. [Google Scholar] [CrossRef] [Scilit]
  125. Zsembeli, J.; Kovács, G.; Czellér, K.; Tuba, G. Long-term effect of soil management on the carbon dioxide emission of the soil. Acta Agrar. Debr. 2018, 150, 515–527. [Google Scholar] [CrossRef] [Scilit] [PubMed]
  126. Juhász, C.; Huzsvai, L.; Kovács, E.; Kovács, G.; Tuba, G.; Sinka, L.; Zsembeli, J. Carbon dioxide efflux of bare soil as a function of soil temperature and moisture content under weather conditions of warm, temperate, dry climate zone. Agronomy 2022, 12, 3050. [Google Scholar] [CrossRef] [Scilit]
  127. de Araújo Santos, G.A.; Moitinho, M.R.; de Oliveira Silva, B.; Xavier, C.V.; Teixeira, D.B.; Corá, J.E.; Júnior, N.S. Effects of long-term no-tillage systems with different succession cropping strategies on the variation of soil CO2 emission. Sci. Total Environ. 2019, 686, 413–424. [Google Scholar] [CrossRef] [Scilit]
  128. Mühlbachová, G.; Růžek, P.; Kusá, H.; Vavera, R. CO2 emissions from soils under different tillage practices and weather conditions. Agronomy 2023, 13, 3084. [Google Scholar] [CrossRef] [Scilit]
  129. Venterea, R.T.; Bijesh, M.; Dolan, M.S. Fertilizer source and tillage effects on yield-scaled nitrous oxide emissions in a corn cropping system. J. Environ. Qual. 2011, 40, 1521–1531. [Google Scholar] [CrossRef] [Scilit]
  130. Omonode, R.A.; Vyn, T.J.; Smith, D.R.; Hegymegi, P.; Gál, A. Soil carbon dioxide and methane fluxes from long-term tillage systems in continuous corn and corn–soybean rotations. Soil Tillage Res. 2007, 95, 182–195. [Google Scholar] [CrossRef] [Scilit]
  131. Barcza, Z.; Haszpra, L.; Somogyi, Z.; Hidy, D.; Lovas, K.; Churkina, G.; Horváth, L. Estimation of the biospheric carbon dioxide balance of Hungary using the BIOME-BGC model. Időjárás 2009, 113, 203–219. [Google Scholar]
  132. Gagnon, B.; Ziadi, N.; Rochette, P.; Chantigny, M.H.; Angers, D.A.; Bertrand, N.; Smith, W.N. Soil-surface carbon dioxide emission following nitrogen fertilization in corn. Can. J. Soil Sci. 2016, 96, 219–232. [Google Scholar] [CrossRef] [Scilit]
  133. Jezierska-Tys, S.; Joniec, J.; Bednarz, J.; Kwiatkowska, E. Microbiological nitrogen transformations in soil treated with pesticides and their impact on soil greenhouse gas emissions. Agriculture 2021, 11, 787. [Google Scholar] [CrossRef] [Scilit]
  134. Jiang, J.; Chen, L.; Sun, Q.; Sang, M.; Huang, Y. Application of herbicides is likely to reduce greenhouse gas (N2O and CH4) emissions from rice–wheat cropping systems. Atmos. Environ. 2015, 107, 62–69. [Google Scholar] [CrossRef] [Scilit]
  135. Wang, F.; Chen, Y.; Wu, Z.; Jiang, F.; Weng, B.; You, Z. Effects of herbicides on urea nitrogen transformation and greenhouse gas emission from tea garden soil. J. Agro Environ. Sci. 2017, 36, 1649–1657. Available online: http://www.aes.org.cn/nyhjkxxben/ch/reader/view_abstract.aspx?file_no=20170826&flag=1 (accessed on 1 July 2024).
  136. Medo, J.; Maková, J.; Medová, J.; Lipková, N.; Cinkocki, R.; Omelka, R.; Javoreková, S. Changes in soil microbial community and activity caused by application of dimethachlor and linuron. Sci. Rep. 2021, 11, 12786. [Google Scholar] [CrossRef] [Scilit]
Figure 1. Overview of the experimental site. (A) Geographical map of the study area and experimental design; (B) Climate data; (C) Conventional tillage (CT); (D) Minimum tillage (MT); (E) Weed data collection; and (F) CO2 emission sensor and closed-chamber system.
Soilsystems 10 00026 g001
Figure 2. Effects of CT and MT on soil temperature. Each box represents the mean, and the error bars indicate standard deviation (SD). Different letters indicate significant differences between tillage systems (p < 0.05).
Soilsystems 10 00026 g002
Figure 3. Effects of CT and MT on soil moisture content. Each box represents the mean, and the error bars indicate SD. Different letters denote significant differences between the tillage systems (p < 0.05).
Soilsystems 10 00026 g003
Figure 4. Effects of CT and MT on soil penetration resistance (PR). Each box represents the mean, and the error bars indicate SD. Different letters signify significant differences between the tillage systems (p < 0.05).
Soilsystems 10 00026 g004
Figure 5. Effects of CT and MT on NDVI under nitrogen fertilisation rates of N160 (74 kg N ha−1) (A) and N320 (147 kg N ha−1) (B). Each box represents the mean NDVI, and the error bars indicate SD. Different letters indicate significant differences between tillage systems within the same nitrogen level (p < 0.05).
Soilsystems 10 00026 g005
Figure 6. Effects of herbicide application rates (H0, H25, H50, H75, H100) on NDVI under CT with nitrogen inputs of N160 and N320 (74 and 147 kg N ha−1). Each bar represents the mean NDVI, and the error bars indicate SD. Different letters above the bars (74 kg N ha−1 group) denote significant differences among treatments based on one-way ANOVA and LSD0.05 test. No significant differences were observed at 147 kg N ha−1.
Soilsystems 10 00026 g006
Figure 7. Effect of herbicide application rates (H0–H100) on NDVI under MT with nitrogen inputs of N160 and N320 (74 and 147 kg N ha−1). Each bar represents the mean NDVI, and the error bars indicate the SD. Different letters denote significant differences among treatments based on one-way ANOVA and LSD0.05 test (p < 0.05).
Soilsystems 10 00026 g007
Figure 8. Effect of nitrogen level N160 and N320 (74 and 147 kg N ha−1, respectively) and herbicide dose (0–100%) under CT on weed dry biomass (bars, left axis) and weed diversity (Simpson index, line, right axis).
Soilsystems 10 00026 g008
Figure 9. Effect of nitrogen level N160 and N320 (74 and 147 kg N ha−1, respectively) and herbicide dose (0–100%) under MT on weed dry biomass (bars, left axis) and weed diversity (Simpson index, line, right axis).
Soilsystems 10 00026 g009
Figure 10. Soil CO2 emissions under CT and MT at the same nitrogen fertilisation level and herbicide dose. Each column represents the mean, and the error bars indicate SD. Different letters indicate significant differences between tillage systems under identical nitrogen and herbicide treatments (p < 0.05).
Soilsystems 10 00026 g010
Figure 11. Effect of CT and MT on soil CO2 emissions at nitrogen levels of N160 (74 kg N ha−1) (A) and N320 (147 kg N ha−1) (B). Each box represents the mean, and the error bars indicate SD. Different letters denote significant differences between tillage systems within each nitrogen level (p < 0.05).
Soilsystems 10 00026 g011
Figure 12. Effect of herbicide application rates (H0–H100) on soil CO2 emissions (µmol m−2 s−1) under CT with nitrogen inputs of N160 and N320 (74 and 147 kg N ha−1). Each bar represents the mean, and the error bars indicate SD. Different letters indicate significant differences among treatments within each nitrogen level based on one-way ANOVA and LSD0.05 test (LSD = 0.30 for 74 kg N ha−1; LSD = 0.18 for 147 kg N ha−1; p < 0.05).
Soilsystems 10 00026 g012
Figure 13. Effect of herbicide application rates (H0–H100) on soil CO2 emissions (µmol m−2 s−1) under MT with nitrogen inputs of N160 and N320(74 and 147 kg N ha−1). Each bar represents the mean, and the error bars indicate SD. Different letters indicate significant differences among treatments within each nitrogen level based on one-way ANOVA and LSD0.05 test (LSD = 0.84 for 74 kg N ha−1; LSD = 0.83 for 147 kg N ha−1; p < 0.05).
Soilsystems 10 00026 g013
Figure 14. Influence of nitrogen application rates N160, N320 (74, 147 kg N ha−1) and herbicide doses (0–100%) on CO2 emissions under CT. Each bar represents the mean, and the error bars indicate SD. Different letters indicate significant differences among nitrogen × herbicide combinations (LSD0.05 = 0.22).
Soilsystems 10 00026 g014
Figure 15. Influence of nitrogen application rates N160, N320 (74, 147 kg N ha−1), and herbicide doses (0–100%) on CO2 emissions under MT. Each bar represents the mean, and the error bars indicate SD. Different letters indicate significant differences among nitrogen × herbicide combinations (LSD0.05 = 0.72).
Soilsystems 10 00026 g015
Table 1. Units and ranges of continuous variables and values of categorical variables within the experiment, separated by tillage system.
Variable (Unit)Conventional Tillage (CT)Minimum Tillage (MT)
ENVIRONMENTAL
Mean growing season temperature (°C)16.5
Mean annual precipitation (mm)376.4
Sandy (%)24
Silt (%)48
Clay (%)28
Soil textureClay loam
Soil classificationDanube alluvial soil
Soil pH (H2O)7.97.9
Organic matter (%)3.03.0
Total nitrogen (g kg−1)1.91.9
Phosphorus (M3) (mg kg−1)33.436.9
Potassium (exchangeable) (mmol kg−1)5.46.0
Calcium (exchangeable) (mmol kg−1)183.7185.6
Magnesium (exchangeable) (mmol kg−1)24.826.8
Potentially Mineralizable Nitrogen(mgN/kg)69.672.3
Cation exchange capacity (mmol kg−1)174.9179.9
Total aluminium (g/kg)38.538.1
Total iron (g/kg)21.220.6
Soil penetration resistance (MPa, 0–10 cm)0.2 ± 0.1 (CV = 43.4%)0.6 ± 0.3 (CV = 53.96%)
NON-CHEMICAL MANAGEMENT
Tillage typeMoldboard ploughing (MTZ 820 + KÜHNE plough)Disc tillage (MTZ 820 + RXT3 disc harrow)
Soil cultivation (5 April 2022) & Seedbed preparation (7 April 2022)New Holland TM165 (New Holland Agriculture, Basildon, UK)
+ Agrikon 6.6 m combinator (AGRIKON KAM Kft., Kiskunmajsa, Hungary)
Sowing date (19 April 2022)New Holland 110-90 + Kuhn MAXIMA
Seeding rate (seeds ha−1)72,000
Intra-row spacing (cm)25
Inter-row spacing (cm)75
Nitrogen rates (kg N ha−1)0, 74, 147, and 221
Fertiliser typeGenezis Karbamid (46% N)
IrrigationNone
Harvest date (12 October)New Holland CR890
CHEMICAL WEED CONTROL
Herbicide programmeCalaris Pro (2.3 L/ha−1), Eucarol Plus (0.5 L/ha−1), Milagro 240 (0.02 L/ha−1)
Herbicide dose levels0%, 25%, 50%, 75%, 100% of full rate (H0–H100)
Application methodusing a calibrated field boom sprayer (Zakład Mechaniki Maszyn i Urządzeń Rolniczych Sławomir Biardzki, Zbuczyn, Poland), 200 L ha−1
Application timing11 May 2022; maize at 6-leaf stage
Weed growth stage at applicationBroadleaf weeds: 2–4 leaves; grass weeds: 3–5 leaves
Note: The soil organic matter values presented in Table 1 represent baseline measurements at the time of soil sampling and do not reflect long-term changes in soil organic carbon associated with tillage practices.
Table 3. ANOVA results for the effects of nitrogen levels.
Source of Variationd.f.s.s.m.s.FF pr.
Nitrogen (N) 10.000780.000782.450.135
Herbicide (H) 40.018440.0046114.51<0.001
N × H 40.000850.000210.670.621
Residual 180.005720.00032
Total 290.02883
Nitrogen (N), herbicide dose (H), and their interaction (N × H) on NDVI under CT. Degrees of freedom (d.f.), sum of squares (s.s.), mean square (m.s.), F-value, and significance (p-value) are shown. Significant values (p < 0.05) are in bold.
Table 4. ANOVA results for the effects of nitrogen level and herbicide dose on NDVI under minimum tillage (MT).
Source of Variationd.f.s.s.m.s.FF pr.
Nitrogen (N)10.002270.0022714.690.001
Herbicide (H)40.044150.0110471.54<0.001
N × H40.000860.000211.390.277
Residual180.002780.00015
Total290.05039
Nitrogen (N), herbicide dose (H), and their interaction (N × H) on NDVI under MT. d.f., s.s., m.s., F-value, and p-value are presented. Significant values (p < 0.05) are in bold.
Table 5. ANOVA results for the effects of nitrogen fertilisation level and herbicide dose on soil CO2 emissions under conventional tillage (CT).
Source of Variationd.f.s.s.m.s.FF pr.
Nitrogen (N)1932.86082932.8608230,160.71<0.001
Herbicide (H)44451.002251112.7505635,976.80<0.001
N × H41884.00305471.0007615,228.12<0.001
Residual361.113470.03093
Total497269.29392
Nitrogen (N), herbicide dose (H), and their interaction (N × H) on soil CO2 emissions under CT. d.f., s.s., m.s., variance ratio (F), and significance (F pr.) are presented. Significant values (p < 0.05) are in bold.
Table 6. ANOVA results for the effects of nitrogen level and herbicide dose on soil CO2 emissions under minimum tillage (MT).
Source of Variationd.f.s.s.m.s.FF pr.
Nitrogen (N)1538.3119538.31191723.31<0.001
Herbicide (H)43692.7637923.19092955.42<0.001
N × H42967.3448741.83622374.85<0.001
Residual3611.24540.3124
Total497214.6913
Nitrogen (N), herbicide dose (H), and their interaction (N × H) on soil CO2 emissions under MT. d.f., s.s., m.s., F-value, and p-value are provided. Significant values (p < 0.05) are in bold.
Disclaimer/Publisher’s Note: The statements, opinions and data contained in all publications are solely those of the individual author(s) and contributor(s) and not of MDPI and/or the editor(s). MDPI and/or the editor(s) disclaim responsibility for any injury to people or property resulting from any ideas, methods, instructions or products referred to in the content.