Article

Enhancement of Inner Race Fault Features in Servo Motor Bearings via Servo Motor Encoder Signals

Faculty of Mechanical and Electrical Engineering, Kunming University of Science and Technology, Kunming 650500, China
*
Author to whom correspondence should be addressed.
Vibration 2025, 8(4), 59; https://doi.org/10.3390/vibration8040059
Submission received: 24 July 2025 / Revised: 24 September 2025 / Accepted: 29 September 2025 / Published: 1 October 2025
(This article belongs to the Special Issue Vibration in 2025)

Abstract

This study proposes a novel framework to enhance inner race fault features in servo motor bearings by acquiring rotary encoder-derived instantaneous angular speed (IAS) signals, which are obtained from a servo motor encoder without requiring additional external sensors. However, such signals are often obscured by strong periodic interferences from motor pole-pair and shaft rotation order components. To address this issue, three key improvements are introduced within the cyclic blind deconvolution (CYCBD) framework: (1) a comb-notch filtering strategy based on rotation domain synchronous averaging (RDA) to suppress dominant periodic interferences; (2) an adaptive fault order estimation method using the autocorrelation of the squared envelope spectrum (SES) for robust localization of the true fault modulation order; and (3) an improved envelope harmonic product (IEHP), based on the geometric mean of harmonics, which optimizes the deconvolution filter length. These combined enhancements enable the proposed improved CYCBD (ICYCBD) method to accurately extract weak fault-induced cyclic impulses under complex interference conditions. Experimental validation on a test rig demonstrates the effectiveness of the approach in enhancing and extracting the fault-related features associated with the inner race defect.

1. Introduction

Electric motors are the core power source in modern industrial systems, extensively applied in machine tools, robotics, aerospace, and renewable energy. Their operational reliability is crucial for ensuring production efficiency and equipment safety. However, motor components are inevitably subject to friction, vibration, and thermal stresses, which often lead to performance deterioration or even catastrophic failures. Among these components, rolling bearings are particularly vulnerable; they commonly experience defects such as inner race cracks, rolling element spalling, and outer race degradation [1]. Such failures cause severe mechanical breakdowns and safety hazards. Therefore, early and reliable detection of bearing faults has long been a critical issue in condition monitoring.
Vibration-based methods have traditionally been the primary approach for bearing fault diagnosis due to their sensitivity to impulsive features [2]. However, these methods face practical challenges, including the need for additional vibration sensors, complexity in installation within confined spaces, and potential signal attenuation caused by mounting conditions [3]. Laser Doppler vibrometry (LDV) has emerged as a promising alternative, but its industrial adoption is still limited by stringent optical alignment requirements, and sensitivity to environmental conditions [4,5,6]. In recent research, Liu et al. proposed a residual signal analysis method using LDV. This approach effectively addresses interference issues and enables accurate fault feature extraction [7]. With its high resolution, precision, and broad frequency response range, LDV has become an invaluable tool for detecting subtle vibrations in complex systems, positioning it as a key technology in fault diagnosis [8]. At the same time, researchers have increasingly turned to the use of servo motor encoders within servo drive systems. These encoders provide IAS signals directly, avoiding the issues associated with resampling, and ensuring greater stability across varying operating conditions, including variable-speed conditions. Studies have shown that localized bearing defects induce periodic fluctuations in IAS signals [9]. Zhang et al. pointed out that, in contrast to vibration signals, built-in encoder signals intrinsically possess more comprehensive fault-related information [10]. Despite its advantages, IAS-based analysis still faces significant challenges. Weak fault features, particularly those caused by inner race defects, are often obscured by gear meshing, background noise, and motion coupling, further complicating the fault diagnosis process [10,11,12]. Overcoming these challenges requires advanced signal processing techniques capable of amplifying fault-related periodic impulses while suppressing irrelevant components. Blind deconvolution has emerged as a promising solution. Wiggins originally introduced minimum entropy deconvolution (MED) to enhance impulsive features in seismic signals [13]. McDonald proposed maximum correlated kurtosis deconvolution (MCKD), which incorporates correlation constraints to strengthen fault-related impulses [14]. Recently, blind deconvolution methods based on cyclostationarity have gained attention. Buzzoni proposed cyclic blind deconvolution (CYCBD) [15], which enhances periodic fault features by maximizing second-order cyclostationarity of the output signal. Although CYCBD has shown promise in machinery signal analysis, it still suffers from several limitations. When the cyclic frequency specified for CYCBD deviates substantially from the true value, the algorithm fails to converge toward the actual fault impulses, producing unreliable results [16]. Furthermore, inappropriate selection of filter length either weakens the fault features (if too short) or imposes excessive computational costs (if too long) [17]. Moreover, the presence of strong noise or pronounced periodic interference can significantly degrade deconvolution accuracy [18]. These limitations constrain the practical application of existing blind deconvolution methods in real-world bearing fault diagnostics.
To address the aforementioned challenges in enhancing IAS-based fault features, this paper proposes an ICYCBD framework tailored for inner race faults in servo motor bearings. The method integrates the inherent advantages of encoder-based IAS monitoring with three key enhancements: a comb-notch filtering strategy based on RDA to suppress dominant periodic interferences; adaptive fault order estimation method using the autocorrelation of the SES for accurate localization of the true fault modulation order; an IEHP, leveraging the geometric mean of harmonics, to optimize the deconvolution filter length. Together, these strategies enable ICYCBD to robustly extract weak fault cyclic impulses even under strong interference, gear meshing effects, and complex noise conditions. Experimental validation on a servo motor test rig demonstrates that the proposed method can effectively enhance and extract fault-related features associated with inner race defects, thereby providing a reliable basis for subsequent fault diagnosis and monitoring.

2. Theoretical Background

2.1. Measurement Principle of IAS

For fault detection using rotary encoder signals, the encoder’s square-wave output is acquired and converted into an IAS signal. As shown in Figure 1, the IAS is estimated under ideal conditions using a single-edge counting mode, in which only the rising edges of channel A are recorded. Consequently, the encoder produces M pulses per revolution, corresponding to an angular-domain sampling rate of M samples per revolution. The angular spacing between adjacent pulses, denoted as Δφ, represents the angular displacement associated with a single encoder pulse, and is given by [19]
Δ φ = 2 π M
Based on this, the IAS can be estimated by the forward difference method as given in [12]
ω k = Δ φ Δ T k
where ω[k] indicates the IAS at the k-th pulse, ΔT[k] denotes the time interval between consecutive rising edges of the kth and (k + 1)-th pulses. Importantly, the pulse intervals are measured using an FPGA-based high-frequency counter, which ensures accurate acquisition of the encoder output pulses and precise estimation of the IAS signal for subsequent analysis.

2.2. Brief on Cyclic Blind Deconvolution

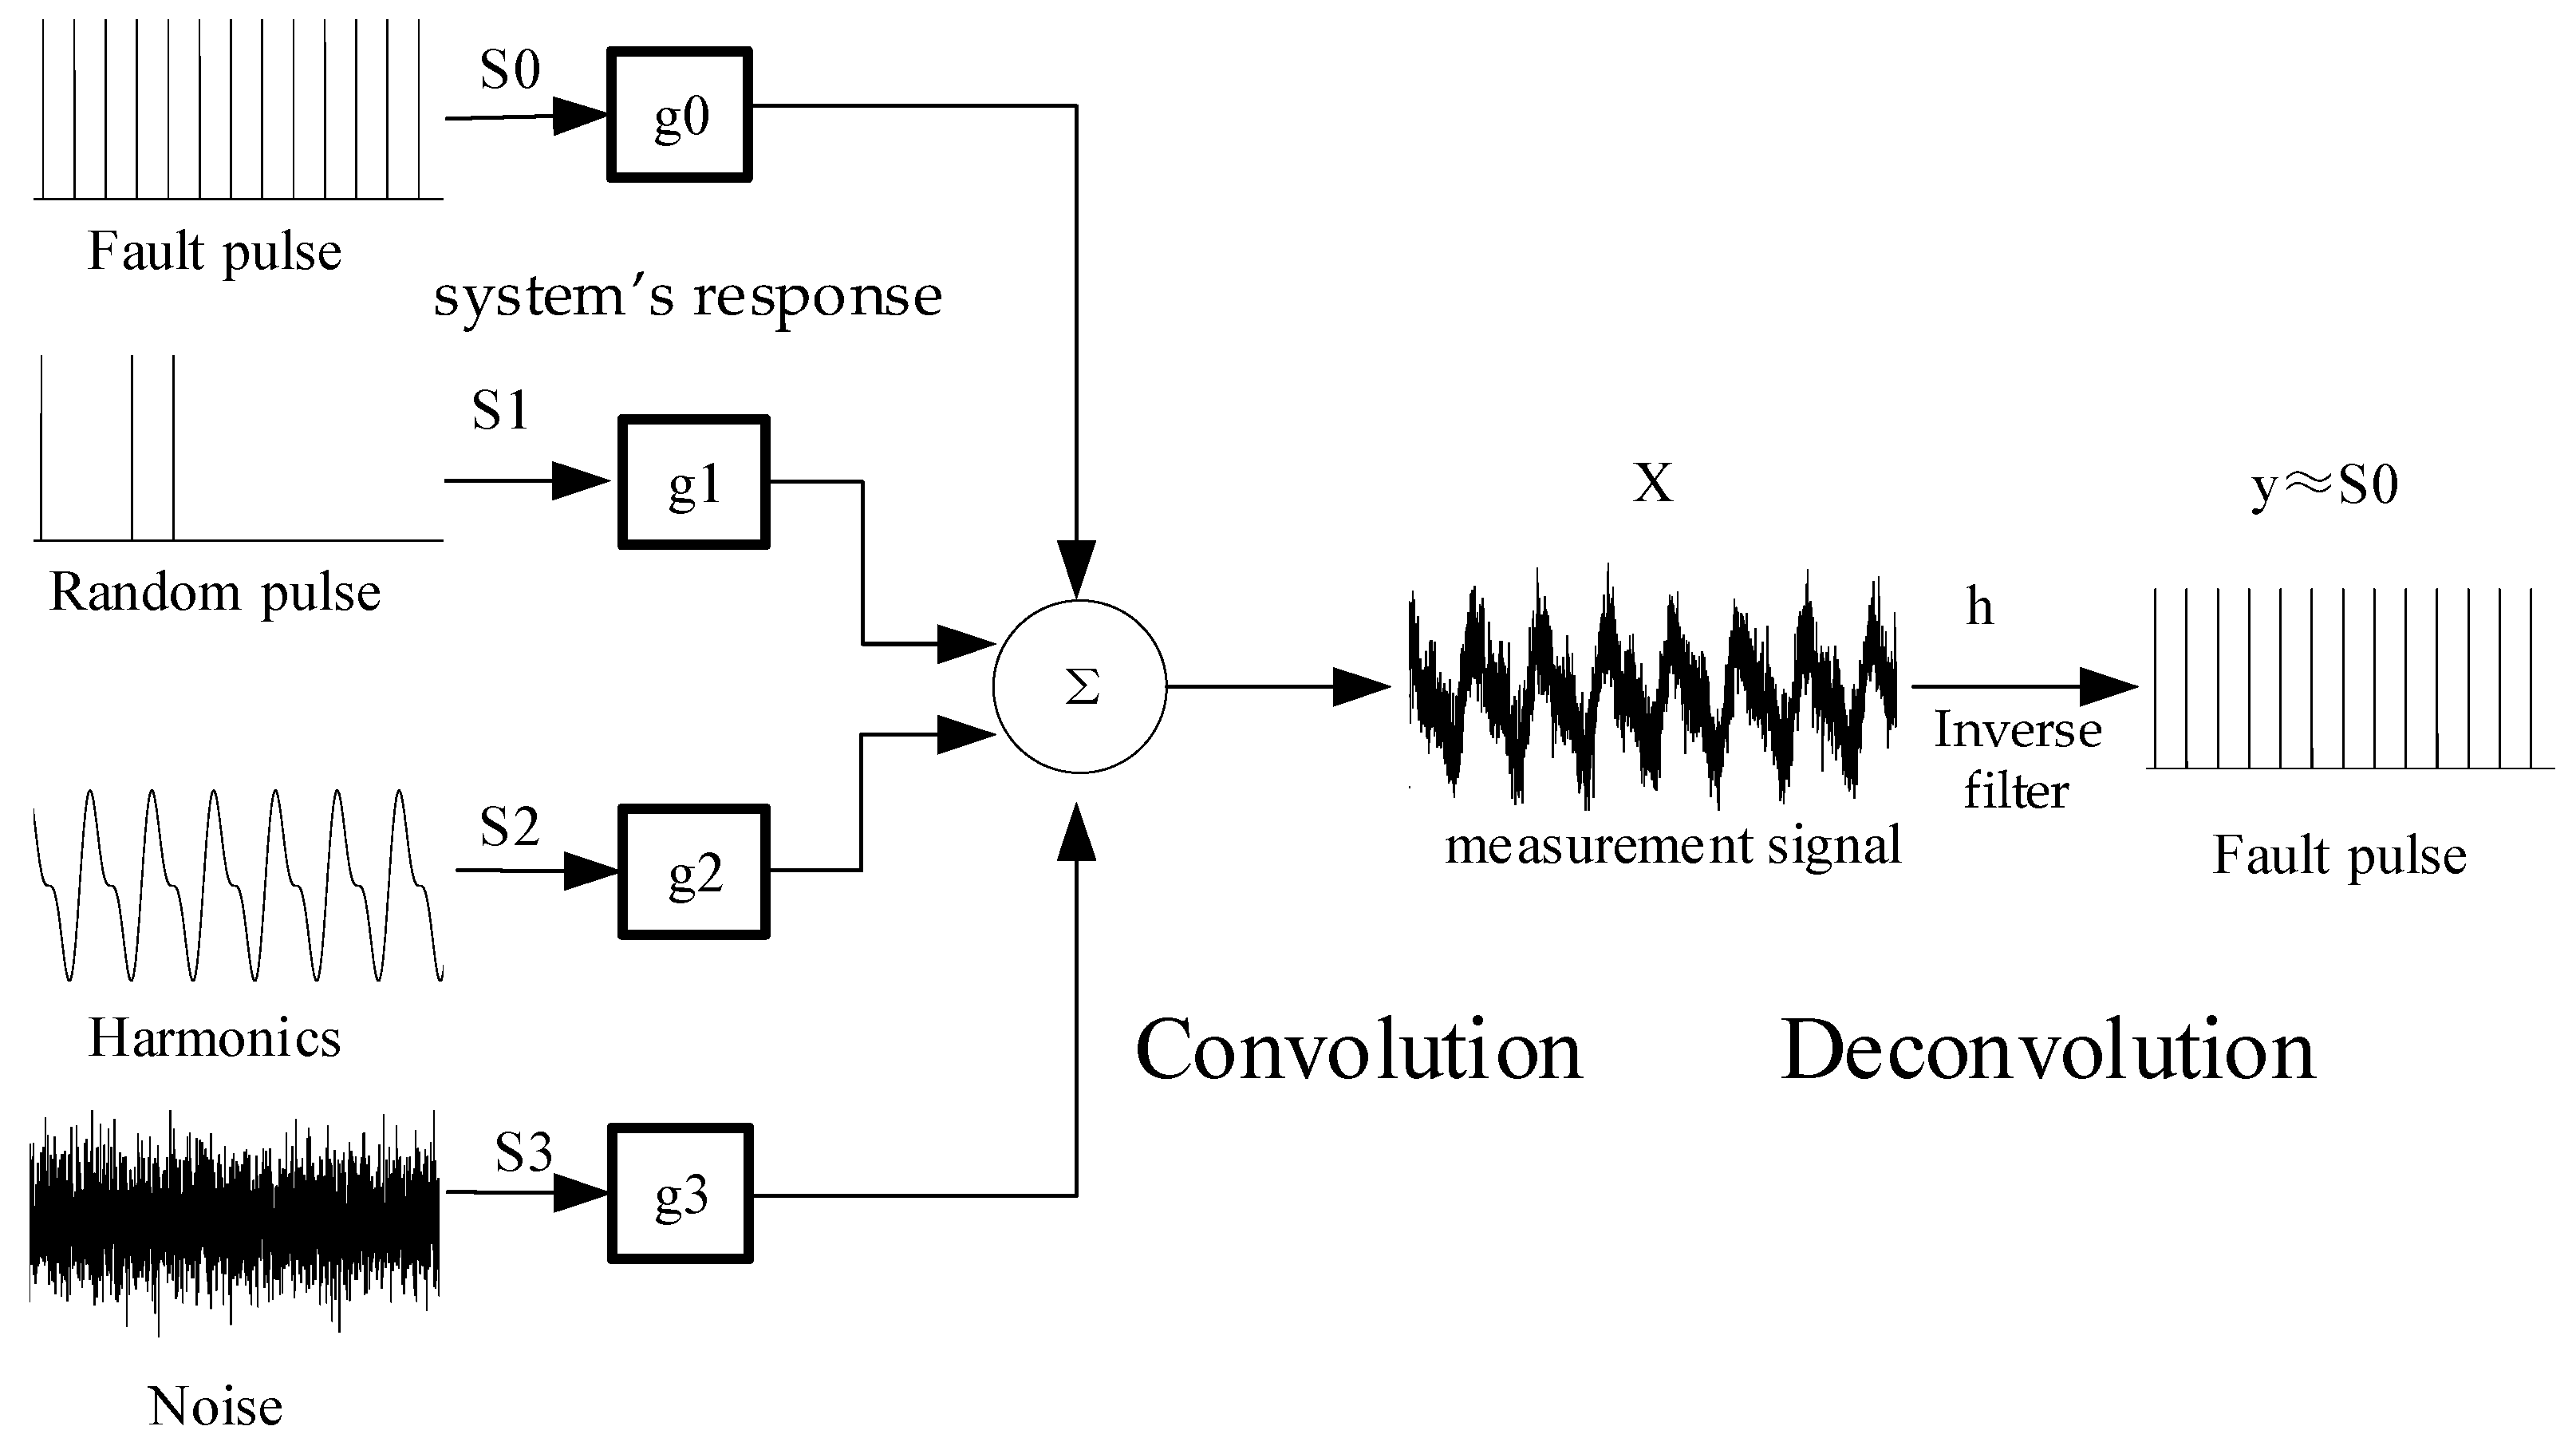
As it is well known that a deconvolution algorithm can be regarded as the design of an inverse filter h, with the goal of recovering the target signal S0 from the observed signal X, as shown in Figure 2, the gi (i = 0, 1, 2, 3) represents the system’s response components, which is expressed in [15] by
S = X h S 0
where S represents the estimated source signal; h is the inverse filter; ∗ denotes the convolution operator. Equation (3) can also be expressed in matrix by
S N 1 S L 1 = x [ N 1 ] x 0 x [ L 1 ] x [ L N 2 ]   h 0 h N 1
where L and N denote the lengths of the observed signal S and the inverse filter h, respectively.
The indicator of second-order cyclostationarity (ICS2) quantifies periodicity in second-order statistics. Based on this measure, Buzzoni [15] proposed cyclic blind deconvolution, a blind deconvolution method that maximizes ICS2 via the eigenvector algorithm.
ICS 2 = h H X H WXh h H X H Xh = h H R XWX h h H R XX h
where the superscript H denotes the Hermitian (conjugate transpose) of a matrix; Rxwx and Rₓₓ represent the weighted correlation matrix and the correlation matrix, respectively; and the weighting matrix W can be expressed as
W =   0   P S 2   0   L N + 1 l = N 1 L 1 S 2
P | S | 2 = 1 L N + 1 k e k e k H | S | 2 = E E H | S | 2 L N + 1
E = e 1     e k     e K e k = [ e j 2 π α N 1   e j 2 π α N   e j 2 π α L 1 ] T
where α denotes the cyclic frequency of the discrete signal. T represents the matrix transpose. The maximum ICS2 value can be obtained by solving a generalized eigenvalue problem, where the largest eigenvalue λ corresponds to the maximum value of ICS2.
R XWX h = R XX h λ

2.3. Improved CYCBD

To overcome the limitations of CYCBD—particularly its reliance on manually selected parameters and its poor performance under strong interference—this paper introduces an ICYCBD method, which incorporates three improvements. These advancements enhance the robustness and automation of feature extraction in IAS-based bearing monitoring.

2.3.1. Comb-Notch Filtering Based on RDA

To suppress strong periodic disturbances in the IAS signal—caused by motor pole-pair effects and their integer multiples of the rotational order, this paper proposes a comb-notch filtering technique based on the RDA, leveraging the strict equi-angular sampling of encoder signals to attenuate rotation-induced components and thereby enhance the extraction of weak fault-related features [20].
The RDA is applied to extract strictly periodic components from the raw IAS signal, with an angular-domain sampling rate of M samples per revolution. To enforce zero response at the specified rotation-synchronous components (e.g., 1×, 2×, 3×, …), the parameter N is defined as N = M/1 = 2500. For example, if the goal is to suppress higher-order components (e.g., 4×, 8×, 12×, …), then N is chosen as N = M/4 = 625. The signal is divided into R segments, each of length N, and the averaged IAS at the angular position k is computed across all revolutions, as expressed by
ω r e f k = 1 R r = 0 R 1 ω k + r N
where ωref[k] denotes the reference IAS signal at angular sample k; ω[k] denotes the original IAS signal at angular sample k; R is the number of complete segments; N is the segment length; This generates a reference signal of length N. To remove these periodic components from the original signal, the RDA signal is cyclically extended to match the full signal length by means of a modulo operation. The residual signal can be obtained by
ω r e s k = ω k ω r e f k   mod   N
where ωres[k] is the residual IAS signal after suppression of periodic components; and “mod” denotes the modulo operation. Importantly, this is not a simple low-pass operation; rather, it functions as a comb-notch mechanism that suppresses targeted synchronous periodic components while preserving non-synchronous impulsive features, which are essential for accurate fault feature extraction.
Example 1. 
Application to simulation signal
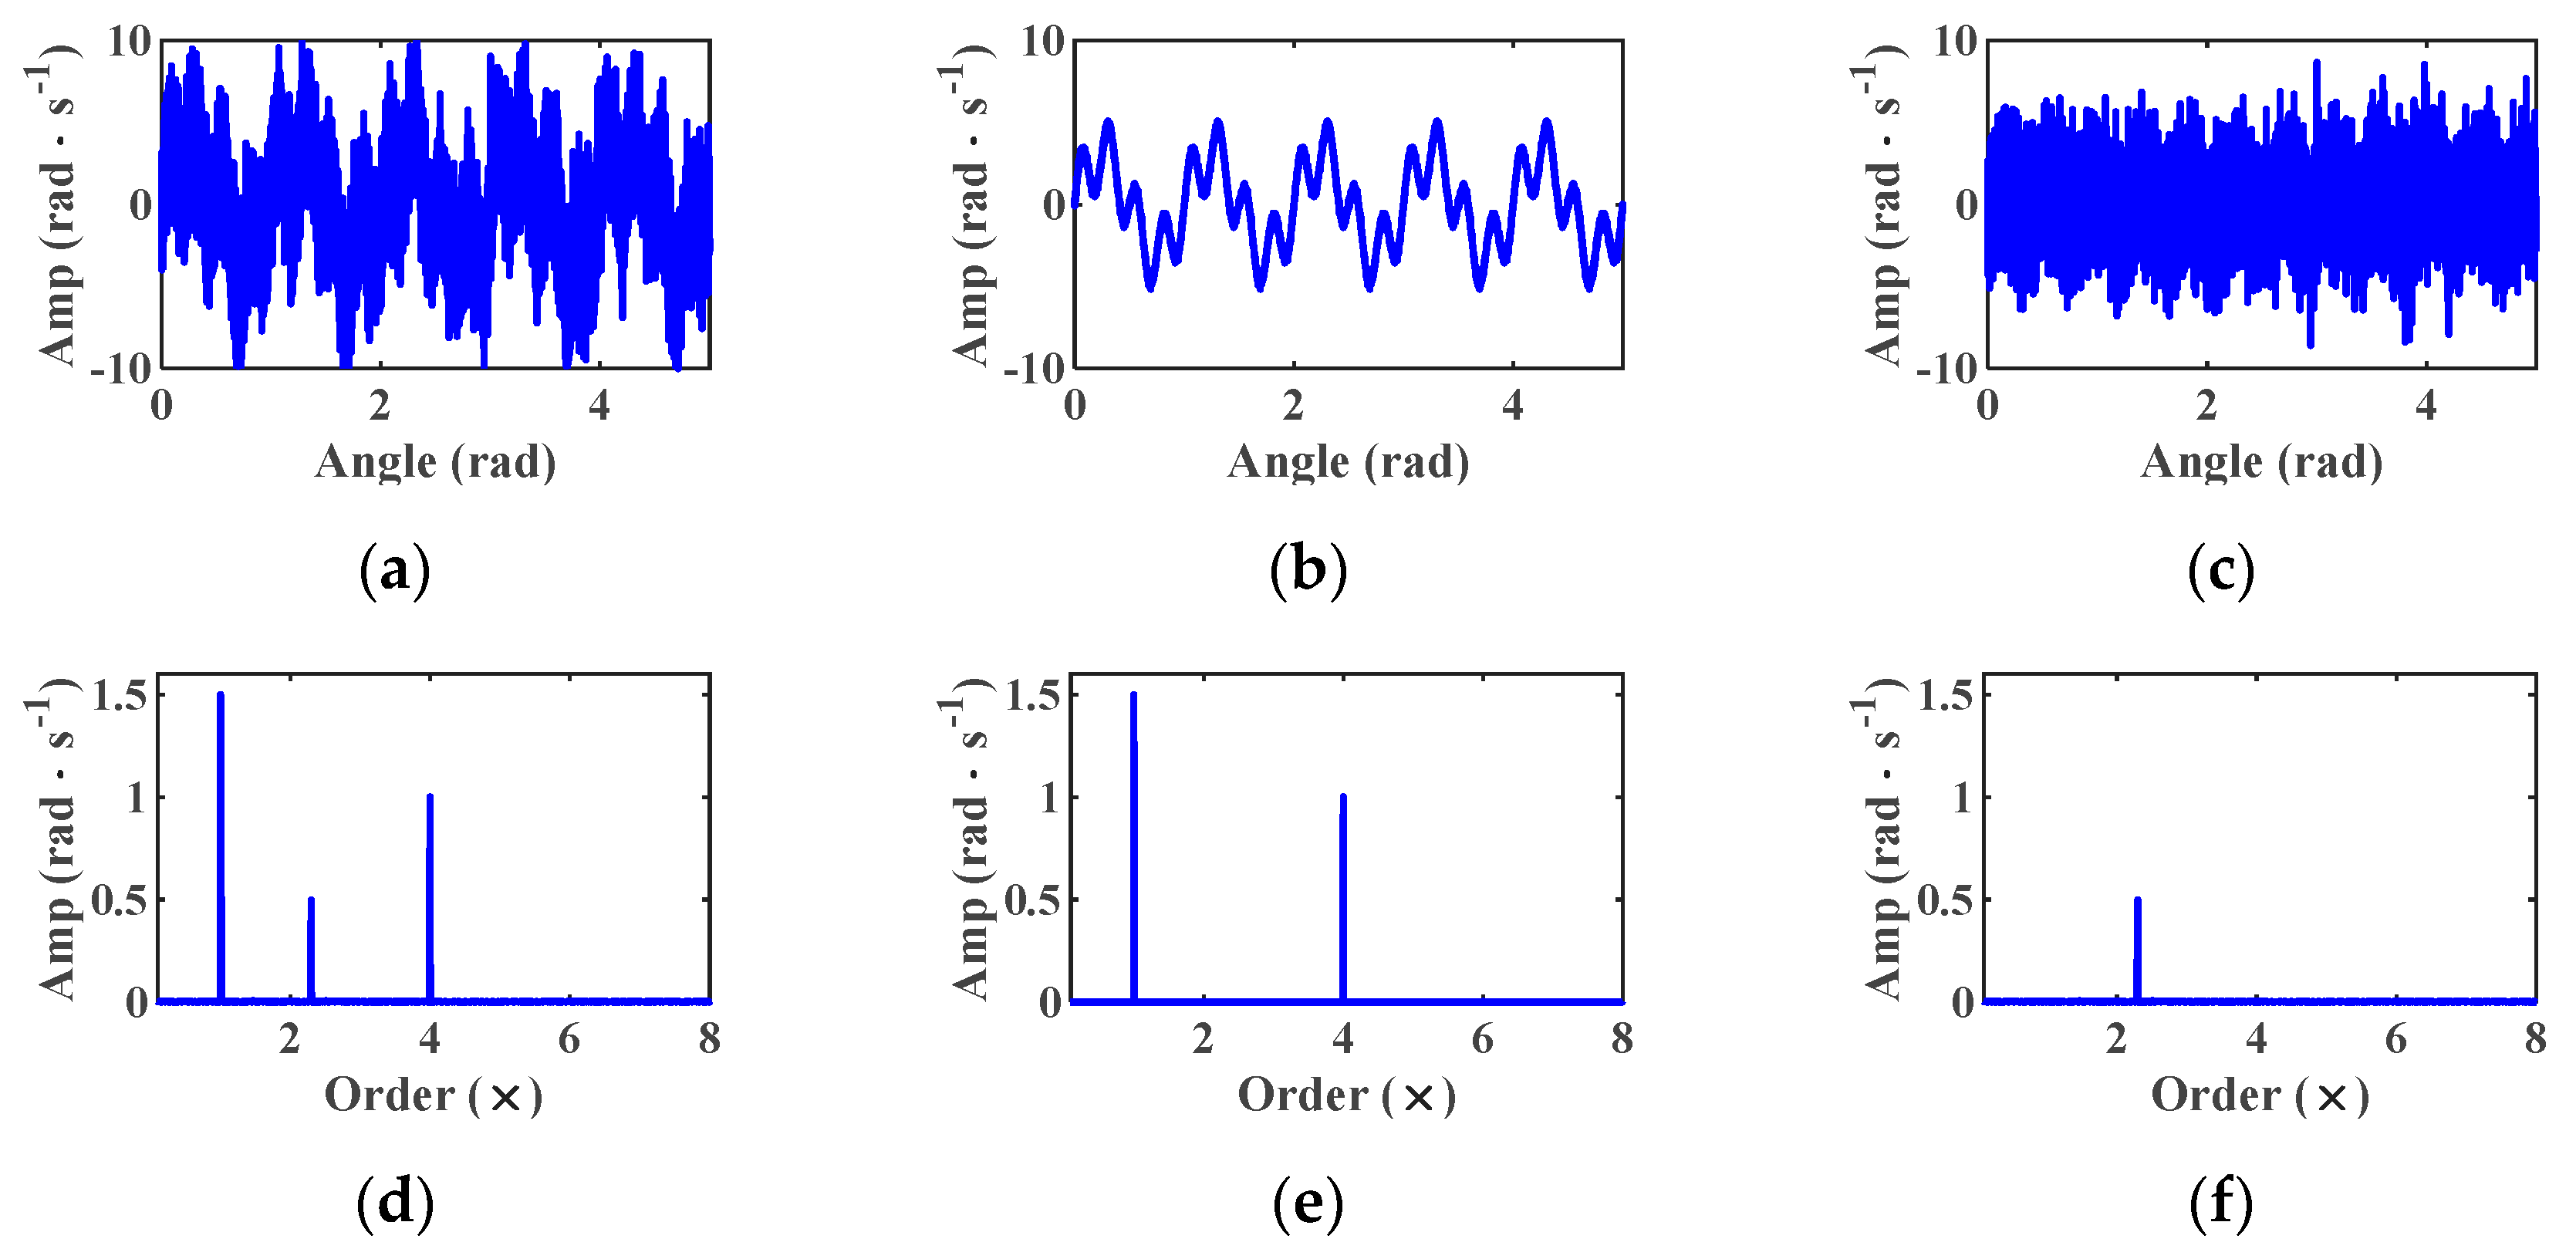
The procedure is demonstrated using a simulation IAS signal with multiple components, as shown in Figure 3. The IAS contains rotation-synchronous at 1× and 4×, a weak non-synchronous component at 2.3×, and additive standard Gaussian noise n(θ).
x r a w θ = 3 sin 2 π 1 θ + 2 sin 2 π 4 θ + sin 2 π 2.3 θ + n θ

2.3.2. Adaptive Estimation of Fault Characteristic Order

The SES [16] enables broadband demodulation of second-order cyclostationary signals, revealing fault modulations. To adaptively estimate the fault characteristic order Of, this study employs the SES and its autocorrelation, which enhances periodic components while suppressing noise and non-cyclic content, thereby improving the robustness of order localization. However, slight deviations in rotational speed are inevitable due to the commonly observed 1–2% random slip between rollers and raceways [21], as well as unavoidable measurement errors in bearing structural parameters [12]. These factors may cause the theoretical fault characteristic order of the outer race to deviate from its actual value. To mitigate this uncertainty, a sliding window of [0.98Of, 1.02Of] is employed, within which a local search is conducted to identify the most prominent peak, which is then regarded as the estimated fault characteristic order.
O o p t = arg max O [ 0.98 O f , 1.02 O f ] ACF SES ω O
where SESω(O) denotes the squared envelope spectrum of the residual IAS signal ωres at order O; ACF(⋅) is the autocorrelation function; Oopt indicates optimally estimated fault order; argmax denotes obtaining the value of O that maximizes the autocorrelation of the squared envelope spectrum.

2.3.3. Adaptive Filter Length Tuning Using IEHP

Following the adaptive estimation of Oopt, we propose the IEHP metric to guide the adaptive selection of filter length [22]. IEHP computes the geometric mean of harmonic amplitudes within a ±1% tolerance around integer orders, which emphasizes harmonic consistency and avoids outcomes dominated by isolated strong components. To limit computation and avoid signal distortion, we adopt a discrete search strategy. Following reference [15], the initial filter length is set to 40 as a reasonable starting point, while inspired by [23], we use a proportional step size of 10 (given the tenfold lower fault frequency in our case). Empirically, searching the interval from 40 to 140 with a step size of 10 provides satisfactory results, within which the optimal filter length is adaptively determined by maximizing the IEHP metric.
IEHP O = m = 1 M S E S s 0 O   ,   O 0.99 m O o p t , 1.01 m O o p t   L = arg max IEHP O

3. Schematic of ICYCBD

The schematic of ICYCBD is shown in Figure 4, which includes the following steps:
1.
IAS Signal Acquisition
The pulse outputs from the servo motor encoders were recorded in this study using a high-speed counter based on FPGA technology. The time interval between adjacent pulses was calculated using Equation (2) and converted into an IAS signal sequence.
2.
Signal Preprocessing
The IAS signal is segmented into data blocks, which correspond to integer complete cycles of the encoder. Equation (10) is used to perform the RDA. Subsequently, Equation (11) is utilized to obtain the residual IAS signal.
3.
CYCBD-Based Weak Fault Feature Extraction
The fault order is estimated from the residual IAS signal using Equation (13). A pre-whitening filter is initialized, and the inverse filter h is optimized to enhance cyclostationary at the target order. Convergence is evaluated using Equation (5), and the output is envelope-demodulated to reveal impulsive features.
4.
Adaptive Filter Length Optimization
For each candidate filter length L, the indicator defined in Equation (14) is calculated based on the estimated fault order Oopt. The filter length is adaptively adjusted by comparing the current IEHP value with its maximum to determine the optimal configuration.
5.
Envelope Signal Calculation and Spectral Feature Matching
The deconvolved signal obtained with optimal parameters is subjected to spectral analysis, and its features are compared with the estimated fault order to validate the fault diagnosis.

4. Experimental Results and Analysis

4.1. Experiment

4.1.1. Test Rig

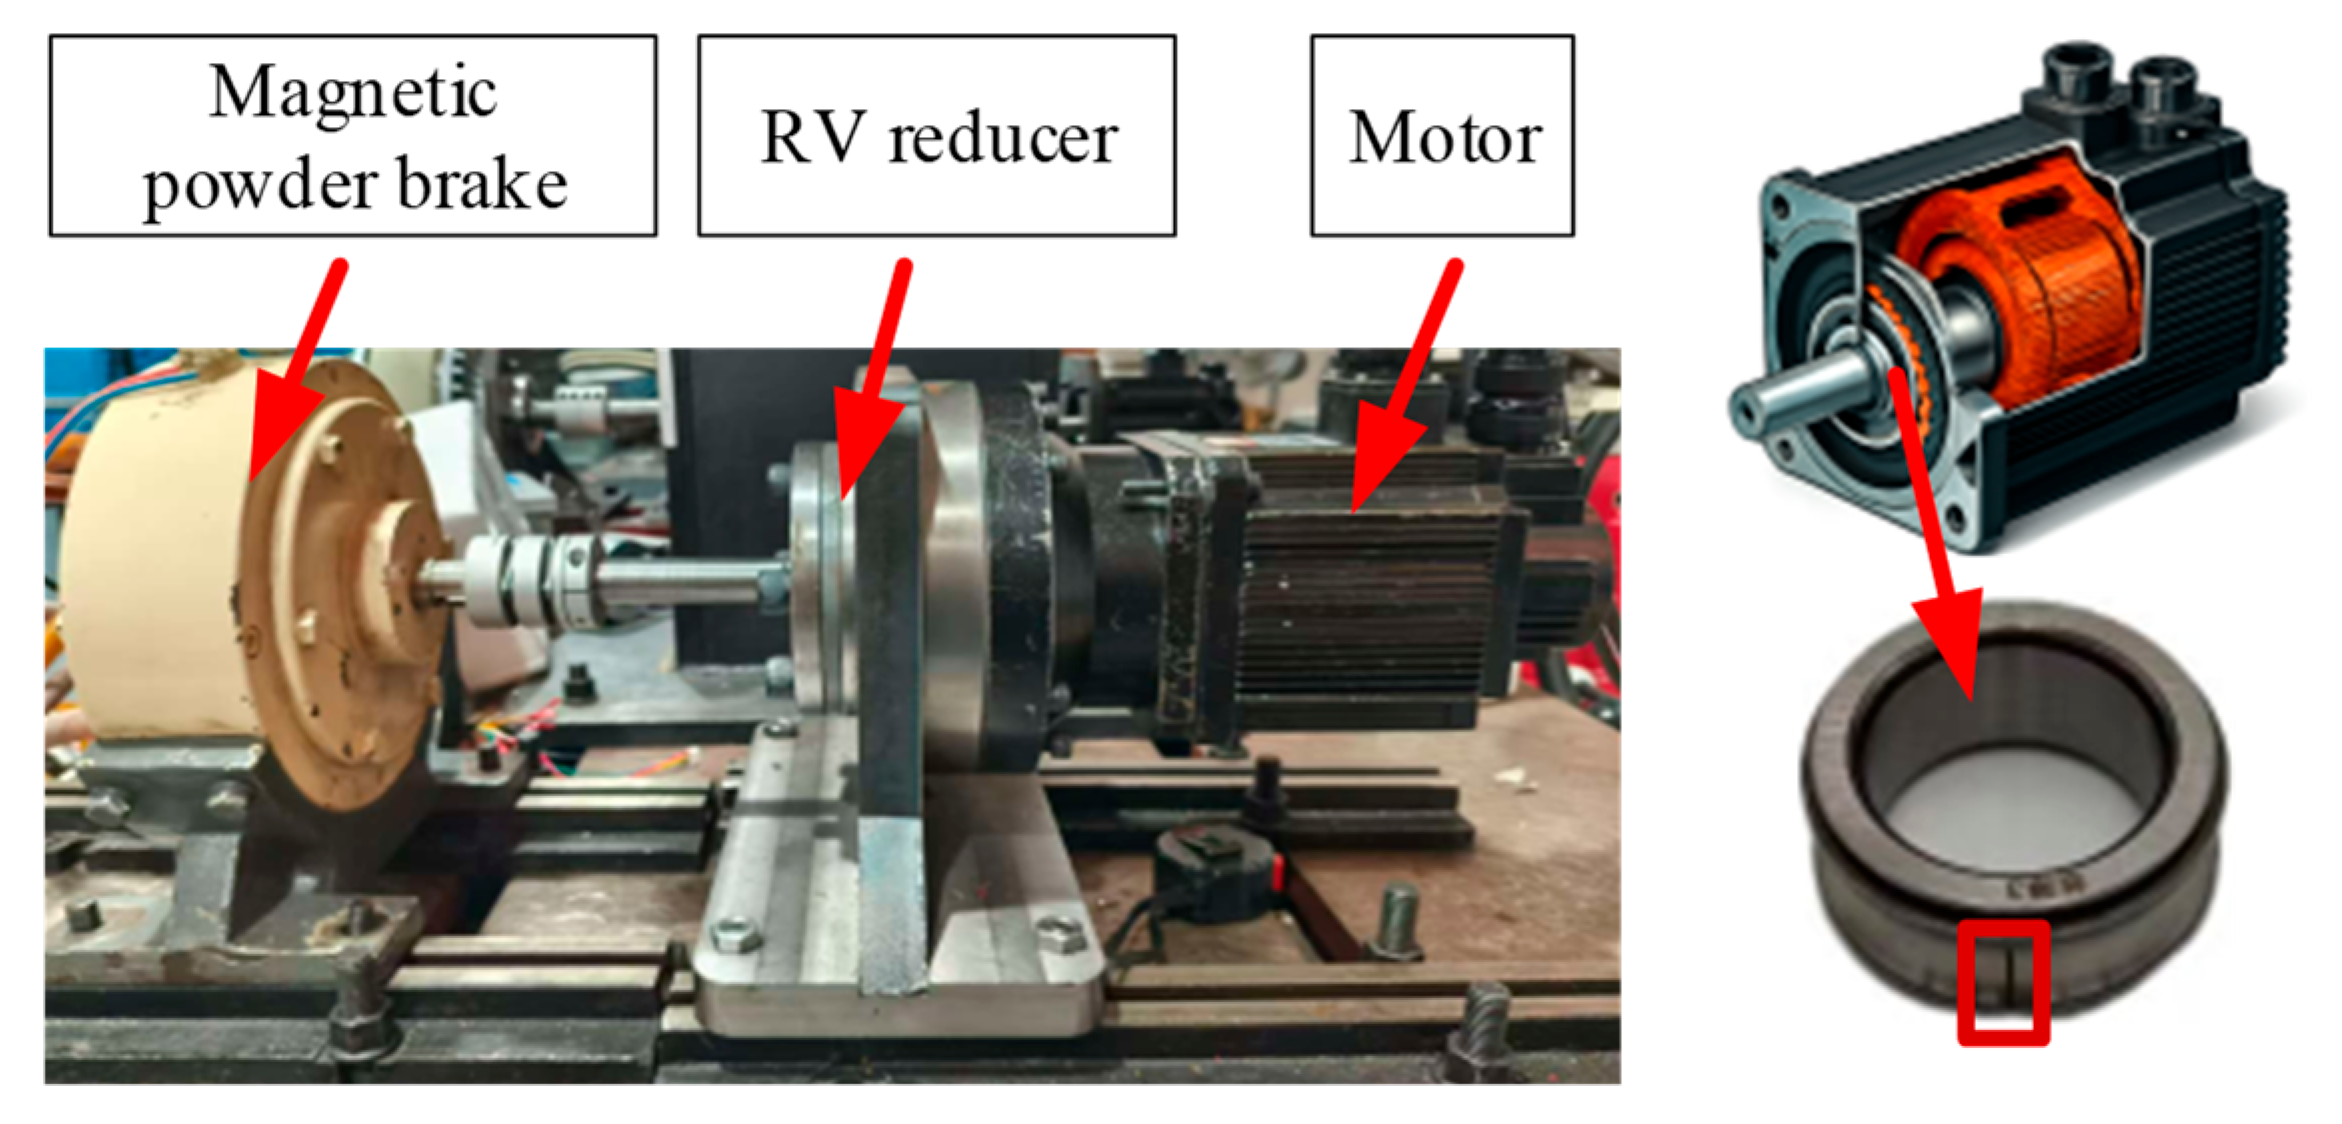
Figure 5 depicts the test rig. It consists of three main components: a Ri Ding servo motor (Model: 130ST-M060C2A), an RV reducer (Model: RV40-121, reduction ratio 121:1), and a magnetic powder brake as the load. The servo motor has a rated power of 1.3 kW, a rated torque of 5 N·m, and a rated speed of 2500 rpm/min. It is also equipped with an encoder with a resolution of 2500 PPR. To simulate a bearing fault, a spall with 1 mm × 0.3 mm was artificially machined on the inner race of an SKF 6305RZ bearing of the servo motor using electrical discharge machining. The bearing’s structural parameters are listed in Table 1.
During operation, such a localized fault induces impulsive speed jitters, which represent key features for bearing fault analysis. To accurately capture these features, the FPGA-based high-speed counter mentioned above was utilized. Then, the IAS signals were calculated by Equation (2).
It is well known that the ball pass frequency of the inner race (BPFI) can be calculated by Equation (15) [1].
O B P F I = N b 2 1 + D b D p cos α
By substituting the parameters in Table 1 into Equation (15), OBPFI = 4.42×.

4.1.2. Experimental Results

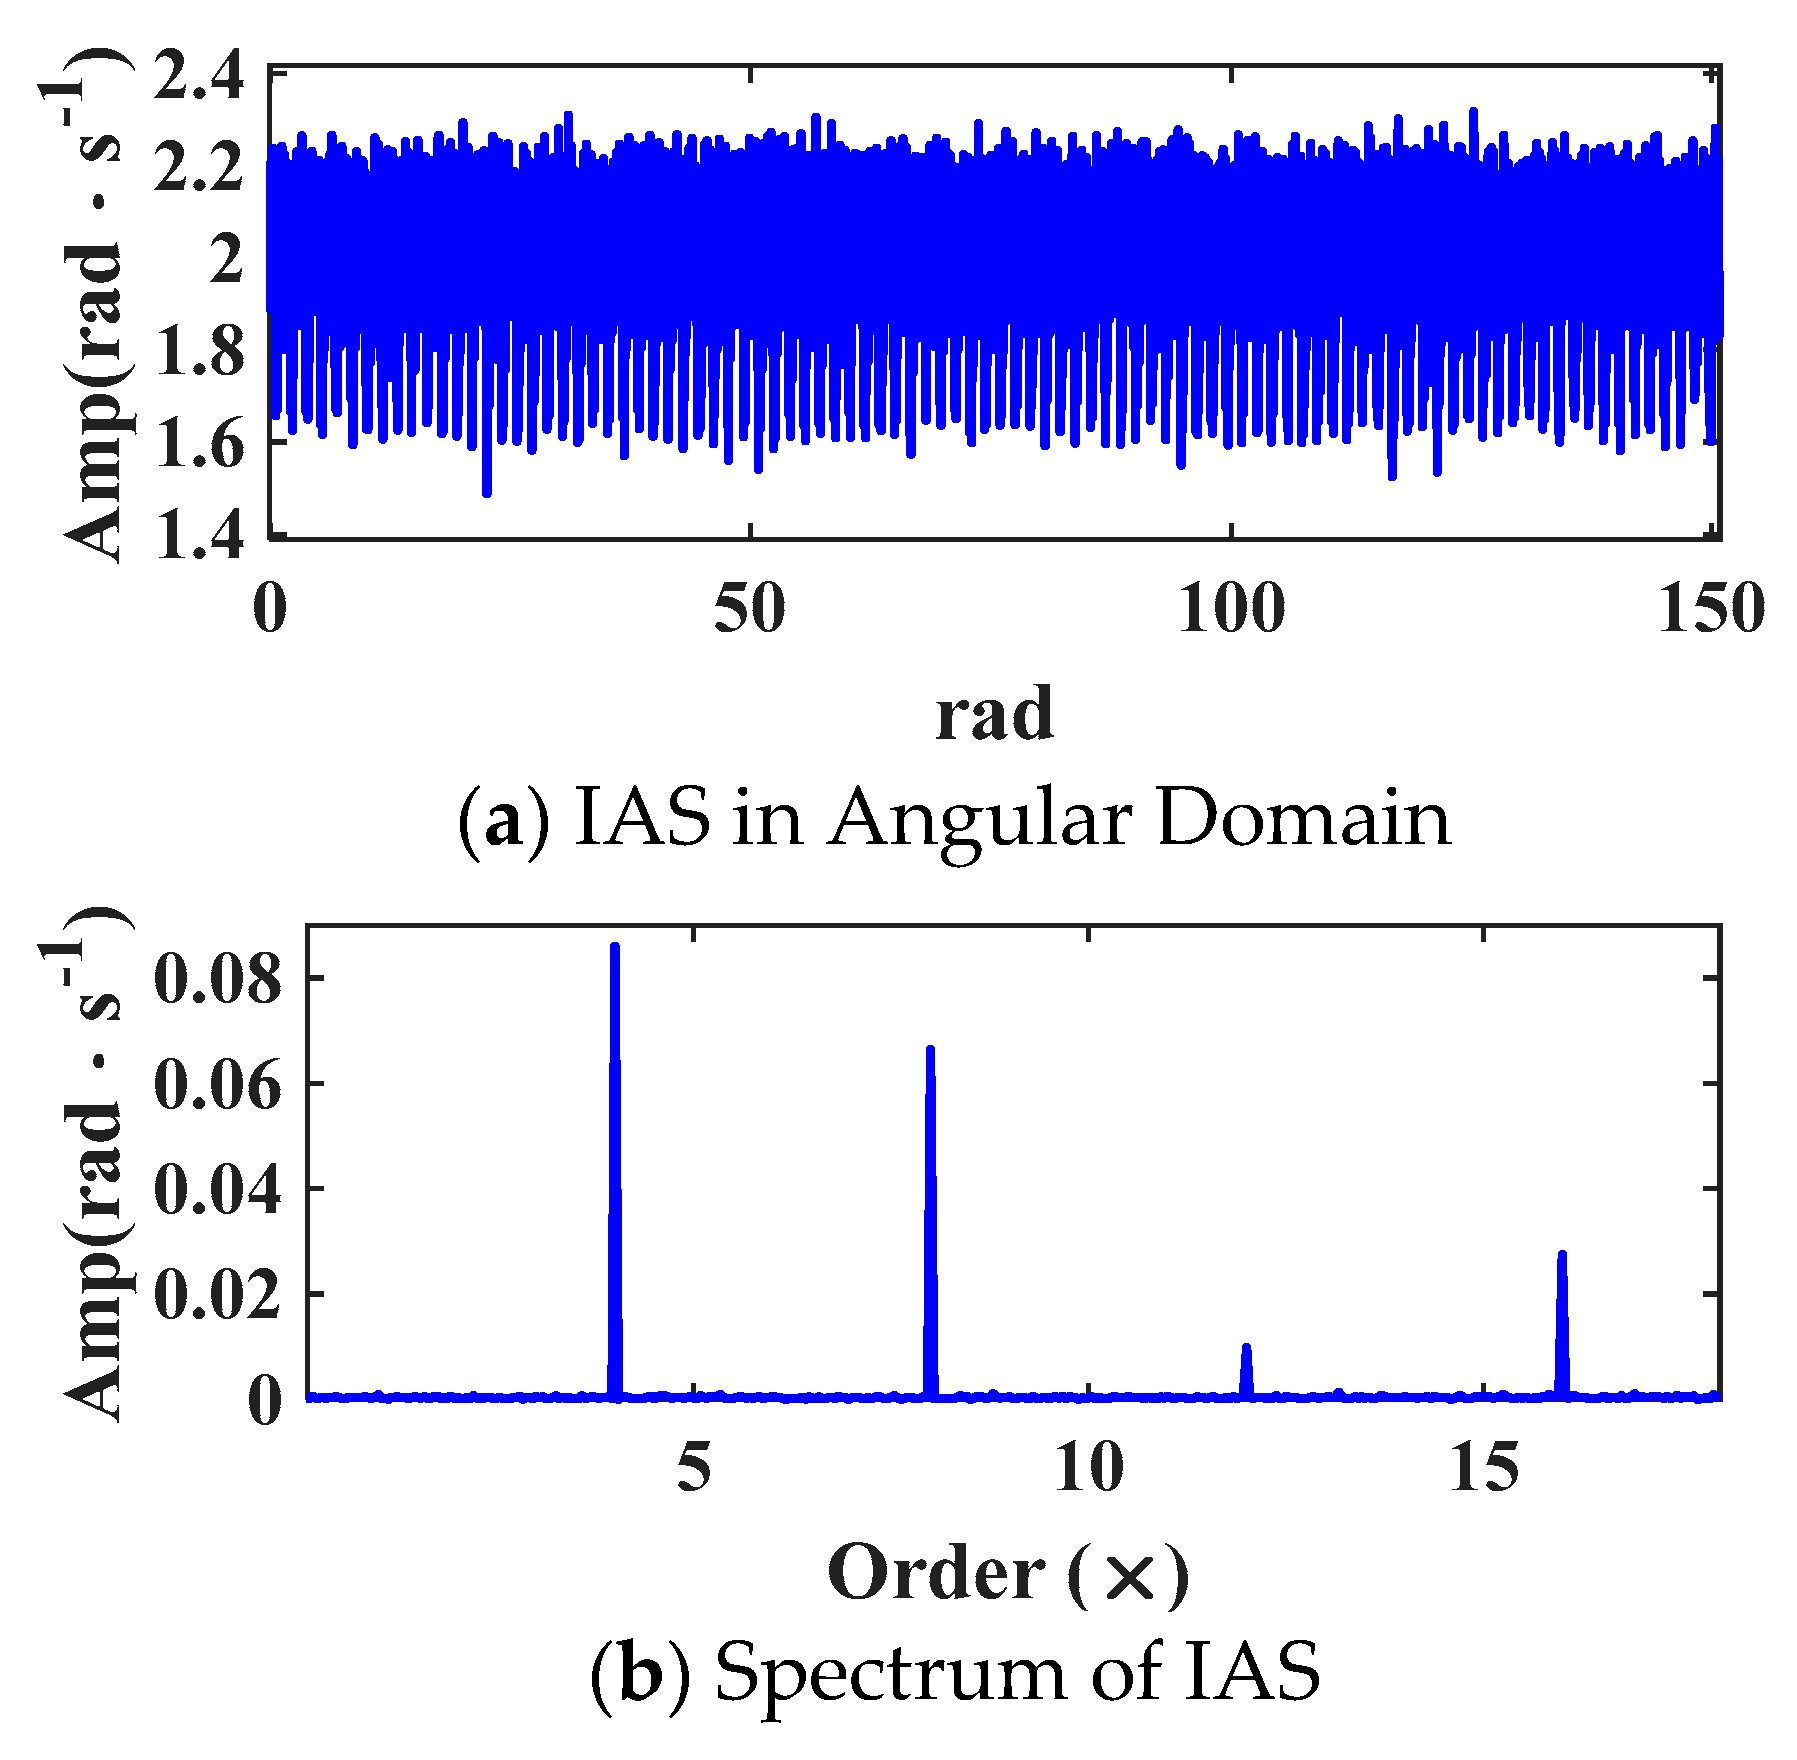
To validate the proposed method, experimental data were collected from the test rig. In this study, the encoder mounted on the servo motor was used to measure the shaft rotational speed, and the acquired data were processed offline for validation. The acquired IAS waveform and its corresponding spectrum are presented in Figure 6a, b, respectively. At a rotational speed of approximately 2 rad/s, as shown in Figure 6a, the x-axis is expressed in angle for convenient representation of the IAS, and under this condition no distinct impulsive features are observable. In contrast, Figure 6b reveals prominent components at the 4×, 8×, and 12× rotational orders, which are attributed to the motor’s pole pairs. In comparison, the lower-order components (1×, 2×, and 3×) exhibit negligible amplitudes. It is worth noting that all spectra in this study are presented in the order domain rather than in the frequency domain, as the order is independent of rotational speed. The OBPFI are masked by background noise and the pole-pair.

4.2. Comparison

To comprehensively evaluate the feature enhancement performance, three representative deconvolution methods, namely MED, MCKD, and adaptive cyclic blind deconvolution, were applied to the IAS signal shown in Figure 6a.
Firstly, Figure 7 shows the deconvolved signal obtained by MED [13]. As seen in the zoomed waveform Figure 7a, impulsive components are not clearly revealed. The envelope spectrum in Figure 7b similarly indicates weak fault, suggesting that MED has limited capability in enhancing fault features.
Secondly, Figure 8 shows the deconvolved signal using MCKD [14]. The zoomed waveform Figure 8a does not reveal clear periodic impulses, and the envelope spectrum Figure 8b shows that the fault-related features are still not effectively extracted.
Subsequently, ACYCBD was employed to expose the REB fault-related features [15]. According to [24], a cyclic order sweep was performed in the range of OBPFI:OBPFI:10OBPFI. the filter length L was set with reference to Section 2.3.3. The optimal filter length was set to L = 140. As shown in Figure 9a, no clear periodic impulses are observed, and Figure 9b shows that the fault-related order Of can be extracted.
Lastly, the ICYCBD approach is applied following the flow diagram shown in Figure 4. To suppress strong periodic interference, the IAS signal (Figure 6) was first subjected to the comb-notch filtering strategy described by Equations (10) and (11). This process generated a residual signal where the impulsive features related to bearing faults were preserved. The cyclic fault order was adaptively estimated from this residual signal by Equation (13), yielding an optimal value of Oopt = 4.38×. Based on this estimate, a cyclic order sweep was conducted over the range Oopt:Oopt:10Oopt. The ICYCBD algorithm was initialized with 50 iterations and a convergence tolerance of 10−4. To improve computational efficiency, reference [18], the filter length L is set with reference to Section 2.3.3. As shown in Figure 10a, the optimal length L = 110 was determined using the indicator IEHP defined in Equation (14). Using these parameters, the ICYCBD-deconvolved signal in the angle domain was obtained. Its locally zoomed angle domain waveform is presented in Figure 10b, where periodic impulsive features are clearly observed. The angle intervals of these features correspond to TBPFI, verifying their consistency with the OBPFI.
To further enhance interpretability, the Hilbert transform was applied to extract the envelope of the ICYCBD deconvolution signal, and the resulting envelope spectrum is shown in Figure 10c, where fault-related orders at 4.38×, 8.76×, and 13.14× are clearly identified. This approach not only recovers fault-related impulsive features in the angle domain but also accentuates them more distinctly in the order domain, demonstrating superior feature enhancement capability under strong interference conditions.

4.3. Robustness Validation

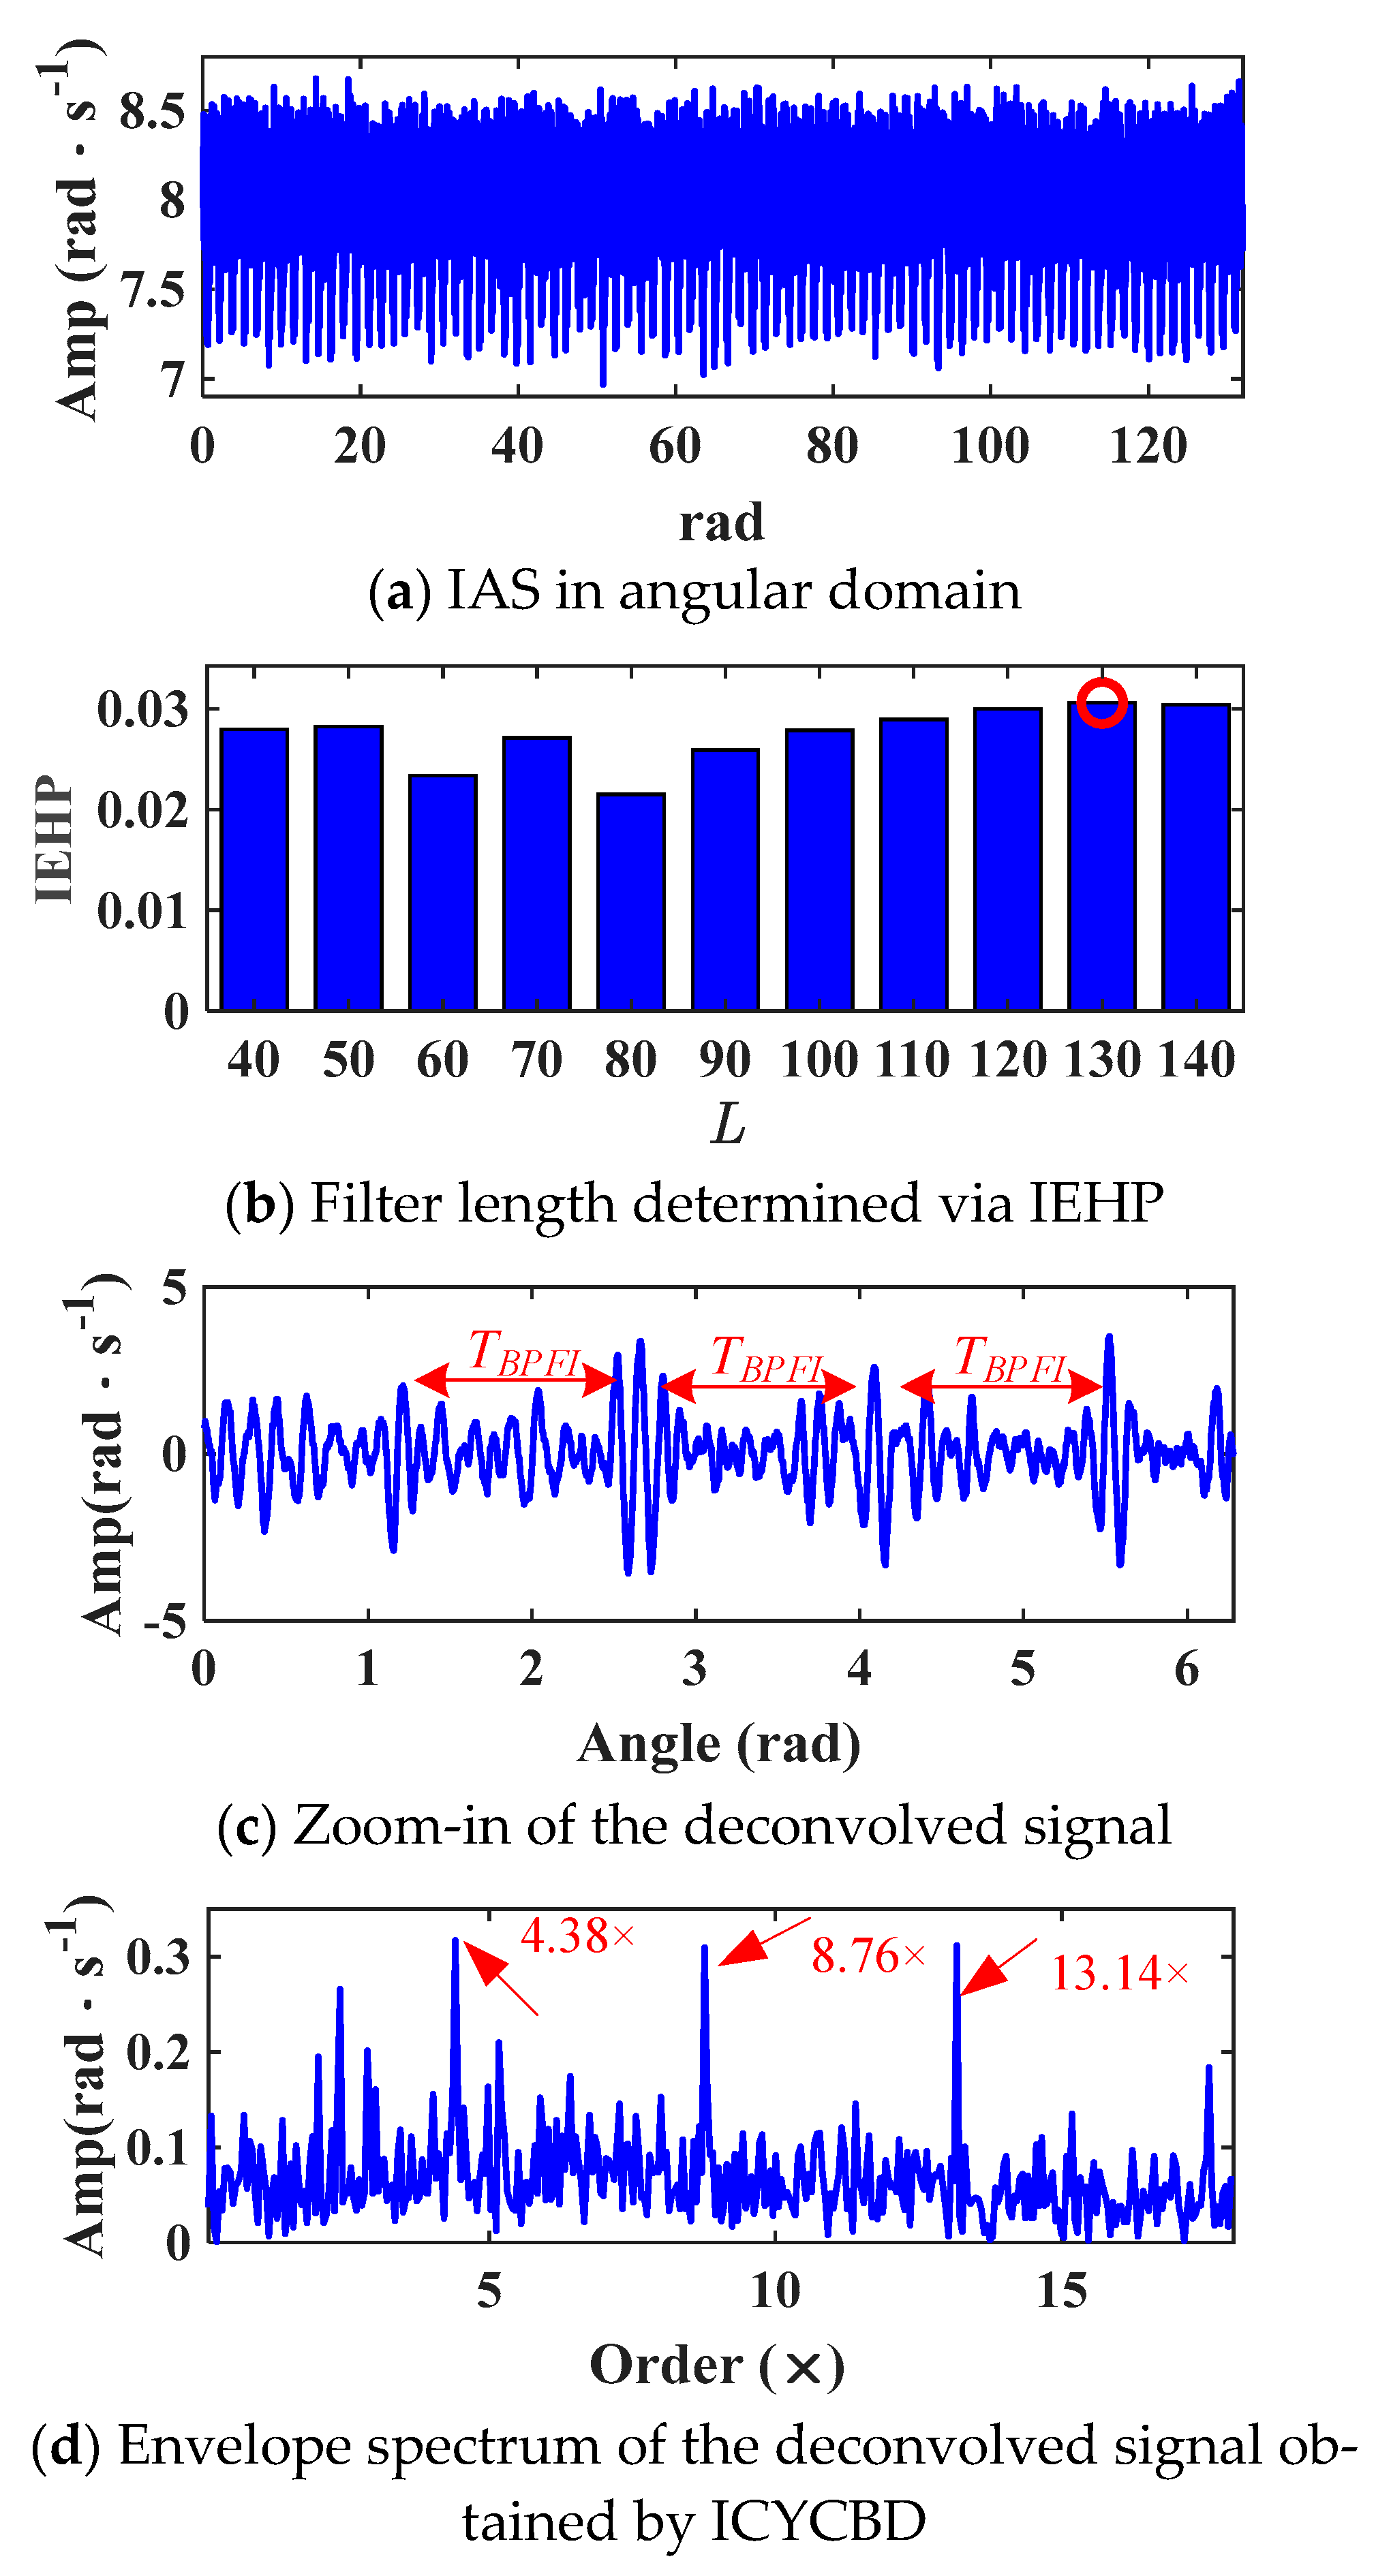
To further evaluate the robustness of the proposed approach, an additional experiment was conducted at a rotational speed of approximately 8 rad/s. As shown in Figure 11a, the original IAS signal acquired from the test rig (Figure 4) exhibits strong components, which obscure the impulsive features associated with the bearing fault. The filter-length selection process is shown in Figure 11b, where the IEHP indicator identifies the optimal value as L = 130. Using this parameter, the ICYCBD algorithm was applied, and the resulting deconvolved waveform is represented in Figure 11c. In this signal, the periodic impulses corresponding to the inner race fault are more distinct, while irrelevant frequency components are suppressed. To further enhance interpretability, the Hilbert transform was applied to extract the envelope of the ICYCBD-processed signal. The corresponding envelope spectrum in Figure 11d reveals fault-related orders at 4.38×, 8.76×, and 13.14×, consistent with the theoretical fault frequencies. These observations indicate that the method is able to extract fault features at different rotational speeds.

5. Conclusions

This study demonstrates that the servo motor encoder signals of servo motors can be effectively utilized to extract features of local inner-race faults in motor bearings, thereby eliminating the need for additional external sensors. Compared with MED, MCKD, and ACYCBD, the proposed ICYCBD method exhibits superior capability in recovering fault-related cyclic impulses and their corresponding orders, while maintaining higher robustness under complex operating conditions. Future research will focus on optimizing filter length selection and developing parameter transfer strategies for applying settings to similar cases. Additionally, extracted features will be integrated with deep learning for automatic alarms and early warnings. Furthermore, efforts will be made to integrate the algorithm into embedded hardware for real-time fault detection and monitoring.

Author Contributions

Writing—original draft preparation, Y.L.; writing—review and editing, Y.L. and Y.G.; data curation, Y.L. and J.L.; conceptualization, Y.G.; methodology, Y.L.; validation, Y.G. and H.W. All authors have read and agreed to the published version of the manuscript.

Funding

This work was supported in part by the Department of Education’s Higher Education Serving Key Industries Science and Technology Project (Grant No. FWCYZNT2024007), the Yunnan Fundamental Research Projects (Grant No. 202501AS070116), and the National Natural Science Foundation of China (Grant No. 52165067).

Data Availability Statement

The data are not publicly available due to privacy restrictions.

Acknowledgments

The authors would like to thank the anonymous reviewers for their valuable and constructive comments on this article.

Conflicts of Interest

The authors declare no conflicts of interest.

Abbreviations

The following abbreviations are used in this manuscript:
IASInstantaneous Angular Speed
MEDMinimum Entropy Deconvolution
MCKDMaximum Correlated Kurtosis Deconvolution
CYCBDCyclic Blind Deconvolution
ICYCBDImproved Cyclic Blind Deconvolution
RDARotary-domain Synchronous Averaging
SESSquared Envelope Spectrum
FPGAField Programmable Gate Array

References

  1. Randall, R.B.; Antoni, J. Rolling element bearing diagnostics—A tutorial. Mech. Syst. Signal Process. 2011, 25, 485–520. [Google Scholar] [CrossRef]
  2. Rai, A.; Upadhyay, S.H. A review on signal processing techniques in fault diagnosis of rolling element bearings. Tribol. Int. 2016, 96, 289–306. [Google Scholar] [CrossRef]
  3. Ding, C.; Zhao, M.; Lin, J.; Jiao, J.; Liang, K. Sparsity-Based Algorithm for Condition Assessment of Rotating Machinery Using Internal Encoder Data. IEEE Trans. Ind. Electron. 2020, 67, 7982–7993. [Google Scholar] [CrossRef]
  4. Cristalli, C.; Paone, N.; Spinsante, S. Mechanical fault detection of electric motors by laser vibrometer and accelerometer measurements. Mech. Syst. Signal Process. 2006, 20, 1350–1361. [Google Scholar] [CrossRef]
  5. Adamczak, S.; Wrzochal, M.; Durakbasa, N.M. Evaluation of a Non-Contact Method for Measuring Vibration of Rolling Bearings in Industrial Conditions. Mechanik 2020, 93, 8–11. [Google Scholar] [CrossRef]
  6. Rothberg, S.J.; Allen, M.S.; Castellini, P.; Di Maio, D.; Dirckx, J.J.J.; Ewins, D.J.; Halkon, B.J.; Muyshondt, P.; Paone, N.; Ryan, T.; et al. An International Review of Laser Doppler Vibrometry: Making Light Work of Vibration Measurement. Opt. Lasers Eng. 2017, 99, 11–22. [Google Scholar] [CrossRef]
  7. Liu, H.Y.; Ji, D.C.; Lin, J. Non-contact torsional vibration measurement and residual vibration analysis methods for planetary gearbox fault diagnosis. J. Vib. Eng. 2025, 38, 1354–1362. [Google Scholar] [CrossRef]
  8. Liu, H.; Ji, D.; Lin, J. Residual angular speed analysis based on laser Doppler vibrometer and its application in planetary gearbox diagnosis. Measurement 2025, 250, 116987. [Google Scholar] [CrossRef]
  9. Renaudin, L.; Bonnardot, F.; Musy, O.; Doray, J.B.; Rémond, D. Natural roller bearing fault detection by angular measurement of true instantaneous angular speed. Mech. Syst. Signal Process. 2010, 24, 1998–2011. [Google Scholar] [CrossRef]
  10. Zhang, Y.; Lin, J.; Miao, Y. Application of an MAKD method via Dixon’s test for gearbox fault diagnosis based on built-in encoder signals. Meas. Sci. Technol. 2025, 36, 086115. [Google Scholar] [CrossRef]
  11. Stack, J.R.; Habetler, T.G.; Harley, R.G. Fault-signature modeling and detection of inner-race bearing faults. IEEE Trans. Ind. Appl. 2006, 42, 61–68. [Google Scholar] [CrossRef]
  12. Chen, X.; Guo, Y.; Na, J. Instantaneous-angular-speed-based synchronous averaging tool for bearing outer race fault diagnosis. IEEE Trans. Ind. Electron. 2023, 70, 6250–6260. [Google Scholar] [CrossRef]
  13. Wiggins, R.A. Minimum entropy deconvolution. Geoexploration 1978, 16, 21–35. [Google Scholar] [CrossRef]
  14. McDonald, G.L.; Zhao, Q.; Zuo, M.J. Maximum correlated kurtosis deconvolution and application on gear tooth chip fault detection. Mech. Syst. Signal Process. 2012, 33, 237–255. [Google Scholar] [CrossRef]
  15. Buzzoni, M.; Antoni, J.; Borghesani, P. Cyclic blind deconvolution for bearing diagnostics. Mech. Syst. Signal Process. 2021, 147, 107077. [Google Scholar] [CrossRef]
  16. Sun, H. Application of a novel improved adaptive CYCBD method in gearbox compound fault diagnosis. IEEE Access 2021, 9, 133835–133848. [Google Scholar] [CrossRef]
  17. Zhang, Q. Research on fault extraction method of CYCBD based on seagull optimization algorithm. Shock Vib. 2021, 2021, 8552024. [Google Scholar] [CrossRef]
  18. Huo, W.; Jiang, Z.; Sheng, Z.; Zhang, K.; Xu, Y. Cyclostationarity blind deconvolution via eigenvector screening and its applications to the condition monitoring of rotating machinery. Mech. Syst. Signal Process. 2025, 222, 111782. [Google Scholar] [CrossRef]
  19. Yin, X.; Guo, Y.; Na, J.; Fan, J. Incremental optical encoder error modeling and compensation for accurate speed acquisition in non-stationary conditions. IEEE Trans. Ind. Electron. 2025, 72, 1033–1042. [Google Scholar] [CrossRef]
  20. Guo, Y.; Zhao, L.; Wu, X.; Na, J. Tooth root crack detection of planet and sun gears based on resonance demodulation and vibration separation. IEEE Trans. Instrum. Meas. 2020, 69, 65–75. [Google Scholar] [CrossRef]
  21. Antoni, J.; Bonnardot, F.; Raad, A.; El Badaoui, M. Cyclostationary modelling of rotating machine vibration signals. Mech. Syst. Signal Process. 2004, 18, 1285–1314. [Google Scholar] [CrossRef]
  22. Zhang, B.; Miao, Y.; Lin, J.; Yi, Y. Adaptive maximum second-order cyclostationarity blind deconvolution and its application for locomotive bearing fault diagnosis. Mech. Syst. Signal Process. 2021, 158, 107736. [Google Scholar] [CrossRef]
  23. Wang, Z.; Zhou, J.; Du, W.; Lei, Y.; Wang, J. Bearing fault diagnosis method based on adaptive maximum cyclostationarity blind deconvolution. Mech. Syst. Signal Process. 2022, 162, 108018. [Google Scholar] [CrossRef]
  24. Qi, Y.; Shan, C.; Jia, S.; Liu, L.; Dong, C. A gearbox composite fault diagnosis based on enhanced CYCBD. Chin. Mech. Eng. 2022, 33, 2927–2941. [Google Scholar] [CrossRef]
Figure 1. Framework of IAS signal acquisition based on encoder pulses.
Vibration 08 00059 g001
Figure 2. Schematic of blind deconvolution process.
Vibration 08 00059 g002
Figure 3. Comb-notch filtering applied to the simulation signal. (a) Raw IAS signal: The simulation IAS signal includes 1×, 4×, and 2.3× components. (b) IAS after RDA: The RDA signal captures the rotation-synchronous 1× and 4× components. (c) Residual IAS signal: The residual signal isolates the 2.3× non-synchronous component after RDA subtraction. (d) Order spectrum of the raw IAS signal: The order spectrum of the original signal shows peaks at 1×, 2.3×, and 4×. (e) Order spectrum after RDA: The spectrum of the RDA signal confirms the removal of synchronous components. (f) Order spectrum of the residual: The residual spectrum retains the 2.3× component while the 1× and 4× peaks are suppressed, illustrating the separation of non-synchronous content.
Vibration 08 00059 g003
Figure 4. Schematic of ICYCBD.
Vibration 08 00059 g004
Figure 5. Experimental setup and defective bearing with an inner race fault.
Vibration 08 00059 g005
Figure 6. IAS signal and spectrum.
Vibration 08 00059 g006
Figure 7. Deconvolved signal by MED.
Vibration 08 00059 g007
Figure 8. Deconvolved signal by MCKD.
Vibration 08 00059 g008
Figure 9. Deconvolved signal by ACYCBD.
Vibration 08 00059 g009
Figure 10. Deconvolved signal obtained by ICYCBD.
Vibration 08 00059 g010
Figure 11. Deconvolved signal obtained by ICYCBD.
Vibration 08 00059 g011
Table 1. Parameters of fault bearing.
Bearing ParameterValue
Pitch Diameter Dp (mm)43.5
Rolling Element Diameter Db (mm)11.49
Number of Rolling Elements Nb7
Contact Angle α (°)0
Disclaimer/Publisher’s Note: The statements, opinions and data contained in all publications are solely those of the individual author(s) and contributor(s) and not of MDPI and/or the editor(s). MDPI and/or the editor(s) disclaim responsibility for any injury to people or property resulting from any ideas, methods, instructions or products referred to in the content.