1. Introduction
Active vibration control (AVC) is an essential technology used to achieve lower levels of vibration often required for the optimal performance and longevity of machines and structures. Unlike passive control methods, which involve modifying the physical properties of a structure to absorb vibration, AVC can offer greater adaptability and effectiveness [
1]. AVC operates on the principle of destructive interference by applying an identical counteractive force to the initial vibration caused by disturbances. When the amplitude and phase of this counteractive force closely matches the uncontrolled vibration, significant attenuation is often achieved [
2]. The key components of an AVC system include the plant to be controlled, sensors to detect the vibration, actuators that provide the compensatory force, and a controller that executes the necessary algorithms [
3].
A notable example of a system requiring active vibration control is the Adaptive Collimation System (ACS) [
4] proposed for the CERN Large Hadron Collider (LHC). The ACS is designed to address slow deformations and vibratory responses that affect the collimators, which are critical for beam cleaning and concentration of circulating proton beams for optimal collision. In instances of excessive beam loss, a beam dump is triggered to extract the beam. Errors in this process can lead to direct beam impacts on the collimator jaws, resulting in significant vibratory responses. The proposed ACS aims to mitigate these issues using a closed-loop system, which integrates an intrinsic fibre-based interferometric strain measurement system and a series of high-powered piezo-ceramic (PZT) stack actuators. These piezo actuators effectively correct slow elastic deformations caused by gradual proton beam losses, ensuring the slow collimator jaw deflections remain within acceptable limits. However, the flexural oscillations induced by direct beam impacts from asynchronous beam dumps and beam injection errors remain uncompensated [
5]. The initial deflection caused by these impulse impact scenarios can lead to plastic deformation of the collimator jaws, as demonstrated in several studies [
6,
7]. By reducing the first-cycle peak caused by beam impacts, the ACS can minimise the risk of plastic deformation and maintain the integrity of the collimation system.
The effectiveness of control measures for the CERN jaw active vibration challenge can be evaluated by the percentage of first-cycle peak attenuation (FCPA). Numerous studies in the literature explore active suppression of transversal free vibration in flexible smart structures. Various control strategies are used, different appraisal methods for control effectiveness are employed and, in some cases, the controlled vibration graphs show different levels of first-cycle peak suppression. Some of these efforts are based on modern control-state feedback methods. Kermani et al. investigated high-authority piezoelectric stack actuators for AVC of long-reach robotic manipulators. They compared a control law based on the Popov criterion with Linear Quadratic Regulator (LQR) control. The study found that the Popov criterion not only guarantees system stability but also enhances actuator performance in suppressing flexural modes. For initial displacement disturbances, the Popov criterion controller achieved 8% first-cycle peak attenuation [
8]. Sethi and Song studied the suppression of free vibration in a smart beam and a model frame structure using pole placement and LQR control methods. These studies demonstrated vibration suppressed across multiple modes. Controller performance was evaluated using power spectrum plots without an investigation of first-cycle peak attenuation [
9,
10]. Martens and Waller presented practical results on cantilever beam vibration suppression using patch and stack-type piezo actuators. They employed the LQR method to attenuate impulsively excited vibrations, assessing suppression effectiveness in terms of the settling times of the uncontrolled beam, the stack actuator beam, and the bimorph patch actuator beam, where an 85% settling time reduction was achieved [
11].
Soft computing fuzzy-based methods have also been applied for active suppression of free vibration. Li et al. applied the decentralised adaptive fuzzy control method to a large space truss structure under impulse excitation. While the resultant overall vibration suppression was effective, no attenuation of the first-cycle peak was observed [
12]. Xu et al. developed a vibration control system for gossamer space structures using piezoelectric stack actuators. They compared decentralised adaptive fuzzy control with the traditional fuzzy control, focusing on settling time. Experimental results showed a 12.5% attenuation of the first-cycle peak of bending vibration for both control methods under initial displacement disturbances [
13]. Additionally, Xu et al. developed an online learning fuzzy vibration controller for a smart truss structure. Although the reported evaluation parameter was the damping ratio, the experimental results showed that the fuzzy controller achieved a 7.5% first-cycle peak attenuation, while the online learning fuzzy controller achieved a reduction of 12.5% [
14]. Alireza et al. applied fuzzy control to a smart beam subjected to initial displacement. They compared the time responses of the beam in the open loop, the proportional differential (PD), and the fuzzy controller, focusing on the root mean square (RMS) of the sensor output voltage. The fuzzy absorber reduced the magnitude of the first mode vibration by approximately 38% of the open-loop system; however, first peak response was not affected [
15].
A variety of classical control and other advanced methods have been employed to suppress free vibration of flexible structures. Qui et al. developed a backpropagation neural network-based PD control algorithm for a piezoelectric beam, showing effectiveness in settling time reduction but no early attenuation [
16]. Khot et al. presented active control of a cantilever beam using piezoelectric transducers with H-infinity and PD controllers designed in LabVIEW. Their experiments showed a reduction in settling time for initial displacement disturbances but no reduction in the initial peak. They also reported noise at the settling time due to spurious signals from the controller [
17,
18]. Takacs et al. implemented embedded explicit model predictive control on a piezoelectric smart beam, comparing their method with the classical positive position feedback control. The proposed method achieved similar vibration suppression with less control effort, but suppression only began from the third vibration cycle [
19]. Song et al. investigated active vibration damping of a composite beam using positive position feedback and strain rate feedback methods, focusing on the power spectrum density reduction [
20]. Malgaca and Karagulle implemented displacement feedback and direct velocity feedback control on laminated composite beams under step disturbance. Controller effectiveness was analysed using the damping ratios achieved using controller gain values. The maximum controller input peak voltage was presented; however, no FCPA of the response was observed [
21,
22]. In addition to structural and precision engineering applications, active vibration control methods are increasingly relevant to intelligent vehicle suspension systems, where road bumps or potholes can induce significant transient dynamics. Recent studies have explored active and semi-active strategies for suspension control [
23,
24] While these methods focus on improving ride comfort and road handling, our review of the literature revealed a limited emphasis on suppressing the first-cycle peak, which is the initial high-amplitude response following an impulse. This specific challenge has significant implications for ride quality and component fatigue.
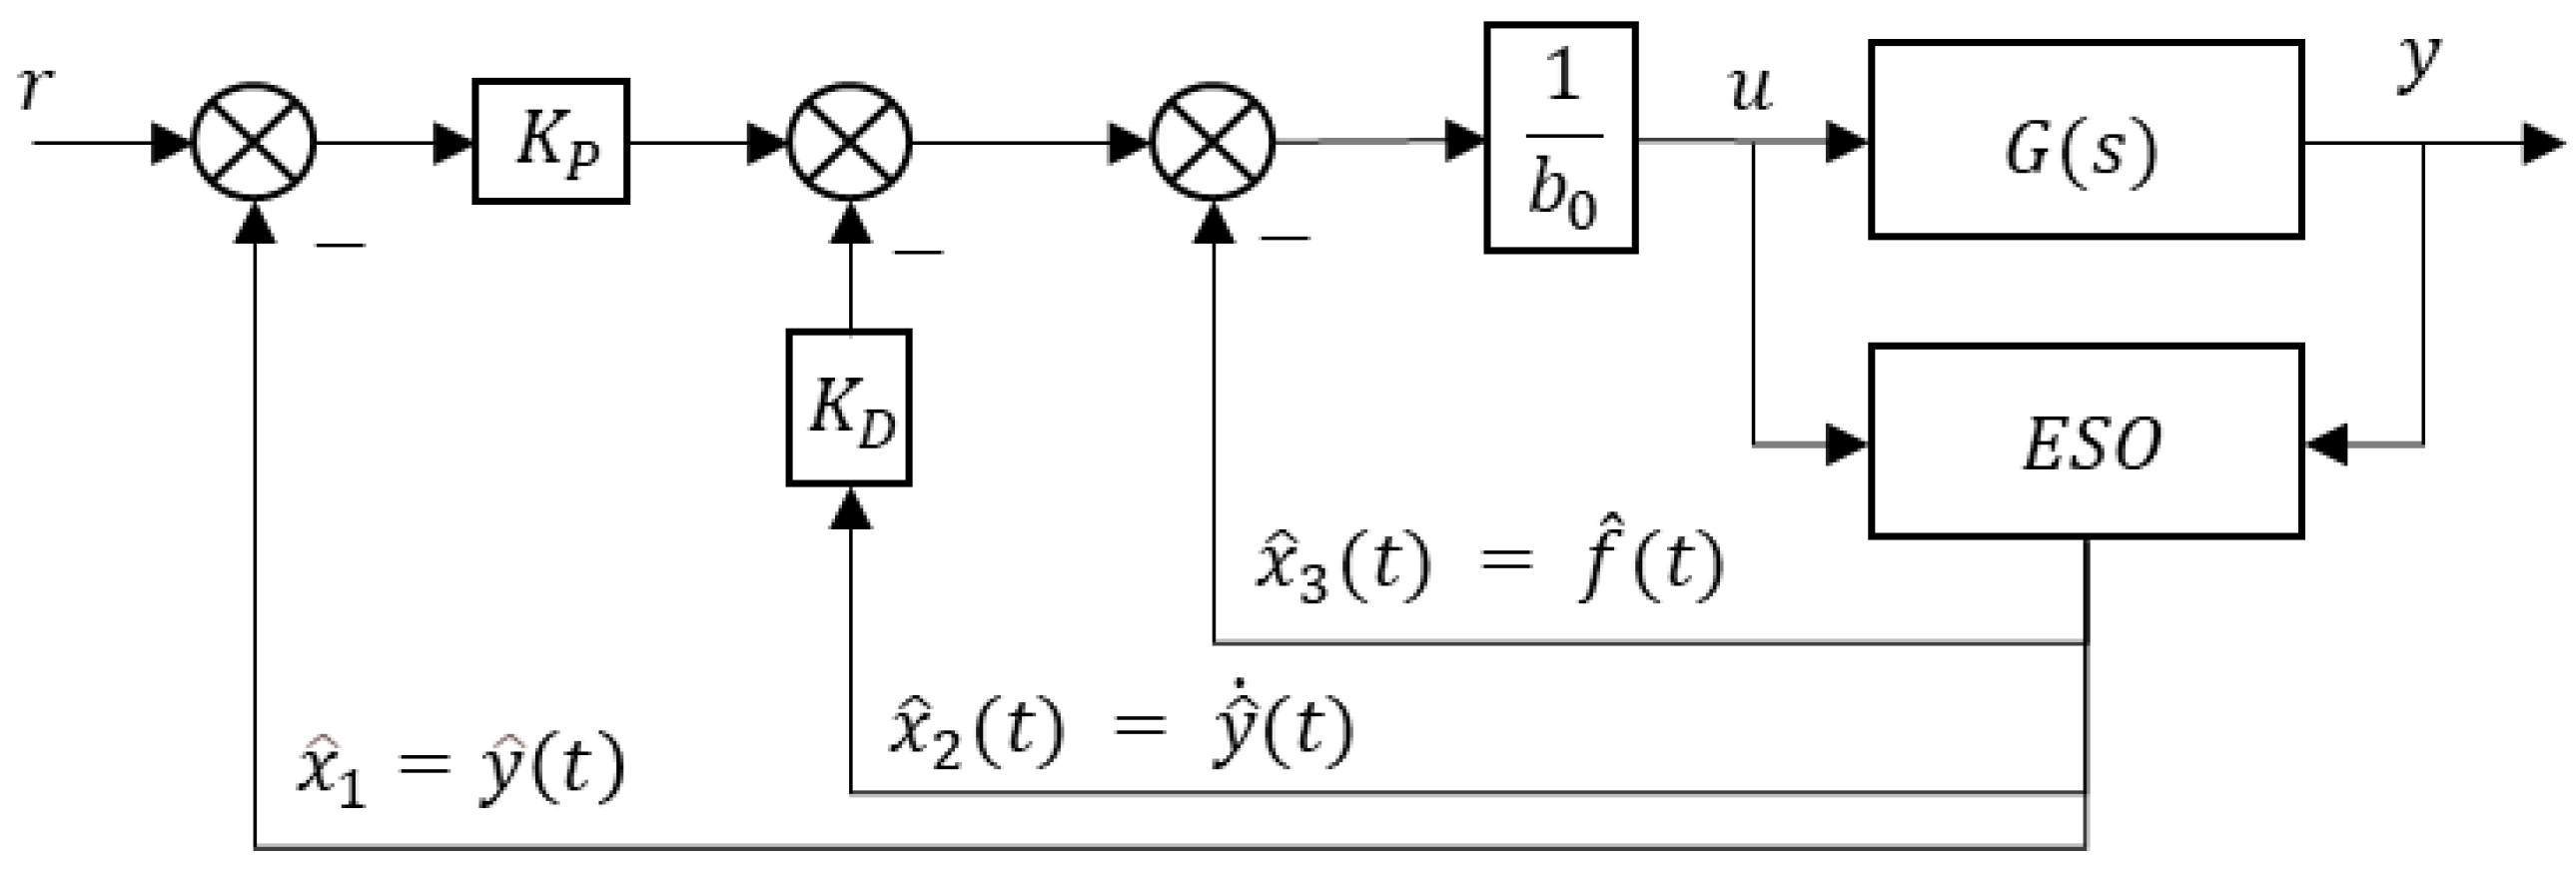
Active disturbance rejection control (ADRC) compensates for disturbances by estimating them and applying corrective measures. Where it is not possible to directly measure the disturbance, ADRC combines the PID control error-driven approach with state observer techniques to address the shortcomings of classical and modern control, such as error computation and noise issues. This results in effective disturbance estimation and rejection using an extended state observer [
25]. Gao advocates for ADRC due to the uncertainty of mathematical models representing real-life process dynamics, showing that the notion of disturbance can be generalised to represent any discrepancies between the physical system and the model [
26]. He also proposed a scaling and bandwidth-parameterisation-based tuning method of linear ADRC. This method was used to quickly determine the maximum bandwidth by varying tuning parameters to make different trade-offs among different design considerations [
27]. Herbst, Zhang et al., and Li et al. presented ADRC derivations and simulation results, relating key tuning parameters with control outcomes. The controller bandwidth was selected based on the desired system performance, particularly the settling time, and it was recommended to set the observer bandwidth between three and ten times the controller bandwidth for the optimal performance [
28,
29,
30]. In the application of vibration control, Lee reported the use of an estimated disturbance input to compensate for vibrations of different structures. Early suppression of the vibratory response is observed as this method is applied [
31,
32]. A simulative study by Zhang et al. shows 33% and 42.6% attenuation in the first-cycle peak response for a smart beam under step disturbance. The tuning parameter produces larger observer gains, which shorten the rise time of the estimated disturbance, increase overshoot, and amplify noise in the system. However, the extent of noise amplification and its effects were not investigated [
33]. Ostertag highlighted that a judicious choice of the observer gain facilitates a reduction in the effect of disturbance, particularly when certain conditions are met [
34]. Zheng et al. implemented ADRC for reference tracking and vibration suppression of a piezoelectric beam, comparing its performance with observer-based state feedback with integral action (OBSFI) and PID controllers for the tracking of sinusoidal and square wave signals. While the vibration suppression experiment demonstrated a significant reduction in settling time, the reduction in the first-cycle peak was not quantified, nor was the effect of the tuning parameter ratio of the observer and controller bandwidths investigated [
35].
The literature review identifies a gap in early suppression capabilities of controllers for the free vibration response, particularly first-cycle peak reduction. Most studies use the release test methodology rather than an impulse with a fixed amplitude and width. However, the vibrations of the collimator jaw are more closely related to the impact of an impulse. ADRC is the only algorithm that seems to deliver attenuation of the first-cycle peak by more than 30%; however, its experimental application needs further exploration, especially considering system uncertainties like delay, noise, and nonlinearities.
In this work, a smart cantilever beam is equipped with a piezo stack actuator for vibration suppression and a laser triangulation sensor for vibration measurement. The main contributions of this work are as follows:
Introduction of the first-cycle peak attenuation as a novel and practical performance metric for evaluating the effectiveness of active vibration controllers under impulsive excitation. While previous studies often rely on RMS reduction, settling time, or frequency domain metrics, these do not capture the critical first-response amplitude, which is especially important in impact-sensitive applications.
Implementing and experimentally validating the FCPA metric using a smart cantilever beam setup with a piezoelectric stack actuator and a laser triangulation sensor. The experimental platform allows for the precise measurement of transient responses, unlike some numerical-only studies in the literature.
Investigating the impact of the actuator–sensor configuration (collocated vs. non-collocated) on ADRC performance. Although collocation effects have been studied in the general control literature, their specific influence on first-cycle peak suppression in piezo-based systems under impulse loads has not been addressed.
Proposing and assessing a new tuning approach for ADRC based on the ratio between control bandwidth and observer bandwidth, denoted as a dimensionless tuning parameter α. Although it is acknowledged in the literature that increasing the controller bandwidth can amplify noise, the extent of this amplification and its impact on system behaviour have not been thoroughly investigated. Furthermore, while a ratio between the observer and controller bandwidths is often recommended, this guideline has not been tested on systems with high sensitivity to sensor noise, such as the one considered in this study.
Model tuning and noise analysis using experimental data, revealing how measurement noise and system delay affect performance and observer behaviour. This adds a practical dimension to ADRC tuning and evaluation, which is often overlooked in simulation-based studies.
The outcome will provide insights into the achievable first-cycle peak response attenuation for a system with a specific delay and signal-to-noise ratio. A PD controller, widely considered the industry standard, is selected for a performance comparison with ADRC. Furthermore, control strategies reviewed, such as LQR and fuzzy logic, utilise output error and its first derivative to generate control efforts in a manner similar to PD control.
2. System Model
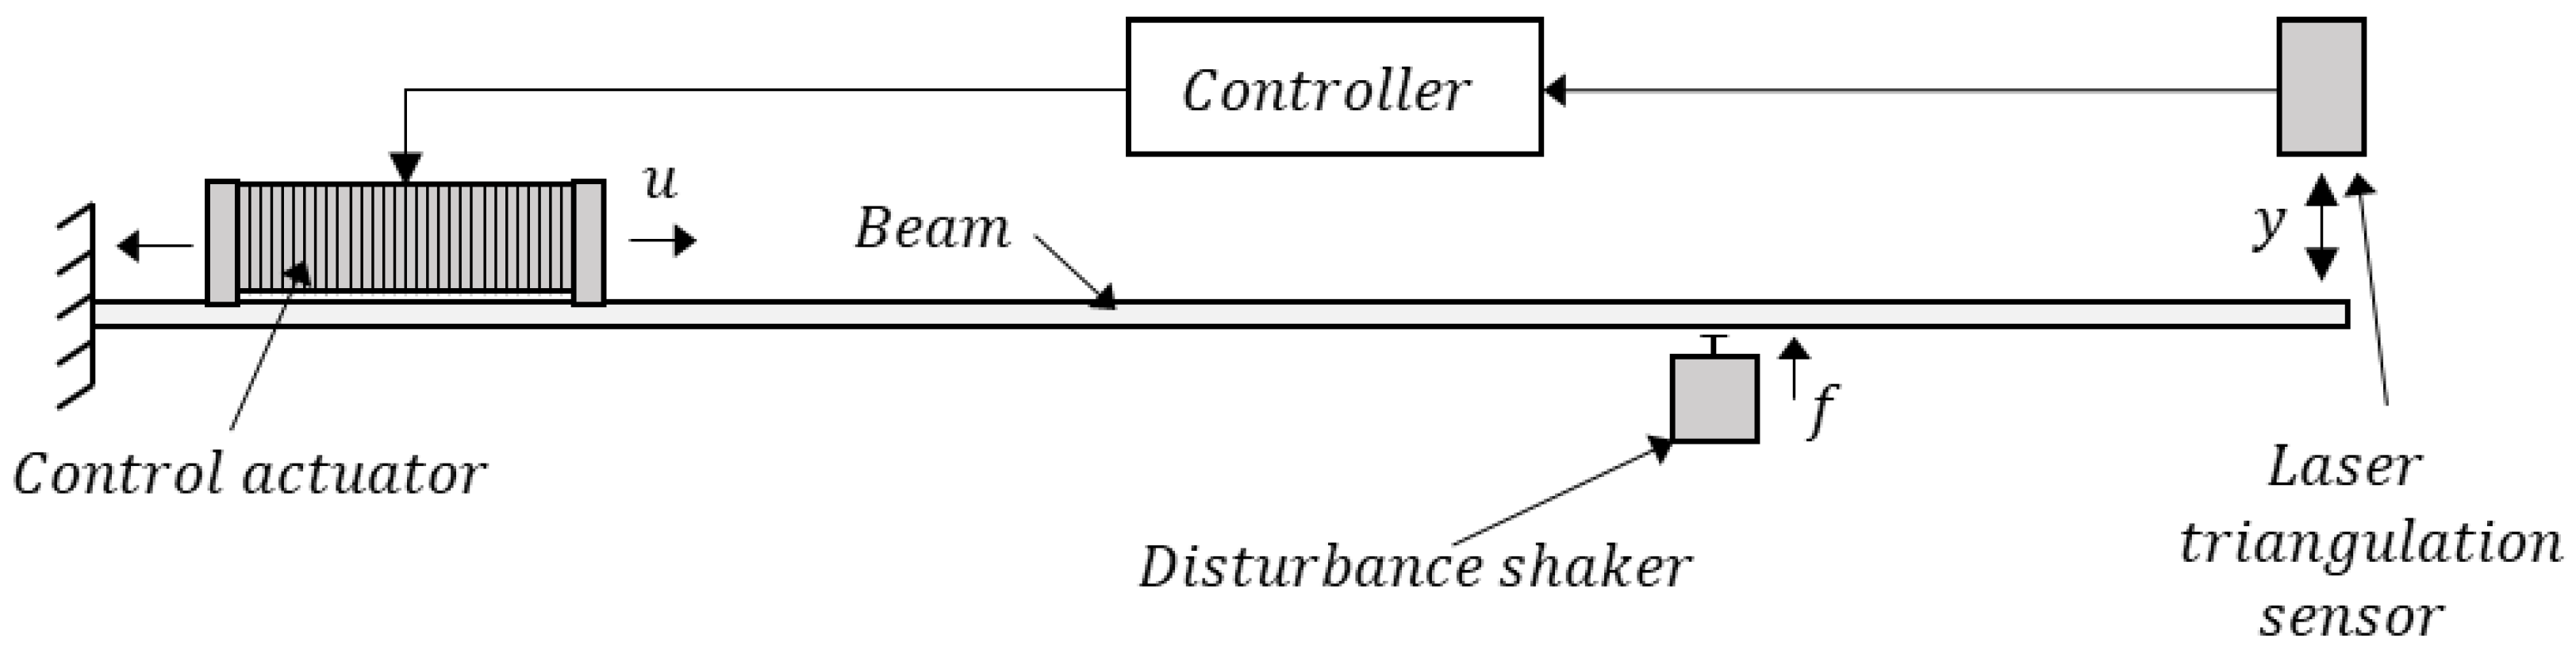
The piezoelectric beam used in this study is illustrated in
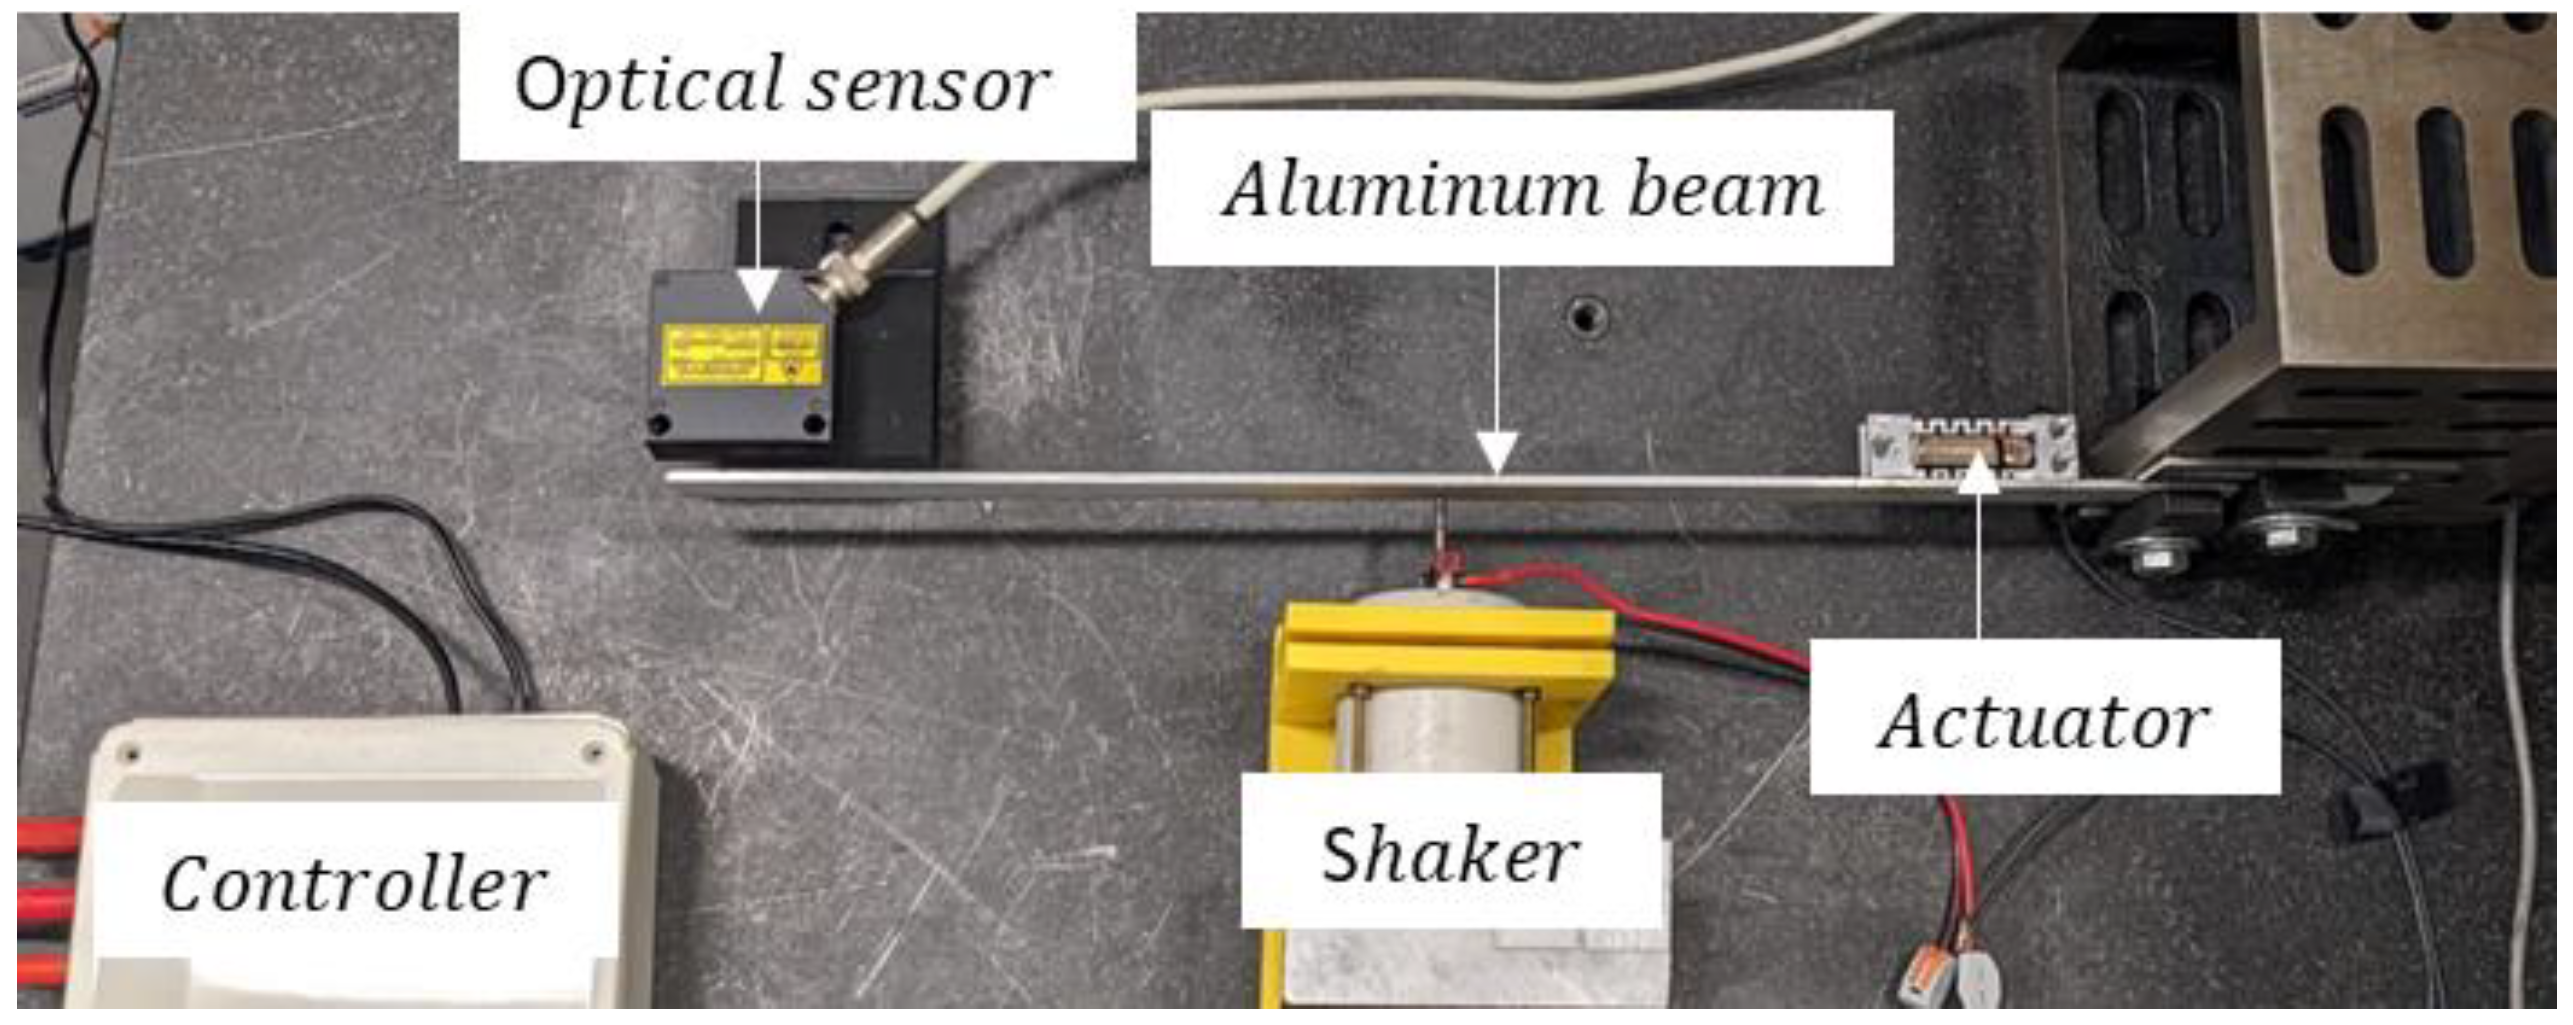
Figure 1. The unidirectional piezoelectric actuator is attached at the root of the cantilever beam through an adapting mechanism. When voltage is applied to the actuator electrodes, the stack actuator expands in the axial direction and induces bending moments via the adapting mechanism. This causes transversal displacement of the beam tip relative to the optical sensor. A shaker is placed beside the beam to generate impulse disturbance.
The system under investigation can be physically modelled as a distributed parameter system governed by the Euler–Bernoulli beam theory. For control design purposes, this is commonly reduced to a finite-degree-of-freedom approximation [
13]. In this study, we adopt a second-order lumped parameter model, capturing the dominant vibration mode. The equation of motion for the reduced-order system is
where
,
, and
k represent the modal mass, damping, and stiffness, respectively,
is the displacement at the tip,
is the disturbance force, and
is the control force applied via the piezo actuator. The system model is described by a linear time-invariant (LTI) second-order state-space system according to
where the state vector
contains the tip displacement and velocity as
The control input
represents the voltage applied to the actuator, which generates a control force at the base of the beam. The disturbance input
represents an external force applied to the beam tip, simulating an impulse excitation. The output
is the measured displacement at the beam tip, obtained from the laser triangulation sensor. Matrices
,
,
and
are the state transition matrix, control input influence matrix, disturbance influence matrix, and output matrix, respectively. The linearised model capturing the dynamics of the beam between actuator voltage and tip displacement can be obtained by experimental means. A chirp signal with a frequency range of 1 Hz to 200 Hz and amplitude of 1 V peak to peak was applied over 300 s to the amplifier which drives the stack actuator. The system frequency response is shown in
Figure 2. The figure shows three resonant frequencies in the frequency range of the test, located at
,
and
. The impulse response of the disturbance from the shaker was recorded to deduce the disturbance model. The MATLAB v23.2 ‘
ssest’ function, which uses a prediction error minimisation algorithm, was utilised to create the system model for the first bending mode in the observer canonical form given in Equation (4).
Although piezoelectric actuators can exhibit nonlinear behaviour such as hysteresis and creep, these effects are negligible in this case due to the use of low voltage excitation and the short-duration impulse nature of the disturbance. Hence, a linear time-invariant (LTI) model is considered sufficient to capture the dominant dynamics of the beam. Furthermore, nonlinear effects and unmodeled dynamics are treated as part of the lumped disturbance, for which the ADRC strategy is designed to estimate and compensate.
4. Experiment
The proposed ADRC was implemented on the piezoelectric smart beam to demonstrate its FCPA control capability. Testing was performed for the non-collocated and collocated disturbance and sensor configurations using different tuning parameters to establish the peak attenuation, delay, and noise amplification due to changing tuning parameters. In the non-collocated configuration, the shaker is placed at a random point between the actuator and the sensor, while in the collocated configuration, the shaker is placed directly opposite the sensor.
4.1. Experimental Setup
The smart beam, constructed from aluminium alloy (Young’s modulus:
, density:
), featured a piezoelectric stack-type actuator (Physik Instrumente, GmbH, model P-888.91) capable of generating a blocking force of 3800 N within a 0 to 100 V range. Actuators were controlled using a BCP303 Thorlabs amplifier with adjustable gain settings (7.5, 10, and 15). Beam tip deflection was non-contact measured via a Riftek RF603 laser triangulation sensor, providing a 0–10 V analogue signal indicative of deflection. Control algorithms were implemented using a Texas Instruments F28379D development board and MATLAB/Simulink. Signal conditioning circuits were designed to scale signals within the 0–3 V input–output range of the controller. Data acquisition utilised National Instruments hardware and software. Tip disturbance was induced by a simple electromagnetic shaker, driven by a pulse signal from a function generator.
Figure 6 depicts the assembled setup.
The presence of noise, delay, and nonlinearities can introduce significant deviations between experimental results and simulation outcomes, in terms of peak attenuation and system stability. The analogue-to-digital converter (ADC) of the control card contributes to noise, leading to spurious system outputs. Consequently, the response of the controller to this artificial disturbance inadvertently disrupts system behaviour. In controllers with high gain, this disturbance becomes pronounced, triggering free vibration. Attempts by the controller to mitigate this disturbance subsequently lead to spillover, manifesting as excitation of higher modes of vibration. While the system may remain marginally stable during spillover, damping of free vibration of the first mode is still achievable. However, in certain instances, amplification of the first-cycle peak occurs.
Figure 7 illustrates the contribution of ADC noise for varying sampling frequencies. Notably, while noise peaks occur at similar levels (approximately 0.1 V max) across different sampling frequencies, higher sampling frequencies exhibit more frequent spikes and a larger noise floor. Consequently, a sampling frequency of 1 kHz emerges as the optimal choice due to its superior performance in minimising the occurrence of spikes.
However, sampling at 1 kHz introduces a delay of 1 μs, which is a trade-off for reduced noise. Despite this sampling delay, it is considered a favourable compromise due to the significant noise reduction achieved. Furthermore, the overall delay within the system is compounded by delays arising from the actuator response and nonlinearities. These delays collectively contribute to the system response time, which is determined through an analysis of experimental results.
4.2. PD Controller vs. ADRC
In this part, the experimental results of non-collocated disturbance and the sensor PD controller and ADRC are presented and analysed. The control experiments were conducted with identical tuning parameters as those used in the simulations.
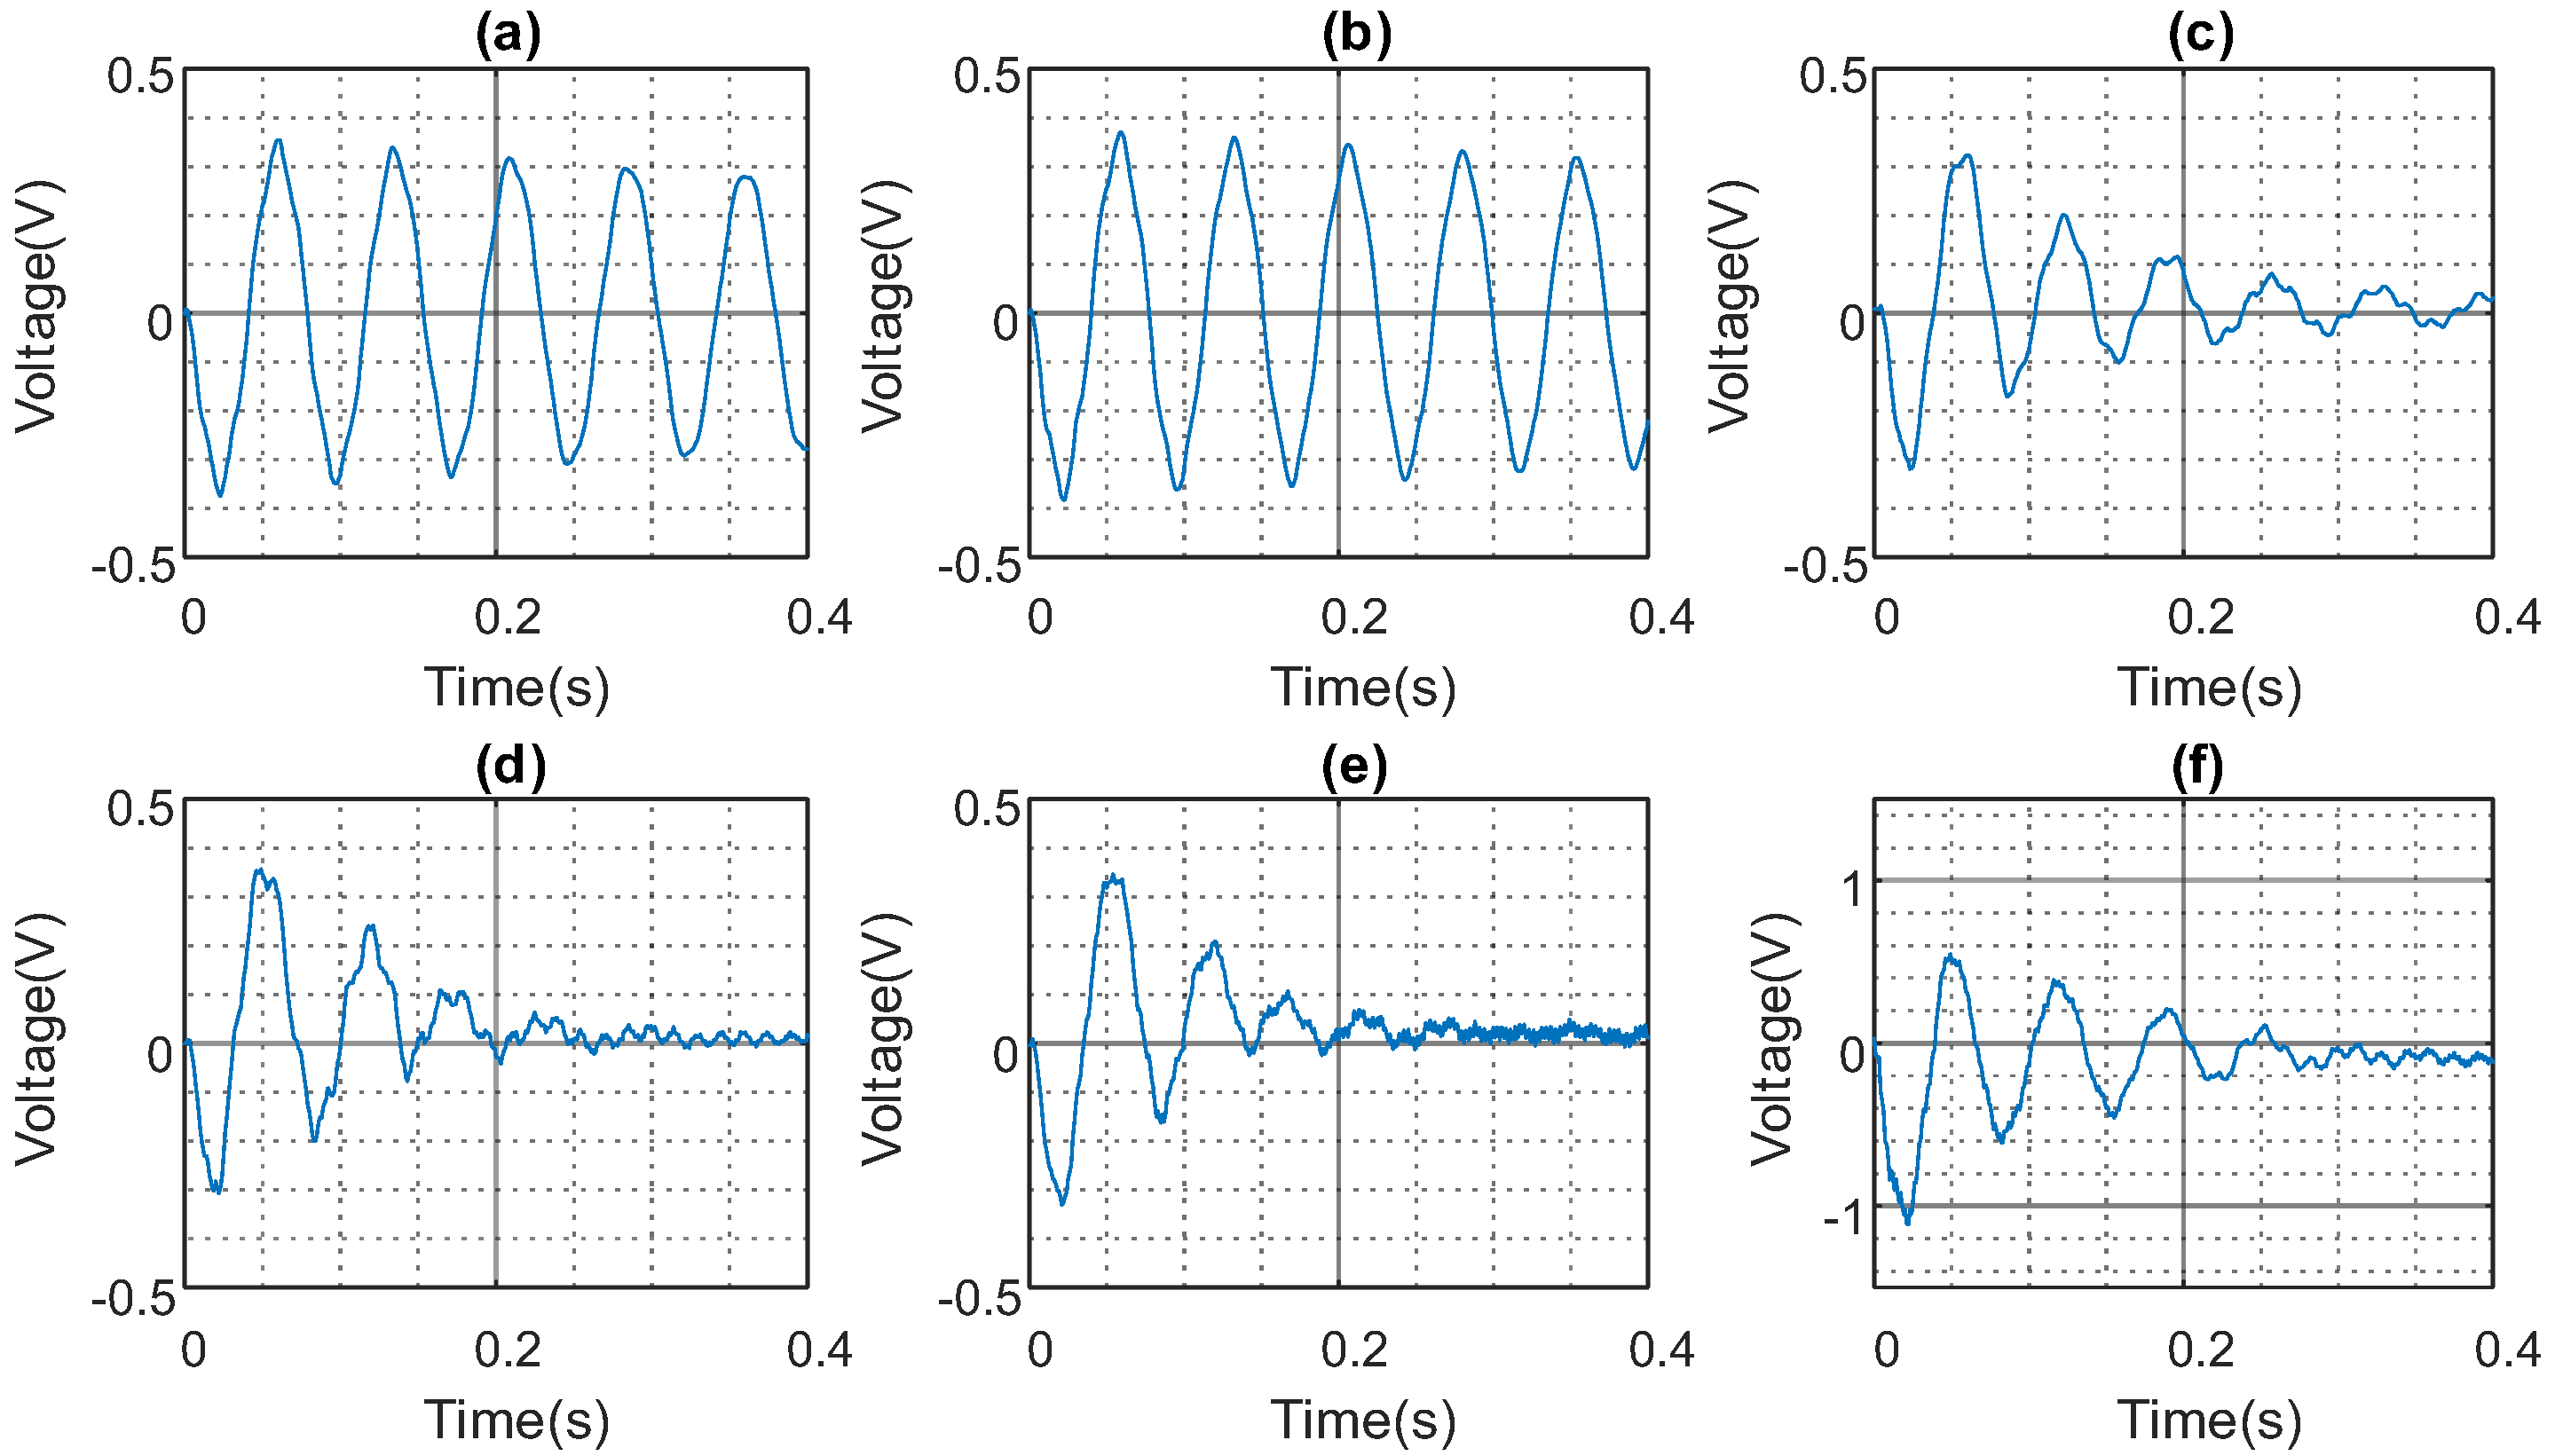
The results presented in
Figure 8 and
Figure 9, and summarised in
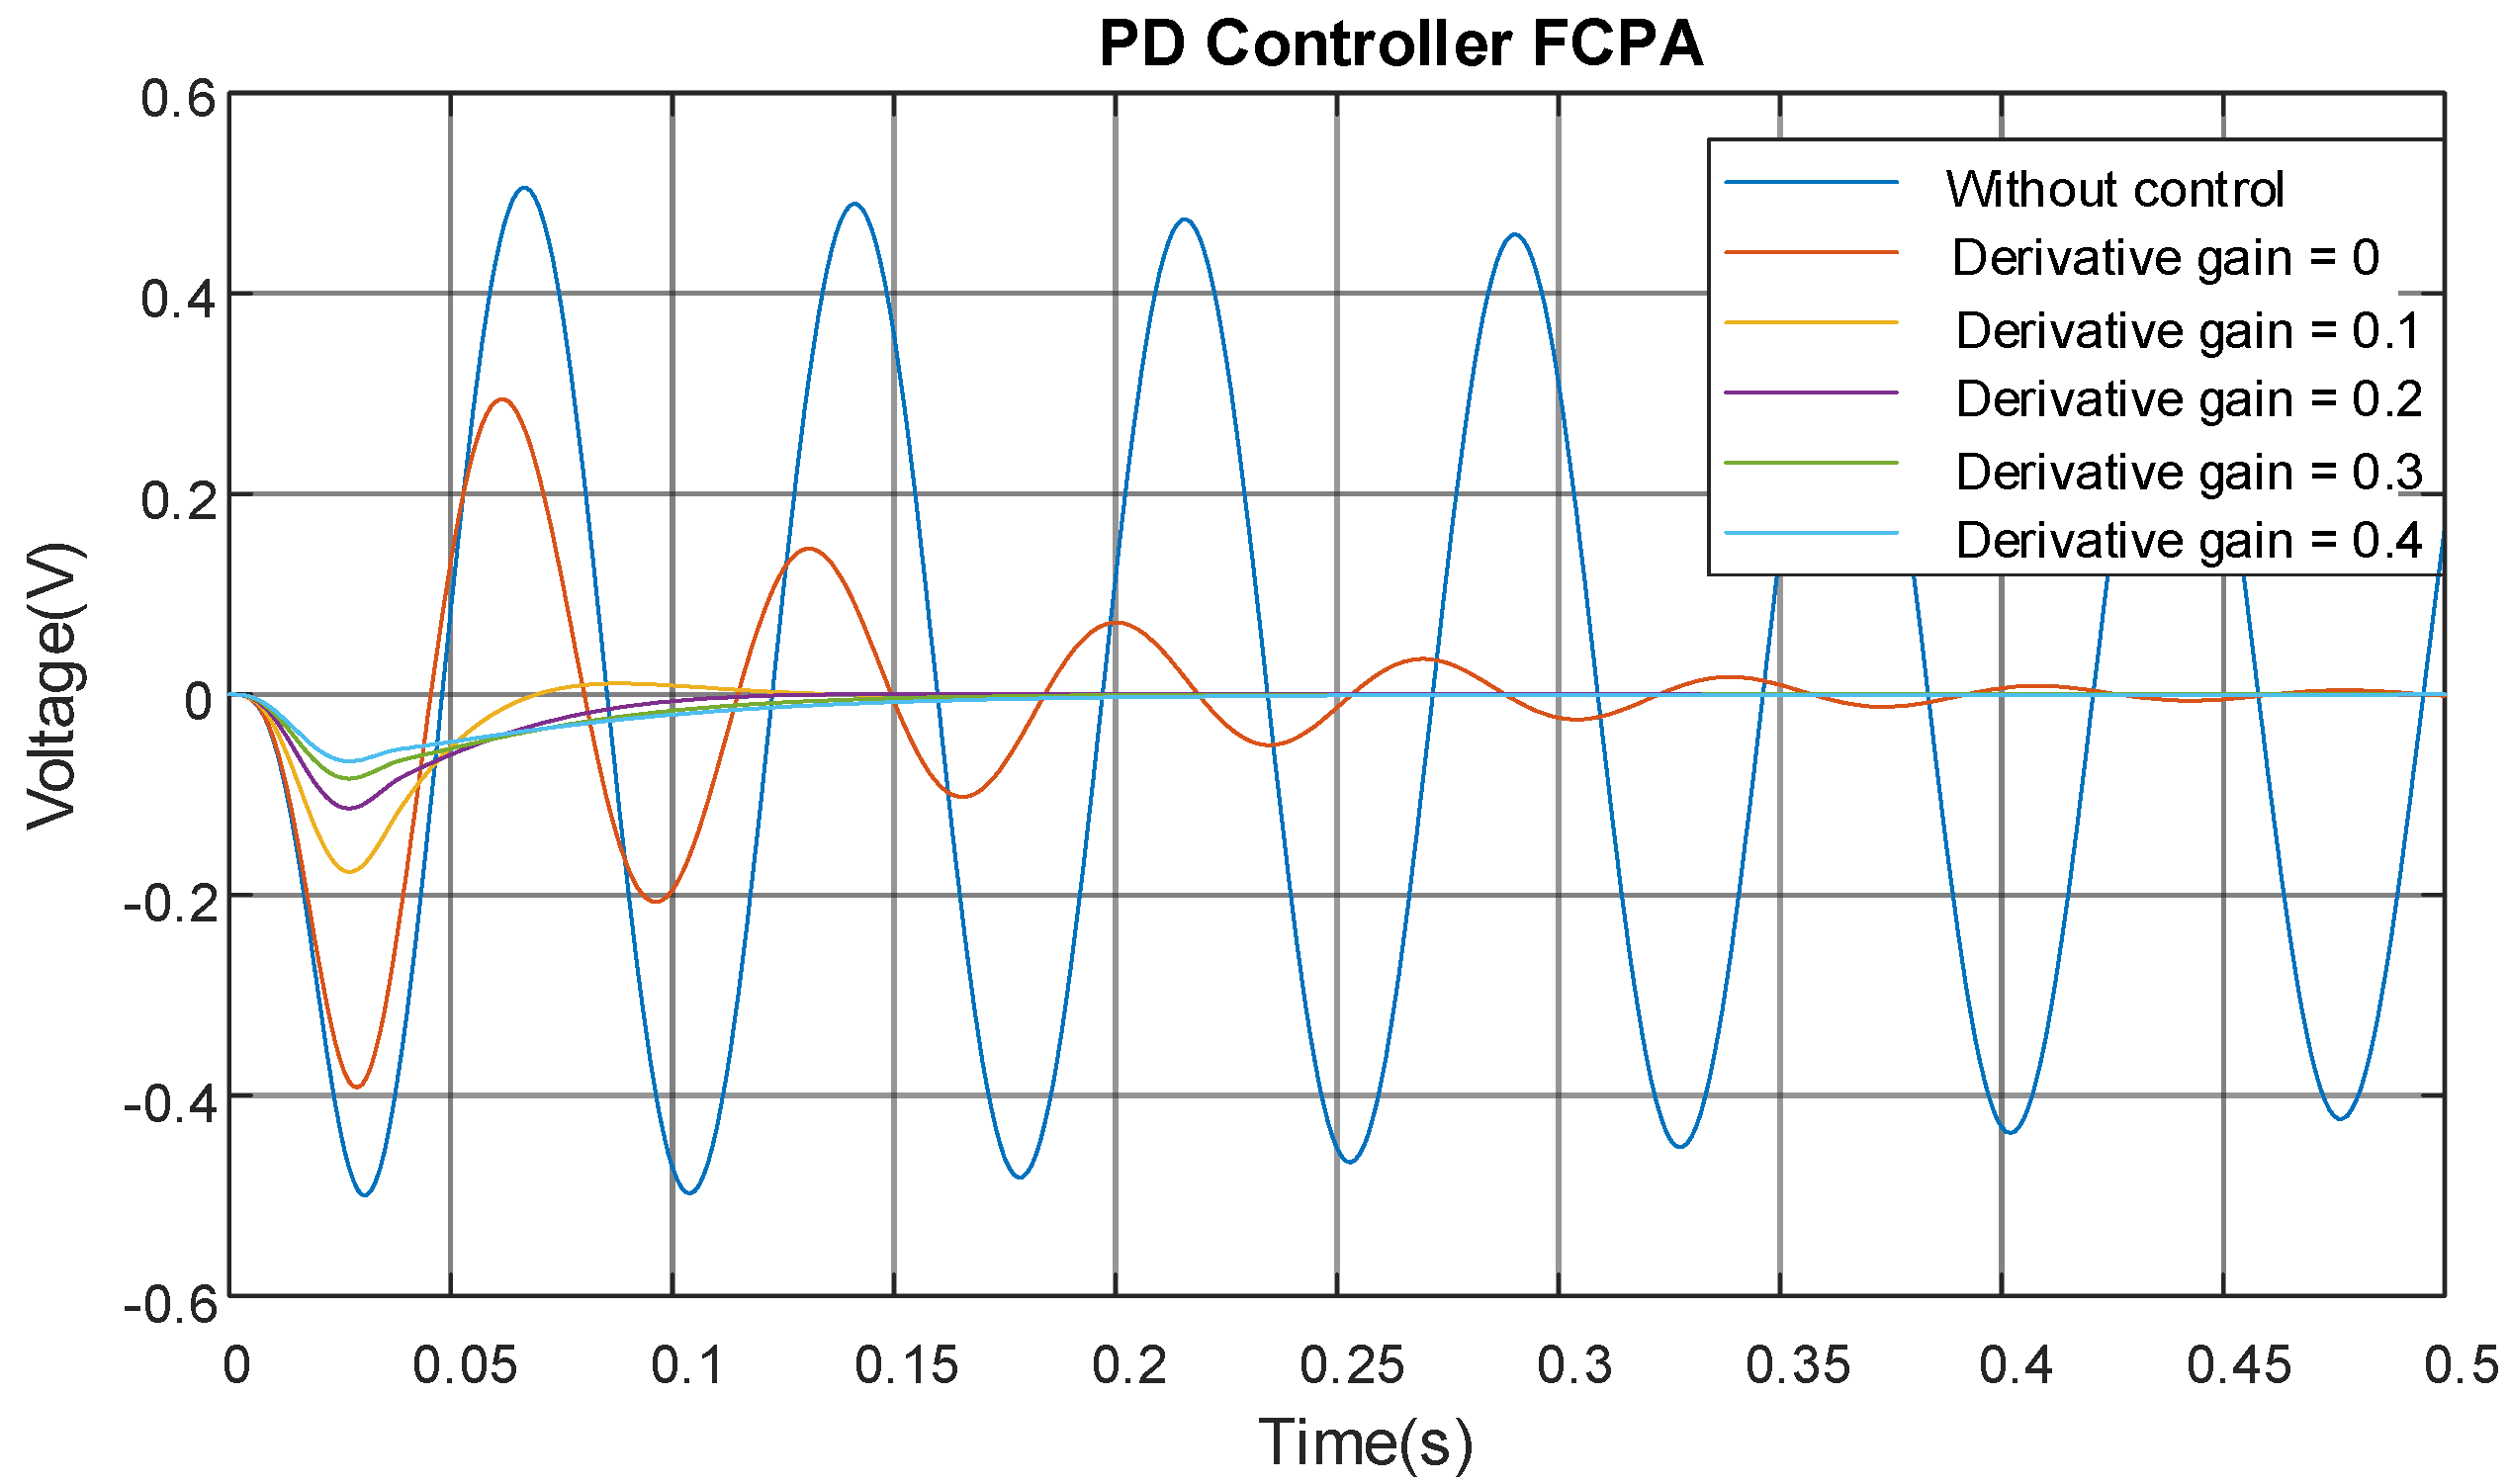
Table 2, show the FCPA for the experimental beam. The PD controller achieves a maximum attenuation of 18.1% before the system experiences spillover, which occurs due to an increase in the derivative gain. The spillover excitation frequency observed was 340 Hz, higher than the third mode of vibration.
With a derivative gain of 0.3, the vibration amplitude was 0.16 V, though an FCPA of 11.7% was achieved. The derivative gain of 0.4 resulted in a vibration amplitude of 0.2 V and amplification of the first-cycle peak by 200%, according to
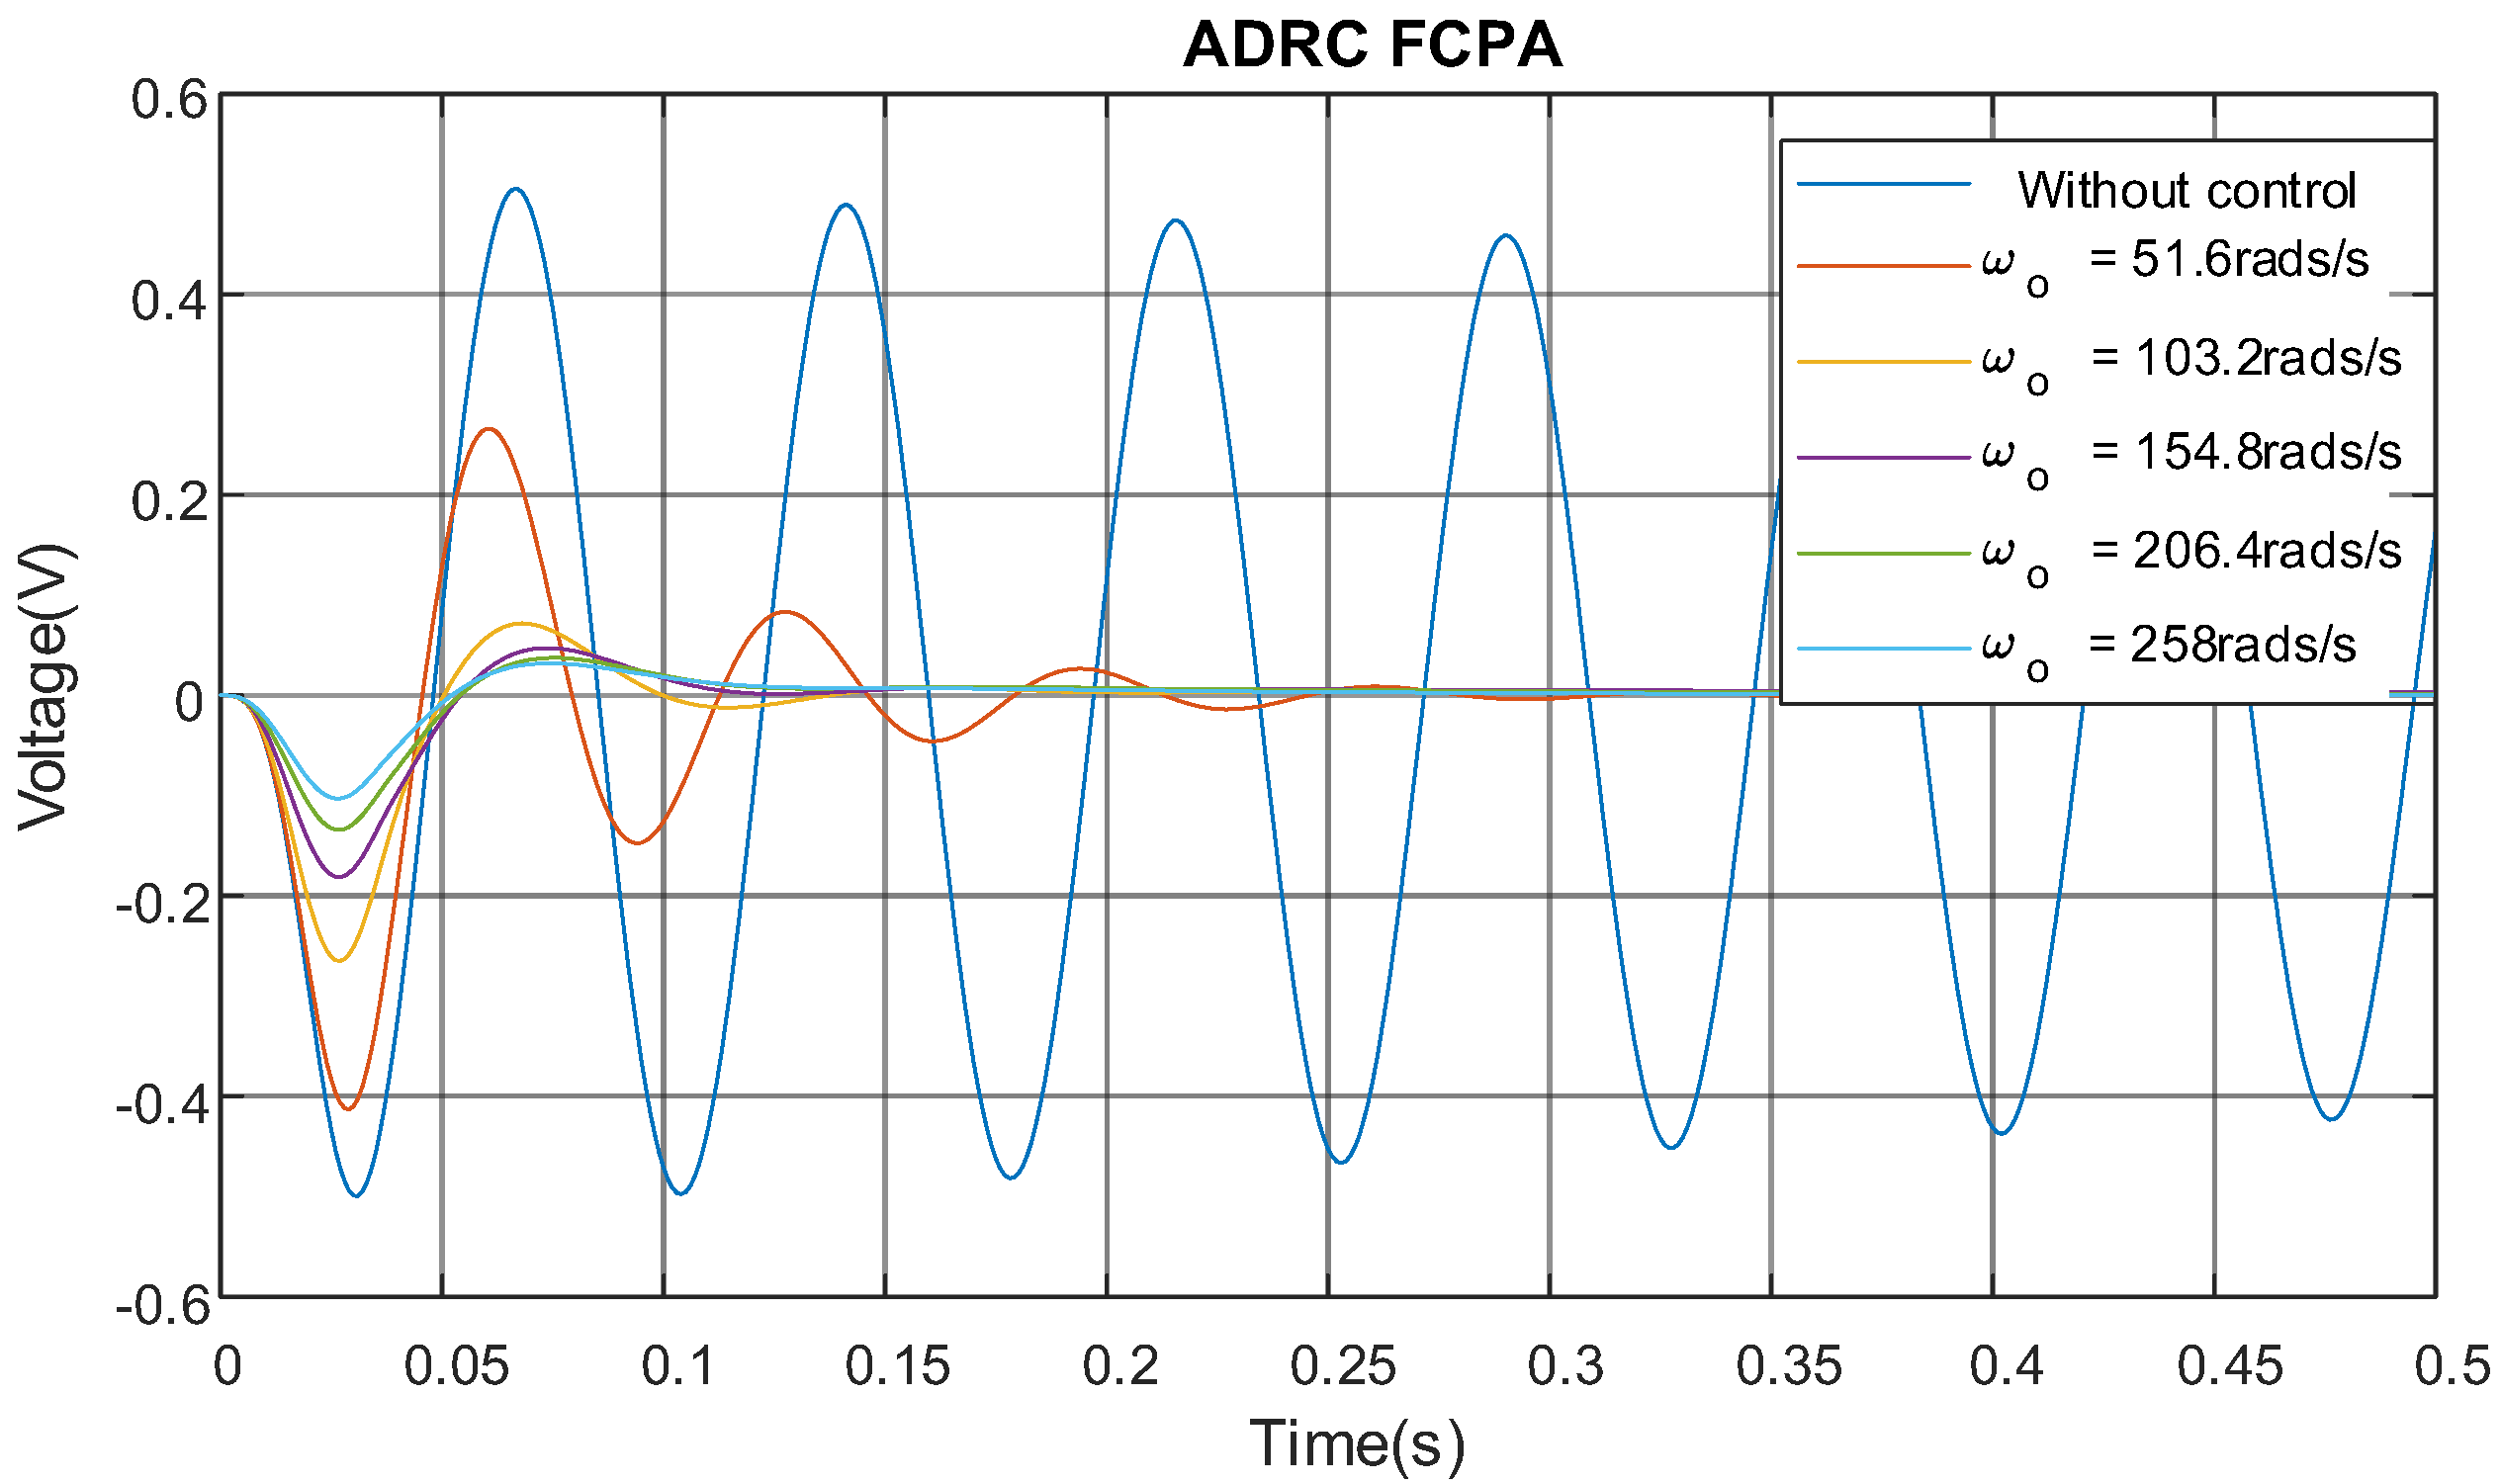
Figure 8f. In contrast, the ADRC achieved up to 30% FCPA when the observer bandwidth was set at 258 rad/s and the controller bandwidth at 43.03 rad/s.
4.3. Collocated Disturbance and Sensor ADRC
Control experiments were conducted repeatedly using the collocated sensor and disturbance configuration, with a varying ADRC tuning parameter . Multiple experiments with different settings and observer bandwidth values were performed to gather data for a parameter sensitivity analysis. This analysis involved systematically tuning the simulation model to better match experimental observations. By iteratively adjusting the delay in the simulation, the control effort was aligned with the experimental results, leading to a more accurate system characterisation.
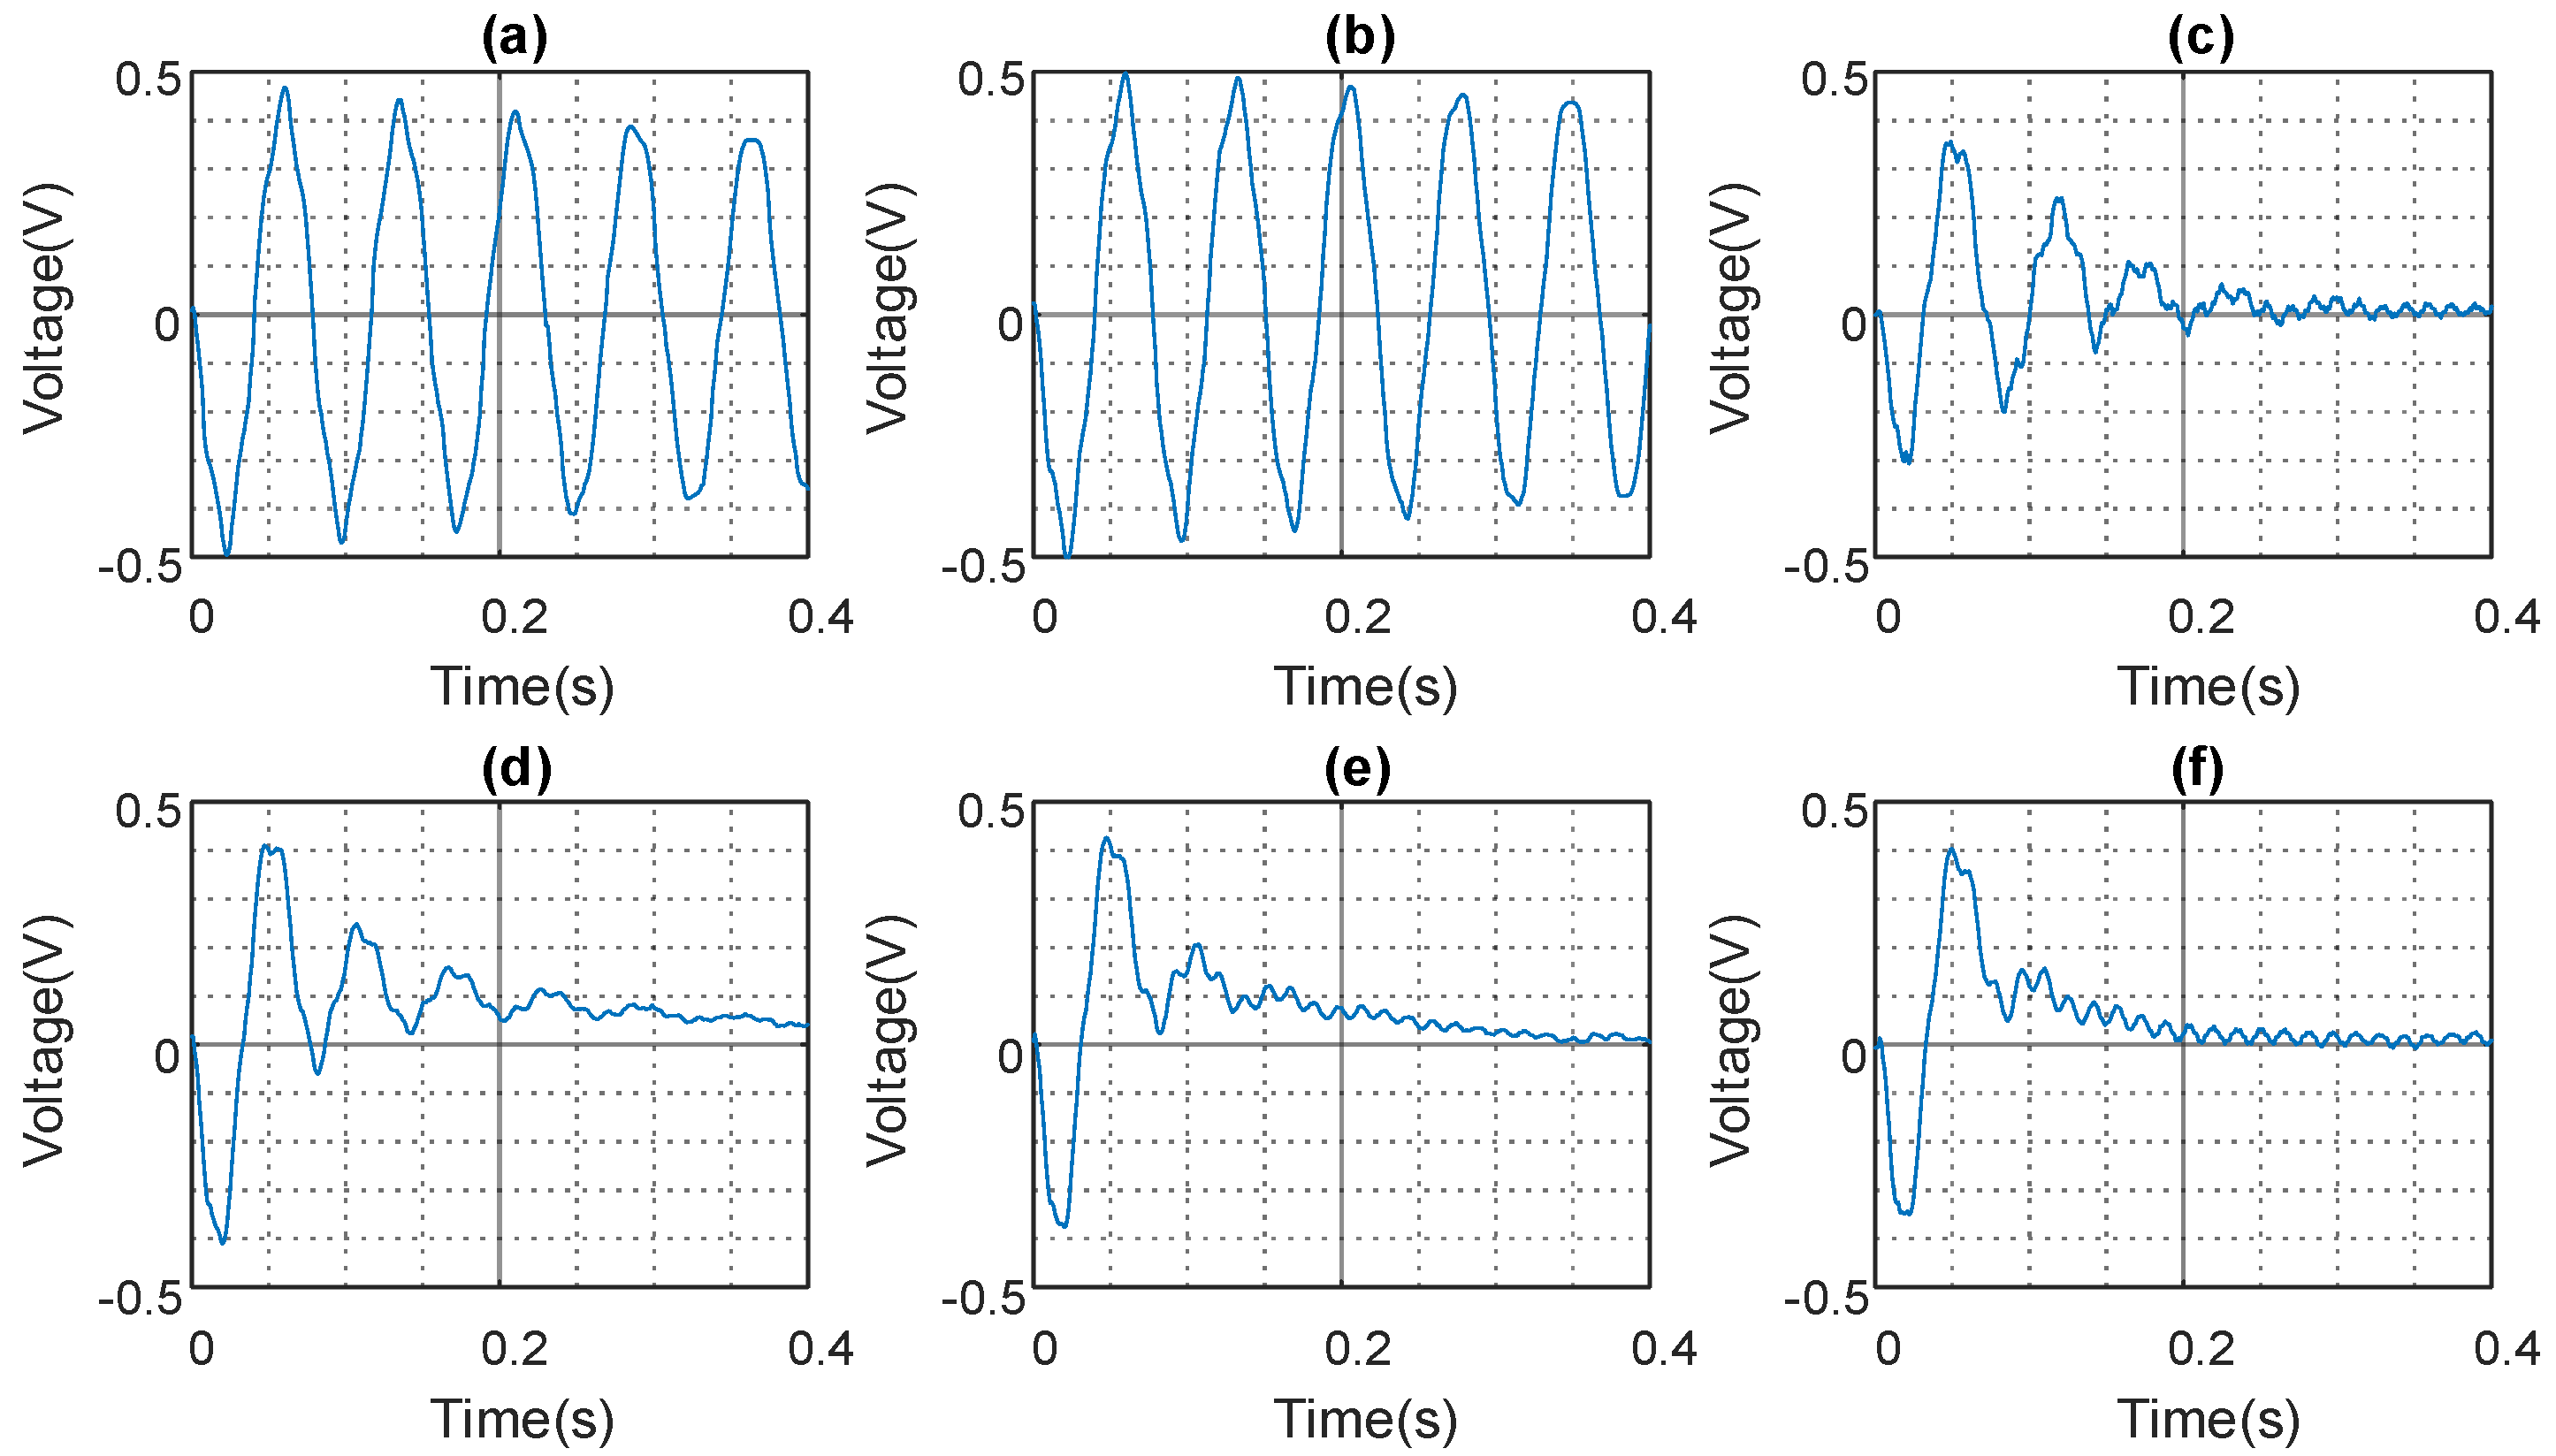
The results presented in
Figure 10,
Figure 11 and
Figure 12, and summarised in
Table 3, show the FCPA for the experimental beam using the collocated disturbance and sensor configuration. The maximum FCPA achieved for the cases with
,
, and
ranges from 44.8% to 48.4%.
An observer bandwidth of 344 rad/s resulted in a spillover vibration amplitude of 0.28 V and first-cycle peak amplification of 56%, as observed in
Figure 12e. An observer bandwidth of 430.3 rad/s resulted in a vibration amplitude of 0.7 V and amplification of the first-cycle peak by 150%, according to
Figure 12f.
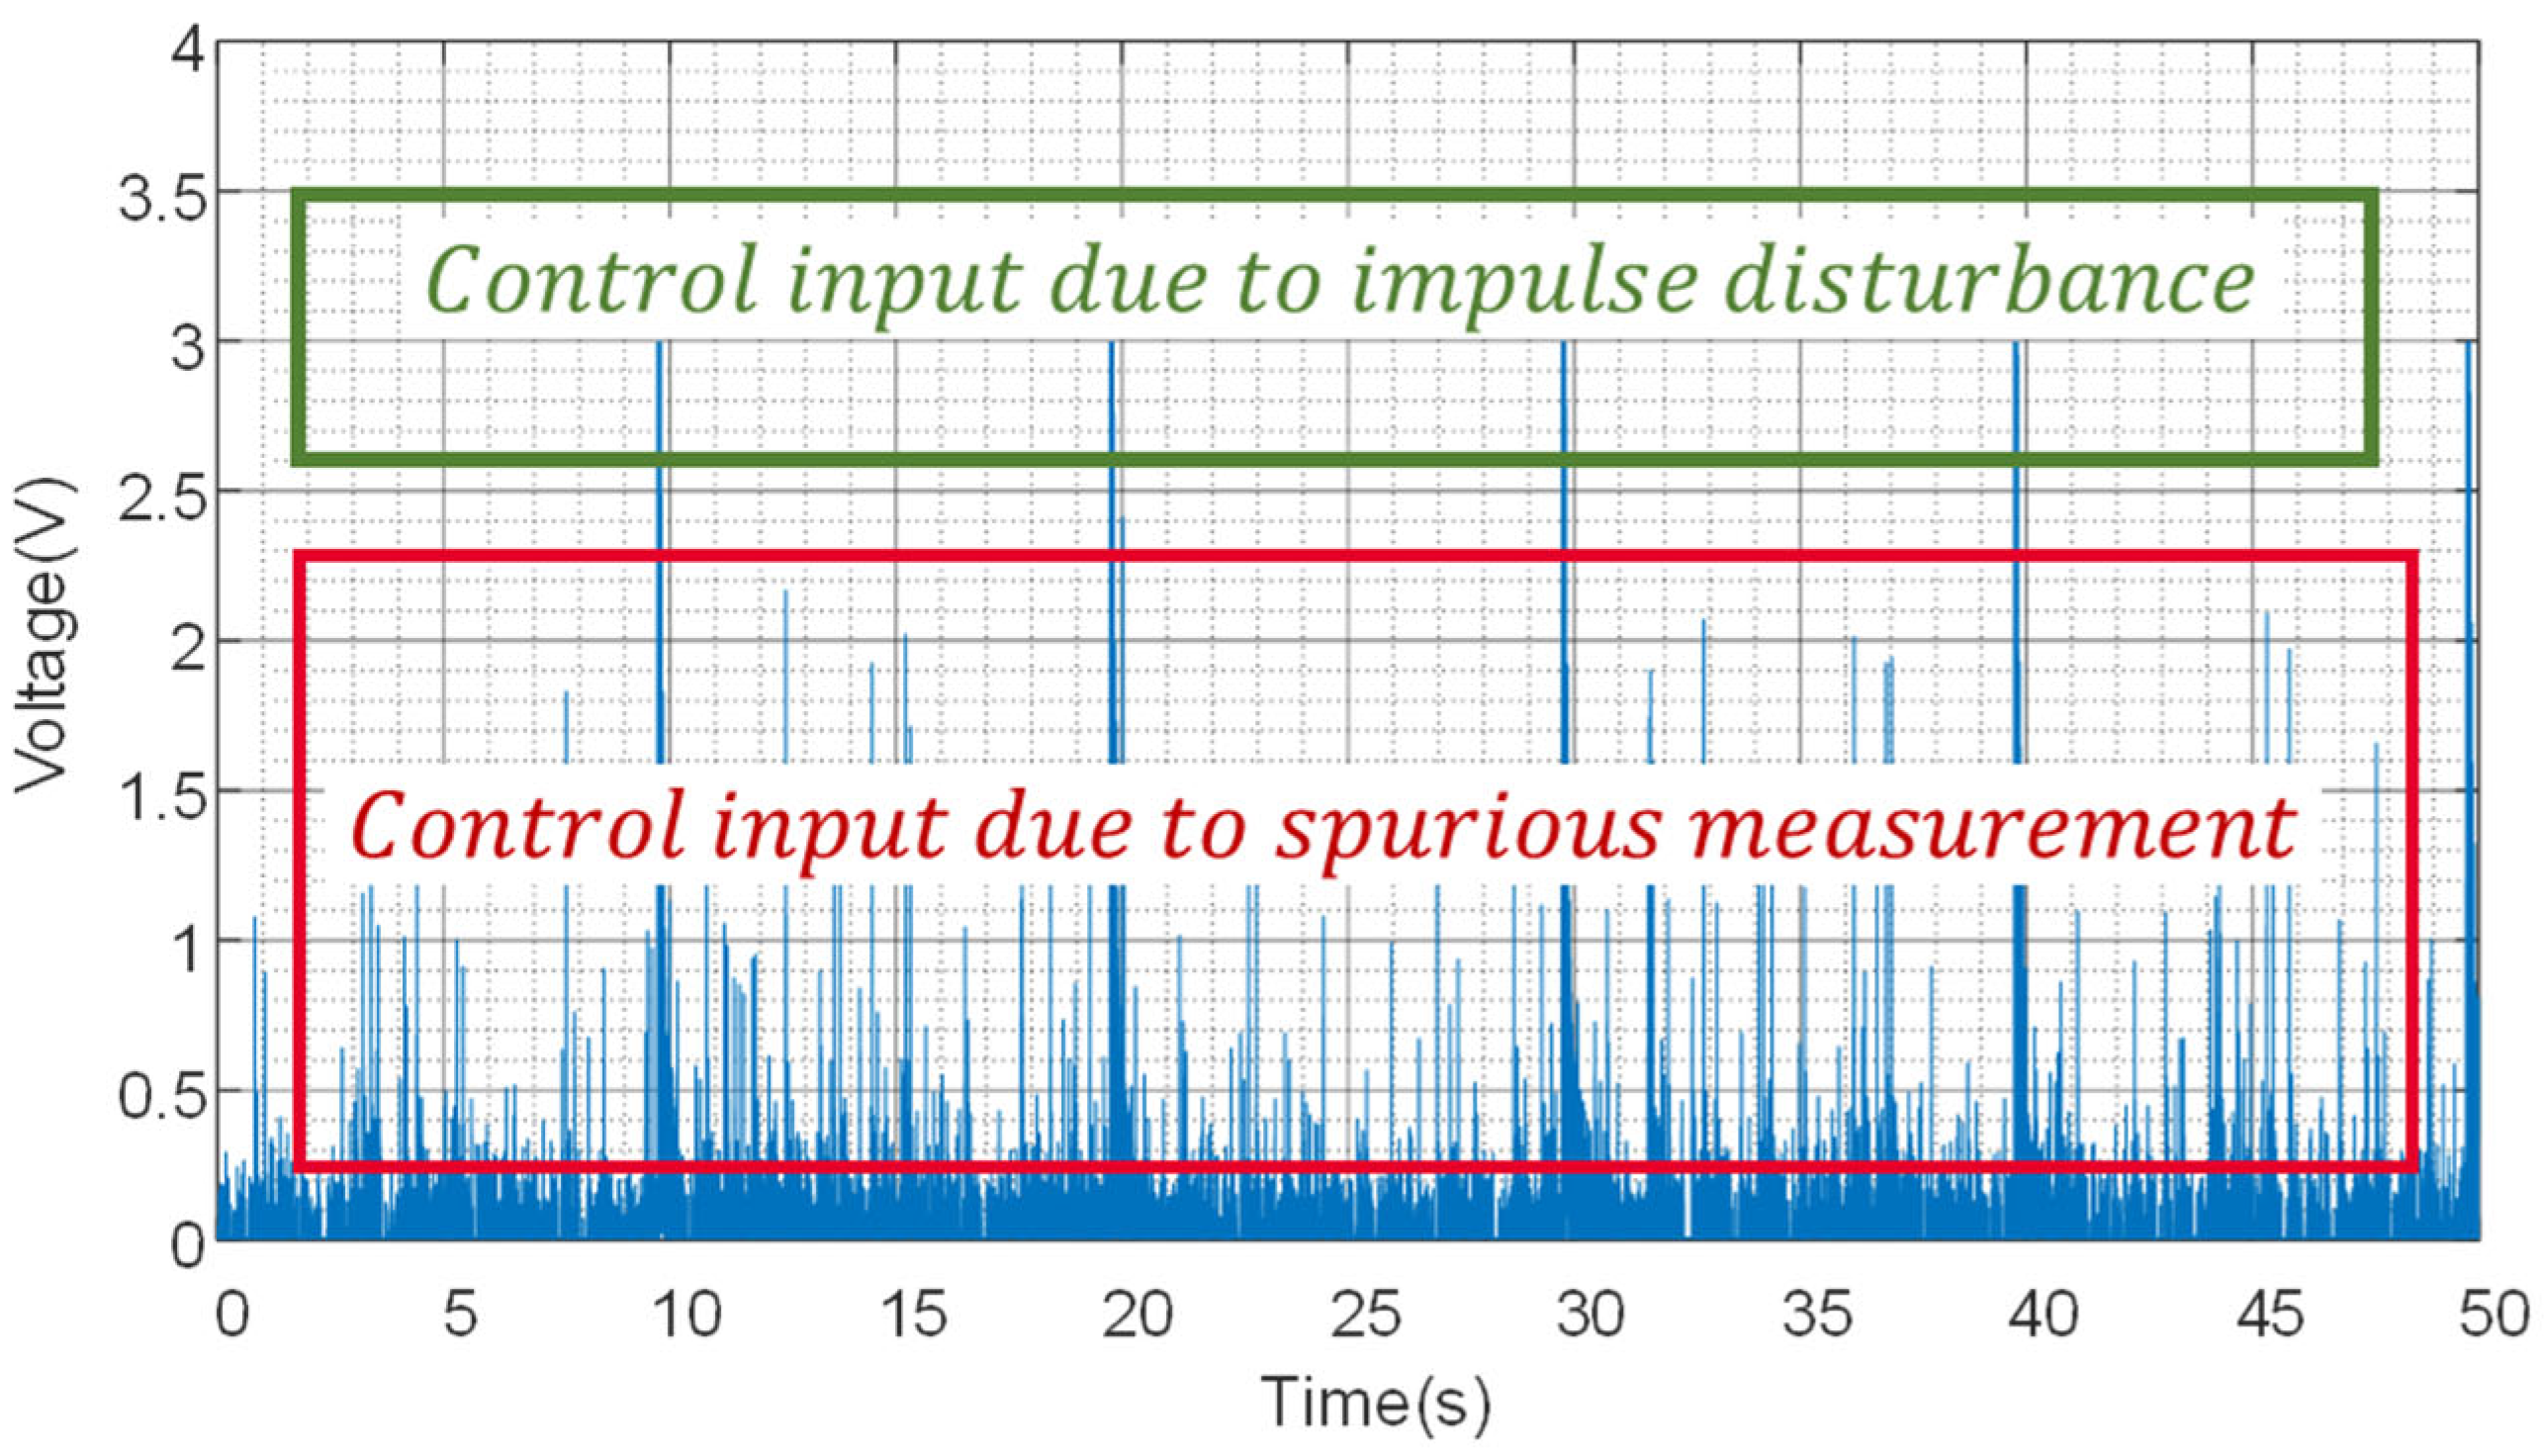
The profile of the control input signal which drives the actuator is shown in
Figure 13. It is observed that the control input is a combination of the intended response to the impulse disturbance and a spurious response due to sensor noise, which is amplified based on the
value. When these high-amplitude responses occur in succession, they combine with the system delay to cause spillover.
Figure 14 shows the noise amplification that results from FCPA across different controller gain settings. An analysis of the noise amplification in PID and non-collocated and collocated ADRCs reveals that the non-collocated ADRC achieved 12% more FCPA than the PID controller and the collocated ADRC achieved 18% more FCPA than the non-collocated ADRC. To investigate the recommended
/
ratio of between three and ten, the observer bandwidth
was held at its optimal value of
, while
was varied to extract the control signal. The results are shown in
Figure 15. Due to the 3 V control card saturation limit, it was not possible to deduce the mathematical relationship between
and noise amplification. However, as this is an introductory investigation into the effect of this ratio, the results provide a springboard for further research.
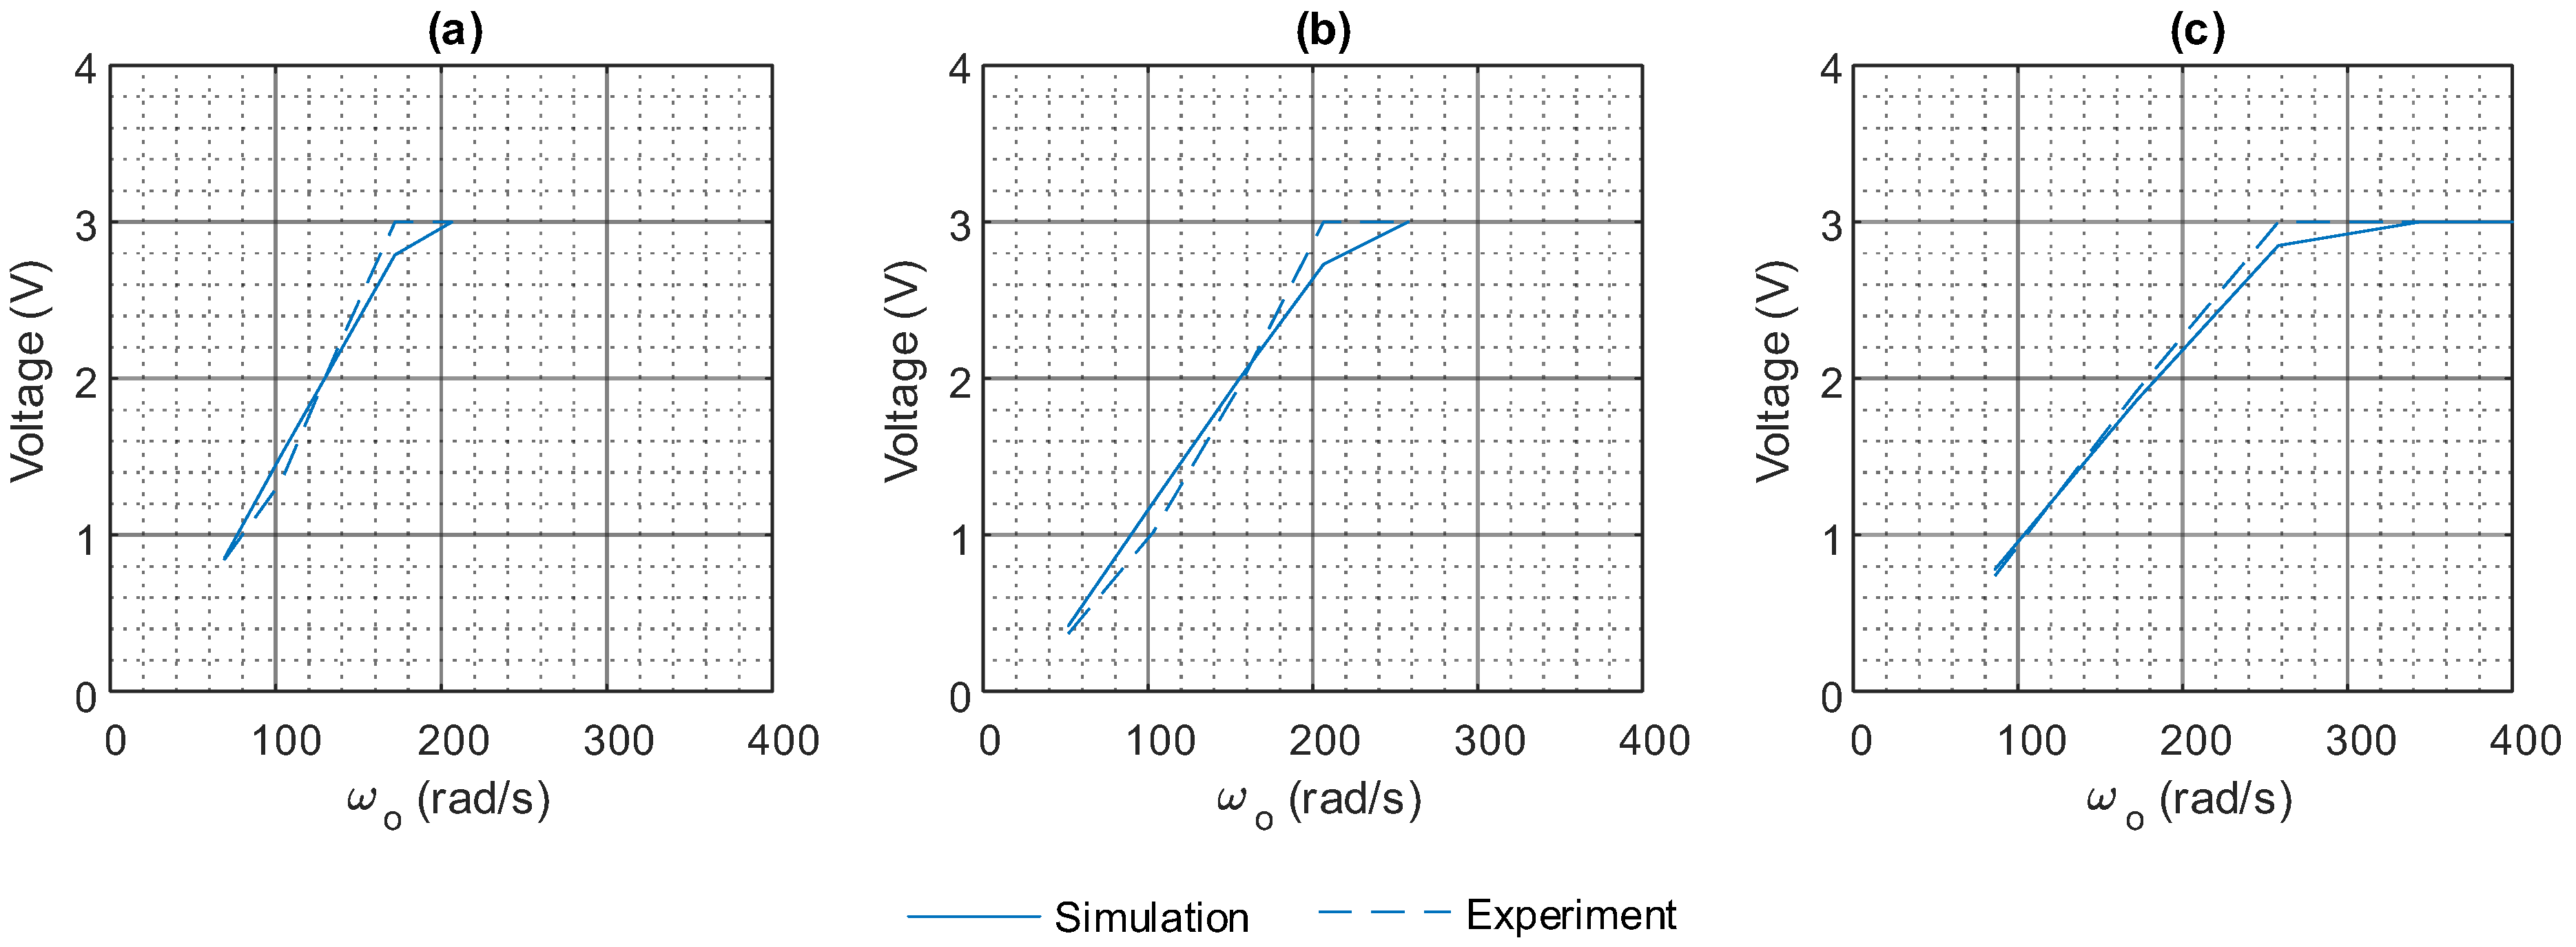
The graphs in
Figure 16 present the results of the sensitivity analysis conducted to determine the system delay that affects the achieved FCPA for the experimental collocated disturbance and sensor beam. In addition to the sampling delay, other delays such as the output delay caused by energy transfer through the adapting mechanism of the actuator are expected. The sensitivity analysis indicated that a 10
delay was necessary to produce an initial peak in the control effort in simulation that matches the experimental results.
High
values also result in controller effort peaks that exceed the 3 V limit allowable by the control card. According to
Table 3 and
Figure 16, when
, the control input peak is saturated for
. Similarly, when
, the control input peak is saturated for
, and when
, the control input peak is saturated for
. It is observed that for higher
configurations, larger
values are achieved before control input saturation, and this highlights the impact of the choice of
on control signal amplification.
4.4. Noise Amplification
To investigate the effect of
on noise amplification, experiments were conducted with
fixed at 258 rad/s which has been determined to be the spillover limit of the controller. The
values are set at 2, 4, 6, 8, and 10 in line with the 3–10 times recommendation given in [
28].
Figure 14 presents the results of these tests. The findings show that for
= 2, the control signal has a low noise floor with more frequent and higher-amplitude spikes, several reaching the control card maximum of 3 V. In contrast, the
= 10 case results in a control signal with a higher noise floor of up to 0.5 V but with less frequent and lower-amplitude ADC noise spikes reaching up to 2 V.
The control signal reflects the plant output fed to the controller. As shown in
Figure 17, the sensor signal can reach approximately 0.1 V. Therefore, with the controller output of the
= 10 case reaching an amplitude of 2 V, the noise in the system is effectively amplified by a factor of 20. Similarly, with the controller output of the
= 2 case reaching an amplitude of 3 V, the noise is amplified by a factor of 30. Despite this noise amplification, there was no significant effect on the excitation of the beam, as the beam did not experience spillover even at a high controller bandwidth, and the FCPA remained at an average of 46.5%.


