Article

Dispersion and Explosion Characteristics of Hydrogen Released from a Hydrogen Fuel Cell Vehicle
1
Institute of Thermal Science and Technology (Institute for Advanced Technology), Shandong University, Jinan 250061, China
2
Dalian Boiler and Pressure Vessel Inspection & Testing Institute Co., Ltd., Dalian 116012, China
3
SINOPEC Research Institute of Safety Engineering Co., Ltd., Qingdao 266100, China
4
Guangdong Provincial Key Laboratory of Clean Automotive Propulsion and Energy Application Technology, Guangzhou Automobile Group Co., Ltd., Guangzhou 511434, China
*
Author to whom correspondence should be addressed.
Fire 2026, 9(7), 300; https://doi.org/10.3390/fire9070300
Submission received: 3 June 2026 / Revised: 12 July 2026 / Accepted: 13 July 2026 / Published: 15 July 2026
(This article belongs to the Special Issue Assessment and Mitigation of Hydrogen-Fuelled Fire Hazards)

Abstract

Safety concerns regarding hydrogen dispersion, fire, and explosion hinder the commercialization of hydrogen fuel cell vehicles (HFCVs). This study developed and validated a numerical model for hydrogen leakage, dispersion, and explosion in representative accident scenarios using real-vehicle experimental data from a manufacturer-provided HFCV. The analysis examined the effects of leakage orifice diameter, leakage orientation, vehicle motion, and ignition timing on hazard evolution. Large-orifice leakage accelerates flammable cloud formation and expands the hazard range, whereas small-orifice leakage prolongs cloud persistence. Vehicle motion enhances turbulent mixing and reduces near-field accumulation. Immediate ignition produces a jet flame with a maximum radiative heat-flux impact distance of 44.1 m, whereas delayed ignition increases explosion severity and generates a peak overpressure of 0.14 bar. These findings support the risk assessment and safety design of HFCVs.

1. Introduction

In the context of global carbon-neutrality goals, hydrogen energy is widely regarded as a key pathway for the energy transition, because of its high gravimetric energy density and zero-carbon emissions at the point of use [1]. Hydrogen fuel cell vehicles (HFCVs) have gained increasing attention in recent years and represent an important application of hydrogen energy [2,3]. Onboard hydrogen storage systems predominantly rely on high-pressure hydrogen storage technologies. Electrical devices and high-voltage components within the vehicle may act as potential ignition sources [4]. In conditions such as collisions, component aging, or connection failures, released hydrogen may rapidly disperse and form flammable mixtures, posing risks to vehicle integrity, occupants, and nearby surroundings [5]. Therefore, a comprehensive understanding of hydrogen dispersion and subsequent fire or explosion behavior is essential for risk assessment and the large-scale commercialization of HFCVs.
Hydrogen leakage in HFCVs may occur at storage cylinders, valves, pipeline connections, and thermal pressure relief devices (TPRDs) [6]. Hydrogen leakage typically forms a high-pressure under-expanded jet, with flow characteristics strongly affected by leakage diameter, storage pressure, and release orientation. Existing studies have investigated hydrogen dispersion and safety risks in typical application scenarios, such as highways, parking garages, and tunnels [7,8,9,10]. For example, Merilo et al. investigated hydrogen dispersion in a single-vehicle garage and evaluated the effectiveness of ventilation in reducing hydrogen concentration [11]. Scaled experiments and numerical simulations have also been widely used to examine the effects of leakage location, leakage orientation, ventilation, and surrounding obstacles on hydrogen dispersion [12,13]. Experimental studies provide essential data for model development and validation, while numerical simulations enable detailed analysis of dispersion processes in complex scenarios [14,15,16,17]. However, many existing studies mainly focus on external environmental conditions, while the effect of vehicle structures on hydrogen leakage and dispersion remains insufficiently investigated [18,19,20]. In real HFCVs, the chassis, underbody components, local cavities, pipelines, and vehicle body can significantly affect hydrogen accumulation, dilution, and transport pathways. Therefore, leakage behavior around a real vehicle cannot be fully represented by simplified release scenarios or idealized geometries.
Early studies on the combustion behavior of HFCVs relied on simplified models due to the high cost and difficulty of full-scale experiments. For instance, Xiang et al. investigated local components of an onboard hydrogen storage system and reported delayed hydrogen release and a limited release rate during TPRD activation. Under continuous heating, significant deformation of the release pipeline was also observed [21]. Although such component-level studies provide valuable insights into hydrogen release behavior, they cannot fully represent the complex operating conditions of complete hydrogen fuel cell vehicles. Currently, only a few studies have involved real vehicles [22,23,24,25]. Tamura et al. conducted a full-scale emergency hydrogen release experiment using an entire vehicle, providing valuable qualitative observations of fire propagation behavior. The results indicated that flames originating from burning vehicle materials were more likely to ignite neighboring vehicles than the TPRD jet flame itself. Nevertheless, the study did not quantitatively evaluate the hazard range, which limits its applicability for establishing clear isolation distance criteria [23]. Numerical simulations have further enabled detailed analysis of explosion behavior and accident consequences of HFCVs in underground garages, bus scenarios, and parking environments [26,27,28]. These studies revealed the influence of leakage orientation, vehicle arrangement, and rapid pressure rise on risk distribution. They also indicated that thermal radiation may dominate the hazard range compared with overpressure in certain immediate-ignition scenarios [29]. Although the influence ranges of thermal radiation and overpressure have been systematically examined, how ignition timing governs the transition in accident consequences remains unclear [30,31,32,33]. Immediate ignition tends to generate a momentum-dominated jet flame, with thermal radiation as the primary hazard, whereas delayed ignition may allow a flammable hydrogen cloud to form before ignition, leading to a vapor cloud explosion and significant overpressure [34].
As shown in Appendix A Table A1, previous studies have extensively investigated hydrogen leakage, dispersion, fire, and explosion hazards associated with hydrogen-powered vehicles. However, most existing studies have been conducted using idealized geometries, component-scale models, or static release conditions. As a result, the coupled effects of real HFCV structures, vehicle motion, and ignition timing on flammable cloud evolution and accident consequences remain insufficiently understood. To address these gaps, this study developed a three-dimensional CFD model based on the geometric characteristics of a commercial HFCV and validated it against real-vehicle-scale experimental data. Compared with previous studies, the main contributions of this work are:
First, a real-vehicle-geometry-based CFD framework was established to assess hydrogen leakage, dispersion, fire, and explosion consequences in HFCVs.
Second, the effects of leakage-orifice diameter, leakage direction, and vehicle motion on the evolution of the flammable hydrogen cloud were systematically quantified within a unified vehicle-scale framework.
Third, the influence of ignition timing on accident consequences was further examined, revealing the transition of the dominant hazard from jet-flame thermal radiation upon immediate ignition to flammable cloud explosion overpressure upon delayed ignition.
Overall, this study provides a quantitative basis for improving passive safety design, optimizing TPRD orientation, determining safety separation distances, supporting emergency response planning, and assessing the operational risks of HFCVs.

2. Methodology

2.1. Experimental Setup

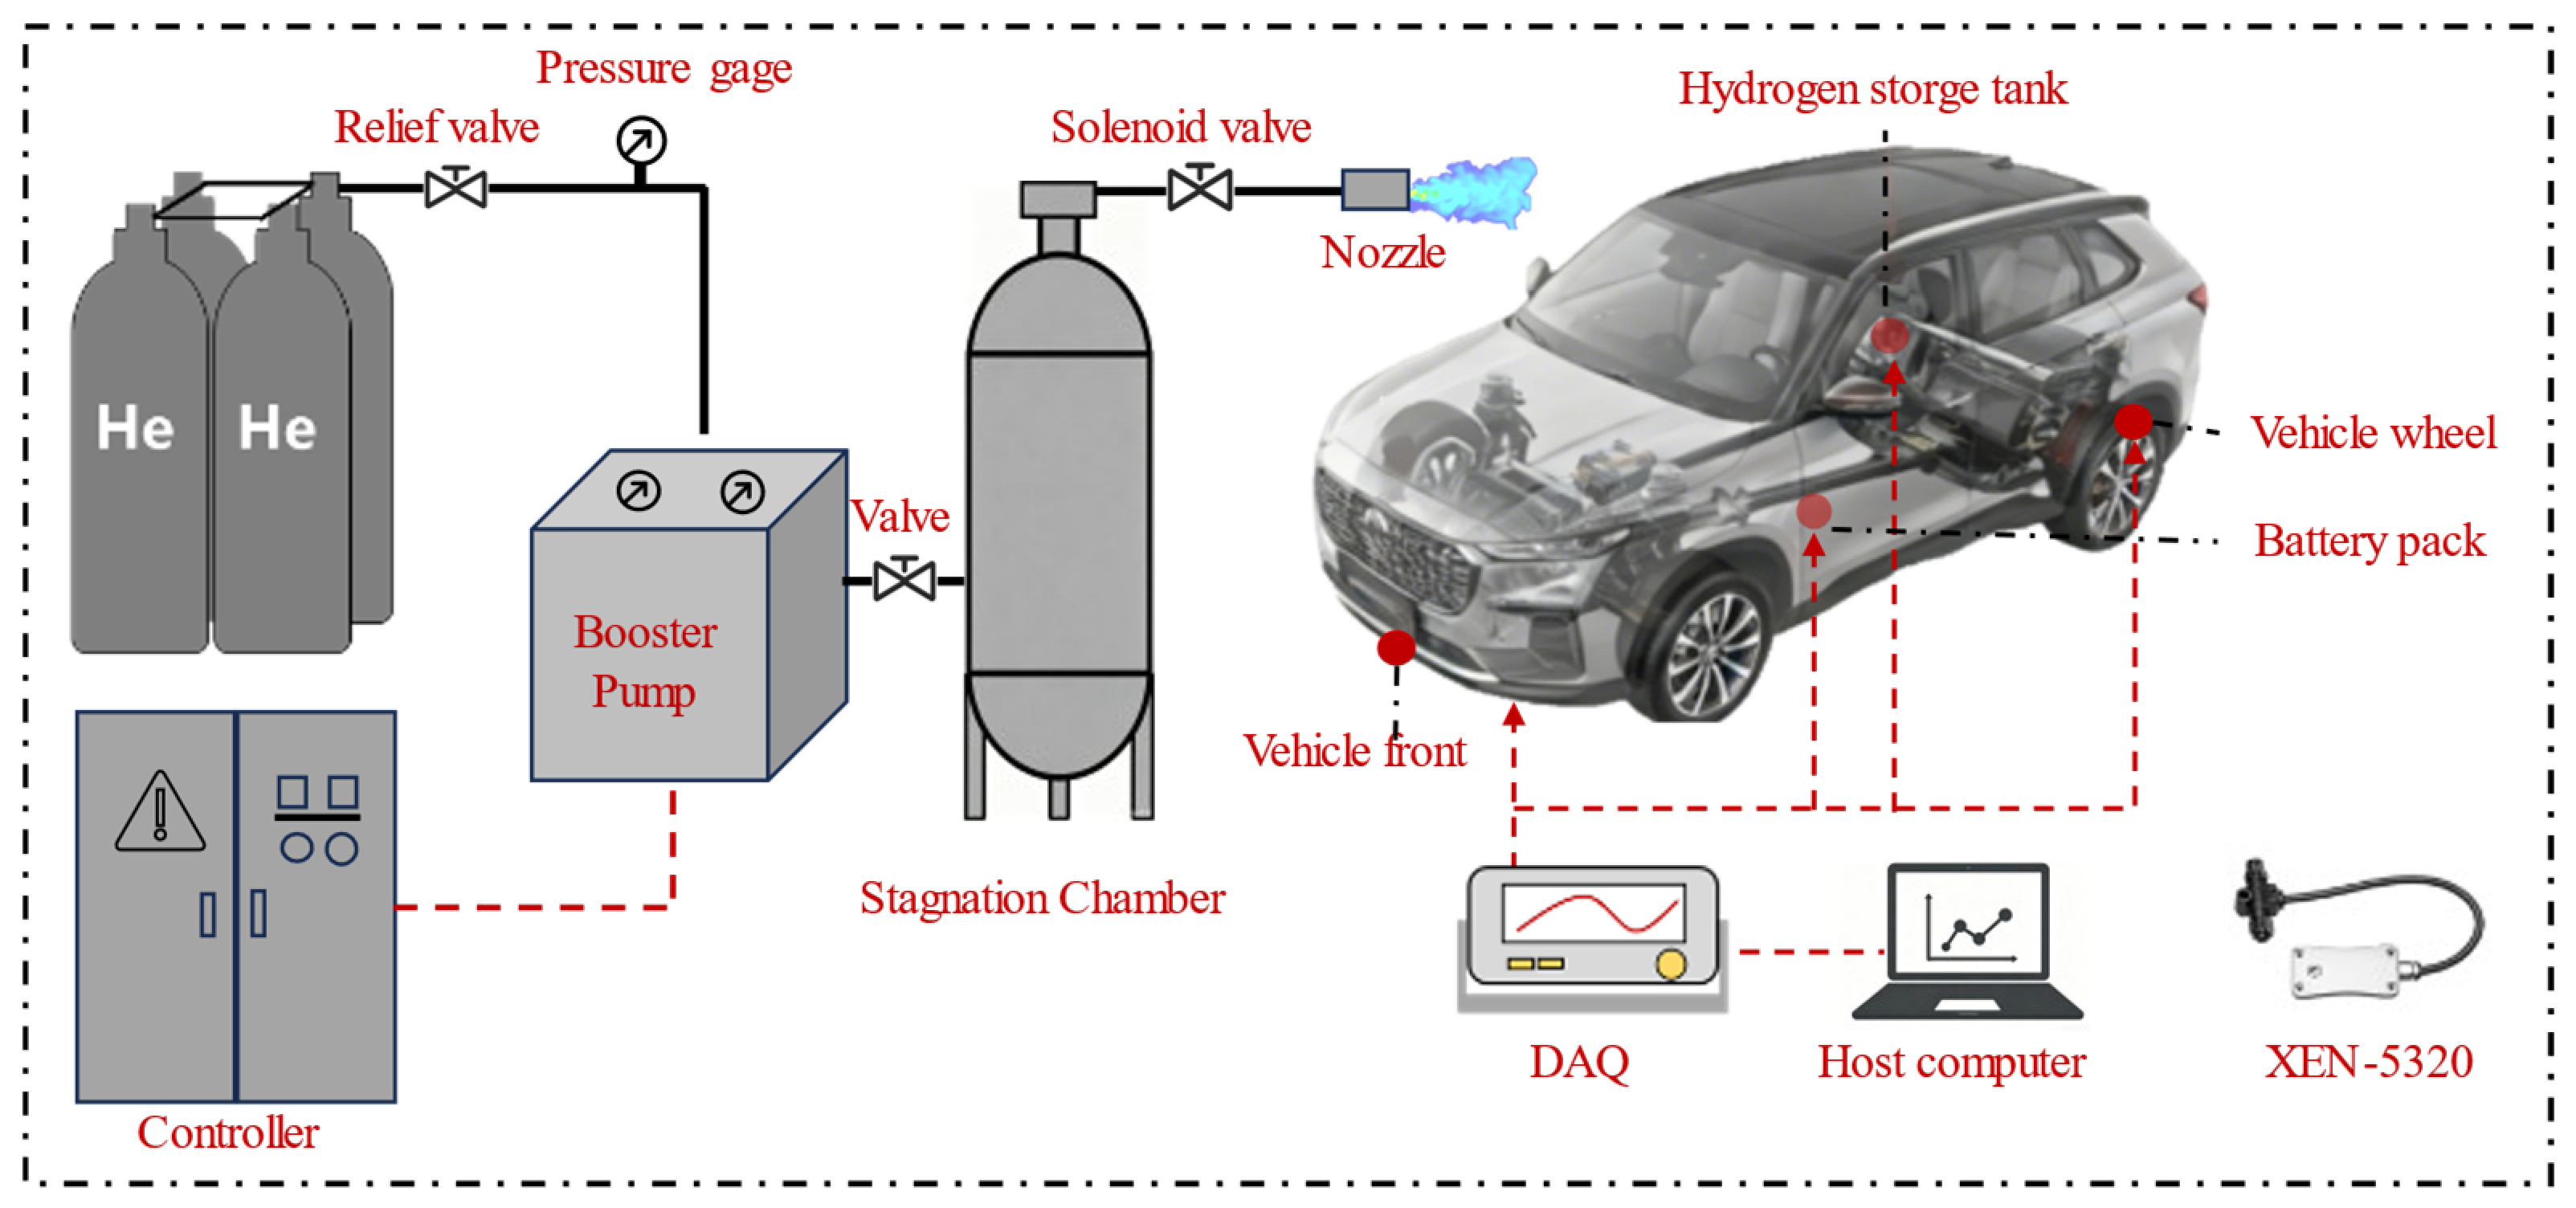
The hydrogen fuel cell vehicle (AION LX, GAC Group, Guangzhou, China) used in the full-scale test was provided by the manufacturer, as shown in Figure 1. The experimental system consisted of three modules: the HFCV, the gas supply module, and the data acquisition module, as shown in Figure 2. Helium was used as a surrogate gas to ensure experimental safety. The gas supply module comprised a controller, a booster pump, and a stagnation chamber. Gas released from the cylinder assembly was pressurized to a predetermined level by the booster pump and then discharged through the leakage nozzle at the target leakage location. Gas concentrations were measured using a series of gas sensors (XEN-5320 katharometers, Xensor Integration, Delfgauw, The Netherlands), and the sensor signals were collected by a data acquisition device (Keysight DAQ970A, Keysight Technologies, Santa Rosa, CA, USA) connected to a computer. The gas sensors had a minimum detection limit of 100 ppm, with an accuracy of 2% of full scale. The sensors were positioned at critical locations, including the hydrogen storage tanks, the front of the vehicle, the battery pack, and the wheel wells, as shown in Figure 2.

2.2. Numerical Method

2.2.1. Geometry Model

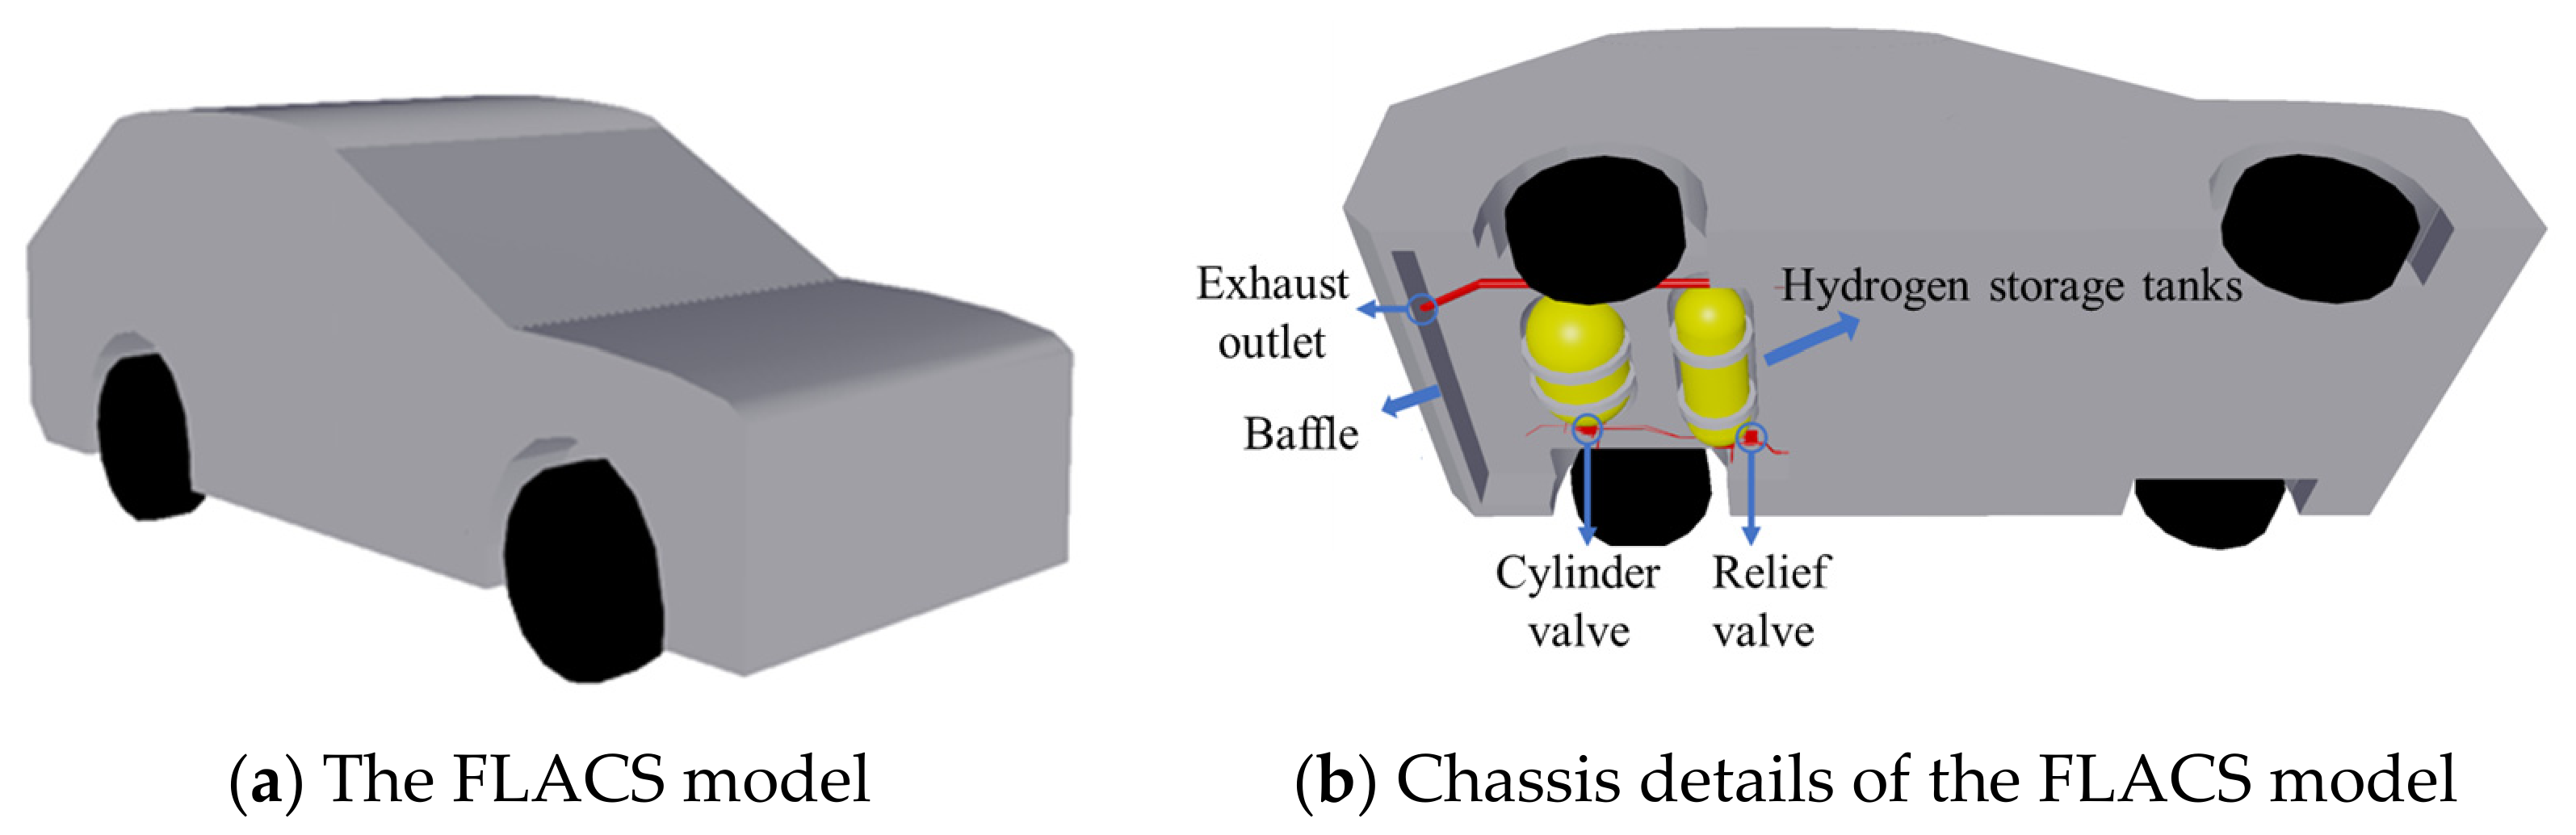
The geometric model was constructed based on the full-scale structural parameters of the HFCV, as shown in Figure 3. The vehicle was equipped with two 70 MPa high-pressure hydrogen storage tanks located at the rear. Hydrogen leakage typically initiates at tank valves and pipe connection interfaces under scenarios such as external collision and long-term component degradation. The hydrogen storage system is housed in a recessed protective compartment beneath the vehicle chassis, creating a semi-enclosed space with restricted ventilation that facilitates hydrogen accumulation. Electrical components are installed within the chassis, including the battery pack and high-voltage wiring harnesses. Sparks generated during abnormal operation of these components can ignite accumulated hydrogen, leading to fire and explosion consequences.

2.2.2. Governing Equations

The Reynolds-averaged Navier–Stokes (RANS) equations were solved to obtain the field parameters within the computational domain, including pressure, temperature, velocity, and species mass fraction. The species considered included fuel, air, and combustion products. A turbulent combustion model couples turbulent transport with chemical reactions to capture flame development and simulate combustion dynamics and overpressure transients. In the present study, the empirical constants involved in the combustion model were kept at the default values recommended in FLACS.
Continuity equation:
t β v ρ + x j β j ρ u j = m ˙ V
where β v represents volume porosity; β j represents area porosity in the j direction.
Momentum equation:
t β v ρ u i + x j β j ρ u i u j = β v p x i + x j β j σ i j + F o , i + F w , i + β v ρ ρ 0 g i
where σij represents the stress tensor; Fw,i represents flow resistance due to walls; Fo,i represents sub-grid flow obstructions; and Fo,I is defined by Equation (3).
F o , i = ρ β x i u i u i
Energy equation:
t β v ρ h + x j β j ρ u j h = x j β j μ e f f σ h h x j + β v D p D t + Q ˙ V
Species transport equation:
t β v ρ Y f u e l   + x j β j ρ u j Y f u e l   = x j β j μ e f f   σ f u e l   Y f u e l   x j + R f u e l  
where Rfuel represents the fuel reaction rate, which will be handled in combustion modelling.
The FLACS combustion model comprises a numerical flame model, a combustion rate model, and a flame wrinkling model. The numerical flame model defines combustion criteria and the spatial distribution of chemical reaction rates. The governing equation is given below:
t β v ρ Y f u e l + x j β j ρ u j Y f u e l = x j β j ρ D Y f u e l x j + R f u e l c = 1 Y F F F 0 ;   R f u e l = C β R F S Δ ρ min [ c , 9 ( 1 c ) ]
where CβRF is a model constant; S represents the burning velocity; Δ is a constant on the order of the grid resolution; c is the progress variable; YF represents the fuel mass fraction; YF0 represents the initial fuel mass fraction in a control volume.
The combustion rate model uses different formulations for different regions. The flame burning rate in the laminar flame region is defined as follows:
S L = S L 0 P P 0 γ P
where γP represents the fuel coefficient.
In the turbulent flame region, the turbulent burning rate ST follows a simplified form of the general expression:
S T = 1.81 u 0.412 L 0.196 S L 0.784 ν 0.196
The flame wrinkling model describes the increase in local burning velocity caused by obstacles and turbulence:
t ρ Ξ s + x i ρ u i Ξ s = G s Ξ s R s Ξ s 1
where Ξ s represents the wrinkling factor; Gs represents the generation of the wrinkling factor; and Rs represents the dissipation of the wrinkling factor.

2.2.3. Grid Sensitivity

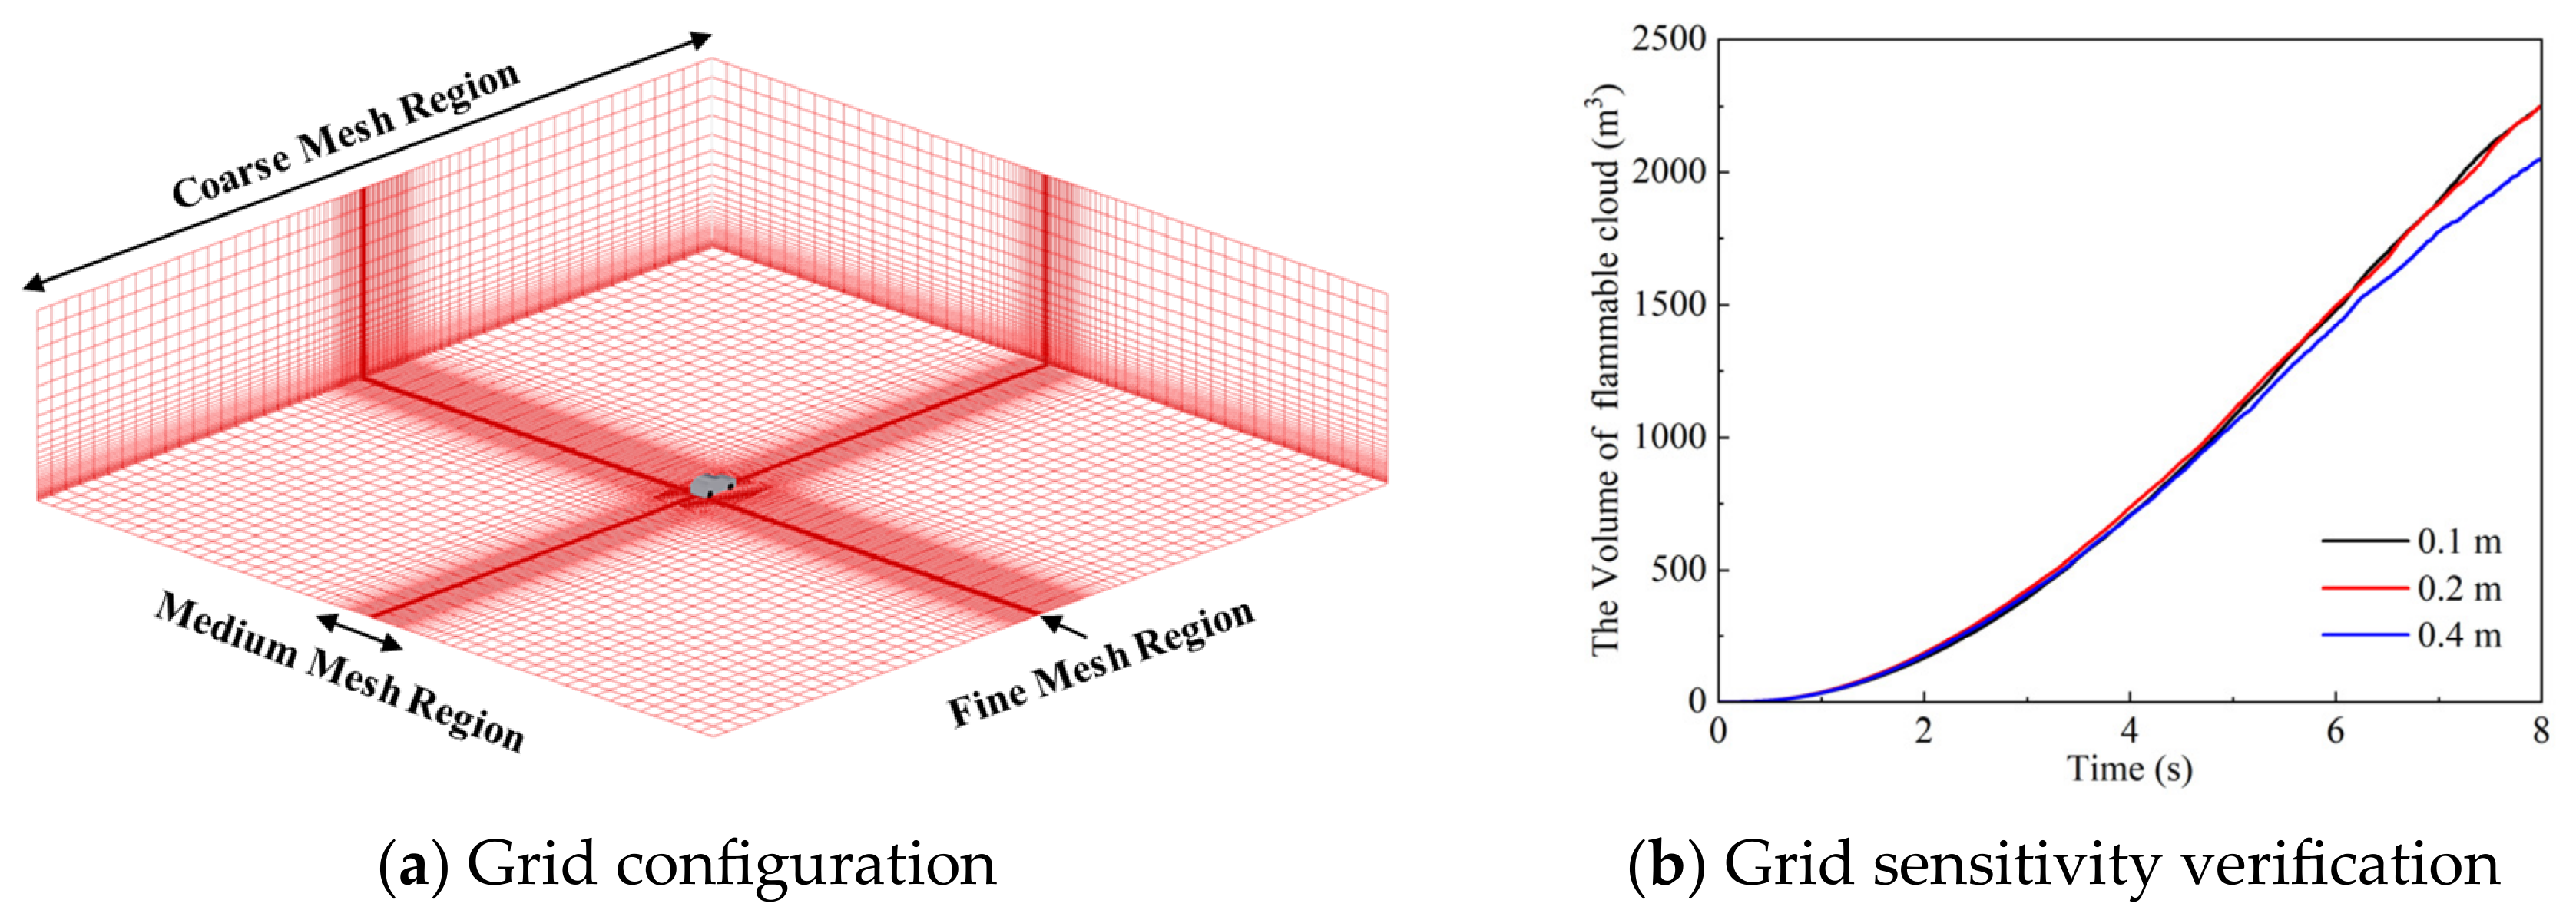
The computational domain was divided into a background region, a core region, and locally refined regions (100 m × 100 m × 20 m), as shown in Figure 4a. The core region was defined within 2 m of the vehicle, where refined grid cells were used to accurately resolve hydrogen jet development and near-field dispersion. Outside the core region, the grid size gradually increased with an expansion ratio of 1.2. Local mesh refinement was applied near the leakage outlet to capture the high-velocity hydrogen jet behavior. A grid sensitivity study was conducted to ensure reliable results while avoiding excessive computational cost. Three core grid sizes (0.1 m, 0.2 m, and 0.4 m) were examined, using the flammable cloud volume as the evaluation criterion. The results indicated that the flammable cloud volumes obtained using grid resolutions of 0.1 m and 0.2 m showed negligible differences, as shown in Figure 4b. Therefore, a core grid size of 0.2 m was selected for subsequent simulations to balance computational accuracy and efficiency.

2.2.4. Model Validation

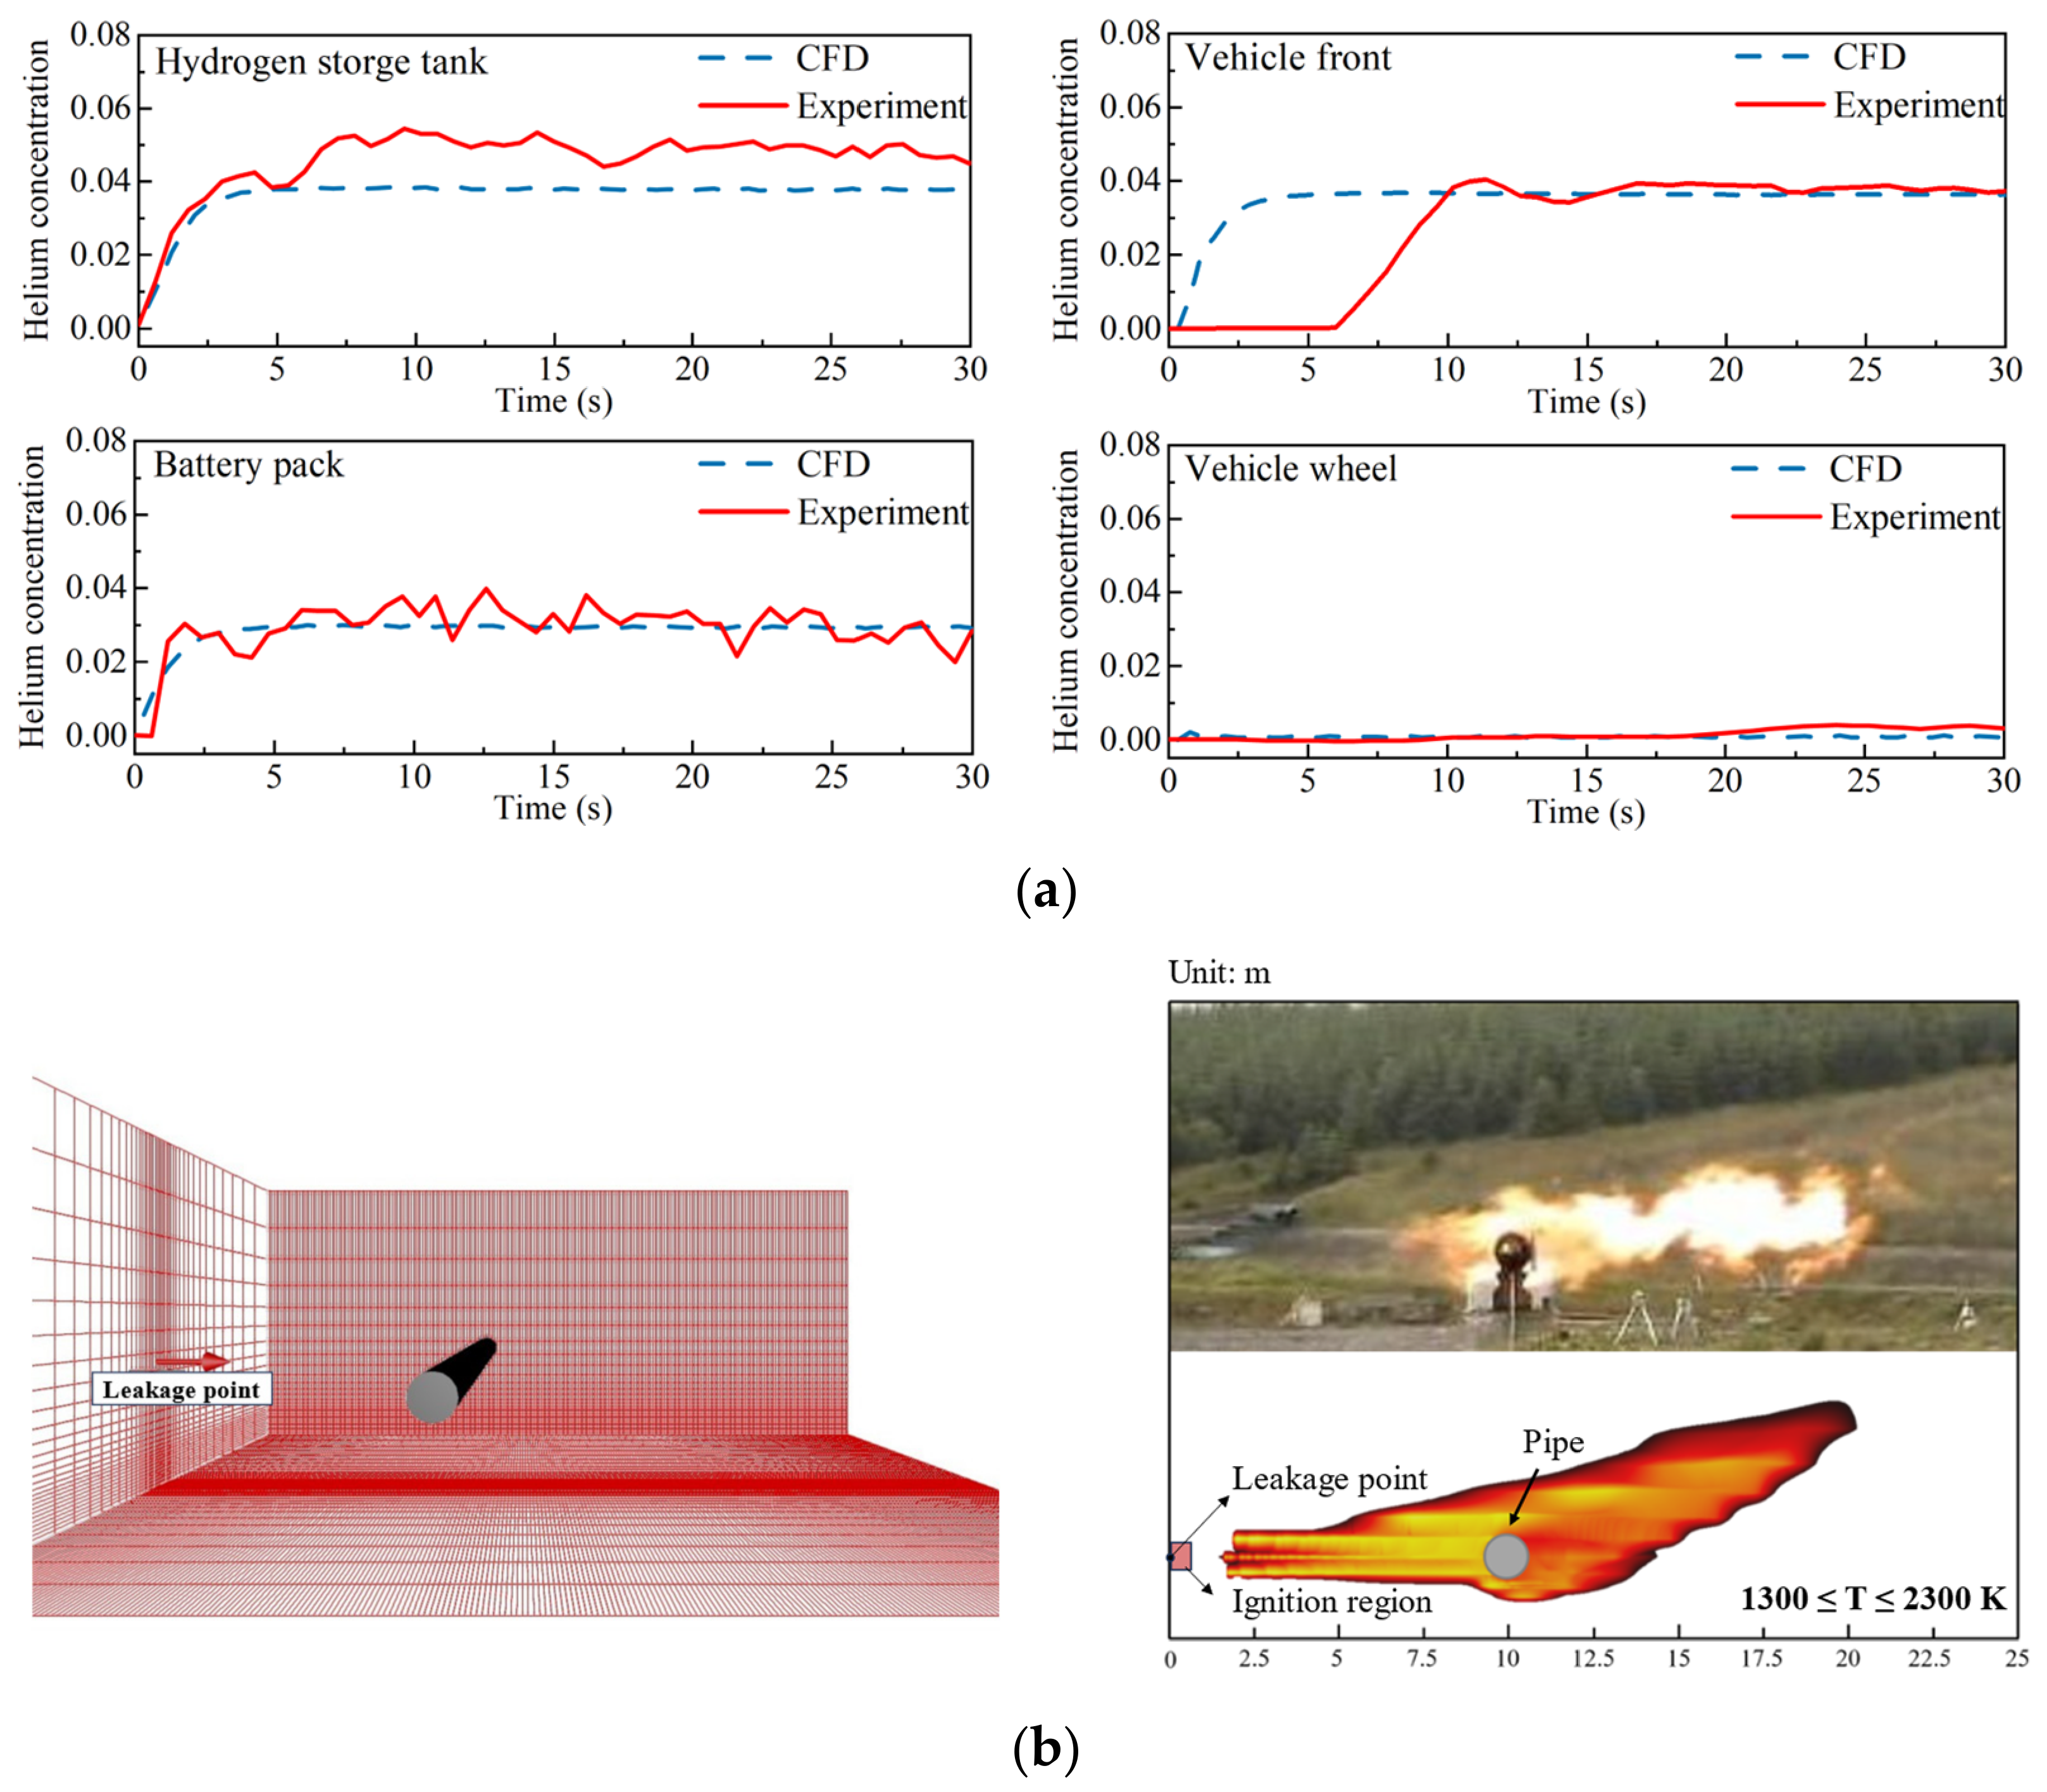
Helium concentration data obtained from a relief valve leakage experiment in an HFCV were used to validate the numerical model for hydrogen dispersion. The experimental conditions included a leakage pressure of 2 MPa, a leakage diameter of 1.5 mm, and a vertical downward leakage orientation. The model predictions showed good agreement with the experimental measurements in the main monitoring regions, although the experimental values were slightly higher than the simulated values, as shown in Figure 5a. These discrepancies were mainly due to pressure losses in the piping system, sensor positioning uncertainties, and slight flow disturbances caused by the sensor structures. Overall, the developed numerical model was suitable for studying hydrogen dispersion in HFCVs.
The jet fire model was validated against experimental data from Lowesmith and Hankinson [35]. The experiment involved a leakage pressure of 5.94 MPa and a leakage diameter of 20 mm. The ignition region was located near the jet outlet. A pipe with a diameter of 0.9 m was placed 9.45 m from the leakage opening, with the nozzle and pipe aligned at 3.25 m above the ground. The geometric model was constructed using FLACS, as shown in Figure 5b. The ignition region was specified near the jet outlet, and the visible flame region was identified from the temperature distribution, using a temperature range of 1300–2300 K [36]. The simulated flame shape and length showed close agreement with the experimental observations. The measured flame length was 19.8 ± 1.6 m, compared with 19.5 m in the FLACS simulation, yielding a relative error of approximately 1.5%. These results show that the model can accurately simulate hydrogen jet fires associated with HFCVs.

3. Results and Discussion

3.1. Dispersion Behavior

This study investigated the influence of leakage diameter, orientation, and vehicle velocity on hydrogen dispersion behavior. A Full-scale release through a thermal pressure relief device with a diameter of 4.35 mm was defined as the baseline scenario. Furthermore, reduced leakage diameters of 3.07 mm and 0.435 mm were analyzed to evaluate varying hazard intensities. The emission angles were specified as 0°, 30°, 60°, and 90° relative to the horizontal backward axis, where the angle increases in the clockwise direction. Here, 0° denotes the horizontal backward direction and 90° corresponds to the vertically downward direction. Vehicle velocities of 30 km/h and 50 km/h were selected to represent typical driving conditions for evaluating dispersion dynamics and associated safety risks. The complete simulation conditions are summarized in Table 1.
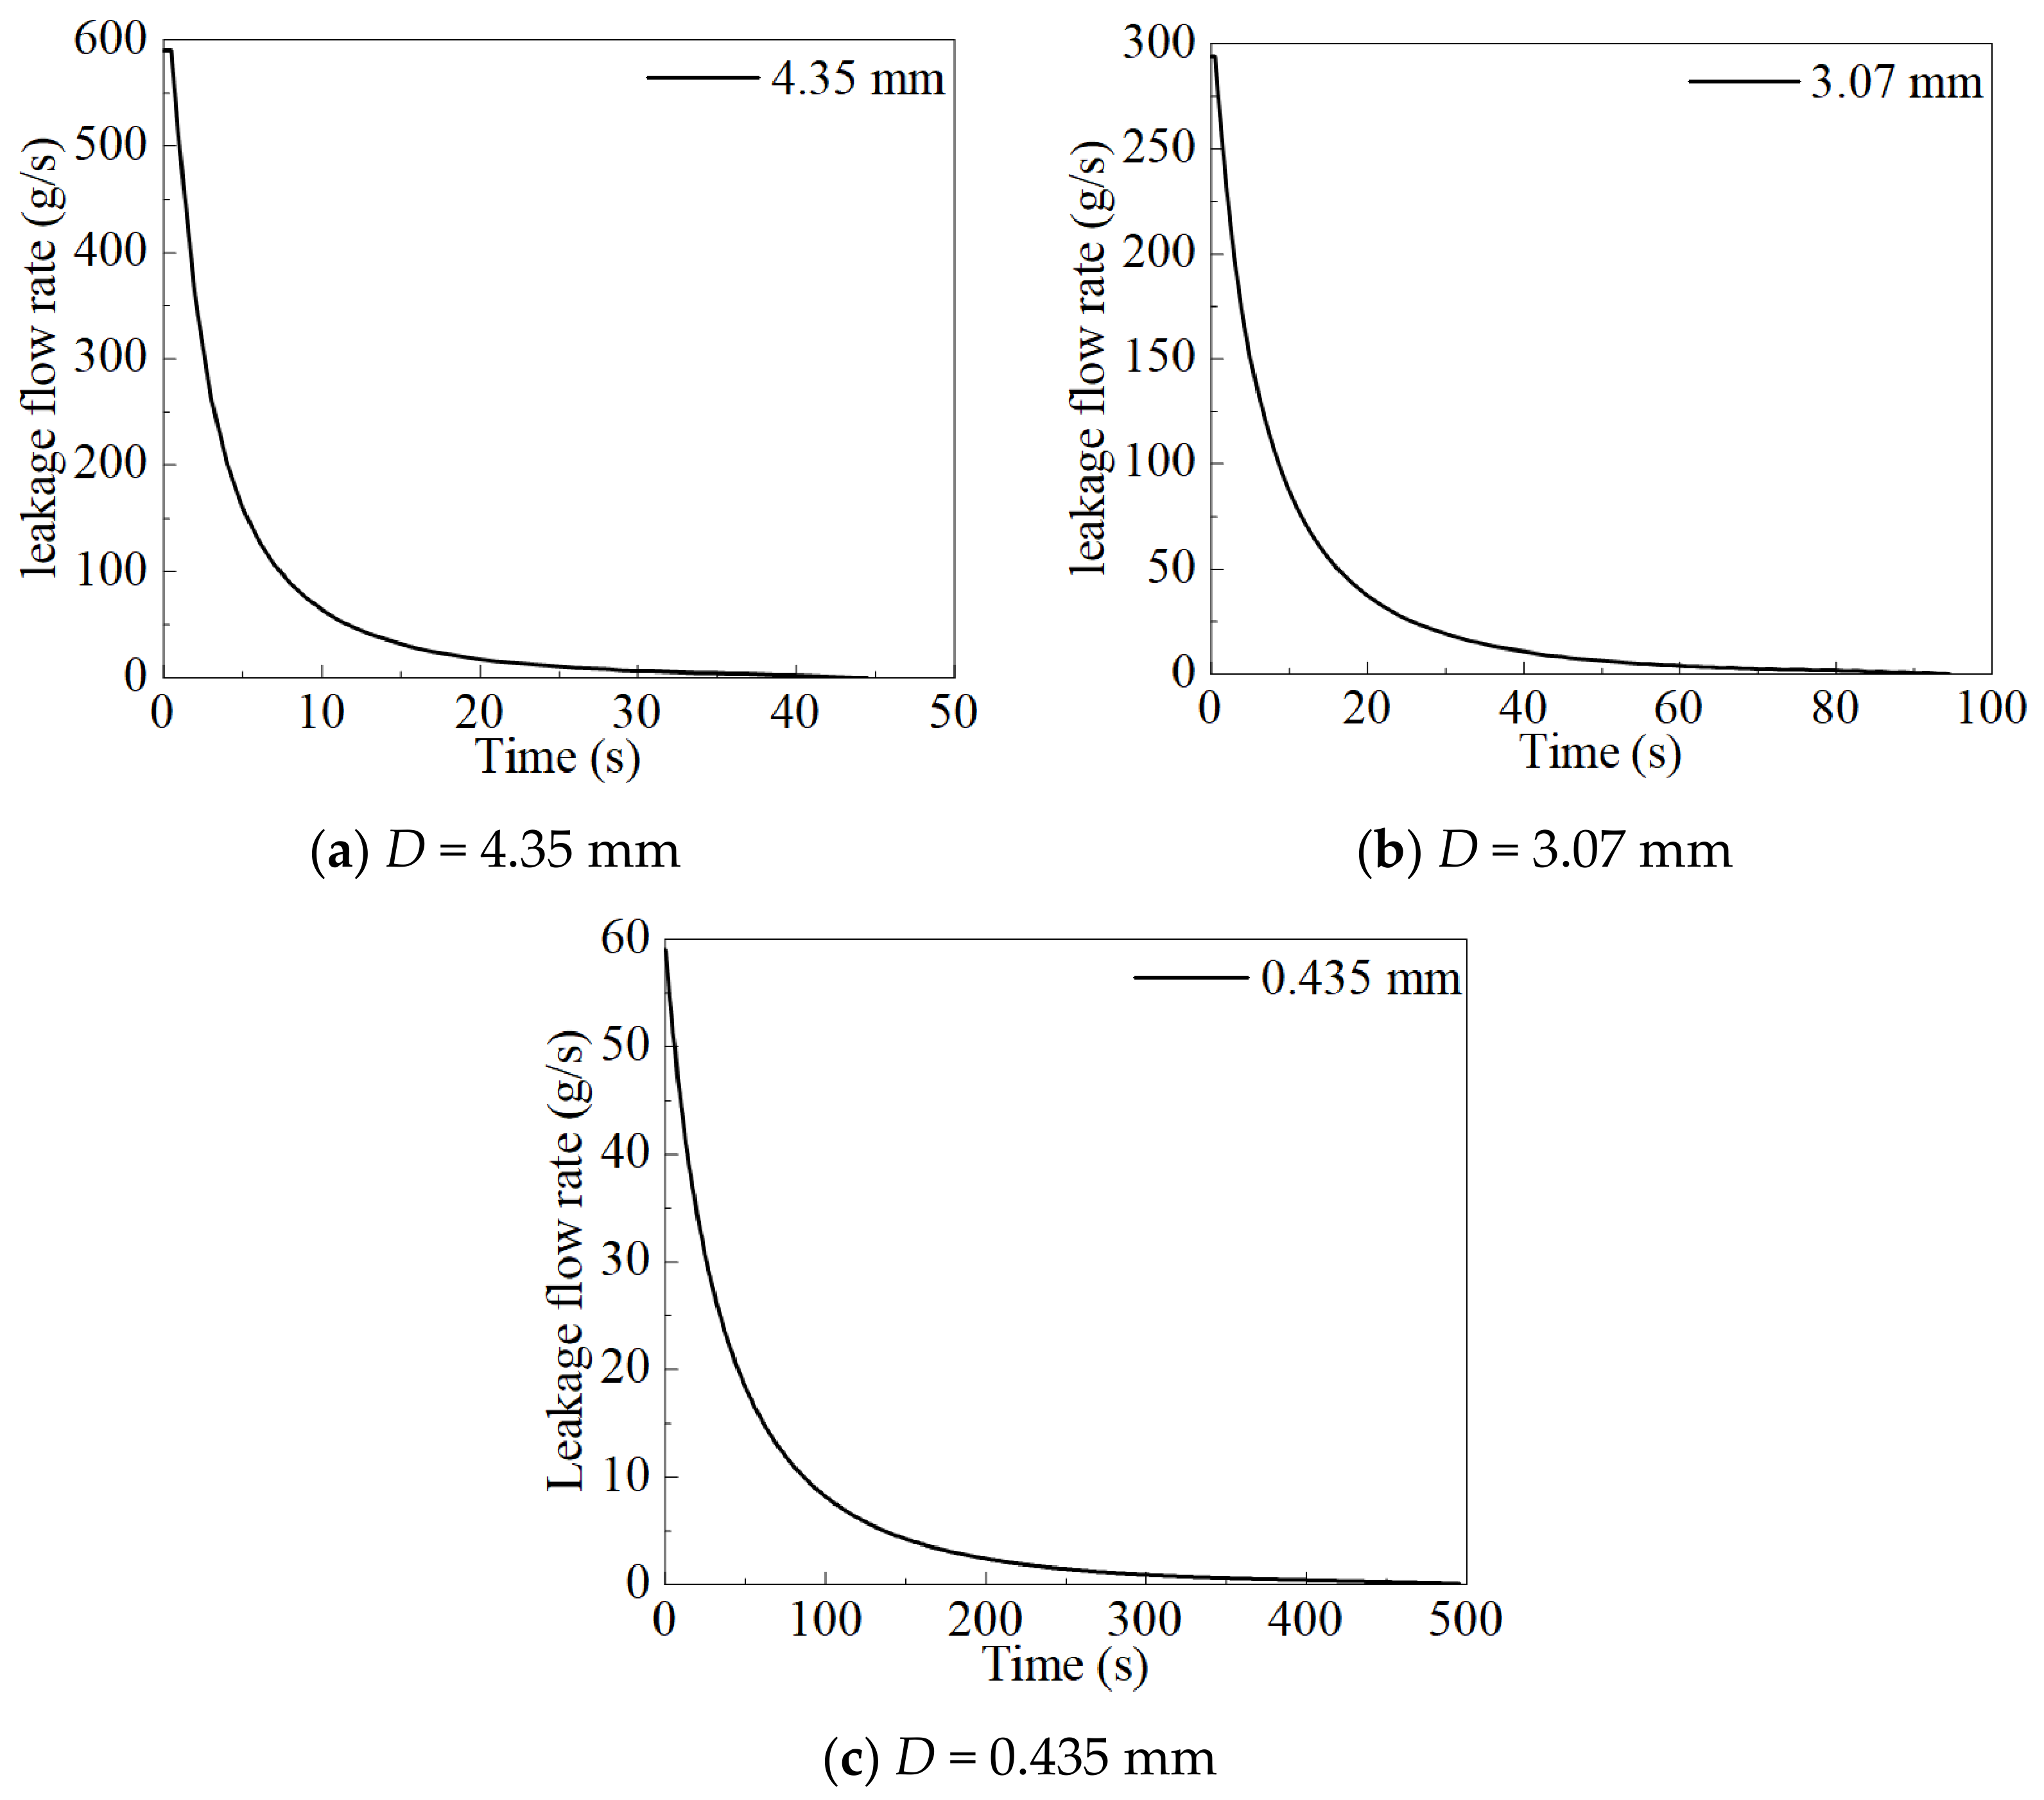
The hydrogen storage tank had a volume of 77 L and a maximum hydrogen capacity of 3.02 kg. The leakage mass flow rate decreased continuously during release until the tank was depleted. The variation in leakage mass flow rate with leakage orifice diameter (D) is shown in Figure 6.

3.1.1. Effect of Leakage Orifice Diameter

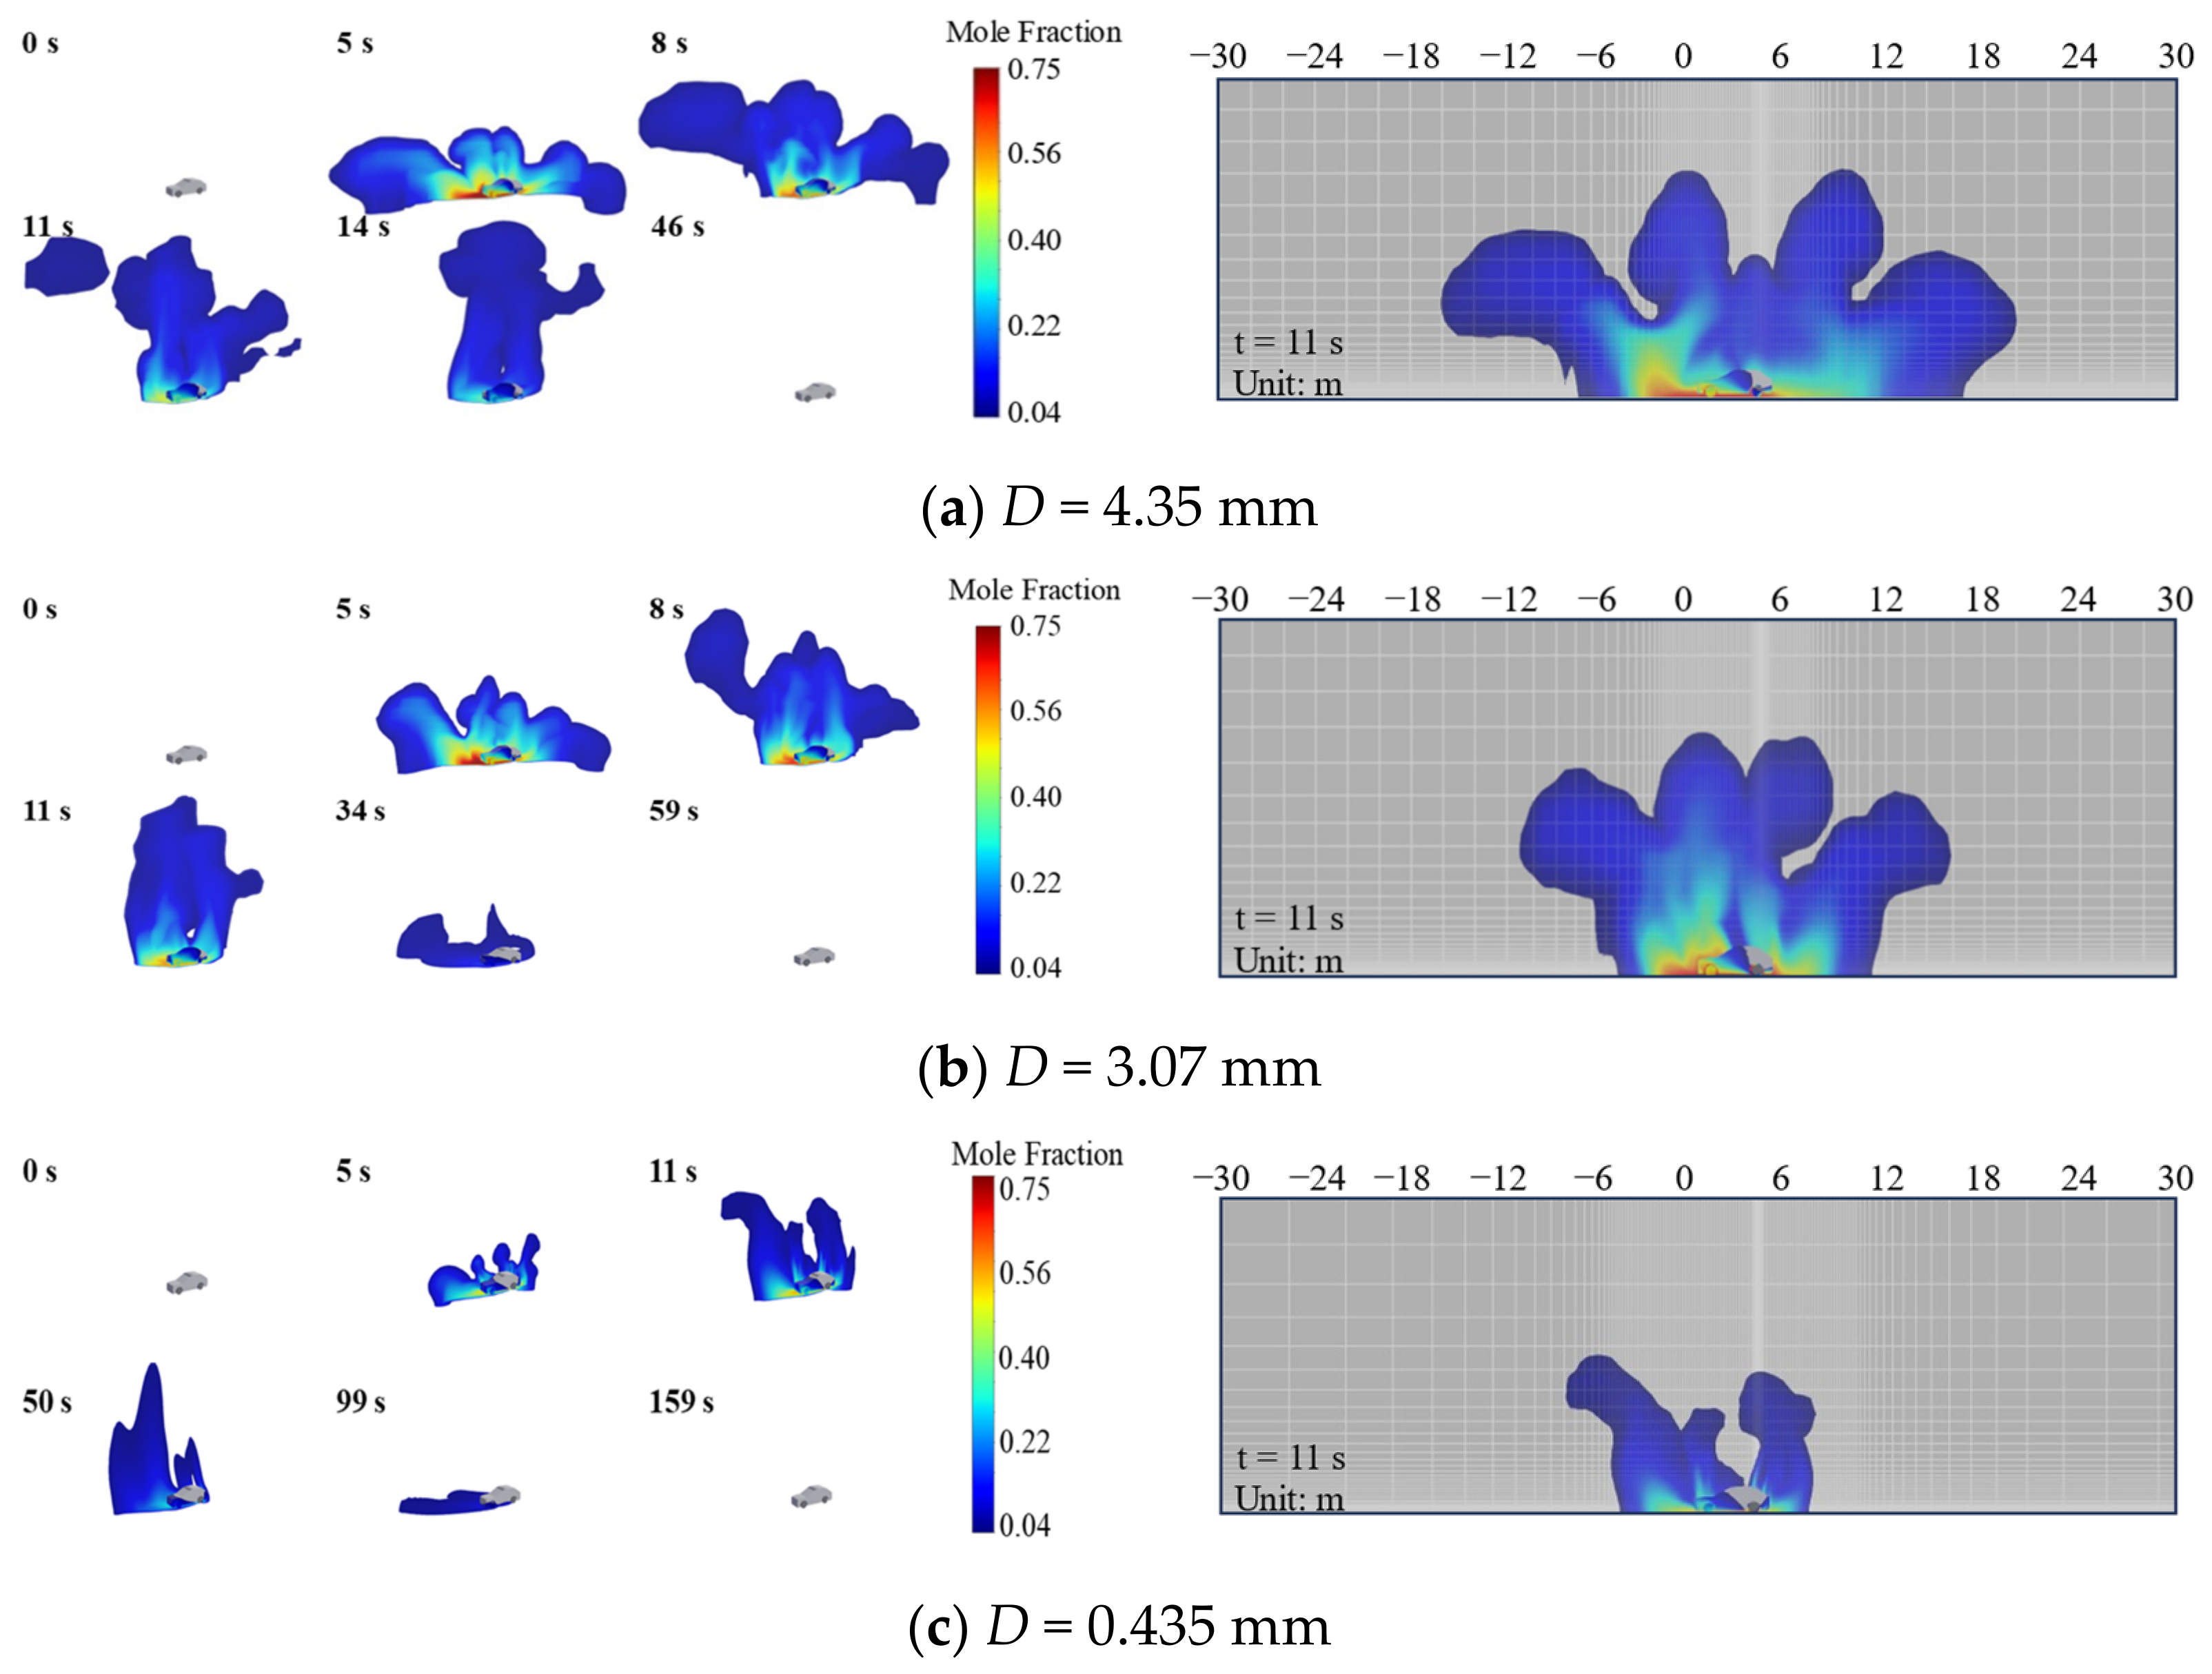
The spatiotemporal evolution of flammable hydrogen clouds for different leakage diameters is shown in Figure 7. The evolution process was divided into two stages: an accumulation stage and a dispersion stage, with the boundary set at the time when the cloud volume reaches the maximum value. During the accumulation stage, the jet impinged on the ground and spread beneath the vehicle. Beyond the vehicle body, reduced geometric confinement and declining horizontal momentum promoted upward dispersion, leading to partial engulfment of the vehicle. Because the leakage location was near the left wheel, the plume was deflected toward the right, resulting in significant accumulation in the upstream, downstream, and right-side regions. During the dispersion stage, the leakage mass flow rate decreased as the tank pressure dropped, and the flammable cloud dissipated gradually.
Leakage orifice diameter significantly affected both the evolution rate and spatial extent of the flammable cloud. Large-orifice leakage led to rapid formation and wide spatial expansion, whereas small-orifice leakage resulted in slower development, smaller spatial extent, and longer persistence. For a large orifice (D = 4.35 mm), a continuous flammable cloud rapidly developed and extended above and around the vehicle. When the orifice diameter decreased to 0.435 mm, reduced jet momentum led to a locally rising plume. Enhanced dilution by air limited the spatial extent of the flammable cloud and prolonged cloud duration.
Hydrogen dispersed farther in the longitudinal direction than in the lateral directions, as shown in Figure 7 (right). The maximum dispersion distance decreased from 16 m (D = 4.35 mm) to 11 m (D = 3.07 mm) and 8.3 m (D = 0.435 mm).
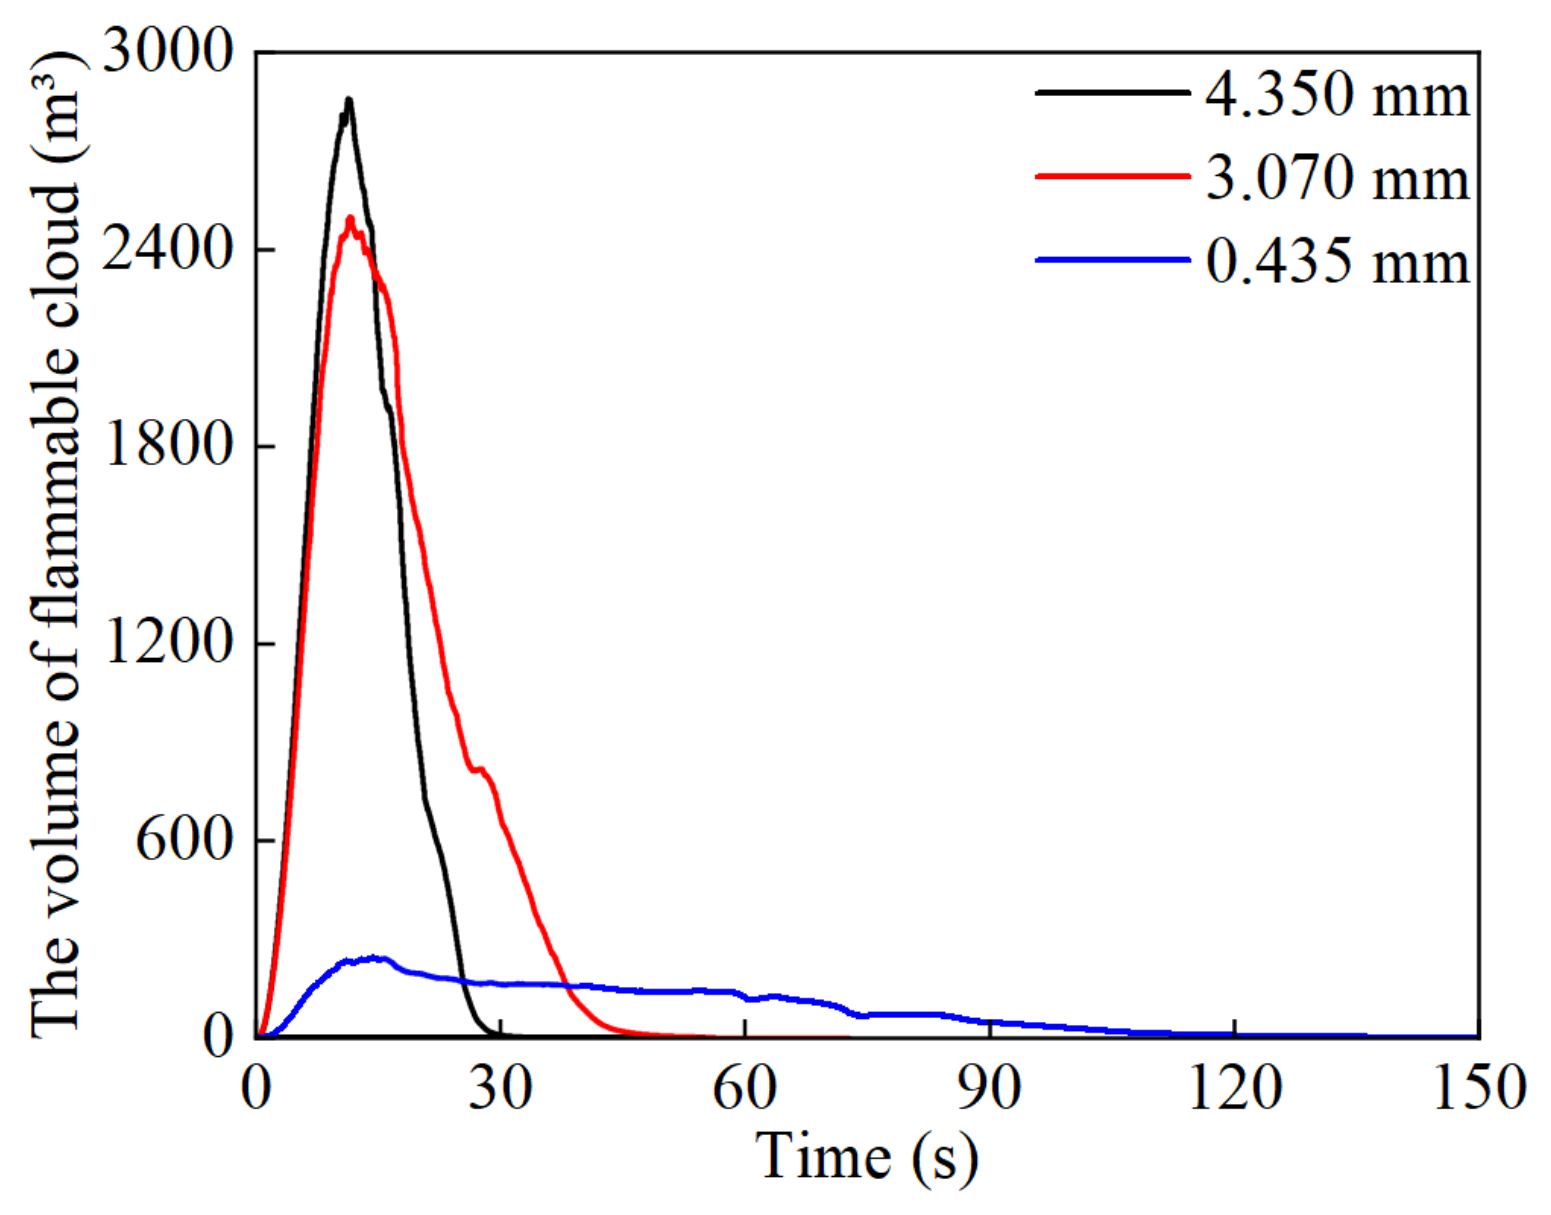
The temporal evolution of flammable cloud volume for different leakage orifice diameters further demonstrates the differences described above, as shown in Figure 8. The peak volume decreased from 2859 m3 at an orifice diameter of 4.35 mm to 2500 m3 at 3.07 mm and further to 244 m3 at 0.435 mm, with reductions of 12.6% for the 3.07 mm case and 91.5% for the 0.435 mm case, both relative to the 4.35 mm case. Smaller orifices resulted in longer leakage duration, which extended flammable cloud persistence. Notably, the flammable cloud volume reached its maximum at approximately 11 s for all cases. The leakage diameter affected the source strength and local jet momentum flux, thereby influencing the overall magnitude of the flammable cloud volume. However, in the present cases, the vehicle geometry, leakage orientation, external flow condition, and boundary conditions remained unchanged. As a result, the main transport pathway, residence time, and dilution process of the flammable cloud around the vehicle remained broadly similar. The time to reach the peak volume was mainly governed by the vehicle-scale transport and dilution timescale, whereas the leakage diameter primarily controlled the magnitude of the maximum flammable cloud volume.

3.1.2. Effect of Leakage Orientation

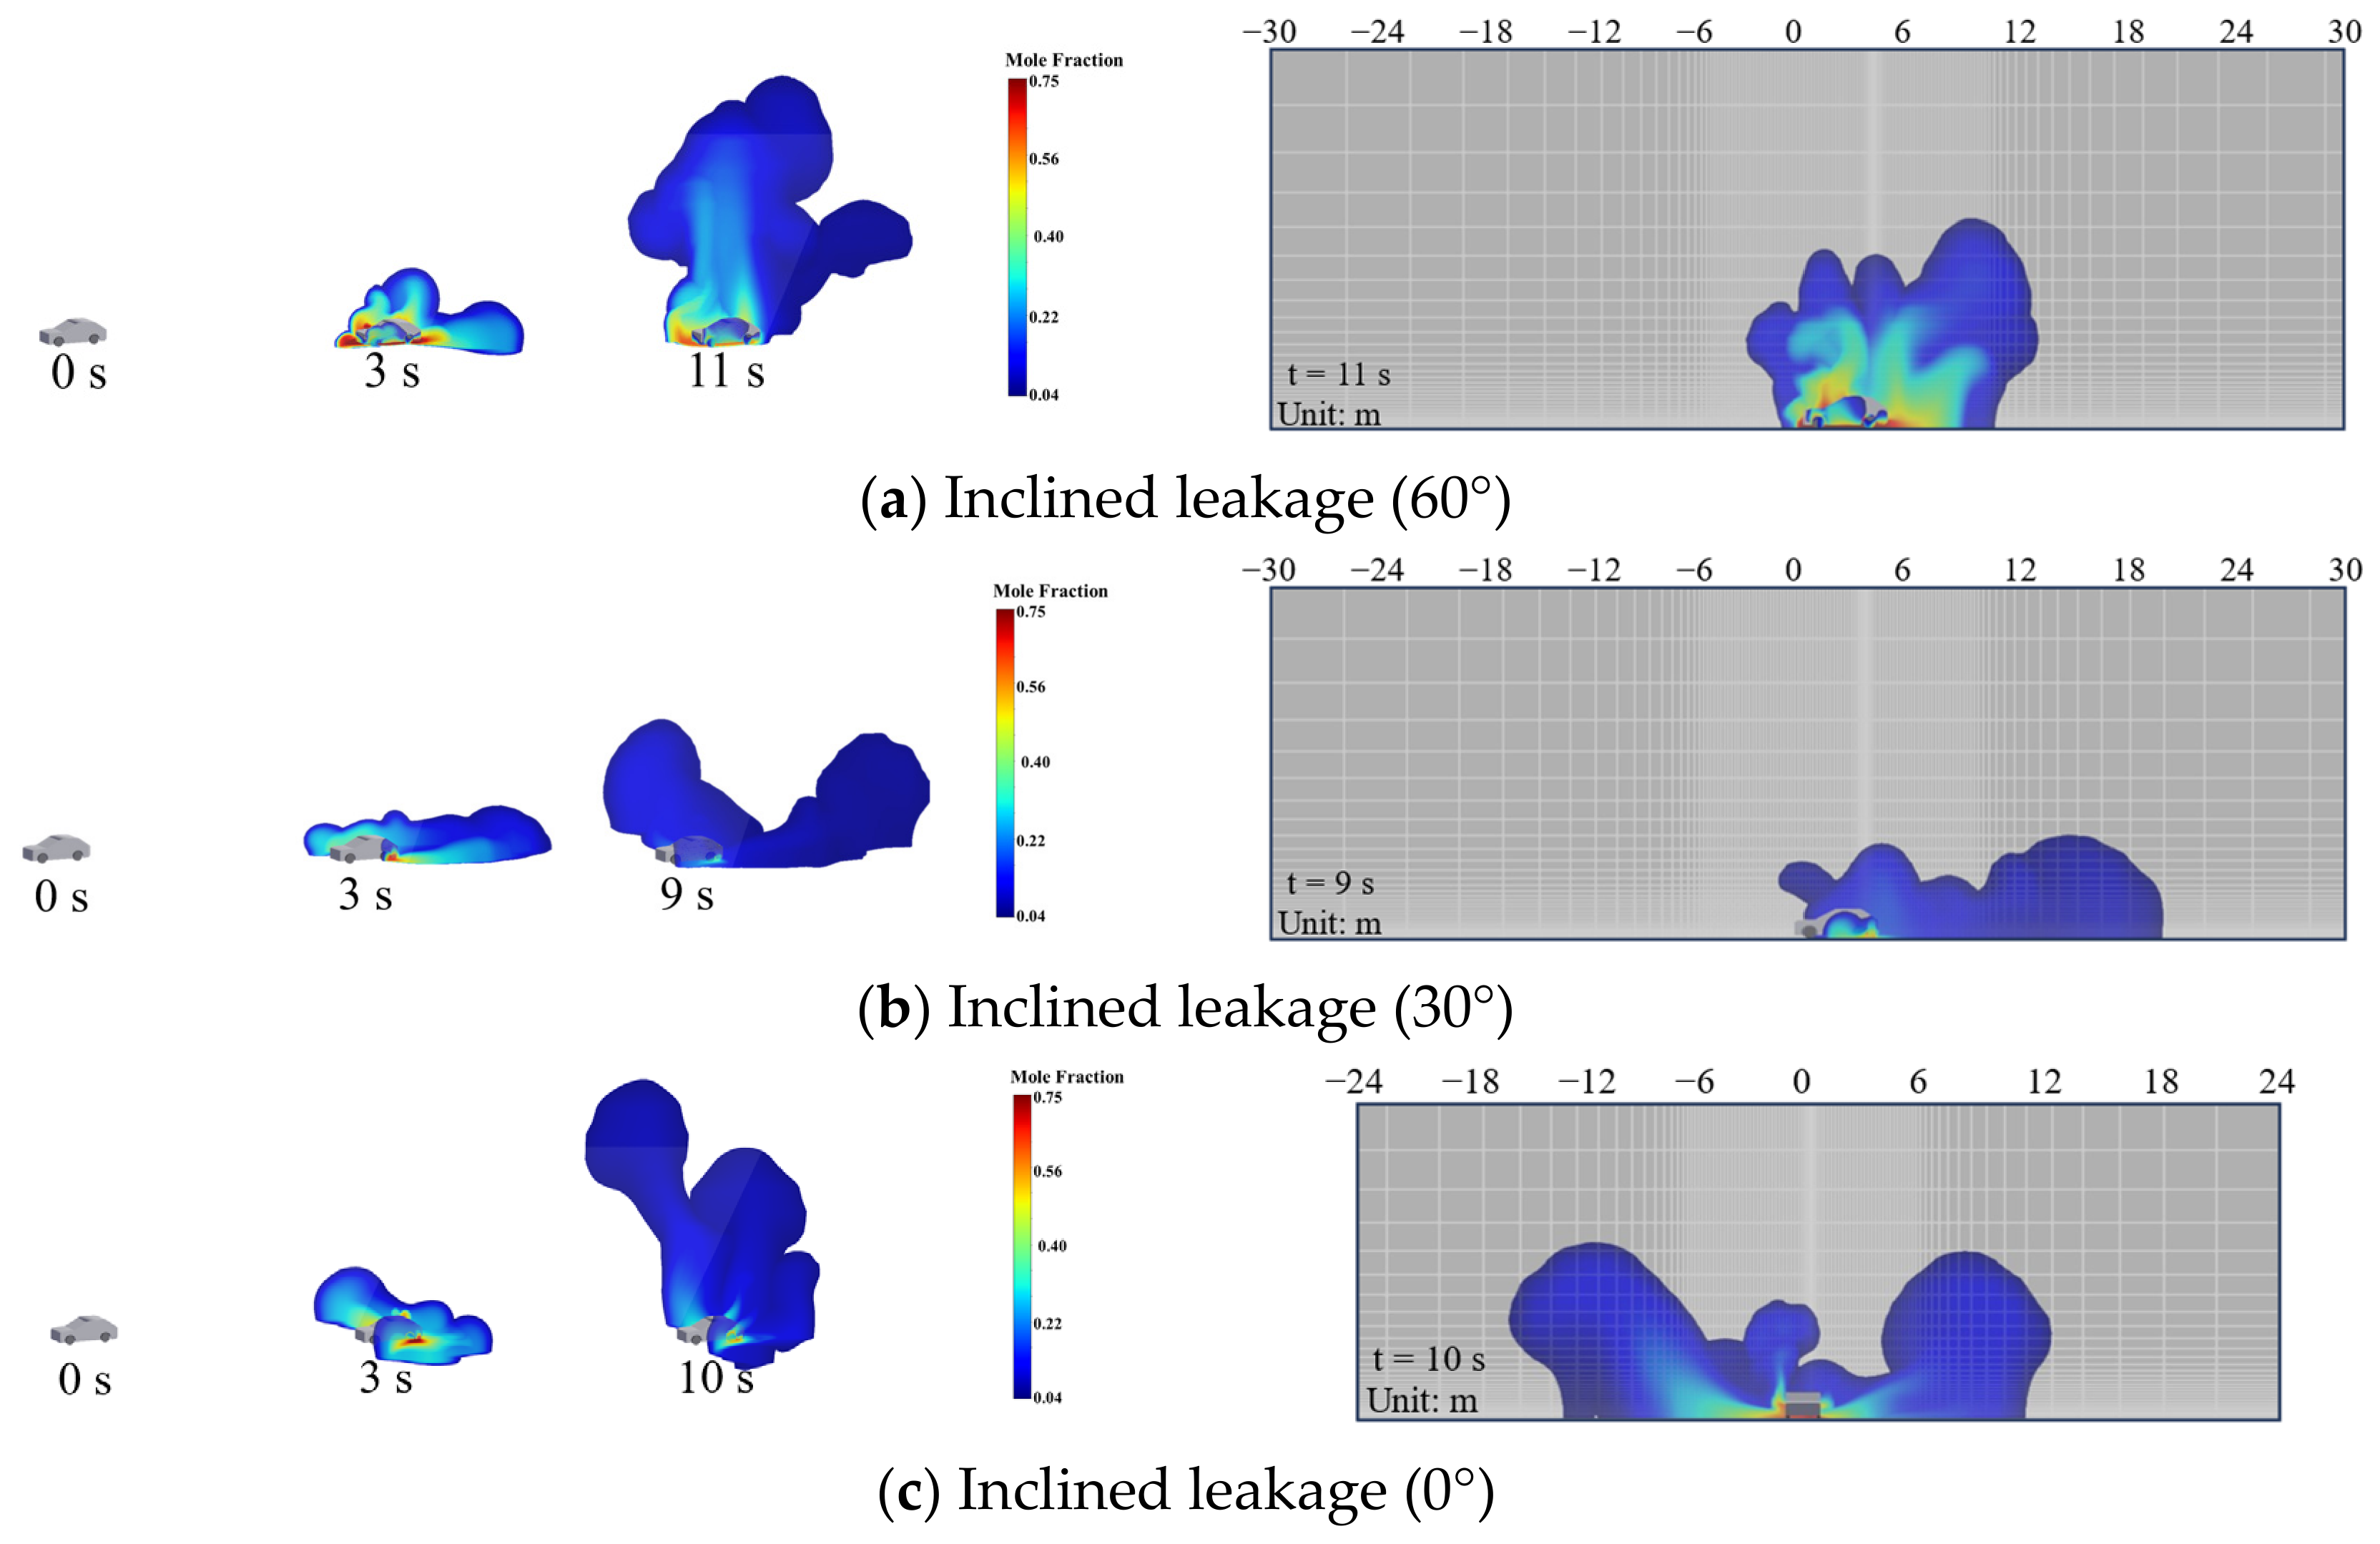
Leakage orientation is highly uncertain during accidental hydrogen release from HFCVs. Flammable cloud distributions for different leakage orientations are presented in Figure 9. Leakage orientation significantly affected both the size and spatial distribution of the flammable cloud. As the leakage angle decreased, the cloud extended in the downstream direction. The downstream extent increased from 8.3 m at 60° to 16.5 m at 30°. In contrast, at 0°, the jet was blocked by the baffle, resulting in predominantly lateral dispersion. The maximum lateral distance reached 14.5 m on the right side.
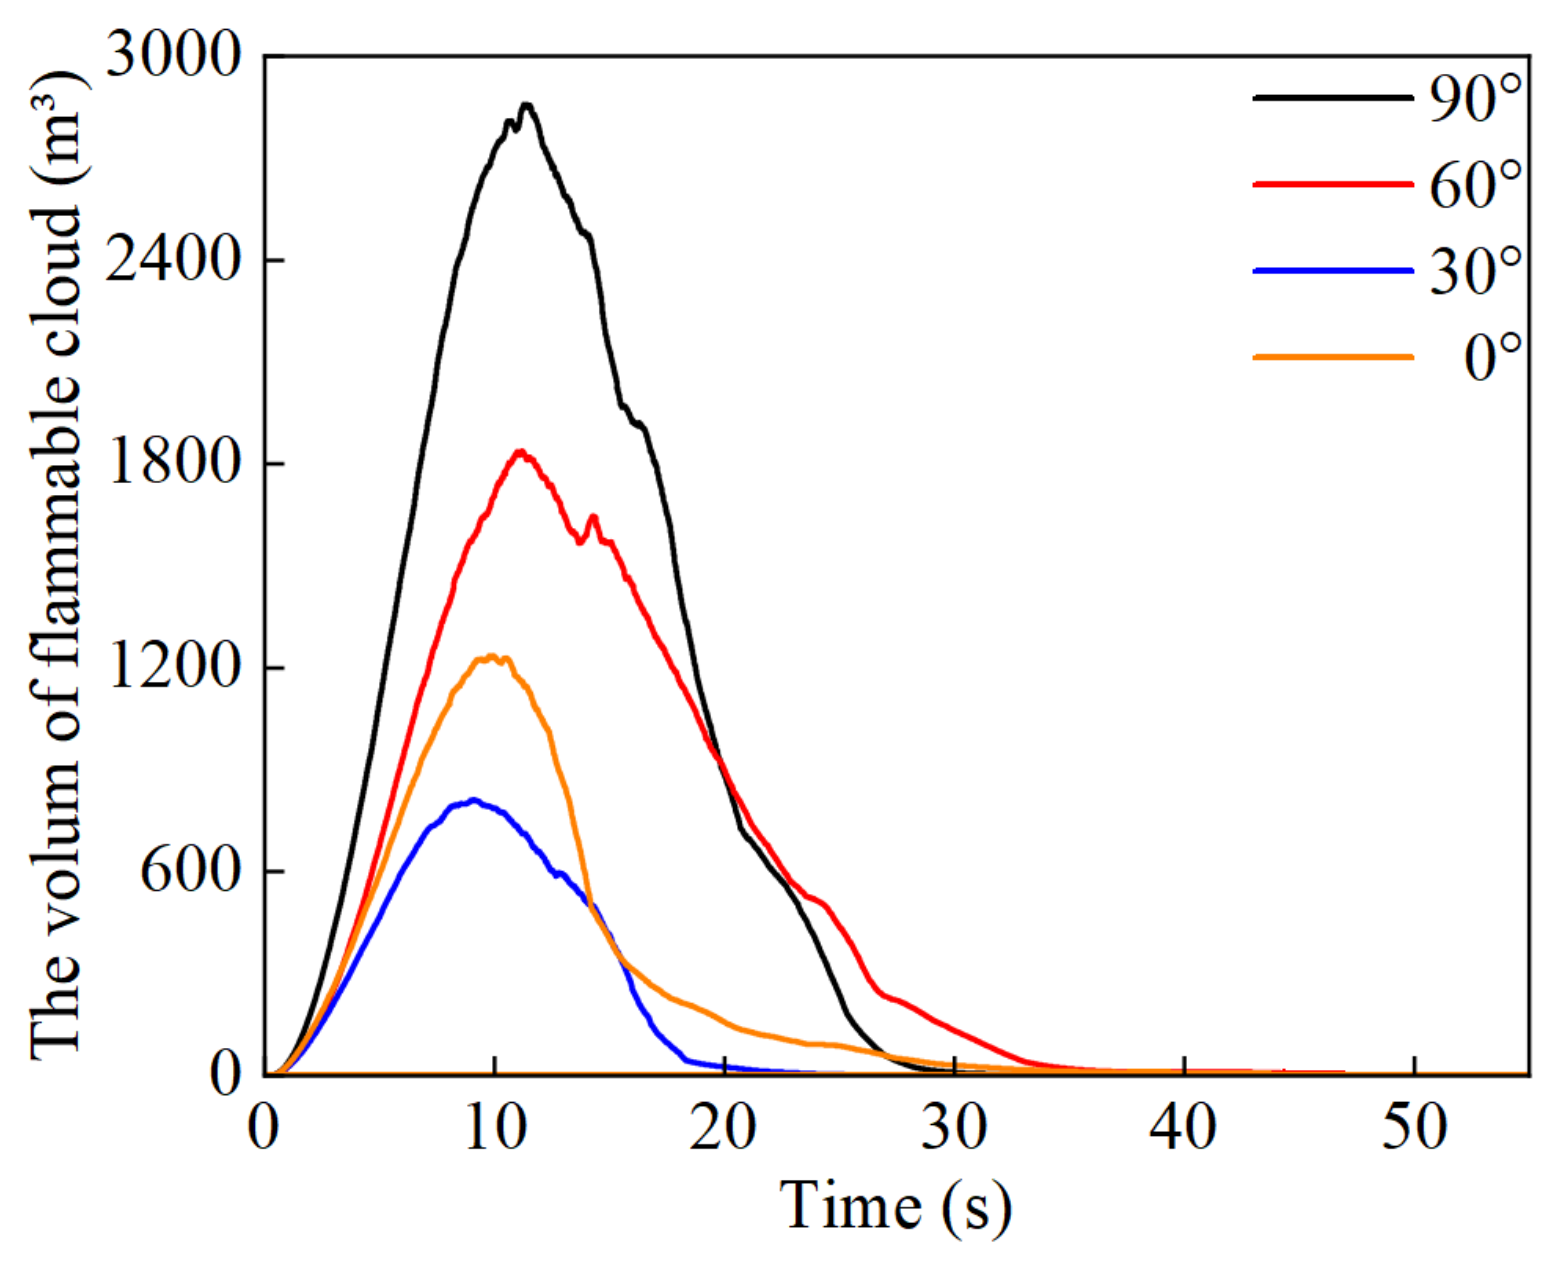
The temporal evolution of flammable cloud volume for different orientations is shown in Figure 10. The peak cloud volume decreased by 35.6% at 60° and 71.6% at 30°, relative to the vertically downward leakage case (90°). At 0°, the baffle altered the dispersion path and redirected the flow toward the upstream region. Despite this effect, the peak flammable cloud volume still decreased by 57.3% relative to the 90° case. Inclined leakage effectively reduced the flammable cloud volume around the vehicle. For TPRDs in onboard hydrogen storage systems, the release direction should be inclined relative to the ground, and structural obstacles along the release path should be avoided to minimize the risk of forming a large flammable cloud.

3.1.3. Effect of Vehicle Velocity

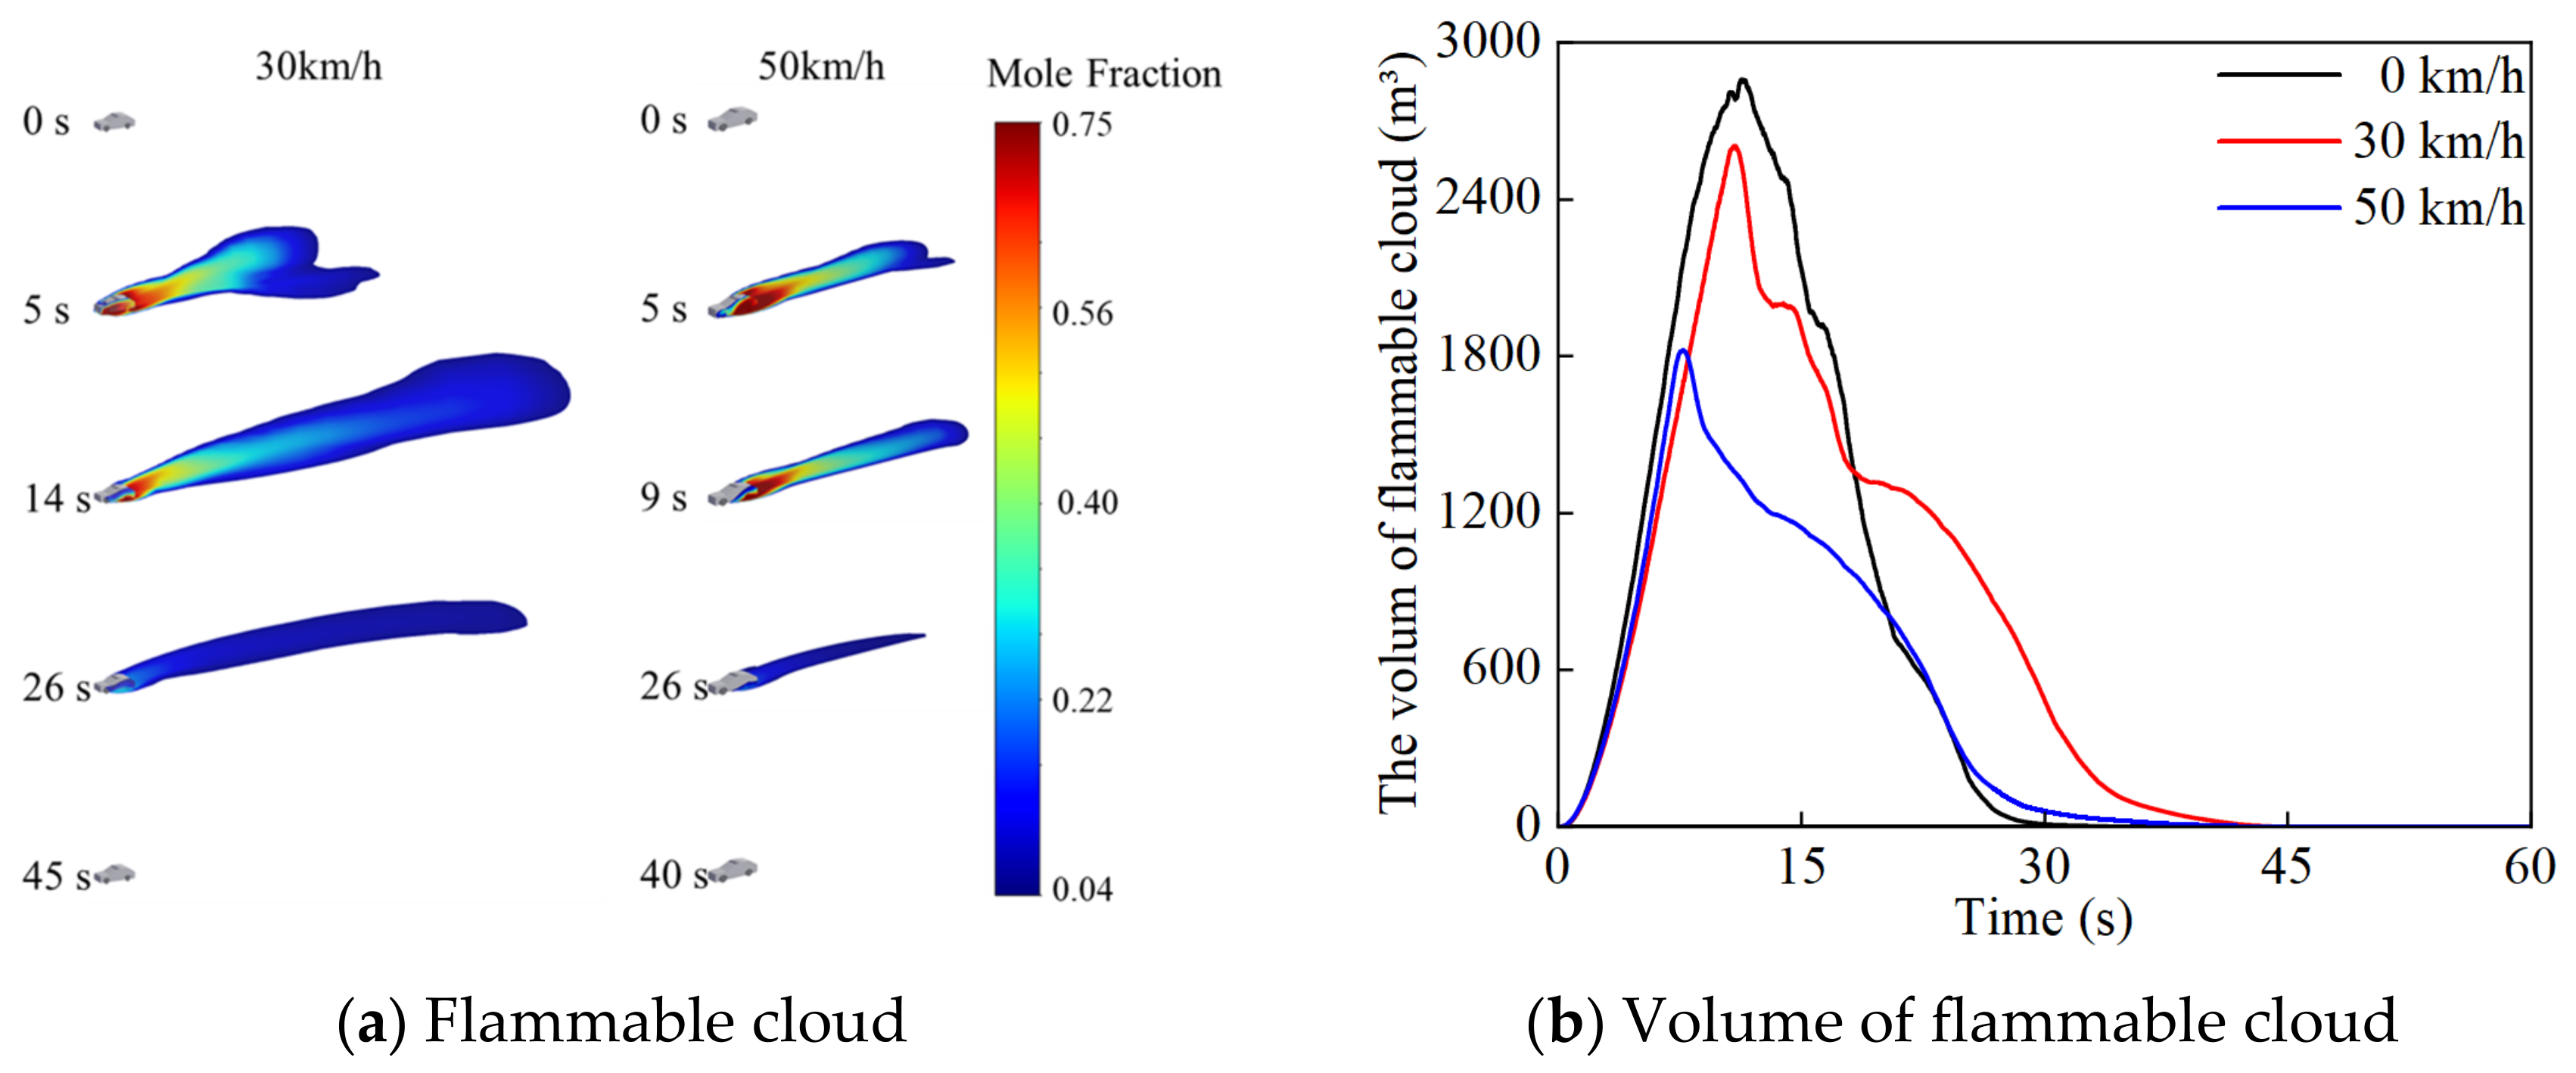
Airflow disturbances induced by vehicle motion significantly modify hydrogen transport through enhanced turbulence and wake effects, altering the spatiotemporal distribution and hazard extent of the flammable cloud. Two typical vehicle speeds of 30 and 50 km/h were considered to quantify the effect of vehicle motion on hydrogen dispersion. Compared with the stationary condition, hydrogen did not accumulate near the vehicle but instead formed an elongated flammable cloud in the downstream wake region. This behavior was attributed to intensified turbulent mixing and shear-layer development in the vehicle wake. These flow structures accelerated hydrogen dilution and promoted downstream transport. The time required for flammable cloud volume to reach maximum cloud volume decreased with increasing vehicle speed, from 11 s at 30 km/h to 8 s at 50 km/h, as shown in Figure 11b. Relative to the stationary condition, the peak flammable cloud volume decreased by 8.9% at 30 km/h and by 36.2% at 50 km/h. Traffic safety regulations typically specify a minimum inter-vehicle distance of 50 m for speeds below 100 km/h. However, the maximum dispersion distance of the flammable cloud exceeded 50 m in both moving-vehicle cases. Enhanced warning and control strategies are required during vehicle operation to maintain adequate separation distances and mitigate downstream hazard propagation.

3.2. Explosion Behavior

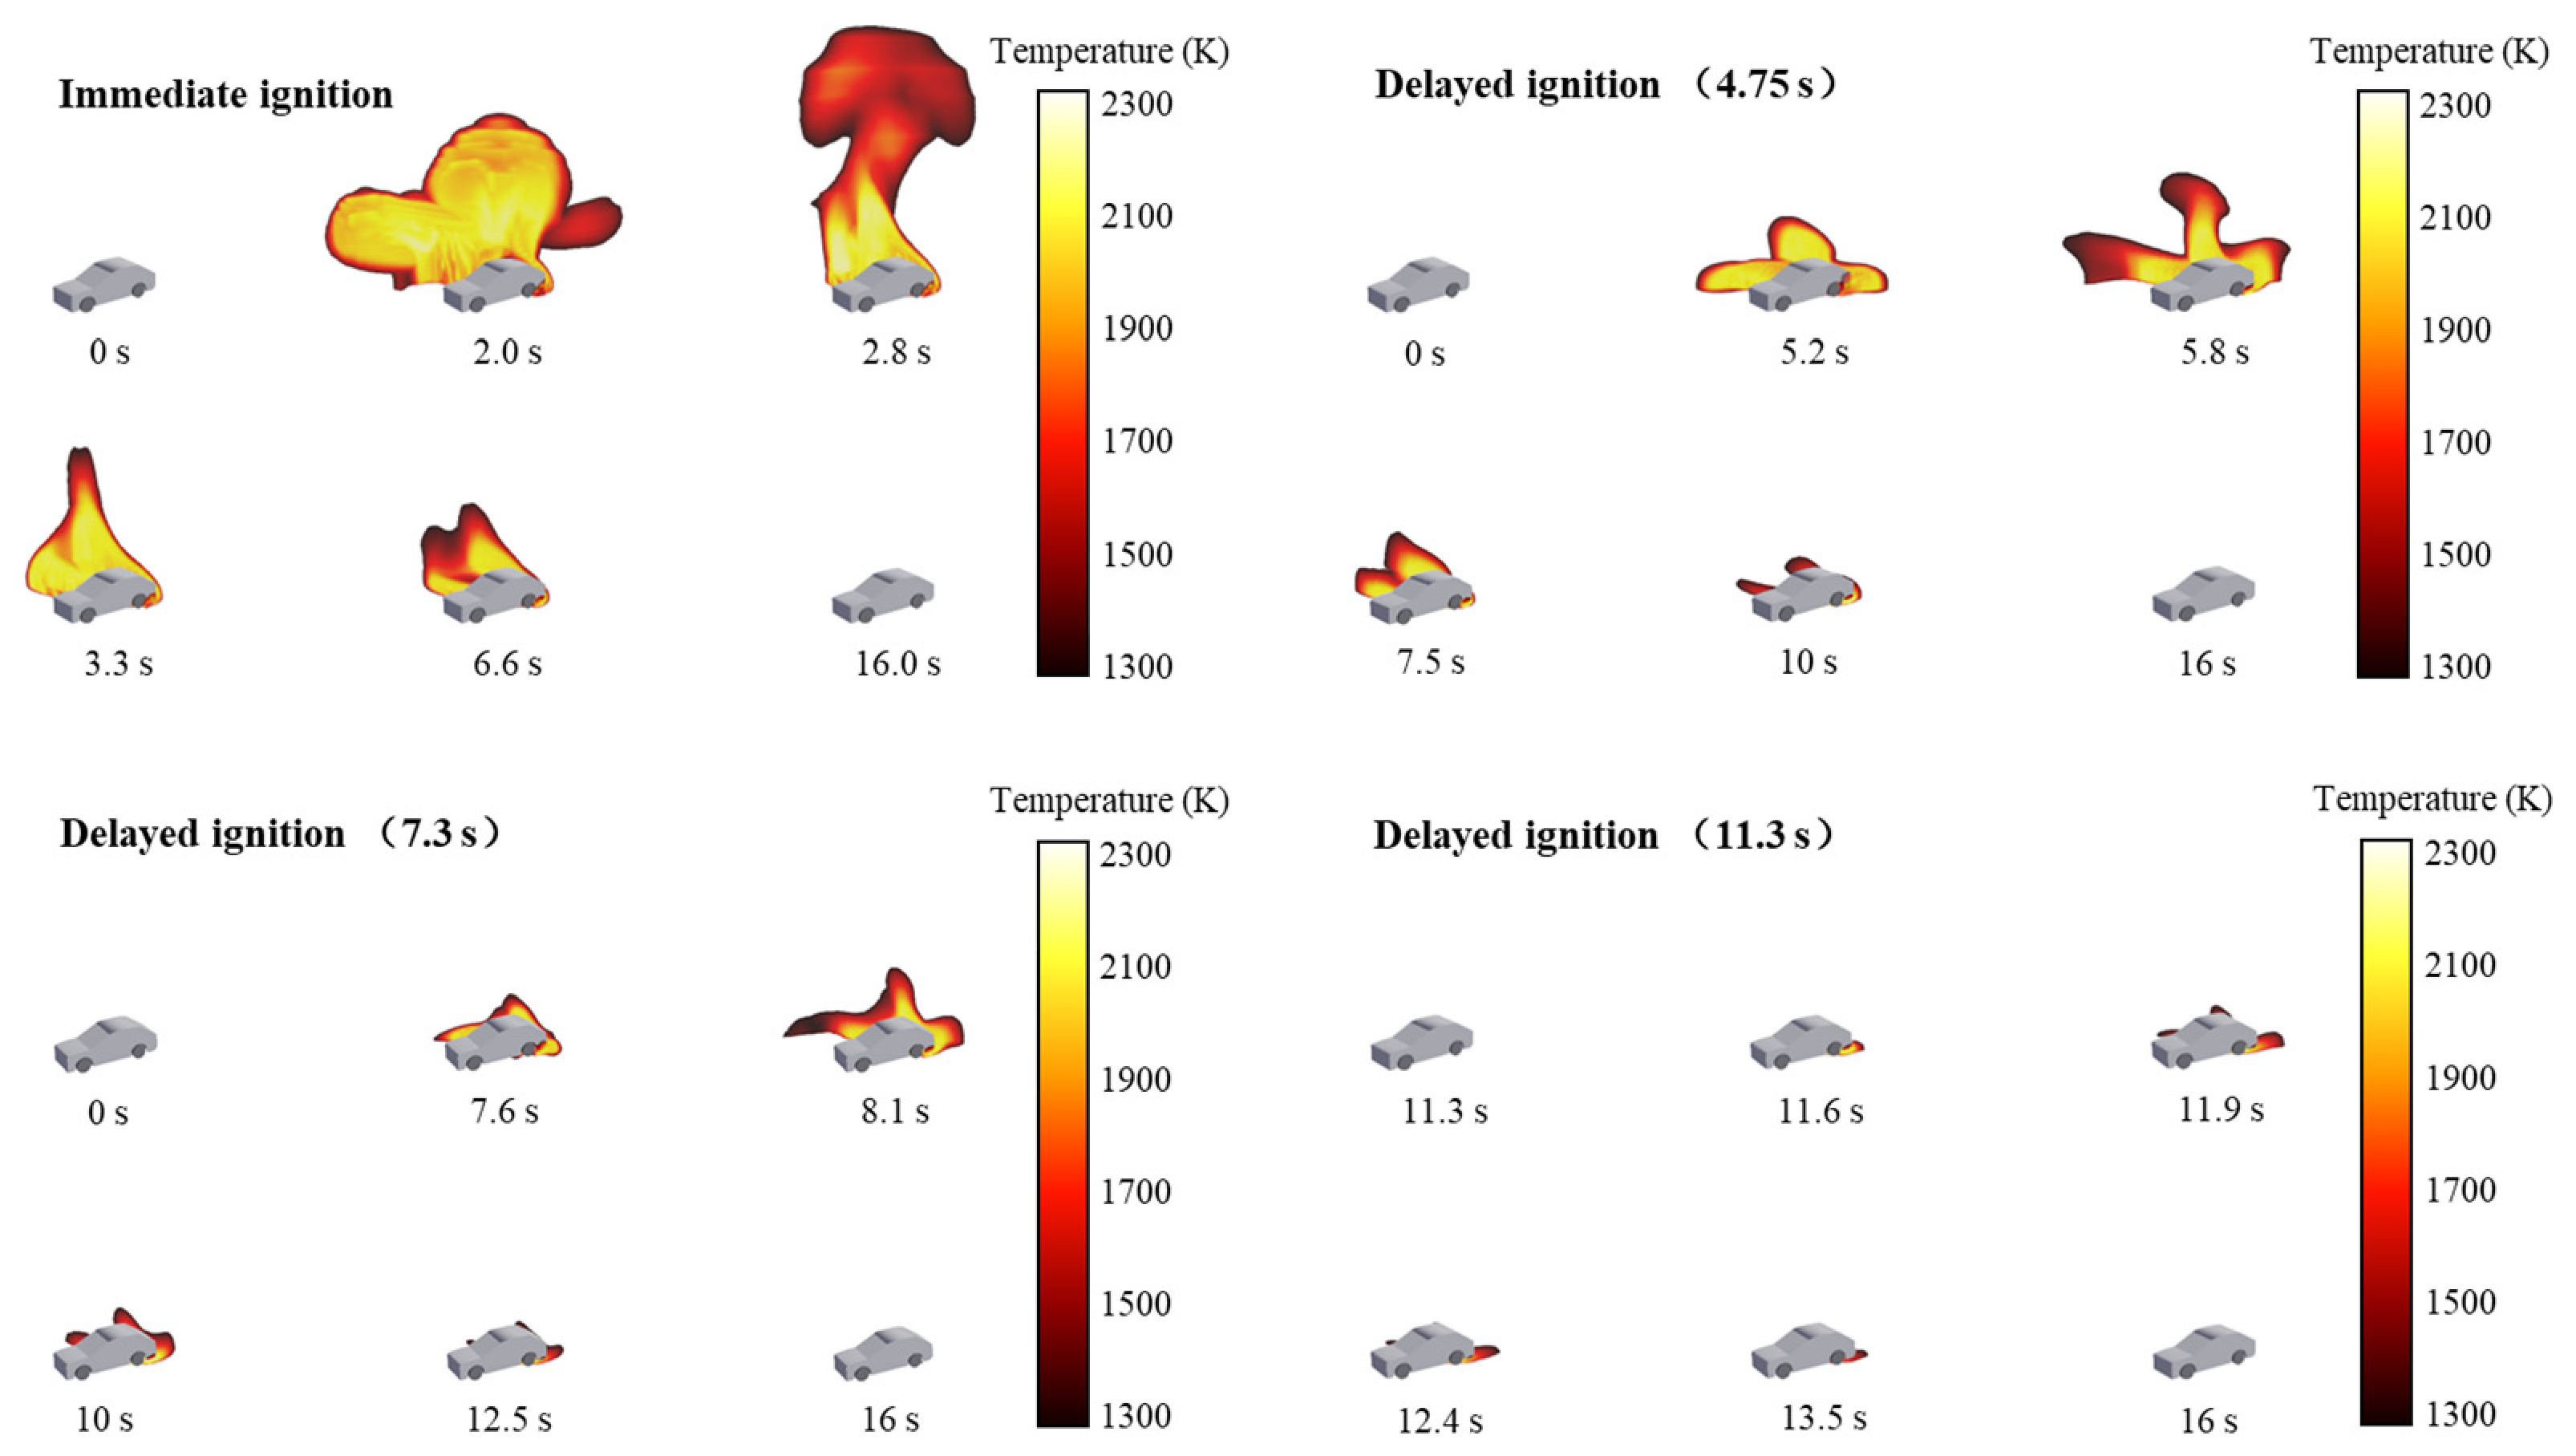
Ignition timing is a critical factor governing accident evolution and hazard severity during hydrogen leakage. A baseline case with an orifice diameter of 4.35 mm, vertically downward leakage, and a stationary vehicle was selected for analysis. Four representative ignition times were selected based on flammable cloud volume: 0 m3 (0.10 s), 1000 m3 (4.75 s), 2000 m3 (7.30 s), and 2855 m3 (11.30 s). A temperature threshold of 1300 K was used to identify visible flames, while critical thresholds of 4.0 kW/m2 for radiative heat flux and 0.07 bar for overpressure were used to quantify hazard extent [37,38,39]. Flame development characteristics and spatial distributions varied with ignition timing, as shown in Figure 12.
For immediate ignition, a stable jet flame formed near the leakage orifice. The flame spread along the underside of the vehicle after impinging on the ground and reached its maximum coverage at approximately 2.8 s. The flame showed pronounced asymmetry due to geometric confinement and nonuniform local mixing. Higher hydrogen concentrations promoted flame propagation on the right and rear sides of the vehicle, while lower concentrations limited flame spread on the left side. As storage pressure decreased, flame intensity weakened, and extinction occurred at approximately 16 s. For delayed-ignition cases, flame development and spatial distributions remained similar to those for immediate ignition. Despite the increase in flammable cloud volume with ignition delay, the maximum flame coverage decreased significantly. This behavior is attributed to enhanced air dilution and fuel-lean conditions in most regions, as sub-threshold hydrogen concentrations limited flame propagation.
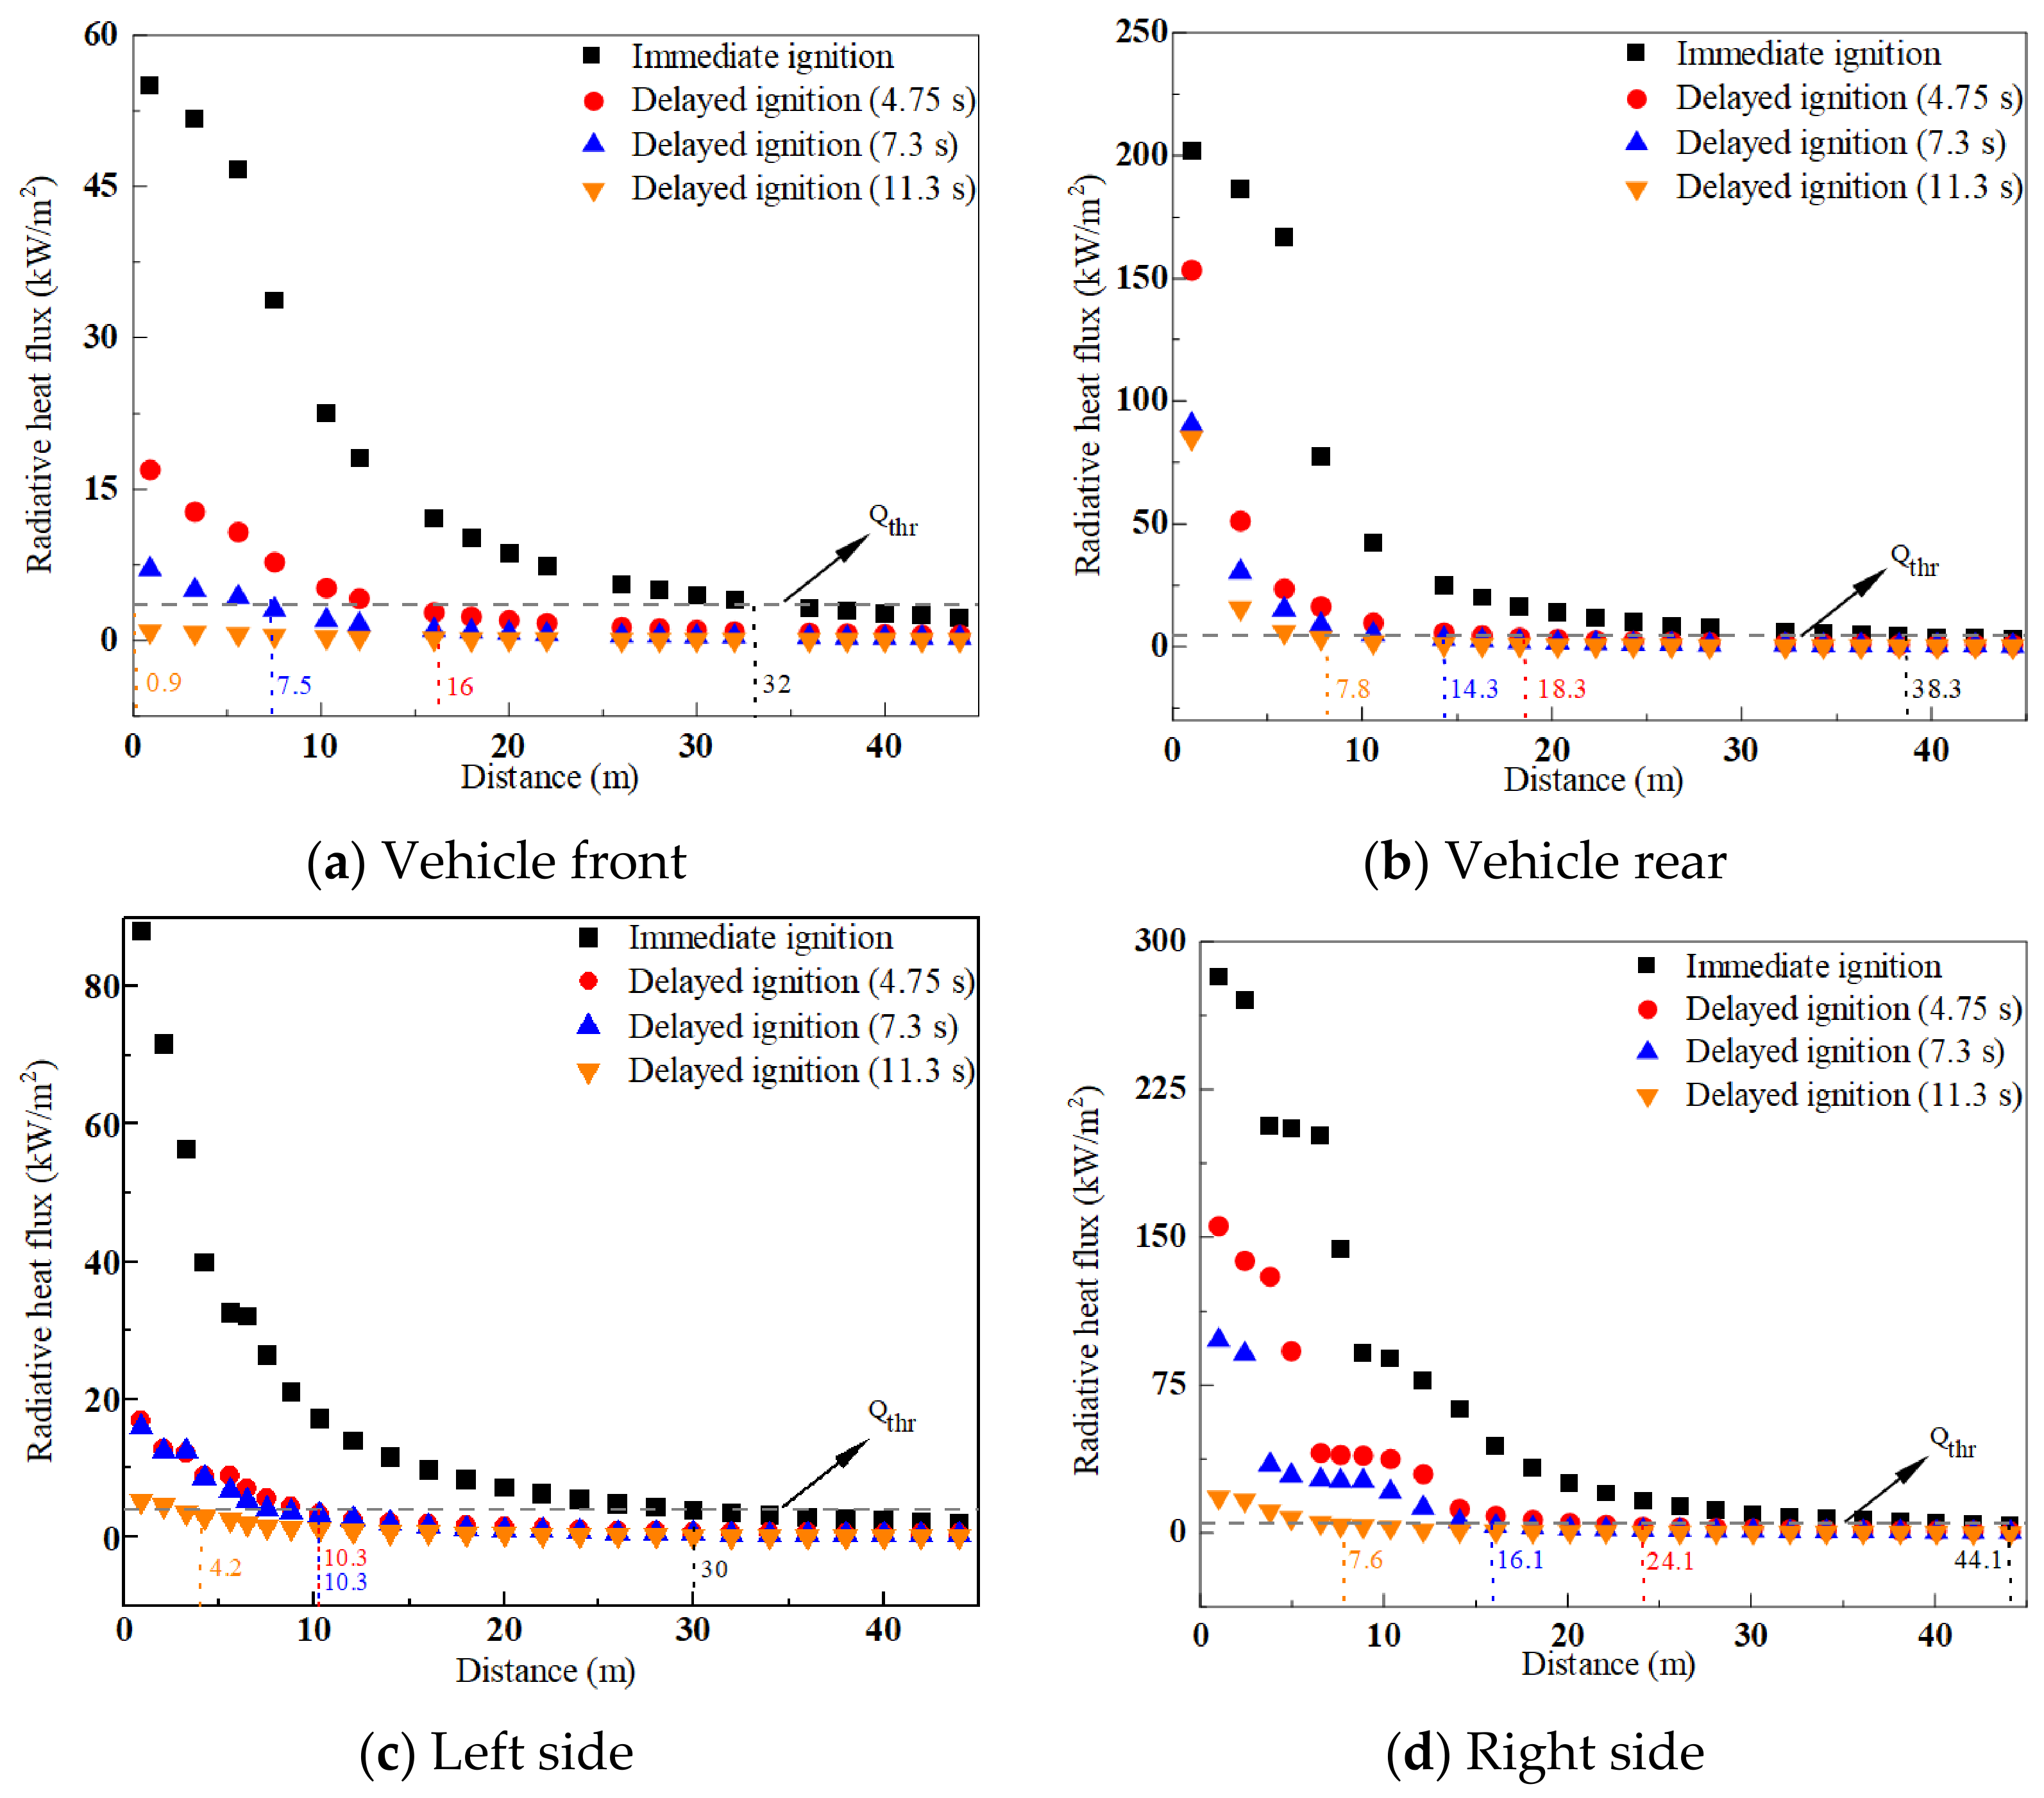
The spatial distributions of radiative heat flux around the vehicle at different ignition times are shown in Figure 13. The critical radiative heat-flux threshold of 4.0 kW/m2 (Qthr) was used as the baseline, and the intersection between this threshold and each radiative heat-flux distribution curve represented the impact distance. The maximum radiative heat flux in all directions showed a monotonic decrease with increasing distance from the vehicle. At the same location, the maximum radiative heat flux decreased significantly with increasing ignition delay. The maximum radiative heat-flux impact distance was used as the risk indicator. Immediate ignition produced the largest impact distance of 44.1 m. When the ignition delay increased to 4.75 s, the impact distance decreased to 24.1 m, representing a 45.4% reduction relative to immediate ignition. Further increases in ignition delay to 7.30 s and 11.30 s reduced the impact distance to 16.1 m and 7.6 m, corresponding to reductions of 63.5% and 82.8%, relative to immediate ignition. Delayed ignition significantly reduced the radiative heat-flux impact range; however, the impact distance still exceeded typical parking spacing, indicating a potential risk of damage to surrounding vehicles in HFCV fires.
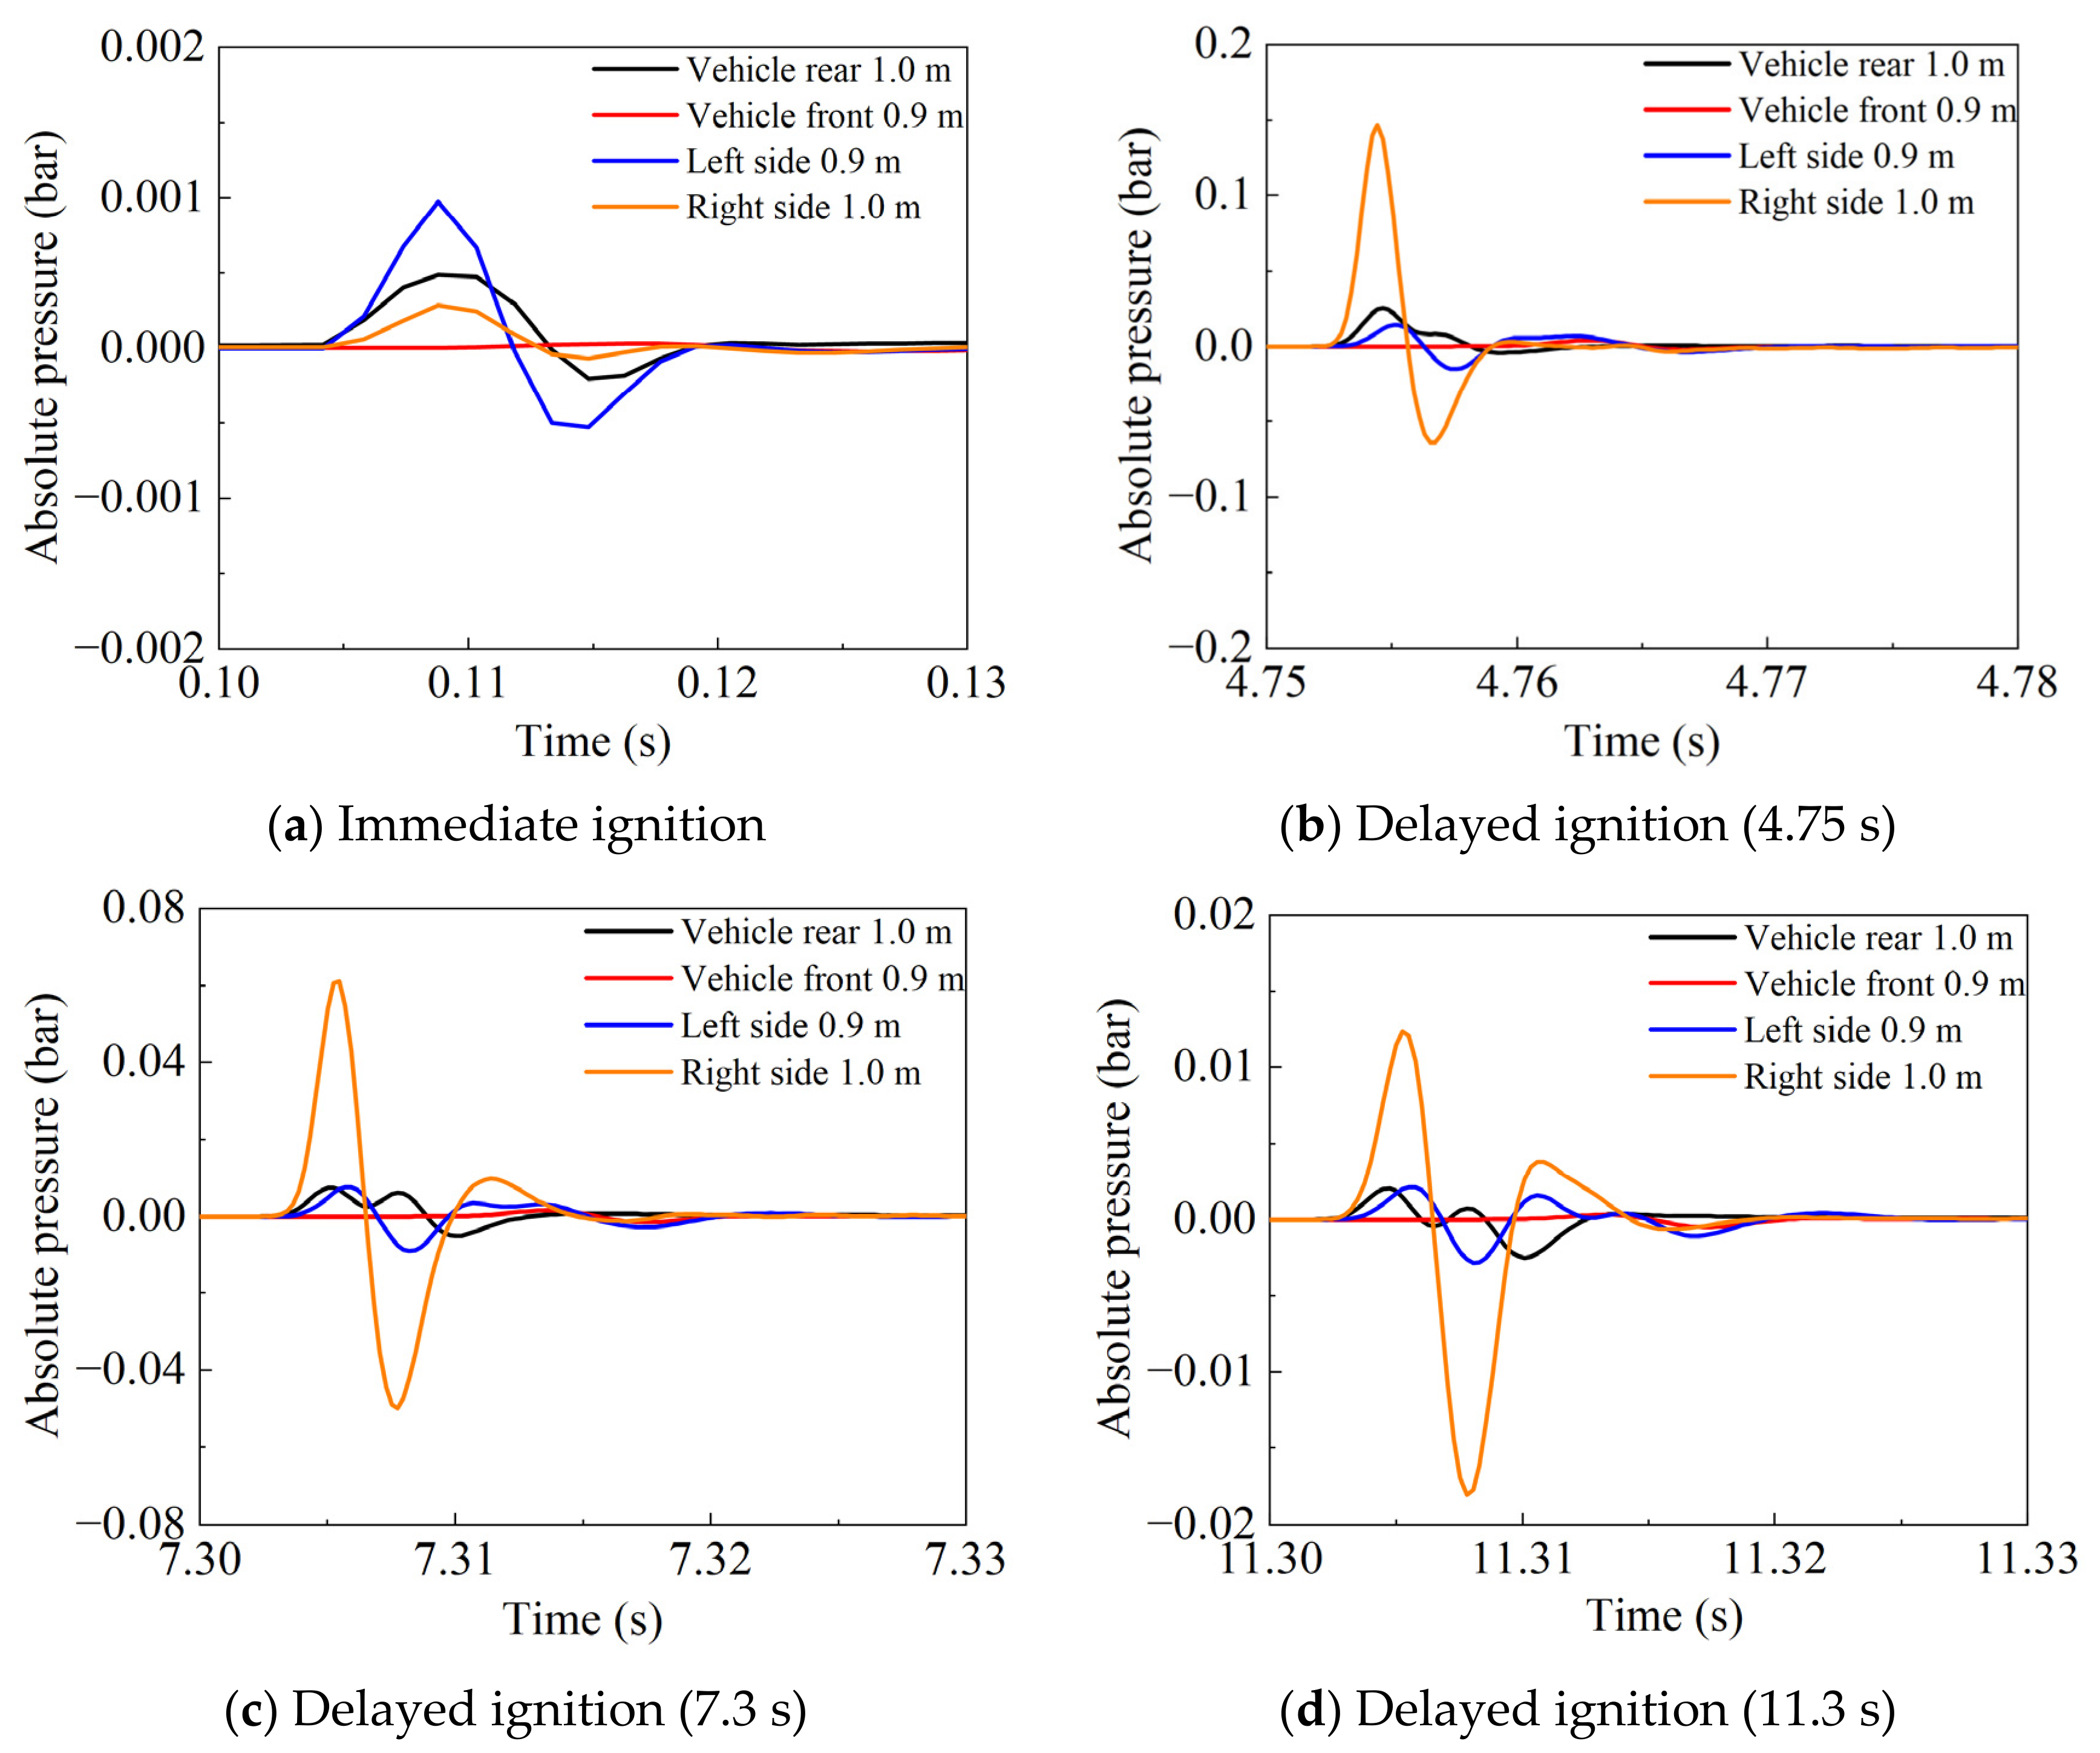
The overpressure distributions around the vehicle at different ignition times are shown in Figure 14. Immediate ignition produced only weak pressure disturbances in the near field, with no distinct shock effects. Delayed ignition led to rapid combustion and deflagration, resulting in significant overpressure. The pressure evolution exhibited a typical positive-negative fluctuation. Initial gas expansion generated a positive pressure peak, followed by rapid outflow that induced a transient negative pressure phase. The highest overpressure occurred on the right side, whereas the front region showed the lowest values. At an ignition time of 4.75 s, the maximum overpressure reached 0.14 bar, exceeding the critical threshold of 0.07 bar and indicating a typical explosion hazard. The overpressure decreased below the damage threshold at a distance of approximately 2.42 m from the vehicle.
Ignition timing governs accident consequences through two distinct mechanisms. Immediate ignition leads to a stable jet flame with the largest radiative heat-flux impact range, whereas delayed ignition promotes deflagration, resulting in significant overpressure hazards. Therefore, risk assessment of HFCV leakage must explicitly account for the distinct effects of ignition timing on thermal radiation and overpressure hazards.
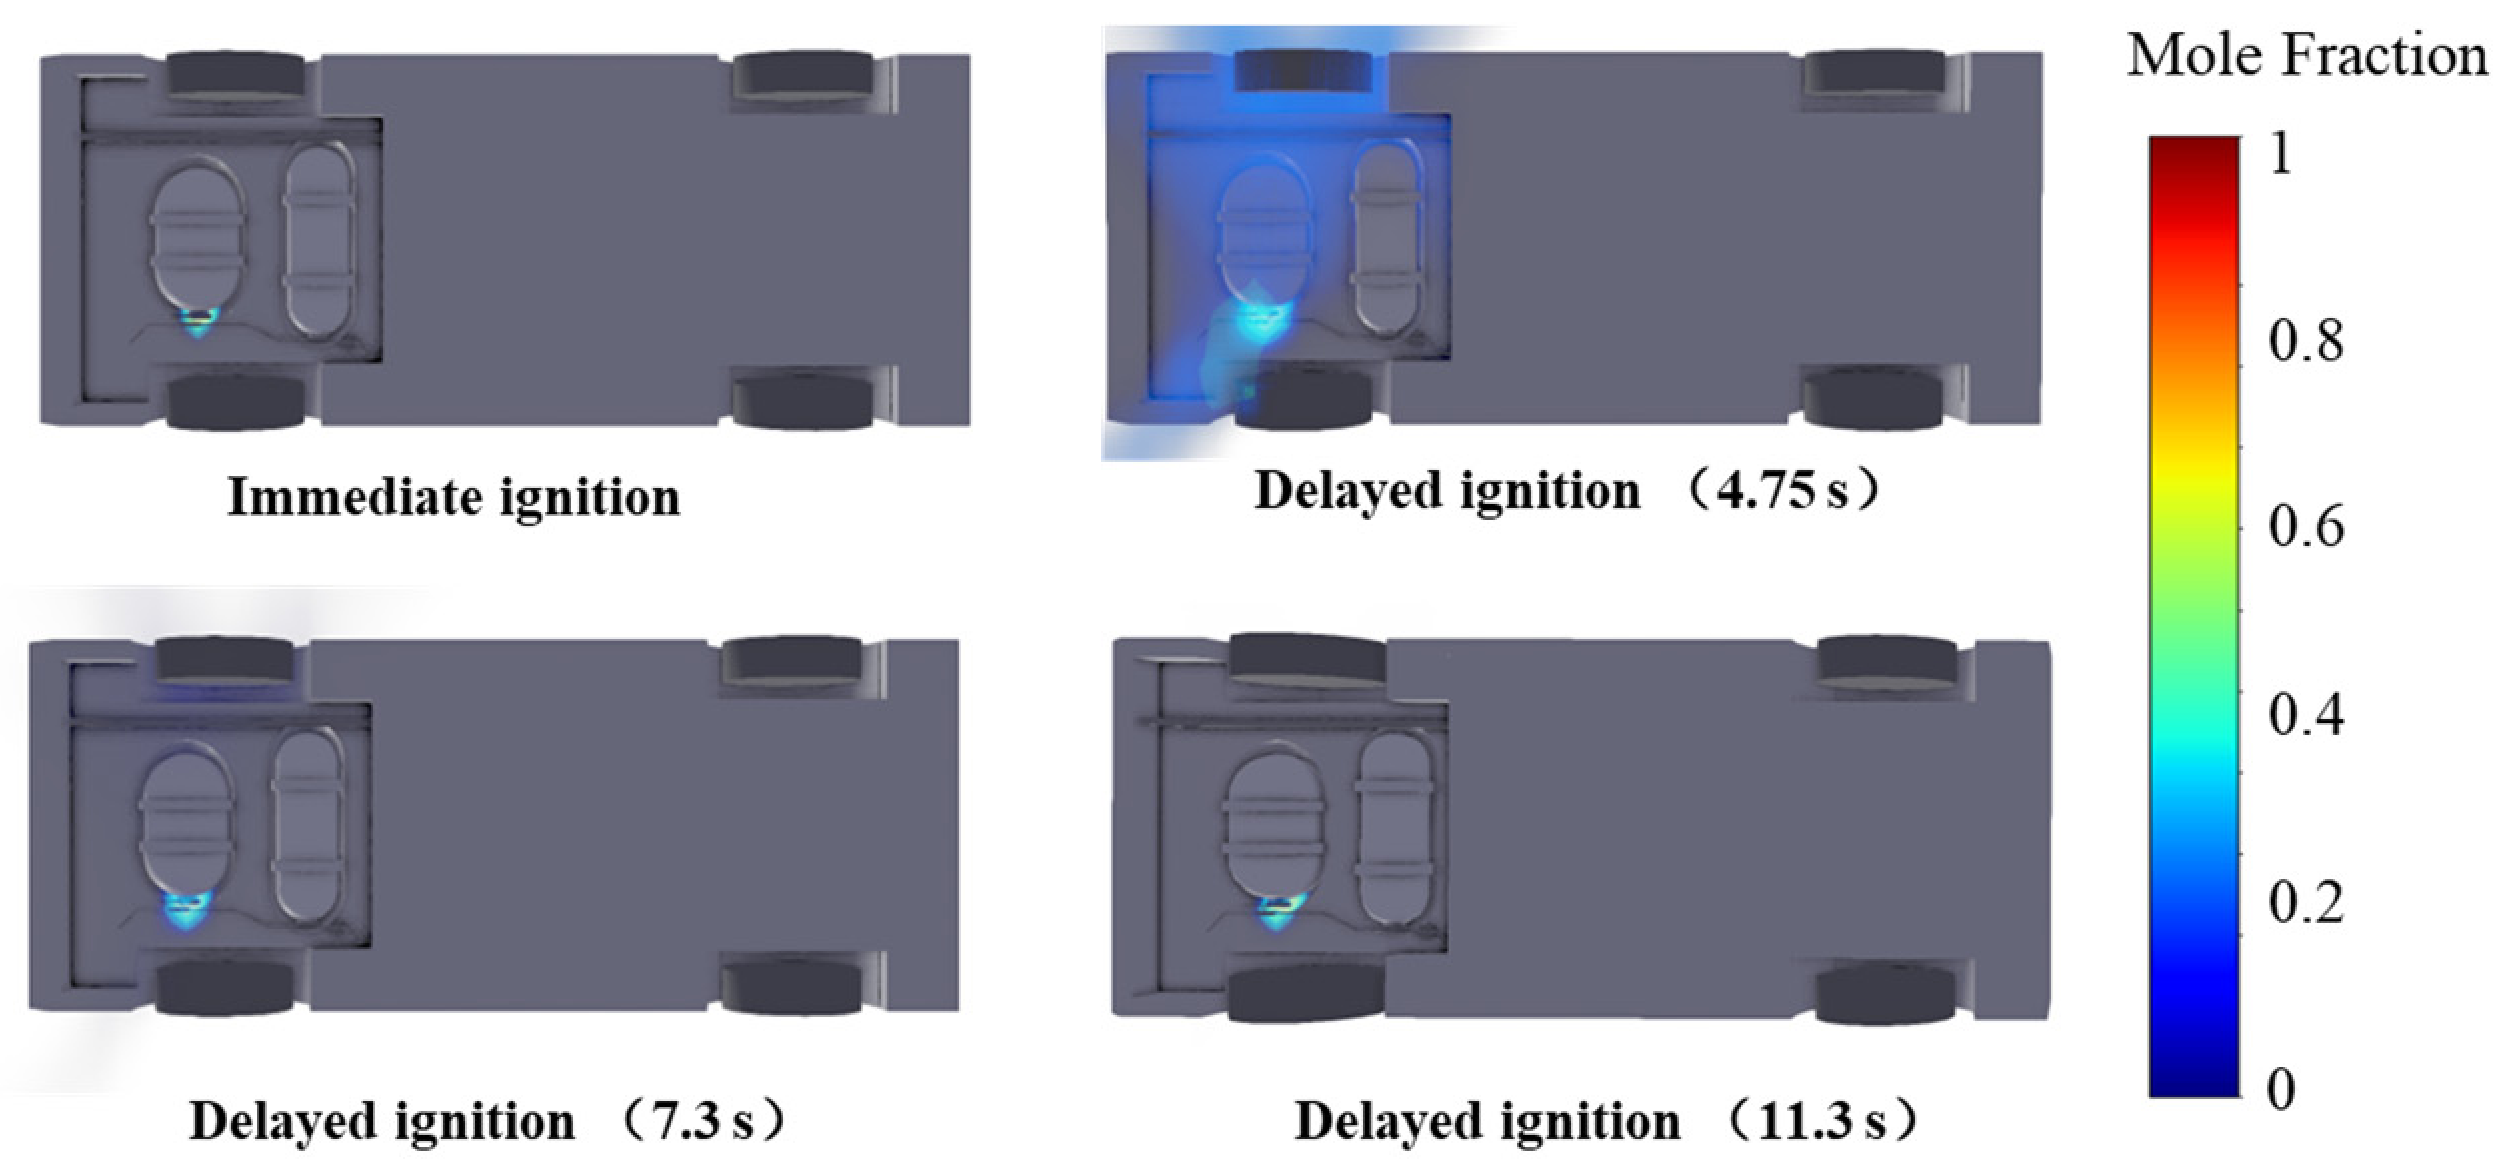
The hydrogen concentration maps beneath the vehicle at different ignition times are shown in Figure 15. In the immediate-ignition case, only a small hydrogen cloud formed near the leakage orifice, and no large-scale flammable cloud had yet formed beneath the vehicle. Therefore, ignition at this stage mainly leads to a local jet fire, with only a limited amount of premixed hydrogen–air mixture participating in rapid combustion, resulting in relatively low overpressure.
At 4.75 s, the hydrogen cloud had expanded significantly beneath the vehicle and remained concentrated around the leakage source, the hydrogen storage system, and nearby underbody structures. This distribution created favorable conditions for rapid combustion and pressure build-up, because the storage cylinders, supports, and vehicle boundaries enhanced local blockage effects and turbulence generation. At this time, the cloud was sufficiently developed but had not yet been substantially diluted or transported away from the near-vehicle region. Therefore, rapid combustion and flame acceleration were promoted, producing the highest overpressure.
At later ignition times, although the total flammable cloud volume continued to increase, the cloud in the near-vehicle underbody region became more dispersed and diluted. Part of the hydrogen cloud was transported away from the critical obstructed region or was further diluted. As a result, the effective amount of hydrogen participating in intense combustion near the vehicle structures decreased, and the overpressure risk also decreased accordingly.

4. Conclusions

This study presents an experimentally validated CFD investigation of hydrogen dispersion and explosion characteristics in HFCVs. The present work integrates real-vehicle geometry, real-vehicle experimental validation, and coupled multi-parameter numerical assessment within a unified framework. Key hazard indicators, including flammable cloud volume, dispersion distance, radiative heat-flux impact distance, and explosion overpressure, were quantified to characterize the evolution of hydrogen leakage hazards. The main findings are summarized as follows:
First, the leakage orifice diameter was found to be a dominant factor governing the volume and persistence of the flammable hydrogen cloud. When the orifice diameter decreased from 4.35 mm to 0.435 mm, the maximum flammable cloud volume was reduced by up to 91.5%, whereas the cloud duration increased approximately fourfold. This indicates that small-orifice leakage produces a more spatially confined but longer-lasting flammable cloud, potentially increasing the likelihood of delayed ignition. In contrast, large-orifice leakage rapidly generates a larger flammable cloud, resulting in a higher instantaneous hazard.
Second, the leakage direction significantly influenced the distribution of the flammable hydrogen cloud. Compared with vertical downward leakage at 90°, the maximum flammable cloud volume decreased by 35.6%, 71.6%, and 57.3% under the 60°, 30°, and 0° leakage conditions, respectively. This result indicates that backward-inclined leakage can effectively mitigate hydrogen accumulation around the vehicle body. However, under horizontal leakage, the jet was obstructed by the baffle, which promoted lateral dispersion and intensified local hydrogen accumulation on both sides of the vehicle. Therefore, the release direction of the TPRD and the arrangement of surrounding structures should be jointly considered in onboard hydrogen storage system design.
Third, vehicle motion had a dual effect on the dispersion behavior of the flammable hydrogen cloud. On the one hand, the enhanced turbulent mixing and dilution near the leakage source reduced the peak flammable cloud volume by 36.2% at a vehicle speed of 50 km/h. On the other hand, vehicle-induced airflow promoted the downstream transport of the flammable cloud, extending the affected distance to more than 50 m. Therefore, leakage detection and emergency shutdown should be strengthened during vehicle operation to reduce the risk of delayed ignition in downstream regions.
Fourth, ignition timing was found to have a critical influence on the fire and explosion consequences of underbody hydrogen leakage. Under immediate ignition, a fully developed flammable premixed cloud had not yet formed, and combustion was dominated by jet-flame behavior, leading to the highest thermal radiation hazard. When ignition was delayed to 4.75 s, a larger flammable premixed cloud accumulated near the underbody structures. The confined space and obstacle-induced turbulence promoted flame acceleration and pressure buildup, resulting in higher explosion overpressure. With further ignition delay, the hydrogen cloud beneath the vehicle gradually disperses and dilutes, reducing the amount of effective flammable mixture involved in intense combustion and thereby lowering both thermal radiation and overpressure hazards. These results indicate that the maximum explosion risk is governed by the spatial distribution of the flammable cloud within confined regions and its coupling with ignition timing.
Compared with idealized geometries or single-parameter analyses, this approach provides a more realistic representation of the effects of vehicle structures, leakage conditions, and ignition timing on accident consequences. The findings provide quantitative support for HFCV risk assessment, emergency response planning, and the safety-oriented design of onboard hydrogen storage systems. Future work should further extend the present framework to more complex scenarios, such as multi-vehicle interactions and crosswind environments. In addition, integrating leakage detection with real-time consequence prediction would further improve the active safety management of HFCVs.

Author Contributions

Conceptualization, X.L.; methodology, X.L.; validation, X.L. and Z.W.; formal analysis, Z.W.; investigation, D.W.; resources, P.C. and W.Z.; data curation, D.W.; writing—original draft preparation, Z.W. and D.W.; writing—review and editing, Z.W.; visualization, Z.W.; supervision, H.L. and S.N.; project administration, H.L. and S.N.; funding acquisition, X.L. All authors have read and agreed to the published version of the manuscript.

Funding

This study was supported by the National Key R&D Program of China, grant number 2023YFE0199100 and the National Natural Science Foundation of China, grant number 52176191 and 52306255.

Data Availability Statement

The raw data supporting the conclusions of this article will be made available by the authors on request.

Conflicts of Interest

Author Dianji Wang was employed by the company Dalian Boiler and Pressure Vessel Inspection & Testing Institute Co., Ltd., Authors Huan Liu and Shishuai Nie were employed by SINOPEC Research Institute of Safety Engineering Co., Ltd., and Authors Peirong Chen and Wenfeng Zhan were employed by Guangzhou Automobile Group Co., Ltd. The remaining authors declare that the research was conducted in the absence of any commercial or financial relationships that could be construed as a potential conflict of interest.

Appendix A

Table A1. Comparison of recent studies on hydrogen leakage, dispersion, ignition, and consequence assessment related to HFCVs.
Research CategoryRepresentative StudiesResearch ScenarioMain Findings
Full-scale vehicle leakage, ignition and fire experimentsGupta et al. (2009) [40]; Kim et al. (2009) [41]; Maeda et al. (2006) [25]; Maeda et al. (2017) [42]; Merilo et al. (2011) [11]; Tamura et al. (2014) [43]; Xiang (2025) [21];Yao et al. (2026) [44]Full-scale HFCV leakage, garage release, passenger-cabin dispersion, and ignition/fire tests.Provide rare experimental data on hydrogen accumulation, flame development, and fire behavior under realistic vehicle-scale conditions.
Vehicle-component and onboard-system hydrogen dispersion modelingGao et al. (2026) [45]; Jiao et al. (2021) [27]; Li and Xin (2025) [9]; Li et al. (2022) [46]; Liu et al. (2025) [47]; Salva et al. (2012) [48]; Shen et al. (2023) [49]; Song et al. (2024) [50]; Wang et al. (2023) [51]Hydrogen leakage from cabins, front compartments, chassis/underfloor regions, tube fittings, supply pipelines and onboard vehicle structures.Clarify how the components of the vehicle and the local structural constraints affect the accumulation of hydrogen gas and the evolution of flammable clouds in the local area.
Confined infrastructure and traffic-environment scenariosChen et al. (2025) [52]; Dai et al. (2024) [53]; Duan et al. (2024) [12]; Gao et al. (2024) [16]; Li et al. (2021) [28]; Lv et al. (2024) [26]; Pan et al. (2024) [54]; Park et al. (2022) [22]; Ryu and Lee (2021) [7]; Shen et al. (2021) [8]; Song et al. (2025) [32]; Yan et al. (2024) [17]; Zhang et al. (2025) [30]Garages, underground parking facilities, tunnels, shipping cabins, highways and other environments involving HFCVs.Show how surrounding infrastructure and traffic environments influence hydrogen accumulation, migration, flammable cloud dissipation, and accident consequences.
Detection, sensor layout and active mitigationCui et al. (2025) [55]; Liu and Christopher (2015) [56]; Liu and He (2023) [57]; Park et al. (2024) [58]; Tamura et al. (2014) [43]; Xie et al. (2025) [59]Hydrogen sensor placement, leakage localization, emergency response.Support active safety by improving detection speed, source localization, sensor layout, emergency response, and mitigation effectiveness.
Risk assessmentGu et al. (2025) [31]; Yang et al. (2026) [60]Risk evolution and consequence quantification for HFCV leakage, fire, and explosion scenarios.Provide decision-oriented frameworks for ranking accident risks and identifying critical leakage, fire, and explosion consequence pathways.

References

  1. Hydrogen Council; McKinsey & Company. Global Hydrogen Compass 2025; Hydrogen Council: Brussels, Belgium, 2025. [Google Scholar]
  2. Haoxin, D.; Qiyuan, D.; Chaojie, L.; Nian, L.; Zhang, W.; Hu, M.; Xu, C. A comprehensive review on renewable power-to-green hydrogen-to-power systems: Green hydrogen production, transportation, storage, re-electrification and safety. Appl. Energy 2025, 390, 125821. [Google Scholar] [CrossRef] [Scilit]
  3. Kamran, M.; Turzyński, M. Exploring hydrogen energy systems: A comprehensive review of technologies, applications, prevailing trends, and associated challenges. J. Energy Storage 2024, 96, 112601. [Google Scholar] [CrossRef] [Scilit]
  4. Agyekum, E.B.; Odoi-Yorke, F.; Abbey, A.A.; Ayetor, G.K. A review of the trends, evolution, and future research prospects of hydrogen fuel cells—A focus on vehicles. Int. J. Hydrogen Energy 2024, 72, 918–939. [Google Scholar] [CrossRef] [Scilit]
  5. Calabrese, M.; Portarapillo, M.; Di Nardo, A.; Venezia, V.; Turco, M.; Luciani, G.; Di Benedetto, A. Hydrogen Safety Challenges: A Comprehensive Review on Production, Storage, Transport, Utilization, and CFD-Based Consequence and Risk Assessment. Energies 2024, 17, 1350. [Google Scholar] [CrossRef] [Scilit]
  6. Lan, H.; Wang, G.; Zhao, K.; He, Y.; Zheng, T. Review on the Hydrogen Dispersion and the Burning Behavior of Fuel Cell Electric Vehicles. Energies 2022, 15, 7295. [Google Scholar] [CrossRef] [Scilit]
  7. Ryu, J.-O.; Lee, H.-Y. A basic study on the hazard of hydrogen feul cell vehicles in road tunnels. J. Korean Tunn. Undergr. Space Assoc. 2021, 23, 47–60. [Google Scholar] [CrossRef]
  8. Shen, Y.; Zheng, T.; Lv, H.; Zhou, W.; Zhang, C. Numerical Simulation of Hydrogen Leakage from Fuel Cell Vehicle in an Outdoor Parking Garage. World Electr. Veh. J. 2021, 12, 118. [Google Scholar] [CrossRef] [Scilit]
  9. Li, C.; Xin, Z. Analysis of Hydrogen Leakage and Influencing Factors of Fuel Cell Vehicles in Enclosed Spaces. Batteries 2025, 11, 247. [Google Scholar] [CrossRef] [Scilit]
  10. Diao, S.; Li, H.; Wang, J.; Wei, C.; Yao, Y.; Yu, M. Hydrogen leakage location prediction for fuel cell vehicles in parking lots: A combined study of CFD simulation and CNN-BiLSTM modeling. Int. J. Hydrogen Energy 2025, 109, 115–128. [Google Scholar] [CrossRef] [Scilit]
  11. Merilo, E.G.; Groethe, M.A.; Colton, J.D.; Chiba, S. Experimental study of hydrogen release accidents in a vehicle garage. Int. J. Hydrogen Energy 2011, 36, 2436–2444. [Google Scholar] [CrossRef] [Scilit]
  12. Duan, Q.; Xin, J.; Zhang, H.; Hou, Z.; Duan, P.; Jin, K.; Sun, J. Experimental and numerical studies on hydrogen leakage and dispersion in underground parking garages: Impact of leakage direction on safety considerations. Saf. Sci. 2024, 180, 106643. [Google Scholar] [CrossRef] [Scilit]
  13. Yang, N.; Deng, J.; Deng, T.; Wang, C. Experimental study on the distribution characteristics of hydrogen leakage in three-dimensional parking garages. Int. J. Hydrogen Energy 2024, 93, 520–535. [Google Scholar] [CrossRef] [Scilit]
  14. Hu, D.; Gao, P.; Cheng, Z.; Shen, Y.; He, R.; Yi, F.; Lu, M.; Wang, J.; Liu, S. Comprehensive Review of Hydrogen Leakage in Relation to Fuel Cell Vehicles and Hydrogen Refueling Stations: Status, Challenges, and Future Prospects. Energy Fuels 2024, 38, 4803–4835. [Google Scholar] [CrossRef] [Scilit]
  15. Li, Y.; Zhang, S.; Yu, M.; Wu, Y.; Wu, J.; Jiang, L. Dispersion of High-Pressure Hydrogen Jets in Open-Top and Indoor Environments: Effects of Leak Geometry and Pressure. Hydrogen 2025, 6, 107. [Google Scholar] [CrossRef] [Scilit]
  16. Gao, Y.; Liu, H.; Hou, Y. Effects of leakage location and ventilation condition on hydrogen leakage during shipping of fuel cell vehicles. Int. J. Hydrogen Energy 2024, 54, 1532–1543. [Google Scholar] [CrossRef] [Scilit]
  17. Yan, M.; Wang, W.; Tian, S.; Yang, J.; Liu, J.; Jiang, Z. Hydrogen leakage distribution and migration analysis under multiple factors in underground cross-river tunnel. Tunn. Undergr. Space Technol. 2024, 152, 105947. [Google Scholar] [CrossRef] [Scilit]
  18. Zhao, M.; Huang, T.; Liu, C.; Chen, M.; Ji, S.; Christopher, D.M.; Li, X. Leak localization using distributed sensors and machine learning for hydrogen releases from a fuel cell vehicle in a parking garage. Int. J. Hydrogen Energy 2021, 46, 1420–1433. [Google Scholar] [CrossRef] [Scilit]
  19. Han, H.; Chang, X.; Duan, P.; Li, Y.; Zhu, J.; Kong, Y. Study on the leakage and diffusion behavior of hydrogen-blended natural gas in utility tunnels. J. Loss Prev. Process Ind. 2023, 85, 105151. [Google Scholar] [CrossRef] [Scilit]
  20. Li, Z.; Pan, X.; Sun, K.; Ma, J. Evaluation on the harm effects of accidental releases from cryo-compressed hydrogen tank for fuel cell cars. Int. J. Hydrogen Energy 2013, 38, 8199–8207. [Google Scholar] [CrossRef] [Scilit]
  21. Xiang, D.; Mao, Z.; Fu, N.; Yi, S.; Zhang, X.; Li, Y. Fire test research on on-board hydrogen system of hydrogen fuel cell buses. Press. Vessel Technol. 2025, 42, 23. [Google Scholar] [CrossRef]
  22. Park, J.; Yoo, Y.; Ryu, J.; Lee, H. Study on the Explosion of the Hydrogen Fuel Tank of Fuel Cell Electric Vehicles in Semi-Enclosed Spaces. Energies 2022, 16, 241. [Google Scholar] [CrossRef] [Scilit]
  23. Tamura, Y.; Takabayashi, M.; Takeuchi, M. The spread of fire from adjoining vehicles to a hydrogen fuel cell vehicle. Int. J. Hydrogen Energy 2014, 39, 6169–6175. [Google Scholar] [CrossRef] [Scilit]
  24. Maeda, Y.; Itoi, H.; Tamura, Y.; Suzuki, J.; Watanabe, S. Diffusion and Ignition Behavior on the Assumption of Hydrogen Leakage from a Hydrogen-Fueled Vehicle. In Proceedings of the SAE 2007 World Congress & Exhibition, Detroit, MI, USA, 16 April 2007. [Google Scholar] [CrossRef] [Scilit]
  25. Maeda, Y.; Takahashi, M.; Tamura, Y.; Suzuki, J.; Watanabe, S. Test of Vehicle Ignition Due to Hydrogen Gas Leakage. In Proceedings of the SAE 2006 World Congress & Exhibition, Detroit, MI, USA, 3 April 2006. [Google Scholar] [CrossRef] [Scilit]
  26. Lv, H.; Hu, Y.; Shen, Y.; Bi, C.; Lan, H.; Zhang, C. Numerical study of hydrogen leakage, diffusion and explosion in the parking garage under closed and natural ventilation conditions. Int. J. Hydrogen Energy 2024, 83, 210–225. [Google Scholar] [CrossRef] [Scilit]
  27. Jiao, M.; Zhu, H.; Huang, J.; Zhang, X. Numerical Simulation of Hydrogen Leakage and Diffusion Process of Fuel Cell Vehicle. World Electr. Veh. J. 2021, 12, 193. [Google Scholar] [CrossRef] [Scilit]
  28. Li, Y.; Xiao, J.; Zhang, H.; Breitung, W.; Travis, J.; Kuznetsov, M.; Jordan, T. Numerical analysis of hydrogen release, dispersion and combustion in a tunnel with fuel cell vehicles using all-speed CFD code GASFLOW-MPI. Int. J. Hydrogen Energy 2021, 46, 12474–12486. [Google Scholar] [CrossRef] [Scilit]
  29. Wang, Y.; Xu, C.; Zhao, G.; Zeng, Y.; Han, R.; He, T. Numerical simulation study on hydrogen leakage and explosion of hydrogen fuel cell buses. Sci. Rep. 2025, 15, 31976. [Google Scholar] [CrossRef] [Scilit] [PubMed]
  30. Zhang, J.; Lyu, X.; Wang, L.; Zhang, S.; Li, X. Hydrogen Leakage Risks and Mitigation Measures in Large Underground Garages. J. Energy Resour. Technol. Part A Sustain. Renew. Energy 2025, 1, 032101. [Google Scholar] [CrossRef] [Scilit]
  31. Gu, B.; Liu, H.; Zhang, T.; Gao, Y.; Chen, W.; Liu, Z.; Liu, S.; Yang, Y.; Liang, C. Hydrogen leakage risk analysis of hydrogen fuel emergency power vehicle multi-scenario based on dynamic Bayesian network. Int. J. Hydrogen Energy 2025, 136, 173–185. [Google Scholar] [CrossRef] [Scilit]
  32. Song, B.; Wang, X.; Kang, Y.; Li, H.; Li, M.; Cheng, Z. Hydrogen fuel cell vehicles on highways: Leakage diffusion characteristics and safety assessment. Process Saf. Environ. Prot. 2025, 199, 107255. [Google Scholar] [CrossRef] [Scilit]
  33. Ren, Z.; Giannissi, S.; Venetsanos, A.G.; Friedrich, A.; Kuznetsov, M.; Jordan, T.; Wen, J.X. The evolution and structure of ignited high-pressure cryogenic hydrogen jets. Int. J. Hydrogen Energy 2022, 47, 29184–29194. [Google Scholar] [CrossRef] [Scilit]
  34. Fan, R.; Pan, Y.; Xiao, Y.; Wang, Z. Investigation on flame propagation characteristics and critical ignition criteria of hydrogen jet. Int. J. Hydrogen Energy 2024, 57, 1437–1445. [Google Scholar] [CrossRef] [Scilit]
  35. Lowesmith, B.J.; Hankinson, G. Large scale high pressure jet fires involving natural gas and natural gas/hydrogen mixtures. Process Saf. Environ. Prot. 2012, 90, 108–120. [Google Scholar] [CrossRef] [Scilit]
  36. Makarov, D.; Molkov, V. Plane hydrogen jets. Int. J. Hydrogen Energy 2013, 38, 8068–8083. [Google Scholar] [CrossRef] [Scilit]
  37. Yu, Q.; Hou, L.; Chai, C.; Li, Y. Investigation of flame length and damage range of high-pressure natural gas pipeline. Pet. Sci. Bull. 2022, 4, 593–603. [Google Scholar] [CrossRef]
  38. Yu, M.; Feng, C.; Zeng, Q.; Guo, X. The damage criterion of thermal radiation and the damage radius of pool fire. China Saf. Sci. J. 1996, 2, 8–13. [Google Scholar] [CrossRef]
  39. Yu, M.; Feng, C.; Zeng, Q.; Guo, X. The destructive effect and injury zones of an explosion. China Saf. Sci. J. 1995, 2, 13–17. [Google Scholar] [CrossRef]
  40. Gupta, S.; Brinster, J.; Studer, E.; Tkatschenko, I. Hydrogen related risks within a private garage: Concentration measurements in a realistic full scale experimental facility. Int. J. Hydrogen Energy 2009, 34, 5902–5911. [Google Scholar] [CrossRef] [Scilit]
  41. Kim, J.; Lee, S.; Hwang, I.; Lim, T. The Safety of Hydrogen Release and Discharge From a Fuel Cell Vehicle. In Proceedings of the ASME 2009 7th International Conference on Fuel Cell Science, Engineering and Technology; ASMEDC: Newport Beach, CA, USA, 2009; pp. 783–787. [Google Scholar] [CrossRef] [Scilit]
  42. Maeda, K.; Tamura, Y. Characteristics of hydrogen leakage sound from a fuel-cell vehicle by hearing. Int. J. Hydrogen Energy 2017, 42, 7331–7339. [Google Scholar] [CrossRef] [Scilit]
  43. Tamura, Y.; Takeuchi, M.; Sato, K. Effectiveness of a blower in reducing the hazard of hydrogen leaking from a hydrogen-fueled vehicle. Int. J. Hydrogen Energy 2014, 39, 20339–20349. [Google Scholar] [CrossRef] [Scilit]
  44. Yao, Y.; Pan, A.; Hu, M.; Tan, L.; Wang, Y.; Zhan, S. Experimental investigation on in-cabin hydrogen leakage and diffusion characteristics in hydrogen fuel cell vehicles. Fuel 2026, 406, 136913. [Google Scholar] [CrossRef] [Scilit]
  45. Gao, Y.; Cheng, J.; Chen, J.; Fu, Y.; Guo, D.; Yang, X.; Jia, L. Numerical investigation of the spatio-temporal evolution of hydrogen leakage and dispersion in the front compartment and underfloor regions of fuel cell vehicles. Int. J. Hydrogen Energy 2026, 197, 152634. [Google Scholar] [CrossRef] [Scilit]
  46. Li, Y.; Hou, X.; Wang, C.; Wang, Q.; Qi, W.; Li, J.; Zhang, X. Modeling and analysis of hydrogen diffusion in an enclosed fuel cell vehicle with obstacles. Int. J. Hydrogen Energy 2022, 47, 5745–5756. [Google Scholar] [CrossRef] [Scilit]
  47. Liu, S.; Hao, L.; Jia, H.; Zhang, Q.; Du, P. Hydrogen supply pipeline leakage diffusion and safety assessment for fuel cell patrol vehicle. Clean Energy 2025, 9, 204–222. [Google Scholar] [CrossRef] [Scilit]
  48. Salva, J.A.; Tapia, E.; Iranzo, A.; Pino, F.J.; Cabrera, J.; Rosa, F. Safety study of a hydrogen leak in a fuel cell vehicle using computational fluid dynamics. Int. J. Hydrogen Energy 2012, 37, 5299–5306. [Google Scholar] [CrossRef] [Scilit]
  49. Shen, Y.; Lv, H.; Zheng, T.; Liu, Y.; Zhou, W.; Zhang, C. Temporal and spatial evolution of hydrogen leakage and diffusion from tube fittings on fuel cell vehicles under the effect of ambient wind. Renew. Sustain. Energy Rev. 2023, 185, 113596. [Google Scholar] [CrossRef] [Scilit]
  50. Song, B.; Wang, X.; Kang, Y.; Li, H. Research on hydrogen leakage diffusion and safety analysis in hydrogen fuel cell vehicles with regard to leakage location and ventilation ports. Int. J. Hydrogen Energy 2024, 83, 173–187. [Google Scholar] [CrossRef] [Scilit]
  51. Wang, X.; Yi, F.; Su, Q.; Zhou, J.; Sun, Y.; Guo, W.; Shu, X. Influence of Longitudinal Wind on Hydrogen Leakage and Hydrogen Concentration Sensor Layout of Fuel Cell Vehicles. Sustainability 2023, 15, 10712. [Google Scholar] [CrossRef] [Scilit]
  52. Chen, G.; Zhou, S.; Chen, B.; Xue, R.; Yang, Y.; Sun, S. Numerical simulation of high-pressure hydrogen leakage and dispersion in tunnel environments for fuel cell locomotives. Int. J. Hydrogen Energy 2025, 186, 152034. [Google Scholar] [CrossRef] [Scilit]
  53. Dai, J.; Yang, S.; Yang, Y.; Fang, Q. Research on the consequences of hydrogen leakage and explosion accidents of fuel cell vehicles in underground parking garages. Int. J. Hydrogen Energy 2024, 77, 1296–1306. [Google Scholar] [CrossRef] [Scilit]
  54. Pan, X.; Xue, Z.; Wang, S.; Wang, Q.; Wang, Z.; Jiang, Y.; Xu, D.; Jiang, J. Numerical investigation on the effects of smoke barriers on hydrogen dispersion in a full-scale underground garage. Int. J. Hydrogen Energy 2024, 73, 340–350. [Google Scholar] [CrossRef] [Scilit]
  55. Cui, Y.; He, R.; Liu, S. Hydrogen Leakage Simulation and Optimization of Sensor Layout for Hydrogen Supply Systems in Fuel Cell Truck. Energy Tech 2025, 13, 2500412. [Google Scholar] [CrossRef] [Scilit]
  56. Liu, W.; Christopher, D.M. Dispersion of hydrogen leaking from a hydrogen fuel cell vehicle. Int. J. Hydrogen Energy 2015, 40, 16673–16682. [Google Scholar] [CrossRef] [Scilit]
  57. Liu, S.; He, R. Optimization of hydrogen sensor placement for hydrogen leakage monitoring in the fuel cell truck. J. Braz. Soc. Mech. Sci. Eng. 2023, 45, 193. [Google Scholar] [CrossRef] [Scilit]
  58. Park, B.; Kim, Y.; Kim, J.W.; Lim, O.K. Proactive Emergency Response Strategies for First Responders to Hydrogen Gas Leakages in Vehicles. Sustainability 2024, 16, 1859. [Google Scholar] [CrossRef] [Scilit]
  59. Xie, L.; Yuan, F.; Long, R.; Liu, Z.; Liu, W. Accelerating flammable gas cloud dissipation in hydrogen leakage during refilling hydrogen-powered vehicles via employing canopy fans. Int. J. Hydrogen Energy 2025, 136, 1219–1229. [Google Scholar] [CrossRef] [Scilit]
  60. Yang, L.; Li, J.; Liang, H.; Liang, G.; Tian, Z.; Shen, J. Risk quantification assessment for fuel cell buses based on component leakage space risk analysis. Renew. Energy 2026, 256, 124046. [Google Scholar] [CrossRef] [Scilit]
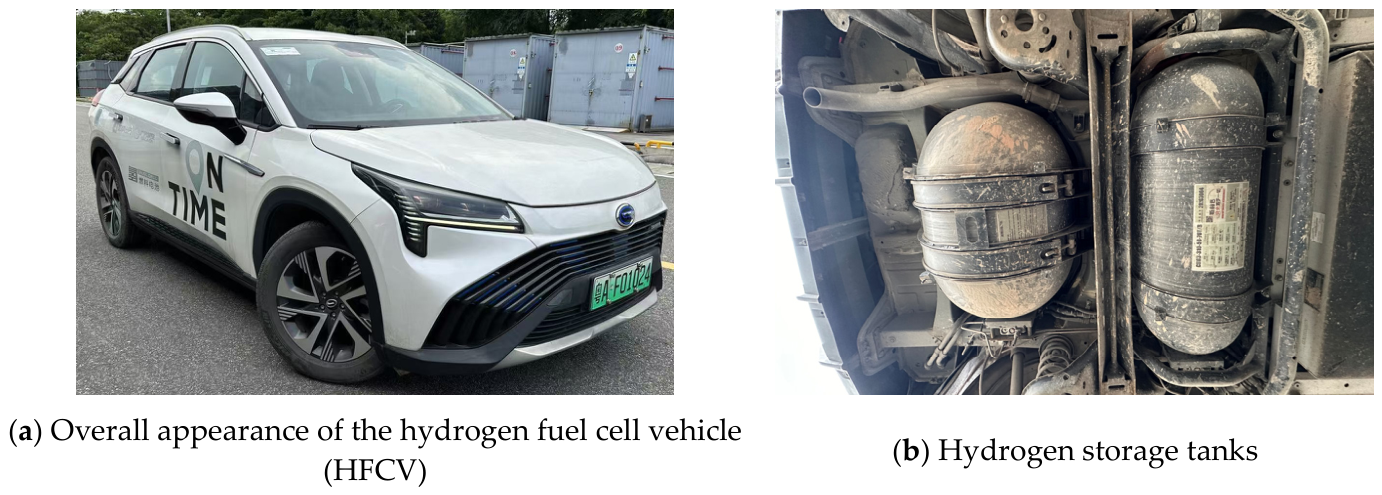
Figure 1. The GAC AION LX hydrogen fuel cell vehicle.
Fire 09 00300 g001
Figure 2. Schematic of the experimental system.
Fire 09 00300 g002
Figure 3. The FLACS geometric model.
Fire 09 00300 g003
Figure 4. Grid configuration and grid sensitivity verification.
Fire 09 00300 g004
Figure 5. Model validation. (a) Comparison of helium concentration between simulation and experiment; (b) geometric model and mesh (left); comparison of experimental and simulated flames (right).
Fire 09 00300 g005
Figure 6. Leakage mass flow rate for various leakage orifice diameters.
Fire 09 00300 g006
Figure 7. Flammable cloud distribution (left) and maximum flammable distance (right) for different leakage orifice diameters.
Fire 09 00300 g007
Figure 8. Temporal evolution of flammable cloud volume for different leakage orifice diameters.
Fire 09 00300 g008
Figure 9. Flammable cloud distribution (left) and maximum flammable distance (right) for various leakage orientations.
Fire 09 00300 g009
Figure 10. Temporal evolution of flammable cloud volume for different leakage orientations.
Fire 09 00300 g010
Figure 11. Flammable cloud volume evolution at different vehicle velocities.
Fire 09 00300 g011
Figure 12. Flame spatial distribution around the vehicle at different ignition times.
Fire 09 00300 g012
Figure 13. Radiative heat-flux distributions around the vehicle at different ignition times.
Fire 09 00300 g013
Figure 14. Nearfield pressure variation around the vehicle at different ignition times.
Fire 09 00300 g014
Figure 15. Hydrogen concentration map beneath the vehicle.
Fire 09 00300 g015
Table 1. Simulation conditions for HFCV leakage.
Leakage PositionLeakage Pressure (MPa)Leakage Diameter (mm)Leakage Orientation
(Clockwise)
Vehicle Velocity (km/h)
Hydrogen storage tank valve704.35Vertical downward (90°)0
3.07
0.435
4.35Inclined leakage (60°)0
Inclined leakage (30°)
Horizontal backward (0°)
4.35Vertical downward (90°)30
50
Disclaimer/Publisher’s Note: The statements, opinions and data contained in all publications are solely those of the individual author(s) and contributor(s) and not of MDPI and/or the editor(s). MDPI and/or the editor(s) disclaim responsibility for any injury to people or property resulting from any ideas, methods, instructions or products referred to in the content.