Article

Assessing Factors Driving Lightning-Induced Fire Ignition in the Region of East Macedonia and Thrace, Greece

by
Ioannis Mitsopoulos
1,*,
Irene Chrysafis
2,
Konstantinos Lagouvardos
3 and
Giorgos Mallinis
2
1
Department of Forestry and Natural Environment, Aristotle University of Thessaloniki, University Campus, 54124 Thessaloniki, Greece
2
School of Rural and Surveying Engineering, Aristotle University of Thessaloniki, University Campus, 54124 Thessaloniki, Greece
3
Institute for Environmental Research and Sustainable Development, National Observatory of Athens, 15236 Athens, Greece
*
Author to whom correspondence should be addressed.
Fire 2026, 9(7), 292; https://doi.org/10.3390/fire9070292
Submission received: 11 June 2026 / Revised: 29 June 2026 / Accepted: 8 July 2026 / Published: 10 July 2026

Abstract

The spatial relationships between lightning-induced fire ignition and topography, vegetation, climate, and weather were analyzed in the region of East Macedonia and Thrace, northeastern Greece. The study was based on reported lightning-induced ignitions during the 2009 fire period. Lightning data for the same period was provided by the ZEUS lightning detection network operated by the National Observatory of Athens, while fire statistics were obtained from the official records of the Greek Fire Service. A total of 198 lightning strike events (66 fire ignitions and 132 non-fire events) were used for model development. Statistical models based on Logistic Regression (LR) and random forests (RF) were developed to estimate the probability of lightning-induced fire using topography, climate, weather, and vegetation indices as predictor variables. According to the analysis results, the probability of an area being affected by lightning-induced fire is primarily determined by the Normalized Difference Vegetation Index (NDVI) and the accumulated precipitation in 24 h equal to or less than 2.5 mm expressed by Dry Thunderstorm (DT) day occurrence in this dataset. The logistic regression model achieved an area under the ROC curve of 0.94 and an overall classification accuracy of 91.9%, while the random forest model produced an Out-Of-Bag (OOB) error rate of 3.0%. Although the models have not been subjected to independent validation and include a single year’s data, the results demonstrate high internal classification performance and provide valuable insights into the primary drivers of fire ignition following lightning strikes in the study region. The outcomes of the present study will be useful in assessing spatially explicit fire risk, the planning and coordination of efforts to identify high-fire-risk areas, and designing long-term fire management and climate change adaptation strategies.

1. Introduction

Fires constitute one of the most significant natural disturbances impacting forests and other natural ecosystems globally, with substantial implications for biodiversity, carbon cycling, air quality, and human safety [1]. While anthropogenic ignitions drive fire occurrence in many regions, lightning remains a critical natural ignition source that can account for a substantial proportion of the burned area, particularly in remote and mountainous forested landscapes [2,3]. Understanding factors that affect lightning-induced fire ignition is therefore essential for developing effective fire risk assessment frameworks and informing fire management strategies in an era of changing climate and fire regimes [4,5].
Lightning-induced fires, though typically less frequent than human-caused fires on a global scale, are responsible for most of the burned area in certain regions and represent an increasingly important component of fire regimes under projected climate change scenarios [6,7,8]. Recent studies have demonstrated that climate-driven changes are amplifying lightning-induced fire risk across multiple continents, with future projections indicating substantial increases in lightning fire activity mainly in boreal and temperate forests [5]. Specifically, changes in atmospheric instability and moisture availability associated with climate change are expected to modify both the frequency and spatial distribution of dry thunderstorm events, which are critical drivers of lightning-induced fire ignitions [4]. Recent modelling studies show significant increases in lightning-induced fire activity across boreal and temperate forests under climate change scenarios [5], highlighting the need for reliable spatiotemporal assessments of lightning-induced fire risk that can inform long-term fire management and climate change adaptation planning.
In North America, lightning accounts for the majority of large fire occurrences in boreal forests, with climate-driven increases in lightning activity and fuel dryness creating favorable conditions to extensive burning [6,9]. Studies of long-term trends in western North America revealed that both anthropogenic and lightning-induced fires are becoming larger and more frequent over a longer fire season, with the interannual variability in lightning-induced fire activity strongly controlled by antecedent climate and fuel moisture conditions [7,9]. In Canada, spatiotemporal analyses covering nearly four decades (1981–2018) have identified distinct regional patterns of lightning-induced fires, with seasonality and trends varying considerably across the boreal forest biome [10,11]. In Australia, lightning activity accounts for a large fraction of the burned area in southeastern regions, with weather and fuel variables strongly affecting the ignition probability [12,13]. A recent study in Tasmania has successfully modelled the probability of lightning-induced fires, revealing the critical role of atmospheric moisture deficits in determining fire ignition success [14]. In the boreal forests of northern latitudes, large-scale climatic patterns exert primary control on lightning-induced fire occurrence, with fire weather indices and fuel moisture conditions mediating the relationship between lightning activity and area burned [15,16]. Notably, lightning-induced fires are now occurring beyond the polar circle in Siberian forests, representing a northward expansion of the lightning-induced fire regime associated with climate warming [16]. In central Siberia, the fire regime is characterized by frequent lightning-induced fires that shape the forest structure and composition over large spatial scales [17]. In the Alpine region, lightning-induced fires represent an increasing problem, with detailed analyses in Austria and Switzerland revealing the critical role of lightning strike characteristics such as the continuing current duration and peak current and the local fuel conditions in determining fire initiation [18,19,20]. These global studies demonstrate that lightning-induced fires are a significant phenomenon across diverse biomes and climatic zones; yet, they also reveal substantial regional variation in ignition rates, environmental controls, and fire behavior. Notably, Mediterranean ecosystems, characterized by summer drought, diverse fuel types, and complex topography, remain understudied compared to boreal and temperate regions, despite experiencing significant lightning activity during the fire season.
Within the Mediterranean Basin, lightning has been identified as an important ignition source in specific regions, though its relative contribution varies considerably with regional climate, topography, and vegetation characteristics [21]. A study in Central Spain has developed time-invariant probability models highlighting the role of vegetation water status, topographic position, and dry thunderstorm frequency in determining lightning-induced fire ignition [22]. In the Iberian Peninsula, more broadly, recent modelling efforts have focused on the daily probability forecasting of lightning-induced ignitions, incorporating synoptic weather patterns, fuel moisture dynamics, and lightning characteristics to improve operational fire management [23,24]. Spatial analyses in the central plateau of the Iberian Peninsula have also demonstrated that vegetation type, fuel load, topography, and lightning characteristics such as peak current, polarity, and multiplicity jointly drive lightning-induced fire ignition [25,26]. In northwestern Spain, the probability of fires induced by lightning has been successfully predicted using topographic, climatic, and vegetation variables, offering significant contributions to regional fire risk assessment [27]. Synoptic-scale meteorological analyses have identified specific atmospheric circulation patterns conducive to lightning-induced fires in Castile and León, emphasizing the importance of upper-level troughs and surface instability in generating DT [28]. A global database on the holdover time, e.g., the delay between lightning strike and fire detection, has revealed substantial variability across biomes and climate zones, with important implications for fire detection and suppression strategies [29]. Holdover occurs when a lightning strike ignites smoldering combustion in organic material (such as duff, rotten wood, or peat) that may burn undetected for hours or even days before transitioning to flaming combustion and becoming visible as an active fire. Holdover times can range from a few hours to several days depending on fuel moisture, fuel type, and weather conditions following the strike. In Catalonia, a comprehensive characterization of lightning-induced fires has identified the rainfall factor as a critical determinant of ignition success, with DT events (precipitation <2.5 mm) accounting for most fire ignitions [30,31]. Synoptic weather patterns conducive to lightning-induced fires in the same region have been classified, and the holdover phase has been characterized in detail, providing insights into the temporal dynamics of lightning-induced fire occurrence [32]. Despite the documented importance of lightning-induced fires in Mediterranean Europe, quantitative studies specifically focused on Greece remain scarce, where only a recent work on Mount Mainalo in the central Peloponnese has examined the spatiotemporal distribution of lightning-induced fires, highlighting the role of topography, vegetation, and seasonal weather patterns in determining fire ignition [33].
The ignition of a lightning-induced fire requires the coincidence of three factors: (a) lightning activity, (b) ignitable fuels, and (c) weather conditions conducive to ignition [34,35]. Each of these factors is shaped by a complex interplay of topographic, climatic, and vegetation characteristics that fluctuate across spatial and temporal scales. Lightning activity is controlled primarily by atmospheric instability, moisture availability, and orography, with topography playing a key role in modulating storm development [36,37]. In mountainous regions, elevation gradients create differential heating patterns that promote convective initiation, while aspect influences the timing and intensity of solar heating [38,39].
The relationship between lightning density and topography has been documented across diverse geographic regions, from the boreal forests of Canada to the Mediterranean mountains of southern Europe [3,40,41]. The availability and ignitability of fuel are determined by the type, structure, and moisture content of vegetation, which are, in turn, influenced by climate, topography, and the history of disturbances [42]. Vegetation indices derived from satellite remote sensing, particularly the NDVI, provide spatially explicit measures of vegetation greenness or dryness that correlate with the fuel load and continuity [22,23]. Topographic variables such as elevation, slope, and aspect influence vegetation distribution and fuel moisture through their effects on temperature, precipitation, and solar radiation [26,27]. Weather conditions at the time of lightning strikes are also critical in determining whether ignition occurs and whether an ignited fire will spread and/or self-extinguish [43,44].
DT, defined as the lightning event accompanied by a low amount of rainfall or no precipitation, has been central to understanding lightning-induced fire ignition in many regions [37,43]. DT occurs when precipitation evaporates before reaching the ground or when convective cells produce lightning but minimal rainfall, creating conditions where fuels remain dry and ignitable [45]. The occurrence of DT is influenced by atmospheric instability, moisture availability at different atmospheric levels, and synoptic weather patterns, making it a key variable for understanding lightning fire risk [43]. Therefore, forecasts for dry lightning potential have been developed for operational fire management in several regions, incorporating atmospheric moisture profiles, instability indices, and synoptic weather patterns [43,46]. In southwestern North America, the effect of monsoonal atmospheric moisture on lightning-induced fire ignitions has been quantified, revealing a threshold relationship where the ignition probability decreases sharply above certain precipitation levels [47]. In central Brazil, the characteristics of lightning-induced fires have been analyzed in relation to cloud-to-ground lightning and dry lightning events, emphasizing the importance of precipitation deficits [48]. A recent work on lightning-induced fires in the western United States has characterized ignition precipitation and associated environmental conditions, providing insights into the atmospheric and fuel moisture thresholds that govern ignition success [44]. Climate variables, particularly long-term precipitation and temperature patterns, influence both fuel accumulation and fuel moisture, thereby affecting the relationship between lightning activity and fire occurrence [4,42]. In the boreal forest ecosystems of western North America, future increases in lightning-induced ignition efficiency and fire occurrence are expected from drier fuels associated with a warmer climate, even in the absence of substantial increases in lightning frequency [4].
A range of statistical and machine-learning methodologies have been utilized to model the occurrence of lightning-induced fires and to forecast spatial patterns of fire probability. LR provides interpretable coefficients (odds ratios) that quantify the direction and magnitude of predictor effects, making it valuable for understanding which environmental factors increase or decrease the fire ignition probability. RF, an ensemble machine-learning method, can capture non-linear relationships and complex interactions among predictors without requiring an explicit specification of the interaction terms, often achieving a higher predictive accuracy than parametric methods.
LR is frequently employed due to its interpretability, computational efficiency, and capacity to quantify the effects of individual predictor variables through odds ratios [49,50]. LR models have been successfully applied to the lightning-induced fire occurrence in diverse geographic settings, including Ontario [35], British Columbia [51], the Iberian Peninsula [22,27], and Austria [19,52]. These models typically incorporate topographic, climatic, and vegetation variables as predictors and estimate the probability of fire occurrence in each spatial unit (grid cell or administrative unit) over a defined period. Machine-learning methods, particularly RF, have gained prominence in recent years due to their ability to capture non-linear relationships and complex interactions among predictor variables without requiring an explicit specification of the functional forms [53,54]. RF models have been applied to lightning-induced fire occurrence in Montana [53], Tasmania [14], southeastern Australia [55], and boreal coniferous forests [56], often achieving a higher predictive accuracy than traditional LR approaches. Interpretable artificial intelligence models for predicting lightning-induced fires have been developed, incorporating explainable machine-learning techniques to identify the most important predictor variables and to understand model behavior [5,57]. Other machine-learning approaches, including Light Gradient Boosting Machine [58] and Maximum Entropy methods [59], have also been applied to fire susceptibility modelling, though less frequently for lightning-induced ignitions. Spatial modelling techniques, including model-based geostatistics and Generalized Additive Models, have been employed to account for spatial autocorrelation and to produce smooth spatial predictions of lightning-induced fire probability [25,60]. These approaches are particularly valuable when fire occurrence data exhibit a strong spatial structure, as is often the case due to the spatial clustering of lightning activity and the spatial continuity of environmental variables. Comparative evaluations of statistical and machine-learning methods for fire occurrence prediction have generally found that machine-learning approaches achieve higher predictive accuracy, but LR provides greater interpretability and more straightforward quantification of predictor effects [61].
Despite the recognized importance of lightning as a fire ignition source in Mediterranean ecosystems, comprehensive spatial assessment of lightning-induced fire probability is still lacking in Greece. Existing studies on fire occurrence in Greece have primarily focused on human-caused ignitions with limited attention to the specific environmental conditions driving lightning-induced fire ignition. Furthermore, no study has yet applied and compared both parametric and ensemble machine-learning approaches to quantify the probability of lightning-induced fire ignition in the country The geographical area of East Macedonia and Thrace, situated in the northeastern part of Greece, is characterized by recurring summer thunderstorms and features large areas of forested landscapes, rendering it especially vulnerable to fire occurrence by lightning strikes [40]. This study aims to (a) quantify the spatial relationships between lightning-induced fire ignition and environmental variables and indices in East Macedonia and Thrace, Greece, (b) develop and compare LR and RF models for classifying the spatial probability of lightning-induced fire ignition, and (c) identify the most important environmental predictors of lightning-induced fire ignition in this Mediterranean region. By explicitly addressing this gap, this study provides the first assessment of lightning-induced fire ignition in Greece, contributing to a methodological framework that could be applicable to other Mediterranean regions with similar fire regimes and climate characteristics.

2. Materials and Methods

2.1. Study Area

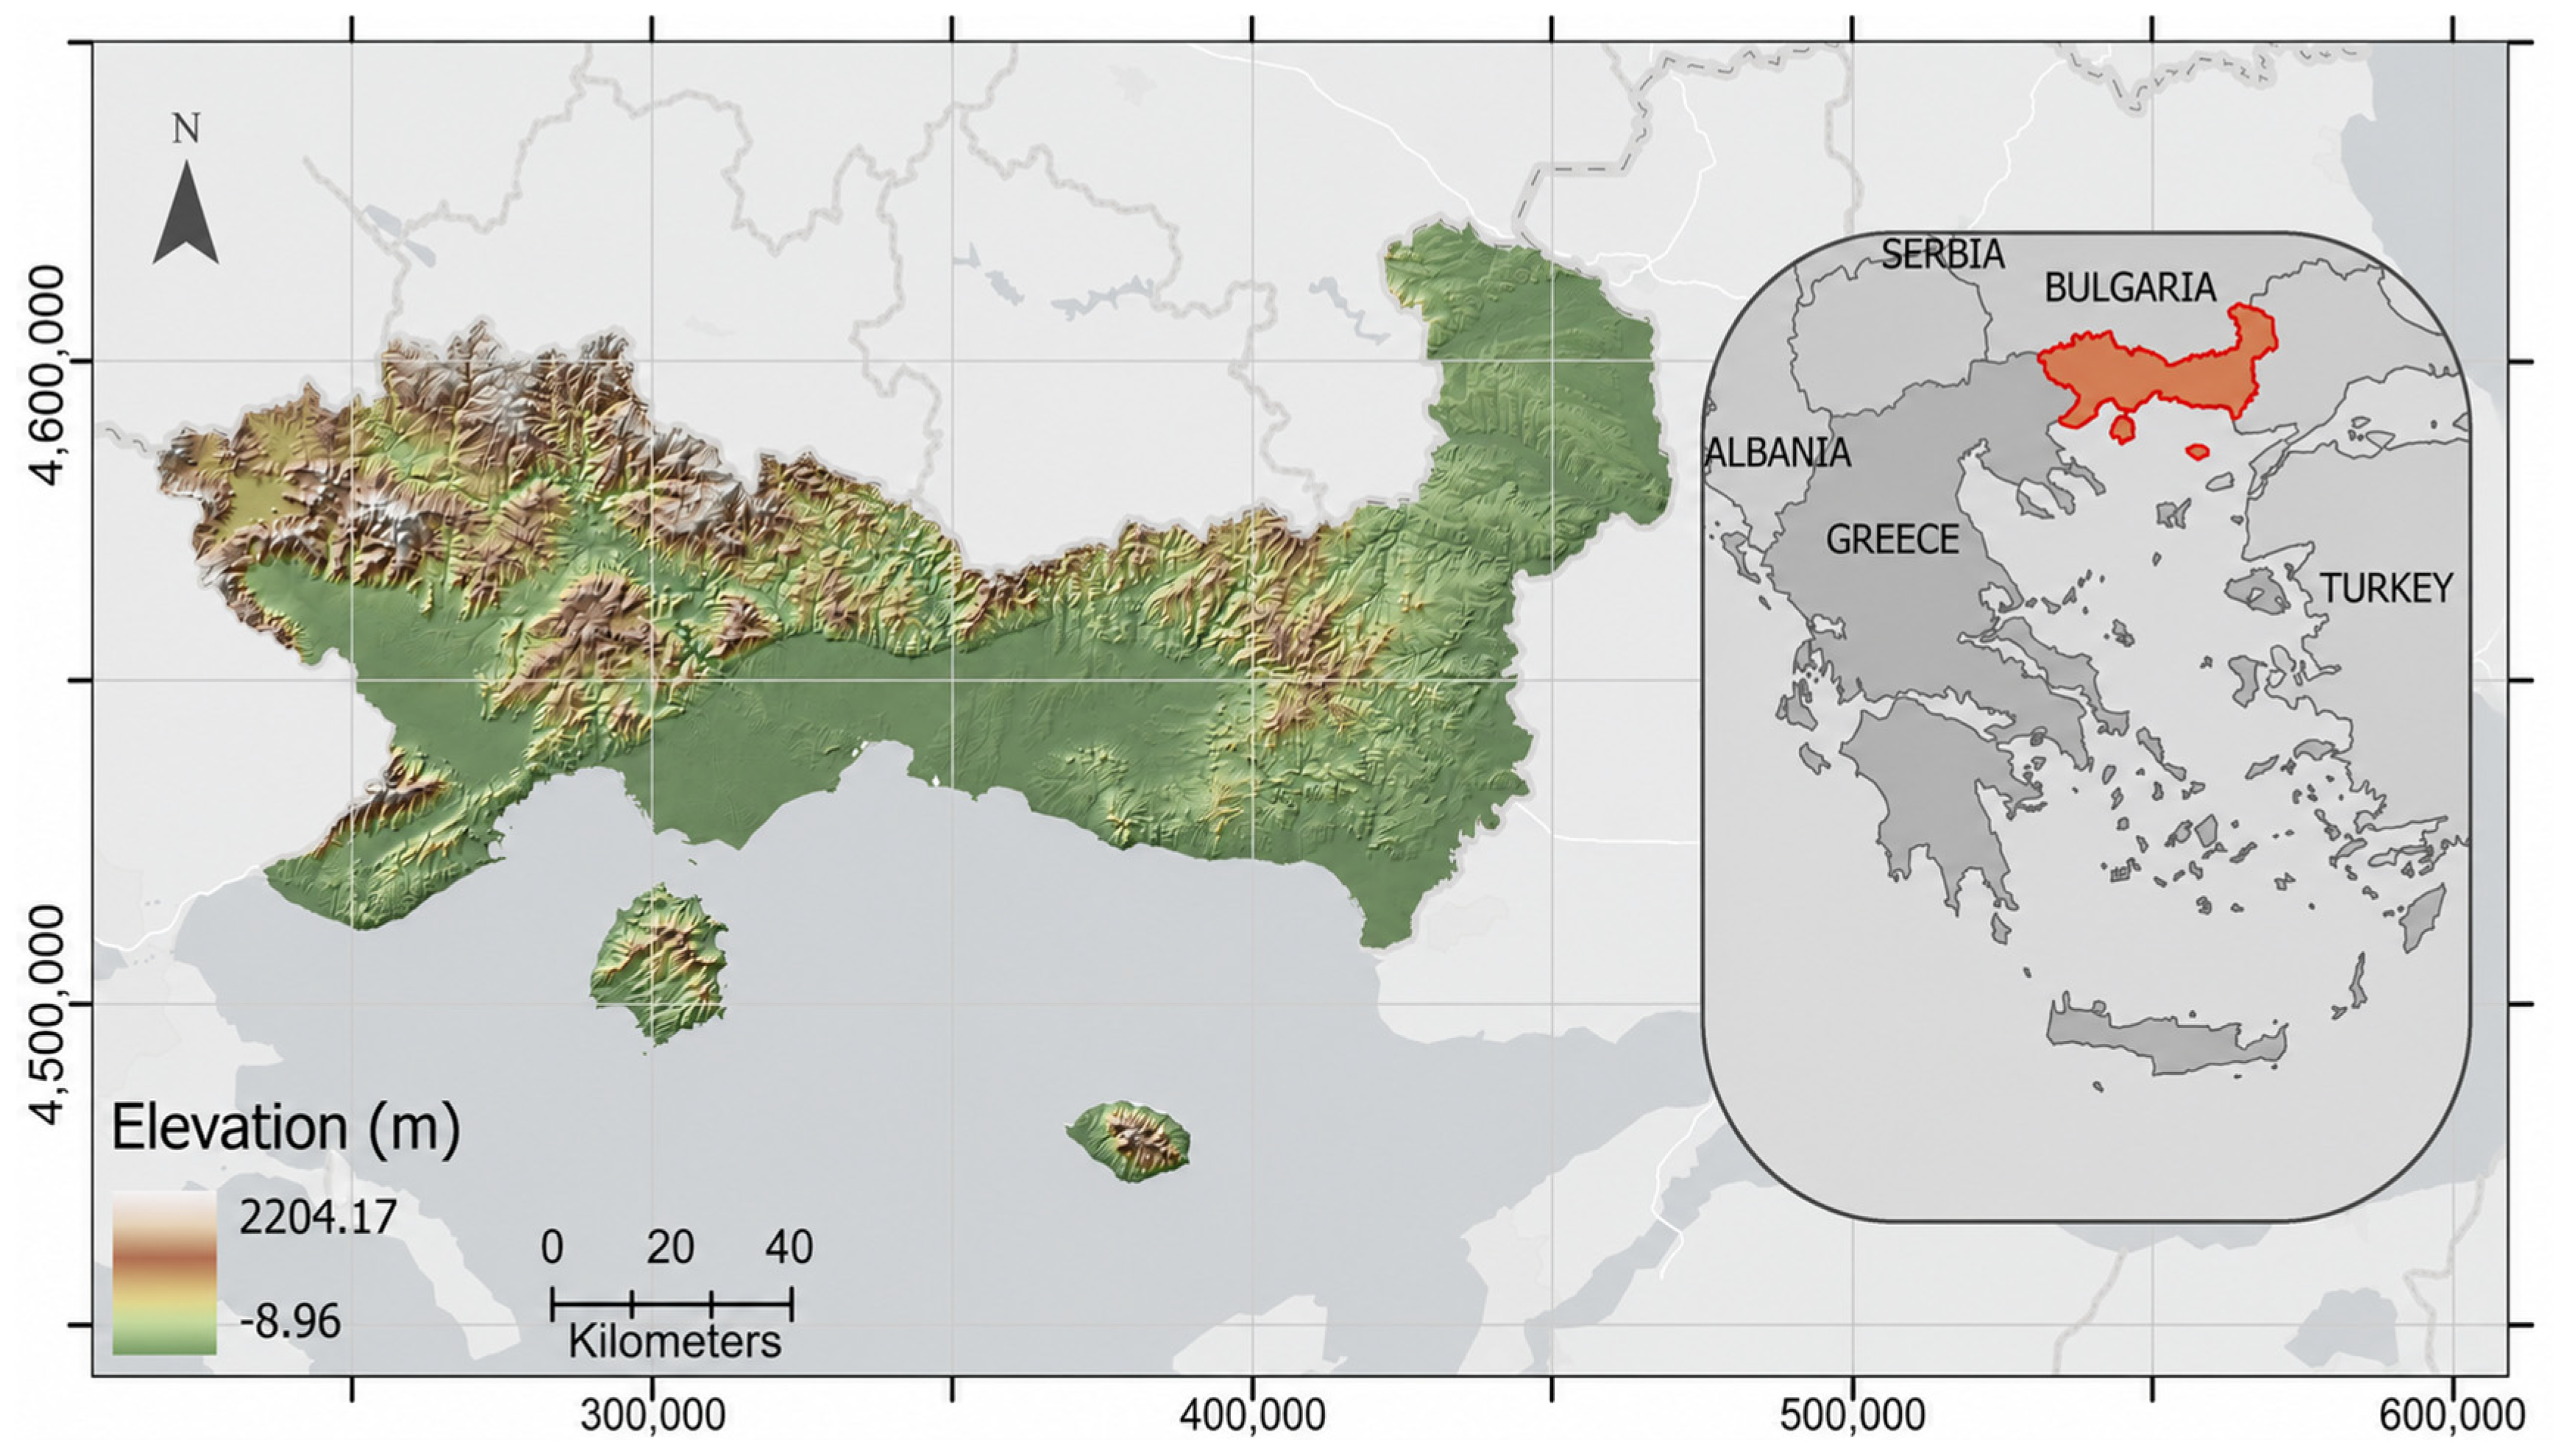
The study focuses on the administrative region of East Macedonia and Thrace, located in northeastern Greece (Figure 1). The whole region covers approximately 14,157 km2 where forests and natural areas occupy 7919.17 km2 and are characterized by diverse topography, ranging from coastal lowlands along the Aegean Sea to mountainous terrain in the interior, with elevations reaching over 2200 m. The climate is transitional between Mediterranean along the Aegean Sea and continental into the mainland of the region and in the Rhodopi mountains across the Greek–Bulgaria borders, with hot, dry summers and cool, wet winters. Mean annual precipitation ranges from approximately 480 mm in coastal areas to over 1000 mm in mountainous zones, while mean annual temperature is 16 °C [62]. The region’s vegetation is dominated by mixed deciduous and coniferous forests in the mountainous areas, Mediterranean shrublands with maquis and phrygana in the lowlands, and agricultural lands in the valleys and coastal plains. The dominant forest tree species include Pinus brutia, Pinus nigra, Quercus spp., Fagus sylvatica, and Abies spp. These geographic, climatic, and vegetation characteristics create spatial heterogeneity in lightning-induced fire ignition across the region. Mountainous terrain and elevation gradients influence both lightning activity (through orographic lifting and convective instability) and fuel moisture conditions, with higher elevations generally experiencing more lightning but also higher fuel moisture. The pronounced summer drought creates a temporal window of high fire susceptibility when fuels are dry, while spatial variation in vegetation type and density creates differential fuel availability and ignitability. The region experiences frequent spring and summer thunderstorms, particularly in the mountainous interior, making it susceptible to lightning-induced fires [40,63].

2.2. Fire and Lightning Data

Fire data were obtained from the Greek Fire Service database, which contains records of all reported fires in Greece, including information on fire location (coordinates), date, and burned area. After every fire event, investigators from the Fire Service conduct a formal fire origin and investigation task and assign each fire to a cause category if sufficient evidence exists. Cases with uncertain or ambiguous cause attribution are classified as “Unknown cause”. For this study, we extracted all lightning-induced fires that occurred in the study area during the 2009 fire season (from 1st of May 2009 until the 31st of October 2009). While cause attribution is subject to uncertainty, particularly for small fires and fires in remote areas, lightning-induced fires are generally more reliably identified than other causes due to the temporal coincidence with thunderstorm activity and the characteristic ignition patterns [64,65].
Lightning data were provided by the ZEUS (Zeus long-range lightning and storm tracking network) lightning detection network, operated by the National Observatory of Athens. ZEUS is a long-range very-low-frequency lightning detection network that provides real-time detection and location of cloud-to-ground lightning strikes across the Mediterranean region and Europe [66]. The network’s detection efficiency for the study area during the study period was estimated at approximately 20–25%, based on comparison with other lightning detection systems and validation studies. While this detection efficiency is lower than that of modern Lightning Location Systems (LLS) networks, ZEUS is capable of monitoring and delineating correctly the thunderstorm areas although it underdetects the actual number of cloud-to-ground lightning [67].

2.3. Spatial Framework and Response Variable

In order to homogenize the dataset and, in particular, to reduce the several thousand lightning strike events with no fire occurrence recorded during the study period, the total number of which exceeded 3500, the following procedure was followed to avoid the severe class imbalance between lightning-induced fire ignition points and lightning strikes that did not result in fire ignition:
(a)
Spatial verification: Each lightning-induced fire ignition point recorded in the Greek Fire Service database was spatially verified against the georeferenced data of the ZEUS lightning detection network. Only fire records that exhibited spatial coincidence between the two datasets were retained for further analysis. A fire ignition was considered spatially coincident with lightning if one or more lightning strikes were detected within 2 km of the fire ignition point. This buffer accounts for lightning location uncertainty (1–2 km for ZEUS network), fire ignition location uncertainty (typically 0.5–1 km based on Fire Service GPS accuracy), and potential fire spread from the actual ignition point to the location where the fire was first detected.
(b)
Spatial frame delineation: For each verified lightning-induced fire ignition point, a 2 km × 2 km grid cell was delineated within a Geographic Information System, with the ignition point positioned at the centroid of the cell. This cell size accounts for spatial uncertainty in both ZEUS detection accuracy and fire ignition reporting, while the environmental predictor variables (meteorological data and vegetation indices) are available at 1 km resolution. A 2 km × 2 km cell allowed us to aggregate or average these 1 km pixels to obtain representative environmental conditions at the lightning-fire event scale.
(c)
Control selection: All ZEUS-detected lightning strike locations with no fire occurrence that fell within, or were spatially contiguous with, the boundary of each grid cell were retained in the analysis as non-fire controls. Non-ignition cases were sampled from the entire pool of lightning strikes across the study region that did not result in recorded fires. This approach ensures that the developed models capture the full range of environmental conditions under which lightning strikes occurred, both in areas where fires ignited and in areas where they did not.
The above procedure yielded 132 non-fire observations paired with 66 fire ignitions presented a 1:2 case-to-control ratio. Critically, lightning-induced fire and non-fire observations were drawn from the same local environmental and meteorological context, minimizing confounding due to spatial variation in lightning occurrence patterns.
Subsampling is a standard and necessary procedure when dealing with severe class imbalance in binary outcome variables, and its application here was essential to ensure the validity of subsequent statistical analyses [68].

2.4. Predictor Variables

A set of environmental predictor variables and indices representing topography, vegetation, climate, and weather conditions was compiled for the analysis. Variable selection was guided by previous studies of lightning-induced fire occurrence and by the conceptual understanding of the factors controlling lightning activity, fuel availability, and ignition success [22,23,26,27,34,35].
Topography variables, including elevation (ELEV), slope (SLP), aspect (ASP), roughness (RGH), Topographic Wetness Index (TWI), and Topographic Position Index (TPI), were extracted from a Digital Elevation Model (DEM) with 25 m spatial resolution provided by Copernicus Land Monitoring Service [69], while Tree Cover Density (TCD) with 10 m spatial resolution was also obtained from Copernicus Land Monitoring Service [70].
Gridded weather and climate variables and indices for the study period such as air temperature (TEMP), relative humidity (RH), wind speed (WS), Normalized Differential Vegetation Index (NDVI), Canadian Fire Weather Index (FWI), and Soil Moisture Index (SMI) were obtained from Prapas et al. [71] study which contains a dataset with variables on a daily basis at 1 km × 1 km grid for fire hazard forecasting purposes in Greece. DT events were defined as the thunderstorms that produce lightning but little or no precipitation at the ground, creating conditions where fuels remain dry and ignitable [37,43,45] and were set operationally in this study when the total daily accumulated precipitation was equal to or less than 2.5 mm. The DT was coded as a binary variable (0 or 1) for each individual lightning strike event in the dataset. Specifically, for each lightning strike, DT = 1 if the daily accumulated precipitation on the day of the strike was ≤2.5 mm, and DT = 0 if precipitation exceeded 2.5 mm. This variable represents the frequency of weather conditions conducive to lightning-induced fire ignition and has been shown to be a strong predictor of lightning-induced fire occurrence in previous studies [22,23,24]. Since the exact time of lightning fire ignition was not recorded in the Greek Fire Service database, all weather and climate variables were obtained by using daily noon weather observations at 12:00, while DT occurrence or not was based on the total daily precipitation value for the strike date.
Vegetation variables included Land-Use/Land-Cover (LULC) types extracted from the Copernicus Land Monitoring Service [72], the Ecosystem Types (ES) obtained from the study of Verde et al. [73], and the Forest Types (FT) maps from the National Forest Inventory [74] of Greece. All of the spatial extraction was performed for the 2 km × 2 km grid cell centered on each lightning strike location, with values averaged across the four 1 km pixels within each cell for variables available at 1 km resolution.
The FireCube dataset [71] provides daily meteorological and vegetation variables at 1 km spatial resolution in a gridded format. To link these 1 km variables to our 2 km × 2 km analysis grid cells centered on lightning strike locations, the following procedure was used:
(a)
For each lightning strike location (point coordinates), a 2 km × 2 km bounding box was created centered on the strike location;
(b)
All 1 km FireCube grid cells whose centroids fell within these 2 km × 2 km boxes were identified resulted in 4 FireCube cells per analysis cell;
(c)
For continuous variables (temperature, humidity, wind speed, FWI, NDVI, and EVI), the mean value was calculated across the four 1 km cells;
(d)
For categorical variables, the most frequent category was assigned among the four 1 km cells;
(e)
For the DT binary variable, the precipitation value was used, averaged across the four 1 km cells, with the 2.5 mm threshold applied to this averaged value.
This spatial aggregation approach provides a representative characterization of environmental conditions at the scale of lightning location uncertainty (±1 km) while leveraging the high spatial resolution of the FireCube dataset.

2.5. Statistical Modelling

In the present study, we employ both LR and RF to leverage their complementary strengths: logistic LR for interpretability and quantification of predictor effects, and RF for potentially higher classification accuracy and ability to capture complex non-linear patterns. This dual approach allowed us to both understand the environmental controls on lightning-induced fire ignition and develop models with high classification performance for potential application in spatial risk assessment.
LR was used to classify lightning-induced fire ignition as a function of the selected predictor variables [49]. LR is appropriate for binary response variables (lightning fire/no lightning fire) and provides interpretable estimates of the effects of predictor variables through odds ratios [27,52]. Before conducting the model fit, an evaluation of multicollinearity among the predictor variables was performed to check the variance inflation factors (VIF), where a VIF value exceeding 10 is indicative of significant collinearity issues. No strong multicollinearity was detected among the predictor variables (see Supplementary Material: Tables S1 and S2). All predictor variables were entered into the LR model in their original measurement units without standardization or transformation, to preserve interpretability on their natural scales. The LR model was fitted using maximum likelihood estimation. Variable selection was performed using a stepwise procedure starting with a full model including all predictor variables and iteratively removing variables that did not significantly improve model fit. Statistical significance of individual predictor variables which were finally kept in the model was assessed using Wald tests, with p = 0.05 as the significance threshold. LR model performance was evaluated using the AUC, which measures the model’s ability to discriminate between fire and no-fire outcome across all possible classification thresholds.
RF is an ensemble machine-learning method that constructs multiple decision trees using bootstrap samples of the training data and random subsets of predictor variables at each node split [75]. Predictions are made by averaging for regression or majority voting for classification across all trees in the forest. RF has several advantages in event occurrence modelling: it can capture non-linear relationships and complex interactions among predictors without requiring explicit specification; it is relatively robust to overfitting; and it provides measures of variable importance [14,53,56]. For this study, RF classification models were fitted using the same predictor variables as the LR models. The number of trees was set to 100 and the number of variables randomly sampled at each split (mtry) was set to the square root of the total number of predictors, following standard recommendations, and the minimum node size was set to 5 to prevent excessive tree depth and overfitting [75]. The significance of variables was evaluated through the mean decrease in accuracy, a metric that quantifies the decline in model performance resulting from the random permutation of a variable, with elevated values signifying increased importance of the examined variables. Model performance was evaluated using confusion matrix and the OOB predictions which are made for each observation using only the trees for which that observation was not included in the bootstrap sample, providing an internal cross-validation estimate of model performance without requiring a separate test dataset. The OOB error is an internal, unbiased estimate of model generalization error that arises naturally from the bootstrap sampling procedure used in RF. Specifically, each tree in the ensemble is trained on a bootstrap sample comprising approximately two-thirds of the available observations; the remaining one-third of observations—the OOB sample—are not used in training that particular tree and are instead used to generate out-of-sample predictions. By aggregating OOB predictions across all trees, a reliable estimate of classification accuracy is obtained for every observation in the dataset without the need for a separate validation set. The dataset was not further partitioned into independent training and testing subsets, as this would substantially reduce the number of observations available for model fitting and would yield a test set too small to provide stable performance estimates.
The LR and RF models were compared in terms of their predictive performance measured by the area under the ROC and their classification performance by using the following metrics: (a) Accuracy, the overall proportion of correct predictions across all classes, (b) Precision, the proportion of predicted positive cases that are true positives, (c) Recall, the proportion of actual positive cases correctly identified by the model, and (d) F1-score, the harmonic mean of Precision and Recall.

3. Results

The final dataset for statistical modelling consisted of 198 lightning strike events from the 2009 fire season: 66 events that resulted in recorded lightning fire ignitions (33.3%) and 132 lightning events that did not result in fires (66.7%). These cases were derived from an initial pool of more than 3500 lightning strikes detected by the ZEUS network in the study region during the 2009 fire season. Table 1 and Table 2 presents the basic descriptive statistics and the statistical difference between the quantitative and qualitative variables for each outcome (fire ignition/non-ignition) used in the development of the LR and RF models, respectively.
The estimated parameters, their standard errors, and the significance levels of the LR model are presented in Table 3. The stepwise LR indicated that NDVI and DT presence were the only statistically significant variables (p < 0.001), and, consequently, they were the only variables that were kept in the model for further analysis. The other variables were excluded from the final model as they did not significantly improve the model fit. DT was the strongest positive predictor (β = 4.701, p < 0.0001), with an odds ratio of 110.045, indicating that the presence of dry thunderstorms (DT = 1) was associated with approximately 110-times-higher odds of lightning-induced fire ignition compared to the absence of dry thunderstorms (DT = 0). Conversely, NDVI exhibited a significant negative association with ignition probability (β = −5.266, p = 0.001), with an odds ratio of 0.005, indicating that each unit increase in the NDVI (on a 0–1 scale) was associated with a 99.5% reduction in the odds of lightning-induced fire ignition. Because a one-unit increase spans the entire theoretical NDVI range, a more interpretable re-expression is that each 0.1-unit increase in the NDVI was associated with an odds ratio of approximately 0.60, i.e., a 40% reduction in the odds of lightning-induced fire ignition, indicating that greener and healthier vegetation substantially reduced fire ignition probability. Regarding the goodness-of-fit statistics, the Nagelkerke R2 value was 0.75, and the −2 Log(Likelihood) was 95.07 (p < 0.0001), while the Hosmer and Lemeshow’s goodness-of-fit test was not significant (p = 0.298), indicating that the model had an adequate fit. The ROC curve is often used as an index of how well a scoring system can classify events into one of two alternatives, such as lightning-induced fire ignition or non-lightning-induced fire ignition.
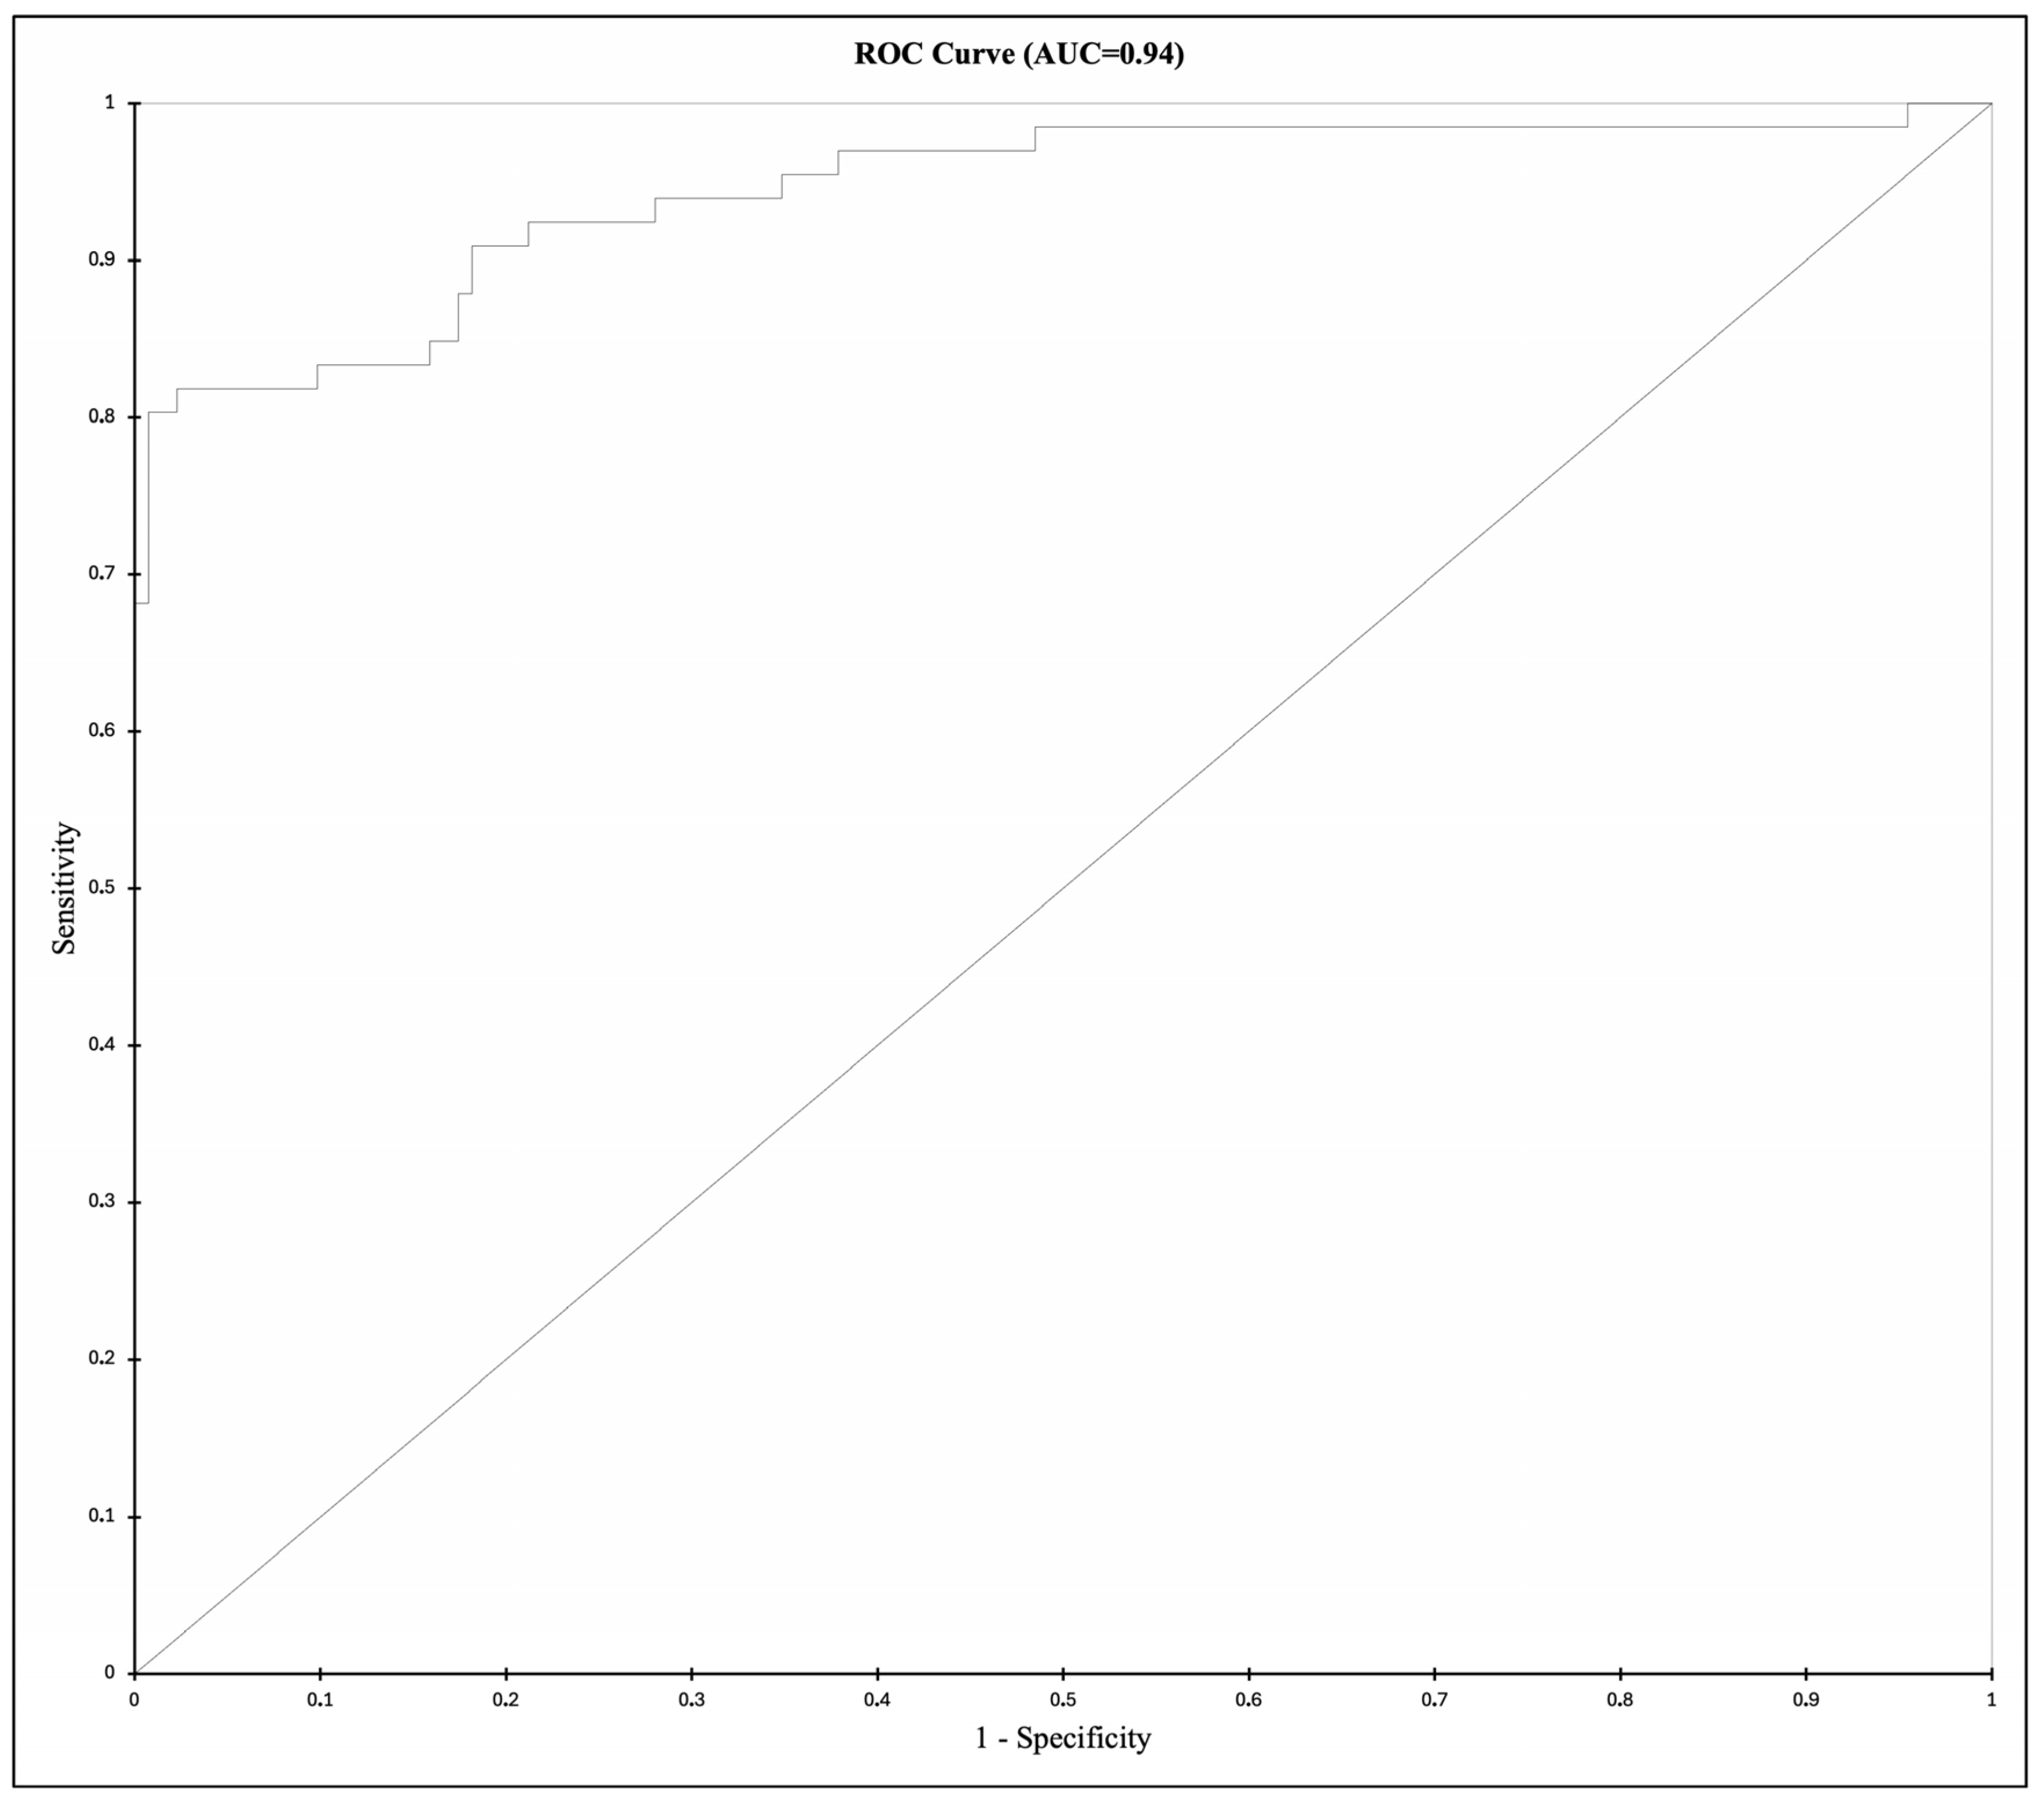
The LR model yielded an area under the ROC curve of 0.94 (Figure 2). The curve rises steeply toward the upper-left corner of the plot, achieving a high sensitivity (>0.80) at very low false positive rates (1 − Specificity < 0.05), indicating that the model effectively distinguishes between lightning-induced fire and lightning strikes with non-fire events.
Overall, the LR model correctly classified the successful lightning-induced fire ignitions in 91.9% of the cases (Table 4). Lightning strikes with no fire ignition events were classified with a high specificity (97.73%; 129 out of 132 cases), while lightning-induced fire ignitions were correctly identified in 80.30% of instances (53 out of 66 cases). A total of 13 ignition events were misclassified as non-ignitions, and only 3 non-ignition cases were incorrectly classified as fire non-ignition events.
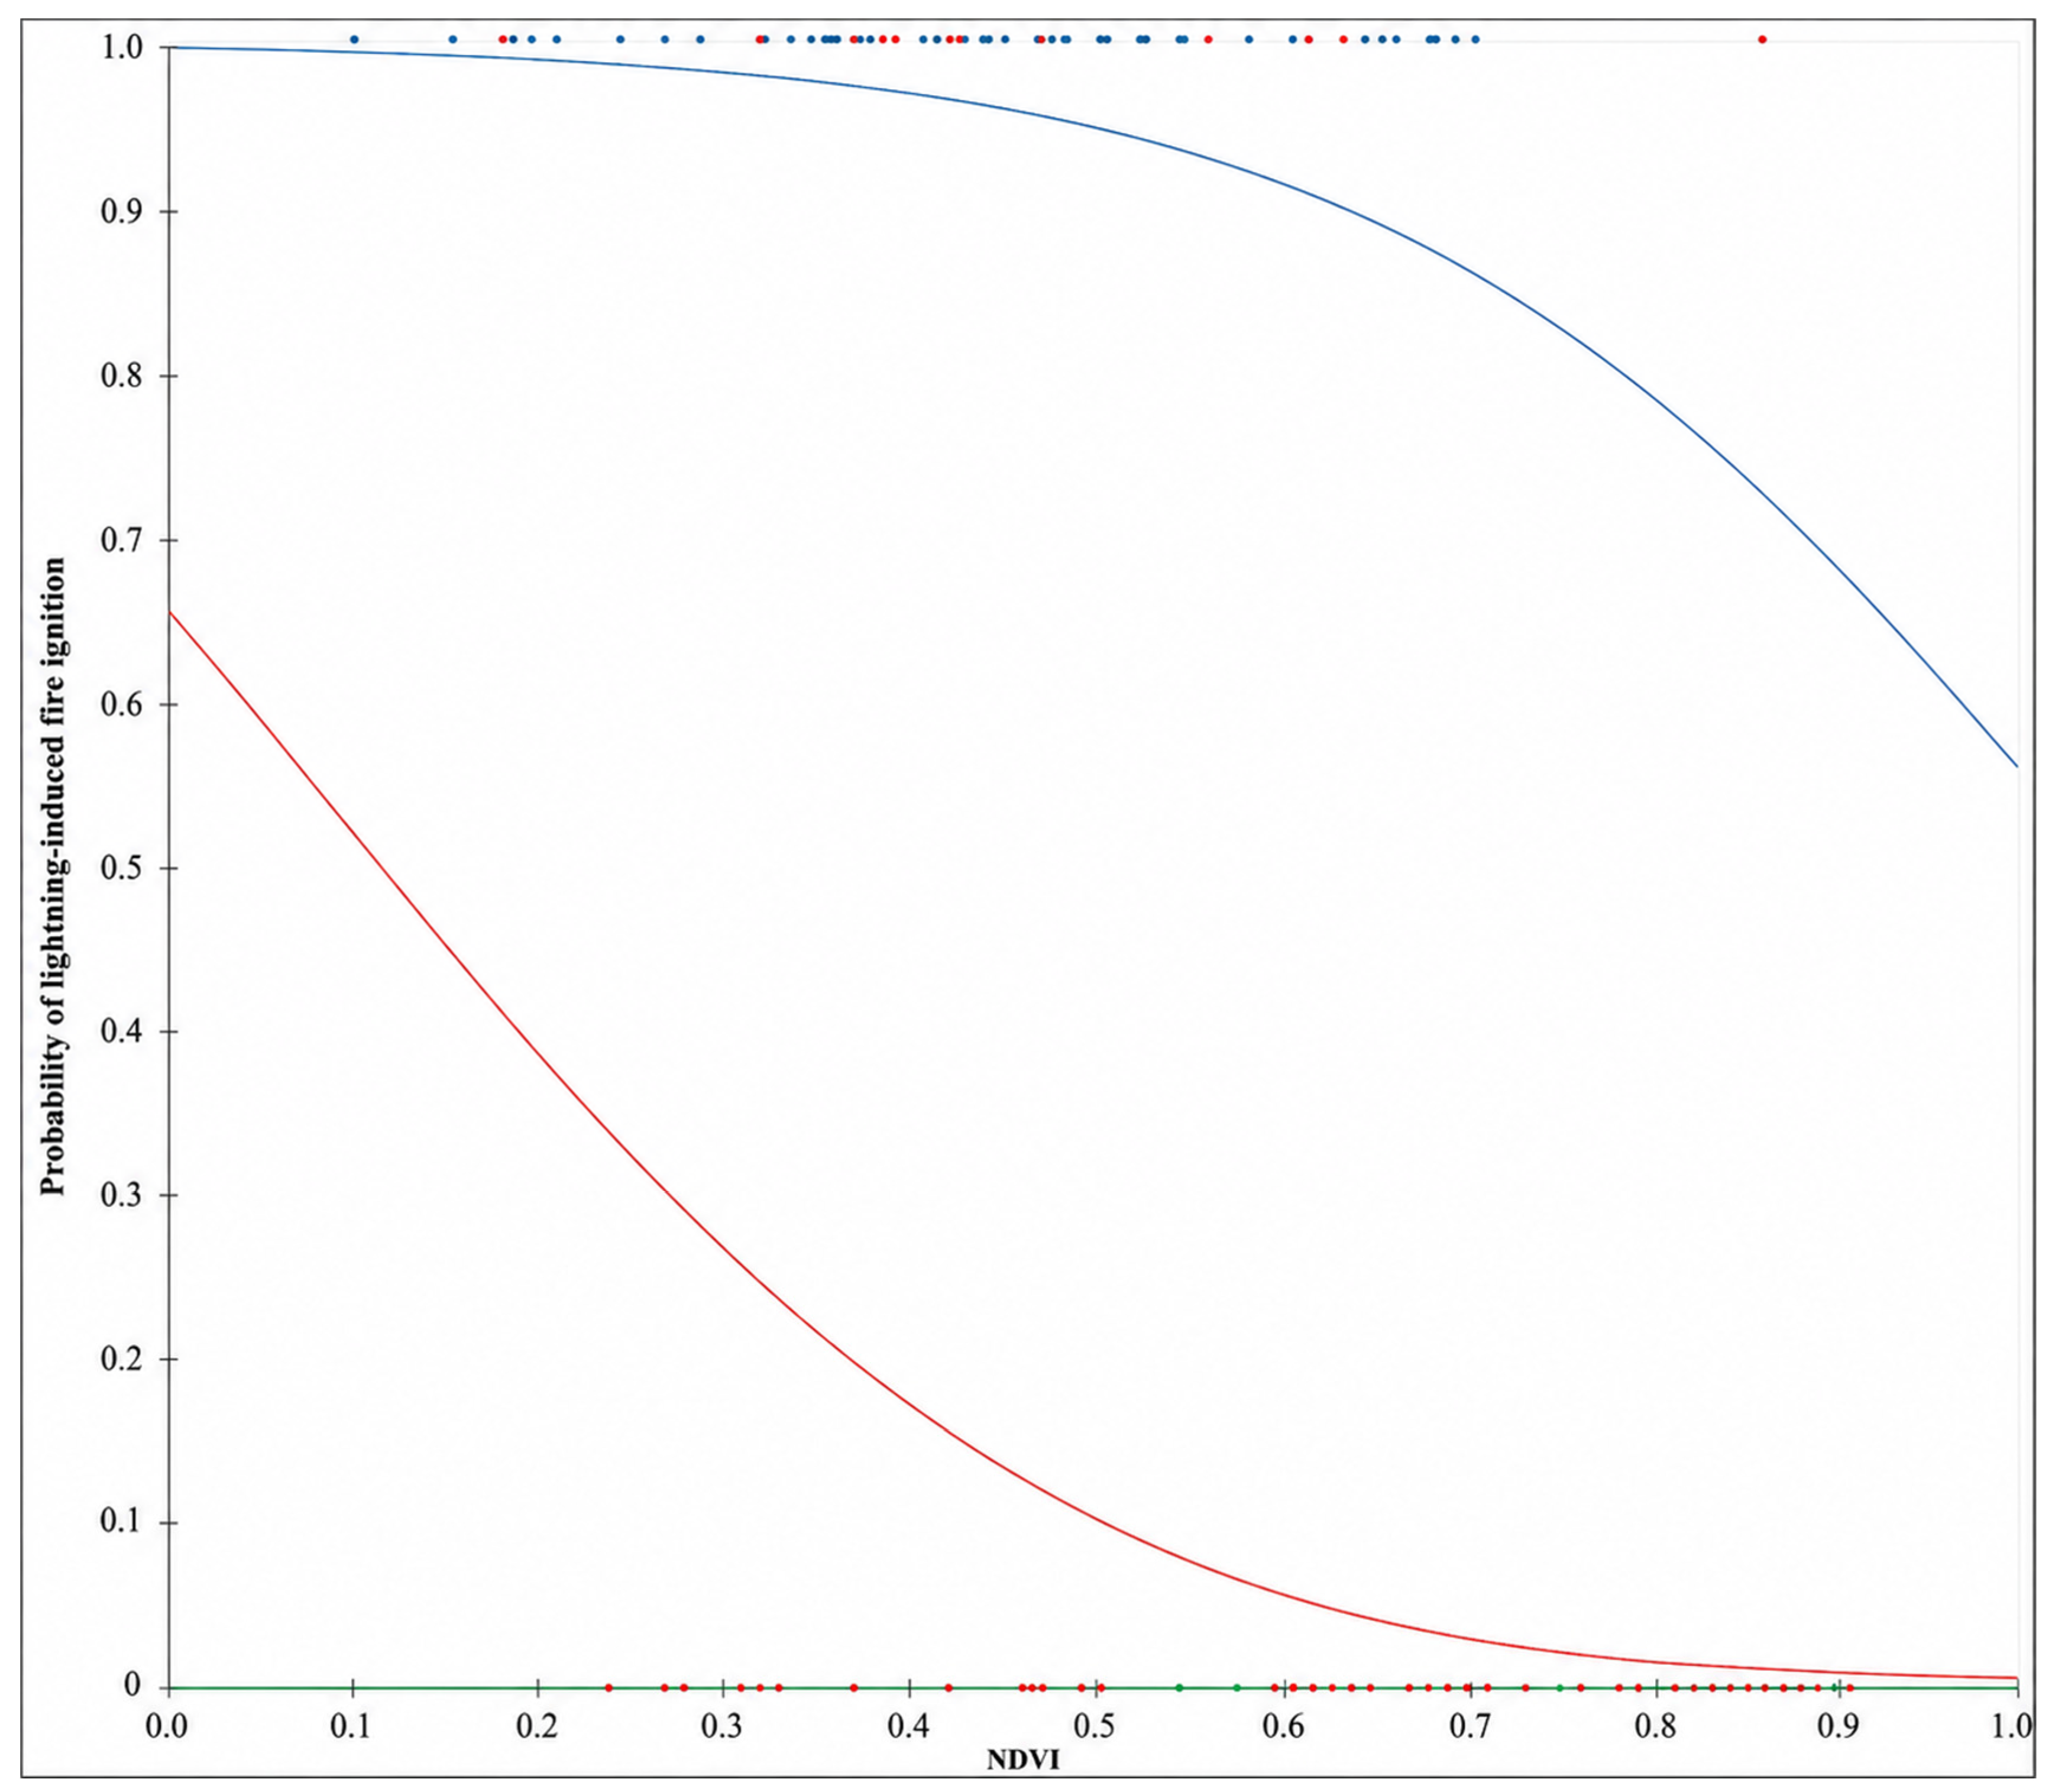
The LR model indicated a pronounced interaction between the NDVI and DT presence on lightning-induced fire ignition (Figure 3). When DT occurred (blue line), lighting-induced fire ignition remained exceptionally high (>95%) across most NDVI values (0–0.8), decreasing only at high NDVI values (>0.85). On the contrary, without the DT occurrence (red line), lightning-induced fire ignition probability exhibited a steep negative correlation with the NDVI, declining from 0.65 at low NDVI values (<0.1) to nearly zero at moderate NDVI values (>0.5).
The RF model, fitted using the same predictor variables as the LR model, achieved a classification accuracy of 97% based on OOB predictions (3% error rate), indicating an excellent discriminatory ability and high performance (Table 5). Lightning strikes with no fire ignition events were correctly identified in 98.4% of cases (130 out of 132), while lightning-induced fire ignitions were accurately classified in 93.9% of cases (62 out of 66). Misclassifications were minimal, comprising only 2 false positives and 4 false negatives across the 198 total cases.
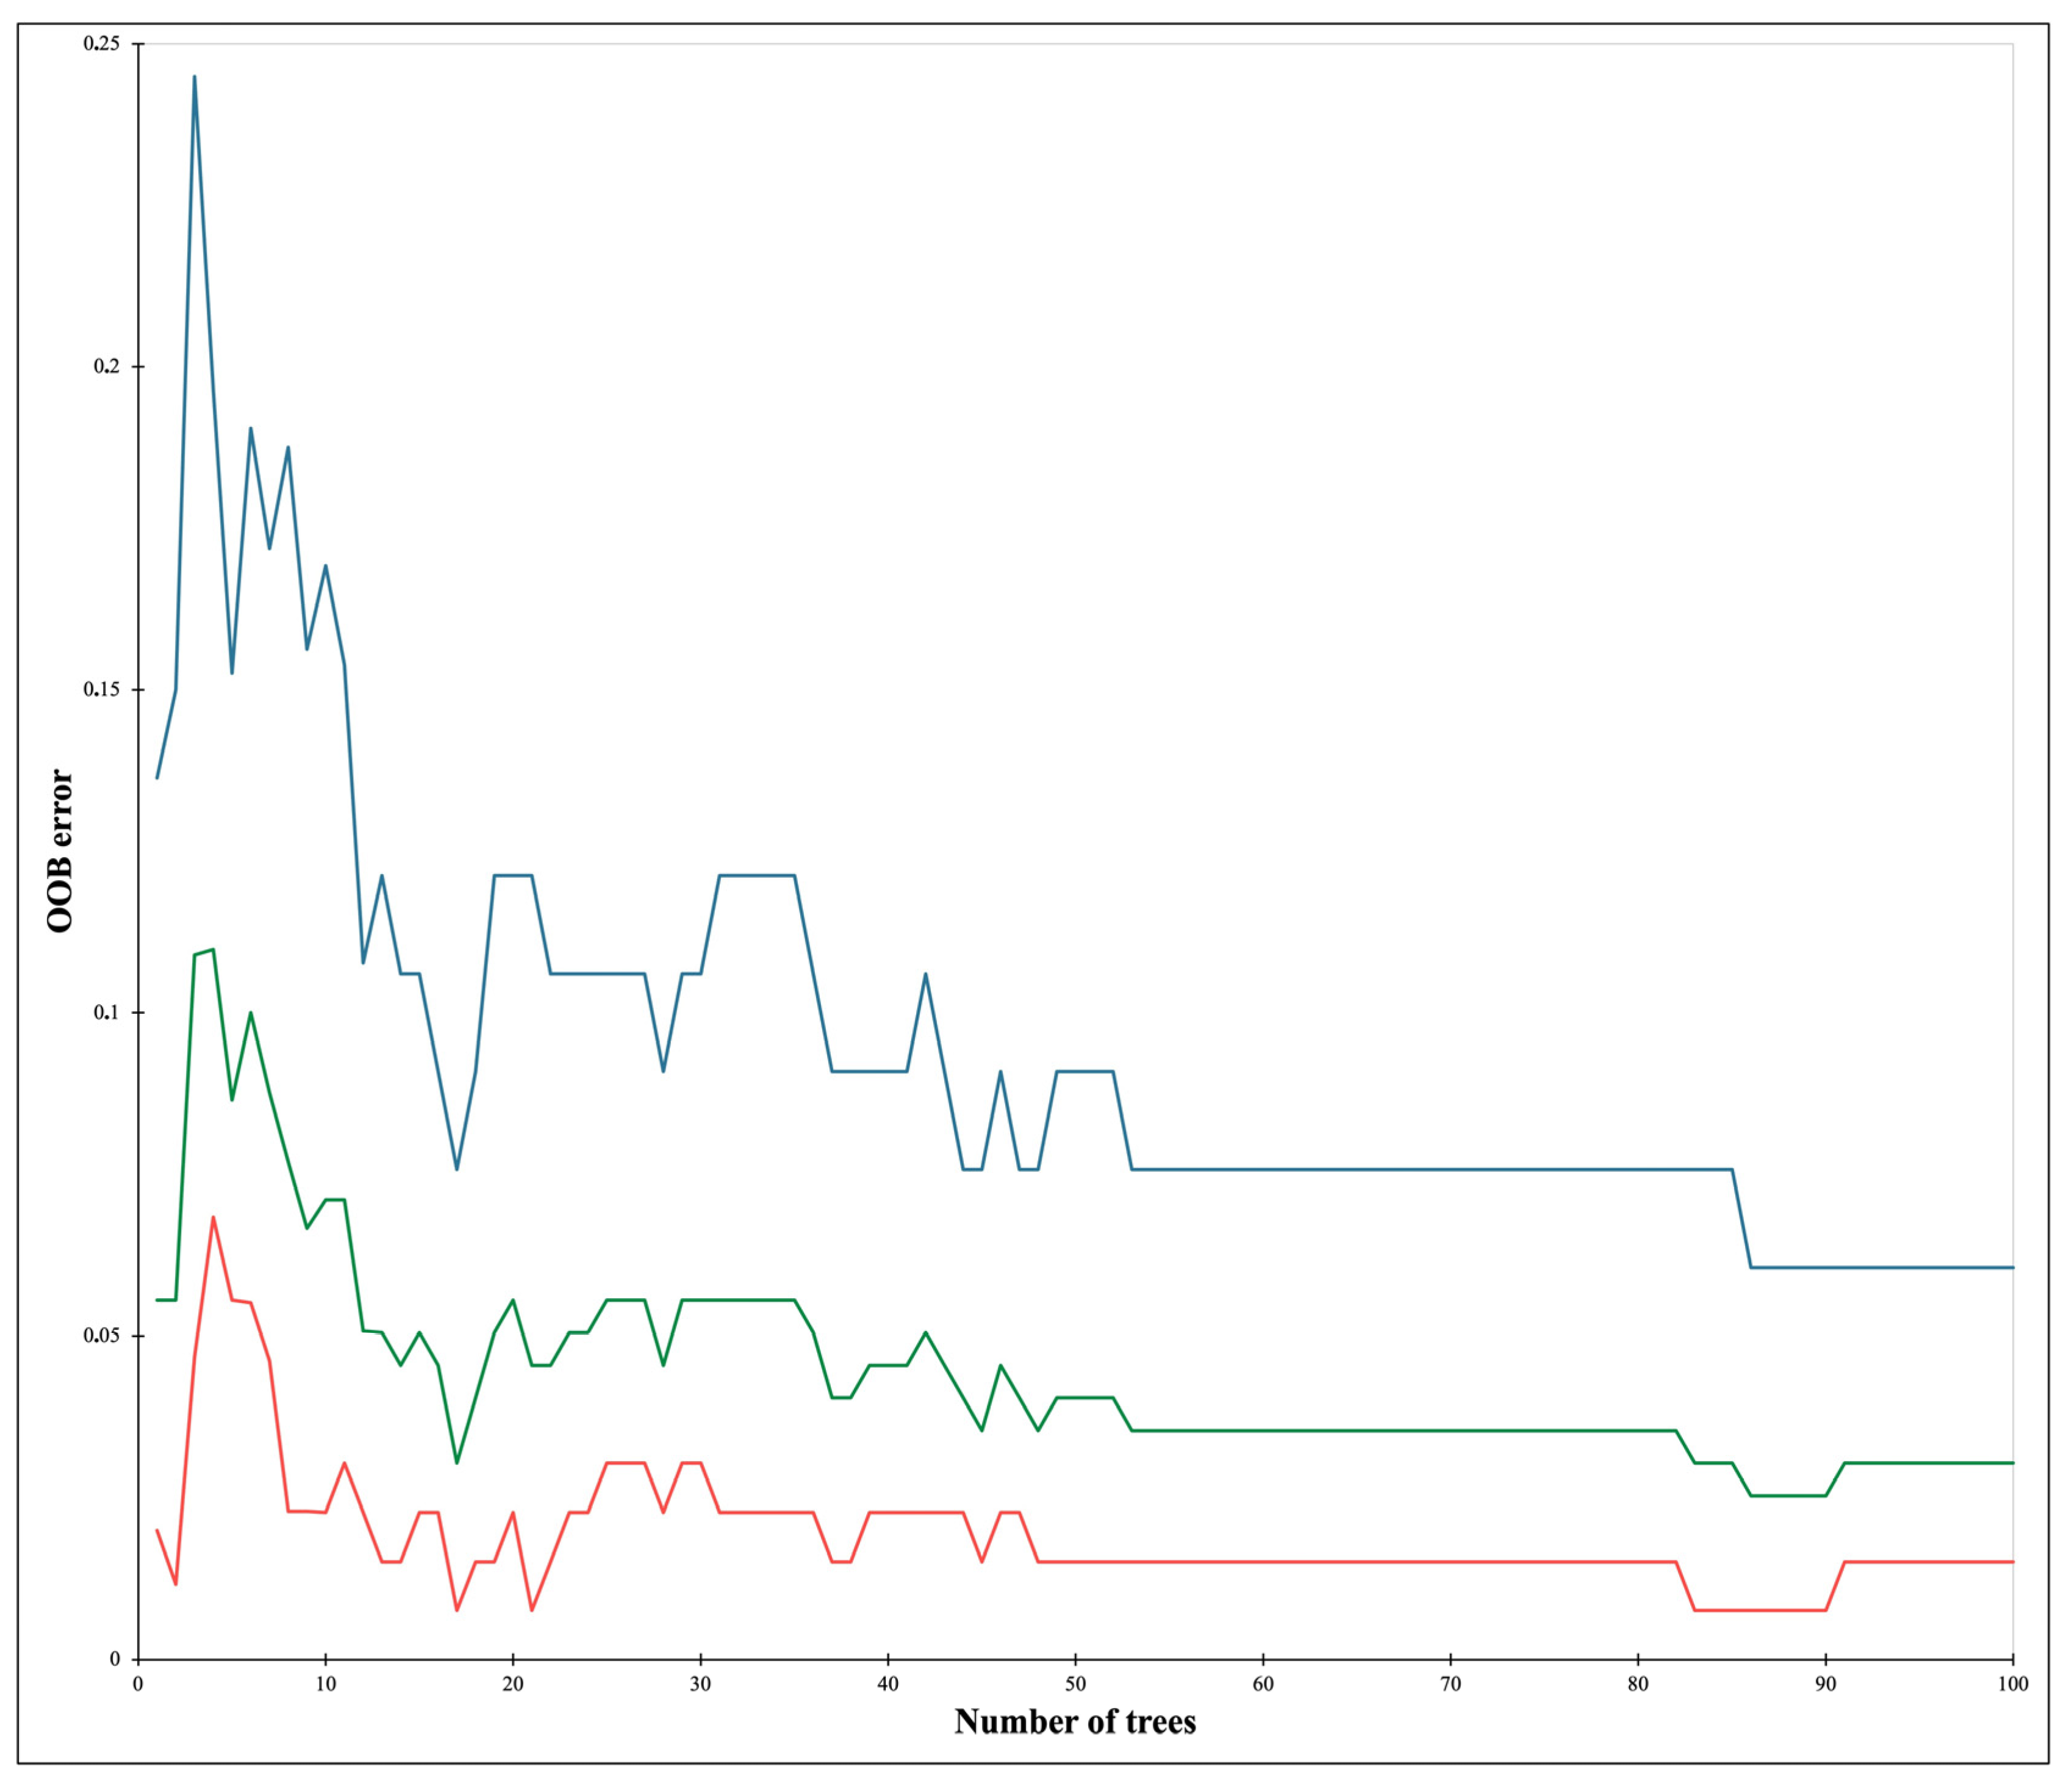
Figure 4 shows how this error rate evolved as the number of trees (100) increased during training. The stabilization of all error metrics beyond 60 trees indicates that the ensemble reached optimal predictive capacity, with minimal gains from additional trees, and that the ensemble reached its optimal predictive capacity at a relatively small number of trees; thus, increasing the number of trees beyond 100 is not expected to cause meaningful improvements in model performance. Overall, the model achieved a high classification accuracy with a particularly strong performance in identifying positive lightning-induced fire ignition cases, suggesting a robust capability in capturing the complex multivariate relationships between the selected variables predictors and lightning-induced fire ignition.
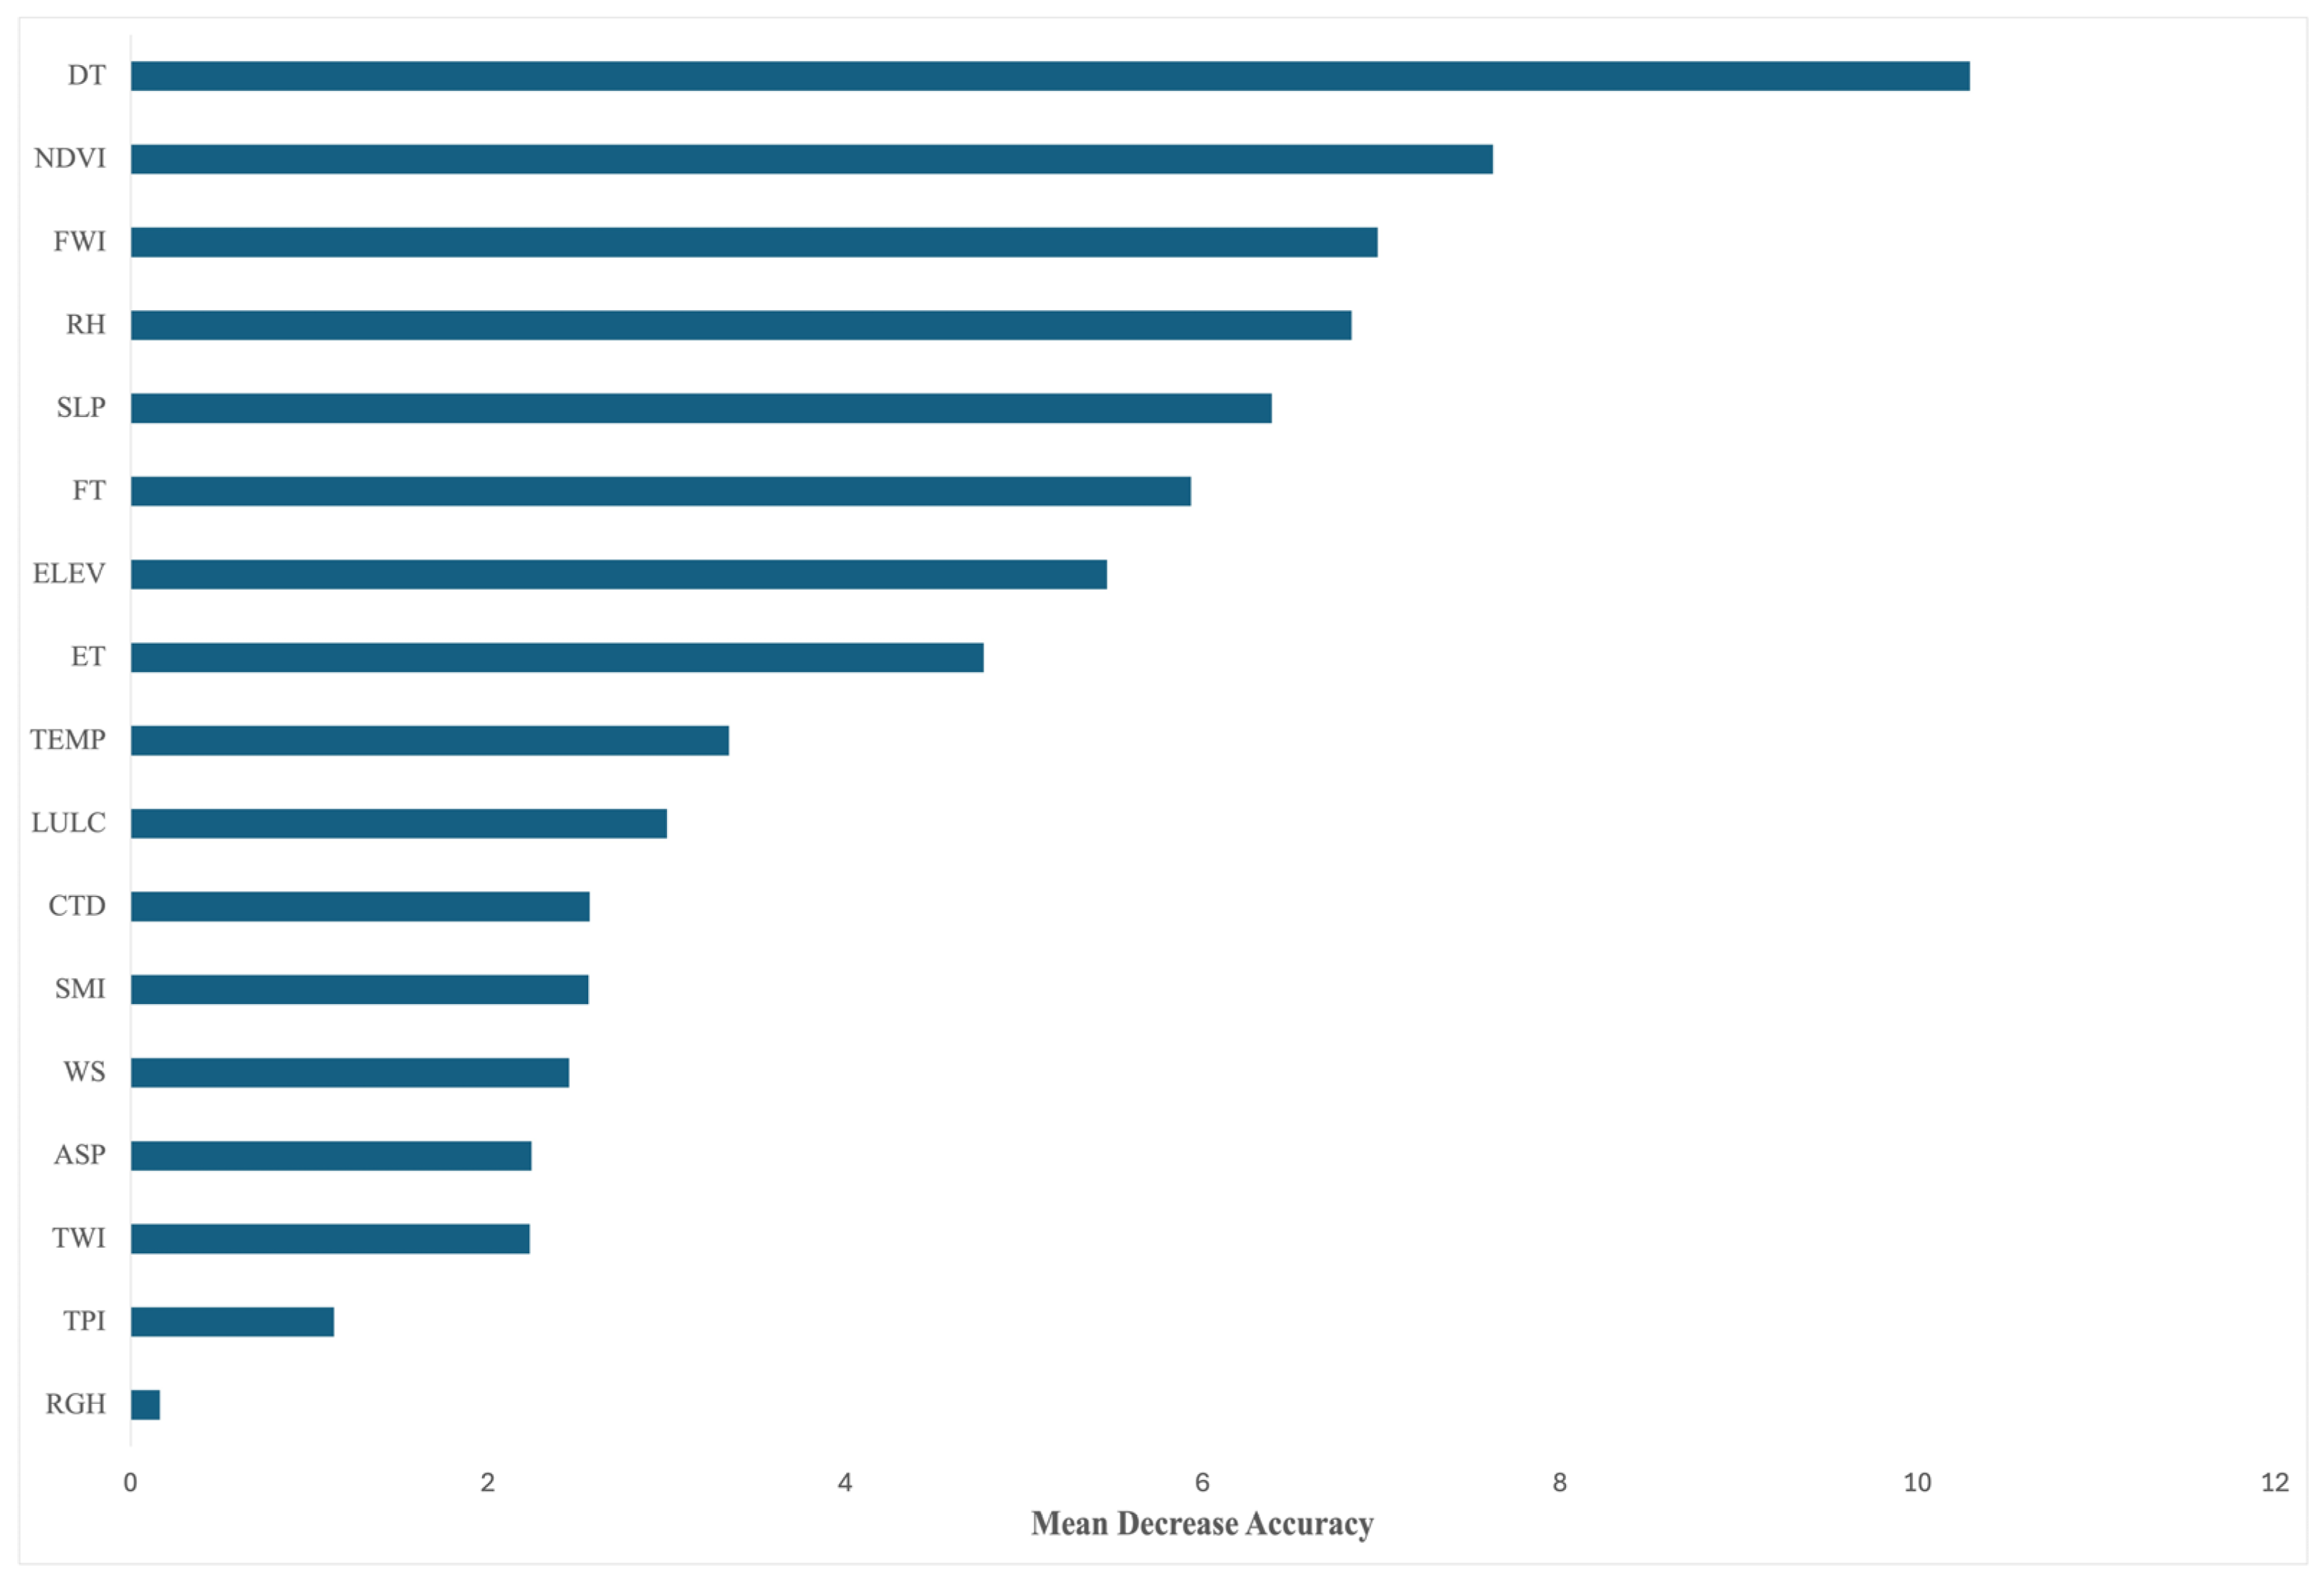
The variable importance measures from the RF model largely confirmed the findings from the LR analysis (Figure 5). DT occurrence was identified as the most important variable by mean decrease in accuracy, followed by the NDVI. However, variables such as the FWI, RH, and SLP were also found to be quite important in lightning-induced fire ignition potential, indicating that these variables also contribute to model accuracy. The remaining variables showed progressively diminishing importance.
Table 6 compares the performance ability between LR and RF models. The comparative evaluation of the two models revealed that both the LR and RF achieved a high predictive performance for lightning-induced fire ignition, though the RF model consistently outperformed LR across all assessed metrics. In terms of overall accuracy, the RF model attained a higher value compared to LR, representing a 5.4% improvement in the correct classification of lightning-induced fire ignition events. Precision scores were similarly high for both models, indicating that both classifiers exhibited low rates of false positive predictions, correctly identifying most predicted lightning-induced ignition events as true positives. The most notable finding was observed in the Recall metric, where the RF model achieved a value of 0.97 versus 0.90 for LR, suggesting that the RF model was substantially more effective at detecting actual lightning-induced fire ignition events and minimizing false negatives, a critical consideration in fire risk management and preparedness. The F-score, which balances Precision and Recall into a single composite metric, further confirmed the excellent performance of the RF model (0.95) over LR (0.93), reflecting a more harmonious trade-off between detection sensitivity and classification specificity. Overall, these results demonstrate that the RF model, by leveraging ensemble learning and capturing the non-linear interactions among predictor variables, provides a more robust and reliable framework for lightning-induced fire ignition classification compared to the parametric LR approach. The non-linear relationships between the lighting-induced fire occurrence probability with NDVI values and DT occurrence can be considered consistent with the complex ecological processes governing fuel dryness and ignition success [56]. The better performance of RF over LR can be attributed to several statistical properties of the ensemble method. First, RF constructs multiple decorrelated decision trees via bootstrap aggregation and random feature subsampling, which reduces the variance without increasing the bias. Second, LR assumes a linear relationship between the log-odds of fire ignition and the predictor variables, which may not fully capture the threshold-dependent and interactive effects of the NDVI and DT on fire ignition. In contrast, RF makes no parametric assumptions about the functional form of predictor response relationships and can model interactions and non-linearities implicitly through recursive tree splitting. Third, the higher Recall of the RF model indicates a substantially lower false negative rate, meaning that the RF model was more effective at correctly identifying actual fire ignition events. The marginal gain in Precision suggests that both models maintain a comparable specificity, but the RF model’s improved sensitivity results in a higher F-score, reflecting a better balance between detection sensitivity and classification specificity across the examined dataset.

4. Discussion

The results of this study suggest that the NDVI and DT occurrence are important variables of lightning-induced fire ignition in East Macedonia and Thrace, Greece. The dominant effect of the NDVI is consistent with the findings from other Mediterranean regions, including central Spain [22], the Iberian Peninsula [23], and Catalonia [30], where the vegetation greenness status as expressed by NDVI has been identified as key determinants of lightning-induced fire ignition. The correlation between NDVI values and lightning-induced fire ignition presents a complex, non-linear relationship that underlines the simplistic assumptions about the vegetation status and fire risk. Overall, lower NDVI values have been associated with increased fire risk due to the reduced vegetation moisture and increased fuel dryness. However, global-scale machine-learning analyses demonstrate that the fire risk from lightning strikes increases with NDVI values up to approximately 0.8, after which the risk decreases as a very high NDVI indicates wet, less flammable vegetation [75]. This suggests that extremely low NDVI values significantly affects fire ignition but may lack sufficient fuel load to sustain ignition and fire spread, while moderate NDVI values represent optimal conditions where adequate fuel availability coincides with sufficient dryness to support combustion. Zhang et al. [76] found the NDVI as a key driver in machine-learning models predicting lightning-induced fire ignition, though the relationship was not exclusively driven by low values. Similarly, research in China identified interactive effects between the NDVI and diurnal temperature range, suggesting that moderately dry vegetation conditions, rather than an extremely low NDVI, create favorable circumstances for lightning-induced fire occurrence [77]. These findings underscore the importance of considering NDVI thresholds and regional vegetation characteristics when assessing the lightning-induced fire risk, as the fuel–moisture balance appears more critical than vegetation greenness alone [56]. The negative relationship between the NDVI and lightning-induced fire ignition represents one of the most interesting findings of our analysis. This low odds ratio indicates that areas with a high vegetation greenness are less likely to experience fire ignition compared to areas with low NDVI values, holding other factors constant. This finding reflects the critical role of fuel moisture in fire ignition success, which acts as a physiological barrier to ignition even when lightning strikes occur. Conversely, low-NDVI areas representing either sparse vegetation, herbaceous fuels, or drought-stressed woody vegetation therefore present fuel conditions highly susceptible to lightning fire ignition. This interpretation is consistent with the Mediterranean climate regime where summer drought creates a pronounced spatial and temporal gradient in vegetation water status, and the present study results indicate that this gradient exerts dominant control over ignition success rates.
The significant effect of DT occurrence confirms the critical role of precipitation deficits during thunderstorm events in determining lightning-induced fire ignition. This finding is consistent with the extensive research on DT and lightning-induced fire ignition across diverse geographic settings, including the western United States [37,43,44], southwestern North America [47], Catalonia [31], Portugal [24], central Brazil [48], and Tasmania [14]. The threshold of 2.5 mm used in this study to define DT is consistent with the previous work in Mediterranean regions [31] and represents a reasonable approximation of the precipitation level below which fuels remain sufficiently dry for ignition and fire spread. The emergence of DT as a strong positive predictor of lightning-induced fire ignition provides insight into the meteorological controls on ignition in the studied region. While lightning provides the necessary ignition source, the present study findings suggest that the precipitation accompanying thunderstorm events is the critical factor determining whether ignitions successfully occur. The dominance of DT over other meteorological variables suggests that this precipitation threshold represents a more proximate control on ignition success than broader fire weather conditions captured by indices such as the FWI. From an operational perspective, this interpretation implies that fire management agencies could prioritize the monitoring of precipitation amounts during thunderstorm events rather than relying solely on cumulative drought indices when assessing lightning-fire risk.
The present study results indicate an interaction between the vegetation state and meteorological conditions that provides insight into fire ignition controls. Under DT conditions, the ignition probability exceeds 95% across the NDVI range of 0 to 0.8, showing that favorable meteorological conditions can override the vegetation-based resistance to fire ignition. When the meteorological preconditions for ignition are met (lightning presence with minimal precipitation), the vegetation characteristics become secondary factors until a critical moisture threshold is reached. This threshold appears to occur at NDVI values around 0.8, above which the vegetation moisture content becomes sufficiently high to prevent fire ignition even under DT conditions. For fire risk assessment, this finding indicates that, during DT events, broad areas with a NDVI below 0.8 could be considered to be at high risk regardless of the variations in vegetation condition, whereas areas with an NDVI above 0.8 maintain their resistance to fire ignition even under favorable meteorological conditions.
RF analysis indicated FWI as a quite important variable which may affect lightning-induced fire ignition though its effect was weaker than that of NDVI and DT occurrence. According to Hessilt et al. [4], the mechanistic link between the FWI and lightning-induced fire ignition operates primarily through short-term fuel drying associated with fire weather conditions, which serves as the main driver of the lightning-induced ignition efficiency. This relationship is revealed in the threshold dependent behavior, where lightning-induced ignitions are largely controlled by antecedent fire weather represented by threshold values of the FWI [77].
The relative importance of vegetation greenness and dry thunderstorm occurrence compared to other environmental factors such as topography, climate, and vegetation types suggests that lightning-induced fire ignition in this region is primarily controlled by fuel dryness and short-term weather conditions conducive to ignition, rather than by spatial patterns of lightning activity per se. This interpretation is supported by the relatively weak effects of the elevation and aspect which influence lightning activity through orographic effects compared to the NDVI and dry thunderstorm occurrence.
The findings of this study could be compared with the previous research on lightning-induced fire ignition in other Mediterranean regions, particularly the Iberian Peninsula, where several studies have been conducted. In central Spain, Nieto et al. [22] developed LR models for lightning-induced fire ignition and found that the NDVI, elevation, and DT occurrence were the most important predictors, consistent with our findings. In the central plateau of the Iberian Peninsula, Vecín-Arias et al. [26] found that biophysical factors (vegetation type and fuel load) and lightning characteristics (peak current and polarity) jointly determined lightning-induced fire ignition, with vegetation factors having the strongest effects. In northwestern Spain, Castedo-Dorado et al. [27] identified ELEV, SLP, ASP, and FT as significant predictors of lightning-induced fire probability, though they did not explicitly incorporate a DT variable. Recent work on the daily probability modelling of lightning-induced ignitions in the Iberian Peninsula [23] has emphasized the importance of fuel moisture dynamics and synoptic weather patterns in determining ignition success, with vegetation greenness serving as a key predictor of spatial patterns. In Portugal, Menezes et al. [24] analyzed lightning-induced fire regime using satellite-derived and in situ data, identifying the critical role of dry lightning events and fuel moisture deficits. These findings are broadly consistent with our results and suggest that the dominant role of vegetation status and DT in determining lightning-induced fire ignition is a general feature of Mediterranean fire regimes. In Catalonia, detailed analyses of lightning-induced fires have characterized the rainfall factor [31], synoptic weather patterns [77], and the holdover phase [78], providing insights into the temporal dynamics of lightning-induced fire development. The identification of specific igniting strikes within thunderstorm events [20] and the development of methods to assess the probability of lightning-induced fires based on strike characteristics [79] represent important advances in understanding the lightning-induced fire relationship at fine temporal scales. Future work within the study area could benefit from incorporating detailed lightning strike characteristics such as the peak current, polarity, and continuing current duration, when higher-quality lightning data become available. Additionally, the global database on holdover time has shown that the delay between a lightning strike and fire detection varies substantially across biomes and climate zones, with important implications for fire detection and suppression strategies [29]. Understanding holdover dynamics could improve operational fire management, particularly for fires ignited in remote mountainous areas where detection and access are challenging.
Continental-scale analyses of the anthropogenic and lightning-induced fire incidence in Europe have revealed a substantial spatial heterogeneity in the relative importance of these two ignition sources, with lightning-induced fires being particularly important in mountainous and remote regions [80]. While this study focuses on a specific Mediterranean region, the preliminary findings can be placed in a broader global context of lightning-induced fire ignition and climate change impacts after a robust independent evaluation. Recent global synthesis studies have demonstrated that climate-driven changes are amplifying the lightning-induced fire risk across multiple continents [5]. In North America, lightning has been identified as a major driver of recent large fire years in boreal forests [6], with both anthropogenic and lightning-induced fires becoming larger and more frequent over a longer season length [7]. The interannual variability in lightning-induced fire activity in the western United States is strongly controlled by antecedent climate conditions and fuel moisture [9], with recent work characterizing the ignition precipitation and associated environmental conditions [44]. Understanding the current relationships between lightning, environmental conditions, and fire ignition, as quantified in this study, provides a foundation for projecting future changes in the lightning fire risk under climate change scenarios.
The comparison of LR and RF models in this study indicated that RF achieved a better internal classification performance consistent with the findings from comparative evaluations in other regions [53,61]. The RF model’s higher AUC suggests that non-linear relationships and/or interactions among predictor variables contribute to lightning-induced fire ignition beyond the additive linear effects captured by LR. This finding is consistent with the complex ecological processes governing fuel availability, fuel moisture, and ignition success, which are unlikely to be perfectly linear or additive [56]. For operational fire risk prediction and spatial prioritization, RF’s high classification accuracy may be more important. In practice, both approaches can be used complementarily, with LR providing interpretable effect estimates and RF providing a more accurate classification [53,61]. The comparative performance of LR and RF models provides important insights. While both models achieved an excellent overall performance, the RF model demonstrated a very high Recall value, meaning it successfully identified 97% of actual ignition events compared to 90% for LR. This difference is significant for fire management applications, where the consequences of failing to classify actual ignitions (false negatives) are more severe than those of false alarms (false positives). However, it should also be recognized that the LR model’s interpretability—particularly the direct interpretation of coefficients and odds ratios—offers advantages for understanding the causal mechanisms and communicating the risk to fire management authorities. The model’s internal evaluation suggests that RF models may be preferred for automated early warning systems where maximizing the detection of high-risk conditions is paramount, while LR models may be more appropriate for strategic planning and communication.
Other machine-learning approaches, including Light Gradient Boosting Machine [58], Maximum Entropy methods [59], and deep-learning approaches, have also been applied to fire risk and susceptibility modelling and may offer further improvements in predictive accuracy. Interpretable artificial intelligence models for predicting lightning-induced fires [57] and explainable machine-learning approaches for global lightning-induced fire prediction [5] represent promising directions for future research that combine the predictive power of machine learning with the interpretability needed for scientific understanding and operational decision-making.

4.1. Fire Management Implications

The results generated in this study may have direct implications for fire management and risk assessment after a robust independent evaluation. The forecasted days with the DT potential with certain NDVI values could be helpful in the allocation of fire management resources, including the pre-positioning of suppression resources, enhanced monitoring and early detection systems, and fuel management treatments, and substantially improve the efficiency and effectiveness of fire management efforts. Furthermore, they could be used for public awareness and preparedness for potential evacuations or other protective actions which can reduce the impacts of fires on human communities and infrastructure. Such operational forecasting systems have been developed and implemented in other regions, including Ontario [35], British Columbia [51], the Iberian Peninsula [23], and Australia [46], and have proven valuable for fire management decision-making. The models developed in this study can provide insights into operational fire danger rating systems and decision support tools for fire management agencies. Daily or seasonal updates of lightning-induced fire ignition could be generated by updating the DT occurrence with current or forecast weather data, providing dynamic risk assessments that reflect current conditions. The present study models represent an exploratory analysis and methodological development rather than an operational tool and operational implementation would require validation across multiple fire seasons to assess temporal stability, spatial validation in other regions to assess transferability, integration with real-time and high resolution lightning detection systems, and operational testing and refinement based on fire manager feedback. However, such operational applications are beyond the scope of the present study and would require substantial additional development and validation.

4.2. Limitations and Future Research Directions

A few limitations of this study should be acknowledged. First, the temporal scope is relatively short and may not capture the full range of the interannual variability in lightning activity, weather conditions, and fire occurrence. The single-season dataset does not allow the testing of potential non-linearities or threshold effects across a wider drought gradient, and a multi-year data would improve the robustness of the models and allow for an analysis of the temporal trends and interannual variability [10,11]. Second, the ZEUS network’s detection efficiency of 20–25% is lower than that of modern lightning location systems. While this detection rate is typical for regional lightning detection networks and is sufficient for identifying major thunderstorm events, it means that many actual lightning strikes, and potentially many lightning-induced fires, are not captured in the dataset. If the detection efficiency varies systematically with environmental conditions (e.g., lower detection in mountainous terrain or during less intense storms), this could bias the results. However, previous validation studies of the ZEUS network suggest that detection efficiency is relatively uniform across the study region for moderate to strong lightning events, which are most likely to cause fires. Future work should utilize higher-quality lightning data from networks with a higher detection efficiency and incorporate in the analysis the lightning strike characteristics, which have been shown to influence fire ignition [80]. Third, this study focused on lightning-induced fire ignition and did not consider the fire size or severity of each fire event. Understanding the factors that determine whether a lightning-induced fire ignition remains small or grows into a large, high-severity fire is important for a comprehensive fire risk assessment [2,6]. Fourth, the non-ignition cases were subsampled from a much larger pool of lightning strikes. This case–control sampling design, while statistically valid and commonly used in ecological studies with rare events, may affect the interpretation of the predicted probabilities. Future work could model the lightning-induced fire size or burned area as a function of environmental conditions and fire weather at the time of ignition and considering the holdover time. Fifth, the use of the daily accumulated precipitation rather than the event-scale or sub-daily precipitation specifically associated with individual lightning strikes is likely to introduce some misclassification in the DT variable, which would tend to weaken the observed relationship between DT and fire ignition. The fact that DT occurrence presents a very strong effect despite this potential misclassification suggests that the true effect of precipitation on ignition probability may be even stronger than this study’s results indicate. Future studies with access to hourly or sub-hourly precipitation data could refine the DT definition and potentially improve model performance. Finally, the models developed in this study have not been subjected to validation using independent data from a different period or geographic area. External validation is important for assessing model generalizability and for building confidence in model predictions [61].

5. Conclusions

This study has quantified the relationships between lightning-induced fire ignition and a set of environmental variables in the region of East Macedonia and Thrace, Greece, and has developed statistical and machine-learning models for assessing the factors affecting lightning-induced fire ignition and classifying the spatial probability of lightning-induced fire ignition.
Vegetation characteristics, as expressed by NDVI values, and DT occurrence were found to be the most important variables affecting lightning-induced fire ignition in this Mediterranean region based on an analysis of 66 lightning-caused fires and 132 non-ignition lightning strikes during the 2009 fire season. These findings are consistent with the previous research in other Mediterranean regions and highlights the critical importance of fuel dryness and precipitation deficits during thunderstorm events. Topographic and other climate, weather, and vegetation variables have weaker effects, suggesting that lightning-induced fire ignition is primarily controlled by the vegetation water status and health and short-term weather conditions rather than by the spatial patterns of lightning activity per se.
RF models achieve a higher internal classification performance compared to LR, suggesting that non-linear relationships and interactions among predictor variables contribute to lightning-induced fire ignition. However, LR presents a higher interpretability by explicit measurements of the predictor effects.
These findings could contribute to the growing body of knowledge on lightning-induced fire ignition in Mediterranean ecosystems and provide a methodological framework that can be adapted to other regions with similar fire regimes. The models developed in this study seem promising and they could be useful for spatially explicit fire risk assessment, for the planning and coordination of regional efforts to identify areas at the greatest risk, and for designing long-term fire management strategies in the study area and potentially in other Mediterranean regions after a robust independent validation.
Future research should focus on extending the temporal scope of the analysis, performing spatial cross-validation that accounts for spatial autocorrelation, incorporating high-quality lightning data with detailed strike characteristics by utilizing higher-efficiency lightning detection systems, developing probabilistic forecasting frameworks that quantify the prediction uncertainty arising from multiple sources, analyzing the fire size and severity in addition to fire ignition, understanding the holdover dynamics, and projecting future changes under climate change and integrating lightning-induced fire models with models of human-caused fire occurrence for comprehensive fire risk assessment.

Supplementary Materials

The following supporting information can be downloaded at: https://www.mdpi.com/article/10.3390/fire9070292/s1, Table S1. Multicollinearity statistics of the quantitative variables used in the analysis (n = 198). Table S2. Multicollinearity statistics of the qualitative variables used in the analysis (n = 198).

Author Contributions

Conceptualization, I.M.; methodology, I.M.; validation, I.C. and I.M.; formal analysis, I.C. and I.M.; data curation, I.M., I.C. and K.L.; writing—original draft preparation, I.M.; writing—review and editing, G.M. and K.L.; visualization, I.C.; supervision, I.M. and G.M. All authors have read and agreed to the published version of the manuscript.

Funding

This research received no external funding.

Data Availability Statement

The dataset is available upon request from the authors.

Acknowledgments

The authors have reviewed and edited the output and take full responsibility for the content of this publication. The authors wish to thank the three anonymous reviewers for their insightful comments and suggestions, which greatly improved the quality of this manuscript.

Conflicts of Interest

The authors declare no conflicts of interest.

Abbreviations

The following abbreviations are used in this manuscript:
ASPAspect
AUCArea Under Curve
DEMDigital Elevation Model
DPDaily Precipitation
DTDry Thunderstorm
ELEVElevation
ESEcosystem Types
FTForest Types
FWI Canadian Fire Weather Index
LLSLightning Location Systems
LRLogistic Regression
LULCLand-Use/Land-Cover
NDVINormalized Difference Vegetation Index
NFINational Forest Inventory
OOBOut Of the Bag
RFRandom Forest
RGHRoughness
RHRelative humidity
ROCReceiver Operating Characteristic
SLPSlope
SMISoil Moisture Index
TCDTree Cover Density
TEMPAir temperature
TPITopographic Position Index
TWITopographic Wetness Index
VIFVariance Inflation Factors
WSWind Speed
ZEUS Zeus long-range lightning and storm tracking network

References

  1. Flannigan, M.D.; Krawchuk, M.A.; de Groot, W.J.; Wotton, B.M.; Gowman, L.M. Implications of changing climate for global wildland fire. Int. J. Wildland Fire 2009, 18, 483–507. [Google Scholar] [CrossRef] [Scilit]
  2. Stocks, B.J.; Mason, J.A.; Todd, J.B.; Bosch, E.M.; Wotton, B.M.; Amiro, B.D.; Skinner, W.R. Large forest fires in Canada, 1959–1997. J. Geophys. Res. Atmos. 2002, 107, 8149. [Google Scholar] [CrossRef] [Scilit]
  3. Wierzchowski, J.; Heathcott, M.; Flannigan, M.D. Lightning and lightning fire, central cordillera, Canada. Int. J. Wildland Fire 2002, 11, 41–51. [Google Scholar] [CrossRef] [Scilit]
  4. Hessilt, T.D.; Abatzoglou, J.T.; Chen, Y.; Randerson, J.T.; Scholten, R.C.; Van Der Werf, G.; Veraverbeke, S. Future increases in lightning ignition efficiency and wildfire occurrence expected from drier fuels in boreal forest ecosystems of western North America. Environ. Res. Lett. 2022, 17, 054008. [Google Scholar] [CrossRef] [Scilit]
  5. Shmuel, A.; Lazebnik, T.; Glickman, O.; Heifetz, E.; Price, C. Global lightning-ignited wildfire prediction and climate change projections based on explainable machine learning models. Environ. Res. Lett. 2025, 20, 014019. [Google Scholar] [CrossRef] [Scilit] [PubMed]
  6. Veraverbeke, S.; Rogers, B.M.; Goulden, M.L.; Jandt, R.R.; Miller, C.E.; Wiggins, E.B.; Randerson, J.T. Lightning as a major driver of recent large fire years in North American boreal forests. Nat. Clim. Change 2017, 7, 529–534. [Google Scholar] [CrossRef] [Scilit]
  7. Cattau, M.E.; Wessman, C.; Mahood, A.; Balch, J.K. Anthropogenic and lightning-started fires are becoming larger and more frequent over a long period across boreal forests of Canada. Glob. Ecol. Biogeogr. 2020, 29, 621–633. [Google Scholar] [CrossRef] [Scilit]
  8. Janssen, T.A.J.; Jones, M.W.; Finney, D.; Van der Werf, G.R.; van Wees, D.; Xu, W.; Veraverbeke, S. Extratropical forests increasingly at risk due to lightning fires. Nat. Geosci. 2023, 16, 1136–1144. [Google Scholar] [CrossRef] [Scilit]
  9. Abatzoglou, J.T.; Kolden, C.A.; Balch, J.K.; Bradley, B.A. Controls on interannual variability in lightning-caused fire activity in the western US. Environ. Res. Lett. 2016, 11, 045005. [Google Scholar] [CrossRef] [Scilit]
  10. Coogan, S.C.P.; Cai, X.; Jain, P.; Flannigan, M.D. Seasonality and trends in human- and lightning-caused wildfires ≥ 2 ha in the Canadian province of British Columbia (1950–2018). Int. J. Wildland Fire 2020, 29, 473–488. [Google Scholar] [CrossRef] [Scilit]
  11. Aftergood, O.S.R.; Flannigan, M.D. Identifying and analyzing spatial and temporal patterns of lightning-ignited wildfires in Western Canada from 1981 to 2018. Can. J. For. Res. 2022, 52, 1399–1411. [Google Scholar] [CrossRef] [Scilit]
  12. Dowdy, A.J.; Mills, G.A. Characteristics of lightning-attributed wildland fires in south-east Australia. Int. J. Wildland Fire 2012, 21, 521–524. [Google Scholar] [CrossRef] [Scilit]
  13. Bates, B.C.; McCaw, L.; Dowdy, A.J. Exploratory analysis of lightning-ignited wildfires in the Warren Region, Western Australia. J. Environ. Manag. 2018, 225, 336–345. [Google Scholar] [CrossRef] [Scilit] [PubMed]
  14. Wickramasinghe, A.M.K.; Boer, M.M.; Cunningham, C.X.; Nolan, R.H.; Bowman, D.M.J.S.; Williamson, G.J. Modeling the Probability of Dry Lightning-Induced Wildfires in Tasmania: A Machine Learning Approach. Geophys. Res. Lett. 2024, 51, e2024GL110381. [Google Scholar] [CrossRef] [Scilit]
  15. Liu, Z.; Yang, J.; Chang, Y.; Weisberg, P.J.; He, H.S. Spatial patterns and drivers of fire occurrence and its future trend under climate change in a boreal forest of Northeast China. Glob. Change Biol. 2012, 18, 2041–2056. [Google Scholar] [CrossRef] [Scilit]
  16. Kharuk, V.I.; Dvinskaya, M.L.; Golyukov, A.S.; Im, S.T.; Stalmak, A.V. Lightning-Ignited Wildfires beyond the Polar Circle. Atmosphere 2023, 14, 957. [Google Scholar] [CrossRef] [Scilit]
  17. Kharuk, V.I.; Dvinskaya, M.L.; Im, S.T.; Golyukov, A.S.; Smith, K.T. Wildfires in the Siberian taiga. Ambio 2021, 50, 1953–1974. [Google Scholar] [CrossRef] [Scilit] [PubMed]
  18. Conedera, M.; Cesti, G.; Pezzatti, G.B.; Zumbrunnen, T.; Spinedi, F. Lightning-induced fires in the Alpine region: An increasing problem. For. Ecol. Manag. 2006, 234, S68. [Google Scholar] [CrossRef] [Scilit]
  19. Müller, M.M.; Vacik, H.; Diendorfer, G.; Arpaci, A.; Formayer, H.; Gossow, H. Analysis of lightning-induced forest fires in Austria. Theor. Appl. Climatol. 2013, 111, 183–193. [Google Scholar] [CrossRef] [Scilit]
  20. Moris, J.V.; Conedera, M.; Nisi, L.; Bernardi, M.; Cesti, G.; Pezzatti, G.B. Lightning-caused fires in the Alps: Identifying the igniting strokes. Agric. For. Meteorol. 2020, 290, 107990. [Google Scholar] [CrossRef] [Scilit]
  21. Vázquez, A.; Moreno, J.M. Patterns of lightning- and people-caused fires in peninsular Spain. Int. J. Wildland Fire 1998, 8, 103–115. [Google Scholar] [CrossRef] [Scilit]
  22. Nieto, H.; Aguado, I.; García, M.; Chuvieco, E. Development of a probability model of occurrence for two Spanish regions. Agric. For. Meteorol. 2012, 162–163, 35–43. [Google Scholar] [CrossRef] [Scilit]
  23. Rodrigues, M.; Jiménez-Ruano, A.; Gelabert, P.J.; de Dios, V.R.; Torres, L.; Ribalaygua, J.; Vega-García, C. Fire regime dynamics in mainland Spain. Part 1: Drivers of change. Sci. Total Environ. 2020, 721, 135841. [Google Scholar] [CrossRef] [Scilit]
  24. Menezes, L.S.; Russo, A.; Libonati, R.; Trigo, R.M.; Pereira, J.M.C.; Benali, A.; Ramos, A.M.; Gouveia, C.M. Drivers of lightning-induced wildfires in Portugal. Agric. For. Meteorol. 2024, 355, 110108. [Google Scholar] [CrossRef] [Scilit]
  25. Ordóñez, C.; Saavedra, A.; Rodríguez-Pérez, J.R.; Castedo-Dorado, F.; Covián, E. Using model-based geostatistics to predict lightning-caused wildfires. Environ. Model. Softw. 2012, 29, 44–50. [Google Scholar] [CrossRef] [Scilit]
  26. Vecín-Arias, D.; Castedo-Dorado, F.; Ordóñez, C.; Rodríguez-Pérez, J.R. Biophysical and lightning characteristics drive lightning-induced fire occurrence in the central plateau of the Iberian Peninsula. Agric. For. Meteorol. 2016, 225, 36–47. [Google Scholar] [CrossRef] [Scilit]
  27. Castedo-Dorado, F.; Rodríguez-Pérez, J.R.; Marcos-Menéndez, J.L.; Álvarez-Taboada, M.F. Modelling the probability of lightning-induced forest fire occurrence in the province of León (NW Spain). For. Syst. 2011, 20, 95–107. [Google Scholar] [CrossRef] [Scilit]
  28. García-Ortega, E.; Trobajo, M.T.; Lopez, L.; Sanchez, J.L. Synoptic patterns associated with wildfires caused by lightning in Castile and León, northwestern Spain. Nat. Hazards Earth Syst. Sci. 2011, 11, 317–327. [Google Scholar] [CrossRef] [Scilit]
  29. Moris, J.V.; Álvarez-Álvarez, P.; Conedera, M.; Dorph, A.; Hessilt, T.D.; Hunt, H.G.P.; Libonati, R.; Menezes, L.S.; Müller, M.M.; Pérez-Invernón, F.J.; et al. A global database on holdover time of lightning-ignited wildfires. Earth Syst. Sci. Data 2023, 15, 1151–1163. [Google Scholar] [CrossRef] [Scilit]
  30. Pineda, N.; Montanyà, J.; van der Velde, O.A. Characteristics of lightning related to wildfire ignition in Catalonia. Atmos. Res. 2014, 135–136, 380–387. [Google Scholar] [CrossRef] [Scilit]
  31. Pineda, N.; Rigo, T. The rainfall factor in lightning-ignited wildfires in Catalonia. Agric. For. Meteorol. 2017, 239, 249–263. [Google Scholar] [CrossRef] [Scilit]
  32. Pineda, N.; Peña, J.C.; Soler, X.; Aran, M.; Pérez-Zanón, N. Synoptic weather patterns conducive to lightning-ignited wildfires in Catalonia. Adv. Sci. Res. 2022, 19, 39–49. [Google Scholar] [CrossRef] [Scilit]
  33. Athanasiou, M.; Karadimitris, A.; Kouretas, I.; Nastos, P. Spatiotemporal Distribution of Lightning-Caused Wildfires on Mount Mainalo, Central Peloponnese, Greece. Atmosphere 2025, 16, 1085. [Google Scholar] [CrossRef] [Scilit]
  34. Anderson, K. A model to predict lightning-caused fire occurrences. Int. J. Wildland Fire 2002, 11, 163–172. [Google Scholar] [CrossRef] [Scilit]
  35. Wotton, B.M.; Martell, D.L. A lightning fire occurrence model for Ontario. Can. J. For. Res. 2005, 35, 1389–1401. [Google Scholar] [CrossRef] [Scilit]
  36. Fuquay, D.M. Mountain thunderstorms and forest fires. Weatherwise 1962, 15, 149–152. [Google Scholar] [CrossRef] [Scilit]
  37. Rorig, M.L.; Ferguson, S.A. Characteristics of Lightning and Wildland Fire Ignition in the Pacific Northwest. J. Appl. Meteorol. 1999, 38, 1565–1575. [Google Scholar] [CrossRef] [Scilit] [PubMed]
  38. Podur, J.; Martell, D.L.; Csillag, F. Spatial patterns of lightning-caused forest fires in Ontario, 1976–1998. Ecol. Model. 2003, 164, 1–20. [Google Scholar] [CrossRef] [Scilit]
  39. Larjavaara, M.; Kuuluvainen, T.; Rita, H. Spatial distribution of lightning-ignited forest fires in Finland. For. Ecol. Manag. 2005, 208, 177–188. [Google Scholar] [CrossRef] [Scilit]
  40. Kotroni, V.; Lagouvardos, K. Lightning occurrence in relation with elevation, terrain slope, and vegetation cover in the Mediterranean. J. Geophys. Res. Atmos. 2008, 113, D21118. [Google Scholar] [CrossRef] [Scilit]
  41. Öztürk, M.; Bekar, I.; Tavşanoğlu, Ç. Rethinking lightning-induced fires: Spatial variability of lightning fire risk in Turkey. For. Ecol. Manag. 2024, 556, 121742. [Google Scholar] [CrossRef] [Scilit]
  42. Wotton, B.M.; Nock, C.A.; Flannigan, M.D. Forest fire occurrence and climate change in Canada. Int. J. Wildland Fire 2010, 19, 253–271. [Google Scholar] [CrossRef] [Scilit]
  43. Nauslar, N.J.; Kaplan, M.L.; Wallmann, J.; Brown, T.J. A forecast procedure for dry thunderstorms. J. Oper. Meteorol. 2013, 1, 200–214. [Google Scholar] [CrossRef] [Scilit]
  44. Kalashnikov, D.A.; Abatzoglou, J.T.; Loikith, P.; Nauslar, N.J.; Bekris, Y.; Singh, D. Lightning-ignited wildfires and long-duration fires in the western US are associated with distinct meteorological environments. Geophys. Res. Lett. 2023, 50, e2022GL102250. [Google Scholar] [CrossRef] [Scilit]
  45. Rajput, S. Dry Lightning as a Forest Predator: A Review. Res. J. Eng. Technol. 2024, 15, 65–68. [Google Scholar] [CrossRef] [Scilit]
  46. Read, N.; Duff, T.J.; Taylor, P.G. A lightning-caused wildfire ignition forecasting model for operational use. Agric. For. Meteorol. 2018, 253–254, 233–246. [Google Scholar] [CrossRef] [Scilit]
  47. Evett, R.R.; Mohrle, C.R.; Hall, B.L.; Brown, T.J.; Stephens, S.L. The effect of monsoonal atmospheric moisture transport on lightning fire ignition in the Sierra Nevada, California. Int. J. Wildland Fire 2008, 17, 101–110. [Google Scholar] [CrossRef] [Scilit]
  48. Schumacher, V.; Setzer, A.; Saba, M.M.F.; Naccarato, K.P.; Mattos, E.; Justino, F. Characteristics of lightning-caused wildfires in central Brazil in relation to cloud-to-ground lightning activity. Agric. For. Meteorol. 2022, 312, 108723. [Google Scholar] [CrossRef] [Scilit]
  49. Kleinbaum, D.G.; Klein, M. Logistic Regression: A Self Learning Text, 3rd ed.; Springer: New York, NY, USA, 2010. [Google Scholar] [CrossRef] [Scilit]
  50. Hosmer, D.W., Jr.; Lemeshow, S.; Sturdivant, R.X. Applied Logistic Regression, 3rd ed.; Wiley: Hoboken, NJ, USA, 2013. [Google Scholar] [CrossRef] [Scilit]
  51. Magnussen, S.; Taylor, S.W. Prediction of daily lightning- and human-caused fires in British Columbia. Int. J. Wildland Fire 2012, 21, 342–356. [Google Scholar] [CrossRef] [Scilit]
  52. Arndt, N.; Vacik, H.; Koch, V.; Arpaci, A.; Gossow, H. Modeling human-caused forest fire ignition for assessing forest fire danger in Austria. iForest 2013, 6, 315–320. [Google Scholar] [CrossRef] [Scilit]
  53. Jiménez-Ruano, A.; Jolly, W.M.; Freeborn, P.H.; Vega-Nieva, D.J.; Monjarás-Vega, N.A.; Briones-Herrera, C.I.; Rodrigues, M. Spatial Predictions of Human and Natural-Caused Wildfire Likelihood across Montana (USA). Forests 2022, 13, 1200. [Google Scholar] [CrossRef] [Scilit]
  54. Song, Y.; Xu, C.; Li, X.; Oppong, F. Lightning-Induced Wildfires: An Overview. Fire 2024, 7, 79. [Google Scholar] [CrossRef] [Scilit]
  55. Clarke, H.; Gibson, R.; Cirulis, B.; Bradstock, R.A.; Penman, T.D. Developing and testing models of the drivers of anthropogenic and lightning-caused wildfire ignition. J. Environ. Manag. 2019, 235, 34–44. [Google Scholar] [CrossRef] [Scilit] [PubMed]
  56. Li, W.; Shu, L.; Wang, M.; Si, L.; Li, W.; Song, J.; Yuan, S.; Wang, Y.; Zhao, F. Investigating the Latency of Lightning-Caused Fires in Boreal Coniferous Forests Using Random Forest Methodology. Fire 2025, 8, 84. [Google Scholar] [CrossRef] [Scilit]
  57. Song, S.; Zhou, X.; Yuan, S.; Cheng, P.; Liu, X. Interpretable artificial intelligence model for lightning-caused forest fire susceptibility mapping and driving factors analysis. Atmos. Sol.-Terr. Phys. 2025, 267, 106408. [Google Scholar] [CrossRef] [Scilit]
  58. Sun, Y.; Zhang, F.; Lin, H.; Xu, S. A forest fire susceptibility modeling approach based on light gradient boosting machine algorithm. Remote Sens. 2022, 14, 4362. [Google Scholar] [CrossRef] [Scilit]
  59. Sari, F. Identifying anthropogenic and natural causes of wildfires by maximum entropy method-based ignition susceptibility distribution models. J. For. Res. 2023, 34, 355–371. [Google Scholar] [CrossRef] [Scilit]
  60. Rodríguez-Pérez, J.R.; Ordóñez, C.; Roca-Pardiñas, J.; Vecín-Arias, D.; Castedo-Dorado, F. Evaluating Lightning-Caused Fire Occurrence Using Spatial Generalized Additive Models: A Case Study in Central Spain. Risk Anal. 2020, 40, 1418–1437. [Google Scholar] [CrossRef] [Scilit] [PubMed]
  61. Phelps, N.; Woolford, D.G. Comparing calibrated statistical and machine learning methods for wildland fire occurrence prediction: A case study of human-caused fires in Lac La Biche, Alberta, Canada. Int. J. Wildland Fire 2021, 30, 850–870. [Google Scholar] [CrossRef] [Scilit]
  62. Chrysafis, I.; Damianidis, C.; Giannakopoulos, V.; Mitsopoulos, I.; Dokas, I.M.; Mallinis, G. Vegetation Fuel Mapping at Regional Scale Using Sentinel-1, Sentinel-2, and DEM Derivatives—The Case of the Region of East Macedonia and Thrace, Greece. Remote Sens. 2023, 15, 1015. [Google Scholar] [CrossRef] [Scilit]
  63. Galanaki, V.; Kotroni, V.; Lagouvardos, K.; Argiriou, A. A ten-year analysis of cloud-to-ground lightning activity over the Eastern Mediterranean region. Atmos. Res. 2015, 166, 213–222. [Google Scholar] [CrossRef] [Scilit]
  64. Amatulli, G.; Peréz-Cabello, F.; De La Riva, J. Mapping lightning/human-caused wildfires occurrence under ignition point location uncertainty. Ecol. Model. 2007, 200, 321–333. [Google Scholar] [CrossRef] [Scilit]
  65. Camia, A.; Durrant, T.; San-Miguel-Ayanz, J. Harmonized Classification Scheme of Fire Causes in the EU Adopted for the European Fire Database of EFFIS. EUR 25923; Publications Office of the European Union: Luxembourg, 2013. [Google Scholar] [CrossRef]
  66. Defer, E.; Lagouvardos, K.; Kotroni, V. Lightning Activity in Eastern Mediterranean Region. J. Geophys. Res. Atmos. 2005, 110, D24210. [Google Scholar] [CrossRef] [Scilit]
  67. Lagouvardos, K.; Kotroni, V.; Betz, H.; Schmidt, K. A comparison of lightning data provided by ZEUS and LINET networks over Western Europe. Nat. Hazards Earth Syst. Sci. 2009, 9, 1713–1717. [Google Scholar] [CrossRef] [Scilit]
  68. Fithian, W.; Hastie, T. Local case-control sampling: Efficient subsampling in imbalanced data sets. Ann. Stat. 2014, 42, 1693–1724. [Google Scholar] [CrossRef] [Scilit] [PubMed]
  69. European Environment Agency. Copernicus DEM—Global and European Digital Elevation Model; European Environment Agency: Copenhagen, Denmark, 2016. [Google Scholar]
  70. Copernicus Land Monitoring Service. Tree Cover Density 2018; European Environment Agency: Copenhagen, Denmark, 2018. [Google Scholar] [CrossRef]
  71. Prapas, I.; Kondylatos, S.; Papoutsis, I. FireCube: A Daily Datacube for the Modeling and Analysis of Wildfires in Greece, Version 1.0; Zenodo: Meyrin, Switzerland, 2022. [CrossRef]
  72. European Environment Agency. CORINE Land Cover 2018 (Vector), Europe, 6-Yearly—Version 2020_20u1; European Environment Agency: Copenhagen, Denmark, 2020. [Google Scholar]
  73. Verde, N.; Kokkoris, I.P.; Georgiadis, C.; Kaimaris, D.; Dimopoulos, P.; Mitsopoulos, I.; Mallinis, G. National Scale Land Cover Classification for Ecosystem Services Mapping and Assessment, Using Multitemporal Copernicus EO Data and Google Earth Engine. Remote Sens. 2020, 12, 3303. [Google Scholar] [CrossRef] [Scilit]
  74. Ministry of Agriculture. National Forest Inventory of Greece; General Secretariat of Forests and Natural Environment: Athens, Greece, 1992. [Google Scholar]
  75. Breiman, L. Random Forests. Mach. Learn. 2001, 45, 5–32. [Google Scholar] [CrossRef] [Scilit]
  76. Zhang, Y.; Nielsen-Gammon, J.W.; Claborn, K. An improved machine-learning model for lightning-ignited wildfire prediction in Texas. Environ. Res. Lett. 2025, 20, 064026. [Google Scholar] [CrossRef] [Scilit]
  77. Lou, L.; Ma, W.; Cheng, P.; Liu, H.; Huang, Y. Climatic and Fuel Drivers of Lightning-Induced Forest Fire Burned Area in the Da Hinggan Ling Region, Northeast China. Remote Sens. 2026, 18, 657. [Google Scholar] [CrossRef] [Scilit]
  78. Kitzberger, T.; Bürgesser, R.E. 2025 A novel fire regime driven by increased lightning activity and lightning ignition efficiency for northwestern Patagonia, Argentina. Int. J. Wildland Fire 2025, 34, WF25016. [Google Scholar] [CrossRef] [Scilit]
  79. Moris, J.V.; Ascoli, D.; Hunt, H.G.P. A new method to assess the probability of lightning causing wildfires. In Proceedings of the 37th International Conference on Lightning Protection, Dresden, Germany, 1–7 September 2024; pp. 1072–1077, ISBN 978-3-8007-6416-7. [Google Scholar]
  80. Dijkstra, J.; Durrant, T.; San-Miguel-Ayanz, J.; Veraverbeke, S. Anthropogenic and Lightning Fire Incidence and Burned Area in Europe. Land 2022, 11, 651. [Google Scholar] [CrossRef] [Scilit]
Figure 1. Study area.
Fire 09 00292 g001
Figure 2. ROC and AUC of the LR model.
Fire 09 00292 g002
Figure 3. Lightning-induced fire ignition based on interaction between NDVI and DT presence resulted from LR analysis. Blue line: DT occurrence; red line: no DT occurrence.
Fire 09 00292 g003
Figure 4. Error rate evolution during the training of the RF model. Blue line: lightning-induced fire ignition error rate; red line: non-fire ignition error rate; green line: overall error rate.
Fire 09 00292 g004
Figure 5. Mean decrease in accuracy (MDA) values for assessing lightning-induced fire ignition.
Fire 09 00292 g005
Table 1. Descriptive statistics of quantitative predictor variables for ignition (n = 66) and non-ignition (n = 132) cases. Values are mean ± standard deviation. p-values are from t-tests.
VariablesIgnition Cases
(n = 66)
Non-Ignition Cases
(n = 132)
p-Value
TEMP (°C)26.3 ± 2.7725.1 ± 4.360.027
RH (%)41.76 ± 11.4849.17 ± 9.730.0001
ELEV (m)965.73 ± 401.82544.79 ± 503.560.0001
SLP (%)20.92 ± 6.4315.45 ± 7.630.0001
TPI0.10 ± 1.77−0.21 ± 2.140.317
RGH0.51 ± 0.080.50 ± 0.060.258
TDC (%)58.32 ± 19.6247.21 ± 26.730.015
WS (m/s)11.62 ± 3.119.90 ± 2.820.0001
NDVI0.44 ± 0.150.65 ± 0.190.0001
FWI36.31 ± 11.8726.72 ± 17.080.0001
SMI0.29 ± 0.090.38 ± 0.160.0001
TWI6.21 ± 2.876.72 ± 2.270.174
Table 2. Descriptive statistics of qualitative predictor variables for ignition (n = 66) and non-ignition (n = 132) cases. Values are frequency (percentage). p-values are from chi-square tests.
VariablesCategoriesIgnition Cases
(n = 66)
Non-Ignition Cases
(n = 132)
p-Value
ASPEast9 (13.6%)22 (16.7%)0.0001
Northeast3 (4.5%)8 (6.1%)0.107
Southeast11 16.7%)19 (14.4%)0.035
North4 (6.1%)13 (9.8%)0.026
Northwest12 (18.2%)15 (11.4%)0.167
South9 (13.6%)19 (14.4%)0.002
Southwest12 (18.2%)21 (15.9%)0.005
West6 (9%)15 (11.4%)0.007
CULCBroadleaved forest6 (9.1%)36 (27.3%)0.0001
Coniferous forest10 (15.2%)15 (11.4%)0.189
Land principally occupied by agriculture, with significant areas of natural vegetation9 (13.6%)18 (13.6%)0.006
Mixed forest14 (21.2%)19 (14.4%)0.087
Natural grasslands5 (7.6%)6 (4.5%)0.345
Sclerophyllous vegetation8 (12.1%)15 (11.4%)0.005
Sparsely vegetated areas7 (10.6%)3 (2.3%)0.003
Transitional woodland-shrub7 (10.6%)20 (15.2%)0.005
Agroforestry2 (3%)1 (0.7%)0.453
Grasslands4 (6%)9 (6.8%)0.098
Mediterranean coniferous forests13 (19.7%)11 (8.3%)0.201
Mediterranean deciduous forests10 (15.2%)54 (40.9%)0.0001
Mixed forest6 (9.1%)6 (4.5%)0.879
Moors and heathland6 (9.1%)6 (4.5%)0.987
Sclerophyllous vegetation21 (31.8%)23 (17.4%)0.421
Temperate mountainous coniferous forests4 (6%)22 (16.7%)0.0001
FTOak forests2 (3%)30 (22.7%)0.0001
Mixed oak and Aleppo pine forests4 (6%)3 (2.3%)0.312
Deciduous shrubs7 (10.6%)18 (13.6%)0.004
Broadleaved evergreen shrubs7 (10.6%)20 (15.2%)0.0001
Grasslands8 (12.1%)30 (22.7%)0.0001
Beech forests2 (3%)6 (4.5%)0.054
Scots pine forests2 (3%)8 (6.1%)0.032
European black pine forests2 (3%)6 (4.5%)0.005
Aleppo pine forests32 (48.5%)11 (8.3%)0.0001
DTNO13 (19.7%)123 (93.2%)0.0001
YES53 (80.3%)9 (6.8%)0.0001
Table 3. LR model results for lightning-induced fire ignition. For binary predictors (DT), the odds ratio represents the multiplicative change in odds comparing presence versus absence. For continuous predictors (NDVI), the odds ratio represents the multiplicative change in odds per unit increase in the predictor.
VariableCoefficient (β)Standard ErrorWald Chi-Squarep-ValueOdds Ratio
NDVI−5.2661.52711.8950.0010.005
DT4.7010.75638.6220.0001110.045
Table 4. Classification table comparing observed lightning-induced fire ignitions with those classified by the LR model.
Predicted vs. ObservedNon-IgnitionIgnitionTotal% Correct
Non-ignition129313297.73%
Ignition13536680.30%
Total1425619891.92%
Table 5. Classification table comparing observed lightning-induced fire ignitions with those classified by the RF model based on the OOB sample.
Predicted vs. ObservedNon-IgnitionIgnitionTotal% Correct
Non-ignition130213298.48
Ignition4626693.94
Total1346419896.97
Table 6. Comparison of the performance metrics between LR and RF models.
Performance MetricsLRRF
Accuracy0.900.93
Precision0.970.94
Recall0.900.97
F-score0.930.95
Disclaimer/Publisher’s Note: The statements, opinions and data contained in all publications are solely those of the individual author(s) and contributor(s) and not of MDPI and/or the editor(s). MDPI and/or the editor(s) disclaim responsibility for any injury to people or property resulting from any ideas, methods, instructions or products referred to in the content.