


Abstract
Forest fire susceptibility mapping is an important component of disaster risk reduction, particularly in transitional climatic zones such as Anhui Province, China. Traditional approaches often rely on expert weighting (AHP) or linear assumptions, which may be insufficient for capturing the complex, non-linear interactions of fire drivers. This study develops a data-driven framework integrating 816 field-surveyed fuel plots with MODIS active fire data (2000–2025). We applied a systematic preprocessing pipeline, including 1–99% Winsorization to reduce the influence of sensor outliers, Non-Linear Gamma Curvature Normalization to represent asymmetrical risk responses, and a spatial buffer-based pseudo-absence protocol combined with semantic land-cover masking to reduce label ambiguity and macro-environmental bias. Benchmarking against seven machine learning algorithms on a naturally balanced dataset showed that the Random Forest (RF) model achieved the highest test-set performance among the evaluated models (Test AUC = 0.831). Youden’s J statistic was used to define a data-driven risk threshold. The results suggest that topographic configuration and forest stand density act as important baseline constraints and interact with physiological moisture stress indicators to influence fire susceptibility. The species-level risk analysis was broadly consistent with ecological expectations: coniferous forests showed the highest predicted high-risk proportion (79.10%), whereas soft broadleaves showed a substantially lower predicted high-risk proportion (4.29%). Spatial mapping indicated a “South-High, North-Low” pattern associated with topographic forcing and fuel continuity, which may provide useful information for regional fire management and the planning of green firebreaks.
1. Introduction
The escalating frequency and intensity of forest fires, exacerbated by global climate variability and increasing anthropogenic interface pressures, represent one of the most critical challenges to terrestrial ecosystem stability and human safety [1]. Forest fires are not merely discrete disaster events but complex biophysical phenomena driven by non-linear interactions between combustible fuel loads, topographic conditions, meteorological forcing, and ignition sources [2]. In the context of Anhui Province, China, a region characterized by a transitional climate zone with diverse vegetation structures and significant topographic relief [3], the precise prediction of fire susceptibility is paramount for effective pre-disaster resource allocation.
Historically, Forest Fire Risk Assessment (FFRA) has relied heavily on expert-driven Multi-Criteria Decision Analysis (MCDA) frameworks, specifically the Analytic Hierarchy Process (AHP) [4]. While AHP provides a structured approach, it suffers from inherent subjectivity; the “weight” assigned to a factor is derived from human judgment rather than empirical observation. This static approach often fails to capture the dynamic and localized nuances of fire regimes, leading to risk maps that reflect theoretical expectations rather than actual ignition probabilities.
Concurrently, recent advancements have highlighted the substantial potential of deep learning architectures in complex spatial pattern recognition. Recent neural networks have shown strong performance in multifaceted collaborative salient object detection in remote sensing imagery [5], context-associated landslide extraction [6], semantic collaborative monocular depth estimation [7], and visual attention-guided crack detection in complex environments [8].
This research implements a data-driven Machine Learning (ML) framework [9]. Recent studies have demonstrated that advanced ML models, particularly ensemble tree architectures, significantly enhance the precision of regional forest fire risk prediction [10]. By leveraging a comprehensive dataset comprising 816 field-surveyed fuel plots, historical active fire data derived from MODIS satellites (2000–2025), and multi-source environmental covariates, we construct an optimized Random Forest (RF) classification model designed to quantitatively decode the non-linear biophysical drivers of fire occurrences directly from ground truth data.
Crucially, the efficacy of ML in geospatial applications can be affected by anthropogenic label noise, spatial proximity bias, and “Ecological Fallacies” induced by arbitrary spatial sampling. To mitigate these challenges, this study implements a systematic data curation and statistical pipeline: (1) 1–99% Winsorization [11] and Gamma Curvature Normalization [12] to reduce the influence of sensor outliers and stabilize continuous variables; (2) semantic land-cover masking to distinguish forest ignitions from agricultural residue burning; and (3) a geostatistically informed spatial exclusion buffer protocol for pseudo-absence sampling [13]. This spatial segregation was designed to reduce ambiguous background noise and spatial autocorrelation, yielding a curated, naturally balanced dataset that supports more reliable model training.
The primary objective of this study is to develop, validate, and interpret a forest fire risk prediction model for Anhui Province. By integrating statistical preprocessing with interpretable machine learning, this research aims to provide forest managers with a quantitative decision-support tool for identifying areas with elevated predicted susceptibility, thereby helping to connect theoretical risk assessment with practical fire management.
2. Theoretical Framework
The development of a predictive fire risk model requires a solid grounding in the biophysical mechanisms of fire behavior and the statistical principles governing data analysis. This section outlines the theoretical underpinnings of the variables selected and the mathematical transformations applied.
2.1. The Biophysical Drivers of Fire Risk
Fire ignition and propagation are governed by the “Fire Triangle”: fuel, weather, and topography [2]. In a modeling context, these are represented by spatially explicit variables.
2.1.1. Fuel Dynamics and Remote Sensing Proxies
Fuel load—the amount of combustible biomass available for burning—is a primary determinant of fire intensity and spread rate. Direct measurement of fuel load over large areas is logistically impossible, necessitating the use of remote sensing proxies. The Normalized Difference Vegetation Index (NDVI) is widely used as a surrogate for live fuel moisture and biomass [14]. However, the relationship between NDVI and fire risk is complex. In “moisture-limited” ecosystems (e.g., dense tropical forests), high NDVI indicates high moisture content, which suppresses ignition (negative correlation). In “fuel-limited” ecosystems (e.g., arid shrublands), high NDVI indicates sufficient biomass to carry a fire (positive correlation) [15]. In the transitional forests of Anhui, we hypothesize a non-linear relationship where risk peaks at intermediate-to-high NDVI values, representing abundant fuel that is seasonally susceptible to drying.
2.1.2. Topographic Controls
Topography influences fire behavior by modifying local microclimates. Elevation (Altitude) acts as a proxy for temperature and precipitation gradients. Typically, higher elevations are cooler and wetter, reducing ignition potential. However, mid-elevation zones often experience less human interference and higher fuel accumulation, potentially creating a “risk band”. Slope affects fire spread physics; fires burn more rapidly upslope due to pre-heating of fuels. Aspect determines solar insolation, influencing fuel moisture content; south-facing slopes in the Northern Hemisphere are generally drier and riskier.
2.1.3. Thermal Anomalies as Precursors
Land Surface Temperature (LST), derived from thermal infrared sensors (e.g., MODIS), serves as a direct indicator of surface heating and fuel dryness [16]. High LST values correlate with reduced soil and fuel moisture, creating conditions favorable for ignition. Unlike static topographic features, LST provides a dynamic, temporal snapshot of flammability.
2.2. Statistical Robustness: The Theory of Winsorization
Environmental datasets are prone to contamination by outliers. In remote sensing, a single pixel might report an anomalously high reflectance due to specular reflection or an impossibly low temperature due to cloud contamination. In field surveys, transcription errors can introduce extreme values.
Standard normalization techniques, such as Min-Max scaling, are extremely sensitive to these outliers:
A single outlier can expand the denominator (), effectively compressing the vast majority of valid data points into a tiny numerical range, thereby obliterating the variance that the machine learning model needs to learn.
Winsorization addresses this by censoring the extremes rather than removing them [11]. It is defined as the transformation of statistics by limiting extreme values in the statistical data to reduce the effect of possibly spurious outliers. Theoretically, this preserves the first moment (mean) and second moment (variance) of the distribution more accurately than trimming (which reduces sample size) or keeping the raw data (which distorts the moments). By capping values at the 1st and 99th percentiles, we ensure that the “extreme” nature of the data point is retained (it remains the highest value), but its magnitude is constrained to a statistically plausible range.
2.3. Non-Linearity and Gamma Transformation
Biological and physical systems rarely respond linearly to environmental gradients. The concept of Membership Functions from Fuzzy Logic provides a useful framework for representing these non-linearities [12].
The Gamma Curvature transformation modifies the shape of the relationship between an environmental variable and risk. It is mathematically expressed as a power law function of the normalized input:
where x is the normalized input variable and governs the curvature.
- Convex Curvature (): This models a system with high sensitivity at low values. For example, a small increase in fuel load (NDVI) from zero might drastically increase fire risk, with the effect saturating at higher levels.
- Concave Curvature (): This models a system with a suppression threshold. For example, risk might remain low for a wide range of elevations and only increase sharply once a specific altitude (or lack thereof) is reached.
This theoretical approach allows the model to ingest features that are physically representative of the fire risk mechanisms, rather than raw geometric values.
3. Study Area and Data Acquisition
3.1. Study Area: Anhui Province
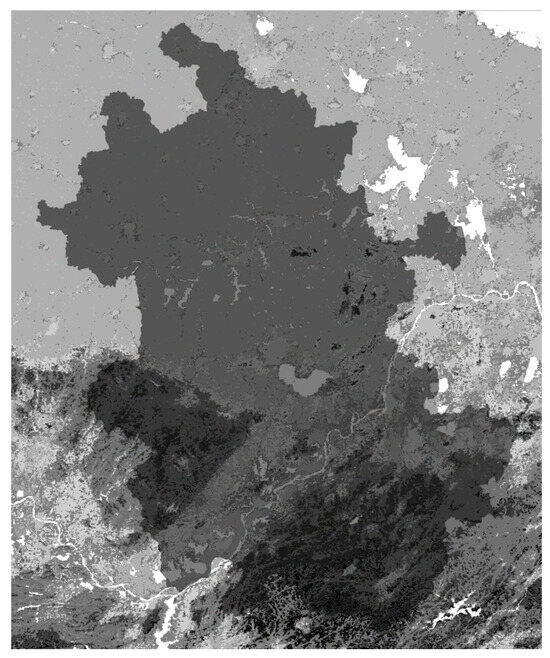
The research focuses on Anhui Province, China, specifically analyzing data from regions including Bozhou, Xuancheng, and Chizhou. Anhui is situated in the transition zone between the warm-temperate and subtropical climatic zones. The southern regions (e.g., Huangshan, Chizhou) are characterized by rugged mountainous terrain and dense broadleaf and coniferous forests, while the northern regions (e.g., Bozhou) are flatter and dominated by agriculture and plains. This heterogeneity provides a suitable case study for evaluating whether a machine learning model can differentiate risk across contrasting landscape contexts. The geographical location of Anhui Province is illustrated in Figure 1.
Figure 1.
Geographical location of Anhui Province.
3.2. Field Data Collection
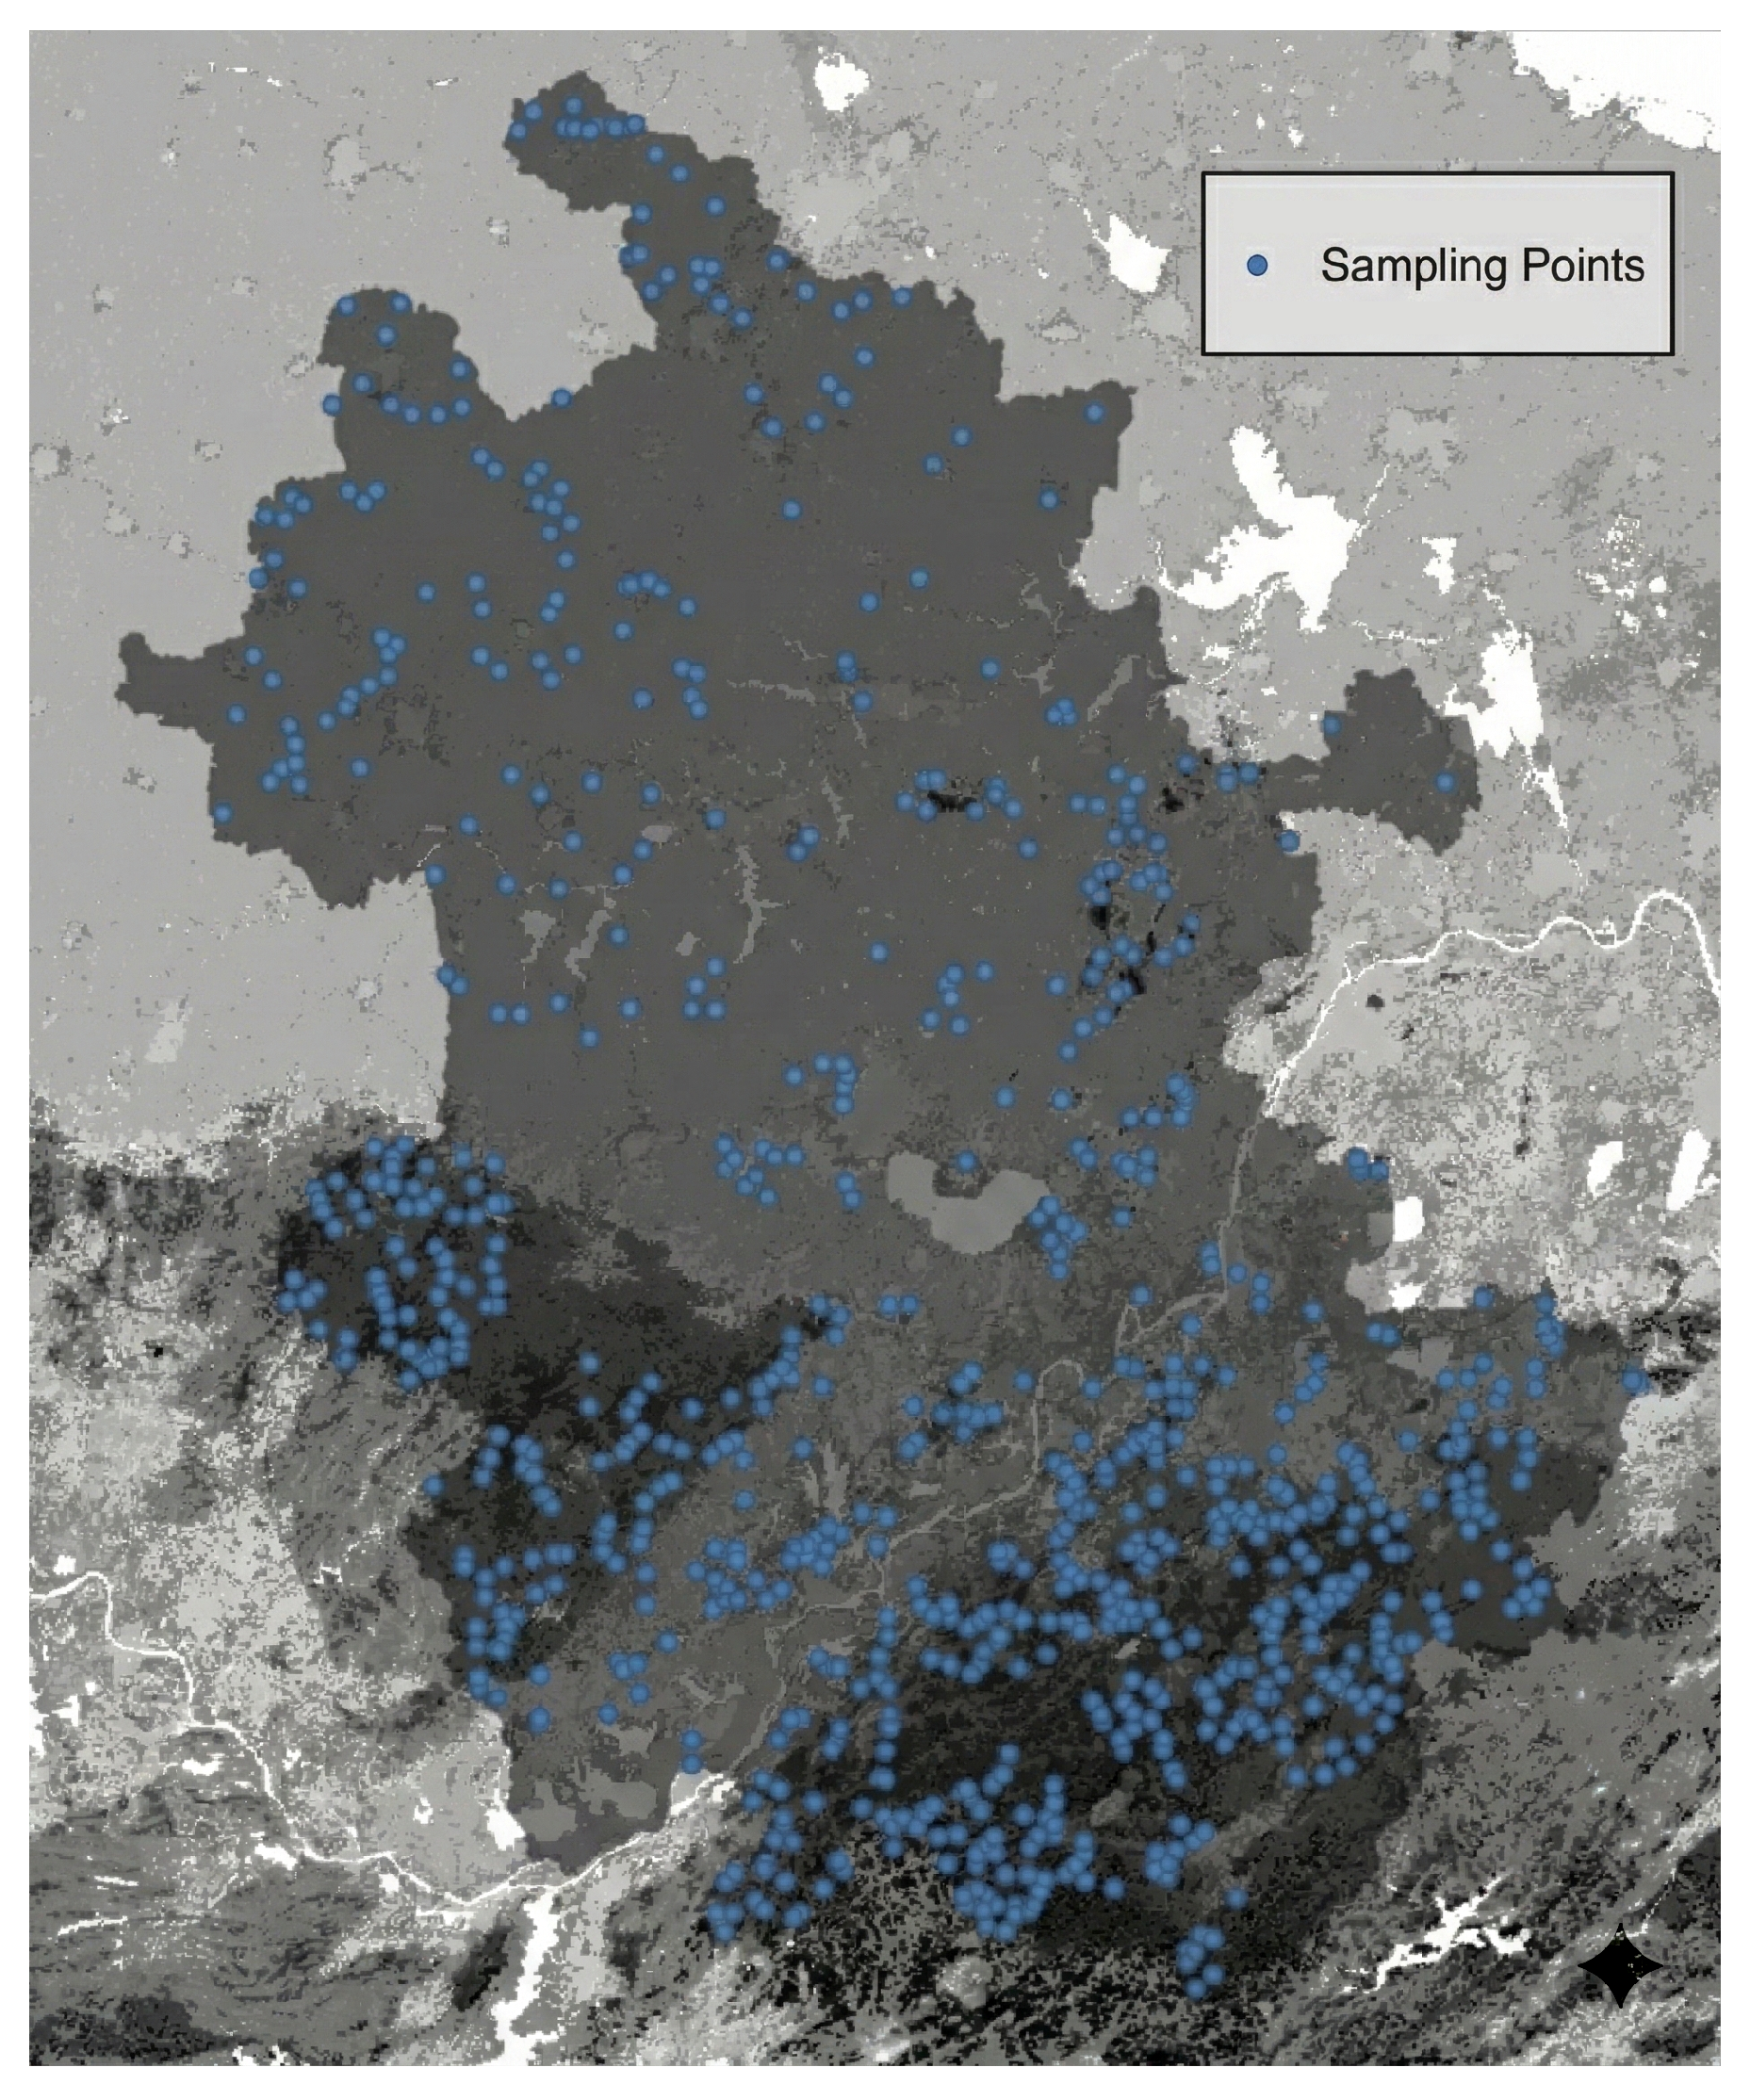
A distinguishing feature of this study is the integration of primary field data. We utilized data from 816 sample plots collected through rigorous field surveys. The field plot data were collected in 2020. The spatial distribution of these sampling points is shown in Figure 2.
- Sampling Strategy: Plots were distributed to cover representative forest types (coniferous, broadleaf, mixed), topographic positions, and elevations.
- Measurements: Key variables measured include:
- –
- Stand Structure: Mean tree height, Mean diameter at breast height, Stand density, and Canopy closure.
- –
- Fuel Loads: Combustible load of litter and humus layers.
- –
- Moisture Metrics: Dry-fresh ratios for litter layers and humus. These ratios are critical laboratory-derived metrics indicating the flammability of the fuel.
- –
- Calorific Values: Heat content of litter and humus and their ignition points.
These ground-survey data provide biophysical detail that is difficult to obtain from purely satellite-based studies.
Figure 2.
Distribution of sampling points.
3.3. Satellite Remote Sensing Data
To scale the analysis regionally and provide temporal dynamics, we integrated satellite products:
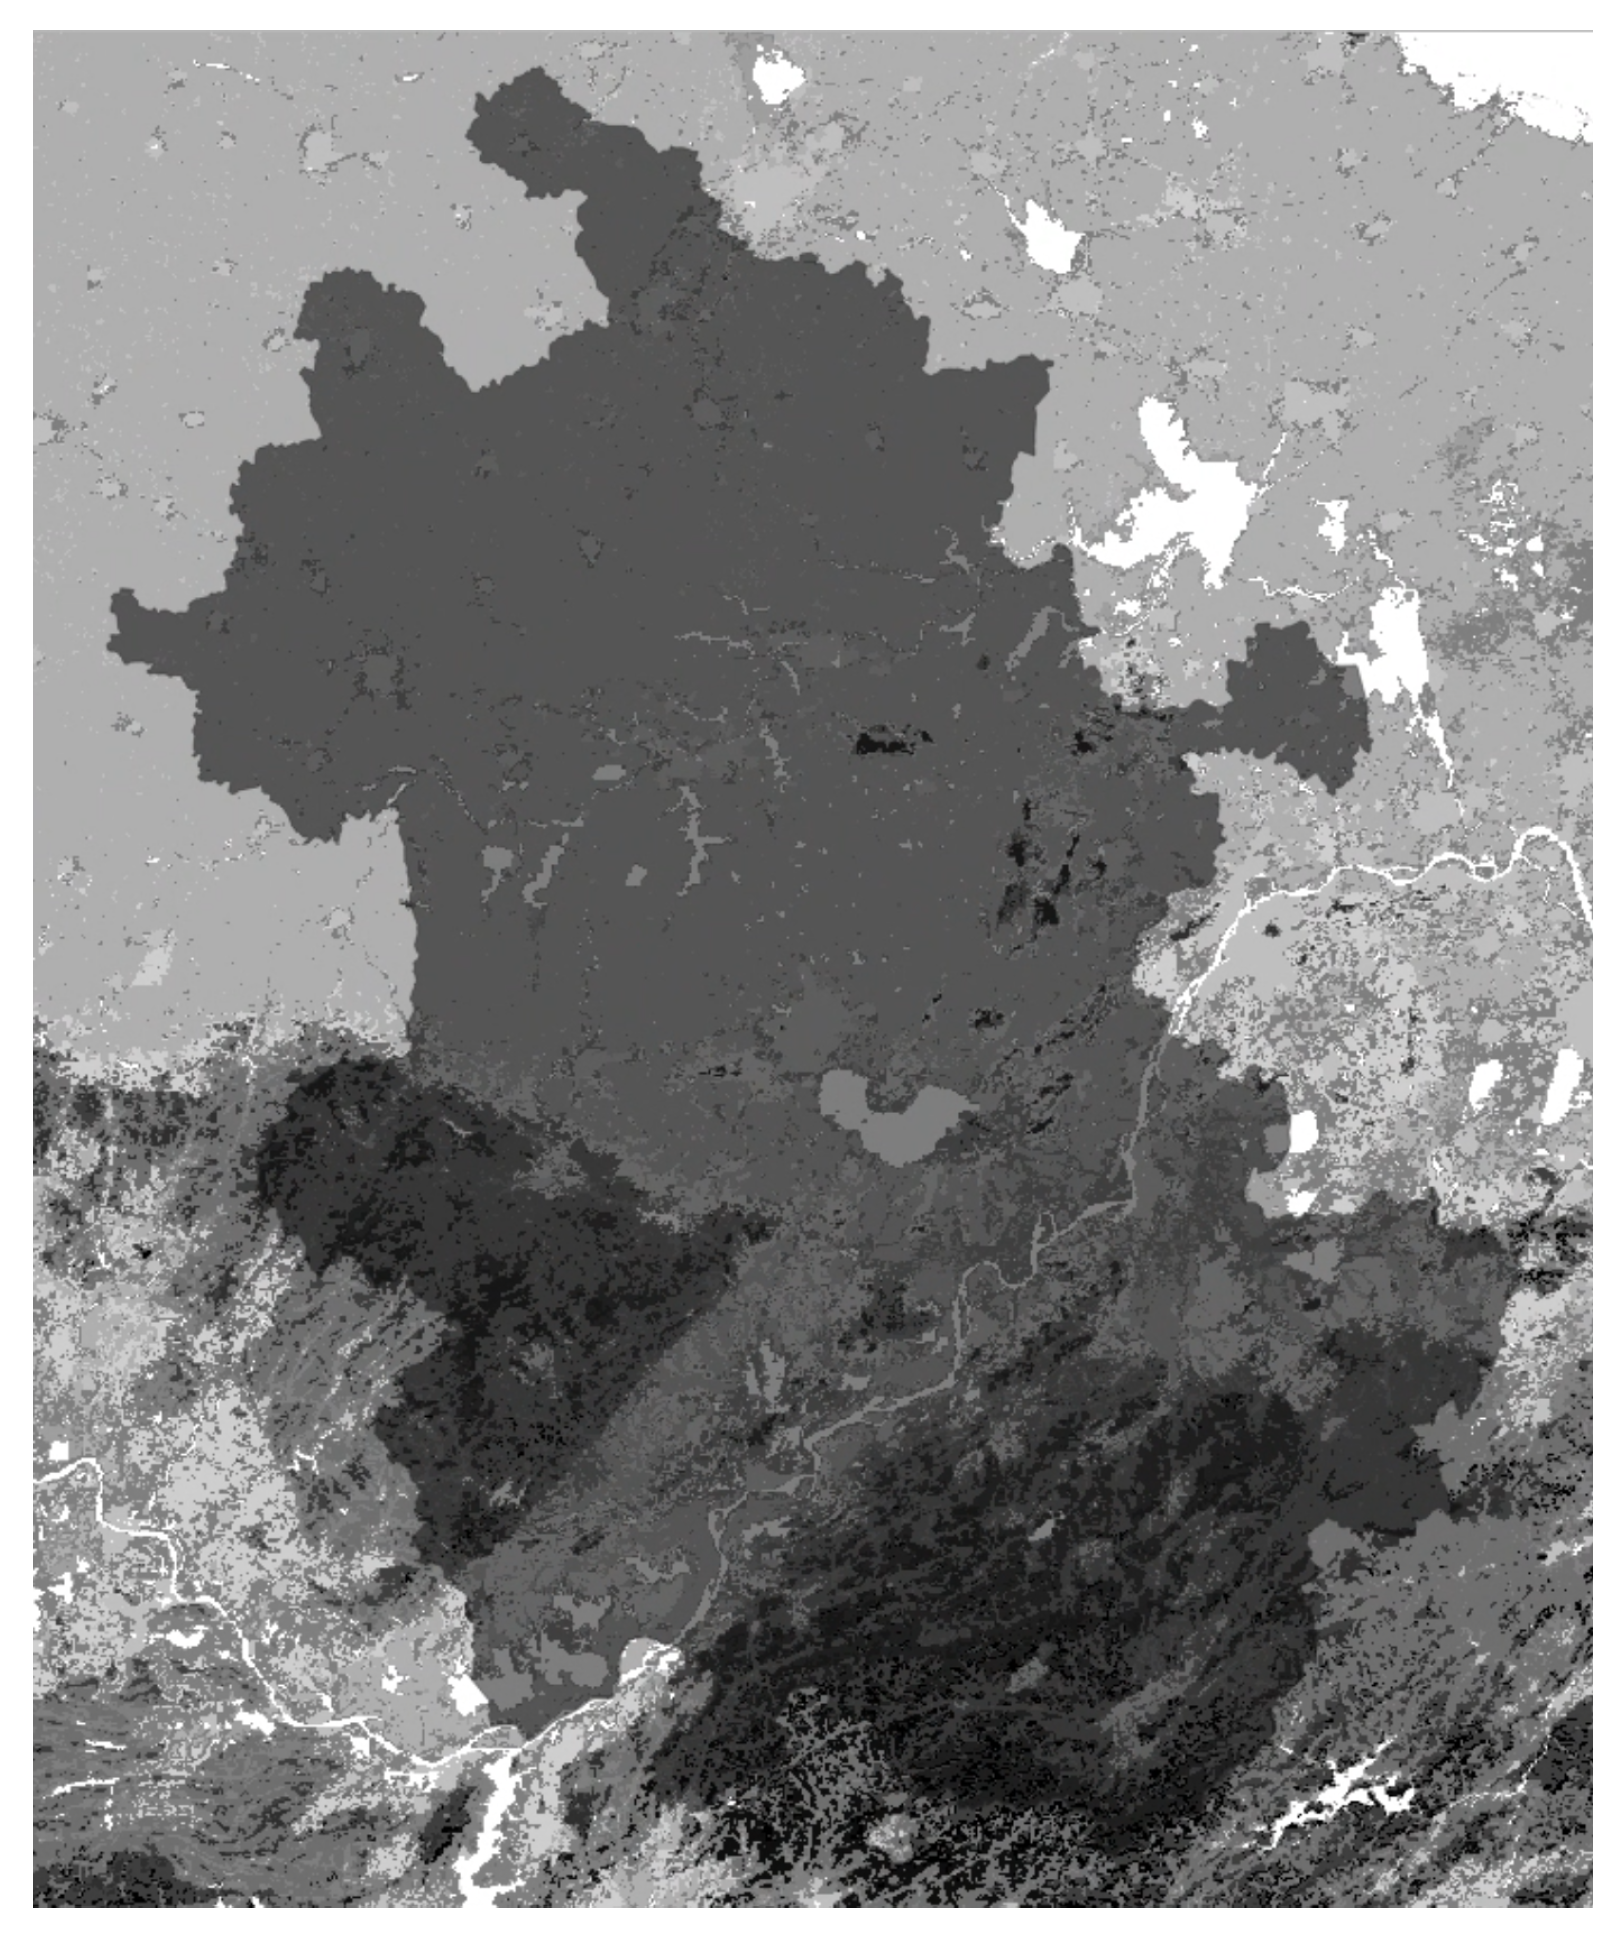
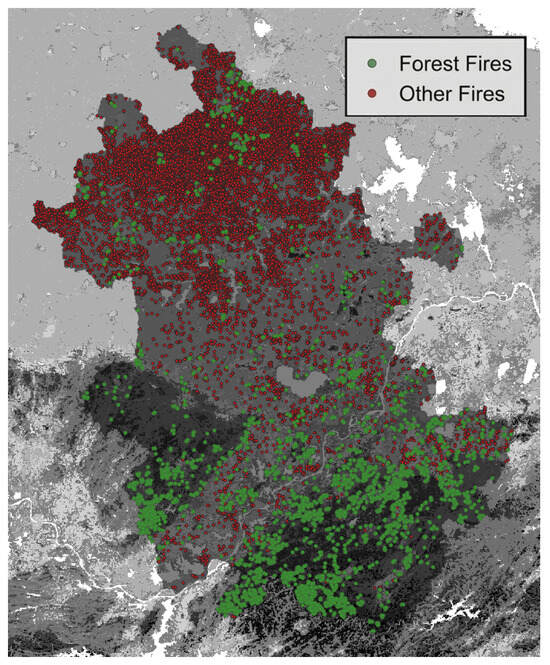
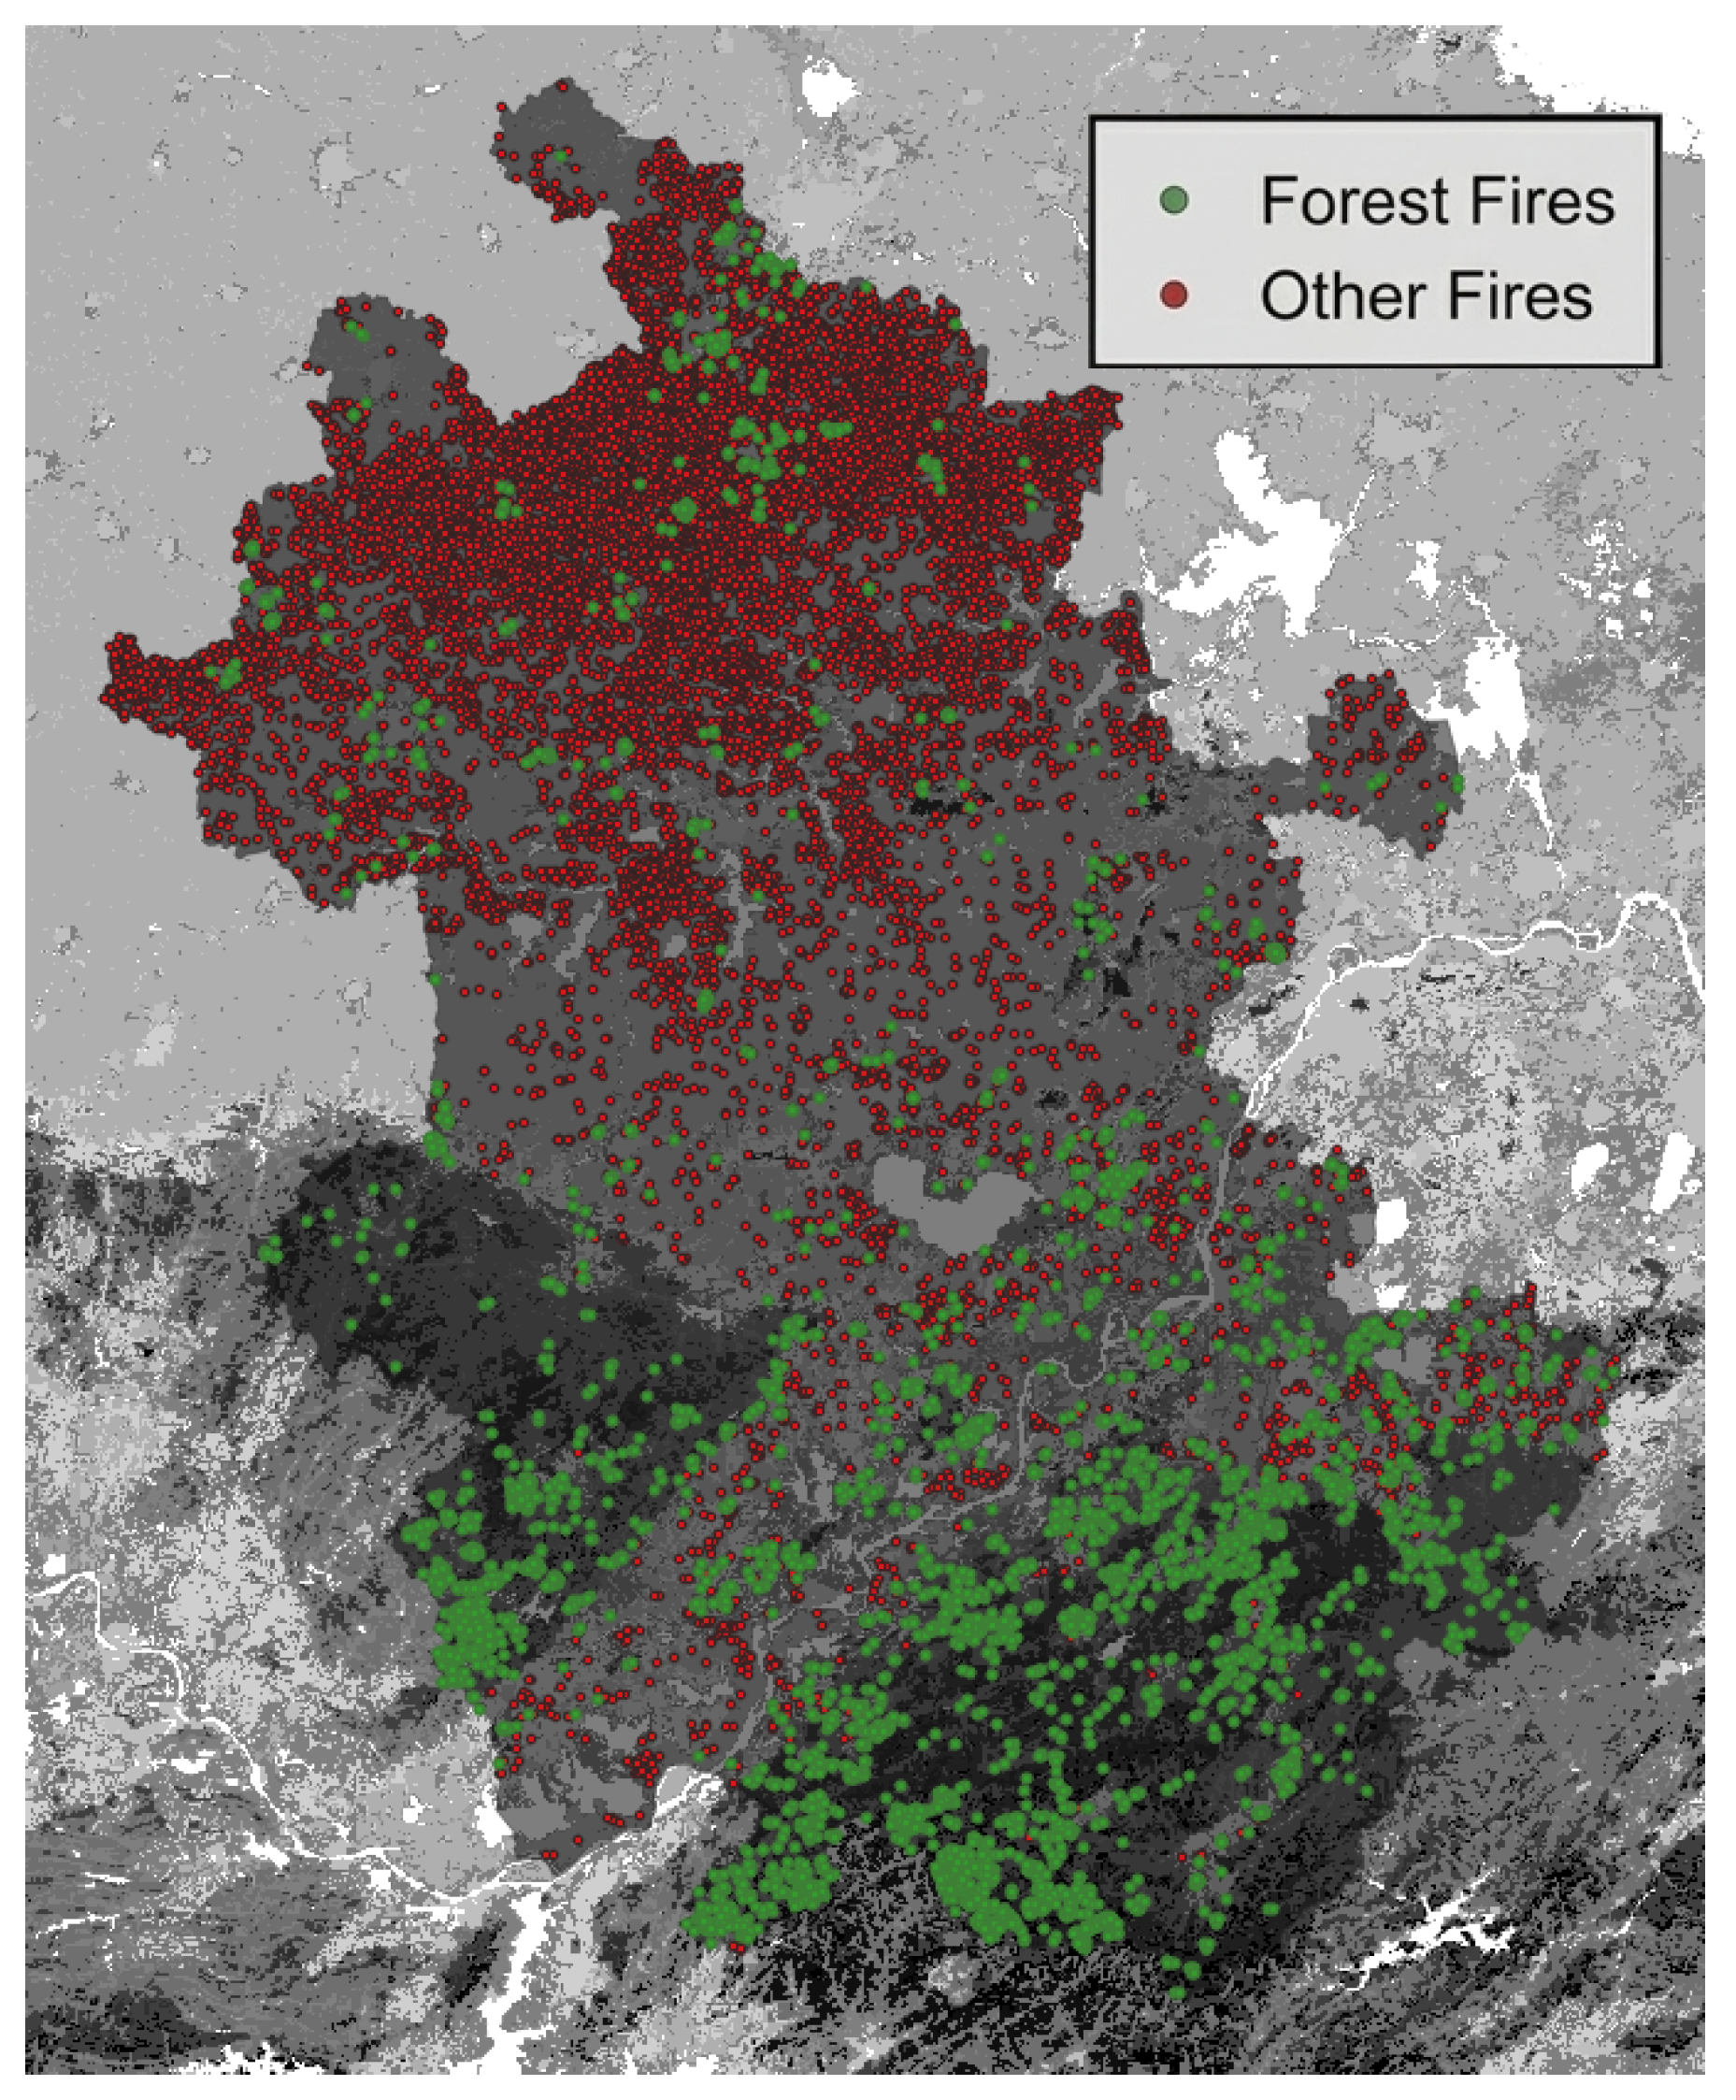
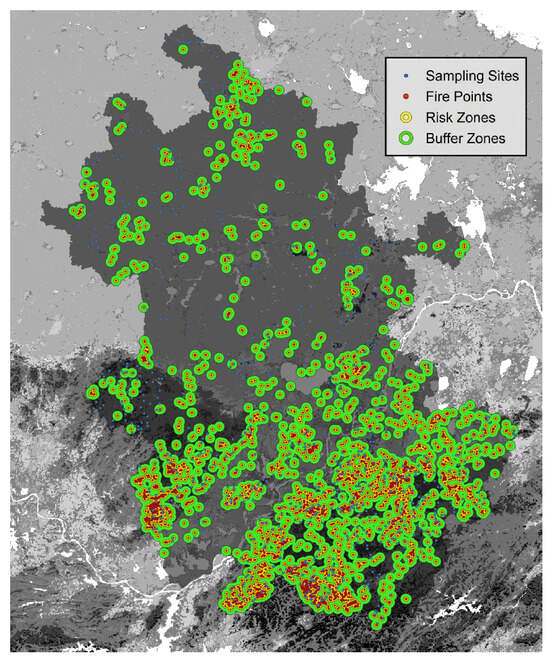
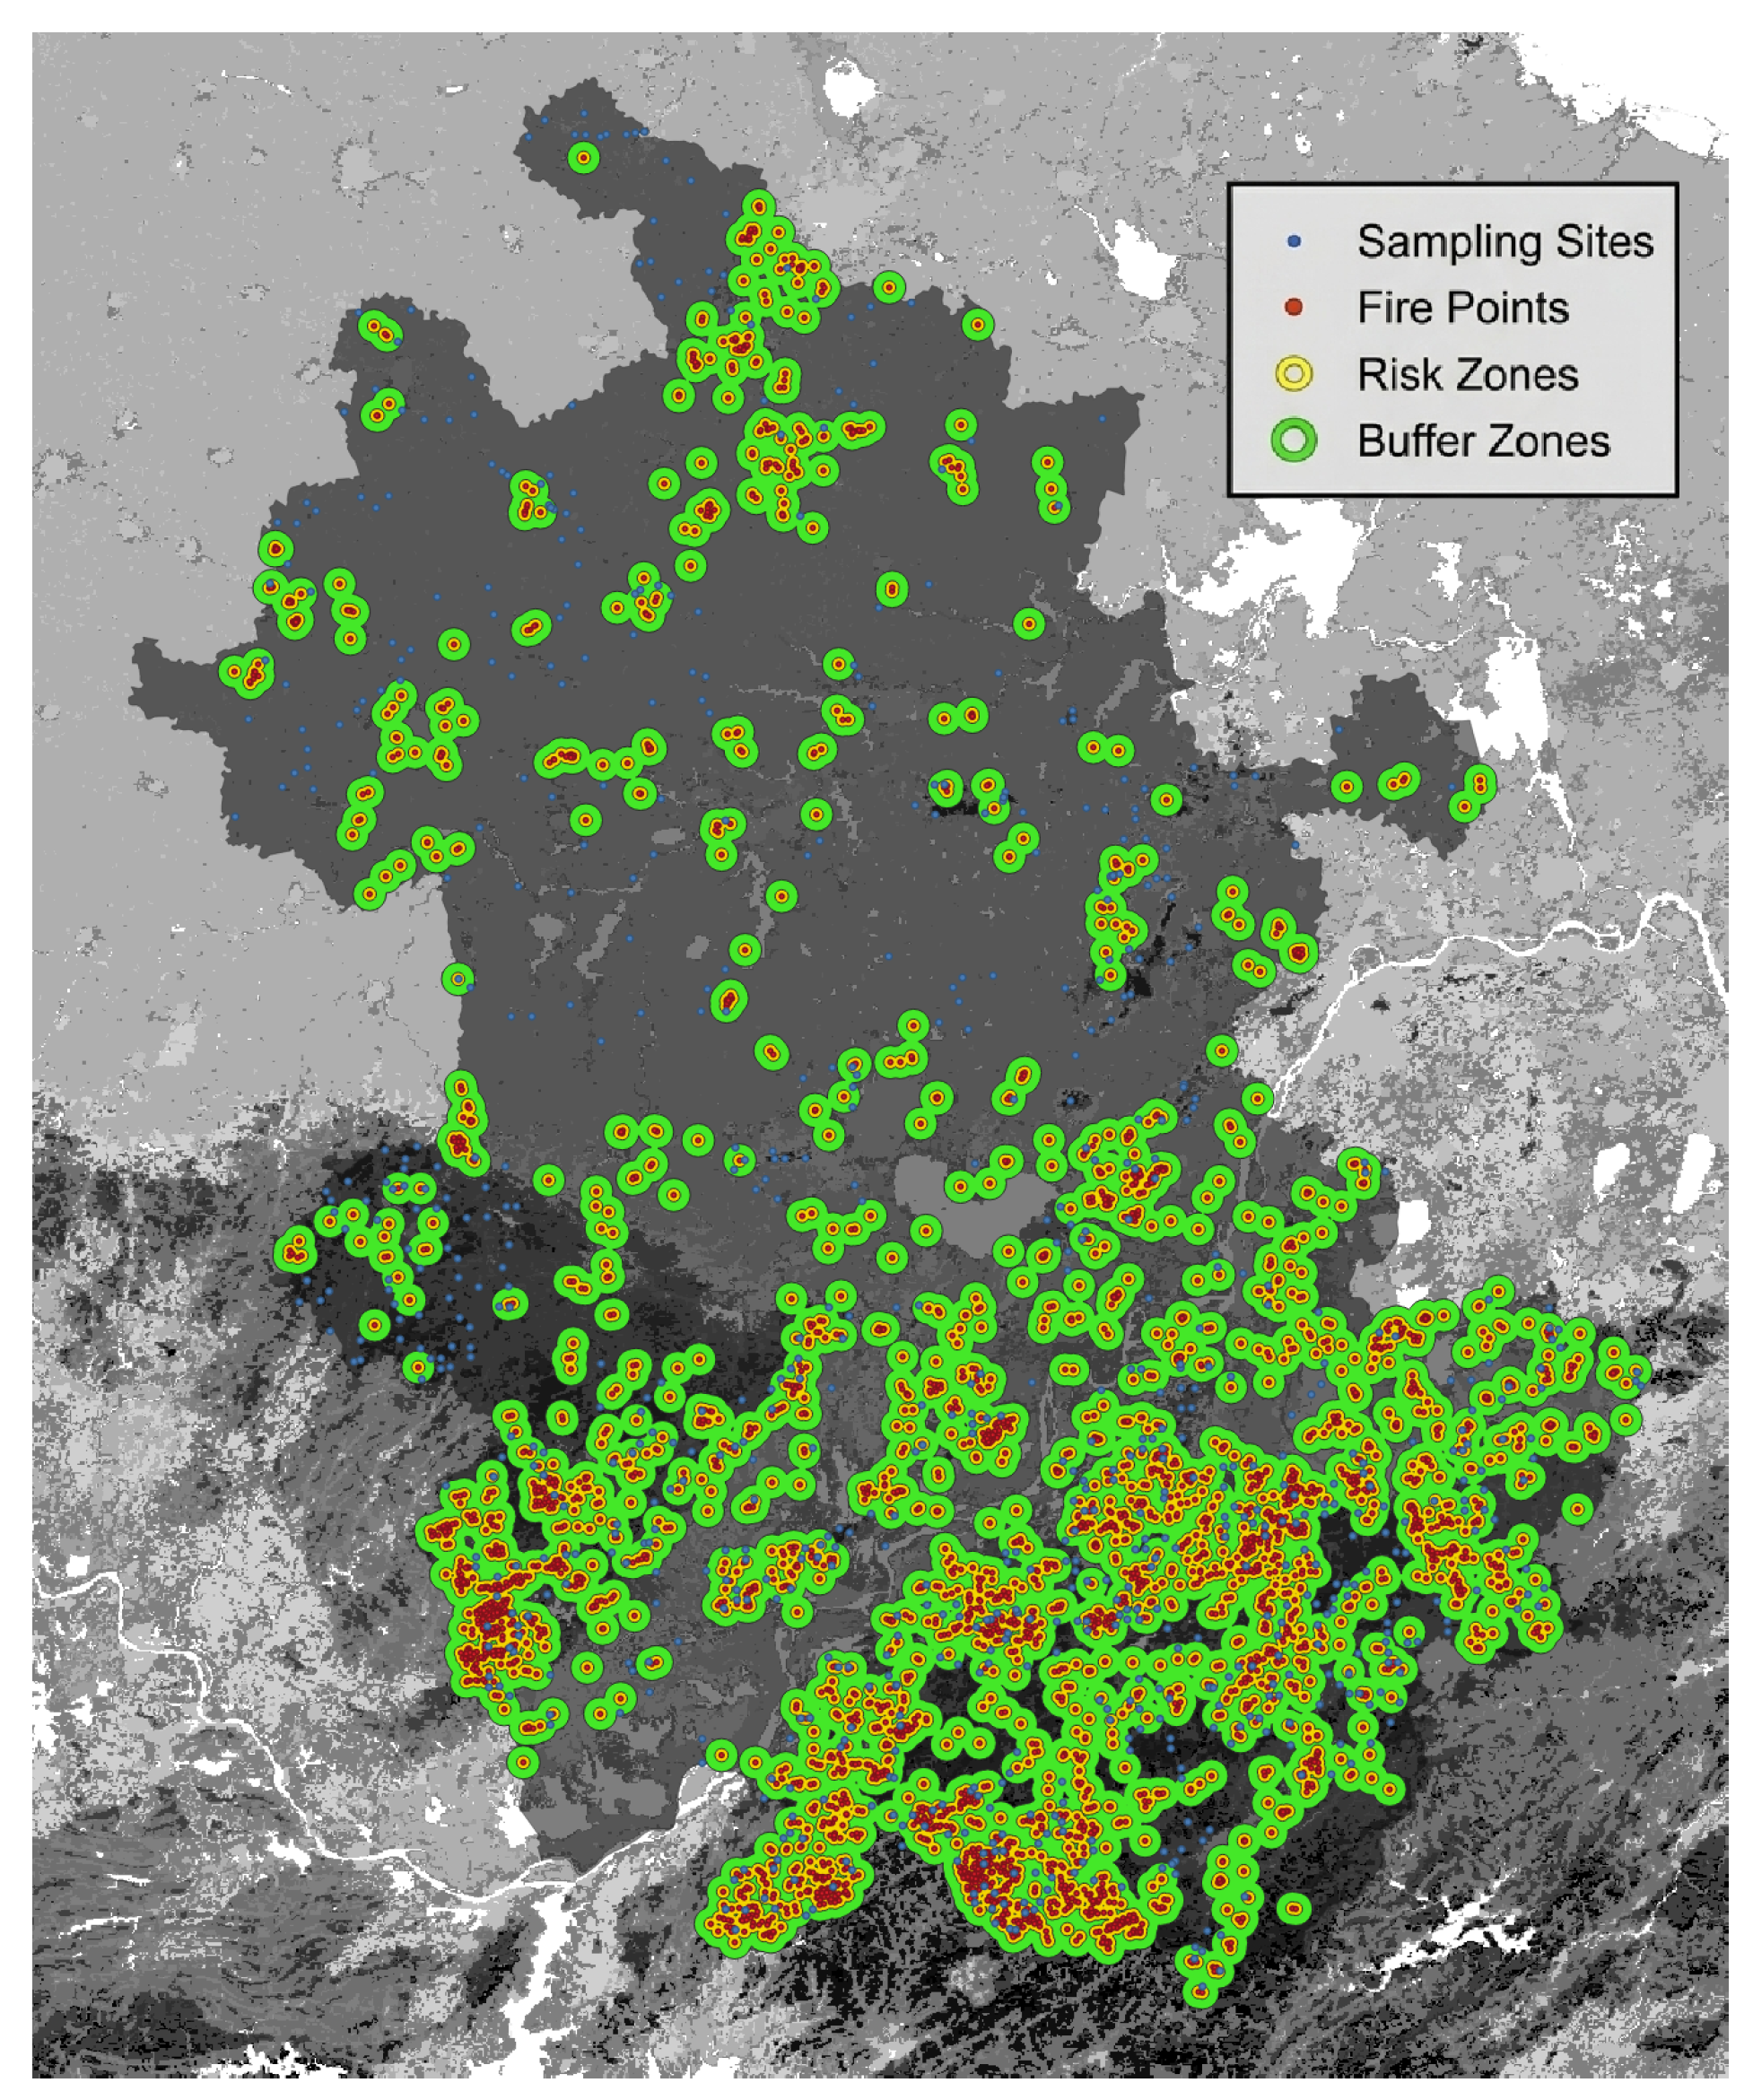
- Historical Fire Points (Target Variable): Fire occurrence data was sourced from MODIS (Moderate Resolution Imaging Spectroradiometer) thermal anomalies products (MCD14ML) covering the period from 1 January 2000, to 30 July 2025 [16] (Figure 3).
- Land Cover Filtering (MCD12Q1): To reduce the influence of non-forest burning, the raw fire points were systematically filtered using the MCD12Q1 Land Cover Type product. Only fire points occurring within pixels classified as Forest, Shrubland, or relevant natural vegetation classes were retained. Agricultural fires (crop residue burning), which are driven by different anthropogenic processes, were excluded to reduce model contamination.
- Vegetation and Surface Indices: Derived from MODIS/Landsat products, including:
- –
- NDVI: Normalized Difference Vegetation Index.
- –
- LST: Land Surface Temperature.
- –
- NSWI: Normalized Surface Water Index.
- –
- NDBSI: Normalized Difference Bare Soil Index.
Figure 3.
Distribution of historical fire records.
To reduce the potential temporal disparity between the multi-decadal MODIS fire records (2000–2025) and the predictor variables, a stratified temporal matching strategy was adopted. Static topographic constraints (e.g., elevation, slope) and fundamental structural attributes from the 816 field surveys were treated as baseline templates. In subtropical climax evergreen broad-leaved forests, stand structural attributes generally fluctuate around long-term equilibrium states with limited inter-annual variation, indicating structural stability at the community scale [17]. Conversely, for dynamic satellite-derived variables (e.g., NDVI, LST, NSWI), we extracted temporal composites corresponding to the specific year of each historical fire event. This strategy was intended to make the predictors more consistent with the environmental conditions during the corresponding temporal windows of fire occurrence.
4. Methodology: Data Preprocessing and Spatial Curation Pipeline
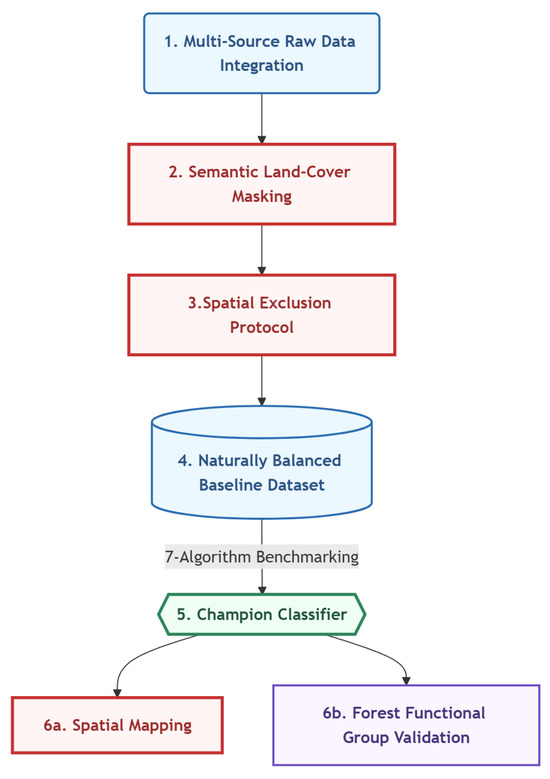
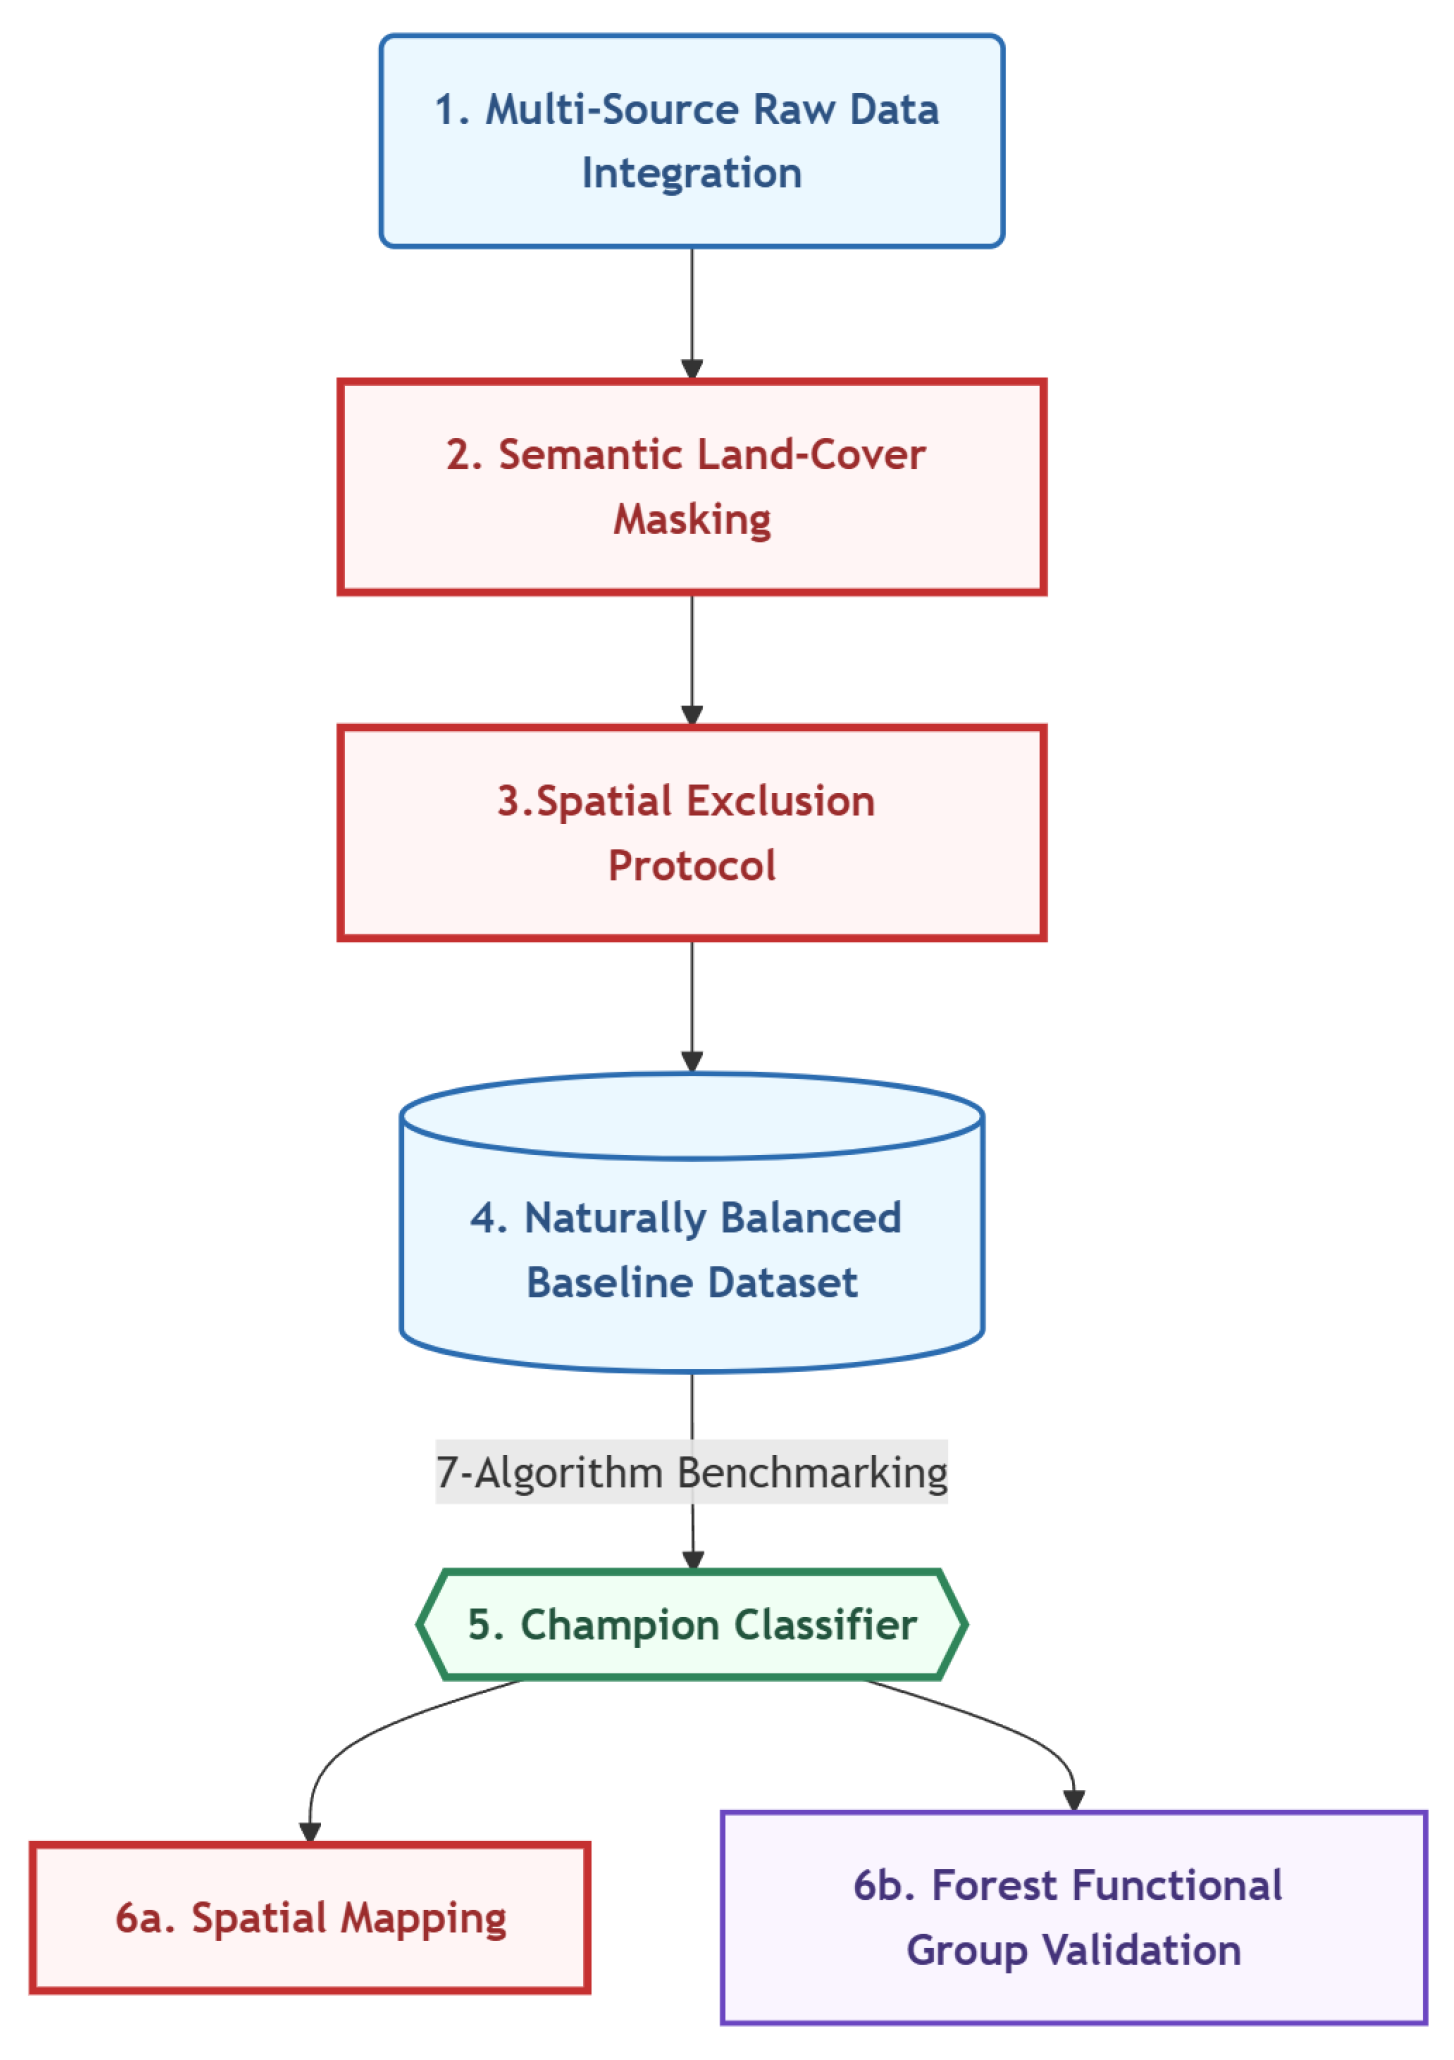
The reliability and ecological validity of machine learning classifiers in geospatial modeling are strongly influenced by the biophysical fidelity, statistical stability, and spatial dependence structure of the input data. To mitigate empirical biases and structural anomalies in raw spatial datasets, this study implements a multi-stage data curation pipeline. Rather than relying directly on heterogeneous raw inputs, this workflow was designed to improve statistical stability across multi-source predictors and reduce spatial ambiguity in sample selection. The overarching analytical framework and geospatial curation workflow of this research are illustrated in Figure 4.
Figure 4.
Methodological framework of the data-driven forest fire susceptibility modeling.
4.1. Statistical Stabilization: 1–99% Winsorization
Continuous variables in environmental datasets often exhibit skewed distributions with long tails. For instance, Land Surface Temperature (LST) might typically range from 20 °C to 40 °C, but a few pixels detecting active fires could register at 150 °C, or cloud-contaminated pixels could register at −50 °C. If we normalize this range linearly (0 to 1), the vast majority of meaningful data (20–40 °C) would be compressed into a narrow interval (e.g., 0.4 to 0.5), rendering the variance invisible to the machine learning algorithm.
To correct this, we applied 1–99% Winsorization to all continuous variables [11].
Implementation Logic
For each continuous feature f:
- 1.
- Calculate the 1st percentile value () and the 99th percentile value ().
- 2.
- Iterate through all sample values in feature f:
- If , replace with .
- If , replace with .
- Otherwise, keep unchanged.
This process essentially “clips” the extreme tails of the distribution. Unlike trimming, which removes the data points entirely (potentially losing the information that a pixel was hot), Winsorization retains the data point but caps its magnitude at a statistically defined boundary. This preserves the sample size—an important consideration when working with limited field plots—while making the min-max range used for subsequent normalization more representative of the dataset’s core behavior. Comparative analysis of raw and Winsorized distributions indicated that this step reduced kurtosis and stabilized the variance, creating a feature space in which the algorithm was less influenced by extreme outliers.
4.2. Feature Transformation: Non-Linear Gamma Curvature Normalization
After Winsorization, variables must be normalized to a 0–1 scale. However, linear scaling may not adequately represent non-linear ecological responses related to fire risk. We utilized a Non-Linear Gamma Curvature Normalization for Elevation and NDVI [12].
4.2.1. The Gamma Transformation Function
The normalization function is defined as:
where determines the concavity or convexity of the mapping.
4.2.2. NDVI Transformation Logic
For NDVI, we applied a Convex Gamma Curve (), typically around or similar “Fuzzy Large” logic. In Anhui’s fuel-limited ecosystems, risk is not necessarily linearly proportional to greenness. Fire susceptibility may increase as vegetation transitions from bare soil (NDVI ∼ 0.1) to sparse vegetation (NDVI ∼ 0.3), where fuel becomes more continuous. Once the canopy is closed (NDVI > 0.6), the incremental addition of biomass may contribute less to spread probability and may even reduce susceptibility due to higher moisture. The Convex Gamma curve amplifies sensitivity at the lower end of the vegetation spectrum, helping the model differentiate between “no fuel” and “some fuel” conditions.
4.2.3. Elevation Transformation Logic
For Elevation, we utilized a Segmented Membership Function enhanced with Gamma curvature. A simple linear normalization (where 0 = Low, 1 = High) may assign increasing risk monotonically with elevation, which is not necessarily consistent with the observed distribution of historical fires. Instead, we mapped elevation to a “risk membership” in which the curve rises toward a mid-elevation range (approximately 500–1000 m) and then may plateau or decline. This non-linear mapping was intended to make the numerical input more consistent with the observed spatial distribution of historical fires.
4.3. Semantic Land-Cover Masking and Spatial Exclusion Protocol
A persistent methodological challenge in geospatial fire probability modeling is the extraction of appropriate “non-fire” background points (pseudo-absences) [13]. Randomly sampling the background can introduce spatial proximity bias and anthropogenic label noise. For instance, agricultural residue burning may be misclassified as forest fires, and unburned points directly adjacent to an active fire may share environmental conditions similar to the ignition site. To reduce these ambiguities, we implemented a two-step spatial curation protocol encompassing semantic land-cover masking and a geostatistically informed spatial exclusion buffer.
4.3.1. Geostatistical Spatial Zoning Definition
To reduce spatial autocorrelation and define a geographic separation between positive ignitions and negative background samples, concentric distance thresholds were ecologically and statistically informed:
- Core Ignition Zone (Label = 1; ≤2 km): Defined as the localized area within a 2 km radius of verified, land-cover-masked forest ignitions. Due to the dissected low-mountain topography and anthropogenic fragmentation in Anhui Province, contiguous homogeneous forest stands often have limited spatial extent [18]. This localized buffer was used to represent the ignition-associated micro-environment while reducing the inclusion of ecologically distinct neighboring areas. Samples within this zone were designated as fire-associated samples.
- Spatial Exclusion Zone (Label = −1; km): Defined as the transitional area spanning 2 km to 5 km from any ignition point. Spatial variogram analyses in complex terrains indicate that the spatial autocorrelation of important fire-related drivers (e.g., local surface temperature anomalies and fuel moisture deficits) often decays to its sill within 2.0 to 4.0 km [19]. Ecologically, this buffer represents a zone in which samples may be environmentally similar to ignition sites but did not burn during the recorded events. Excluding these ambiguous samples from the training set was intended to reduce spatial collinearity and label ambiguity, helping the classifier distinguish ignition-associated samples from lower-risk background samples [20].
- Independent Background Zone (Label = 0; >5 km): Defined as the background environment located beyond the 5 km exclusion boundary [21]. This distance was selected to reduce the potential influence of the thermal footprint and spatial autocorrelation associated with recorded fire events, while keeping pseudo-absence samples within a comparable macro-ecological domain. These samples were treated as background pseudo-absences rather than as intrinsically “safe” locations, providing contrastive cases for model training.
4.3.2. Implementation and Spatial Autocorrelation Diagnostics
This strategy was implemented in QGIS using the EPSG:4547 projected coordinate system to ensure metric accuracy (Figure 5).
Figure 5.
Schematic of the geostatistical spatial exclusion protocol.
To quantitatively assess whether spatial autocorrelation was mitigated by the spatial exclusion protocol, we calculated the Global Moran’s I statistic for the spatial distribution of the selected environmental samples. The results showed that, before exclusion, Moran’s I was 0.106464, with a Z-score of 6.406440 and , indicating significant positive spatial autocorrelation for this dimension. After excluding samples with Fire_Label = −1, Moran’s I decreased to 0.022358, with a Z-score of 1.203861 and , suggesting that the spatial autocorrelation was no longer statistically significant. These results indicate that the protocol substantially reduced spatial proximity bias in the analyzed dimension, although complete spatial independence cannot be assumed.
5. Machine Learning Implementation
The processed dataset—refined via Winsorization, Non-Linear Gamma Curvature Normalization, semantic land-cover masking, and spatial exclusion—yielded a curated, naturally balanced cohort of 240 verified ignitions and 318 pseudo-absences. This sample structure reduced the extreme class imbalance often associated with disaster-event modeling. The resulting data matrix was utilized to train and evaluate predictive models, transitioning from traditional static models to ensemble learning architectures to examine the non-linear interactions of environmental fire drivers [9].
5.1. Model Selection and Benchmark Testing
To evaluate model selection, we conducted a benchmark comparison of seven algorithms under identical pre-processing and spatial isolation conditions. The algorithms included Logistic Regression (LR), K-Nearest Neighbors (KNN), Support Vector Machine (SVM), Decision Tree (DT), Multilayer Perceptron (MLP), Random Forest (RF), and GBDT. Performance was evaluated using 5-Fold Cross-Validation (CV) AUC and an independent 20% Test Set AUC as indicators of fitting and out-of-sample predictive performance, respectively [22].
5.2. Selected RF Architecture
Based on the quantitative benchmark results (detailed in Section 6.2), the RF algorithm was selected as the best-performing model among the evaluated algorithms, showing relatively high test-set performance and a small difference between cross-validation and test-set AUC. RF is a parallel ensemble learning architecture based on the Bootstrap Aggregating mechanism. By constructing multiple decision trees using randomized subsets of both training samples and environmental features at each node split, RF can reduce variance and improve resistance to localized geospatial noise in complex ecological datasets. The RF architecture was calibrated with n_estimators = 300 and a constrained max_depth = 8 to balance model complexity with generalization, thereby reducing the likelihood of memorizing local spatial anomalies.
5.3. Threshold Calibration via Youden’s J Statistic
Benefiting from the naturally balanced sample structure, we used Youden’s J statistic (Youden’s Index) to select a data-driven risk cutoff [23]. By maximizing the sum of the True Positive Rate and True Negative Rate derived from the Receiver Operating Characteristic (ROC) curve of the independent test set, Youden’s J identified Threshold = 0.4704 as the classification cutoff. This calibration reduces subjectivity in threshold selection and allows the derived “High-Risk” class to be defined consistently from the learned probability outputs.
6. Results and Analysis
6.1. Feature Importance: The Hierarchy of Risk
Utilizing the optimal RF classifier, the relative importance of the 27 environmental and physicochemical features was quantified. Table 1 presents the top five features derived from the model’s feature importance metric, normalized to sum to 1.
Table 1.
Top 5 environmental predictors of forest fire risk in Anhui.
Topographic configurations emerged as important baseline constraints, with Geomorphology (11.65%), Slope (5.18%), and Slope Position (5.03%) influencing fire behavior by controlling micro-climatic gradients and solar radiation exposure. Steeper, sun-facing slopes can accelerate localized fuel desiccation and facilitate upward fire spread via convective pre-heating—a thermodynamic mechanism known as the ’chimney effect’ [24]. Furthermore, forest structural attributes, notably Stand Density (7.56%), contribute to horizontal and vertical fuel continuity that may support sustained ignitions [25]. Remote sensing physiological moisture proxies, particularly the Ratio Vegetation Index (RVI, 5.01%), ranked higher than traditional indices such as NDVI (1.24%). This result is consistent with the phenomenon of optical saturation in dense sub-tropical canopies [26], suggesting that RVI may better capture pre-ignition canopy desiccation in this dataset. Interestingly, laboratory-measured inherent physicochemical properties ranked relatively low, indicating that at the regional macro-landscape scale, spatial ignition probability was more strongly associated with macro-topography and fuel continuity than with microscopic leaf flammability [27].
6.2. Multi-Model Benchmark and Generalization Analysis
The benchmark comparison provided insights into spatial machine learning dynamics and highlighted the potential “Overfitting Trap” in geospatial modeling [28].
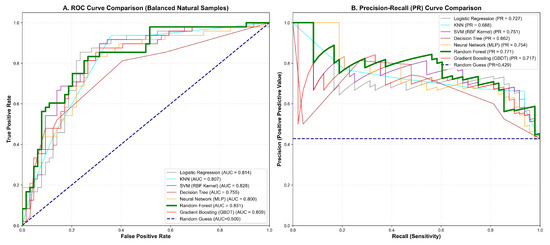
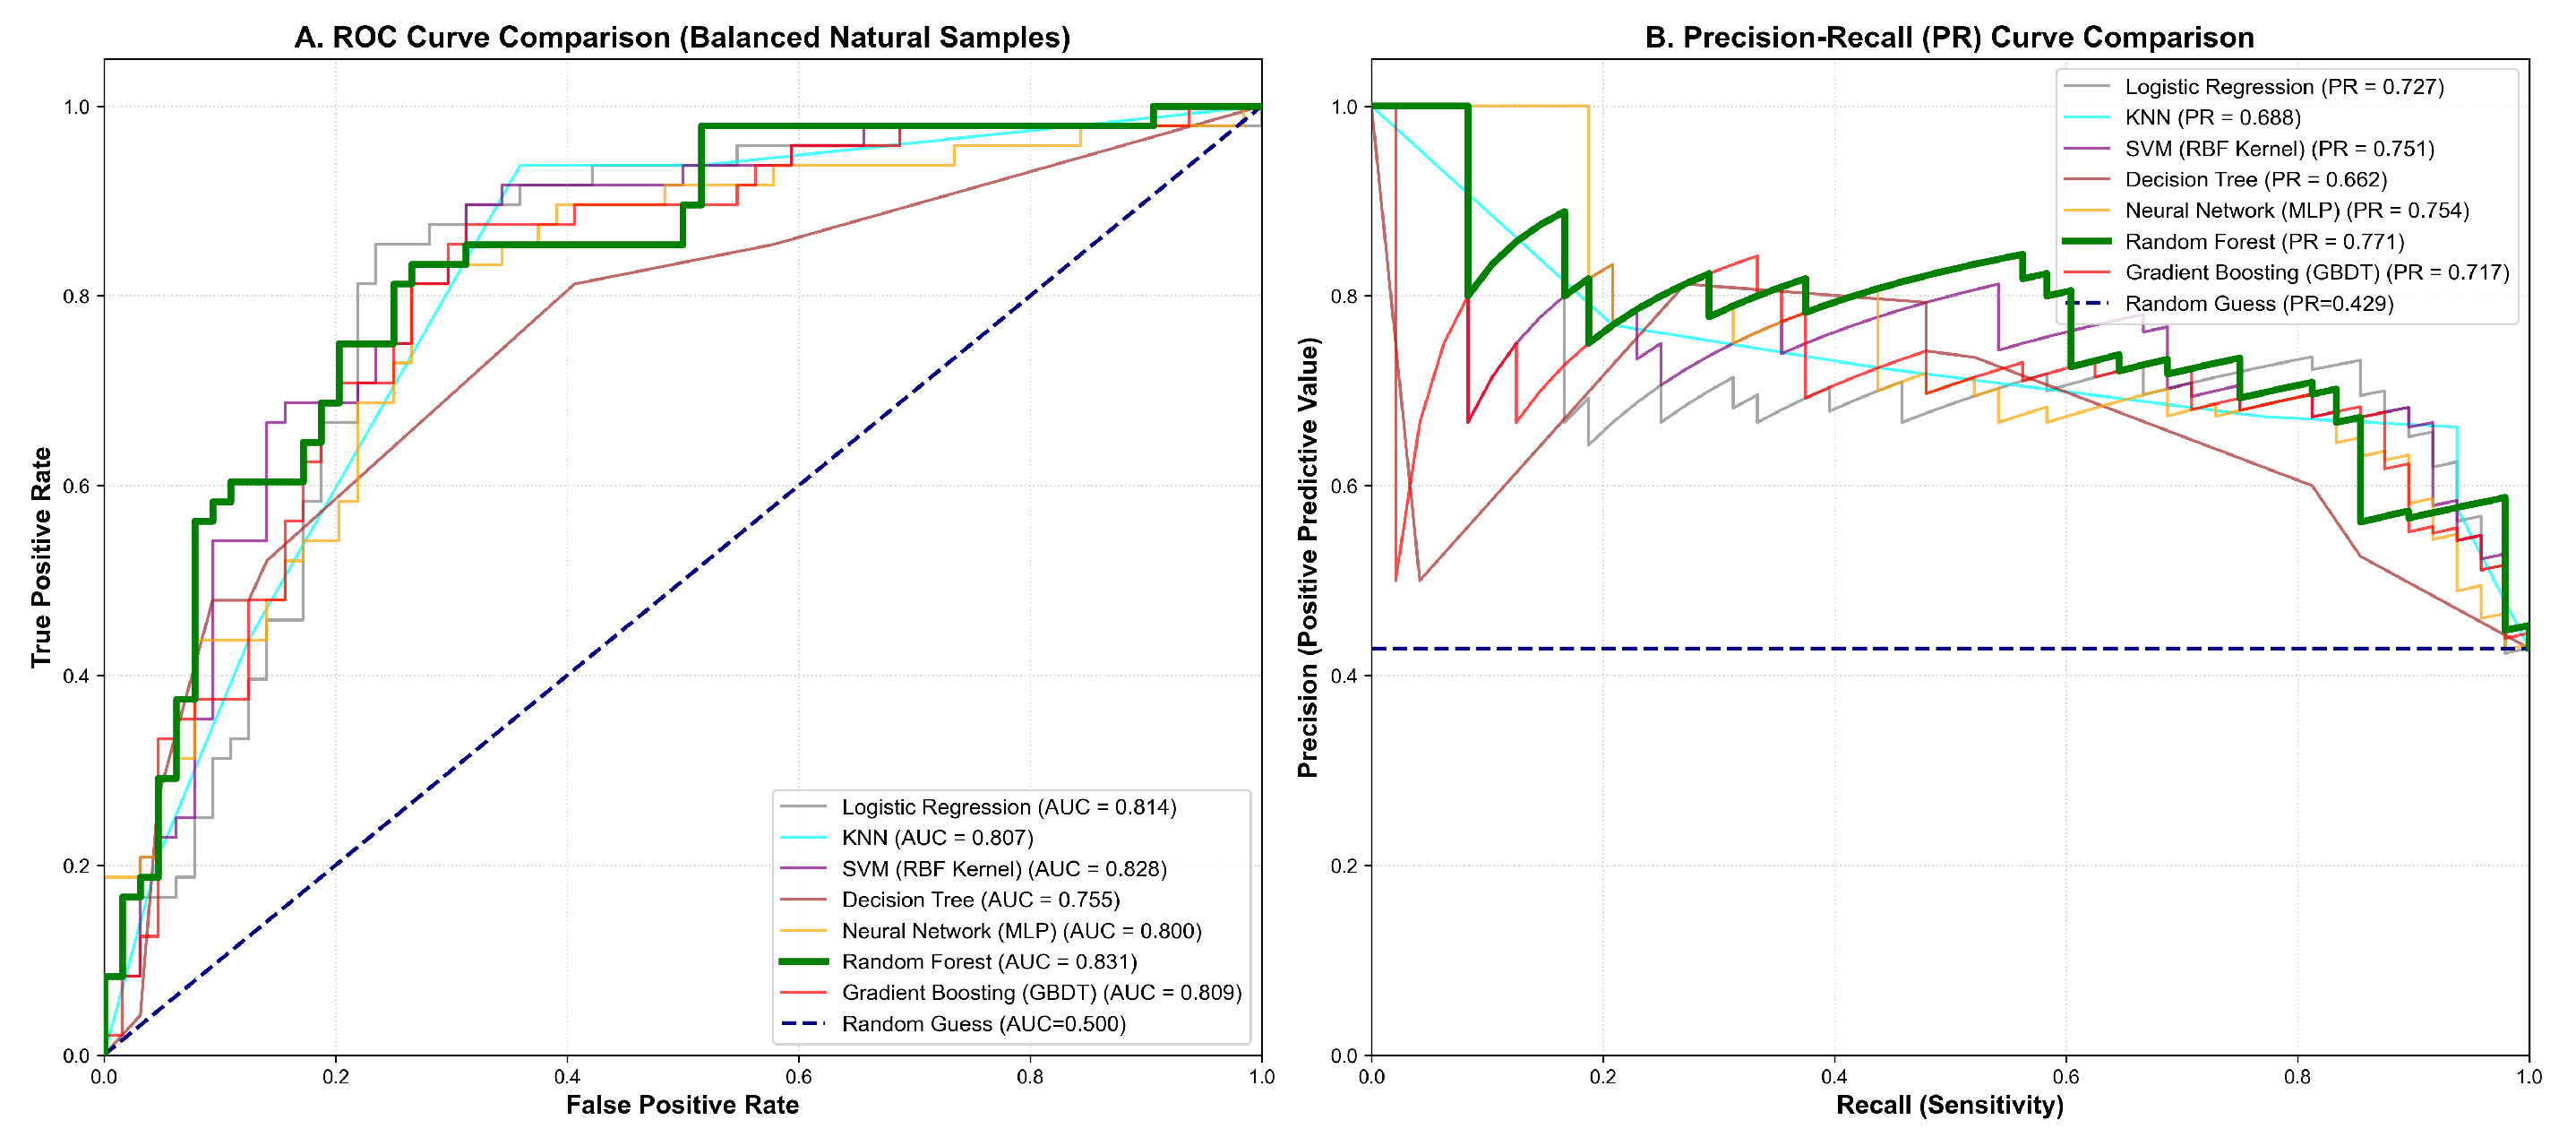
As detailed in Table 2 and Figure 6, the Random Forest (RF) algorithm performed best among the evaluated models on the independent test set. It achieved a Test AUC of , together with a Precision-Recall AUC () and a Brier Score Loss of , indicating relatively strong discriminative ability and probability calibration for this dataset.
Table 2.
Performance Comparison of 7 Machine Learning Algorithms.
Figure 6.
Comprehensive predictive performance benchmarking of the evaluated machine learning algorithms. (A) Receiver Operating Characteristic (ROC) curves and (B) Precision-Recall (PR) curves computed from the independent test set.
The small discrepancy () between cross-validation performance () and independent test-set performance () suggests limited overfitting under the present validation setting. Furthermore, bootstrap resampling () yielded a Confidence Interval (CI) of . The lower bound of exceeds the conventional adequacy threshold often used in environmental risk modeling, supporting the stability of the spatially curated framework while leaving room for further external validation.
6.3. Risk Susceptibility by Tree Species: Ecological Plausibility Check
A useful machine learning model should show consistency with ecological knowledge. We cross-tabulated the model’s spatial risk predictions with the field-surveyed tree species of the 816 fuel plots to examine species-specific patterns in predicted susceptibility (Table 3).
Table 3.
Fire Risk Distribution by Dominant Tree Species.
As an ecological plausibility check, the machine-learning-derived high-risk proportions were aggregated across macroscopic forest functional groups (Table 3). The spatial predictions revealed a marked susceptibility gradient: .
Coniferous species showed higher predicted susceptibility, which may be related to their volatile resin content and well-aerated needle litter beds that can lower the ignition energy barrier [29]. Similarly, the dense vertical architecture of bamboo can create continuous fuel ladders that facilitate fire propagation [19]. In contrast, Soft broadleaf species showed a much lower predicted high-risk proportion. Their broad foliar structures may retain higher moisture and decompose into compact humus layers, thereby reducing flammability under some conditions [30].
These functional-group-level insights provide data-driven evidence that may inform regional silvicultural planning. To mitigate wildfire risk in Anhui Province, the relatively low predicted susceptibility of soft broadleaf species supports considering their use in establishing ’Green Firebreaks’. Strategically interplanting fire-resistant soft broadleaves within contiguous pine matrices may help reduce landscape-level fuel continuity and slow fire propagation, although field-scale validation remains necessary [18].
6.4. Spatial Risk Distribution and Geographical Mechanisms
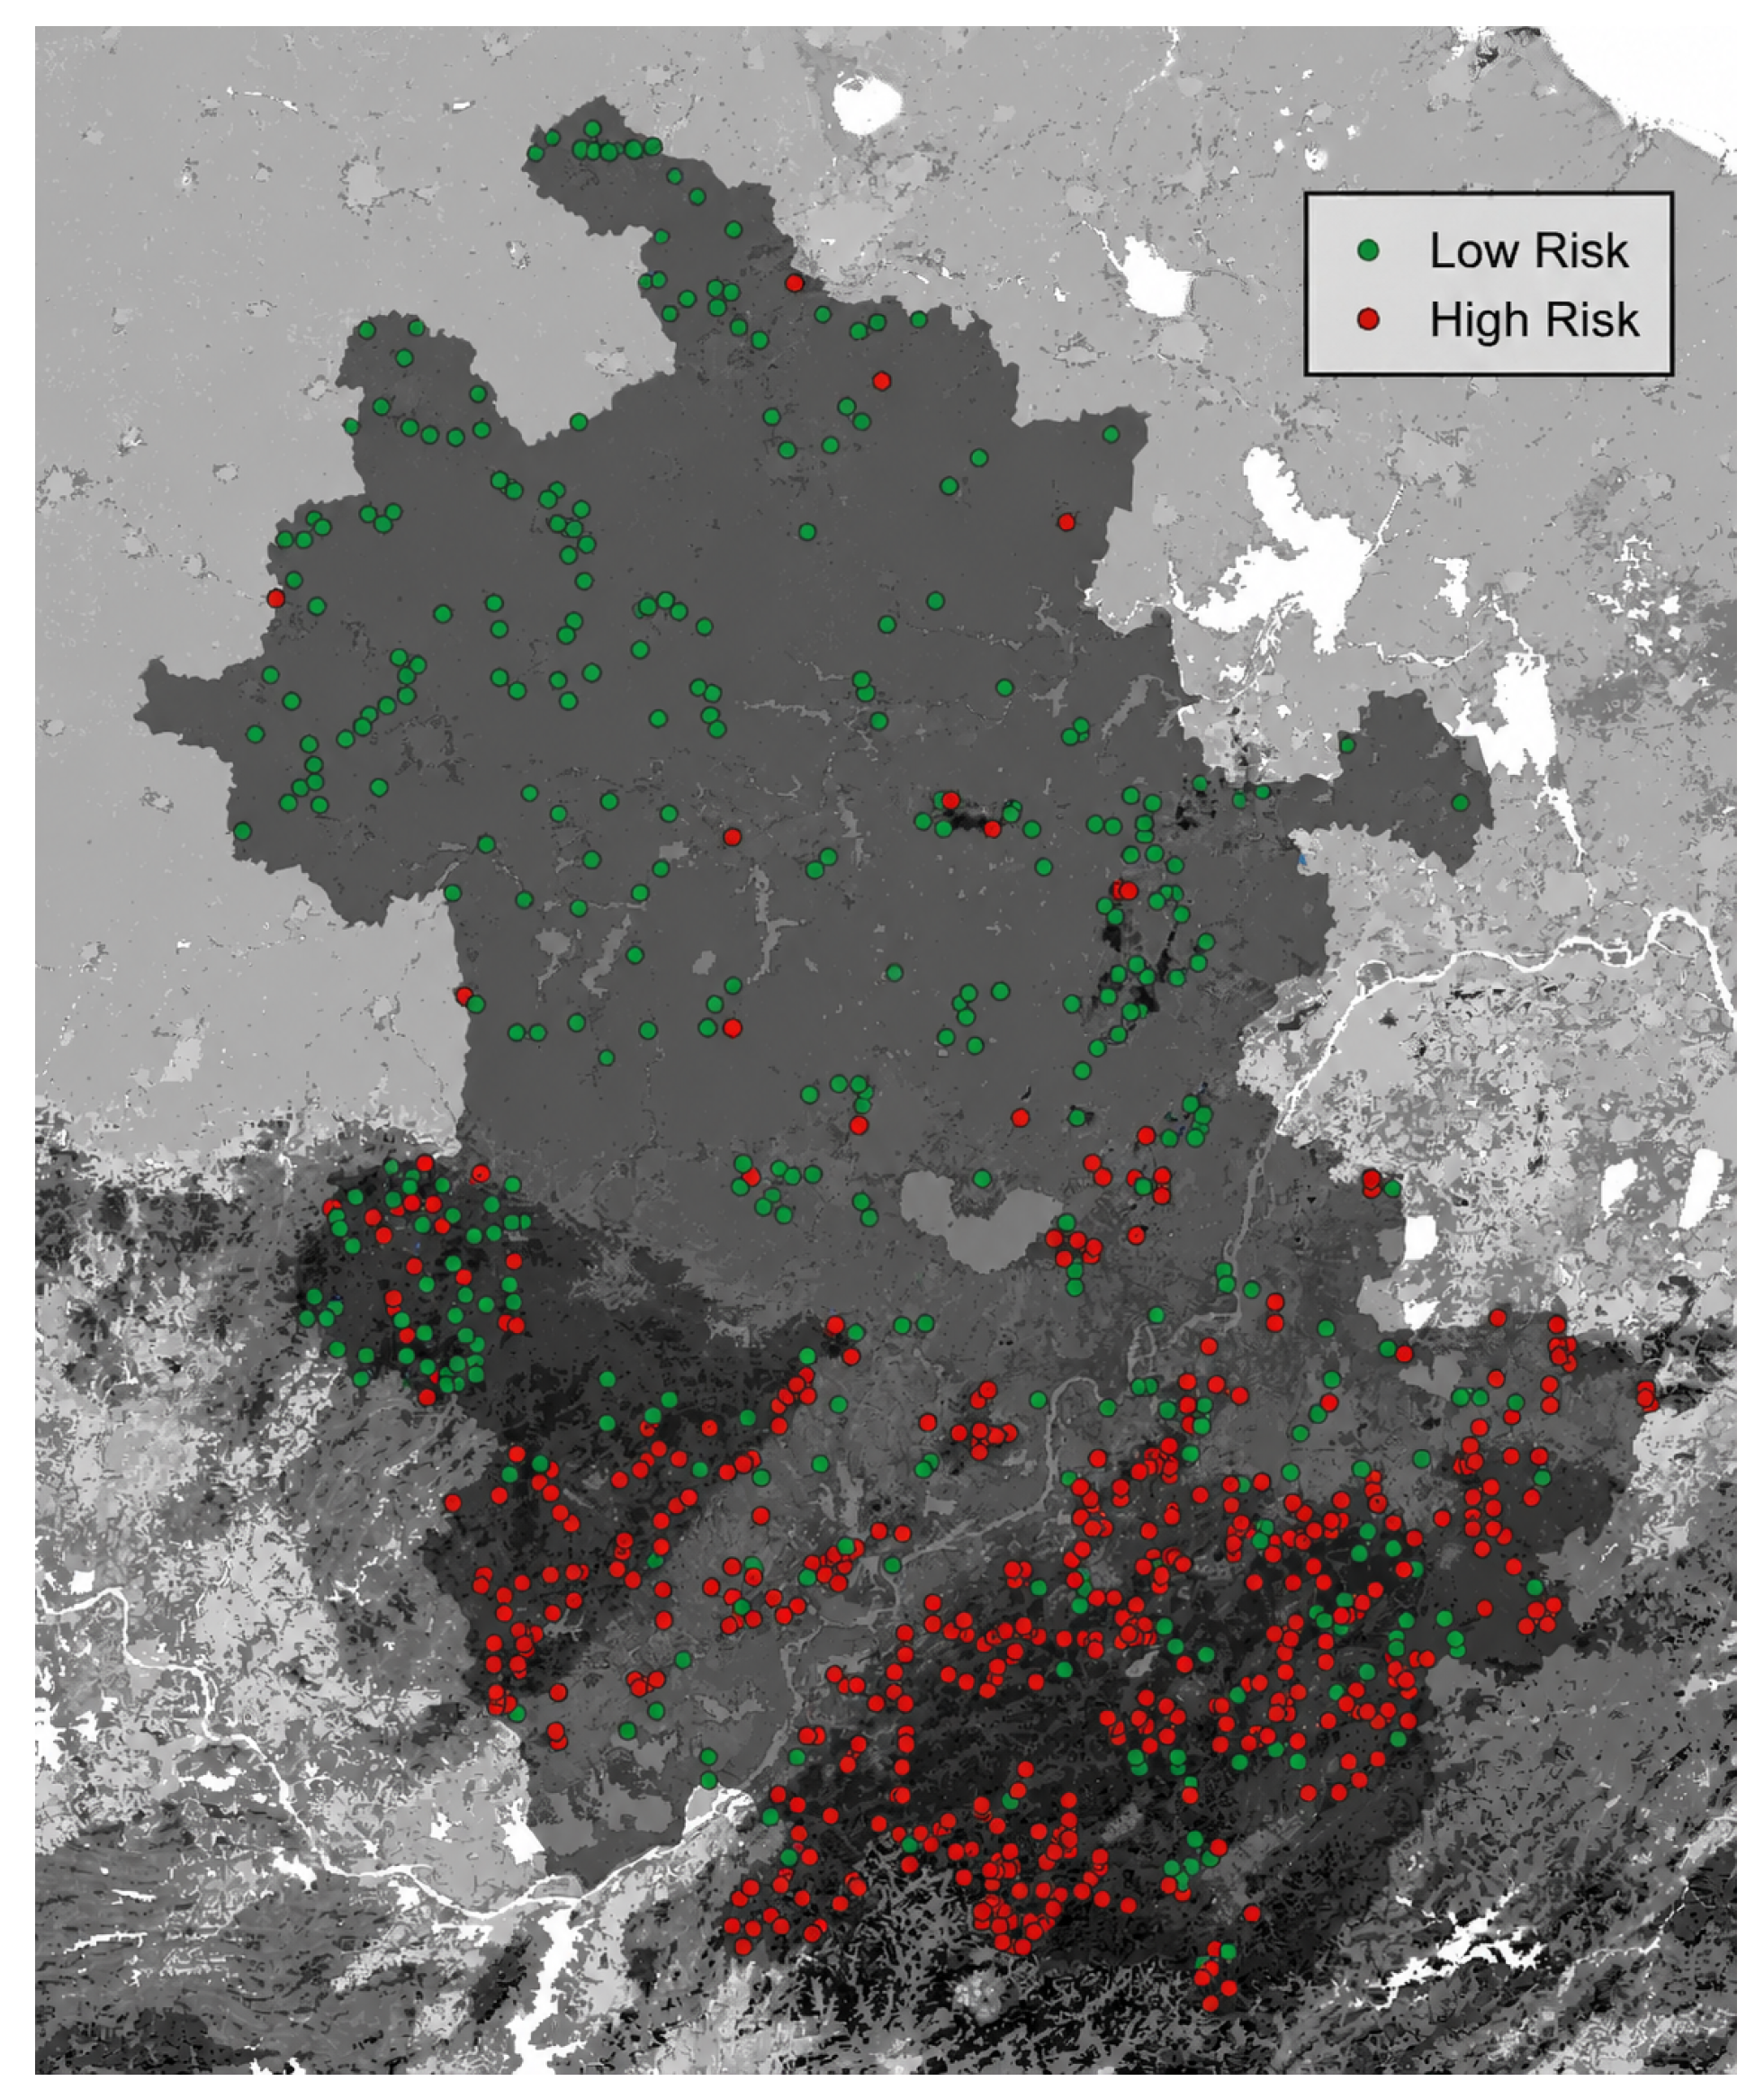
To translate the predictions of the optimized RF model into a geospatial context, the calculated fire ignition probabilities were projected directly onto the geographical coordinates of the 816 curated sampling plots (Figure 7). The resulting spatial distribution indicates a pronounced latitudinal risk gradient across Anhui Province, characterized by three eco-geographic regimes:
- Southern Montane Risk Clusters (Wannan and Dabie Mountains): Many high-risk plots (red markers) are concentrated in the southern and southwestern highlands. This spatial aggregation appears to be associated with a topographic-fuel nexus. As indicated in the functional group analysis, coniferous and bamboo forests in these areas may provide relatively continuous fuel, while rugged, high-relief terrain can promote upward fire spread and localized thermal accumulation on sun-exposed slopes.
- Northern Agrarian Buffer Plains (Huaibei Plain): In contrast, most sampling sites in the expansive northern flatlands are classified as low-risk background zones (green markers). Although the region experiences elevated summer surface temperatures, intensive agricultural practices may disrupt the spatial continuity of wildland fuels. This landscape-level anthropogenic fragmentation may reduce the likelihood of sustained natural forest fire ignitions.
- Central Heterogeneous WUI Corridors (Jianghuai Hilly Region): The geographic center of the province features a fragmented mosaic of high-risk (red) and low-risk (green) points. This spatial heterogeneity is consistent with the complexity of the Wildland-Urban Interface (WUI). Within this undulating transitional zone, isolated patches of secondary forests frequently intersect with rural settlements and agricultural boundaries. Consequently, the predicted fire risk is localized and can shift across the selected threshold, likely shaped by patchy fuel availability, human-induced edge disturbances, and the presence of interspersed soft broadleaf species.
Superimposing the verified historical MODIS active fire coordinates onto this discrete spatial framework revealed a geographical alignment with the predicted red high-risk clusters. This empirical alignment supports the geographical consistency between the model predictions and historical fire records, suggesting that the RF model captured relevant biophysical and thermodynamic drivers of forest fire susceptibility.
Figure 7.
Fire risk level assessment of the sampling points.
7. Discussion
7.1. Advantages over AHP
Traditional wildfire susceptibility mapping often relies on expert systems (e.g., Analytic Hierarchy Process, AHP), which typically use linear and additive assumptions for complex ecological variables. For instance, AHP-style weighting may assign higher hazard scores to steeper slopes in a relatively monotonic manner. In contrast, the data-driven Random Forest framework employed in this study can capture non-linear relationships and interactions among biophysical variables. The optimized RF model indicated that static topographical configurations and Stand Density act as baseline constraints by regulating localized micro-climates and providing combustible fuel continuity. However, topography alone does not determine ignition. The model results suggest that these structural templates are more likely to be classified as “High-Risk” when coupled with physiological moisture deficits. By evaluating these variables jointly rather than as isolated factors, the ML approach may reduce overestimation of risk in steep but barren or humid terrains. These results support the interpretation that wildfire susceptibility in the study area is a multi-dimensional threshold-like phenomenon, while direct performance comparisons with AHP-based models would be needed to quantify relative improvement.
7.2. The Ecological Validity of Advanced Preprocessing
The application of a continuous-variable curation pipeline contributed to the model’s ecological interpretability. Specifically, 1–99% Winsorization helped stabilize the raw distribution of satellite indices. Without this statistical mitigation, a few extreme sensor anomalies could have strongly influenced feature scaling and compressed the variance of the pre-fire baseline, potentially obscuring “warming and desiccation” predictive signals that may precede ignitions. Similarly, the Non-Linear Gamma Curvature Normalization for parameters such as vegetation indices allowed the RF model to represent these variables in a more ecologically meaningful way. By transforming NDVI into a non-linear proxy for “fuel availability and moisture status,” the algorithm captured a threshold-like pattern in fire ecology. It distinguished lower-risk “too sparse to burn” (barren land) and “too wet to burn” (dense, healthy canopy) states from higher-risk “dense, contiguous, and dry” conditions.
7.3. Escaping the Overfitting and Interpolation Traps
First, benchmark testing indicated that the Random Forest (RF) architecture reduced the risk of overfitting in this dataset. While algorithms such as SVM achieved a marginally higher cross-validation AUC (), its performance on the independent test set was slightly lower (). In comparison, the optimized RF maintained a Test AUC of with a small difference from its CV AUC (). By leveraging its bagging mechanism and randomized feature sub-setting, RF may reduce localized geospatial noise and lower the likelihood of memorizing local spatial coordinates.
Second, by replacing arbitrary random background sampling with a geostatistical spatial exclusion protocol and semantic land-cover masking, this study reduced agricultural false alarms and the potential “Ecological Fallacy” induced by spatial proximity bias [31].
Finally, we used Youden’s J statistic to define a data-driven threshold (). Projecting these probabilities onto discrete point-based coordinates preserved the point-level structure of the sampling data and avoided additional smoothing introduced by spatial interpolation. This point-based representation provides a calibrated decision-support reference for wildland fire management, although further validation would be needed before operational deployment.
7.4. Limitations and Generalizability
While the proposed geospatial framework demonstrates promising predictive capability, several limitations warrant acknowledgment. Currently, the model relies on static topographic baselines and near-real-time physiological proxies to map inherent susceptibility. It does not integrate instantaneous meteorological dynamics (e.g., real-time wind velocity and direction), which govern post-ignition dynamic spread trajectories. Furthermore, the threshold derived via Youden’s J statistic and the specific spatial parameters are calibrated to the transitional climate and fragmented topography of Anhui Province.
Nevertheless, the overarching methodological pipeline—specifically the combination of semantic land-cover masking, the geostatistical spatial exclusion protocol, and data-driven risk calibration—may be transferable to other regions after appropriate recalibration. By retraining the algorithm with localized field sampling and regional spatial variograms, this data-curation framework could support forest fire risk profiling in other macro-ecological domains, subject to independent validation.
8. Conclusions
This research establishes a data-driven and ecologically interpretable framework for forest fire susceptibility mapping in Anhui Province.
Key Findings:
- Spatial and Statistical Curation: The integration of 1–99% Winsorization and Non-Linear Gamma Curvature Normalization stabilized the variance structure of environmental data. The implementation of semantic land-cover masking combined with a geostatistically informed > 5 km spatial exclusion protocol substantially reduced anthropogenic label noise and spatial autocorrelation. This was quantitatively supported by Global Moran’s I diagnostics: the spatial autocorrelation of the initial dataset was significant (Moran’s ), whereas the application of the exclusion protocol reduced Moran’s I to a non-significant level (Moran’s ). This yielded a naturally balanced baseline dataset and improved the spatial independence of the subsequent machine learning implementation.
- Generalization Over Memorization: Benchmark testing indicated that the Random Forest algorithm provided relatively strong out-of-sample predictive performance (, CI: ). By reducing localized geospatial noise via its bagging mechanism, the RF model showed a limited CV–test performance gap, suggesting reduced spatial overfitting compared with several evaluated alternatives.
- Non-Linear Biophysical Synergies: Feature importance analysis revealed non-linear interactions among predictors. Static topographic configurations and forest Stand Density acted as important baseline constraints by influencing fuel continuity and micro-climates. These structural templates were associated with higher predicted risk when coupled with physiological moisture deficits, captured by parameters such as RVI and Land Surface Temperature (LST).
- Ecological Consistency: Without explicit botanical inputs, the algorithm produced species-level predictions that were broadly consistent with known flammability differences among forest functional groups. Coniferous forests showed the highest predicted high-risk proportion (), which may be related to volatile resins and continuous fuel structures, whereas Soft Broadleaf stands showed a much lower predicted high-risk proportion ().
- Data-Driven Spatial Delineation: This study used Youden’s J statistic to derive a data-driven risk threshold (). The resulting binary risk classification delineated a “South-High, North-Low” geographical pattern while preserving the point-level structure of the sampling data.
Future Outlook:
This optimized framework extends conventional static risk mapping by combining dynamic moisture proxies with permanent topographical and fuel-related data. It may offer forestry authorities a scalable decision-support tool after further validation. The relatively low predicted susceptibility of soft broadleaf species provides preliminary quantitative support for considering these species in regional silvicultural interventions. Proactively interplanting fire-resistant broadleaves within contiguous coniferous matrices to establish ’Green Firebreaks’ may help reduce landscape-level fuel continuity and protect ecological resources.
Author Contributions
Conceptualization, J.Z. and H.Z.; methodology, J.Z.; software, J.Z.; validation, J.Z., H.Z. and B.Z.; formal analysis, J.Z.; investigation, J.Z.; resources, W.S.; data curation, Z.S.; writing—original draft preparation, J.Z. and H.Z.; writing—review and editing, B.Z. and Y.G.; visualization, J.Z.; supervision, W.S.; project administration, W.S.; funding acquisition, J.Z., B.Z. and Z.S. All authors have read and agreed to the published version of the manuscript.
Funding
This work is supported by Technological Project of State Grid Anhui Electric Power Co., Ltd. (B31205240012).
Data Availability Statement
The data presented in this study are not publicly available due to ongoing research. Requests to access the datasets should be directed to the corresponding author.
Acknowledgments
During the preparation of this manuscript, the authors used Google Gemini 3.5 for the purposes of language polishing and generating LaTeX code. The authors have reviewed and edited the output and take full responsibility for the content of this publication.
Conflicts of Interest
Author Jiaqing Zhang, Binbin Zhang and Zhuo Song was employed by the company State Grid Anhui Electric Power Co., Ltd.
References
- Bowman, D.M.; Balch, J.K.; Artaxo, P.; Bond, W.J.; Carlson, J.M.; Cochrane, M.A.; d’Antonio, C.M.; DeFries, R.S.; Doyle, J.C.; Harrison, S.P.; et al. Fire in the Earth system. Science 2009, 324, 481–484. [Google Scholar] [CrossRef] [Scilit] [PubMed]
- Pyne, S.J.; Andrews, P.L.; Laven, R.D. Introduction to Wildland Fire; John Wiley & Sons: New York, NY, USA, 1996. [Google Scholar]
- Shi, C.; Zhang, F. A Forest Fire Susceptibility Modeling Approach Based on Integration Machine Learning Algorithm. Forests 2023, 14, 1506. [Google Scholar] [CrossRef] [Scilit]
- Pourghasemi, H.R.; Beheshtirad, M.; Pradhan, B. A comparative assessment of prediction capabilities of modified analytical hierarchy process (M-AHP) and Mamdani fuzzy logic models using Netcad-GIS for forest fire susceptibility mapping. Geomat. Nat. Hazards Risk 2016, 7, 861–885. [Google Scholar]
- Xie, Y.; Liu, S.; Chen, H.; Cao, S.; Zhang, H.; Feng, D.; Wan, Q.; Zhu, J.; Zhu, Q. Localization, Balance, and Affinity: A Stronger Multifaceted Collaborative Salient Object Detector in Remote Sensing Images. IEEE Trans. Geosci. Remote Sens. 2024, 63, 4700117. [Google Scholar] [CrossRef] [Scilit]
- Xie, Y.; Zhan, N.; Zhu, J.; Xu, B.; Chen, H.; Mao, W.; Luo, X.; Hu, Y. Landslide Extraction from Aerial Imagery Considering Context Association Characteristics. Int. J. Appl. Earth Obs. Geoinf. 2024, 131, 103950. [Google Scholar] [CrossRef] [Scilit]
- Song, W.; Cui, X.; Xie, Y.; Wang, G.; Ma, J. Monocular Depth Estimation via a Detail Semantic Collaborative Network for Indoor Scenes. Sci. Rep. 2025, 15, 10990. [Google Scholar] [CrossRef] [Scilit] [PubMed]
- Song, W.; Zhao, Y.; Tu, J.; Chen, M.; Xie, Y.; Cui, X. A Visual Attention-Guided Approach for Concrete Crack Detection in Complex Environments. Eng. Appl. Artif. Intell. 2026, 173, 114439. [Google Scholar] [CrossRef] [Scilit]
- Jain, P.; Coogan, S.C.; Subramanian, S.G.; Crowley, M.; Taylor, S.; Flannigan, M.D. A review of machine learning applications in wildfire science and management. Environ. Rev. 2020, 28, 478–505. [Google Scholar] [CrossRef] [Scilit]
- Li, Y.; Li, G.; Wang, K.; Wang, Z.; Chen, Y. Forest Fire Risk Prediction Based on Stacking Ensemble Learning for Yunnan Province of China. Fire 2024, 7, 13. [Google Scholar]
- Tukey, J.W. The future of data analysis. Ann. Math. Stat. 1962, 33, 1–67. [Google Scholar] [CrossRef] [Scilit]
- Bui, D.T.; Bui, Q.T.; Nguyen, Q.P.; Pradhan, B.; Nampak, H.; Trinh, P.T. A hybrid artificial intelligence approach using GIS-based neural-fuzzy inference system and particle swarm optimization for forest fire susceptibility modeling at a tropical area. Agric. For. Meteorol. 2017, 233, 32–44. [Google Scholar] [CrossRef] [Scilit]
- Barbet-Massin, M.; Jiguet, F.; Albert, C.H.; Thuiller, W. Selecting pseudo-absences for species distribution models: How, where and how many? Methods Ecol. Evol. 2012, 3, 327–338. [Google Scholar] [CrossRef] [Scilit]
- Chuvieco, E.; Cocero, D.; Riaño, D.; Martin, P.; Martínez-Vega, J.; de la Riva, J.; Pérez, F. Combining NDVI and surface temperature for the estimation of live fuel moisture content in forest fire danger rating. Remote Sens. Environ. 2004, 92, 322–331. [Google Scholar] [CrossRef] [Scilit]
- Pausas, J.G.; Paula, S. Fuel shapes the fire-climate relationship: Evidence from Mediterranean ecosystems. Glob. Ecol. Biogeogr. 2012, 21, 1074–1082. [Google Scholar] [CrossRef] [Scilit]
- Justice, C.O.; Giglio, L.; Korontzi, S.; Owens, J.; Morisette, J.T.; Roy, D.; Descloitres, J.; Alleaume, S.; Petitcolin, F.; Kaufman, Y. The MODIS fire products. Remote Sens. Environ. 2002, 83, 244–262. [Google Scholar] [CrossRef] [Scilit]
- Li, Z.; Zou, B.; Xia, H.; Ren, H.; Mo, J.; Weng, H. Litterfall Dynamics of an Evergreen Broadleaf Forest and a Pine Forest in the Subtropical Region of China. For. Sci. 2005, 51, 608–615. [Google Scholar] [CrossRef] [Scilit]
- Cui, X.; Alam, M.A.; Perry, G.L.W.; Paterson, A.M.; Wyse, S.V.; Curran, T.J. Green firebreaks as a management tool for wildfires: Lessons from China. J. Environ. Manag. 2019, 233, 329–336. [Google Scholar] [CrossRef] [Scilit]
- Guo, F.; Su, Z.; Wang, G.; Sun, L.; Lin, F.; Liu, A. Understanding fire drivers and relative impacts in different Chinese forest ecosystems. Sci. Total Environ. 2016, 542, 906–914. [Google Scholar]
- Trucchia, A.; Izquierdo-Verdiguier, E.; Fiorucci, P.; Tonini, M. Wildfire susceptibility mapping through machine learning: The impact of pseudo-absence selection and spatial autocorrelation. Fire 2022, 5, 136. [Google Scholar] [CrossRef] [Scilit]
- VanDerWal, J.; Shoo, L.P.; Graham, C.; Williams, S.E. Selecting pseudo-absence data for presence-only distribution modeling: How far should you stray from what you know? Ecol. Model. 2009, 220, 589–594. [Google Scholar] [CrossRef] [Scilit]
- Brenning, A. Spatial cross-validation and bootstrap for the assessment of prediction rules in remote sensing: The R package sperrorest. In Proceedings of the 2012 IEEE International Geoscience and Remote Sensing Symposium, Munich, Germany, 22–27 July 2012; pp. 5372–5375. [Google Scholar]
- Youden, W.J. Index for rating diagnostic tests. Cancer 1950, 3, 32–35. [Google Scholar] [CrossRef] [Scilit] [PubMed]
- Rothermel, R.C. A mathematical model for predicting fire spread in wildland fuels. In USDA Forest Service Research Paper INT-115; USDA Forest Service: Washington, DC, USA, 1972. [Google Scholar]
- Agee, J.K.; Skinner, C.N. Basic principles of forest fuel reduction treatments. For. Ecol. Manag. 2005, 211, 83–96. [Google Scholar] [CrossRef] [Scilit]
- Mutanga, O.; Skidmore, A.K. Narrow band vegetation indices overcome the saturation problem in biomass estimation. Int. J. Remote Sens. 2004, 25, 3999–4014. [Google Scholar] [CrossRef] [Scilit]
- Falk, D.A.; Miller, C.; McKenzie, D.; Black, A.E. Cross-scale analysis of fire regimes. Ecosystems 2007, 10, 809–823. [Google Scholar] [CrossRef] [Scilit]
- Meyer, H.; Reudenbach, C.; Hengl, T.; Katurji, M.; Nauss, T. Improving performance of spatio-temporal machine learning models using forward feature selection and target-oriented validation. Environ. Model. Softw. 2018, 101, 1–9. [Google Scholar] [CrossRef] [Scilit]
- Pausas, J.G.; Keeley, J.E.; Schwilk, D.W. Flammability as an ecological and evolutionary driver. J. Ecol. 2017, 105, 289–297. [Google Scholar]
- Wang, G.; Li, M.; Wang, Y.; Chen, H. Differences in leaf flammability of common tree species in subtropical China. Forests 2021, 12, 1475. [Google Scholar]
- Gotway, C.A.; Young, L.J. Combining incompatible spatial data. J. Am. Stat. Assoc. 2002, 97, 632–648. [Google Scholar] [CrossRef] [Scilit]

Disclaimer/Publisher’s Note: The statements, opinions and data contained in all publications are solely those of the individual author(s) and contributor(s) and not of MDPI and/or the editor(s). MDPI and/or the editor(s) disclaim responsibility for any injury to people or property resulting from any ideas, methods, instructions or products referred to in the content. |
© 2026 by the authors. Licensee MDPI, Basel, Switzerland. This article is an open access article distributed under the terms and conditions of the Creative Commons Attribution (CC BY) license.