1. Introduction
Forest fires are one of the increasingly severe natural disasters occurring worldwide. Driven by climate warming, land use changes, and human activities, the risk landscape is being rapidly reshaped. Compared to fires caused by natural sources, such as lightning strikes, human-caused fires have long dominated in many areas. In the 1.5 million recorded fires in the United States from 1992 to 2012, human-caused fires accounted for 84% [
1]; approximately 96.5% of the burned area in Europe was caused by human factors [
2]; in Guangxi, China, the proportion of human-caused fires from 2016 to 2021 was as high as 96.15% [
3]. The 3028 national forest fire cases (2016–2025) captured through web scraping show that human factors accounted for 84.3%, with offerings for worship (30.1%), production-related fires (22.7%), and smoking in the wild (14.7%) ranking among the top three causes. Human factors comprise the main cause of forest fires in Beijing, but a quantitative evaluation system for human-caused fire sources has been lacking for some. Forest fires in Beijing in recent years have also been mostly caused by human factors, such as the illegal acquisition of lithium batteries that caused a fire in Miyun in 2023 and burning paper on an altar which caused a fire in Yanqing. Therefore, conducting a risk assessment of forest fires caused by human factors is of great significance for improving fire warning and precise prevention capabilities.
Currently, forest fire risk warnings at home and abroad result mainly from natural factors such as weather and the presence of combustible materials, and the quantitative evaluation of human-caused fire sources is relatively weak [
4]. This study aims to establish a risk assessment system for human-caused fire sources in typical forest areas in Beijing, filling the gap in this field and providing technical support for the management of human-caused fire risks. The study selects the three districts of Mentougou, Changping, and Yanqing as typical forest areas, using multi-source data fusion and social surveys to systematically analyze the temporal and spatial patterns of major human-caused fire sources such as agricultural activities, worship, and tourism; establish a risk assessment model; and form a business application module.
2. Literature Review
Human-induced fire sources can be classified into three categories based on their nature and origin: productive fire sources, non-productive fire sources, and intentional arson [
5,
6]. Productive fire sources (such as burning for farming; charcoal production; and forest land reclamation for afforestation and agricultural activities) usually have obvious seasonal and spatial clustering characteristics, and these fires are more likely to occur during the peak seasons of agricultural activities [
7]. Non-productive fire sources (such as smoking outdoors, heating and cooking, and sacrificial fires) are closely related to human daily life and are greatly influenced by living habits and cultural traditions, with higher randomness [
8]. Intentional arson is related to criminal activities and has higher unpredictability [
9]. The differences in the temporal and spatial distribution of different fire source types reflect the coupling effect of human activity rhythms and land use patterns [
10,
11]. In southern and southwestern forest areas of China, accessibility and the density of residential areas have a higher explanatory power for forest fire distribution than do natural factors, while in the northeastern forest area, the weight of natural factors is higher. This suggests that different regions require differentiated fire source control strategies.
The occurrence of human-induced fires is the result of the interaction of natural and human factors. In terms of natural factors, temperature, precipitation, relative humidity, and wind speed affect fire risk by changing the moisture content of combustibles [
12,
13,
14]. Jolly et al. [
15] pointed out that since the end of the 20th century, the fire risk season in vegetation-covered areas has significantly extended globally, and high temperatures and drought have driven an increase in the dryness of combustibles. Flannigan et al. [
16] proposed that climate warming will significantly increase the fire risk probability in the northern boreal forest region. In terms of human factors, population density, road networks, settlement distribution, and land use changes have been widely confirmed as key drivers. Kolanek et al. [
17], in their research in Poland, showed that fire points often concentrate in the urban periphery and areas with high human activity, forming an “intentional fire source dense zone”. Ricotta et al. [
18], in their research in the Mediterranean region, showed that the grid closer to the road has a higher ignition probability, and road density is positively correlated with ignition. Jaafari et al. [
19] found that, in the Zagros region of Iran, road density is strongly correlated with fire point distribution; especially in arid areas, combustibles near roads are more likely to catch fire due to human ignition. Guo et al. [
20], using Ripley’s K and logistic regression models, revealed the spatial non-stationarity impact of road and settlement distance on fire occurrence in the northeastern coniferous forest belt of China. In addition, power facility failures can trigger high fire risk events under specific wind conditions, demonstrating the shaping effect of infrastructure on the fire risk pattern. On a larger scale, agricultural expansion and landscape fragmentation have contributed to the global reduction in burned area, showing that human activities not only increase the ignition probability but also reduce the potential for fire expansion through fuel conversion.
Human-induced fires show significant spatial clustering, mostly concentrated near roads, settlements, and agropastoral transition zones. Jia et al. [
21] found that, in the Inner Mongolia grassland, approximately 80% of fire points were distributed within 5 km of roads and settlements. Xu et al. [
22], in their research on the Qinghai grassland, also confirmed that fire high-risk points were concentrated within 1 km of roads and settlements. In terms of time, the occurrence of human-induced fires shows distinct seasonal and diurnal patterns. Most areas show a bimodal distribution, with high fire occurrence periods in spring and late autumn. Sjöström et al. [
23], in their research on the Nordic region, showed that human activities and population structure are the key factors driving changes in fire risk in the coniferous forest belt. The research of Teymoor et al. [
24] further indicated that although global burned area is declining, the risk of fire due to the land’s exposure to humans is continuously increasing, highlighting the necessity of precise prevention. At the global scale, Bistinas et al. [
25] revealed the nonlinear relationship between population density and burned area, suggesting a threshold effect of human increase and fire reduction. Early studies mostly employed statistical models such as logistic regression and geographically weighted regression for fire risk prediction. In recent years, machine learning methods have been widely applied due to their advantages in handling non-linear and high-dimensional interactions. Rodrigues et al. [
26] systematically compared methods such as random forests, gradient boosting, support vector machines, and logistic regression, laying the technical foundation for using machine learning to depict the “human–fire” relationship. Pang et al. [
27] constructed a random forest model integrating human activities and environmental data in northern China, improving the spatial prediction accuracy. Mambile et al. [
28] developed a forest fire prediction model based on deep learning by combining satellite images, meteorological data, and human activity data, significantly enhancing the ability to identify high-risk areas. Jain et al. [
29] systematically reviewed the application of machine learning in wildfire science, pointing out that multi-source data fusion and model interpretability are key directions for future research.
In summary, existing forest fire danger studies mainly focus on meteorological conditions, vegetation characteristics, fuel moisture, and topographic factors. Although some studies introduce human activity indicators such as population density, road proximity, or land-use intensity, refined quantitative representation of specific human-caused fire behaviors remains relatively limited. In addition, temporal behavioral fluctuations associated with festivals, agricultural activities, and tourism are often insufficiently represented in existing operational fire-risk assessment frameworks. However, there are some shortcomings of these studies: (a) they mostly focus on a single type of fire source or natural factors, lacking systematic quantification of various human-caused fire sources such as farming, worship, and tourism; (b) research in the complex areas where forests, agriculture, and cities intersect around megacities is still lacking; (c) evaluation indicators are mostly static and experience difficulty meeting the requirements for dynamic early warning. This study integrates large-scale social survey data with multi-source geographic and meteorological data to construct an artificial fire risk evaluation model for typical forest areas in Beijing, comprehensively depicting the risk of human-caused fire sources from four dimensions: exposure, triggering factors, vulnerability, and prevention capabilities, filling the technical gap via a refined evaluation of human-caused fire risks.
3. Research Method: Construction of Risk Assessment Model
3.1. Overall Framework Design of the Model
This study draws on the internationally recognized mainstream framework for disaster risk assessment and constructs an evaluation model for human-induced forest fires from four dimensions: exposure, triggering factors, vulnerability, and prevention and control capabilities [
30]. The core formula is
where
represents the accessibility index (exposure level),
represents the fire source risk index (catastrophic factor),
represents the fire occurrence condition index (vulnerability),
represents the prevention and control capability index (response capability), and
represents the type of fire source (agricultural, religious, tourism, power distribution lines).
is taken for robustness processing to avoid data collapse. The historical risk values of Beijing forest land are truncated and normalized using the “0.01th percentile–0.99th percentile” range to eliminate the interference of extreme values and ensure that the output
interval can reflect the true risk gradient of Beijing forest land. In the study, the term “evaluation” specifically refers to the spatial comparison and time trend analysis of the relative levels of human-caused fire risks. The model output value
is a dimensionless relative index. Its physical meaning is the comparison of the risk levels between different spatial positions at the same time point, as well as the trend of risk changes at different times at a fixed location. This index does not represent the absolute probability of a fire occurrence, nor does it directly predict the exact possibility of a fire in a specific grid on a specific date. The multiplicative structure was adopted to reflect the nonlinear coupling relationship among exposure, hazard factors, vulnerability, and prevention capability. High fire risk generally occurs only when several dimensions simultaneously reach high levels. Therefore, compared with a simple additive structure, the multiplicative form can better characterize the amplification effect among human-caused fire risk factors.
3.2. Establishment of Index System
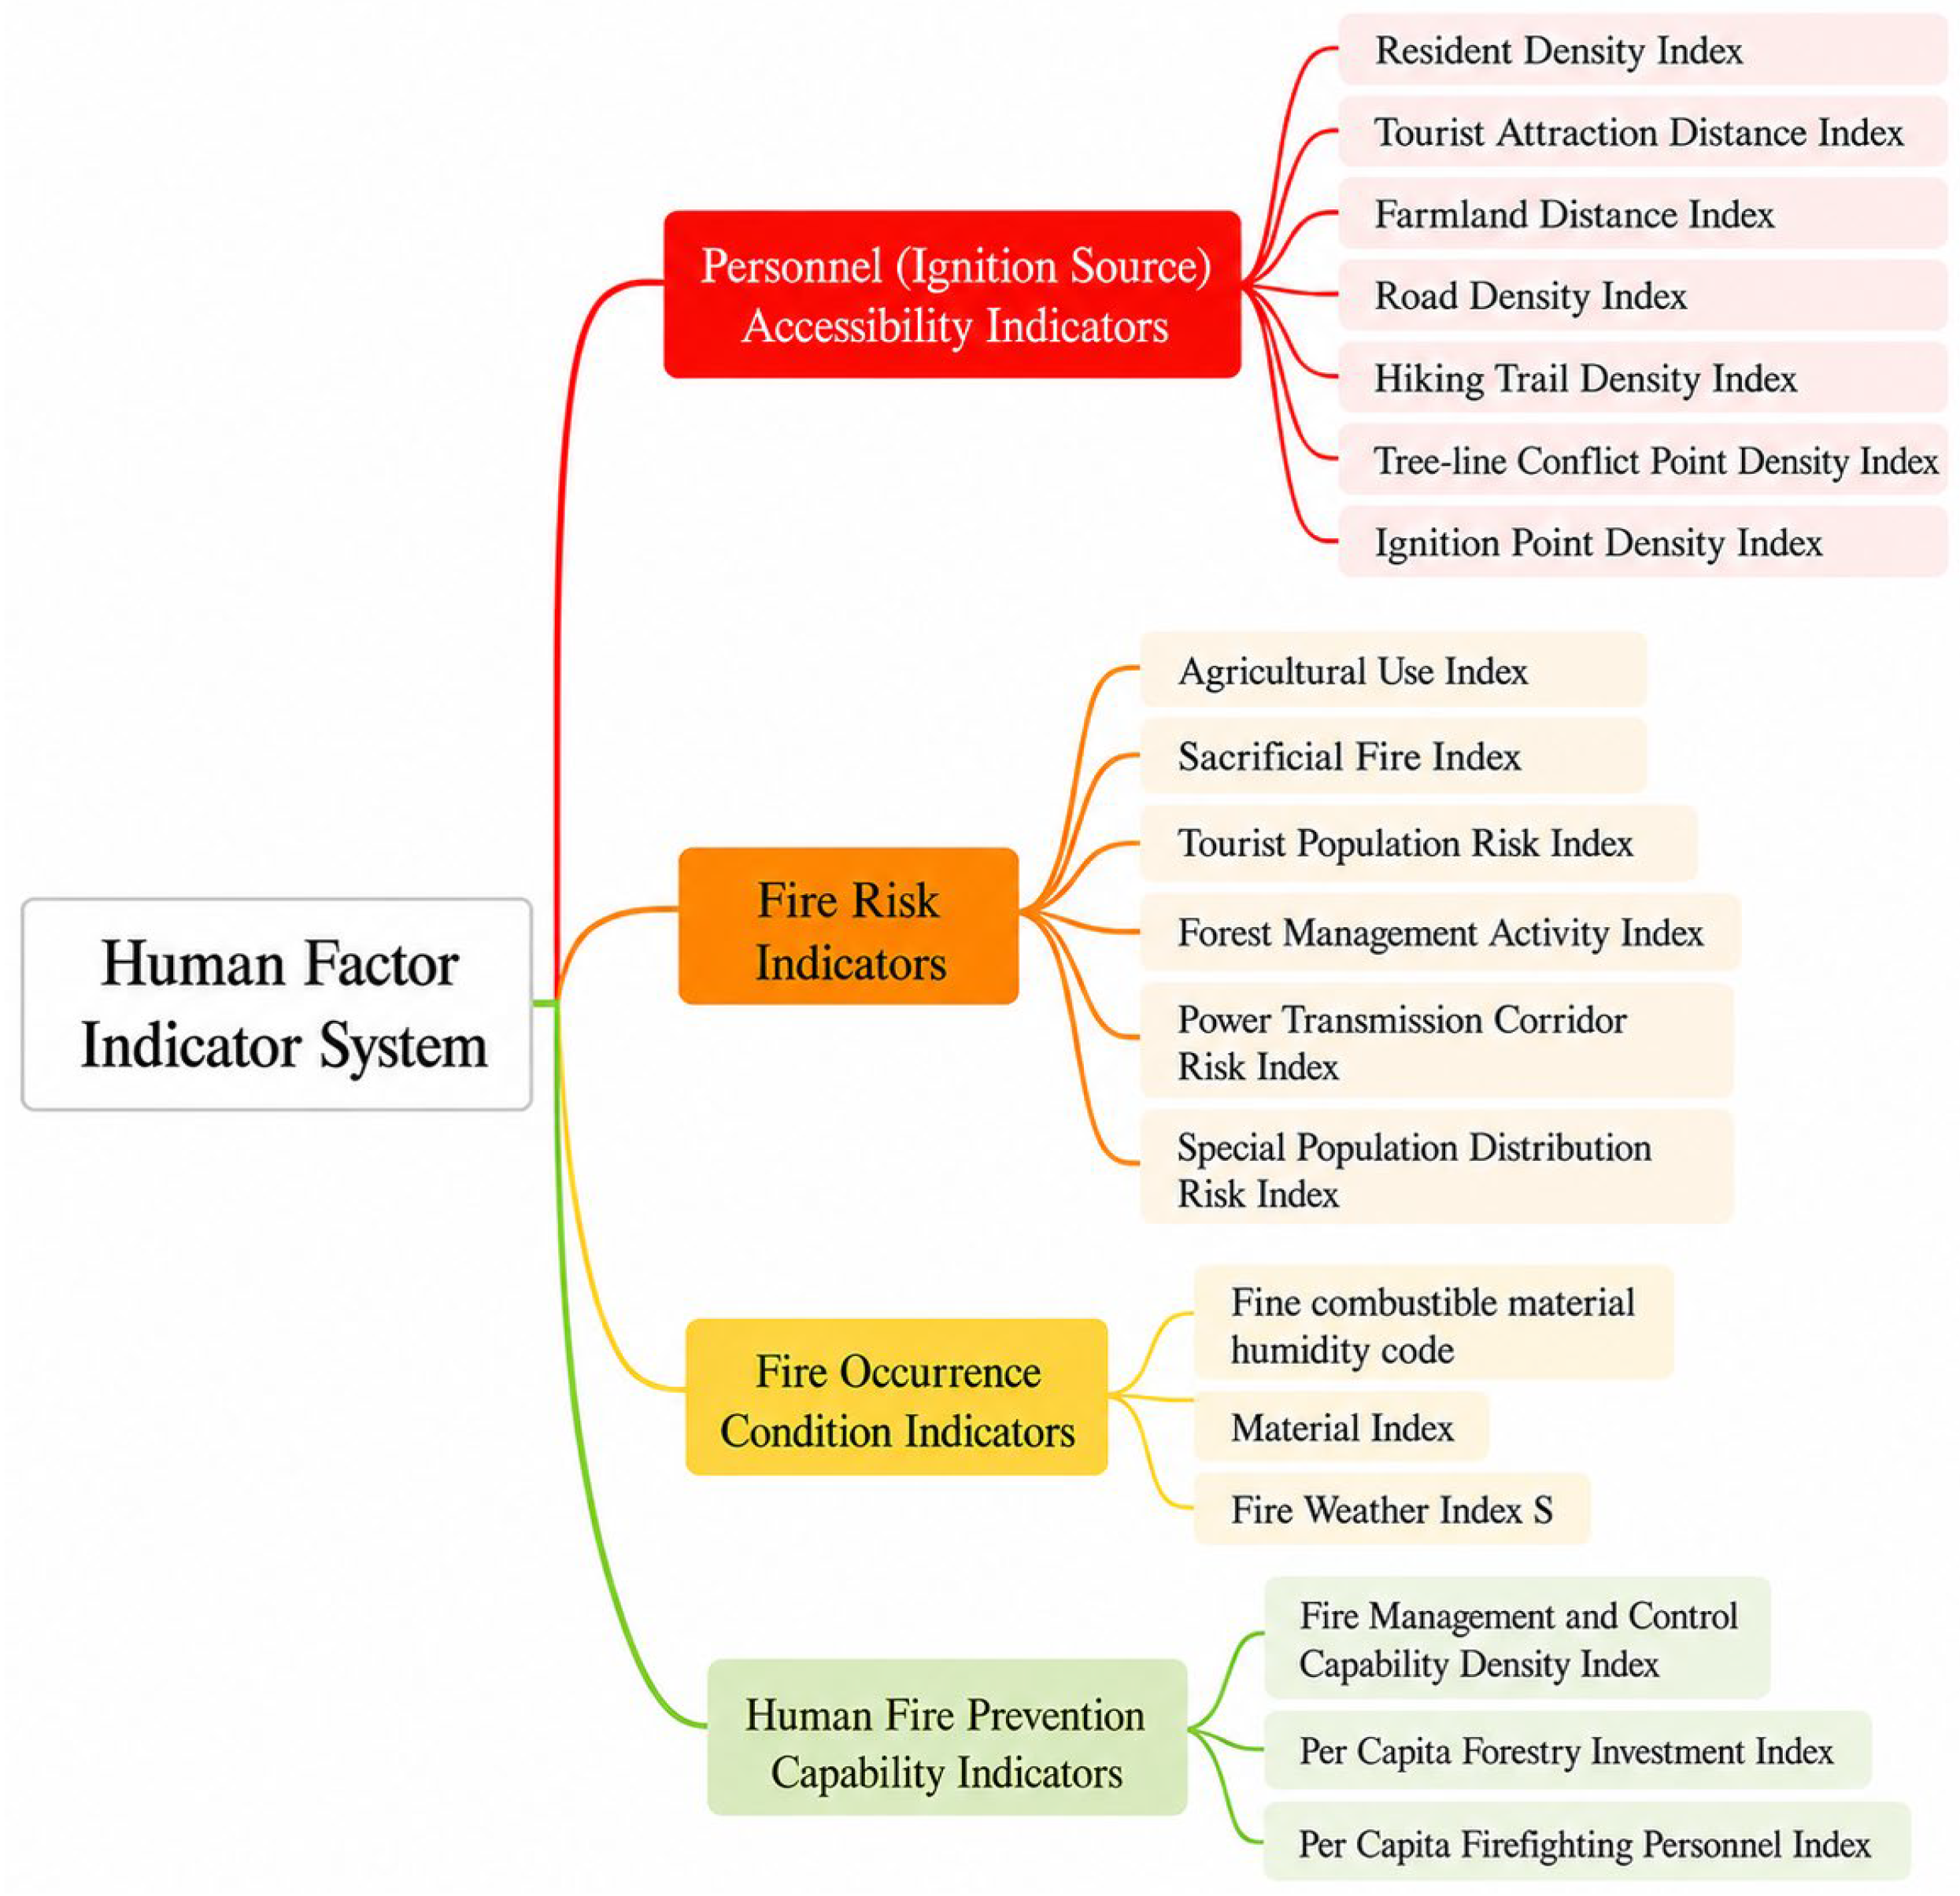
Based on the four-dimensional framework, an evaluation system consisting of four primary indicators and 19 secondary indicators has been constructed, as shown in
Figure 1 below.
The personnel accessibility risk index reflects the spatial relationship between forest land and areas where human-caused fire sources are found, with closer proximity resulting in higher risk. It includes seven secondary indicators: the residential point distance index is based on land use data and calculates the distance from each grid point to the nearest residential point using the Euclidean distance; the scenic area distance index is based on the records of forest-related scenic areas (86 in total) and calculates the distance from each grid point to the nearest scenic area, with the core influence range set at 3000 m; the farmland distance index is based on a satellite remote sensing interpretation of farmland TIFF data and calculates the shortest distance from each grid point to the nearest farmland, with agricultural activities concentrated within 500 m around farmland; the road distance index is based on Beijing’s vector data of highways (national highways, provincial highways, county highways) and calculates the distance from each grid point to the centerline of the nearest road, with 1000 m within the road being a high-risk zone; the hiking path distance index is based on 3498 hiking trajectories captured by the network and calculates the distance from each grid point to the nearest hiking path, with an influence range of 1000 m; the tree line conflict point density index is based on the tree line conflict ledger reported by townships in 2024, with an average density of 0.032 per km2 across the city; the scattered tomb density index is based on the data from the first forest. The above indicators are subjected to forward standardization and robustness processing.
The fire source risk quantity reflects the intensity, frequency, and probability of various human-caused fire sources. It includes six secondary indicators. The agricultural fire use index is based on the risk census data, using the proportion of regional agricultural fire violations as the basis, combined with seasonal weighting coefficients (the peak period is from March to April for spring farming and from September to October for autumn harvest, ), and calculates the original risk value. The sacrificial fire use index is based on the proportion of regional sacrificial fire violations, combined with festival weighting coefficients (the period of Qingming Festival ±3 days and the Spring Festival ±7 days, ). The tourism fire use index is based on the mobile signal personnel density product, with the deviation value of the personnel density in the scenic area as the core, combined with holiday weighting coefficients (weekends/holidays ). The forest area construction fire use index is based on the 2024 forest construction ledger, with the proportion of regional construction fire violations as the core, combined with the peak construction weighting coefficient . The crossing forest area power distribution line fault risk index is based on the power failure ledger, with the proportion of regional failure occurrences as the core, combined with the strong wind weighting coefficient ( when the maximum wind speed is ≥8 m/s). The special personnel per thousand residents quantity index is based on a survey of the non/limited civil capacity population and calculates the quantity of special personnel per thousand residents. The above indicators are subjected to forward standardization and robustness processing.
The fire occurrence condition index reflects the flammability of forest land, that is, the coupling of combustible materials and meteorological conditions for combustion. It includes three secondary indicators. The humidity code F for fine combustibles is calculated according to Appendix A.1 of “DB11/T 2282—2024” [
31], derived from the surface combustible material humidity index of the previous day and temperature, relative humidity, precipitation, and wind speed. The phenological index “
” uses the Beijing NDVI climate baseline (2018–2023) to calculate the dryness of live fuel. The fire danger weather index
is calculated according to Appendix A.4 of “DB11/T 2282—2024”, driven by the initial spread index
R and cumulative index
U, modulated by the semi-decomposed layer humidity function.
The index of human-caused fire source prevention capability reflects the inhibitory effect of the fire source control forces on risks, including three secondary indicators: the fire source prevention checkpoint density index, “”, which calculates the number of checkpoints within a 1 km2 grid based on risk census data; the number of forest rangers per thousand hectares index, “”, which calculates the number of forest rangers per thousand hectares based on the number of rangers and the area of forest land; the number of fire-fighting teams per thousand hectares index, “”, which calculates the number of fire-fighting teams per thousand hectares based on the number of fire-fighting teams and the area of forest land. These indicators are subjected to reverse standardization and robustness processing.
3.3. Method of Indicator Quantification and Normalization
To ensure the clarity of the calculation process for all secondary indicators, this study adopts a process of original value calculation, quantile truncation, extreme value normalization, and robustness handling. This process is applicable to all 19 secondary indicators in the accessibility index, fire source risk index, fire occurrence condition index, and prevention and control capability index. The specific steps are as follows:
- (a)
Original value calculation. For the accessibility index, the original value is the Euclidean distance from the grid point to the target feature, measured in meters. For the fire source risk index, the original value is the regional violation rate multiplied by the seasonal or festival weighting coefficient. For the prevention and control capability index, the original value is the density per unit area.
- (b)
Quantile truncation. To avoid the influence of extreme values on the normalization results, the original values of each indicator are truncated from the 0.01 quantile to the 0.99 quantile. That is, values less than
are counted as
, and values greater than
are counted as
. The truncation intervals for each indicator are shown in
Table 1. The truncated values are denoted as
.
- (c)
Extreme value normalization. Depending on the risk direction of the indicator, different normalization formulas are used. For positive indicators (the larger the value, the higher the risk; the closer the distance, the higher the risk), different formulas are used, respectively.
The key parameters are set as shown in
Table 1. The distance cutoff for residential areas (10 m, 10,000 m), the distance cutoff for scenic areas (5 m, 3000 m), the distance cutoff for farmland (2 m, 500 m), and the density cutoff for checkpoints (0 per km
2, 5 per km
2) are specified.
- (d)
Robustness treatment. To avoid data collapse caused by zero values in subsequent multiplication and division operations, a small constant is introduced. The final indicator value is taken as , ensuring that all secondary indicator values fall within the range of . The small constant ε was introduced only for robustness processing and numerical stability. Its purpose is to avoid data collapse caused by zero values during multiplication and division operations, rather than to alter the relative ranking of risk levels. This constant is determined through sensitivity tests: a constant that is too small would result in discontinuous low-risk zone values for fragmented forest land in Beijing, while a constant that is too large would weaken the resolution ability of high-risk zones.
3.4. Construction of a Single-Class Fire Source Risk Model
For the four types of dominant fire sources, separate single-class risk models are constructed:
where
represents the type of fire source,
represents the accessibility,
represents the fire source risk,
represents the conditions for the occurrence of the fire, and
represents the power robustness coefficient, which is determined through model sensitivity testing. The
value for sacrificial fires is 1.1 to suppress the extreme peak on Qingming Day, and the rest are
= 1.0. The parameters of various fire sources are shown in
Table 2 below, including agricultural use fires, sacrificial use fires, tourism use fires, and power distribution line fires. The weighted coefficients of the four types of fire sources—agricultural, sacrificial, tourism and power distribution lines—are determined based on the proportion of illegal use of fire during the spring sowing and autumn harvest period, the frequency of illegal use during Qingming and Spring Festival, the ratio of mobile phone traffic flow density in scenic areas on weekends and holidays, and the failure rate ratio during strong wind (≥8 m/s) periods.
3.5. Synthesis of Comprehensive Risk Model
The risk of multiple fire source types is synthesized using a weighted additive method:
where
represents the comprehensive risk index of human-caused fires;
is the normalization function;
, respectively, represent the weights and risk indices of agricultural activities, sacrifices, tourism, and other human-caused fire sources. The weights are determined based on the proportion of historical fire and disaster data. The weights of this group are based on the statistics of the causes of 22 typical human-caused fires in Beijing from 2018 to 2025. Sacrificing activities accounted for 35%, agricultural activities and tourism each accounted for 25%, and power distribution lines accounted for 15%. The absolute values of the risks of the four types of fire sources may vary. For example, the average value of fire use for agriculture is 0.6; the average value of line faults is 0.3. After normalization, the magnitude differences can be eliminated, ensuring that the weights can truly reflect the contributions of each type of fire source. The weight explanation is shown in
Table 3 below.
The formula for synthesizing the index of fire occurrence conditions is as follows:
Here, represents the humidity index of fine combustible materials, represents the dryness of live fuel, and represents the fire danger weather index. The weight is the highest, as meteorological conditions are the most crucial factor for short-term fire danger in the Beijing forest area.
The synthesis formula for the prevention and control capability index is:
Here, represents the density index of checkpoints, represents the index of forest rangers per thousand hectares, and represents the index of fire-fighting teams per thousand hectares. The weight of the checkpoint density is the highest at 0.4, as checkpoints are the first line of defense for fire prevention.
3.6. Time Recursion and Spatial Interpolation Method
To achieve daily dynamic forecasting, an exponential smoothing method is employed to process the time series:
where
represents the smoothed comprehensive risk index of human-caused fire sources,
is the smoothing coefficient, and
represents the original risk weight at the current time. The adaptive
parameter was determined through time series cross-validation. After testing using data from 10 days before and after the Qingming Festival, the short-term trend tracking error was the smallest when
, and when it was 0.7 in non-festival months, the noise smoothing effect was the best.
To meet the application requirements of the model in fire risk forecasting operations, the forecast propagation is incorporated. The daily forecast formula is:
The input items include “known next-day information”. For example, if it is known that the next day will be a weekend, the can be calculated as in advance to ensure the accuracy of the forecast. The error should be ≤15%, and the value can be calibrated through daily backtracking to meet the business requirements.
The spatial interpolation uses the Gaussian kernel function, with an interpolation radius of h = 2 “km”. The interpolation radius is determined through spatial cross-validation. By comparing the interpolation results at 1, 2, 3, and 5 km with the independent fire point positions, 2 km results in the minimum average positioning error, while maintaining the continuity of fragmented forest land in Beijing. That is, the forest land in Beijing is fragmented. If “h” is too small, the interpolation results will be discontinuous (such as for small patches of forest land in Xishan of Haidian separated by roads). If it is too large, the details will be blurred (such as the difference between the nearby forest land and farther away villages in Changping). A total of 2 km is the optimal radius:
The risk classification is divided into five levels using the Jenks natural break method: RL1 is low [0, 0.2), RL2 is relatively low [0.2, 0.4), RL3 is medium [0.4, 0.6), RL4 is relatively high [0.6, 0.8), and RL5 is high [0.8, 1.0].
4. Data Collection and Processing
4.1. Meteorological, Geographical, and Ledger Data Collection
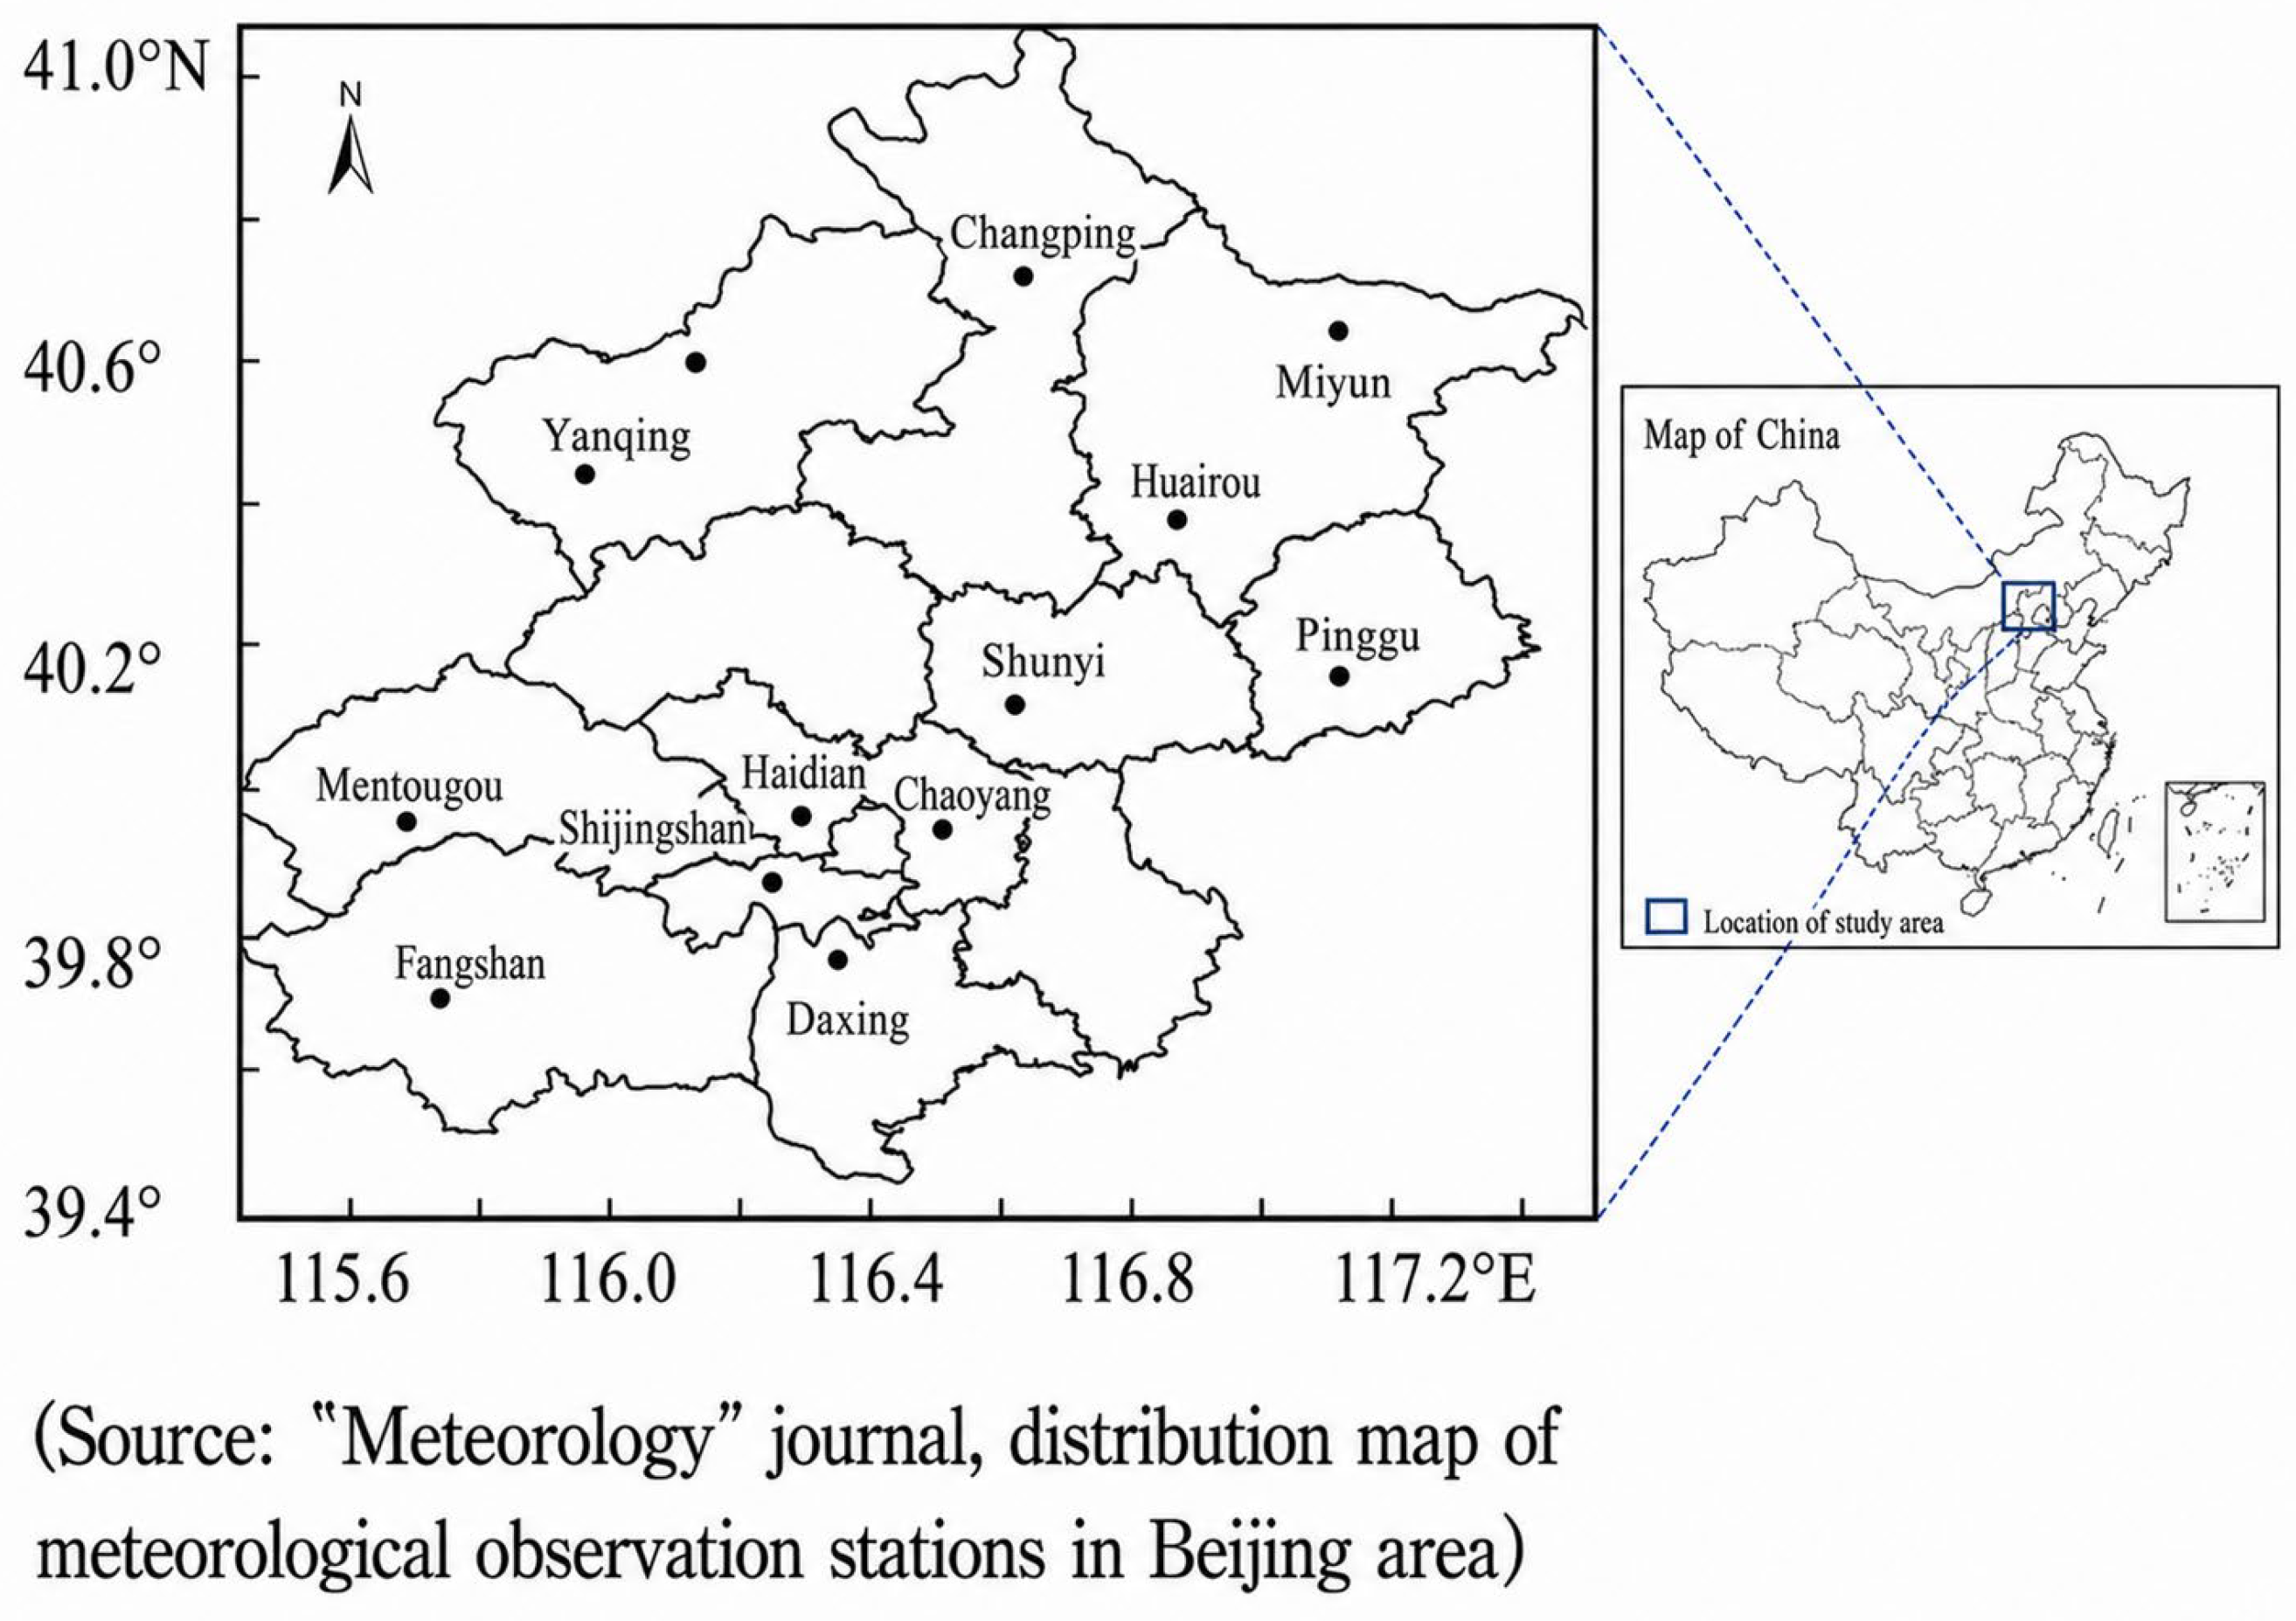
The meteorological data comprised collected historical meteorological information for the Beijing area from 1991 to 2024 at 20 national meteorological stations (including five mountainous stations and 15 plain stations). The elements include temperature, precipitation, humidity, and wind speed. The time resolution covers annual, monthly, daily, and hourly scales. Among them, temperature includes average temperature, maximum temperature, and minimum temperature; precipitation includes total precipitation and number of precipitation days; humidity includes average relative humidity and minimum relative humidity; wind speed includes average wind speed, maximum wind speed, and greatest wind speed.
Figure 2 shows the distribution of meteorological observation stations in the Beijing area, with an inset map added to indicate the location of the study area in mainland China. Notably, all maps adopted throughout this paper are provided by the Beijing Academy of Emergency Management Science and Technology.
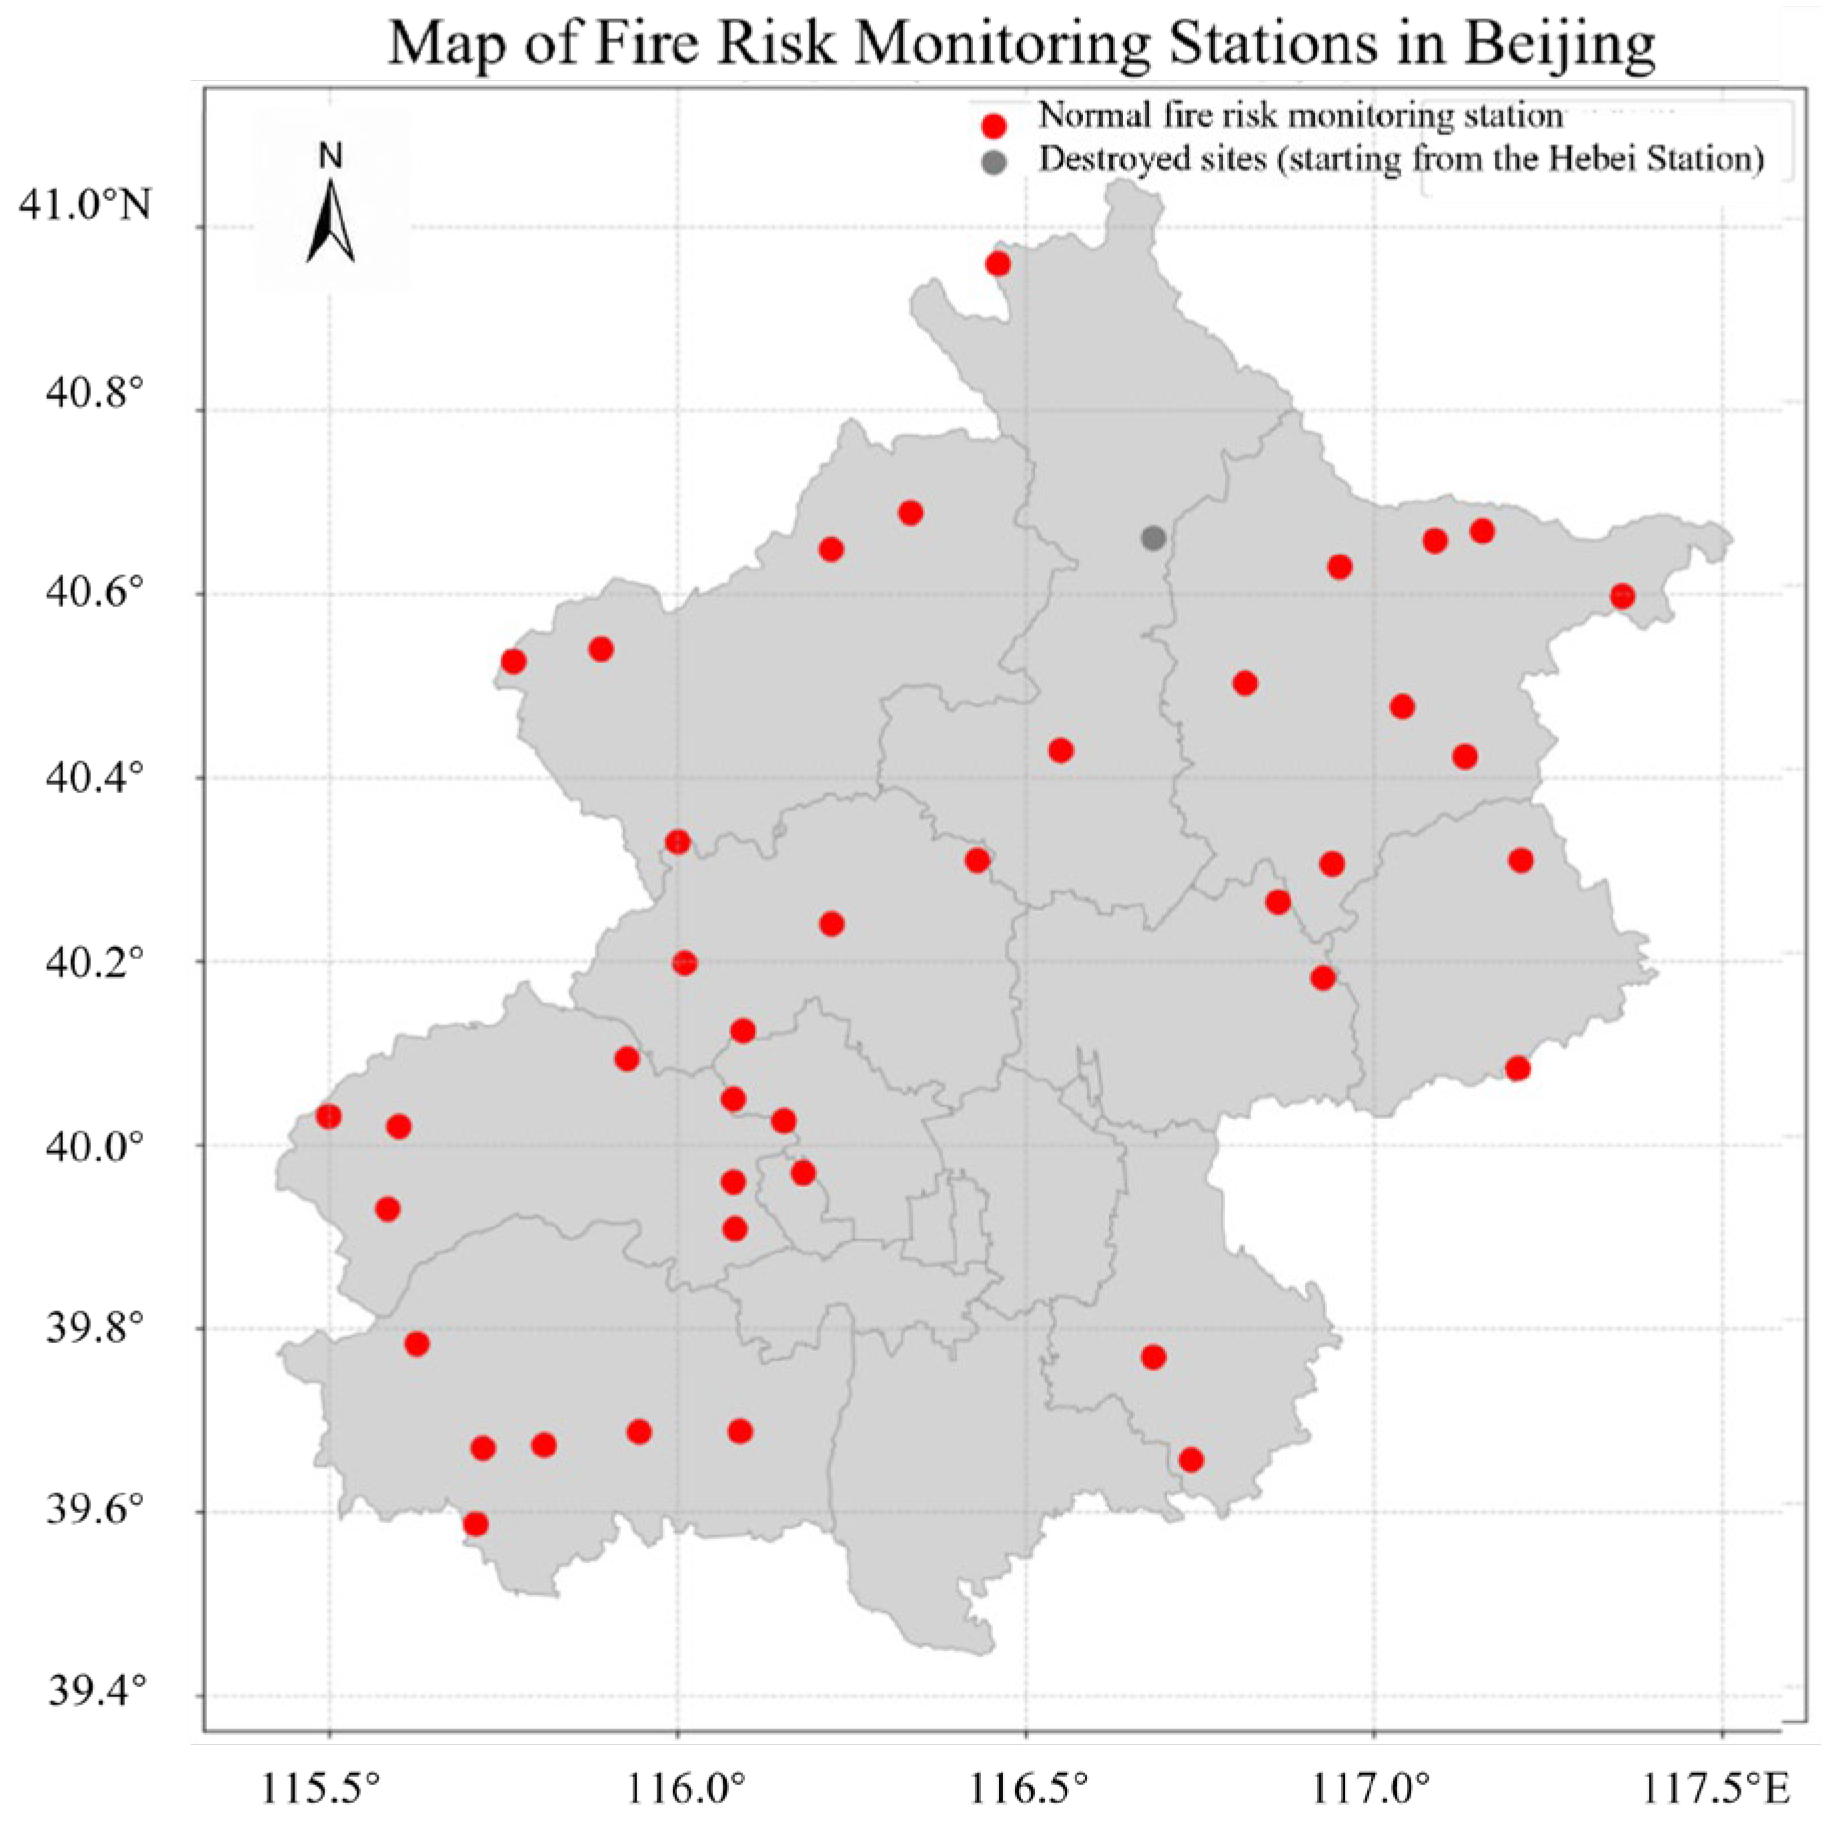
The real-time monitoring data comes from the 40 automatic fire risk monitoring stations deployed by the project team (
Figure 3). These can comprehensively sense elements such as temperature, precipitation, relative humidity, wind speed, wind direction, air pressure, sunshine duration, total solar radiation, soil temperature and humidity, humus temperature and humidity, and 10 h lag combustible material moisture content. The data are updated every 5 min or 1 h. The meteorological forecast data are based on the RMAPS (3 km grid, 24 h forecast) and RMAPS-NOW (1 km grid, 0–2 h short-term forecast) provided by the Beijing Meteorological Department.
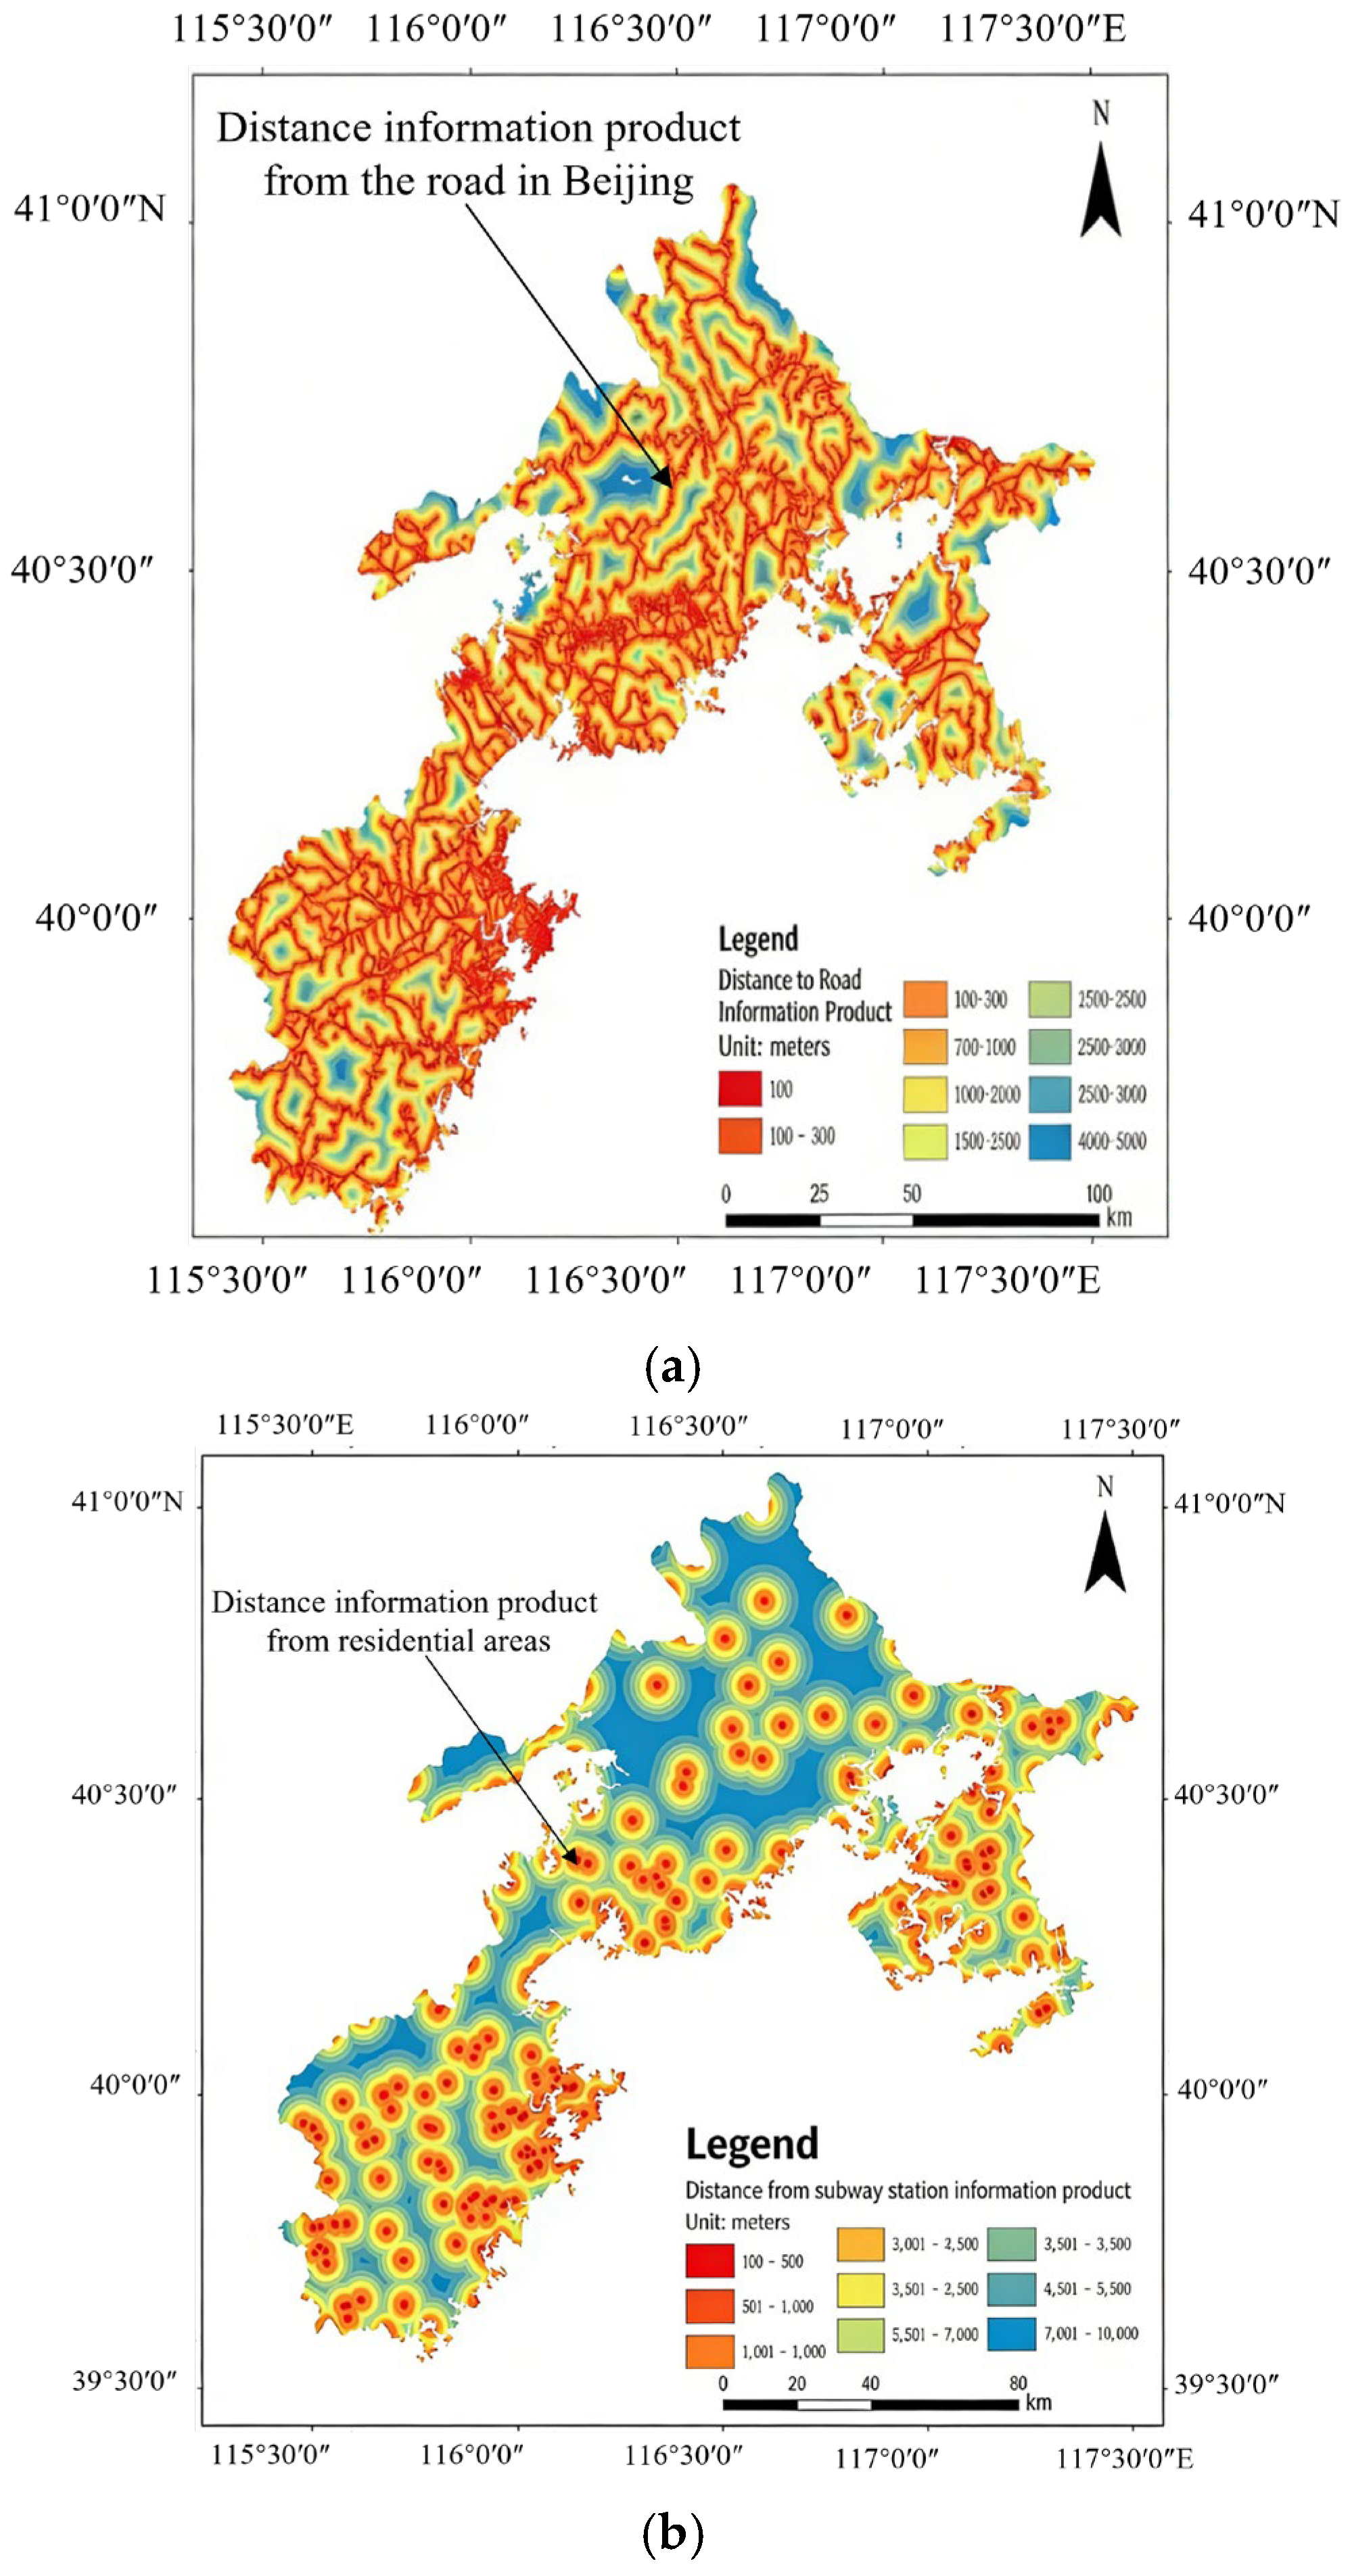
The geographical data include a 12.5 m/30 m resolution DEM, land cover data, road data (including national highways, provincial roads, and county roads), village point data, population density data, etc. The coverage range of the road–village distance products comprises the mountainous areas of Beijing, including five experimental forest areas. The product form is a distance value raster map, with a resolution of 10 m. The product production frequency is once during the project execution period, and the data source is Sentinel-2 10 m data and LandSat 5/7/8 satellite 30 m data. Based on these data, distance-based road–village distance products (
Figure 4a) and distance-based residential area–village distance products (
Figure 4b) were produced by generating Euclidean distance rasters and calculating Euclidean distances.
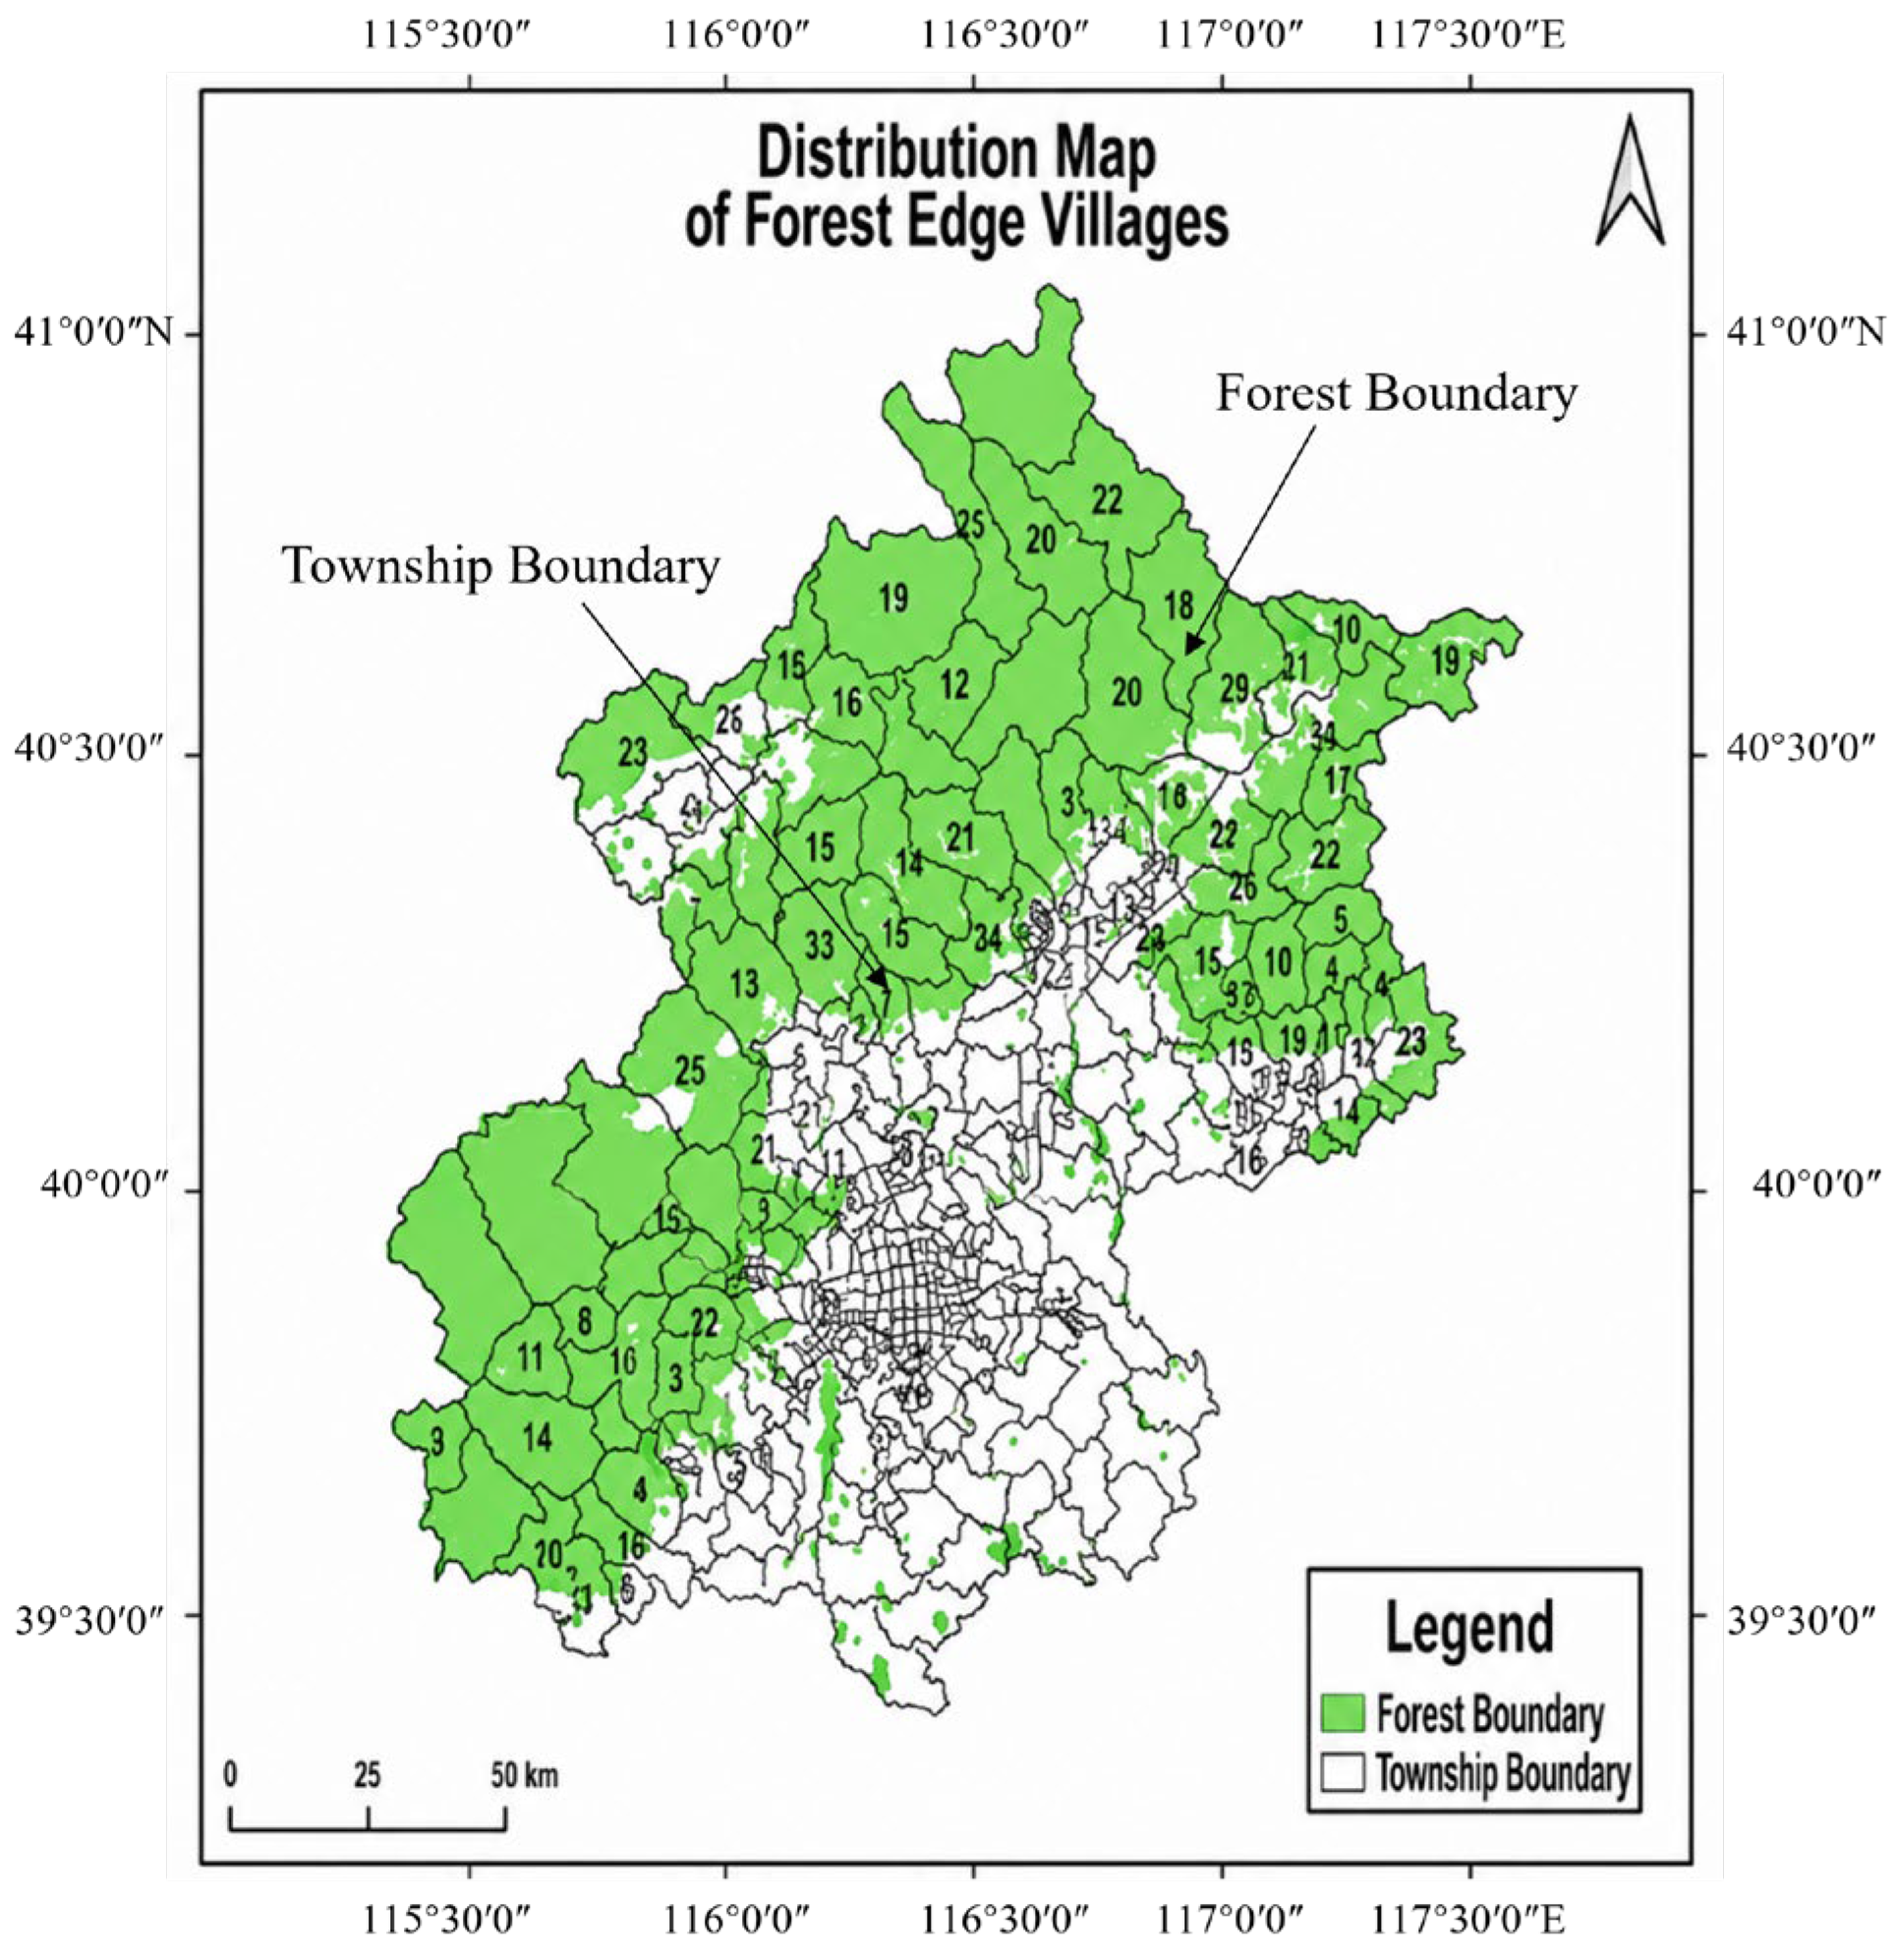
The 2024 reporting materials for each suburb include data from villages near forests, 86 forest-related scenic spots, the distribution of forest-related projects, tree–line conflicts, scattered graves and cemeteries, etc. In addition, the current evaluation index system for human-induced fire source risks already contains vector data related to roads such as national highways, provincial highways, and county highways. However, there is a lack of data on the accessibility of forest personnel and fire source risks for walking paths and routes with high human-activity intensity. Manually collecting route data in the forest area is extremely labor-intensive and difficult to achieve. In recent years, with the use of various mobile applications by hiking enthusiasts, a large number of hiking routes have been collected and shared by outdoor enthusiasts. Therefore, obtaining hiking route data through network scraping has become a feasible solution. The research obtained 3498 hiking routes covering the Beijing area through network scraping. This compensates for the insufficient coverage of traditional road data for forest paths.
Figure 5 below presents the data situation of the villages along the forest edge.
The historical fire data are included up to the fire prevention period of 2024–2025, covering the feedback data of abnormal hot spots detected by satellites from 2007 to 2023, as well as the fire account data from 2023 to 2025. The data cover information such as the type of fire source, the time of use, the geographical location, and longitude and latitude of the fire.
4.2. Social Survey Design and Implementation
The social survey was conducted through a combination of questionnaire surveys, in-depth interviews, and group discussions. The survey targets covered three aspects. Firstly, it investigated the temporal and spatial patterns, population characteristics, and management status of human-caused fire sources, providing behavioral-based evidence for model parameter-setting and control strategies; secondly, it outlines the current management measures and problems for preventing human-caused fires in the grassroots forest areas, including publicity and education, patrol and control, crackdown on illegal fire use, construction of isolation belts, and emergency preparedness. Thirdly, it examined the forest composition and vegetation conditions of the relevant villages, including the accumulation of combustible materials. In addition, the survey further hopes to achieve five specific goals: to clarify the habits, customs, and temporal–spatial patterns of villagers and tourists; to understand the fire-related patterns that grassroots managers have discovered through practice; to explore the current status and problems of management measures; to pay attention to the target of improving grassroots emergency capabilities, including the safety awareness, escape, and self-rescue capabilities of villagers and front-line managers, as well to ascertain their views on the effectiveness of new media publicity; to collect underlying data such as forest orientation, vegetation, and combustible material accumulation in the relevant areas.
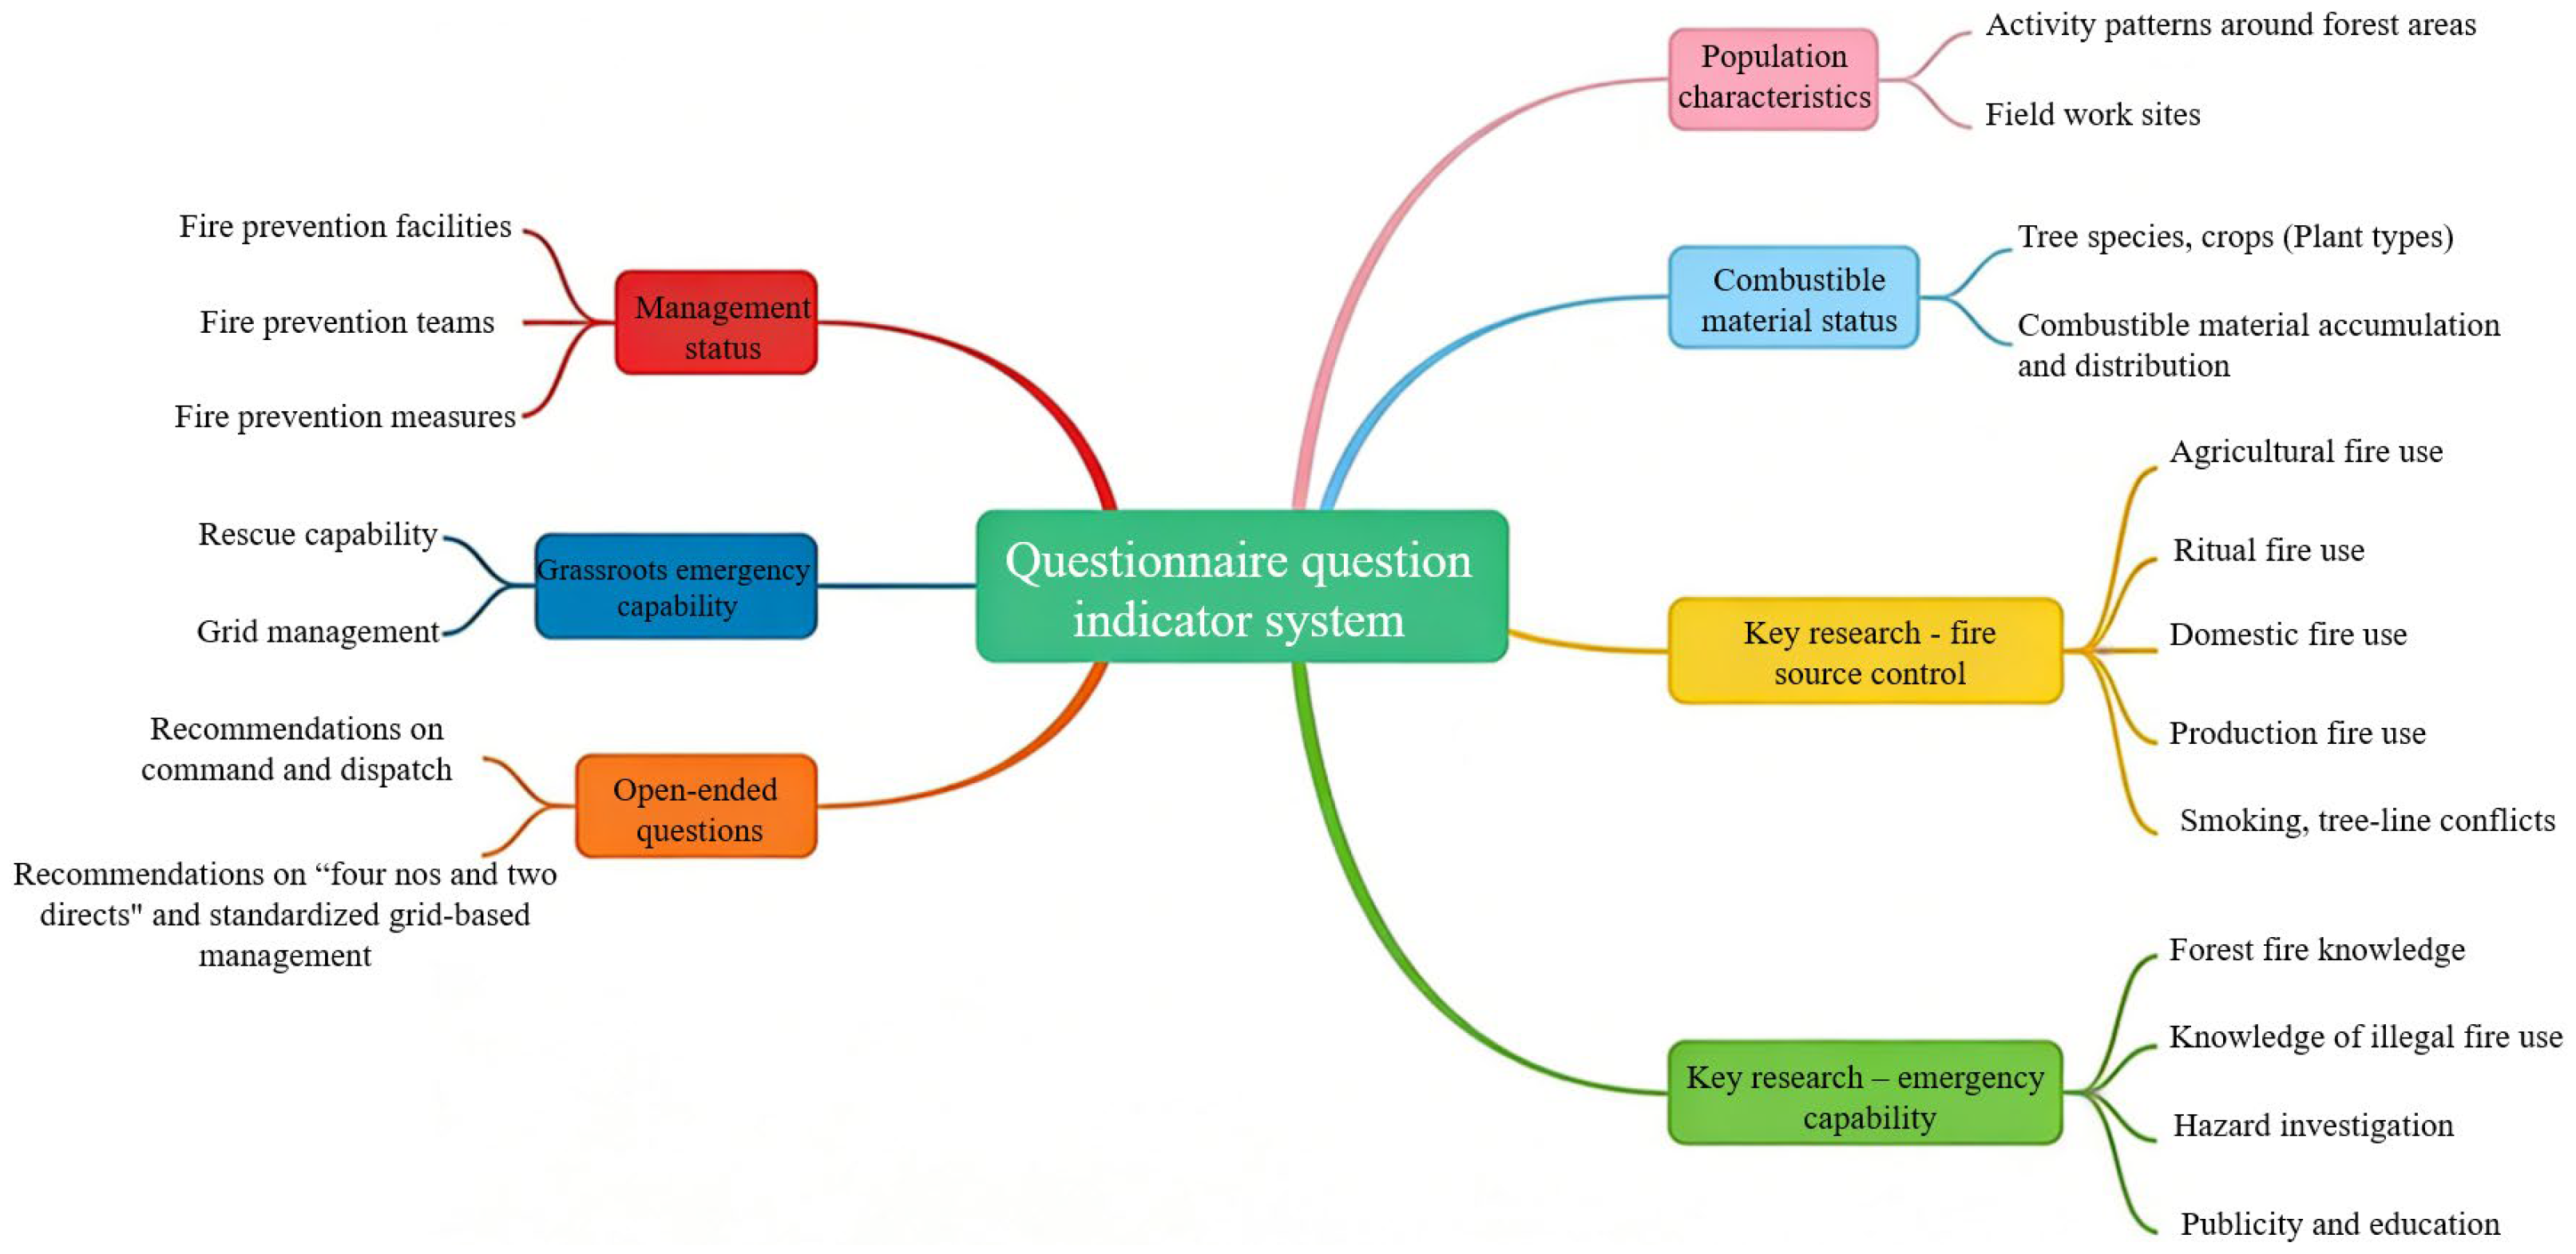
However, the survey data are not directly used to predict the frequency of fires or the distribution of fire points. Instead, they are used to identify the patterns of fire behavior to provide the basis for setting seasonal and festival coefficients. At the same time, data such as the age and treatment of forest rangers are provided for calculating the prevention and control capability index and to serve as a reference for proposing control strategies. The questionnaire data are not directly input into the risk model but only serve as auxiliary information for parameter calibration and result interpretation. The questionnaire design is shown in
Figure 6. Based on the seven-dimensional indicator framework, the issues are detailed from dimensions such as population characteristics, combustible material status, fire source control, emergency response capability, management status, basic emergency response capability, and related suggestions. The study drew on relevant questionnaires from previous public surveys on forest fire prevention in Beijing, the first national comprehensive risk survey on natural disasters, the China Rural Revitalization Comprehensive Survey Questionnaire, the China Migrant Workers Monitoring Survey Questionnaire, and the China Citizen Scientific Literacy Sampling Survey Questionnaire. Questionnaires were designed for villagers, forest rangers, ordinary tourists, and experienced tourists, respectively. The questionnaire framework was constructed around the three key groups, i.e., villagers, forest rangers, and tourists, covering basic characteristics, activity patterns in the forest area, cognition and attitude, and ability and preferences. The draft was verified through two rounds of the Delphi expert method, and 77 trial surveys were conducted in Dajiao Village, Shangweidian Village, and Tanquan Village in Miaofengshan Town, Mentougou District. The reliability and validity analysis showed that the Cronbach’s alpha coefficient was 0.796, the KMO value was 0.731, and the significance was less than 0.01, indicating that the questionnaire had good reliability and validity.
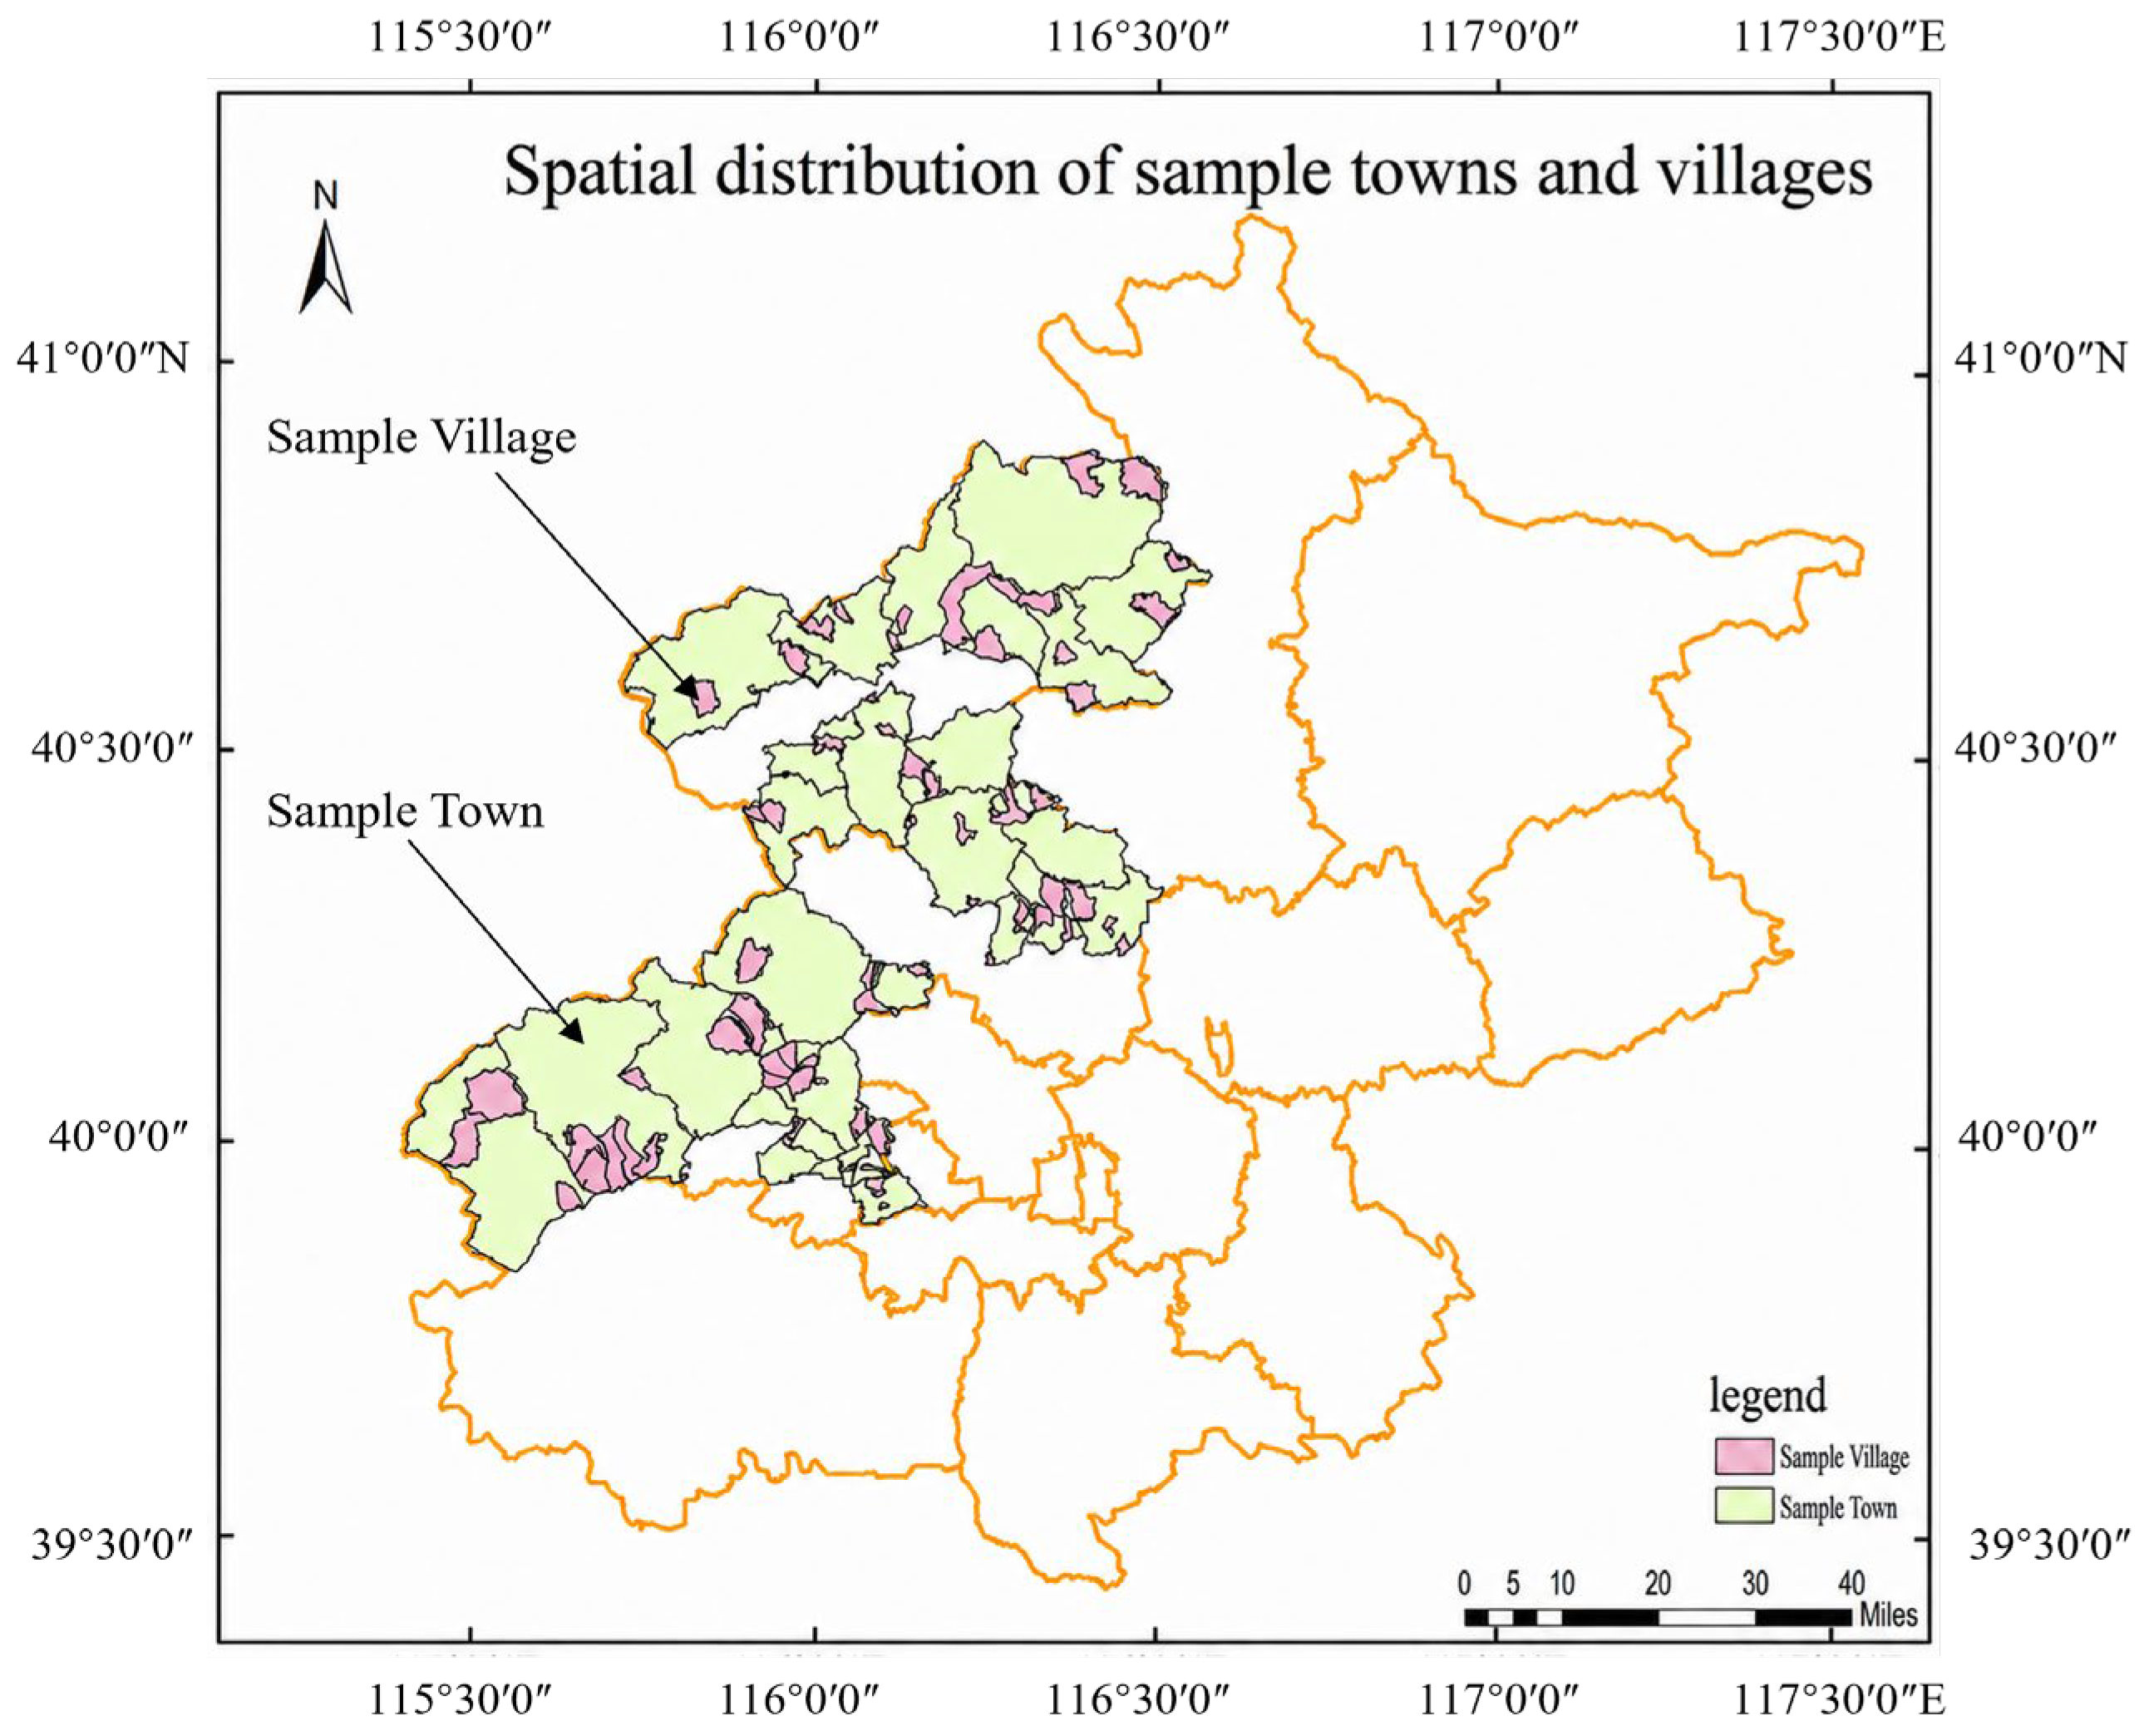
The survey was conducted using a two-stage stratified sampling method. In the first stage, 25 towns and 62 administrative villages from the three districts of Mentougou, Changping, and Yanqing were selected (
Figure 7), with the selection principles based on geographical proximity and population size. In the second stage, samples of villagers were collected through a combination of centralized filling and online supplementation within the villages. In the tourist survey, ordinary tourists completed the survey through on-site interception visits. The scenic spots selected focused on representative scenic spots in the three districts, including Lingshan in Mentougou and the Mianshan National Forest Park in Changping, etc., to meet the criteria of being close to forest areas and having an average daily visitor flow of over 1000 people. Senior tourists were surveyed through online questionnaires, relying on the Tencent Questionnaire database. Through the initial screening with the tag “Beijing + tourism interest” and additional discrimination questions, senior tourists were identified. The grassroots managers collected the data through discussion sessions, mainly inviting the heads of the forest fire prevention departments at the town level.
The survey was conducted from 17 July to 10 September 2025. As shown in
Table 4, 2354 questionnaires were collected offline, of which 2305 were valid; 227 questionnaires were collected online from experienced tourists, of which 203 were valid; 4 meetings with grassroots managers were held, with 22 participants. Finally, 2530 valid samples were obtained, including 1780 from villagers, 151 from forest rangers, 241 from ordinary tourists, 203 from experienced tourists, 139 interviews with village officials, and 22 meetings with town-level managers. From the perspective of regional distribution, Mentougou District covered 7 towns and 22 villages, with 503 responses from villagers, 54 from forest rangers, 58 from village officials, 7 from town-level managers, 89 from ordinary tourists, and 203 from experienced tourists; Changping District covered 7 towns and 18 villages, with 403 responses from villagers, 27 from forest rangers, 48 from village officials, 4 from town-level managers, and 70 from ordinary tourists; Yanqing District covered 11 towns and 22 villages, with 874 responses from villagers, 70 from forest rangers, 33 from village officials, 11 from town-level managers, and 82 from ordinary tourists. The samples covered five key groups, with a reasonable structure, providing a solid data foundation for subsequent analysis.
4.3. Data Preprocessing and Quality Control
Data preprocessing involves steps such as data entry verification, logical checking, handling of missing values, marking of outliers, and numerical encoding of variables. The logical checking covers five aspects: skip-answer logic, demographic rationality, numerical range, temporal sequence, and consistency. Samples that do not meet the requirements are marked as outliers and excluded. Missing value handling uses mean or mode interpolation for low-proportion missing values and multiple interpolation or deletion for high-proportion missing values. Variable encoding is determined based on type; nominal variables are represented by dummy variables, ordinal variables are assigned in order, scale variables retain the original values, binary variables are converted to 0/1, and multiple-choice questions are expanded into dummy variables. Finally, the mapping relationship between the questionnaire document and the database is established, forming the final analysis dataset.
In terms of data quality control, static data is uniformly converted into the Beijing 1954 coordinate system, which is consistent with the data format of the Beijing forestry department. Dynamic data includes daily-scale data, such as meteorology and human flow, and missing data is handled using “interpolation by adjacent stations + filling with seasonal averages” to ensure that there are complete input data for Beijing forest land every day. For meteorological data, based on the demand for calculating real-time forest fire risk indicators in the fire risk warning model, the read permissions for different resolutions and types of real-time data can be automatically retrieved, updated hourly, and retrieved at any time in the fire risk forecast auxiliary module, according to the required time settings, meteorological element settings, and meteorological station number settings. For mobile phone signaling and other personnel activity data, hourly grid heat data, including total number of people, inflow and outflow number of people, gender ratio, and population profile, are obtained through custom fences. All vector/raster data are uniformly processed to ensure consistency in spatial analysis. In terms of questionnaire survey data, data quality is verified through reliability and validity analysis. The pilot survey shows that the Cronbach’s alpha coefficient is 0.796, the KMO value is 0.731, and the significance is less than 0.01, indicating good questionnaire reliability and validity.
5. Model Validation and Application
5.1. Model Validation
To evaluate the accuracy and applicability of the constructed human factor forest fire risk assessment model, this study conducted a retrospective verification based on 22 typical human-caused fire cases that occurred in Beijing from 2018 to 2025. These cases covered various types of human-caused fires that occurred in Beijing in recent years, including a lithium battery malfunction fire caused by illegal hunting by villagers in Fengjiaoyu Town, Miyun District, in 2023; a fire caused by burning paper at the tomb in Zhuhuquan Township, Yanqing District, in 2023; two wildfires caused by the scattering of welding slag from electric welding during road construction operations in Mentougou District in 2023; and multiple human-caused fires during the forest fire prevention period from 2024 to 2025. The case data were derived from the results of the first forest and grassland fire risk census in Beijing, including accurate coordinates of the ignition points, ignition times, types of fire sources, etc. Among them, the fire points from 2007 to 2023 were obtained through the combination of MODIS and FY-3D satellite hot-spot monitoring and ground verification. From 2023 to 2025, the fire points were investigated on-site by the fire prevention departments of each district using GPS (with positioning error ≤ 10 m). All cases were confirmed by the district-level forestry and emergency management departments. Satellite fire monitoring data mark the center of thermal anomaly pixels instead of real fire locations, so the actual fire is rarely within 10 m of satellite monitoring points. This technical feature is documented in the official guidelines of NASA FIRMS.
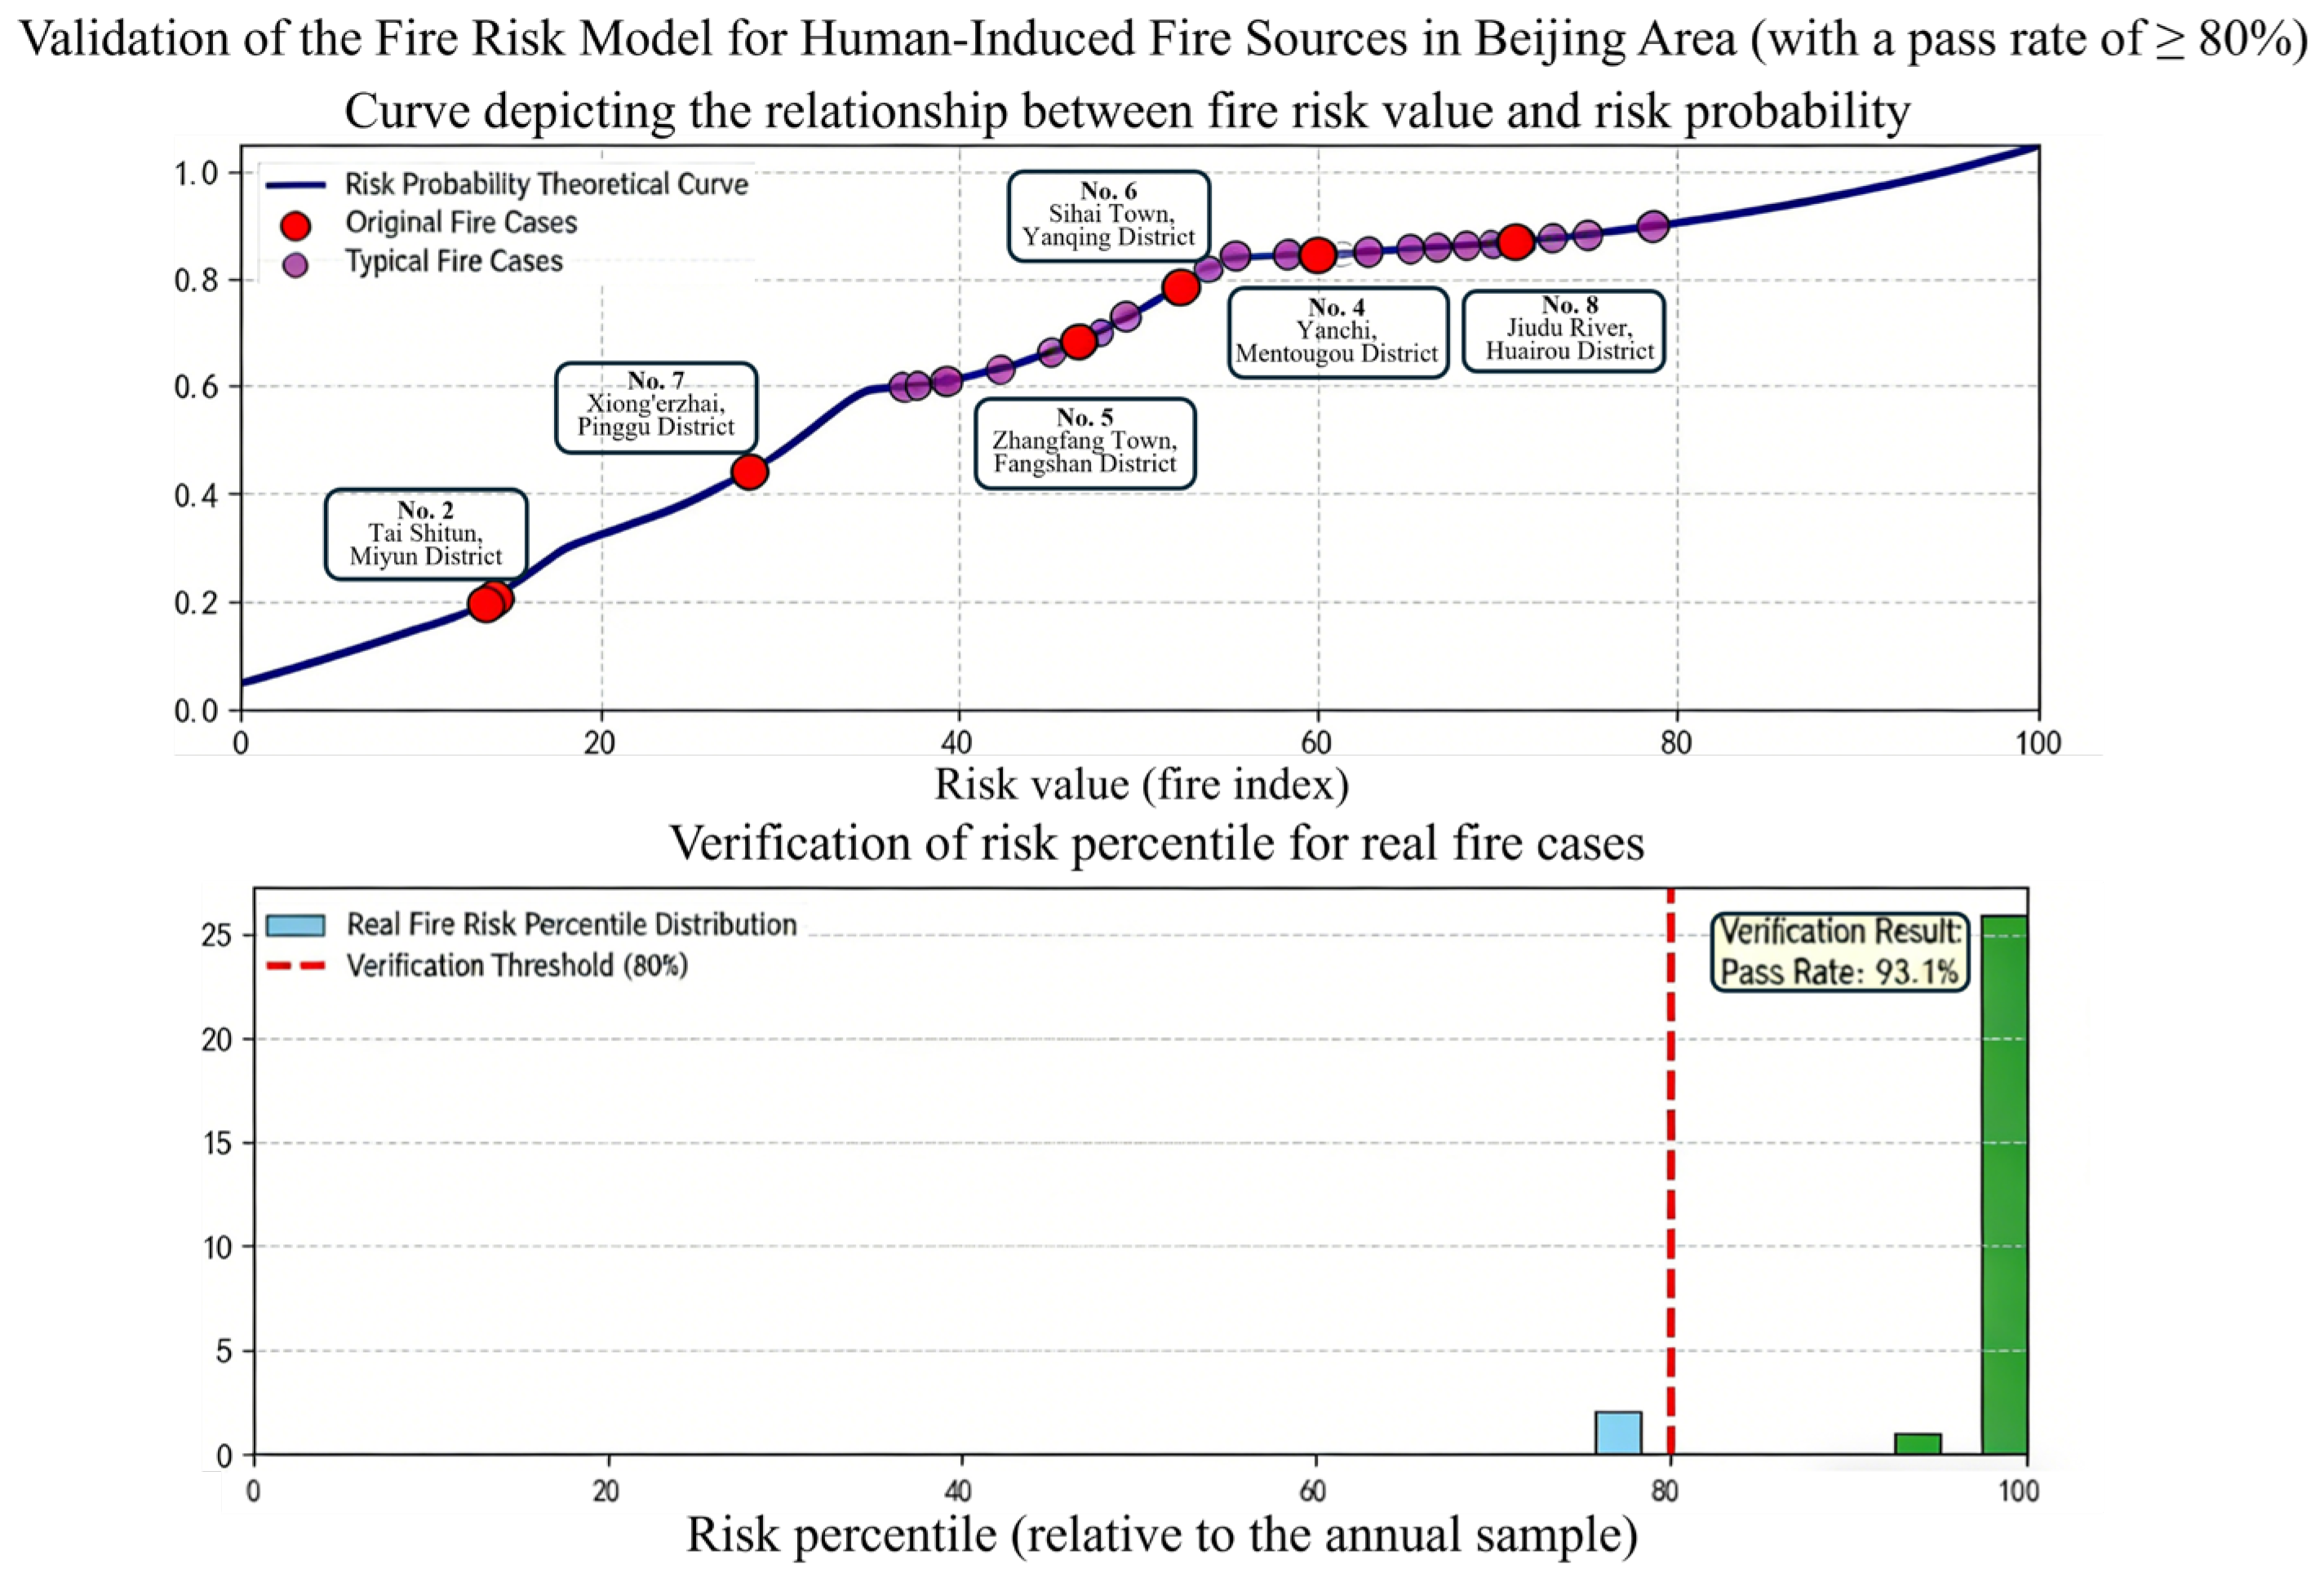
The verification method is as follows. The coordinates of the ignition point for each fire case are input into the model. The meteorological data, combustible material data, and human activity data of the grid where the ignition point is located on that day are extracted. The comprehensive risk index of that point is calculated, and the percentile ranking of this risk value among all grid risk values is determined. The results are shown in
Figure 8. The risk indices of the ignition points for the 22 fire cases are all in the high-risk area, and the lowest percentile distribution is 87.8%. This indicates that the 22 typical human-caused fire cases used in this study were located in areas identified by the model as relatively high-risk zones, suggesting that the model has good sensitivity in identifying human-caused fire risk within the available validation dataset. However, because the number of qualified fire cases with precise coordinates, exact ignition time, and officially confirmed causes was limited, the validation should be regarded as a retrospective validation based on typical cases rather than as a fully independent external validation.
Further analysis revealed that cases involving the use of fire for sacrificial purposes (such as burning paper at funerals in Yanqing) generally had a higher risk percentile than did cases involving the agricultural use of fire. This is consistent with the model’s design, in which the weight for sacrificial fire use is relatively high (0.35), and the holiday weighting coefficient is also relatively large. Although the construction fire use cases had a smaller sample size, their risk percentile was also above 90%, indicating that even for fire sources with limited data, the model can effectively identify high-risk locations through constraints on accessibility and fire occurrence conditions. The verification results indicate that the model can effectively capture the main risk characteristics of human-caused fire sources and their spatiotemporal coupling patterns in the study area, suggesting its potential for supporting operational forest fire risk management.
In addition, the study also tested the time recurrence effect of the model. Using the risk forecast data for 10 consecutive days adjacent to the Qingming Festival in 2024, and comparing it with the actual three fire incidents related to worship activities during the same period, it was found that the model began to show an increase in risk 3 days before the festival, reached its peak on the festival day, and then rapidly decreased after the festival. This closely matched the time distribution of the actual fires, proving the effectiveness of exponential smoothing and adaptive parameter setting. The fire source weights used in the model construction (
Table 3) were based on the statistics for the causes of 22 human-caused fires in Beijing from 2018 to 2025. The model validation also used qualified cases within this period. There was some overlap in time between the two. This was mainly due to two factors: Firstly, the satellite hot-spot data from 2007 to 2017 lacked unified and comparable fire-cause classification and precise coordinate information and could not be directly used for weight quantification; Secondly, in recent years, Beijing has achieved remarkable fire prevention results, and the number of cases that met the conditions regarding the data for precise coordinates, precise time, and official confirmation within the period of 2018 to 2025 was relatively limited. It was impossible to separately divide the modeling and validation periods, and all cases were the qualified samples available within this period, without any selection bias. Nevertheless, the vast majority of parameters in the model were derived from data sources, independent of fire cases, and only the four weights in
Table 3 directly relied on fire statistics. The lowest risk percentile of the ignition points of the 22 validation cases was still 87.8%, and all were located in high-risk areas, indicating that the model’s ability to identify historical fire points is robust. In the future, with the accumulation of data, independent fire cases from 2026 and beyond will be used for continuous verification, the historical period will be extended to 2000, and satellite hot-spot inversion will be considered.
5.2. Evaluation of Hazardousness in Key Forest Areas
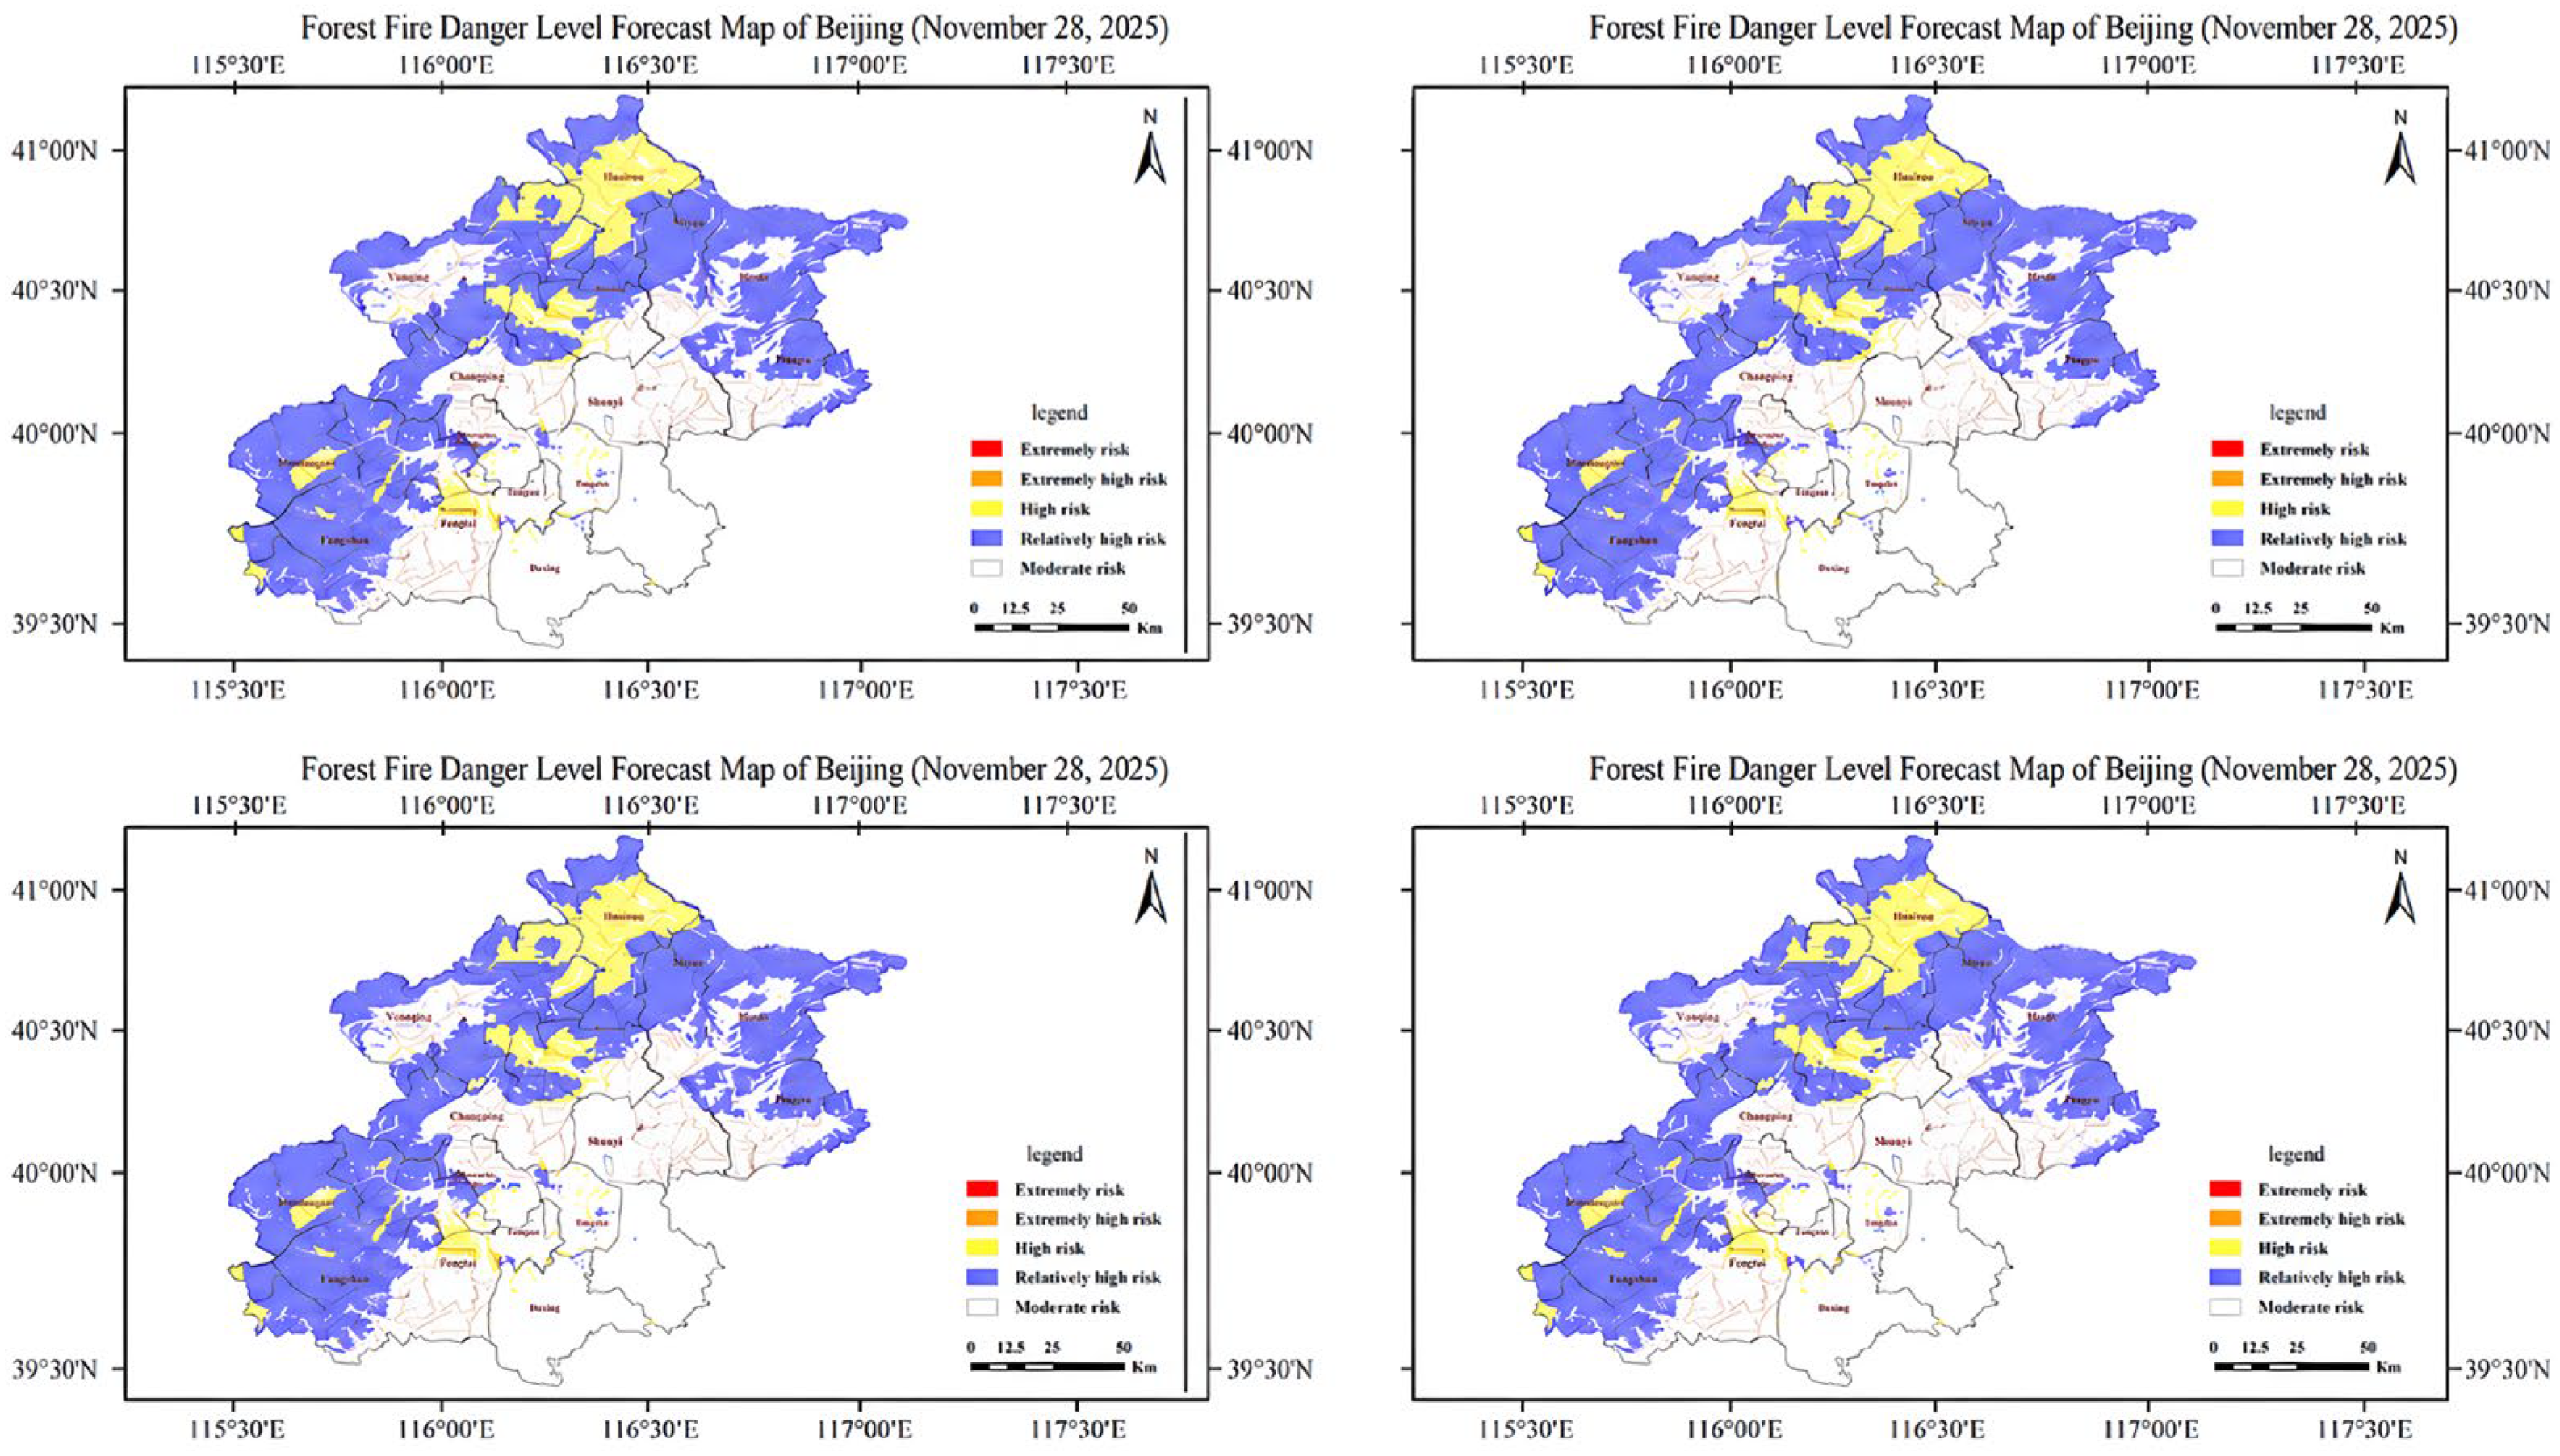
Based on the comprehensive risk model, natural factor indicators such as fire occurrence condition indices were further integrated. A daily risk assessment was conducted for three typical forest areas in Beijing—Mentougou District, Changping District, and Yanqing District. The assessment employed the Gaussian kernel interpolation method, generating a daily risk distribution map with a spatial resolution of 10 m (
Figure 9), which visually demonstrated the heterogeneity of risks within each forest area.
The area includes Mentougou District, Changping District, and Yanqing District. Through the daily risk maps, it can be observed that the risk patterns in these three districts are significantly different: Mentougou mainly exhibits linear (road) and point-like (villages) risks, Changping shows spreading in a surface manner, and Yanqing presents a combination of hot-spot concentration and seasonal fluctuations. This difference provides a direct basis for each district to formulate differentiated fire prevention strategies. For example, Mentougou District should focus on strengthening checkpoint inspections and patrol forces along the 109 National Highway; Changping District needs to dispatch additional temporary forest rangers in scenic areas such as Mengshan and promote the centralized treatment of combustible materials in the forest–agriculture transitional zones; Yanqing District should organize special night patrols during the Spring Festival and the Cold Clothes Festival and conduct risk inspections of hiking routes before the peak tourist season.
5.3. Development of Fire Risk Warning Module
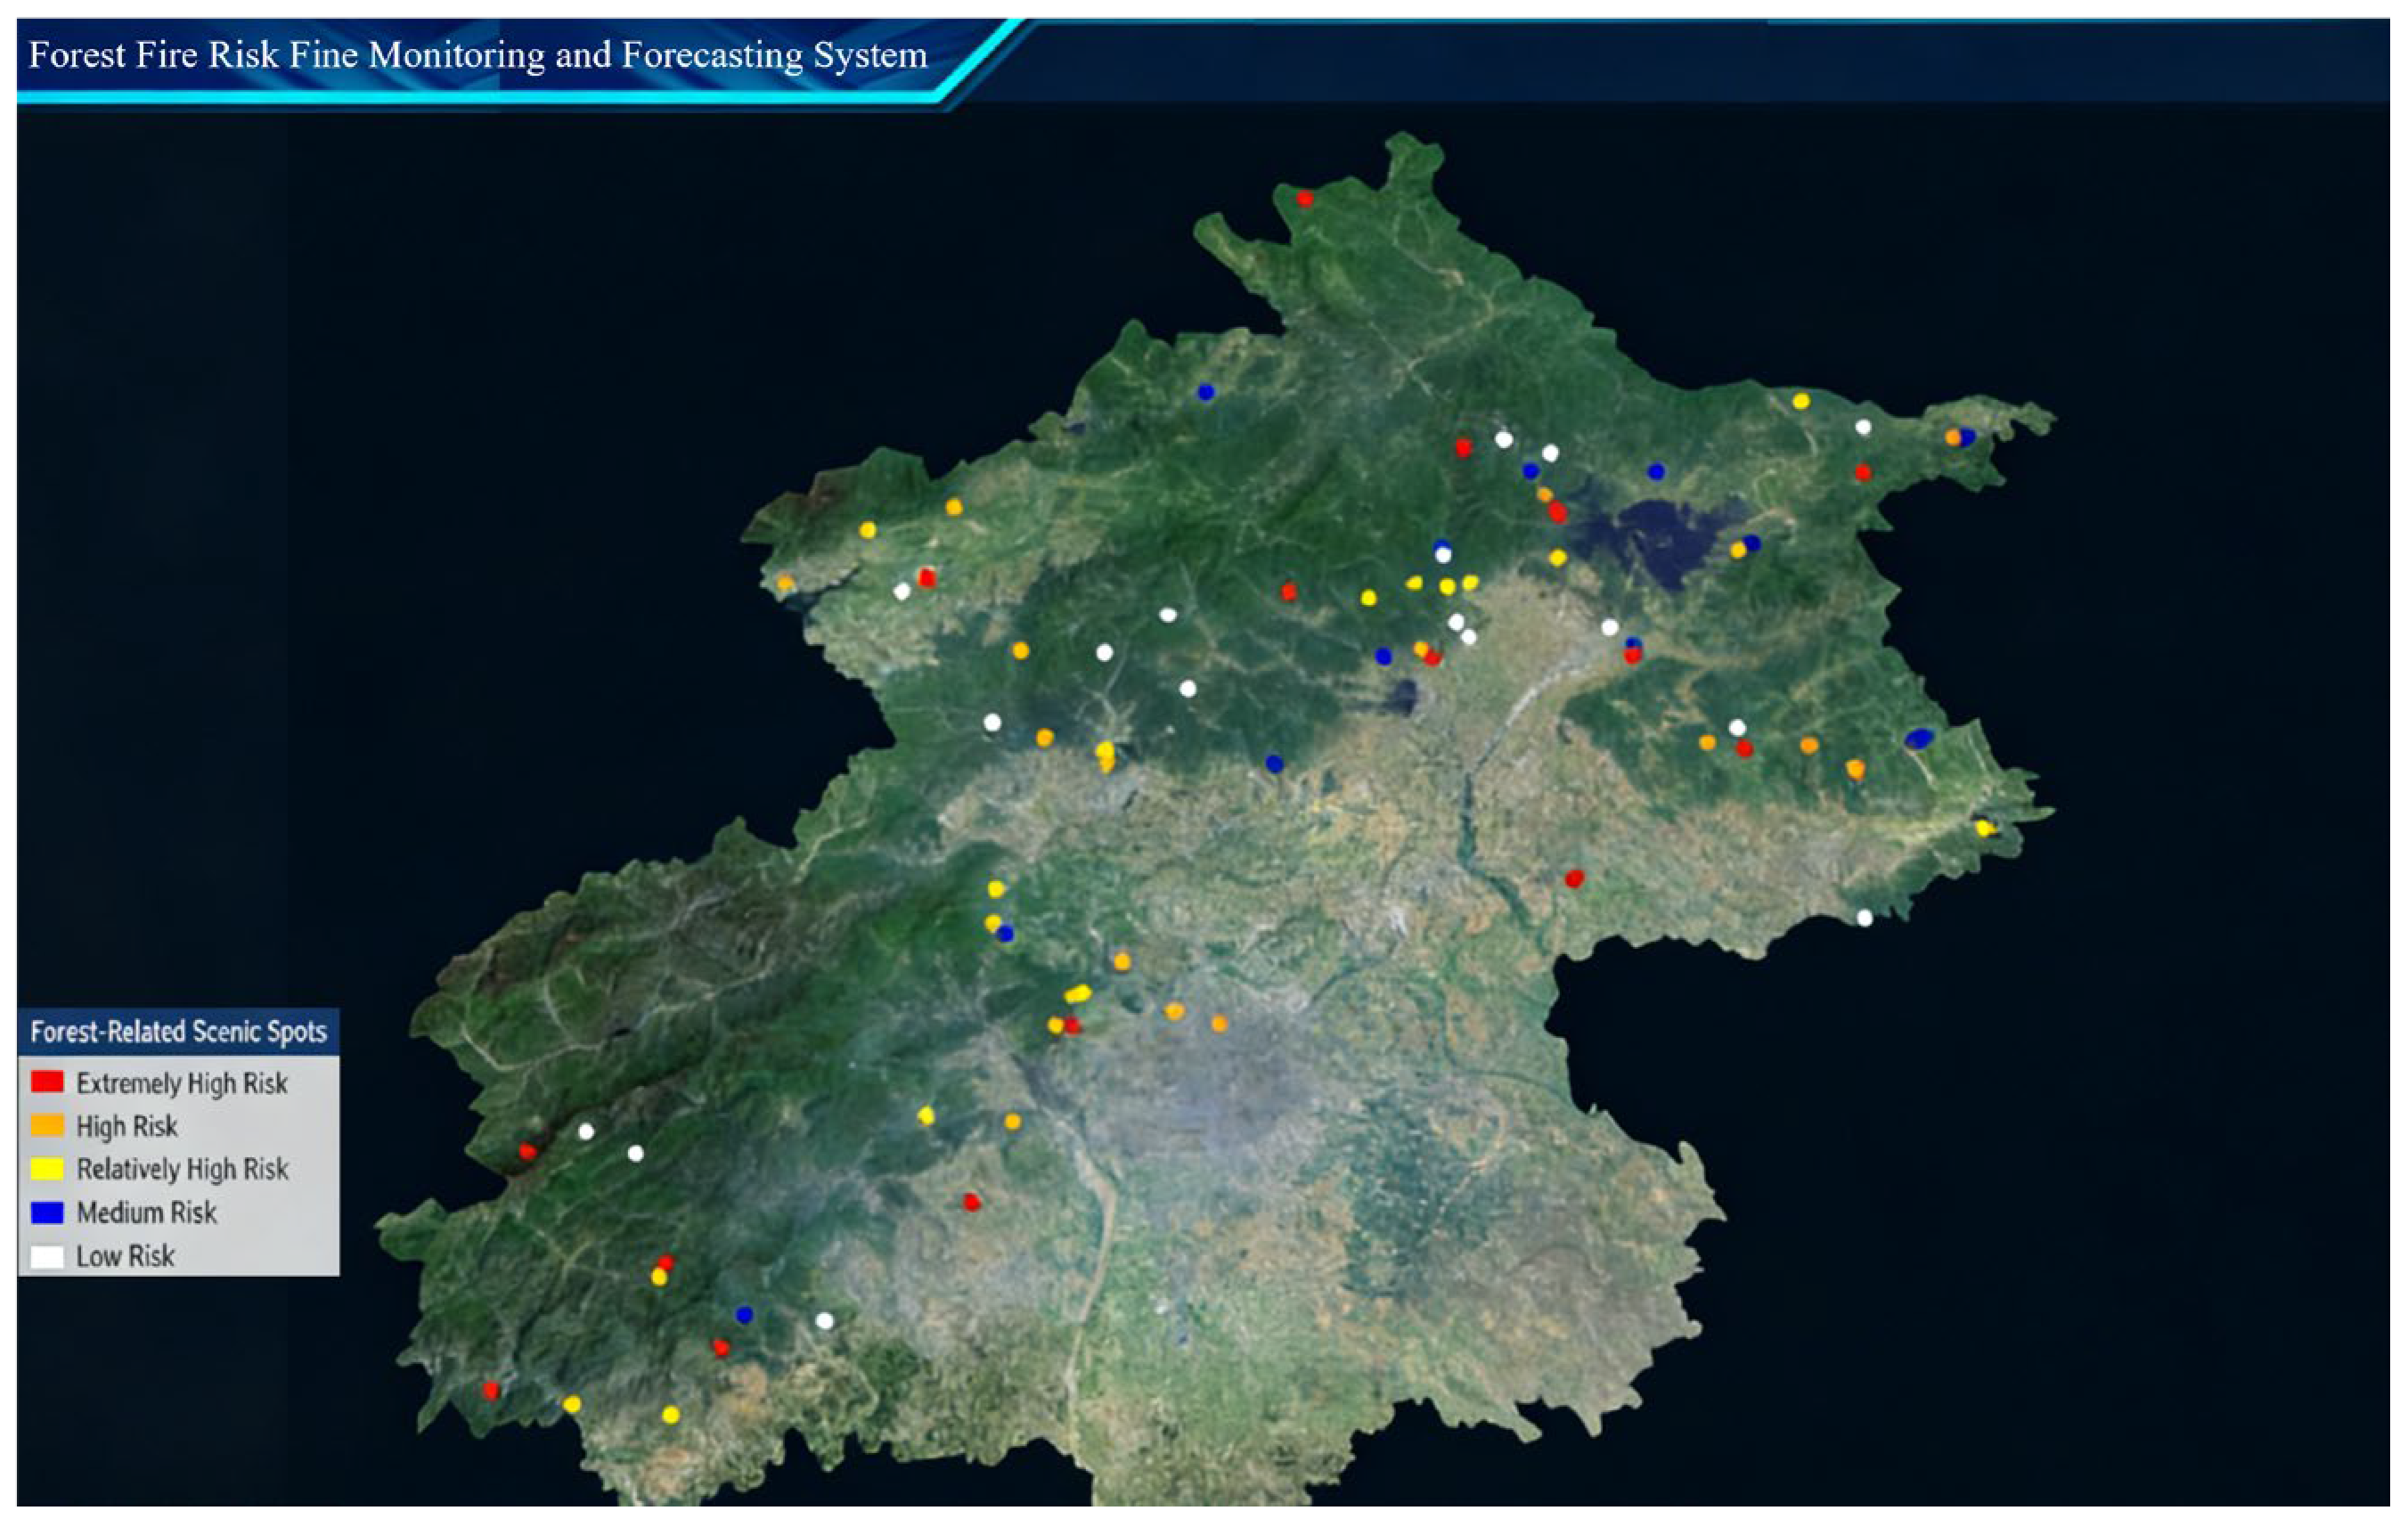
Based on 2530 social surveys and an analysis of 22 historical fire cases, this study identified the behavioral characteristics of the main human-caused fire sources. Agricultural fires mainly involve “scorching the edge of the field”, with young farmers being the high-risk group, and fires occurring mainly during autumn days; sacrificial fires are concentrated during the Qingming Festival and the Cold Clothes Festival, mostly happening at the “family cemetery” near the forest; tourism-related fires frequently occur on weekends in autumn; although experienced tourists actively check the fire danger levels, they still rely on campfires. During the on-site visits and questionnaire surveys, a large number of respondents stated that they often witnessed people smoking in the forest area. A cigarette butt has an ignition temperature above 100 degrees Celsius and can hardly ignite combustibles on its own. However, dry fine fuels and light winds in the forest can provide essential conditions for combustion. Apart from smokers carelessly discarding cigarette butts, a small number of experienced tourists also set fires intentionally. Smoking behavior is one of the main fire hazards in the region. These behavioral patterns directly support the risk-level classification for forest scenic areas and hiking paths in the fire risk warning module described in this section. In order to apply the model results to actual business operations, this study integrated the constructed evaluation model into the “Forest Fire Risk Refined Monitoring and Forecast System” and developed two major functional modules: risk visualization and data query components. In terms of risk visualization, based on the basic data of 86 forest-related scenic spots in Beijing, combined with meteorological factors, fuel factors, human factors, and other multi-source data, the system used the model to calculate the risk level of each forest-related scenic spot, displaying the results in the system’s geospatial visualization interface, with different colors representing different risk levels (
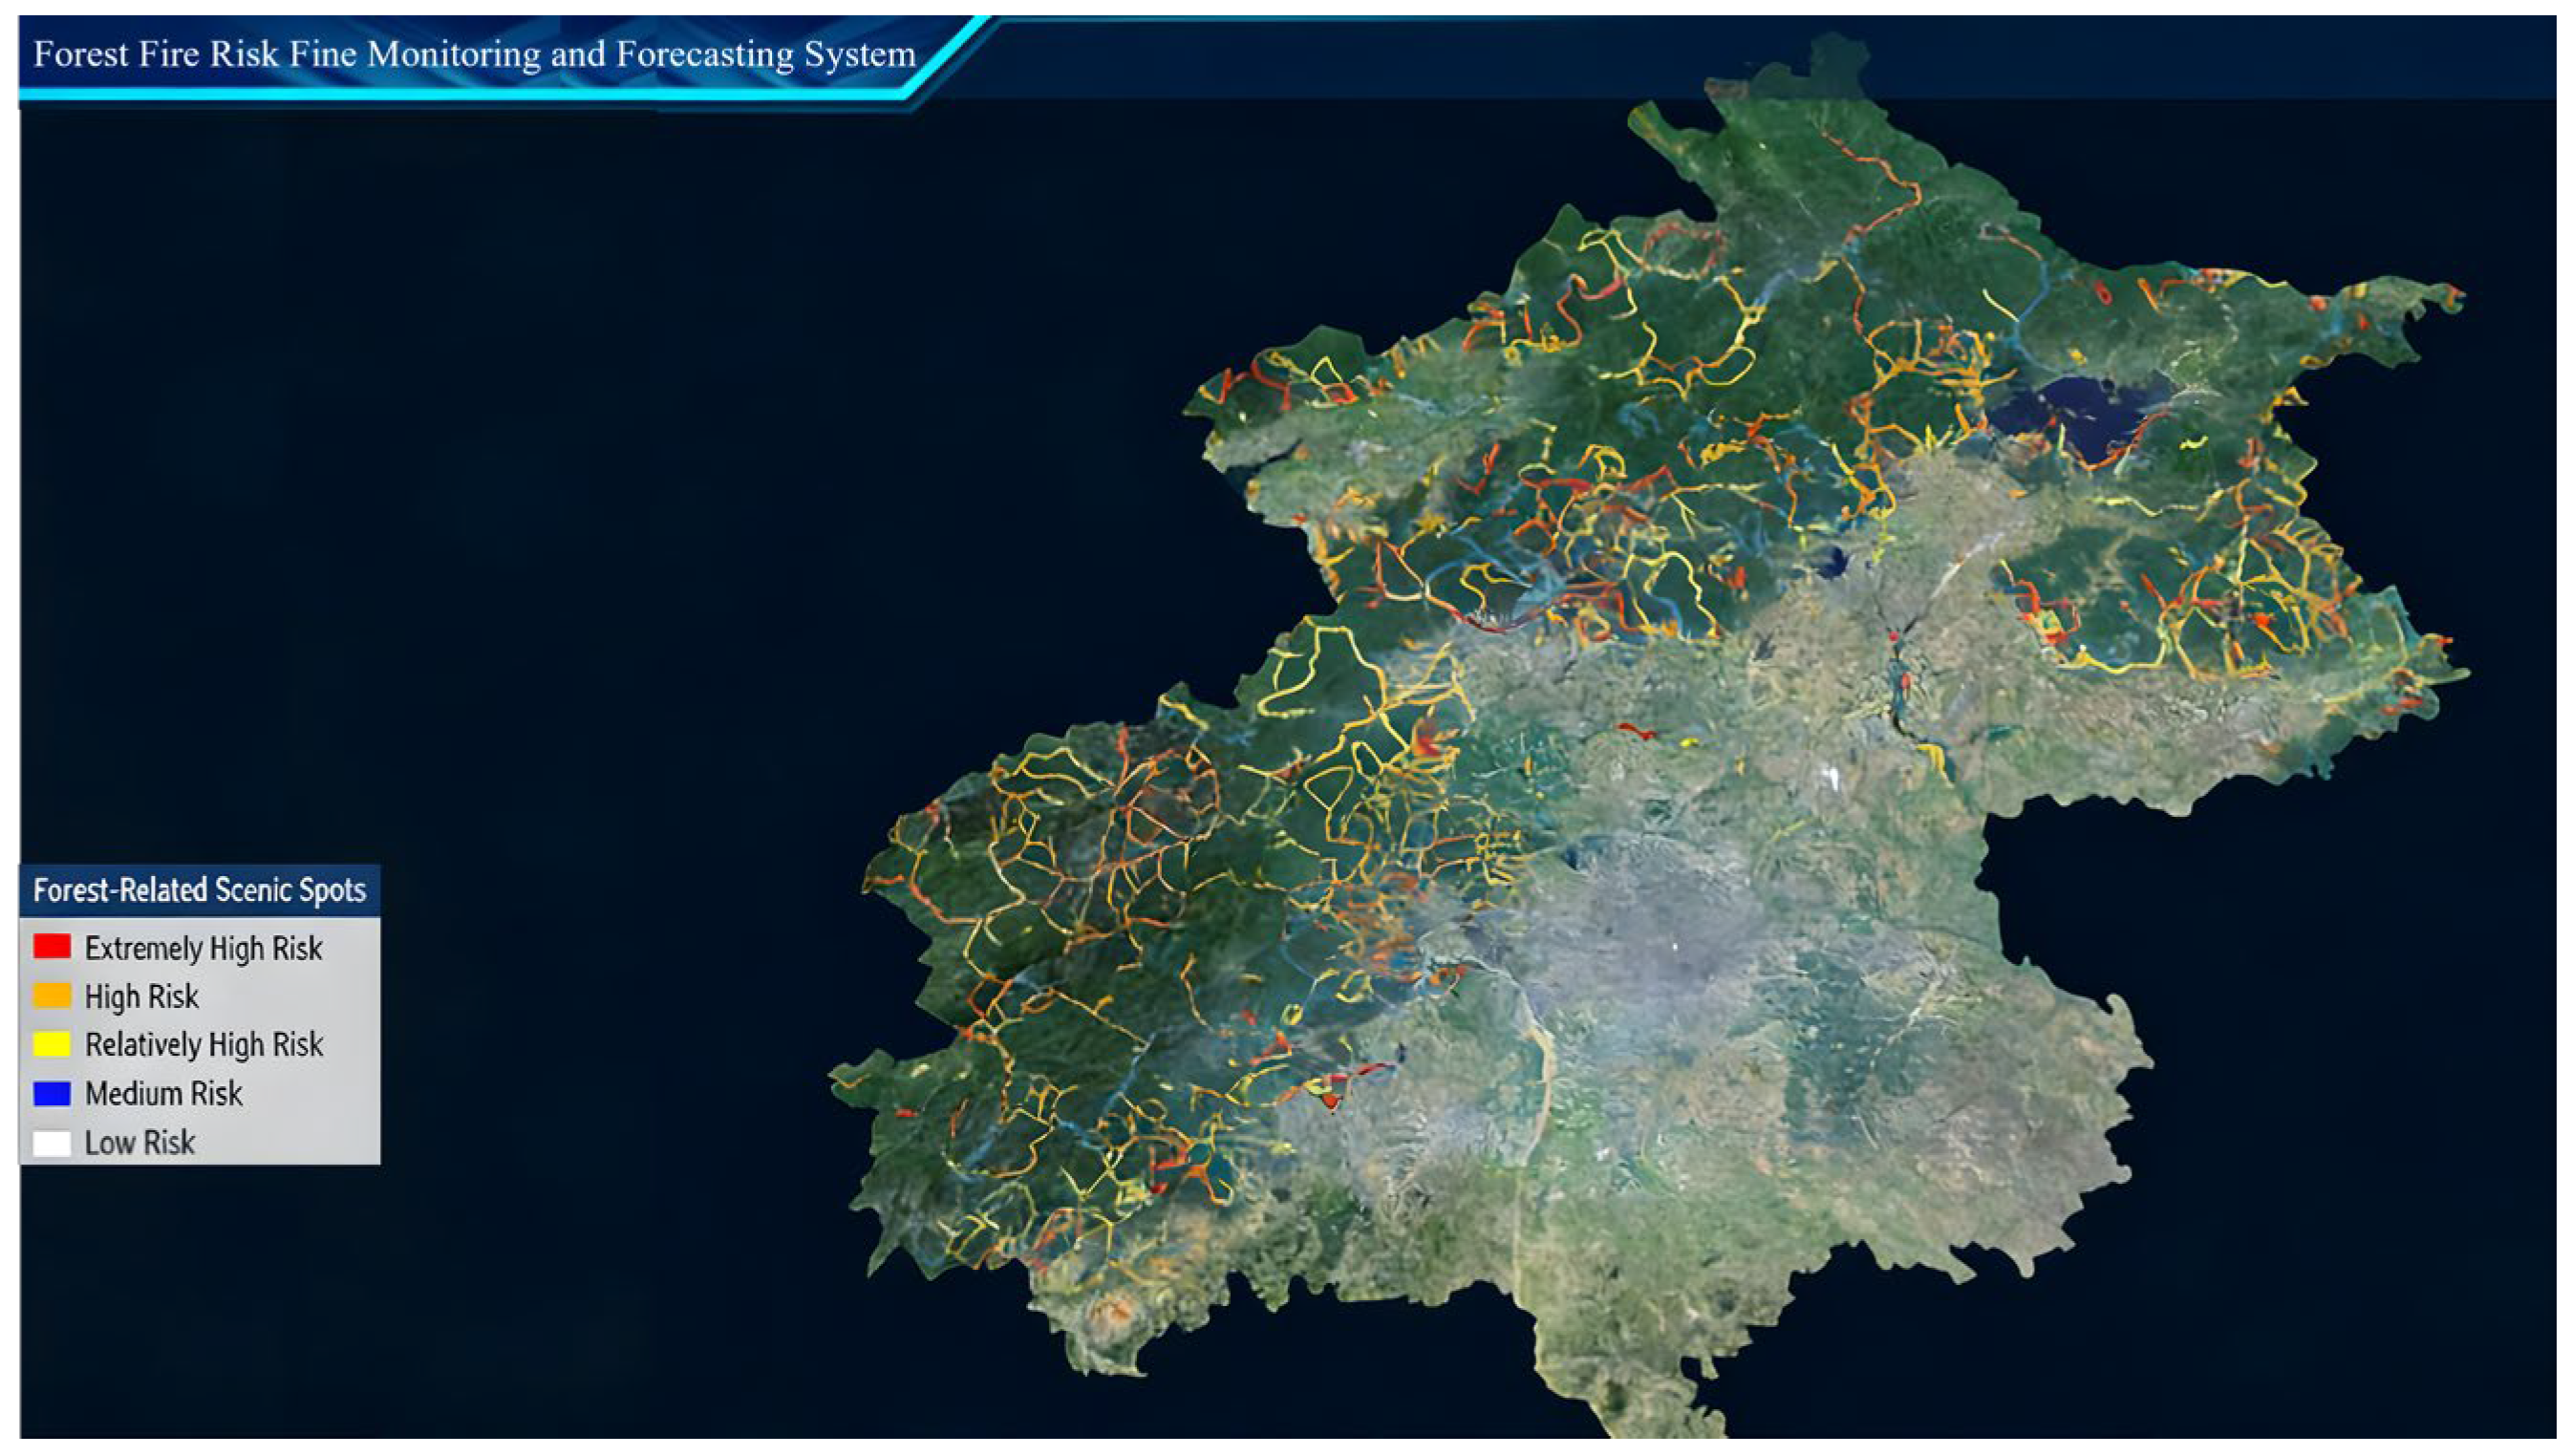
Figure 10). Similarly, based on 3498 hiking trajectory data captured through the network, the system collected the basic information for hiking paths and calculated the risk level of each hiking path by combining multi-source data, displaying the results in the system’s geospatial visualization interface, with different colors representing different risk levels (
Figure 11). Users can click on any scenic spot point or hiking path to open a detail window showing specific risk information. It should be noted that
Figure 10 and
Figure 11 are application interface displays of the Forest Fire Risk Refined Monitoring and Forecast System rather than standalone cartographic maps.
In terms of data query, the system is based on the results of the four-phase human-caused fire questionnaire survey. All data from the 2530 questionnaires are stored in the database, enabling the data query and gathering of statistics from the survey data. The data can be filtered according to district, survey subject type, etc., and displayed in a chart format on the front end. In addition, the system integrates ledger data such as forest area construction units, forest edge villages, scattered graves, and tree–line conflicts. The background conducts data entry for the basic ledger and provides an external query interface, presenting data details in a table format and de-identifying sensitive information. Users can query information such as fire-related activities in the forest area, village distribution, scattered grave locations, and tree–line conflict hazards in the relevant areas, providing basic data support for daily inspections and defense arrangements during key periods.
6. Discussion
6.1. Model Innovation and Advantages
Based on the internationally recognized disaster risk assessment framework, this study constructed an integrated evaluation index system covering exposure, triggering factors, vulnerability, and prevention and control capability to comprehensively characterize human-caused fire risks. In particular, differentiated sub-models were established for four dominant human-caused ignition sources, namely agricultural activities, sacrificial activities, tourism activities, and power transmission facilities. Different accessibility indicators and risk weighting coefficients were designed for different fire-source categories to achieve the refined representation of human-caused fire behavior. Compared with traditional fire danger assessment approaches, which are mainly driven by meteorological and vegetation factors, the proposed framework emphasizes the interpretability and refined behavioral representation of human-caused fire risk. The study integrated large-scale social survey data with multi-source geographical and meteorological data to construct a refined evaluation framework for human-caused fire risks in the typical forest areas of Beijing. A total of 2530 valid questionnaires were collected across 25 towns and 62 administrative villages in the Mentougou, Changping, and Yanqing districts, covering five representative groups, including villagers, forest rangers, ordinary tourists, experienced tourists, and grassroots managers. Behavioral characteristic information was obtained through questionnaire surveys, in-depth interviews, and symposiums. These social survey data were further integrated with meteorological observations, geographical information data, risk census ledgers, and online hiking trajectory data, thereby improving the characterization of human fire-use behavior beyond that obtained from conventional remote sensing and census-based approaches.
The framework further introduced dynamic seasonal adjustment coefficients and festival-related behavioral factors to characterize the spatial heterogeneity and temporal evolution of human-caused fire risk. Compared with generalized human activity proxy models, the proposed framework provides more detailed behavioral mechanism representation and improved interpretability under limited fire-case conditions. Compared with purely data-driven machine learning approaches, the proposed framework uses explicit mathematical formulations and interpretable parameter structures, enabling a clear representation of the physical meaning and contribution of each indicator. This improves transparency and facilitates practical understanding and application by forest fire managers. In addition, compared with traditional macro-scale fire danger zoning approaches, the proposed framework achieves daily dynamic forecasting and 10 m grid-level risk output, enabling the refined depiction of local spatial variability and the short-term temporal fluctuations of fire risk. The parameter settings were calibrated according to the local fire occurrence characteristics and geographical conditions in Beijing, giving the framework distinct regional applicability. The study formed a relatively complete technical chain covering risk feature identification, index system construction, parameter calibration, spatiotemporal validation, and operational application. The resulting framework has been integrated into the Beijing forest fire risk monitoring and early-warning system and supports differentiated prevention and control strategies for different fire-source categories, high-risk periods, and high-risk population groups.
6.2. Control Measures Suggestions Based on Evaluation Results
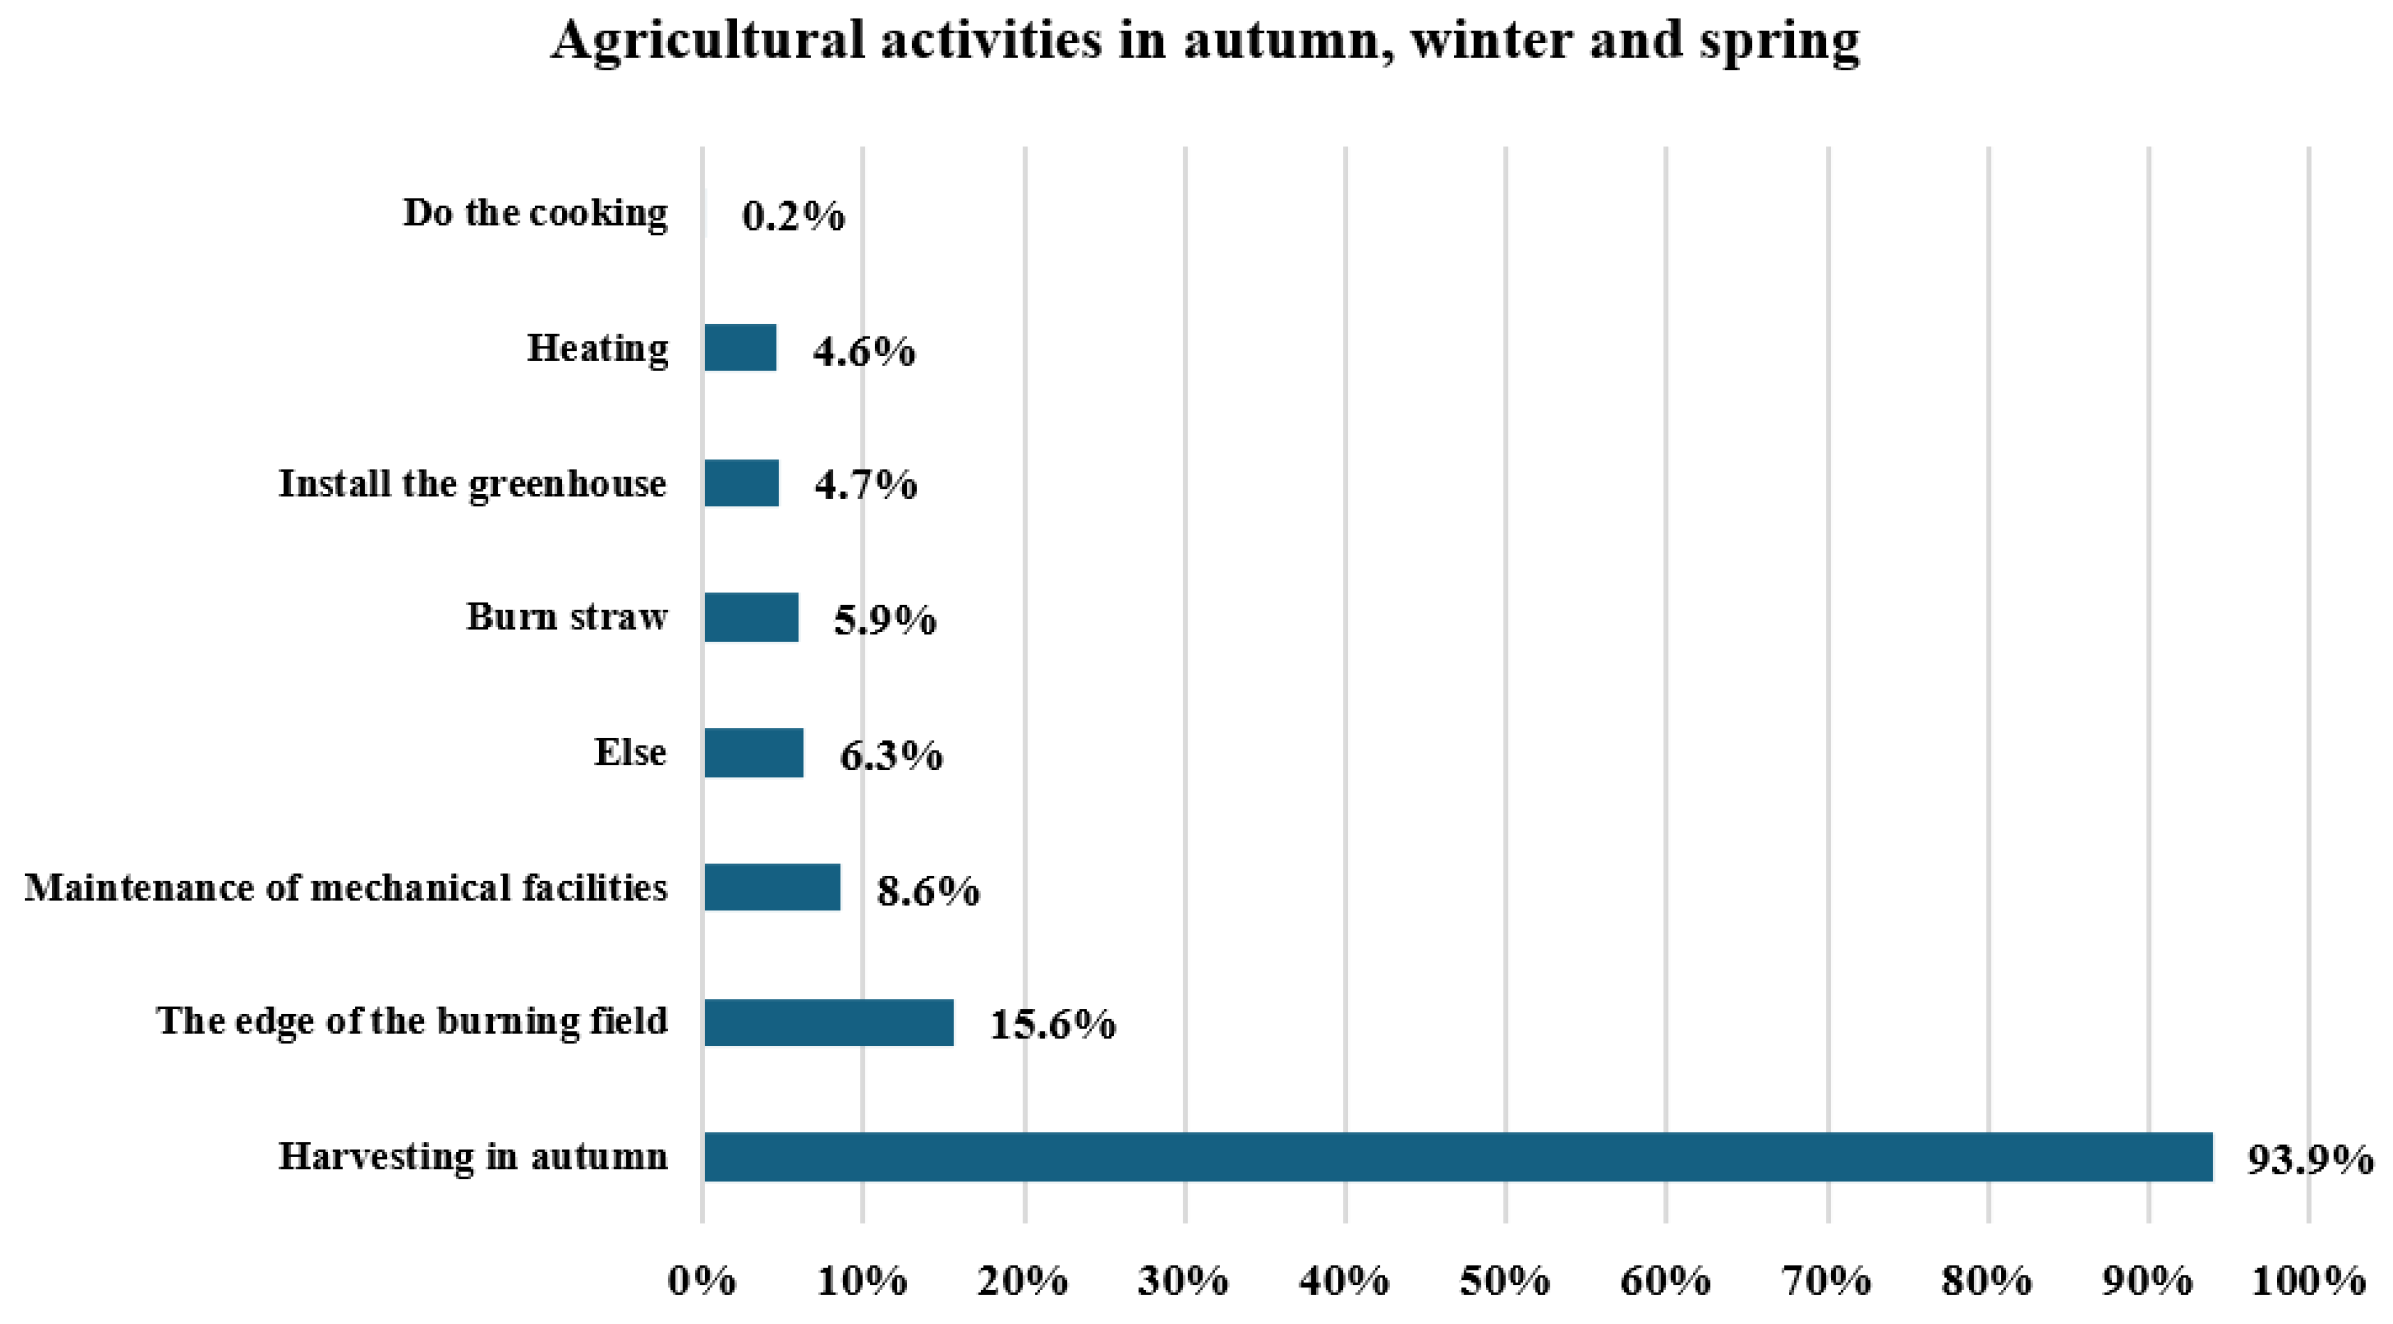
Based on the model-identified high-risk areas, time periods, and population characteristics, combined with the current status of grassroots control revealed through social surveys, this study proposes the following refined control measures. Regarding the control of agricultural fire use, it is suggested to establish a “closed-loop handling mechanism for combustible materials in the forest–agriculture interface area”. The survey shows that 72.9% of families with orchards have forest land within 300 m of their orchards, and 55.4% of families with farmland have forest land within 300 m of their farmland, forming extensive “forest–agriculture interface area” high-risk zones. A simple “fire ban” policy is ineffective for solving the problem of handling combustible materials during agricultural activities. Some townships have adopted the “emergency drill + centralized burning” model, organizing villagers to handle agricultural waste uniformly during the drill period, which not only meets the land cleaning needs but also avoids the risk of unauthorized fire use. In some regions, collective forest farms collect straw, fruit tree branches, and green walnut husks and turn them into biomass energy for villagers’ use. It is suggested that the “village-level combustible material centralized processing point” mechanism be fully promoted in all villages with forest–agriculture interface areas within the city. The district-level government will provide financial support for the operation of forest farms or cooperatives. Agricultural waste such as straw, fruit tree branches, and green walnut husks will be collected at designated points, processed at appointed times, and utilized in a targeted manner. Centralized burning will be included in the annual fire prevention drill plan to achieve “drilling as cleaning, cleaning as training”. At the same time, the focus is on the young farmers group. The survey shows that the young farmers group is the main force for burning fields, burning straw, using fire at night, and using electricity privately. During autumn days, the inspection of forest-edge farmland should be strengthened, and checkpoints and intelligent monitoring should be utilized to reinforce fire source management.
Figure 12 shows the proportion of each type of agricultural activity compared to the whole.
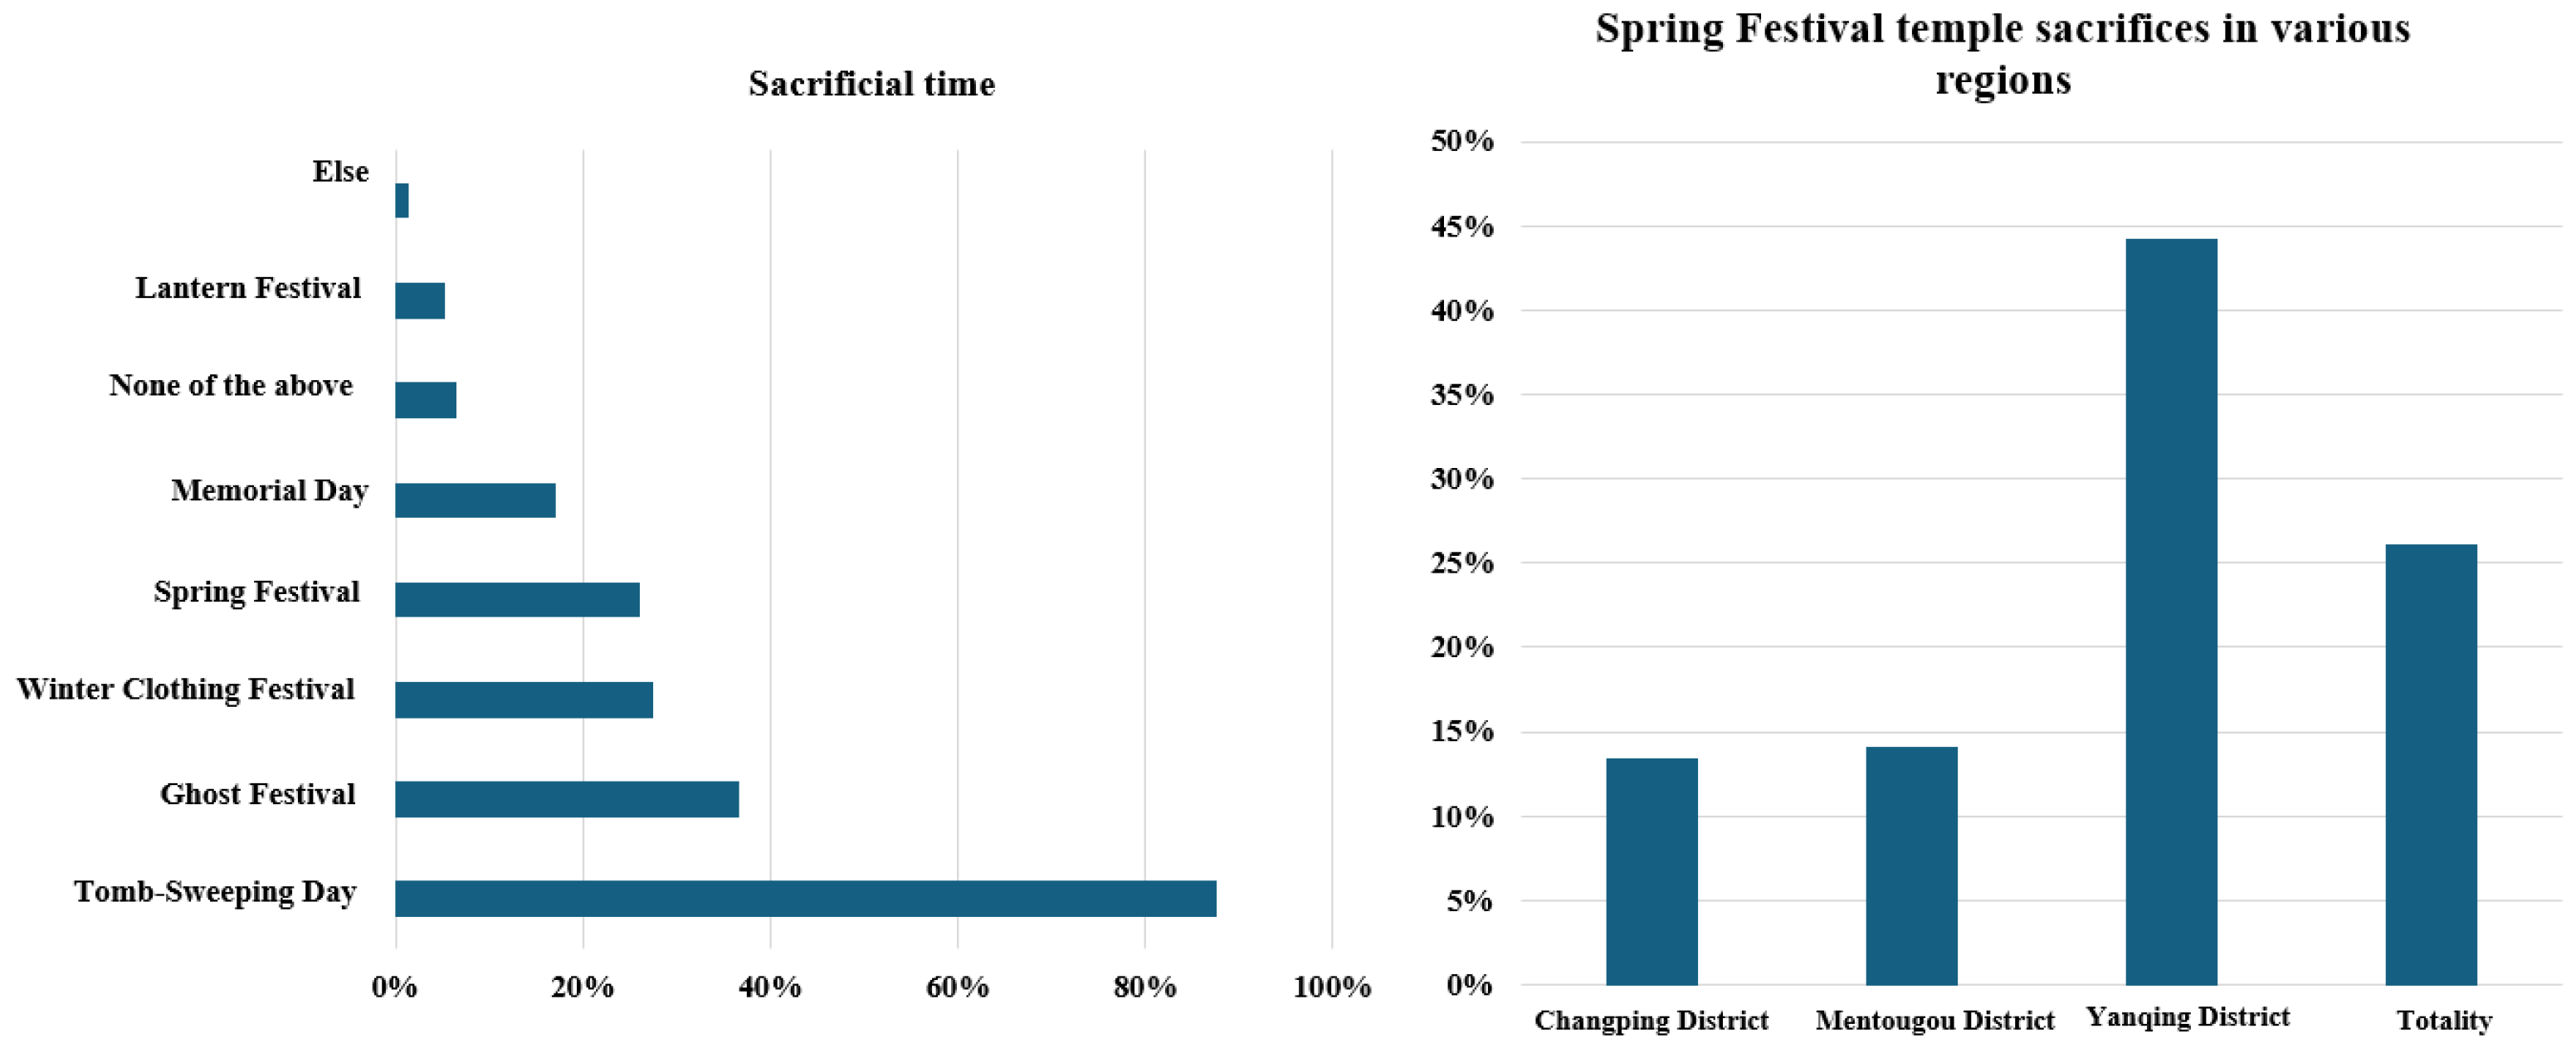
Regarding the control of fire used in sacrificial ceremonies, it is suggested to implement “precise full-cycle control of sacrificial activities”. The survey shows that the Qingming Festival is the dominant peak of sacrificial activities (87.5%), while the Ghost Festival has a significant number of nighttime sacrifices (35.0% are conducted at night, with a rate as high as 62.1% in Changping District and 57.7% in Mentougou District), and the Spring Festival in Yanqing District has a sacrificial ratio as high as 44.3%. Spatially, 68.0% of villagers choose to sacrifice at “their family graves”, mostly located in the forest edge areas, forming a “zero-distance” contact with combustible materials. It is suggested to establish an “electronic ledger of forest edge graves”, code-manage scattered graves within 300 m of the village and to dynamically allocate inspection forces during the Qingming and Ghost Festival periods, specifically strengthening night-time inspections during the Ghost Festival. For the high proportion of Spring Festival sacrifices in Yanqing District, differentiated time-period control is implemented, promoting “flower replacement of paper money” and “electronic sacrifices” as fire-free alternative solutions. Pilot experience in some villages indicates that these measures can effectively reduce reliance on open flames. The “sacrificial behavior registration system” is explored, encouraging families planning to sacrifice outside peak periods to report in advance to the village committee and providing safety guidance by forest guards, achieving a balance between flexible guidance and rigid constraints.
Figure 13 shows the sacrificial time period patterns.
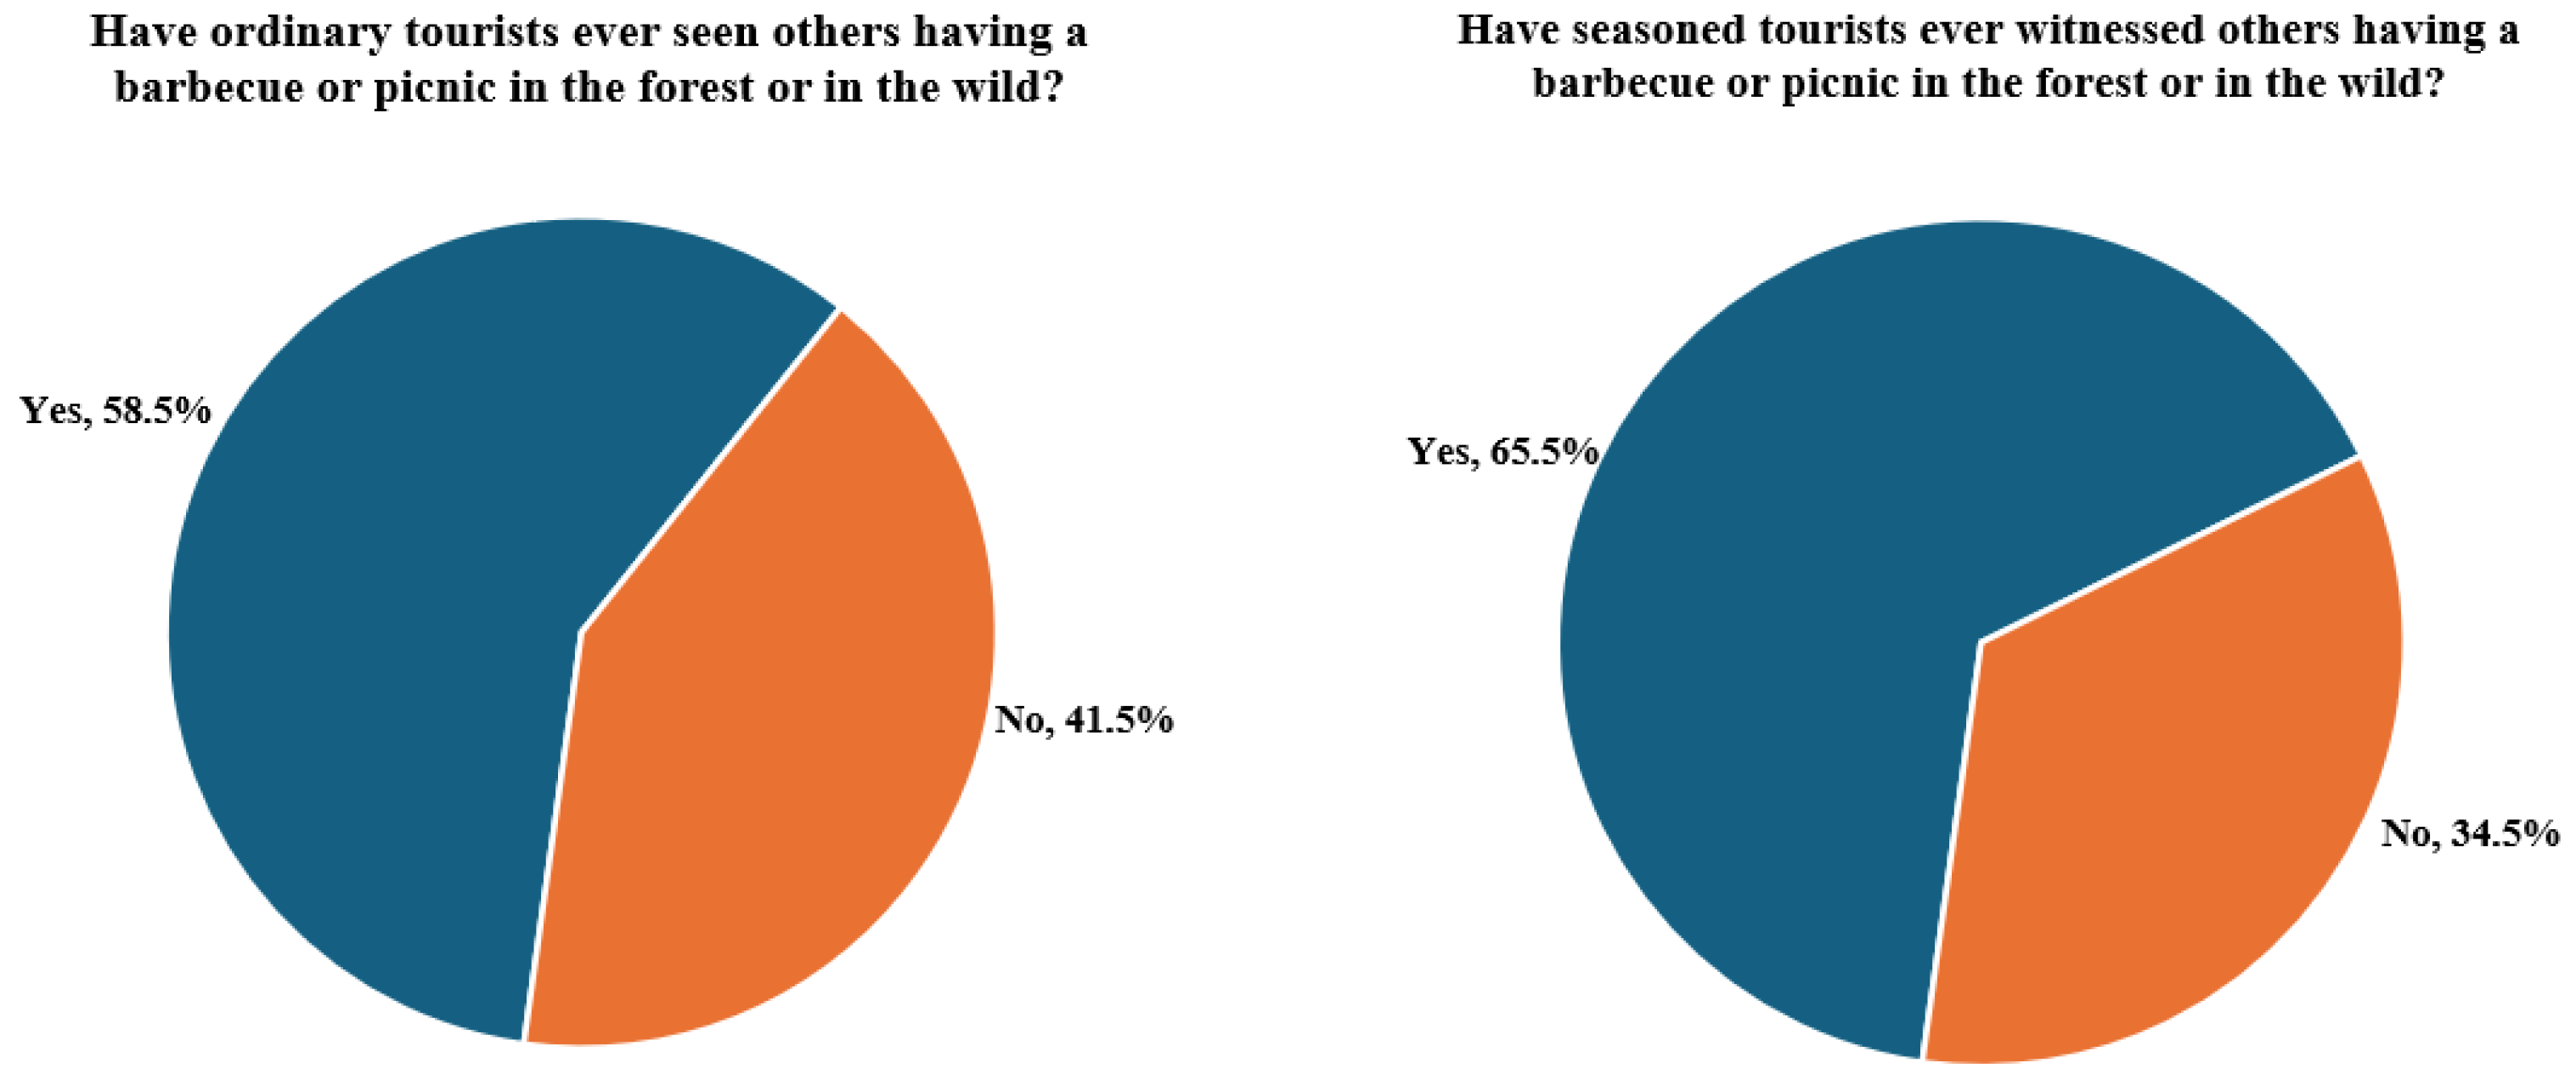
Regarding the control of fire use during tourism, it is suggested to “integrate the risk of fire use by tourists into the entire travel process”. A survey shows that 77.6% of ordinary tourists and 65.0% of experienced tourists choose to travel in autumn, and 75.5% of ordinary tourists and 79.8% of experienced tourists prefer to travel on weekends. A total of 67.5% of experienced tourists will check the fire danger level before departure, and 85.1% obtain route information through Xiaohongshu and Maofenghuo. However, current publicity is mainly concentrated at the entrance to scenic spots, lacking pre-intervention. It is suggested to implement weekend/holiday reservations and flow control for popular routes such as Xiangshan, Fenghuangling, and Jingxi Ancient Road during the high fire danger period from September to October. Physical closure of non-regular entrances should be implemented. At the same time, it is suggested that municipal forest protection departments cooperate with units such as Gaode, Baidu, and Liubolu to automatically push fire danger warnings and fire prevention publicity information when users plan routes in forest areas. Social platforms should also be jointly used to post and highlight the dissemination of content involving open fires such as barbecues and bonfires. By embedding fire prevention publicity into the entire tourist travel chain, passive persuasion is transformed into active guidance, promoting the transformation of the “fire camping” culture.
Figure 14 shows the observed patterns of open fire use during outdoor cooking and camping.
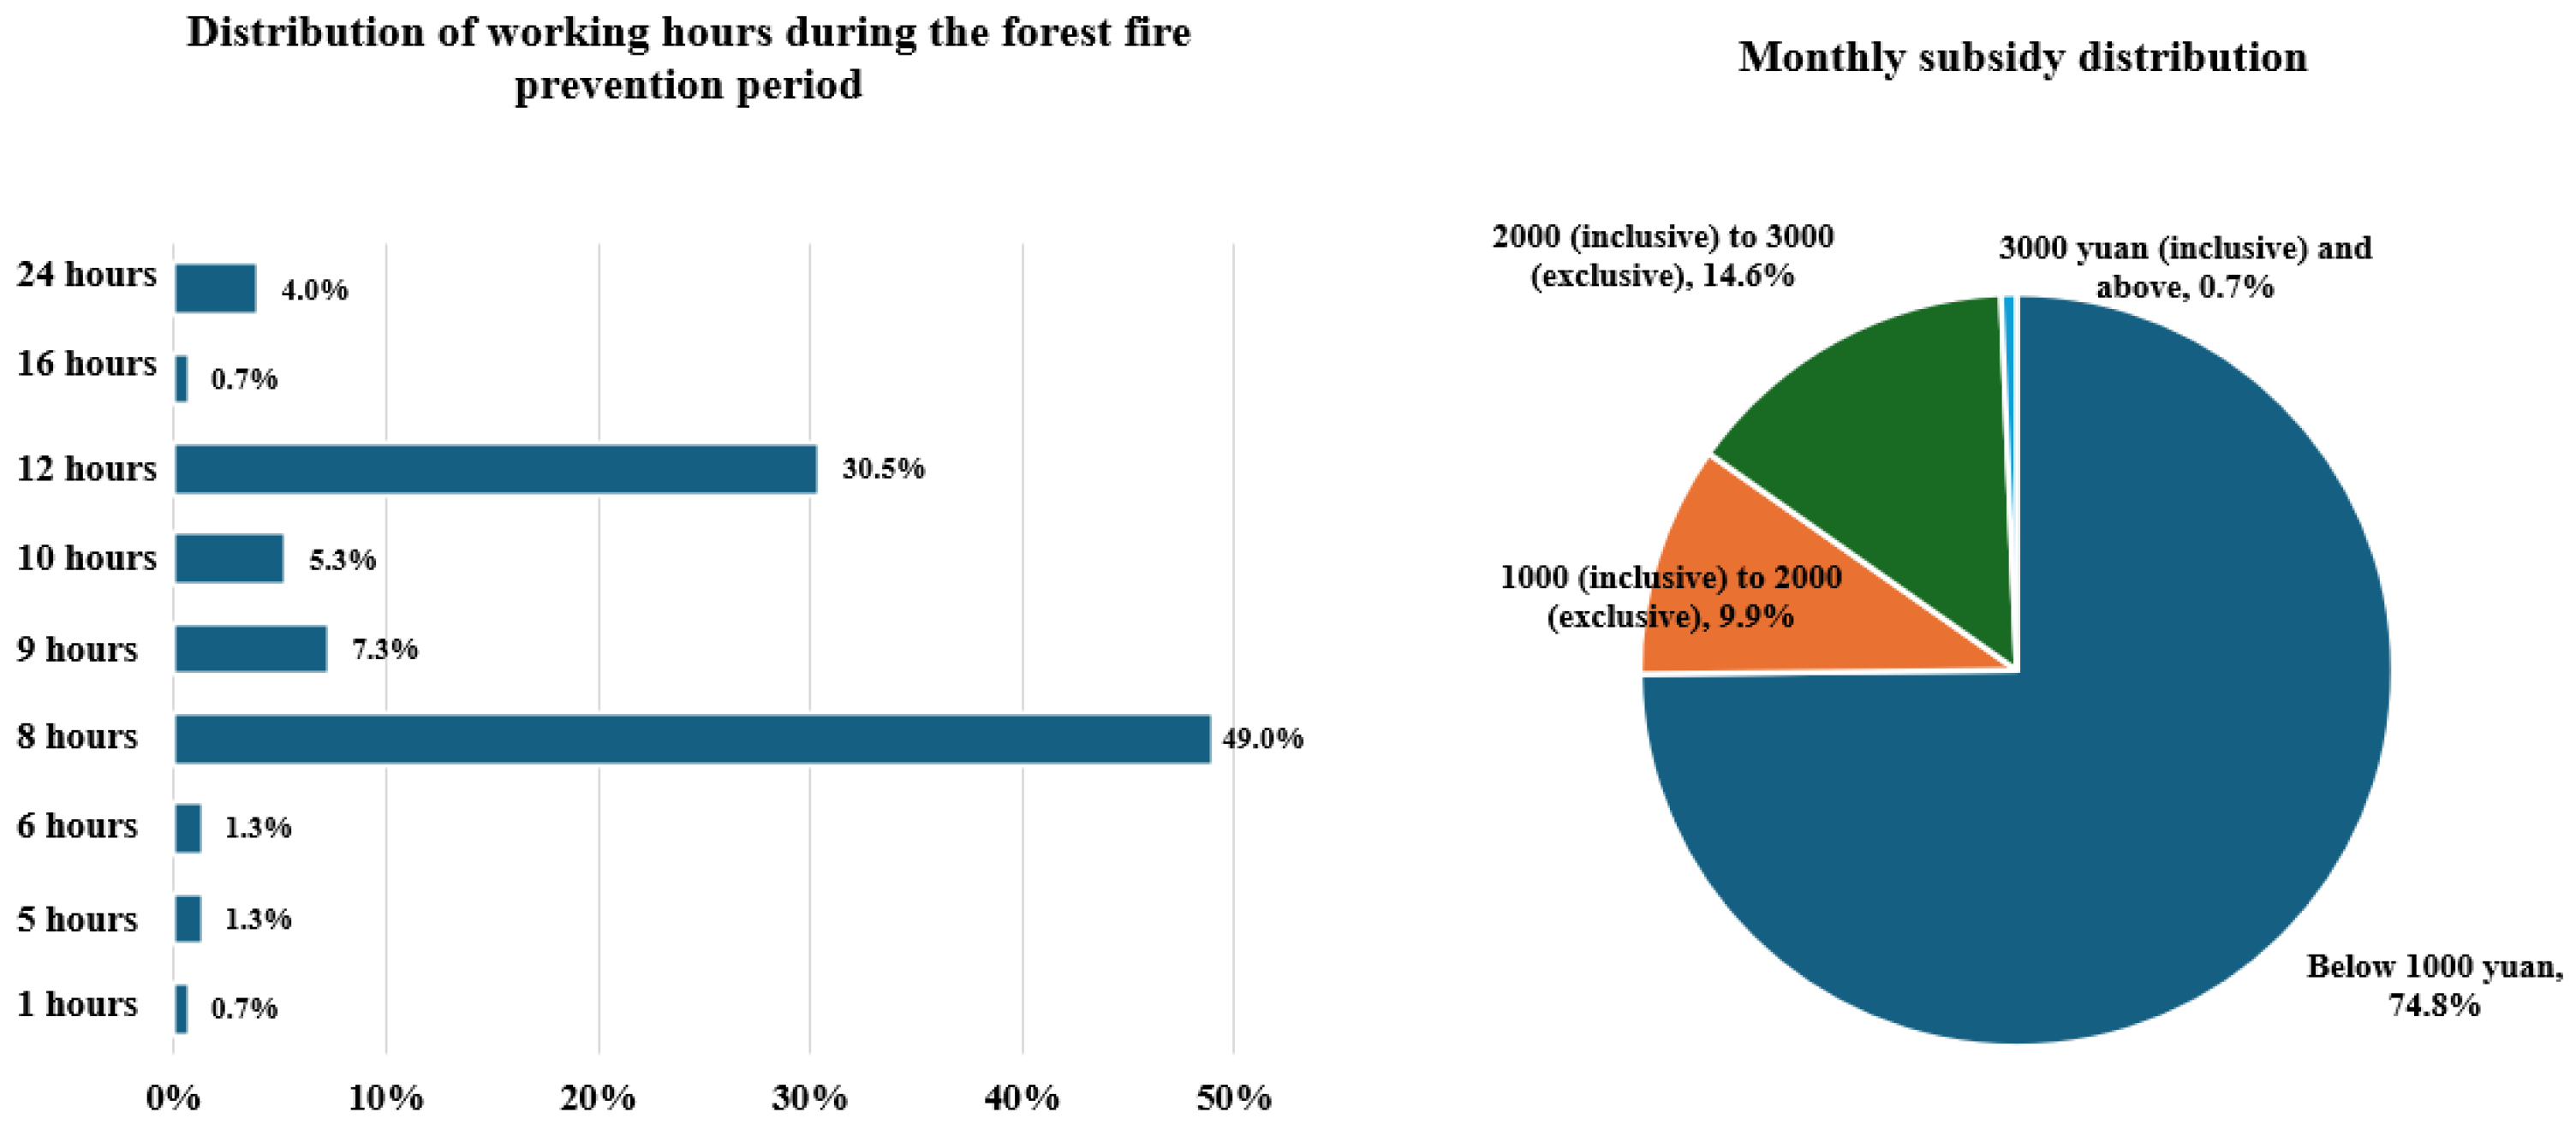
To enhance the prevention and control capabilities, it is suggested to strengthen the foundation of grassroots prevention and control via three aspects: team building, standardization of facilities, and technological empowerment. A survey shows that the forest rangers’ team is severely aging (80.8% are over 51 years old) and has low remuneration (74.8% receive a monthly subsidy of less than 1000 yuan), resulting in “difficulty in recruitment” or “insufficient responsibility”, and they can only undertake the “warning” function. It is recommended to fully implement the professional reform of the forest ranger position, recruit personnel with basic physical fitness and fire prevention knowledge, institute signed labor contracts and incorporate them into the social security system, and increase the forest ranger subsidy. At the same time, it is advised to formulate “village-level forest fire prevention facility configuration standards”, clearly listing the initial disposal tools to be provided at the village level, such as individual equipment, etc., and incorporating the facility configuration into the assessment of the chief forest system to ensure that the responsibility for funds, construction, and operation and maintenance of the facility is assigned to specific individuals. In terms of technological empowerment, it is suggested to promote the construction of an intelligent fire source monitoring system, pilot electronic fences, smoke detection at scattered graves, forest fire publicity robot dogs, personnel sensing monitoring on hiking paths, forest edge and farmland fire prevention video monitoring, APP fire danger information pushing, and load monitoring of old distribution lines along forest paths, etc., to carry out demonstration applications.
Figure 15 shows the workload of forest rangers.
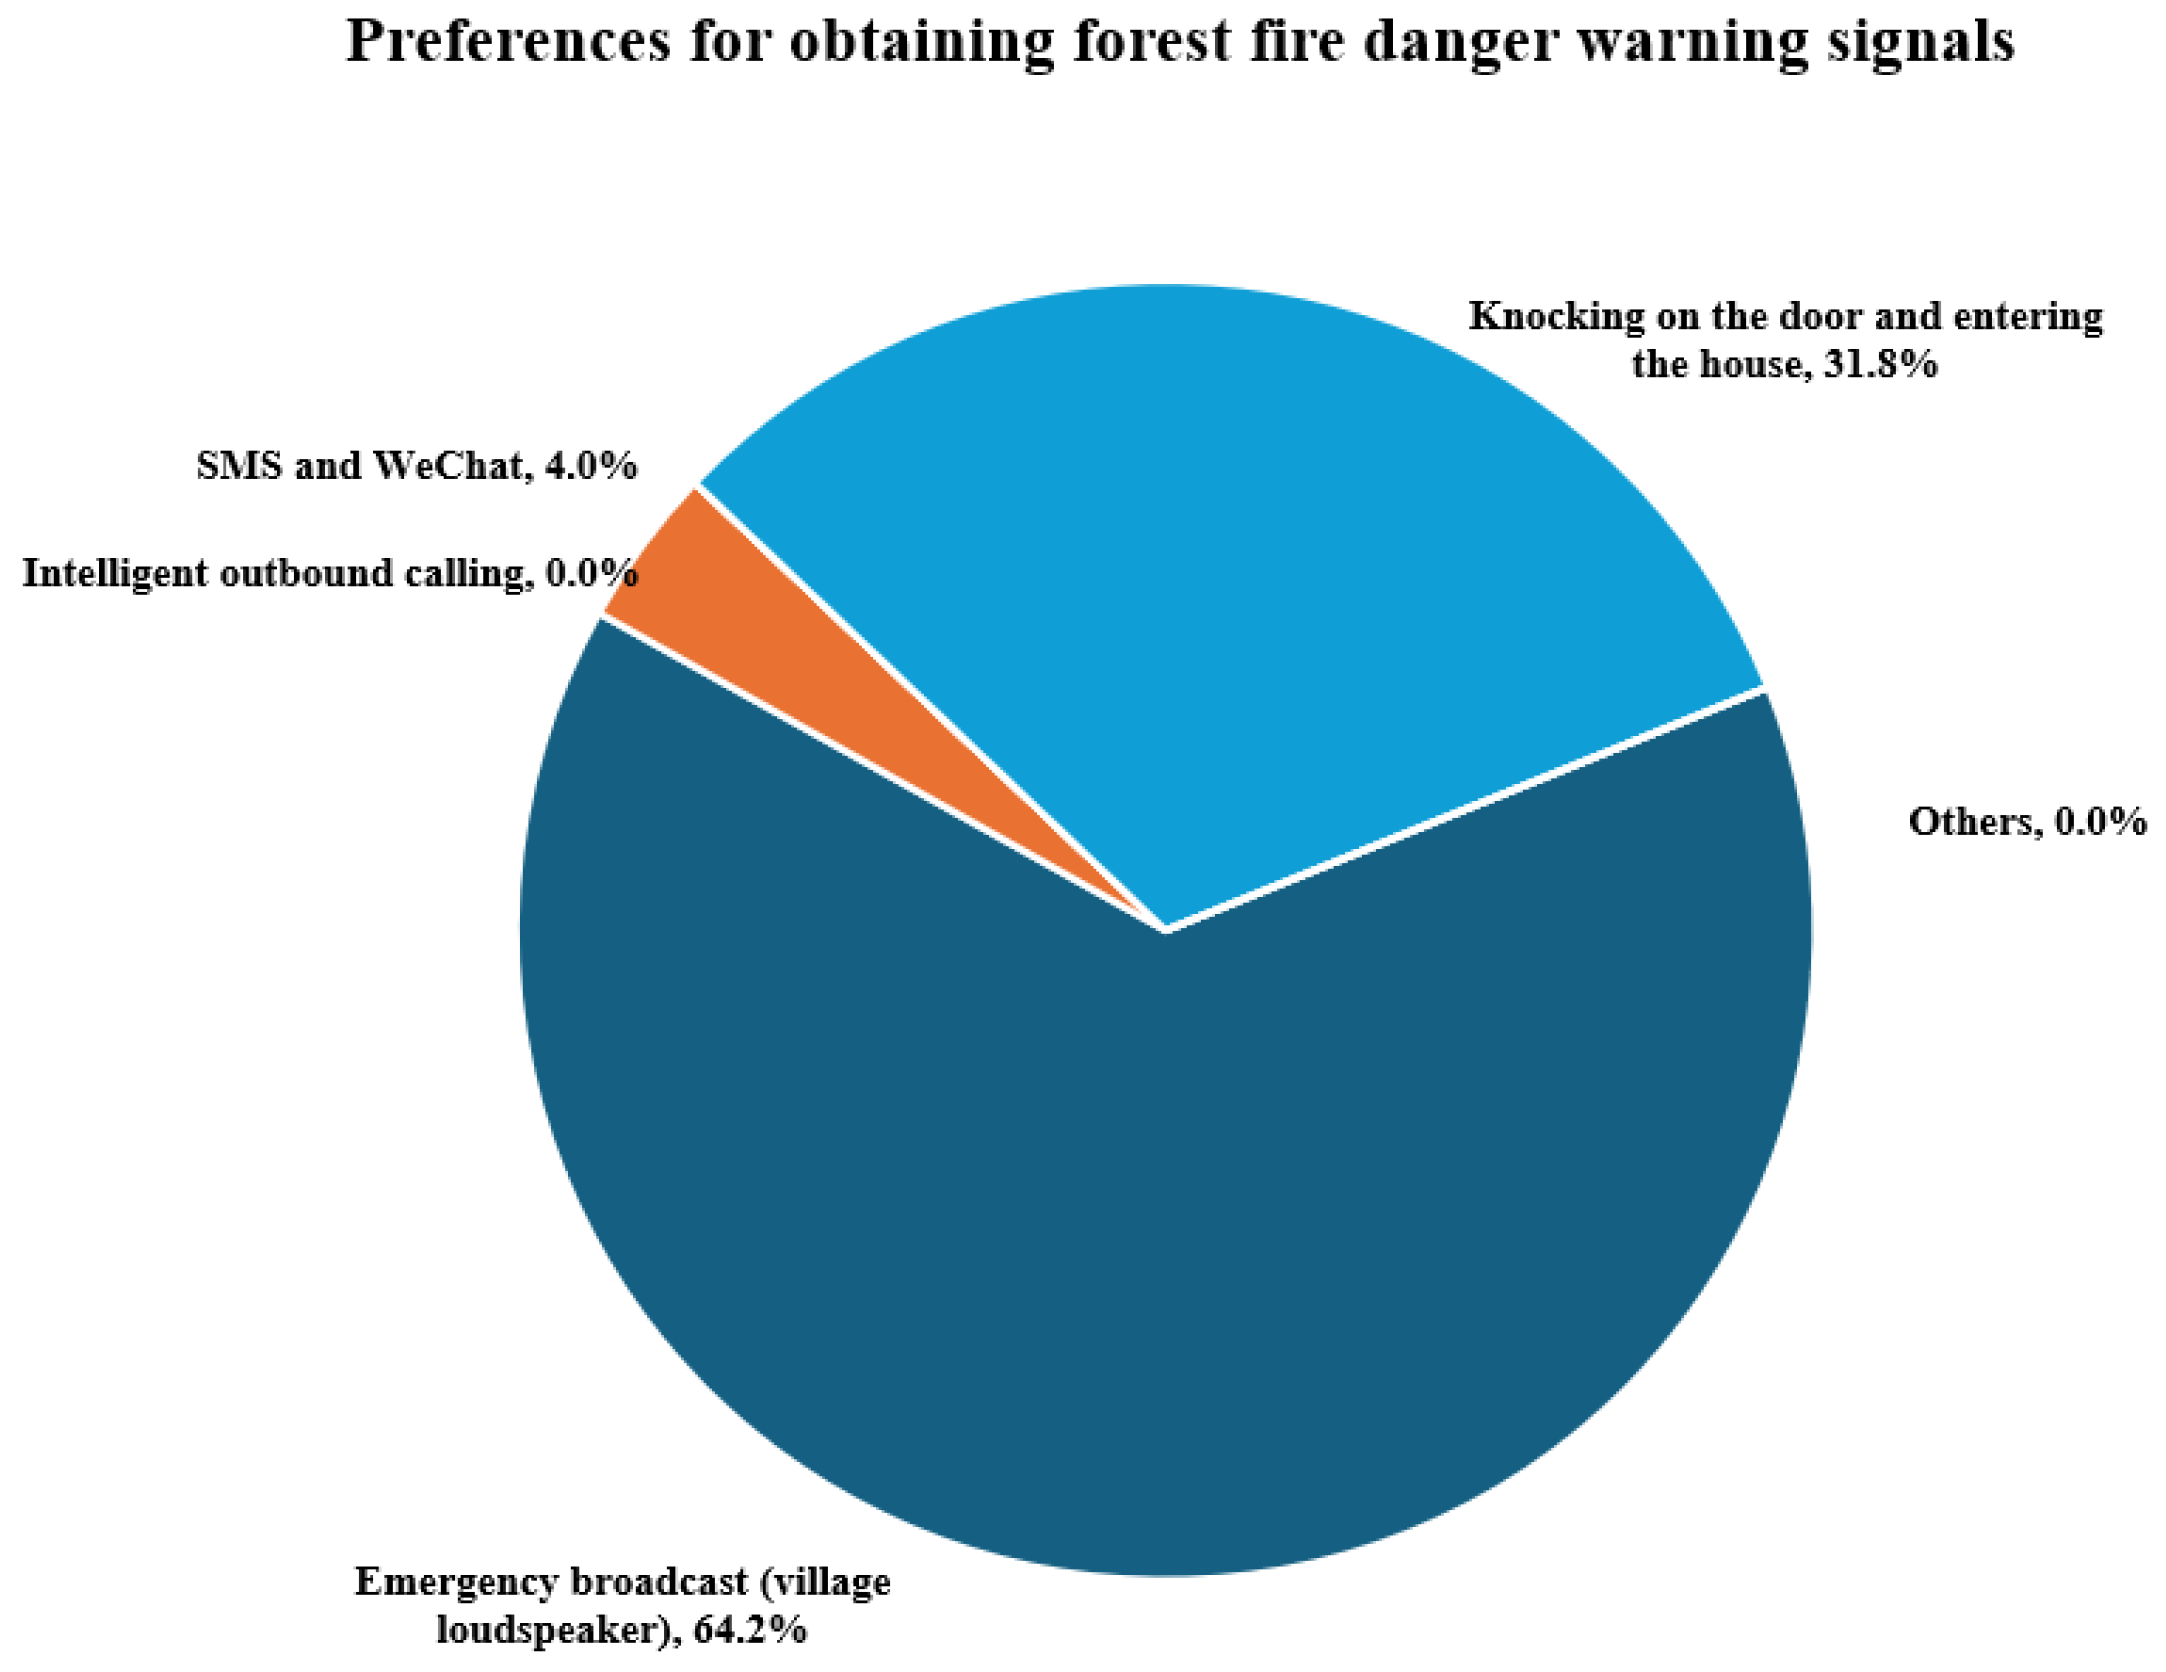
For precise publicity and public education, it is suggested to implement differentiated strategies based on population characteristics. A survey shows that villagers are most willing to accept “science popularization activities organized by the community/village committee” (73.6%) and “the village loudspeaker” (69.3%), and the content should focus on risks of human-caused fire sources (48.4%) and fire hazards (48.1%). Tourists rely heavily on social platforms (85.1% obtain information through Xiaohongshu and Maofenghuo), and they hope to receive publicity reminders before departure (70.5%) and at the entrance of the forest area (61.4%), preferring text messages and WeChat alerts (75.6%) and on-site reminders from park staff (20.7%). For forest rangers, it is necessary to strengthen professional knowledge training regarding topics such as fire classification and laws and regulations. A survey shows that only 24.5% of forest rangers have mastered the correct classification of fire levels. At the same time, 98.3% of villagers, 96.7% of tourists, and 99.3% of forest rangers support including forest fire prevention knowledge in primary and secondary school curricula. It is recommended to promote fire prevention education starting with teenagers and to build a national awareness of fire prevention.
Figure 16 shows the preferences of forest rangers for forest fire danger warnings and fire prevention publicity.
The driving factors of human-induced ignition behaviors within the study area can be divided into four aspects: First, the inertia of traditional agricultural production. Villagers, especially young farmers, view “burning the edge of the field” as a cost-effective and efficient method for clearing farmland. Second, cultural constraints from folk traditions. Fire use for rituals is highly dependent on traditional festivals, and “burning paper” is regarded as an indispensable ritual. Third, the “campfire sentiment” of outdoor leisure culture. Experienced tourists still prefer to use campfires, even when they have knowledge of fire prevention. Fourth, weak supervision. The low remuneration and aging population of forest rangers lead to the ineffective implementation of fire source inspections, and small fire sources such as cigarette butts are difficult to eliminate. These factors together constitute the social ecological foundation of human-caused fire sources.
6.3. Model Limitations and Improvement Directions
The model constructed in this study has achieved good validation results, but it still has certain limitations. At the data level, the sample size of the forest-area construction fire ignition index data is limited. The relevant data indicators included in the risk census only consist of two items. The limitation of the questionnaire survey lies in the fact that respondents may have recall bias or social approval bias, resulting in inconsistency between actual behavior and reported behavior. Therefore, the questionnaire data is only used to reveal the overall trend of behavioral patterns and to assist in parameter setting; it is not used for the precise estimation of fire point density. Future research can adopt passive data collection methods such as GPS tracking and mobile phone signaling behavior traces to obtain more objective indicators of human activity intensity. The tourism fire ignition index relies on mobile phone signaling data, which can well reflect the density of tourist flow in the scenic area, but there is a lack of coverage for people without mobile phones. The phenological index in the fire occurrence condition index uses the NDVI climate baseline, which can eliminate the interference of extreme years, but it may also smooth out the special influence of certain abnormal climate years.
In response to these limitations, future improvement directions mainly include promoting dynamic data updating and model self-learning mechanisms, combining intelligent monitoring equipment to achieve the real-time perception of fire sources, and continuously optimizing model parameters through real-time data feedback. Improvements could also involve exploring a linkage with emergency response systems to achieve a rapid transformation from risk prediction to warning response. When the model identifies high-risk areas, it could automatically trigger the dispatch of inspection tasks and the pre-positioning of emergency forces. At the same time, it is recommended to strengthen basic data collection work; unify the reporting standards for scattered graves, tree–line conflicts, etc., in each area; promote the standardized statistics of construction-fire ignition, special personnel, etc.; and provide a more detailed data basis for model optimization.
7. Conclusions and Prospect
This study established an assessment system for human-caused fire source risks consisting of 4 primary indicators and 19 secondary indicators. It developed sub-item risk models for four main fire sources: agricultural activities, worship ceremonies, tourism, and power distribution lines. It also achieved visualized output of daily risk forecasts. Based on the verification of 22 historical human-caused fire cases, the risk percentile at all ignition points was above 87.8%, indicating a good model identification ability. The research results have been integrated into the forest fire risk monitoring and early warning system of Beijing, supporting its operationalization. Based on the evaluation results, differentiated control measures for different types of fire sources were proposed, providing a refined management approach for human-caused fire sources. The results suggest that the proposed model can provide useful support for identifying human-caused forest fire risks and assisting refined fire prevention management in Beijing. Nevertheless, its broader applicability to other regions and its long-term predictive robustness still require further verification using larger fire-case datasets and independent validation data.
In the future, efforts will be made to update data dynamically and enable model self-learning. Combined with intelligent monitoring equipment, a refined human-caused fire source governance system that is “able to identify behaviors, able to intervene in risks, and able to take actions at the grassroots level” will be constructed, effectively strengthening the ecological security barrier of the capital.