Abstract
This study investigates post-fire vegetation transitions and spectral responses in the Snowstorm Fire (2017) and South Sugarloaf Fire (2018) in Nevada using Landsat 8 Operational Land Imager (OLI) surface reflectance imagery and unsupervised ISODATA classification. By comparing pre-fire and post-fire conditions, we have assessed changes in vegetation composition, spectral signatures, and the emergence of novel land cover types. The results revealed widespread conversion of shrubland and conifer-dominated systems to herbaceous cover with significant reductions in near-infrared reflectance and elevated shortwave infrared responses, indicative of vegetation loss and surface alteration. In the South Sugarloaf Fire, three new spectral classes emerged post-fire, representing ash-dominated, charred, and sparsely vegetated conditions. A similar new class emerged in Snowstorm, highlighting the spatial heterogeneity of fire effects. Class stability analysis confirmed low persistence of shrub and conifer types, with grassland and herbaceous classes showing dominant post-fire expansion. The findings highlight the ecological consequences of high-severity fire in sagebrush ecosystems, including reduced resilience, increased invasion risk, and type conversion. Unsupervised classification and spectral signature analysis proved effective for capturing post-fire landscape change and can support more accurate, site-specific post-fire assessment and restoration planning.
1. Introduction
Wildfires in the Western United States increasingly impact sagebrush ecosystems due to an interplay of climate change and the proliferation of invasive annual grasses, notably cheatgrass (Bromus tectorum), which alter disturbance regimes and increase fuel loads [1,2,3]. These altered fire regimes disrupt native plant communities, heighten soil erosion, reduce vegetation cover, and degrade essential ecosystem structures, leading to diminished biodiversity and compromised ecological services [4,5,6]. The recurrent fire–invasion feedback loop further exacerbates habitat loss and fragmentation, intensifying challenges for sagebrush-dependent wildlife [7]. Consequently, there is an urgent need to assess post-fire landscape changes to inform adaptive management, restore degraded areas, and combat the invasive species cycle, all critical for sustaining ecosystem resilience in the face of ongoing climatic and anthropogenic pressures [8,9,10].
Remote sensing technologies enable continuous monitoring over extensive areas and prolonged periods by using satellite and aerial imagery to capture temporal variations in fire-affected landscapes [11,12]. Such platforms deliver repeatable, high-resolution data that are essential for documenting post-fire vegetation dynamics, soil changes, and burn severity [13]. Standard vegetation indices, while useful for summarizing greenness or burn severity (e.g., via normalized differences), are limited by their narrow focus on a few spectral bands. Incorporating full spectral signatures leverages the complete range of reflected wavelengths, thus capturing subtle biochemical, structural, and moisture-related variations in vegetation and soils that traditional indices might overlook [14,15]. These detailed spectral insights facilitate a more nuanced understanding of the immediate and long-term ecological recovery processes, providing critical information for land management and restoration initiatives [16].
Remote sensing reveals that wildfire events produce characteristic spectral shifts across surface components. Post-fire vegetation commonly exhibits a reduction in red and near-infrared reflectance due to the loss of chlorophyll and structural integrity, while shortwave infrared reflectance may increase owing to changes in moisture content and the formation of char [15,17]. Ash and bare soils display unique spectral signatures distinguishable from surviving vegetation; these include specific absorption and reflectance features not captured by conventional indices [17]. By analyzing full spectral signatures rather than relying solely on vegetation indices such as NDVI or dNBR, researchers can differentiate between subtle biophysical changes such as varying degrees of combustion, residual char, and moisture alterations that indicate burn severity [18]. This comprehensive spectral approach thus enables a more precise assessment of fire-induced ecological impacts, including vegetation mortality, soil alteration, and erosion risk, thereby providing critical insights for effective post-fire management and landscape restoration [19].
Supervised or Unsupervised Image classification can be carried out to distinguish subtle changes in vegetation spectral signatures and identify the biophysical changes happening [12]. Supervised classification requires training datasets for identifying changes and patterns to changes. An example of supervised classification is the LANDFIRE EVT dataset, developed using ground-referenced plot data and Landsat imagery. The dataset is static and is available at periodic intervals, due to which it is moderately effective in depicting broad post-fire vegetation and surface changes and may not capture immediate changes happening due to fire [20]. In contrast, unsupervised classification of full spectral signatures, such as through iterative spectral mixture models, can reveal subtle differences in burned surfaces identifying variations in char, ash, and vegetation recovery and can be applied to observe immediate changes happening post-fire [21]. This spectral approach enables a detailed and dynamic mapping of burn severity and ecological impacts with no prior training dataset and is ideal for scenarios like wildfires where prior datasets of vegetation types are scarce, thereby offering valuable complementary insights for post-fire management and land restoration initiatives.
The study aims to assess the changes in surface spectral signatures before and after wildfire events using Landsat imagery. The study utilizes unsupervised classification to isolate unique pre-fire and post-fire classes and compare changes in their spectral signatures by utilizing publicly available datasets. We anticipate the identification of novel spectral classes associated with fire severity and vegetation recovery, and we analyze these to trace vegetation transitions post-fire.
2. Literature Review
Remote sensing studies typically employ spectral indices such as the NDVI, NBR, dNBR, and Relativized Burn Ratio (RBR) to assess fire severity and monitor post-fire changes [22,23]. NDVI is widely used to indicate vegetation greenness and health, whereas NBR and its derivative dNBR emphasize changes in NIR and SWIR bands, which respond strongly to fire-induced alterations in vegetation structure and moisture content. RBR similarly leverages relative differences to delineate burned from unburned areas. Together, these indices have proven effective in capturing the spatial extent and intensity of fire impacts by highlighting areas of vegetation loss, soil exposure, and char formation [22].
Despite their strengths, these indices have notable limitations. In landscapes characterized by mixed vegetation types or low severity burns, the index values can be ambiguous because the spectral responses from residual green vegetation, recovering shrubs, and exposed soils may overlap [15,24]. While NDVI is effective in quantifying overall greenness, it may challenge and discern subtle changes in combustion completeness, whereas NBR and dNBR are sensitive to abrupt changes in the SWIR bands; their performance is compromised when the burned signal is diluted by adjacent unburned patches [15,25]. Consequently, the reliability of these indices in indicating actual ecological or surface condition changes can be reduced in heterogeneous or low-intensity fire regimes.
In contrast to index-based methods, direct analysis of spectral reflectance values in individual bands provides a more nuanced interpretation of biophysical changes post-fire. After a wildfire, reflectance in the NIR region typically declines due to the loss of healthy vegetation, whereas SWIR reflectance often increases because of reduced moisture levels, increased exposure of ash, and the presence of charred material [24]. These spectral shifts effectively reveal critical information about surface characteristics, declining NIR reflectance signals reduced canopy density, and elevated SWIR reflectance indicates soil exposure and combustion residues. Studies that have compared pre- and post-fire spectral signatures, such as those by [22,24], underscore the importance of analyzing the full spectral profile rather than relying solely on composite indices. Such analyses capture subtle changes related to fire-induced transformations in soil chemistry, vegetation structure, and moisture dynamics that may otherwise be overlooked by indices focused on discrete spectral bands [22,24].
The LANDFIRE Existing Vegetation Type (EVT) dataset is a key product within the LANDFIRE suite developed using supervised classification techniques, which provides a thematic classification of vegetation types derived from a combination of ground-based measurements and remotely sensed imagery [20]. This dataset is widely employed in vegetation and disturbance studies to characterize pre-fire landscape composition and assess post-fire vegetation changes. However, while the EVT dataset is valuable for mapping broad vegetation patterns, its moderate spatial resolution and periodic temporal resolution limits its responsiveness to the rapid and heterogeneous changes that occur immediately after disturbances such as wildfires [20,26]. Although some studies have cross-validated EVT classifications with spectral indices like NDVI and other index-based evidence, challenges remain in accurately capturing the nuanced and transient changes in vegetation condition following fire [20,26]. These limitations are partly due to the time lag between when remote sensing datasets are updated and when post-disturbance dynamics unfold, as well as difficulties in assigning single thematic categories to areas characterized by mixed or transitional vegetation states.
There is a notable gap in research that directly compares spectral signatures of land cover classes before and after fire events in the most timely and economically efficient way. This gap arises partly because most studies focus on readily computed indices rather than the full spectral information, which requires higher spectral resolution data and more sophisticated analytical techniques [24]. Addressing this gap require research approaches that enhance our understanding of ecological resilience and inform more responsive management practices by linking detailed spectral changes to vegetation recovery, soil degradation, and ecosystem service loss that are readily available [20,22,25]. This study contributes to addressing these gaps by applying ISODATA-based classification to pre- and post-fire Landsat 8 surface reflectance imagery in Elko County, Nevada. It evaluates classification sensitivity across multiple clustering parameter sets and validates results using a confusion matrix and accuracy metrics derived from proxy reference data. The analysis aims to provide insight into the nature and distribution of post-fire land cover change in this ecologically vulnerable region.
3. Study Area and Data
The analysis centers on two significant wildfire events in Nevada: The Snowstorm Fire (2017) and the South Sugarloaf Fire (2018). The Study Area subsection details these fire events and their ecological attributes, while the Data subsection outlines the datasets employed, emphasizing their significance in evaluating post-fire vegetation recovery.
3.1. Study Area
The Snowstorm Fire ignited on 15 July 2017, burning a total of 62,554 hectares (154,575 acres) before being contained on 5 August 2017. The study area experiences an average annual temperature of 8 °C (46 °F) and receives approximately 698 mm of precipitation annually. Prior to the fire, the region had an aridity index of 0.43. The dominant vegetation types include the Columbia Plateau and Grassland, Inter-Mountain Basins Big Sagebrush Steppe, Inter-Mountain Basins Big Sagebrush Shrubland, and Great Basin & Intermountain Introduced Annual and Biennial Forbland. The area has a history of wildfire activity, notably the Winters Fire in 2006, which burned 96,577 hectares (238,648 acres).
The South Sugarloaf Fire, caused by lightning on 17 August 2018, burned 94,538 hectares (233,608 acres) before containment on 10 October 2018. It is characterized by shrubland and coniferous vegetation with an annual precipitation of 344 mm, an average temperature of 8 °C (46 °F), and an aridity index of 0.2. Figure 1 provides fire perimeters of both the fires and establishes their proximity to each other.
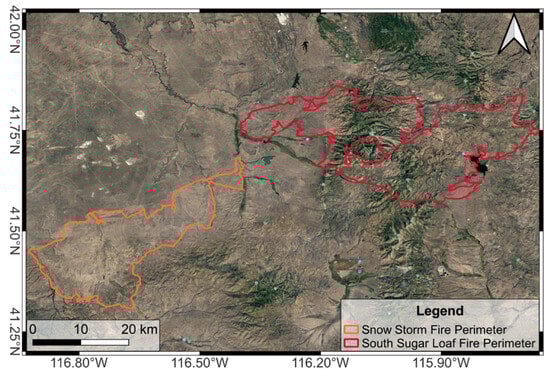
Figure 1.
Fire perimeter of the Snowstorm Fire and South Sugarloaf Fire with respect to each other’s spatial location.
3.2. Data
Landsat 8 OLI imagery was used to develop clusters from ISODATA algorithm, incorporating the red, green, blue, NIR, and SWIR bands as input features for unsupervised classification. The Landsat 8 Level 2 imagery, which was radiometrically and atmospherically corrected, was utilized having a resolution of 30 m × 30 m across every band. The Landfire Existing Vegetation Type (EVT) was used to classify the clusters obtained from ISODATA classification. LANDFIRE’s EVT dataset provides detailed vegetation classifications based on ecological systems, life forms, and dominant species, making it a valuable reference for vegetation classification and baseline vegetation mapping. ISODATA was combined with LANDFIRE EVT classification in QGIS 3.28.8; this integration enabled the accurate classification of vegetation types and baseline vegetation mapping as detailed in methodology below.
4. Methodology
This section outlines the methodological framework employed to assess wildfire-induced vegetation changes using satellite remote sensing and ecological classification data. It details the acquisition and preprocessing of Landsat 8 imagery, the implementation of unsupervised ISODATA classification to delineate spectral land cover classes, and the extraction of spectral signatures for class comparison across time. Additionally, it utilizes the LANDFIRE Existing Vegetation Type (EVT) data and spectral signatures to label vegetation dynamics extracted from ISODATA pre-fire analysis and identify the vegetation classes. A summary of the flowchart is provided in Figure 2. While utilizing coarse resolution spectral imagery like Landsat 30 m can be debated for not being able to provide as detailed information as UAV, they are readily available and integrating with ISODATA techniques would provide more nuanced understanding of post-fire events than applying spectral indices in the most time- and cost-efficient way.
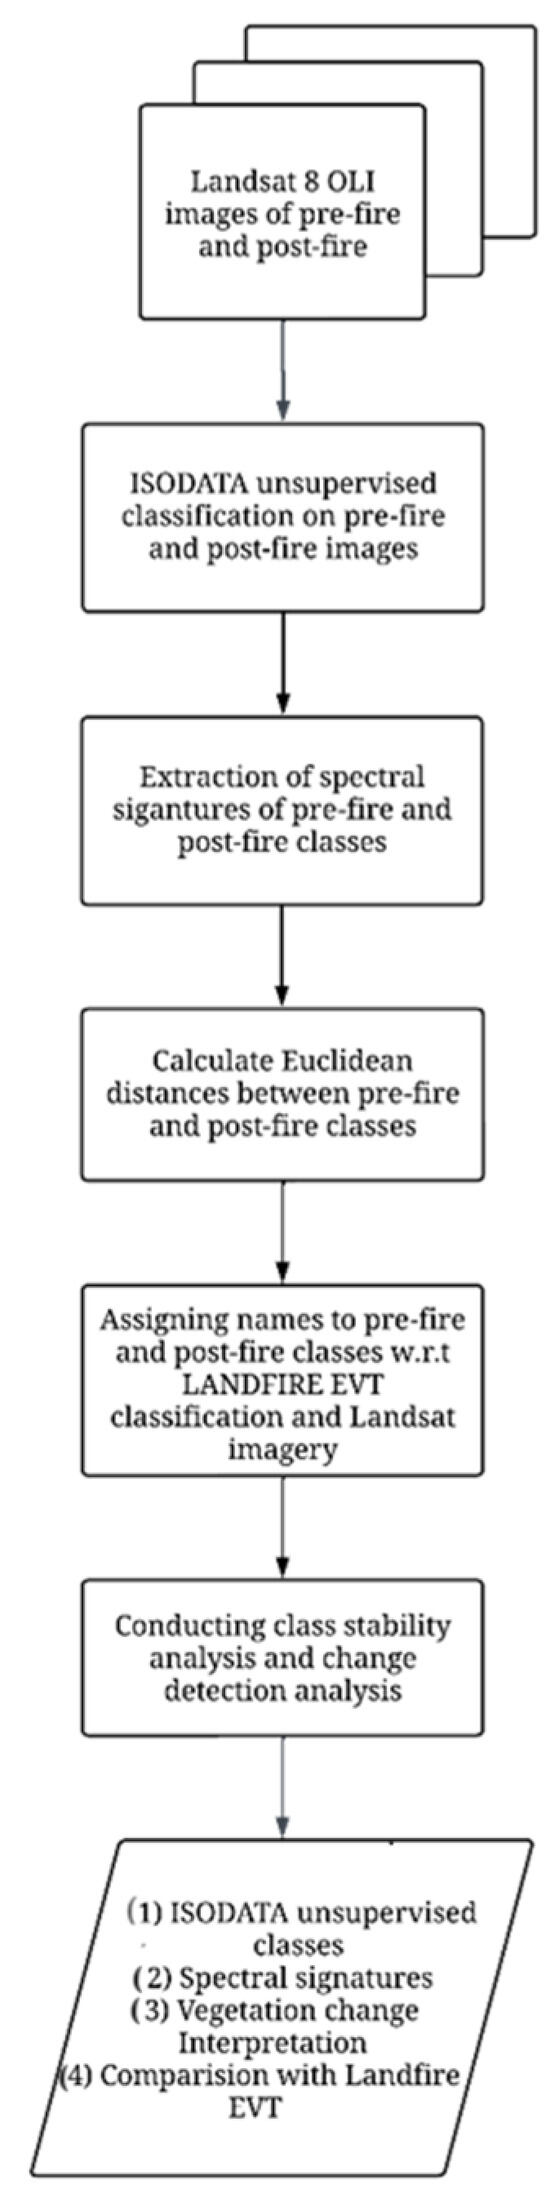
Figure 2.
Flowchart illustrating the methodological framework, including data collection, preprocessing, and statistical analysis.
4.1. Data Collection and Preprocessing
This study employed Landsat 8 tier 2 surface reflectance imagery to examine pre- and post-fire vegetation conditions within the South Sugarloaf and Snowstorm fire perimeters in Nevada. Image processing was performed using Google Earth Engine platform, where image was already processed with atmospheric corrections. Median seasonal composites were generated from cloud-free images acquired between May and August, corresponding to peak vegetation activity in the region. This period corresponds to the peak vegetation activity in the region, when phenological signals are most pronounced and inter-class spectral differences are maximized creating a composite of greenness, vigor, and photosynthetic activity during the vegetation peak of the growing season. Compositing over this window also helps minimize the influence of short-term anomalies, sensor noise, or residual atmospheric contamination [27,28,29,30]. Cloud masking was applied using the quality assurance bands to exclude pixels affected by cloud cover or shadows and only images with zero cloud cover and shadow were considered for analysis. For each fire, the 2016 composite represented pre-fire conditions, while the 2019 composite captured post-fire conditions. All spectral bands from the Operational Land Imager (OLI) sensor were retained to allow for a comprehensive spectral characterization of land cover.
4.2. Unsupervised Classification with ISODATA
The ISODATA analysis was implemented in MATLAB R2023b using the Image Processing Toolbox and Mapping Toolbox within the MATLAB environment. Landsat 8 surface reflectance imagery was first imported and stacked into multi-band arrays, with each image clipped to the respective fire perimeter to isolate the affected area. Pixels with NoData values or located outside the fire boundary were masked out to ensure valid inputs. The imagery was reshaped into a two-dimensional array where each row represented a pixel, and each column corresponded to a spectral band. A custom-scripted ISODATA routine, based on the clustering framework outlined by [31], was employed to perform unsupervised classification. Initial cluster centers were randomly assigned for a minimum of ten clusters, with the algorithm iteratively updating cluster membership based on spectral distance. The clustering process included automated splitting of clusters exhibiting high internal variance and merging of clusters that fell below a predefined spectral separation threshold. Iterations continued until centroid shifts stabilized or the maximum iteration limit was reached.
A sensitivity analysis was conducted with different iterations of ISODATA classification parameters calculating within-class spectral variance, between-class spectral variance, and pair wise Euclidean distances. The optimal clustering solution was selected based on the configuration that produced the lowest within-class variance and highest between-class variance, indicating strong class cohesion and separability suitable for post-classification analysis.
To evaluate classification accuracy, a confusion matrix was constructed by comparing ISODATA-derived class labels with manually interpreted reference data from high-resolution imagery and LANDFIRE vegetation maps. From this, standard classification metrics including overall accuracy, user’s accuracy, and producer’s accuracy were calculated. The classified outputs were exported as georeferenced raster files for subsequent analysis of spectral separability and vegetation dynamics.
4.3. Spectral Signature Extraction and Class Comparison
Following classification, the mean spectral signature and standard deviation of each class was computed by averaging reflectance values across all Landsat bands. These mean signatures were used to characterize the spectral behavior of each class in both timeframes. To identify corresponding land cover classes across time, Euclidean distances were calculated between every pair of pre- and post-fire class signatures. Classes exhibiting the smallest spectral distance were considered analogous, allowing for relative comparisons between pre- and post-disturbance conditions. This method enabled the identification of changes in land cover composition and severity of fire-induced transformations.
To quantify temporal class persistence and change, a class stability matrix was computed by performing a pixel-by-pixel comparison of the classified raster outputs from the pre-fire and post-fire periods. For each spatial location, the ISODATA class assignment in the pre-fire image was compared to the corresponding post-fire assignment. The matrix tabulates the number of pixels that retained their original class versus those that transitioned to a different post-fire class, providing a quantitative measure of land cover stability and post-fire transformation intensity.
The extracted classified maps and the 2016 LANDFIRE EVT maps were imported into QGIS 3.2.8 and aligned using a common coordinate reference system to ensure accurate spatial overlay. The classified ISODATA maps were overlaid on top of the EVT vegetation layer with partial transparency to allow direct visual comparison of spatial patterns. Using the Identify Features tool, representative regions from each ISODATA class were examined to determine their underlying EVT class codes. This step was combined with the analysis of spectral signatures from the classified maps to assist in interpreting which ISODATA class corresponded to which vegetation type. The process enabled the assignment of baseline vegetation types to each ISODATA class by matching both spatial overlap and spectral characteristics.
5. Results
The following section presents the outcomes of spectral classification and vegetation change analysis across the Snowstorm Fire and South Sugarloaf Fire areas. It highlights pre-fire and post-fire class distributions, spectral signature shifts, and the emergence of new land cover types, providing insights into the extent and nature of post-fire landscape transformations.
5.1. South Sugarloaf
5.1.1. Spectral Signature
Sensitivity analysis of the ISODATA clustering outputs was conducted to determine the most stable and spectrally distinct configuration for both pre- and post-fire classifications. For both pre- and post-fire, the ISODATA classfication model after sensitivity analysis selected had the final clustering parameters as follows:
- Number of clusters: 10
- Minimum class size: 30 pixels
- Maximum allowable standard deviation within class: 0.05
- Merge distance threshold: 0.05 (Euclidean distance)
For pre-fire, the between-class spectral variance was 0.0017 whereas for post-fire, it was 0.0015; none of the classes in both the model have a within class spectral variance greater than 0.0007. These models provided consistent and interpretable class boundaries, forming the basis for spectral signature analysis, spatial comparison, and class transition assessment.
The mean spectral signatures for pre-fire and post-fire ISODATA classes exhibited distinct reflectance patterns across the Landsat 8 OLI bands (Bands 2–7). The pre-fire category exhibited five distinct classes within the imagery, whereas post-fire exhibited seven classes. Analysis indicates that post-fire scenario 4 classes were consistent with pre-fire classes, meaning that an additional three classes from the post-fire imagery were obtained. The classes matched together through Euclidean distances are illustrated in Table 1. The classes were matched with each other by calculating Euclidean distance and the class with lowest Euclidean distances was considered to be similar, as illustrated in Table 2.

Table 1.
Mapping of closest Euclidean distances for unsupervised pre-fire and post-fire spectral classes for South Sugarloaf Fire.
Table 2.
Euclidean distance matrix for pre-fire and post-fire classes computed from mean spectral signatures for South Sugarloaf Fire. Closest Euclidean distances are indicated in bold face.
The post-fire class B, E, and G had the highest Euclidean distance to all the classes and were considered to be new classes with spectral signatures distinct enough to represent post-fire transformation. Classes 1 and 2 were found to be transitioning into Class C based on calculated Euclidean distances, while the Pre Class 1 and Post Class A and Class C had near-to-Euclidean distances; their spectral significance were high and, considering Pre Class 5 had the lowest Eucliden distance in Post Class A column, it was matched with it. The classes were mapped and based on Landfire 2016 EVT vegetation classification and Landsat 8 imagery, the pre-fire classes were distinguished and named. The vegetation classification is described in Table 3.
Table 3.
LANDFIRE vegetation types and corresponding physiognomies associated with each spectral class derived from unsupervised classification for pre-fire.
The spectral signatures in the pre-fire scene (Figure 3) Grassland showed the highest reflectance in the Near-Infrared (NIR) band (865 nm), reaching approximately 0.315, followed by Herbs-Shrubs Mix and Conifers. Conifers displayed a marked decrease in reflectance beyond the NIR band, with values dropping to approximately 0.087 in the SWIR2 region (2200 nm). Conversely, Herbs-Shrubs Mix maintained the highest reflectance in the SWIR1 band (1610 nm), peaking at around 0.32.
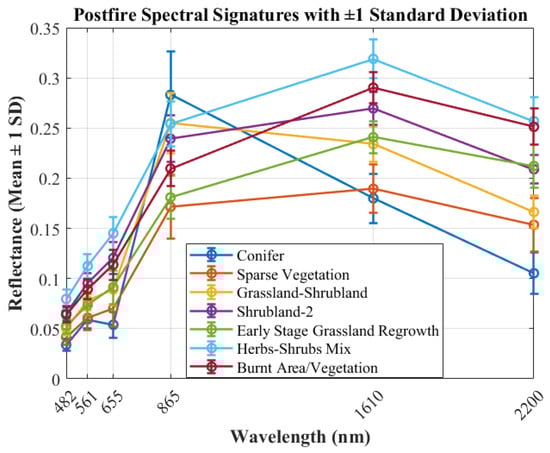
Figure 3.
Mean spectral reflectance curves of pre-fire vegetation classes derived from unsupervised classification of Landsat imagery.
The ±1σ analysis (Table 4) reveals that, while Grassland and Herbs-Shrubs Mix overlap in the visible bands (Blue and Green), they remain distinctly separable in the SWIR1 and SWIR2 bands with no overlap between Grassland and Herbs-Shrubs Mix. Conifer, although spectrally subdued, shows a distinct drop in SWIR2 (0.062–0.102), ensuring clear separation from Grassland and Herbs-Shrubs Mix in that band despite partial overlap elsewhere.
Table 4.
Pre-fire spectral reflectance statistics by vegetation class for Landsat bands, reported as mean reflectance and ±1 standard deviation.
A notable challenge appears between Shrubland-1 and Shrubland-2, which display substantial overlap across nearly all bands, particularly in Green and NIR. However, Shrubland-2’s slightly higher SWIR1 reflectance offers a narrow window of distinction from Shrubland-1, mitigating some of the misclassification risk. Overall, while there are overlaps in many bands, the existence of at least one non-overlapping band per class ensures that these vegetation types can still be effectively distinguished in classification.
In the post-fire classes, Classes B (Sparse Vegetation), E (Early-Stage Grassland Regrowth), and G (Burnt Vegetation) emerged as new spectral clusters, indicating potential changes in vegetation structure or surface condition following the fire, whereas pre-fire Class 1 and Class 2 transitioned into post-fire Class C, indicated as Grassland–Shrubland. The spectral signatures of post-fire classes is depicted in Figure 4.
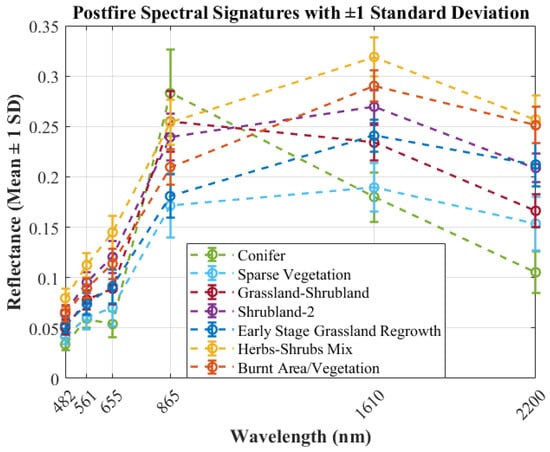
Figure 4.
Mean spectral reflectance curves of post-fire vegetation classes derived from unsupervised classification of Landsat imagery.
Class G exhibited the highest overall reflectance, peaking near 0.30 at 1610 nm (SWIR1) and maintaining elevated reflectance across all bands. The ±1σ ranges show no overlap with Sparse Vegetation or Early-Stage Grassland Regrowth, confirming its distinctiveness and suggesting minimal risk of confusion (Table 5). This spectral pattern, particularly the strong response in the NIR and SWIR regions, suggests the presence of highly reflective exposed surfaces, potentially representing post-fire bare ground, residual ash, or dried herbaceous vegetation with minimal canopy coverage.
Table 5.
Post-fire spectral reflectance statistics by vegetation class for Landsat bands, reported as mean reflectance ±1 standard deviation. Vegetation classes: Conif. (Conifer), Sparse Veg. (Sparse Vegetation), Grass-Shrub (Grassland–Shrubland), Shrub-2 (Shrubland-2), Early Grass Reg. (Early-Stage Grassland Regrowth), Herb-Shrub Mix (Herbs-Shrubs Mix), and Burnt/Grass (Burnt Area/Vegetation Grassland).
Class E displayed a relatively flat spectral profile with moderate reflectance in the visible bands, an NIR peak of approximately 0.17, and a continuous decline toward the SWIR2 region. The overlap analysis indicates significant convergence with Sparse Vegetation in the visible bands (e.g., Green: Early Stage 0.091–0.124; Sparse Vegetation 0.070–0.073), but Early Stage maintains a distinct higher response in SWIR1 (0.257–0.339) compared to Sparse Vegetation (0.165–0.214). This clear separation ensures reliable classification despite overlap in other bands, supporting the interpretation of sparse or early-stage regrowth, likely associated with recovering grasses or low shrubs.
Class B demonstrated the lowest reflectance values among all post-fire classes, particularly in the NIR and SWIR2 bands, suggesting the presence of degraded or thin vegetation cover, possibly representing burned residuals or minimally recovered patches with limited vegetation structure. However, its Blue band (0.034–0.040) remains distinct from most other classes, especially Herbs-Shrubs Mix (0.070–0.112), ensuring separability. While Class B does overlap with Burnt Area/Vegetation and Sparse Vegetation in NIR and SWIR, the presence of at least one distinct band supports its differentiation in classification. The overlap assessment emphasizes that, although many classes show partial or full overlap in certain bands, every class retains at least one band where it is distinct from others, reducing the risk of systematic misclassification.
5.1.2. Vegetation Classification
Pre-fire classification (2016) resulted in five distinct classes across the South Sugarloaf Fire area. Shrubland-2 was the most spatially dominant, occupying 34.33% of the landscape. This was followed by Herbs-Shrubs mix (25.56%), Shrubland-1 (20.28%), and Grassland and Conifer, which accounted for 9.85% and 9.99%, respectively.
Post-fire classification (2019) identified seven classes. All original classes decreased in extent, particularly Shrubland-2, which dropped from 34.33% to 21.20%, and Herbs-Shrubs mix, which declined from 25.56% to 10.95%. Conifer also showed reductions from 9.98% to 7.90%. Four new spectral classes emerged post-fire: Sparse Vegetation (12.78%), Early-Stage Grassland Regrowth (19.83%), Burnt Area/Vegetation (12.80%), and Grassland–Shrubland (14.53%). Notably, a substantial portion of Shrubland-1 transitioned into Grassland–Shrubland, rather than persisting as a separate class.
Together, the new classes accounted for 59.94% of the post-fire classified area. These classes appeared concentrated within the central and southeastern portions of the fire perimeter, indicating extensive structural and spectral changes following fire disturbance. The ISODATA classes were mapped to the LANDFIRE 2016 existing vegetation type map to contextualize their associated vegetation cover. The pre-fire and post-fire spatial distributions of classes are illustrated in Figure 5 and Figure 6.
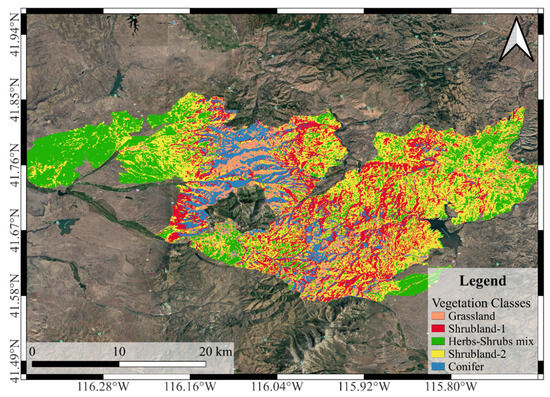
Figure 5.
Spatial distribution of pre-fire spectral classes derived from ISODATA classification of Landsat imagery over the study area. Distinct classes represent pre-fire vegetation conditions prior to wildfire disturbance.
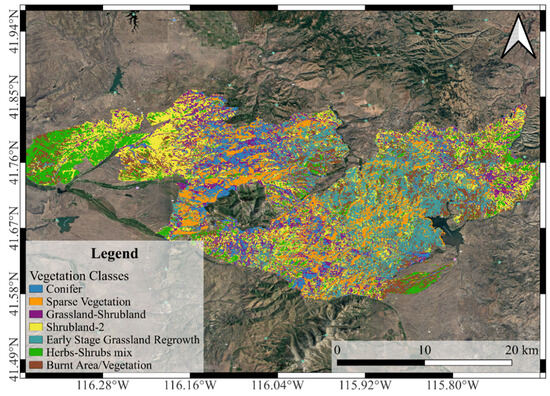
Figure 6.
Spatial distribution of post-fire spectral classes derived from ISODATA classification of Landsat imagery over the study area. Distinct classes represent post-fire vegetation conditions post-wildfire disturbance.
5.1.3. Accuracy Assessment
To evaluate the reliability of the unsupervised classification, confusion matrices were constructed for both the pre-fire and post-fire ISODATA outputs by comparing each classified pixel with the corresponding vegetation type from the LANDFIRE Existing Vegetation Type (EVT) product. Given that multiple ISODATA classes often corresponded to a single ecological class, and that many-to-one relationships are not compatible with confusion matrix structures, the LANDFIRE vegetation categories were aggregated into broader ecological groups. Two generalized classes, Conifer–Hardwood and Grassland–Shrubland Mosaic, were used to ensure consistent alignment between the unsupervised spectral classes and mapped vegetation types.
For the pre-fire classification, the confusion matrix showed an overall accuracy of 86.42%. The Grassland–Shrubland Mosaic class demonstrated excellent agreement between the classified output and reference data, with a producer accuracy of 0.9074 and a user accuracy of 0.9470. The Conifer–Hardwood class, in contrast, exhibited substantially lower agreement, with a producer accuracy of 0.0972 and a user accuracy of only 0.0556, indicating considerable misclassification in this vegetation category.
The post-fire classification yielded a slightly higher overall accuracy of 86.68%, maintaining strong performance across both time periods. The Grassland–Shrubland Mosaic class continued to perform well, with a producer accuracy of 0.9083 and a user accuracy of 0.9490. However, the Conifer–Hardwood class, again, showed limited classification reliability, with a producer accuracy of 0.1139 and a user accuracy of 0.0640.
These results suggest that the classification process effectively captured the spectral signatures of the dominant shrubland–grassland matrix, while the Conifer–Hardwood class remained more susceptible to misclassification. This could be due to spectral overlaps, reduced spatial representation of coniferous vegetation within the fire perimeter, or mixed-pixel effects that are common in transitional zones or low-density forest patches. The simplified two-class system, though necessary to ensure compatibility between the unsupervised spectral clustering and available vegetation reference data, may also contribute to underrepresentation of minority classes such as Conifer–Hardwood.
5.1.4. Class Stability and Change Detection
The change detection matrix highlighted major vegetation transitions. Of the 9302.4 hectares (ha) classified as Grassland, 3937.77 ha transitioned to Grassland–Shrubland, 950.76 ha to Early-Stage Grassland Regrowth and 347.49 hectares to Burnt Area/ Vegetation. For Shrubland-1 (19,157.4 ha), 2796.12 ha transitioned to Grassland–Shrubland, but most pixels shifted to Early-Stage Grassland Regrowth (8054.01 ha) and Sparse Vegetation (6674.49 ha). For the Herbs-Shrubs mix (24,152.4 ha) only 9352.8 ha persisted while others transitioned to Shrubland-2 (7682.31 ha) and Burnt Area/Vegetation (4789.26 ha). Shrubland-2 (32,438.7 ha) remained with 10,953.9 ha, with major transitions to Early-Stage Grassland Regrowth (8766.09 ha), Grassland–Shrubland (4866.39 ha), and Burnt Area/Vegetation (6408.81 ha). Conifer (9434.7 ha) preserved 3480.39 ha, while a large portion shifted into Sparse Vegetation (4808.61 ha) and Early-Stage Grassland Regrowth (796.68 ha). The change detection matrix is depicted in Table 6.
Table 6.
Change detection matrix for the South Sugarloaf Fire, showing area (hectares) transitions from pre-fire spectral classes (rows) to post-fire spectral classes (columns). Abbreviations: Conif. (Conifer), Sparse Veg. (Sparse Vegetation), Grass-Shrub (Grassland–Shrubland), Shrub-1/2 (Shrubland-1/2), Early Grass Reg. (Early-Stage Grassland Regrowth), Herb-Shrub Mix (Herbs-Shrubs Mix), Burnt/Grass (Burnt Area/Vegetation Grassland).
Stability analysis showed variable persistence among the pre-fire vegetation classes. Grassland exhibited the highest-class stability, retaining 42.3% of its original area post-fire. This was followed by Herbs-Shrubs mix (38.7%), Conifer (36.9%), and Shrubland-2 (33.8%). Shrubland-1 was the least stable class, with only 14.6% of its original pixels remaining unchanged. The stability matrix is presented in Table 7.
Table 7.
Class stability matrix showing the area of pre-fire per spectral class in hectares and the proportion that remained unchanged in the corresponding post-fire classification.
These results reflect significant reorganization of vegetation classes following the fire, with dominant pre-fire classes transitioning into newly formed categories that reflect altered vegetation structure and condition.
5.2. Snowstorm Fire
5.2.1. Spectral Signature
Sensitivity analysis of the ISODATA clustering outputs was conducted to determine the most stable and spectrally distinct configuration for both pre- and post-fire classifications. For both pre- and post-fire, the ISODATA classification model selected after sensitivity analysis had the final clustering parameters as follows:
- Number of clusters: 20
- Minimum class size: 30 pixels
- Maximum allowable standard deviation within class: 0.05
- Merge distance threshold: 0.03 (Euclidean distance)
For the pre-fire classification, the between-class spectral variance was 0.0006, and no class exceeded a within-class spectral variance of 0.0002. These clustering settings resulted in compact, well-separated classes suitable for ecological interpretation and temporal change detection.
The ISODATA classification produced five distinct classes in pre-fire and post-fire images. The classes were matched with each other by calculating Euclidean distance which are illustrated in Table 8.
Table 8.
Euclidean distance matrix for pre-fire and post-fire classes computed from mean spectral signatures for Snowstorm Fire. Closest Euclidean distances are indicated in bold face.
The Euclidean distance analysis was conducted to assess the similarity between pre-fire and post-fire classes. The results revealed that four post-fire classes exhibited strong spectral similarity to pre-fire counterparts, indicating potential persistence or partial recovery of certain vegetation types. Conversely, Class A in the post-fire classification appeared as a newly emerged spectral group, distinct from any pre-fire class. This suggests the emergence of a novel surface condition or vegetation type, likely attributable to fire-induced ecological transformation.
The specific class correspondences derived from the Euclidean distance matrix are detailed in Table 9, which outlines the optimal pairings between pre-fire and post-fire classes based on minimum spectral distance.
Table 9.
Mapping of closest Euclidean distances for pre-fire to post-fire spectral classes for the Snowstorm Fire, based on Euclidean distances.
The pre-fire classes were named and guided by the 2016 LANDFIRE EVT vegetation dataset. The resulting five pre-fire classes were mapped to vegetation types, as summarized in Table 10.
Table 10.
LANDFIRE vegetation types and corresponding physiognomies associated with each spectral class derived from unsupervised classification for pre-fire.
The mean spectral signatures of these classes are illustrated in Figure 7 and Figure 8, corresponding to pre-fire and post-fire conditions, respectively. The pre-fire spectral profiles exhibited distinct patterns across the six Landsat bands. Herbaceous Vegetation-2 consistently showed the highest reflectance across all wavelengths, peaking near 0.36 at 1610 nm (SWIR1). This suggests a class dominated by mature vegetation. Herbs-Shrubs Mix-2 and Herbs-Shrubs Mix-3 followed with moderate to high reflectance, particularly in the NIR and SWIR1 bands (>0.30), indicating healthy vegetation cover with moderate canopy density. In contrast, Herbs-Shrubs Mix-1 had the lowest reflectance, with a peak around 0.27 at SWIR1 and reduced values in NIR and SWIR2 bands, possibly representing sparse vegetation, patchy grasslands, or soil-influenced pixels.
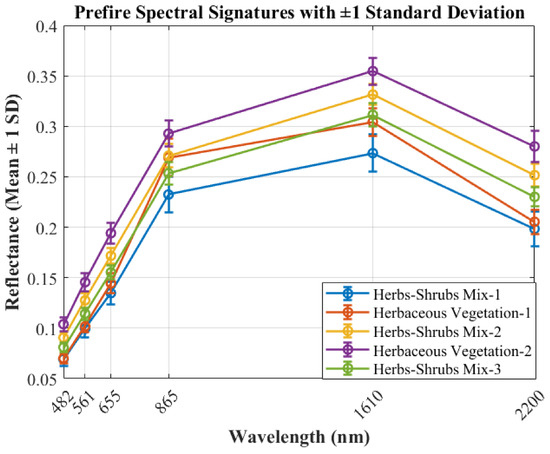
Figure 7.
Mean spectral reflectance curves of five pre-fire vegetation classes for the Snowstorm Fire, derived from unsupervised classification of Landsat imagery.
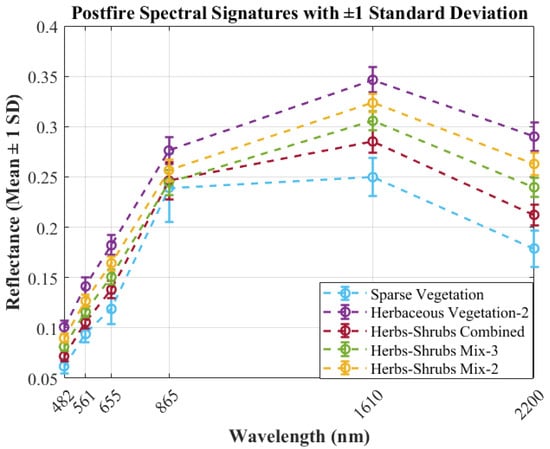
Figure 8.
Mean spectral reflectance curves of five post-fire vegetation classes for the Snowstorm Fire, derived from unsupervised classification of Landsat imagery.
The ±1σ analysis of pre-fire (Figure 7 and Table 11) shows that although Herbaceous Vegetation-2 overlaps partially with Herbs-Shrubs Mix-2 and Herbs-Shrubs Mix-3 in the visible bands, it maintains a distinct separation in the NIR and SWIR1 bands. This clear separation, especially in SWIR1, ensures reliable classification of Herbaceous Vegetation-2 despite moderate overlap elsewhere. Similarly, Herbs-Shrubs Mix-1, although overlapping in visible bands with Herbaceous Vegetation-1 and Herbs-Shrubs Mix-3, retains distinctiveness in SWIR2, which can serve as a key differentiator.
Table 11.
Pre-fire spectral reflectance statistics of Snowstorm Fire vegetation class for Landsat bands, reported as mean reflectance and ±1 standard deviation.
A moderate overlap was noted between Herbaceous Vegetation-1 and Herbs-Shrubs Mix-1 across most bands, but their NIR and SWIR1 ranges remained partially distinct, offering a narrow but usable window for class separation. Overall, despite overlaps in the visible spectrum, all classes displayed at least one band, typically NIR or SWIR1, where clear separation was evident, minimizing the risk of misclassification.
In the post-fire spectral profiles, Sparse Vegetation (formerly referred to as Class A) appeared as a new class not observed in the pre-fire landscape. This class exhibited moderate reflectance across all bands, following a typical vegetation spectral pattern with a rise in the NIR and a peak at SWIR1 (1610 nm), though with slightly lower magnitude compared to other vegetated classes. Reflectance values in the NIR and SWIR2 bands suggested low canopy density or reduced biomass. Given the ecological context of the area, which is dominated by herbaceous plants and shrubs, Sparse Vegetation class likely represents the naturally sparse vegetation cover or early-stage regrowth, consisting of recovering herbs and low shrubs that have started to recolonize the fire-affected terrain. The pre-fire Classes 1 and 2 transitioned into post-fire Class C, which was named Herbs-Shrubs Combined.
The ±1σ ranges of post-fire (Figure 8 and Table 12) show that Sparse Vegetation overlaps with Herbaceous Vegetation-1 and Herbs-Shrubs Mix-2 in the visible and NIR bands. However, it remains clearly distinct in SWIR1, ensuring reliable classification despite initial overlap.
Table 12.
Post-fire spectral reflectance statistics of Snowstorm Fire vegetation class for Landsat bands, reported as mean reflectance and ±1 standard deviation.
Herbaceous Vegetation-2 maintained the highest reflectance. With values exceeding 0.35 in SWIR1, it did not overlap with Sparse Vegetation or Herbs-Shrubs Mix-3, confirming strong separability. Herbs-Shrubs Combined and Herbs-Shrubs Mix-3 showed moderate overlap in NIR and SWIR bands, but Herbs-Shrubs Mix-3 maintained a slightly elevated SWIR2, which provides a subtle yet useful separation marker.
Notably, increases in reflectance were observed for post-fire Herbaceous Vegetation-2, particularly in NIR and SWIR1, indicating possible vegetation regrowth or improved surface exposure. This upward trend post-fire may reflect early successional vegetation colonization in partially affected zones. The overlap analysis supports that while many classes show significant convergence in the visible and NIR regions, all retain at least one distinct band (usually SWIR1 or SWIR2) where separation is assured, mitigating the risk of confusion by the classifier.
5.2.2. Vegetation Classification
The spatial distribution of classes exhibited notable shifts between the pre-fire and post-fire periods for the Snowstorm Fire. In the pre-fire image, Herbs-Shrubs Mix-2 accounted for the largest area, comprising 32.85% of the landscape. This was followed by Herbs-Shrubs Mix-3 (28.33%), Herbaceous Vegetation-2 (15.51%), and Herbaceous Vegetation-1 (12.93%), while Herbs-Shrubs Mix-1 covered 10.37% of the area.
Following the fire, Herbs-Shrubs Mix-2 increased to become the most dominant class, occupying 34.54% of the landscape. Herbs-Shrubs Mix-3 also expanded slightly to 27.40% and Herbaceous Vegetation-2 grew to 18.96%. In contrast, Herbs-Shrubs Mix-1 and Herbaceous Vegetation-1 were substantially reduced in area. Additionally, two new post-fire classes emerged: Sparse Vegetation, which covered 4.72%, and Herbs-Shrubs Combined, representing 14.38% of the post-fire landscape.
Spatially, transitions were concentrated in the central and northern portions of the burn area, where patches of Herbs-Shrubs Mix-1 and Herbaceous Vegetation-1 were largely replaced by Herbs-Shrubs Combined and Sparse Vegetation. Southern portions of the fire also showed notable conversions from Herbaceous Vegetation-2 into Herbs-Shrubs Mix-2 and Herbs-Shrubs Mix-3. Figure 9 and Figure 10 show the spatial distribution of pre-fire and post-fire classes.
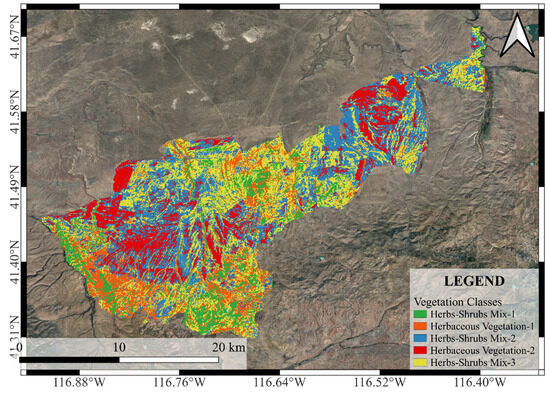
Figure 9.
Spatial distribution of pre-fire spectral classes for the Snowstorm Fire, derived from unsupervised classification of Landsat imagery.
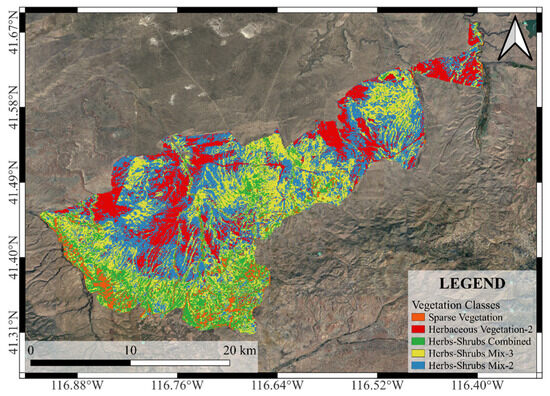
Figure 10.
Spatial distribution of post-fire spectral classes for the Snowstorm Fire, derived from unsupervised classification of Landsat imagery.
5.2.3. Accuracy Assessment
To evaluate the reliability of the unsupervised classification, confusion matrices were constructed for both the pre-fire and post-fire ISODATA outputs by comparing each classified pixel with the corresponding vegetation type from the LANDFIRE Existing Vegetation Type (EVT) product. Given that multiple ISODATA classes often corresponded to a single ecological class, and that many-to-one relationships are not compatible with confusion matrix structures, the LANDFIRE vegetation categories were aggregated into broader ecological groups. Two generalized classes, namely Herbaceous System and Grassland–Shrubland Mosaic, were used to enable consistent alignment between the unsupervised spectral classes and mapped vegetation types.
For the pre-fire classification, the confusion matrix showed an overall accuracy of 70.91%. The Grassland–Shrubland Mosaic class exhibited strong agreement between the classified output and reference data, with a producer accuracy of 0.7875 and user accuracy of 0.8608. In contrast, the Herbaceous System class showed lower agreement, with a producer accuracy of 0.2429 and user accuracy of 0.1613, indicating notable misclassification in this category.
Similarly, the post-fire classification resulted in an overall accuracy of 70.18%, suggesting consistent performance across time periods. The Grassland–Shrubland Mosaic class maintained high producer and user accuracies of 0.7885 and 0.8461, respectively. The Herbaceous System class again showed limited accuracy, with a producer accuracy of 0.2454 and user accuracy of 0.1808.
These results indicate that the classification process was more effective at capturing the spectral patterns associated with the dominant Grassland–Shrubland mosaic, while herbaceous-dominated areas were more likely to be misclassified. This discrepancy may reflect spectral overlaps, spatial intermixing of vegetation types, or post-fire substrate effects such as ash and bare soil, which can obscure vegetation signals. The use of generalized vegetation categories introduces some simplification but was necessary to ensure compatibility between the unsupervised classification and available reference data.
5.2.4. Class Stability and Change Detection
The change detection matrix revealed major class redistributions. Of the 6490.81 ha originally classified as Herbs-Shrubs Mix-1, 2081.44 ha transitioned into sparse vegetation, while 2891.34 ha transitioned into Herbs-Shrubs Combined and 1080 ha into Herbs-Shrubs Mix-3. Herbaceous Vegetation-1 (8094.43 ha) had significant transitions to Herbs-Shrubs Combined (3768.67 ha), Herbs-Shrubs Mix-3 (2876.31 ha), and Herbs-Shrubs Mix-2 (589.32 ha). Most Herbs-Shrubs Mix-2 (20,543.5 ha) remained stable in post-fire (10,714 ha), while the remainder transitioned into Herbs-Shrubs Mix-3 (4335.57 ha), and Herbaceous Vegetation-2 (5099.58 ha), with only 27.36 ha converted to Sparse Vegetation. Herbaceous Vegetation-2 (9697.5 ha) 4820.32 ha remained, with notable shifts into Herbs-Shrubs Mix-2 (4243.95 ha) and Herbs-Shrubs Mix-3 (581.85 ha). Herbs-Shrubs Mix-3 (17,720.2 ha) persisted as 8260.75 ha and contributed 1929.69 ha to Herbs-Shrubs Combined and 5834.79 ha to Herbaceous Vegetation-2. The change detection matrix is shown in Table 13.
Table 13.
Change detection matrix for the Snowstorm Fire, showing area (hectares) transitions from pre-fire spectral classes (rows) to post-fire spectral classes (Columns).
Stability analysis revealed relatively high persistence among all five pre-fire vegetation classes. Herbs-Shrubs Mix-2 exhibited the highest stability, with 52.2% of its original pixels retaining the same classification post-fire. This was followed by Herbaceous Vegetation-2 (49.6%), Herbs-Shrubs Mix-3 (46.6%), and Herbaceous Vegetation-1 (46.5%). Herbs-Shrubs Mix-1 also showed relatively strong persistence with a stability value of 44.6%. The stability Matrix is shown in Table 14.
Table 14.
Class stability matrix for the Snowstorm Fire, showing the area of pre-fire per spectral class in hectares and the proportion that remained stable in the post-fire classification.
These results highlight significant vegetation reorganization across the Snowstorm Fire landscape, with dominant pre-fire classes largely transitioning into Herbs-Shrubs Mix-2, Herbs-Shrubs Mix-3, and the newly formed Herbs-Shrubs Combined. The emergence of Sparse Vegetation also points to possible areas of reduced vegetation cover post-fire.
6. Discussion
This study examines post-fire vegetation transitions and spectral dynamics using unsupervised classification of Landsat 8 imagery across two major wildfire events in Nevada. Through spectral signature analysis, class stability evaluation, and comparison with national vegetation datasets, the results provide new insights into how fire reshapes ecological communities, and alters surface reflectance characteristics. Observed transitions, emergence of novel spectral classes, and spectral shifts highlight both the ecological consequence of high-severity burns and the value of remote sensing for post-fire landscape assessment.
6.1. Post-Fire Vegetation Transitions
The Snowstorm Fire and South Sugarloaf Fire triggered substantial vegetation change, notably the conversion of shrublands and conifer woodlands into herbaceous-dominated systems. These transitions align with long-documented trends in the Great Basin, where frequent fire and invasion by Bromus tectorum reduce the persistence of native woody species [1,5,8]. In both sites, sagebrush and coniferous vegetation exhibited low post-fire stability, often replaced by grasses and forbs. This reduction in woody cover increases the prevalence of fine fuels, accelerating the transition toward more flammable, homogeneous landscapes [7,9,23].
Class stability results emphasized these trends. Herbaceous classes expanded significantly, while tree and shrub types were almost entirely lost in severely burned zones. Coniferous areas in South Sugarloaf were particularly affected, with nearly complete post-fire conversion. Such losses indicate a shift in successional trajectory, suggesting that without active restoration, natural recovery of shrubs or trees may be limited. These changes have ecosystem-wide consequences, including reduced habitat complexity, loss of native biodiversity, and long-term alteration of community structure [5,10].
6.2. Spectral Signature Shifts
Spectral analysis revealed consistent post-fire reflectance changes across both fires. Near-infrared reflectance decreased while shortwave infrared reflectance increased, indicating vegetation loss, canopy desiccation, and exposure of ash, char, or mineral soil [15]. These patterns are characteristic of fire-impacted surfaces, where green biomass is removed and replaced with dry, non-photosynthetic materials.
By examining the full spectral signatures across all Landsat bands, the analysis captured more subtle transitions than vegetation indices alone. This included distinguishing between ash-dominated areas, which appear bright in SWIR, and charred regions, which remain spectrally dark across multiple wavelengths. These nuanced differences are ecologically relevant and may relate to different soil conditions, combustion completeness, or post-fire erosion potential [14].
6.3. Emergence of Novel Spectral Classes
Post-fire classification identified entirely new spectral clusters that were not present in the pre-fire landscape. In South Sugarloaf, the novel classes in post-fire were Sparse Vegetation, Early-Stage Grassland Regrowth, and Burnt Area/Vegetation; similarly, in Snowstorm, post-fire Sparse Vegetation reflected novel surface conditions created by the fire. In the South Sugarloaf Fire, Burnt Area/Vegetation exhibited high reflectance across all bands, particularly in SWIR, indicating exposed ash or mineral soil, whereas Sparse Vegetation had minimal reflectance and was likely dominated by charred organic debris. Both suggest high-severity burns and the loss of vegetation and surface structure.
Early-Stage Grassland Regrowth (South Sugarloaf) and Sparse Vegetation (Snowstorm) displayed moderate spectral responses with subdued NIR peaks and gradual SWIR declines. These likely represent sparse post-fire regrowth or partially burned vegetation. The presence of even modest NIR reflectance implies some chlorophyll activity, possibly from early-stage colonizers or resprouting vegetation.
The ecological significance of these new classes lies in their spatial extent and spectral distinctiveness. Ash and char-dominated areas may have poor soil structure, reduced microbial activity, and low moisture retention, all of which delay recovery and increase susceptibility to erosion. In contrast, sparse regrowth classes may indicate areas with some recovery potential, though they remain vulnerable to invasive species dominance. Identifying and mapping these spectral classes improves our understanding of spatial burn severity and heterogeneity and supports site-specific restoration planning [17,24].
7. Limitations
Only a single post-fire year (2019) was analyzed, limiting insight into long-term recovery or class stability over time, it is recommended that ISODATA analysis be conducted over multiple years post-fire to have a more nuanced understanding of post-fire trajectory.
- The Accuracy assessment relied on high-resolution imagery and LANDFIRE EVT data in the absence of ground-truth field data, due to which ISODATA results may not fully align with ecological class boundaries.
- Spectral confusion may occur in transition zones where ash, char, bare soil, and regrowth co-occur within 30 m pixels, more finer resolution imagery should be used to develop cluster so that spectral confusion should be limited.
8. Conclusions
Both fire areas exhibited strong indicators of low ecological resilience. Most native shrub and woodland classes failed to recover, while novel spectral classes emerged that reflected severely altered surface conditions ranging from ash-covered terrain to sparse early regrowth. These conditions suggest a transition toward more flammable, invasive-prone states, particularly in sagebrush ecosystems vulnerable to the fire–grass cycle. The persistence of new spectral classes across significant areas implies that large portions of the landscape may remain in degraded or altered states without management intervention.
Post-fire classification revealed the formation of distinct new spectral classes in both fires. In South Sugarloaf, Classes 2, 5, and 7 captured charred, sparsely vegetated, and ash-dominated conditions. In Snowstorm, a similar new class reflected sparse regrowth mixed with residual burn effects. These novel classes, absent from the pre-fire landscape, highlight fire-induced ecological shifts and support the use of spectral classification in distinguishing zones with differing recovery potential.
Spectral signature analysis showed reduced near-infrared and elevated shortwave infrared reflectance in all post-fire classes. These patterns are consistent with vegetation loss, canopy dedication, and soil exposure, and confirm the severity of burn impacts across both fire areas. Full-spectrum analysis allowed finer discrimination of surface conditions than vegetation indices alone, enabling the identification of char and ash cover types with ecological relevance.
Finally, pre-fire to post-fire vegetation class transitions revealed widespread conversion of shrublands and woodlands to herbaceous systems. Sagebrush and conifer classes showed low post-fire persistence, while grass- and forb-dominated types expanded across the burn perimeters. These conversions are consistent with long-documented patterns in Great Basin ecosystems, where fire and invasive species jointly drive long-term ecological shifts. The dominance of early successional classes underscores the urgency for targeted restoration to prevent further degradation and biodiversity loss.
This study demonstrates the value of integrating unsupervised classification and spectral analysis to understand fire impacts and ecological trajectories. By identifying areas of severe burn, sparse regrowth, and potential type conversion, this approach offers practical tools for land managers tasked with post-fire assessment and recovery in semi-arid rangelands.
Author Contributions
Conceptualization, I.A. and H.S.; methodology, I.A.; software, I.A.; formal analysis, I.A.; investigation, I.A.; writing—original draft preparation, I.A.; writing—review and editing, I.A. and H.S.; visualization, I.A.; supervision, H.S.; project administration, H.S.; funding acquisition, H.S. All authors have read and agreed to the published version of the manuscript.
Funding
This research was funded by National Science Foundation under grant number OIA- 2148788 and The publication fees for this article were supported partially by UNLV University Libraries Open Article Fund and the NSF grant.
Data Availability Statement
The datasets generated and/or analyzed during the current study are fully presented in the published article. No additional datasets were generated or used.
Conflicts of Interest
The authors declare no conflicts of interest.
References
- Balch, J.K.; Bradley, B.A.; D’Antonio, C.M.; Gómez-Dans, J. Introduced Annual Grass Increases Regional Fire Activity across the Arid Western USA (1980–2009). Glob. Change Biol. 2013, 19, 173–183. [Google Scholar] [CrossRef]
- Balzotti, C.S.; Kitchen, S.G.; McCarthy, C. Beyond the Single Species Climate Envelope: A Multifaceted Approach to Mapping Climate Change Vulnerability. Ecosphere 2016, 7, e01444. [Google Scholar] [CrossRef]
- Brewington, L.; Rodgers, L.; Greenwood, L. Recommendations for Incorporating Invasive Species into U.S. Climate Change Adaptation Planning and Policy. Conserv. Sci. Pract. 2024, 6, e13210. [Google Scholar] [CrossRef]
- Anderson, K.E.; Glenn, N.F.; Spaete, L.P.; Shinneman, D.J.; Pilliod, D.S.; Arkle, R.S.; McIlroy, S.K.; Derryberry, D.R. Estimating Vegetation Biomass and Cover across Large Plots in Shrub and Grass Dominated Drylands Using Terrestrial Lidar and Machine Learning. Ecol. Indic. 2018, 84, 793–802. [Google Scholar] [CrossRef]
- Crist, M.R.; Belger, R.; Davies, K.W.; Davis, D.M.; Meldrum, J.R.; Shinneman, D.J.; Remington, T.E.; Welty, J.; Mayer, K.E. Trends, Impacts, and Cost of Catastrophic and Frequent Wildfires in the Sagebrush Biome. Rangel. Ecol. Manag. 2023, 89, 3–19. [Google Scholar] [CrossRef]
- Iglesias, V.; Balch, J.K.; Travis, W.R. U.S. Fires Became Larger, More Frequent, and More Widespread in the 2000s. Sci. Adv. 2022, 8, eabc0020. [Google Scholar] [CrossRef] [PubMed]
- Shinneman, D.J.; McIlroy, S.K.; de Graaff, M.-A. Disentangling the Effects of Multiple Fires on Spatially Interspersed Sagebrush (Artemisia spp.) Communities. J. Veg. Sci. 2021, 32, e12937. [Google Scholar] [CrossRef]
- Chambers, J.C.; Brown, J.L.; Bradford, J.B.; Doherty, K.E.; Crist, M.R.; Schlaepfer, D.R.; Urza, A.K.; Short, K.C. Combining Resilience and Resistance with Threat-Based Approaches for Prioritizing Management Actions in Sagebrush Ecosystems. Conserv. Sci. Pract. 2023, 5, e13021. [Google Scholar] [CrossRef]
- Power, S.C.; Davies, G.M.; Wainwright, C.E.; Marsh, M.; Bakker, J.D. Restoration Temporarily Supports the Resilience of Sagebrush-Steppe Ecosystems Subjected to Repeated Fires. J. Appl. Ecol. 2023, 60, 1607–1621. [Google Scholar] [CrossRef]
- Simic, P.Z.; Coop, J.D.; Margolis, E.Q.; Young, J.R.; Lopez, M.K. Historical Fire Regimes and Contemporary Fire Effects within Sagebrush Habitats of Gunnison Sage-Grouse. Ecosphere 2023, 14, e4587. [Google Scholar] [CrossRef]
- Crowley, M.A.; Stockdale, C.A.; Johnston, J.M.; Wulder, M.A.; Liu, T.; McCarty, J.L.; Rieb, J.T.; Cardille, J.A.; White, J.C. Towards a Whole-System Framework for Wildfire Monitoring Using Earth Observations. Glob. Change Biol. 2023, 29, 1423–1436. [Google Scholar] [CrossRef] [PubMed]
- Ahmad, I.; Stephen, H.; Ahmad, S. Machine Learning-Based Land Cover Classification and Impact Assessment in Pre-Wildfire and Post-Wildfire Areas. In Proceedings of the World Environmental and Water Resources Congress 2024, Milwaukee, WI, USA, 19–22 May 2024; pp. 1572–1582. [Google Scholar] [CrossRef]
- Fernández-Guisuraga, J.M.; Calvo, L.; Fernández-García, V.; Marcos-Porras, E.; Taboada, Á.; Suárez-Seoane, S. Efficiency of Remote Sensing Tools for Post-Fire Management along a Climatic Gradient. For. Ecol. Manag. 2019, 433, 553–562. [Google Scholar] [CrossRef]
- Van Gerrevink, M.J.; Veraverbeke, S. Evaluating the Hyperspectral Sensitivity of the Differenced Normalized Burn Ratio for Assessing Fire Severity. Remote Sens. 2021, 13, 4611. [Google Scholar] [CrossRef]
- Ahmad, I.; Stephen, H. Assessment of Vegetation Dynamics After South Sugar Loaf and Snowstorm Wildfires Using Remote Sensing Spectral Indices. Remote Sens. 2025, 17, 1809. [Google Scholar] [CrossRef]
- Lanorte, A.; Danese, M.; Lasaponara, R.; Murgante, B. Multiscale Mapping of Burn Area and Severity Using Multisensor Satellite Data and Spatial Autocorrelation Analysis. Int. J. Appl. Earth Obs. Geoinf. 2013, 20, 42–51. [Google Scholar] [CrossRef]
- Beltrán-Marcos, D.; Suárez-Seoane, S.; Fernández-Guisuraga, J.M.; Fernández-García, V.; Pinto, R.; García-Llamas, P.; Calvo, L. Mapping Soil Burn Severity at Very High Spatial Resolution from Unmanned Aerial Vehicles. Forests 2021, 12, 179. [Google Scholar] [CrossRef]
- Fernandez-Manso, A.; Quintano, C.; Roberts, D.A. Burn Severity Influence on Post-Fire Vegetation Cover Resilience from Landsat MESMA Fraction Images Time Series in Mediterranean Forest Ecosystems. Remote Sens. Environ. 2016, 184, 112–123. [Google Scholar] [CrossRef]
- Fernández-Guisuraga, J.M.; Calvo, L.; Quintano, C.; Fernández-Manso, A.; Fernandes, P.M. Linking Crown Fire Likelihood with Post-Fire Spectral Variability in Mediterranean Fire-Prone Ecosystems. Int. J. Wildland Fire 2024, 33, WF23174. [Google Scholar] [CrossRef]
- Picotte, J.J.; Dockter, D.; Long, J.; Tolk, B.; Davidson, A.; Peterson, B. LANDFIRE Remap Prototype Mapping Effort: Developing a New Framework for Mapping Vegetation Classification, Change, and Structure. Fire 2019, 2, 35. [Google Scholar] [CrossRef]
- Choi, J.W.; Noh, S.T.; Choi, S.K. Unsupervised Classification of Landsat-8 OLI Satellite Imagery Based on Iterative Spectral Mixture Model. J. Korean Soc. Geospat. Inf. Sci. 2014, 22, 53–61. [Google Scholar] [CrossRef][Green Version]
- Brook, A. Spectroscopy and Remote Sensing Techniques to Assess Active- and Post-Fire Effects. Proceedings 2020, 30, 78. [Google Scholar] [CrossRef]
- Ahmad, I.; Stephen, H.; Ahmad, S. Assessing the Impact of Burn Severity on Vegetation: A Time Series Analysis of the Meadow Valley and South Sugar Loaf Wildfire. In World Environmental and Water Resources Congress 2025; American Society of Civil Engineers: Reston, VA, USA, 2025; pp. 779–796. [Google Scholar] [CrossRef]
- Gupta, V.; Reinke, K.; Jones, S. Changes in the Spectral Features of Fuel Layers of an Australian Dry Sclerophyll Forest in Response to Prescribed Burning. Int. J. Wildland Fire 2013, 22, 862–868. [Google Scholar] [CrossRef]
- Yang, J.; Pan, S.; Dangal, S.; Zhang, B.; Wang, S.; Tian, H. Continental-Scale Quantification of Post-Fire Vegetation Greenness Recovery in Temperate and Boreal North America. Remote Sens. Environ. 2017, 199, 277–290. [Google Scholar] [CrossRef]
- Nelson, K.J.; Connot, J.; Peterson, B.; Martin, C. The LANDFIRE Refresh Strategy: Updating the National Dataset. Fire Ecol. 2013, 9, 80–101. [Google Scholar] [CrossRef]
- Holben, B.N. Characteristics of Maximum-Value Composite Images from Temporal AVHRR Data. Int. J. Remote Sens. 1986, 7, 1417–1434. [Google Scholar] [CrossRef]
- Bouvier, I.; Caldwell, P.; Houser, P. Spatio-Temporal Vegetation and Catchment Dynamics Following Wildfires in the Southern Appalachian Ecoregion. For. Ecol. Manag. 2025, 595, 122996. [Google Scholar] [CrossRef]
- DeFries, R.S.; Field, C.B.; Fung, I.; Justice, C.O.; Los, S.; Matson, P.A.; Matthews, E.; Mooney, H.A.; Potter, C.S.; Prentice, K.; et al. Mapping the Land Surface for Global Atmosphere-Biosphere Models: Toward Continuous Distributions of Vegetation’s Functional Properties. J. Geophys. Res. Atmos. 1995, 100, 20867–20882. [Google Scholar] [CrossRef]
- White, J.C.; Wulder, M.A.; Hobart, G.W.; Luther, J.E.; Hermosilla, T.; Griffiths, P.; Coops, N.C.; Hall, R.J.; Hostert, P.; Dyk, A.; et al. Pixel-Based Image Compositing for Large-Area Dense Time Series Applications and Science. Can. J. Remote Sens. 2014, 40, 192–212. [Google Scholar] [CrossRef]
- Dhodhi, M.K.; Saghri, J.A.; Ahmad, I.; Ul-Mustafa, R. D-ISODATA: A Distributed Algorithm for Unsupervised Classification of Remotely Sensed Data on Network of Workstations. J. Parallel Distrib. Comput. 1999, 59, 280–301. [Google Scholar] [CrossRef]
Disclaimer/Publisher’s Note: The statements, opinions and data contained in all publications are solely those of the individual author(s) and contributor(s) and not of MDPI and/or the editor(s). MDPI and/or the editor(s) disclaim responsibility for any injury to people or property resulting from any ideas, methods, instructions or products referred to in the content. |
© 2025 by the authors. Licensee MDPI, Basel, Switzerland. This article is an open access article distributed under the terms and conditions of the Creative Commons Attribution (CC BY) license (https://creativecommons.org/licenses/by/4.0/).