Research on Characteristic Analysis of Typical Fire Accidents and Trend Prediction of Workplace Accidents



Abstract
1. Introduction
2. Materials and Methods
2.1. Research Data
2.1.1. Data Source
- (1)
- Official websites of provincial, autonomous regional, and municipal governments and their departments of emergency management;
- (2)
- Official websites of prefecture-level city governments and local emergency management bureaus;
- (3)
- The China Work Safety Big Data Platform.
2.1.2. Basic Data Information
2.2. Research Models
2.2.1. ARIMA Model
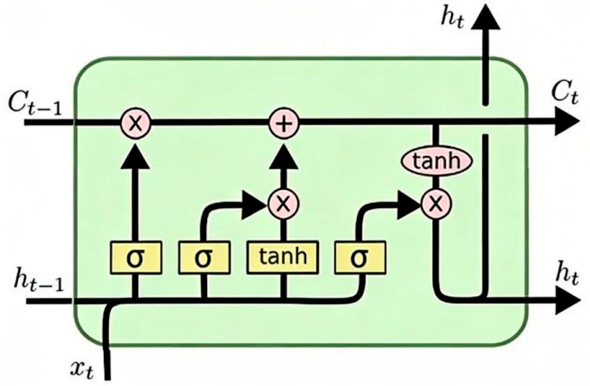
2.2.2. LSTM Model
2.2.3. ARIMA-LSTM Model
- (1)
- The ARIMA model is used to capture linear temporal characteristics of time series and is suitable for processing stationary or differenced stationary data. In the combined model, ARIMA fits the linear part of the data, leaving nonlinear or complex dependencies to the LSTM model.Implementation steps:
- 1)
- Training set division: Split the data into training and test sets at a certain ratio.
- 2)
- Stationarity test: Verify the stationarity of the original sequence through the Augmented Dickey–Fuller (ADF) test to determine whether differencing is required.
- 3)
- Parameter setting: Determine the model parameters based on the Partial Autocorrelation Function (PACF) truncation characteristics and Bayesian Information Criterion (BIC).
- 4)
- Linear prediction and residual extraction: Predict the test set to obtain the linear-trend prediction value . The residual sequence is defined as: . The residuals contain nonlinear features not captured by the linear model and are used as input to the LSTM model.
- (2)
- The LSTM model excels at learning nonlinear dependencies and long-term memory features of time series. In the combined model, LSTM fits the nonlinear part of ARIMA residuals to compensate for ARIMA’s insufficiency in modeling complex patterns.Implementation steps:
- 1)
- Data standardization: Normalize residuals to the range [0, 1] using MinMaxScaler to avoid the impact of numerical differences on training.
- 2)
- Perform a stationarity test on the residual sequence.
- 3)
- Sequence construction: Update the input sequence with the latest residual predictions through a sliding window mechanism and determine the window length L to avoid information loss.
- 4)
- Network structure: Determine parameters such as input layer, hidden layer, output layer, activation function, training batch size, and step size to build the LSTM network structure. The prediction deviation of ARIMA is corrected by learning the nonlinear patterns of residuals.
- (3)
- Model integration: The prediction formula of the combined model is
3. Characteristic Analysis of Typical National Fire Accidents
3.1. Temporal Distribution Characteristics
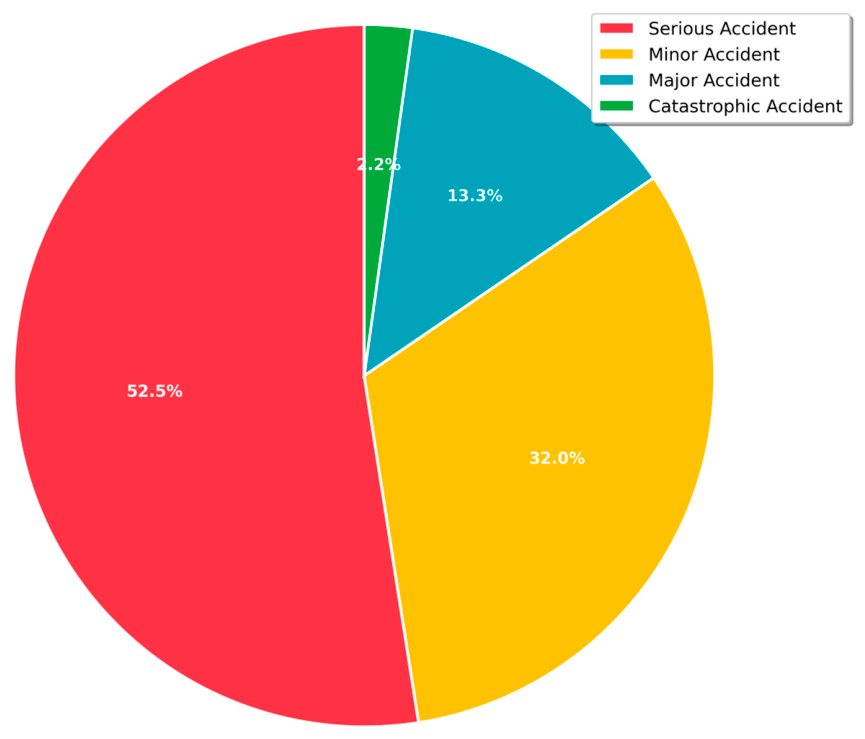
3.2. Accident Grade Distribution Characteristics
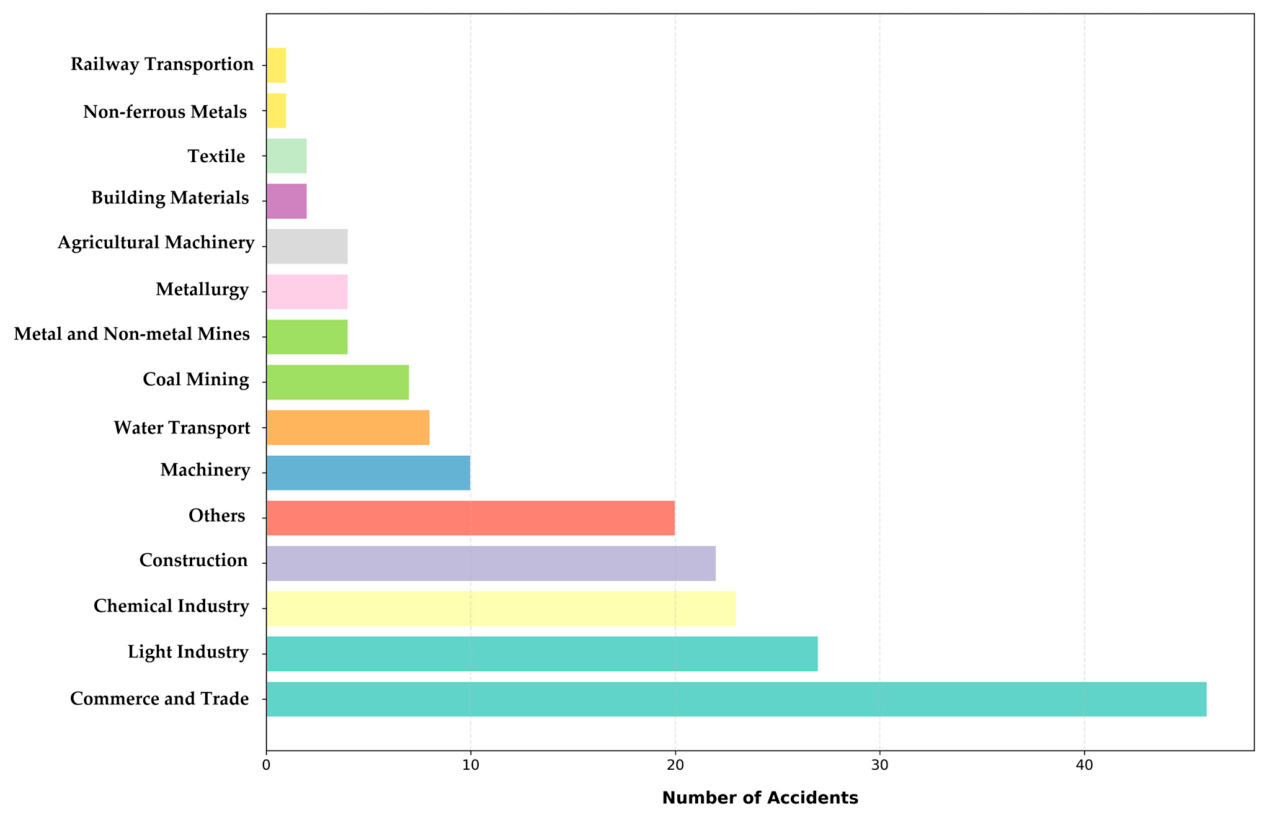
3.3. Industrial Distribution Characteristics
4. Model Calculation and Comparative Analysis
4.1. Data Preprocessing
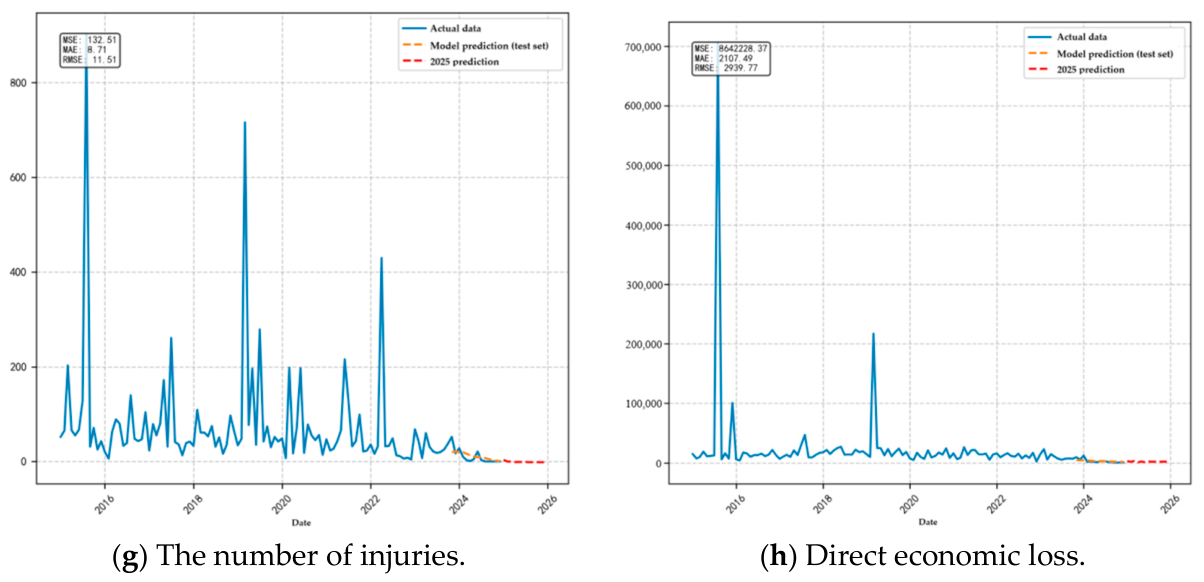
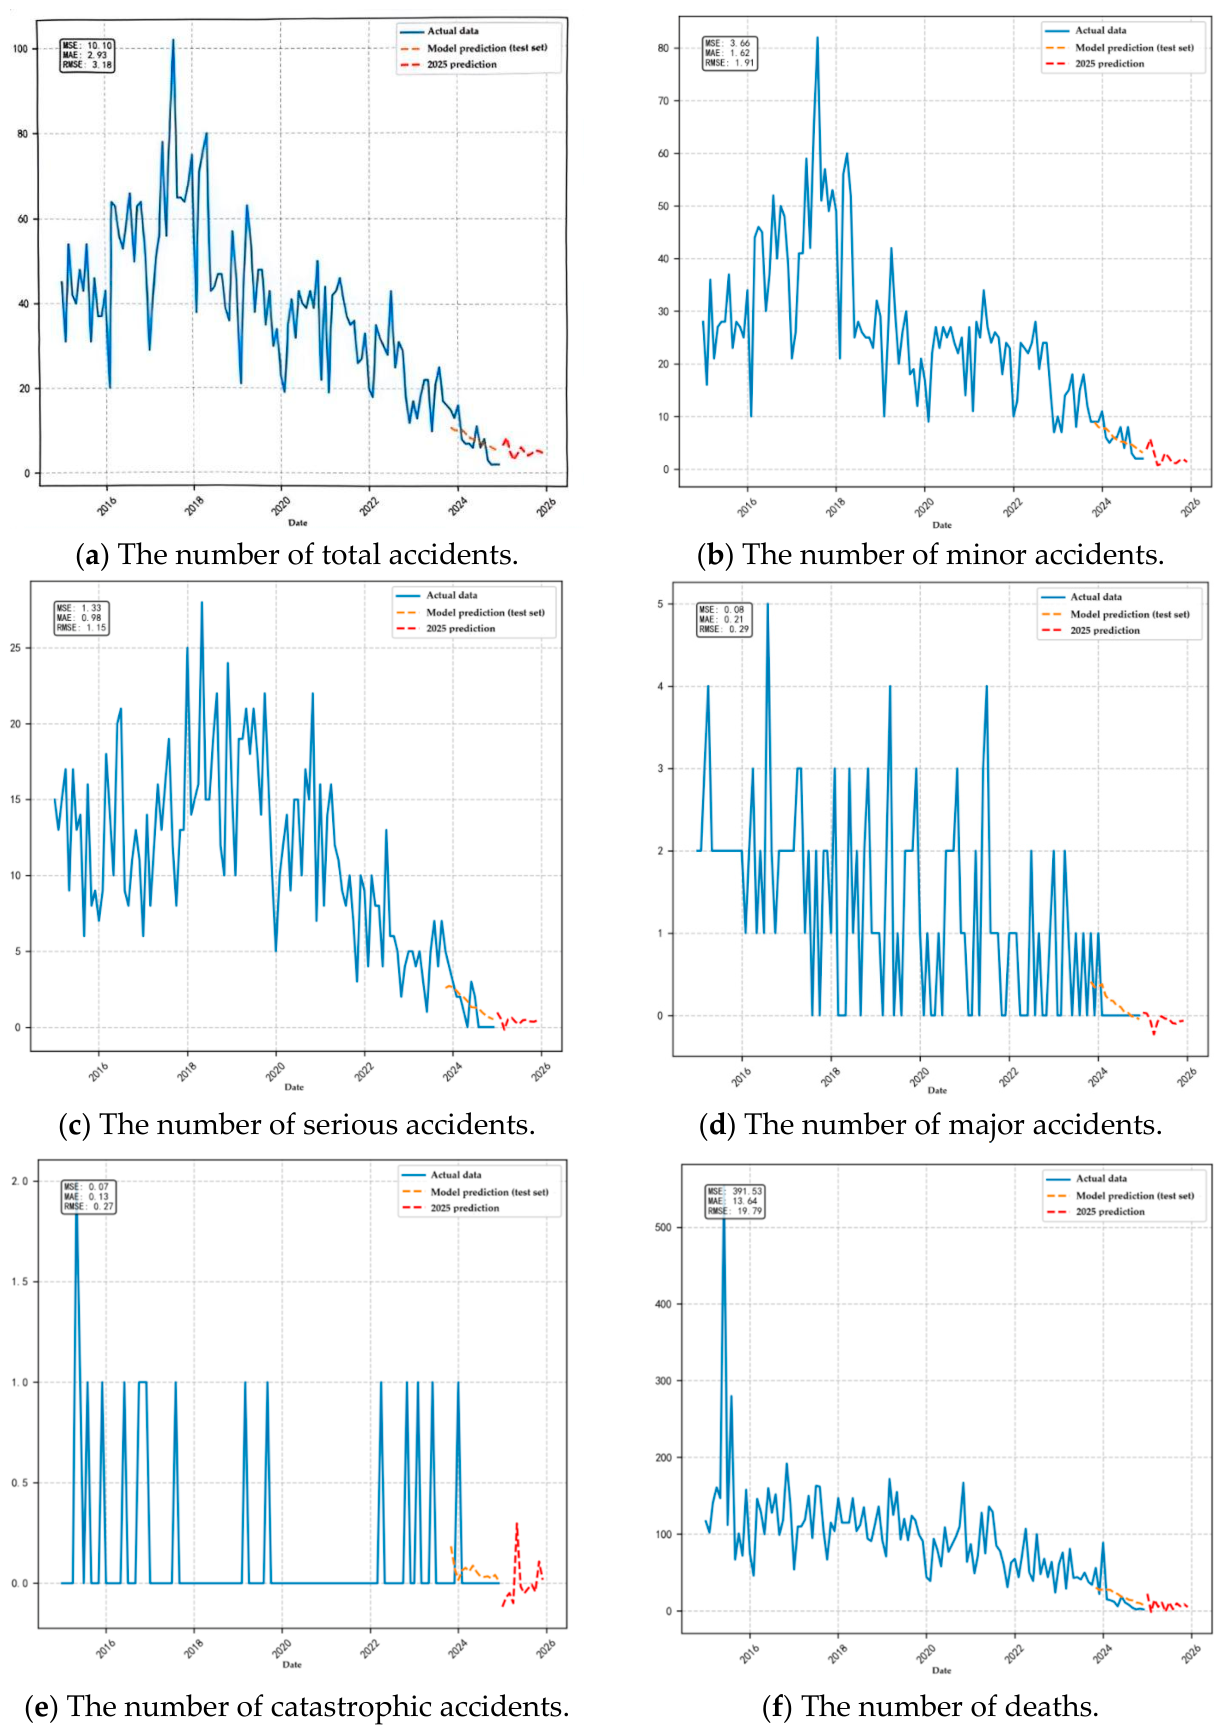
4.2. Model Calculation
- (1)
- Parameter Determination and Calculation
- 1)
- Training set division: In total, 80% of the data is used as the training set, and the remaining 20% as the test set.
- 2)
- Stationarity test: The ADF test (p < 0.05) confirms the original sequence is non-stationary and becomes stationary after first-order differencing (d = 1).
- 3)
- ARIMA parameter setting: The ARIMA model parameters are determined as (5,1,0). Specifically, p = 5 represents the autoregressive order confirmed by the truncation feature of PACF; d = 1 denotes adopting first-order difference processing to realize sequence stationarization; q = 0 means there is no obvious moving average feature in residual sequences, and this parameter combination is finally determined based on the minimum BIC.where is the first-order difference sequence, and is white noise.
- 4)
- Linear prediction and residual extraction: Predict the test set to obtain the linear-trend prediction value .
- 5)
- Residual data standardization: Normalize residuals to [0, 1] using MinMaxScaler.
- 6)
- Perform a stationarity test on the residual sequence, which is a stationary sequence (p < 0.05). At the same time, ACF and PACF have no obvious tail or truncation features, indicating that the residual has basically eliminated linear information, and the remaining part is a stationary nonlinear component, suitable as input for an LSTM model for nonlinear modeling.
- 7)
- Sequence construction: The LSTM predicts based on the latest 10 residuals to avoid information loss. The window length is L = 10, and it is determined via multi-group window comparative cross-validation. We set five candidate window lengths, including 5, 8, 10, 12, and 10 for repeated tests. The verification results show that when L = 10, the model achieves the minimum prediction error and optimal stability, which can effectively balance the extraction efficiency of time-series dependent features and overall computational cost. The i-th sample is
- 8)
- LSTM network structure: The input layer receives sequences of shape (L,1); the LSTM layer has 50 neurons with the Relu activation function (captures long-term dependencies); the output layer outputs 1 value (predicted residual). The model uses the Adam optimizer, MSE loss function, 50 training epochs, and a batch size of 16.
- 9)
- Combined prediction: A recursive prediction strategy is adopted for workplace accident prediction. A rolling recursive strategy is adopted: each step predicts only one month ahead. The predicted value is then fed back into the input window to update the LSTM sequence. This process iterates until all 12 months are predicted, ensuring temporal continuity and stability.
- (2)
- Calculation Results
4.3. Model Comparative Analysis
5. Conclusions
- (1)
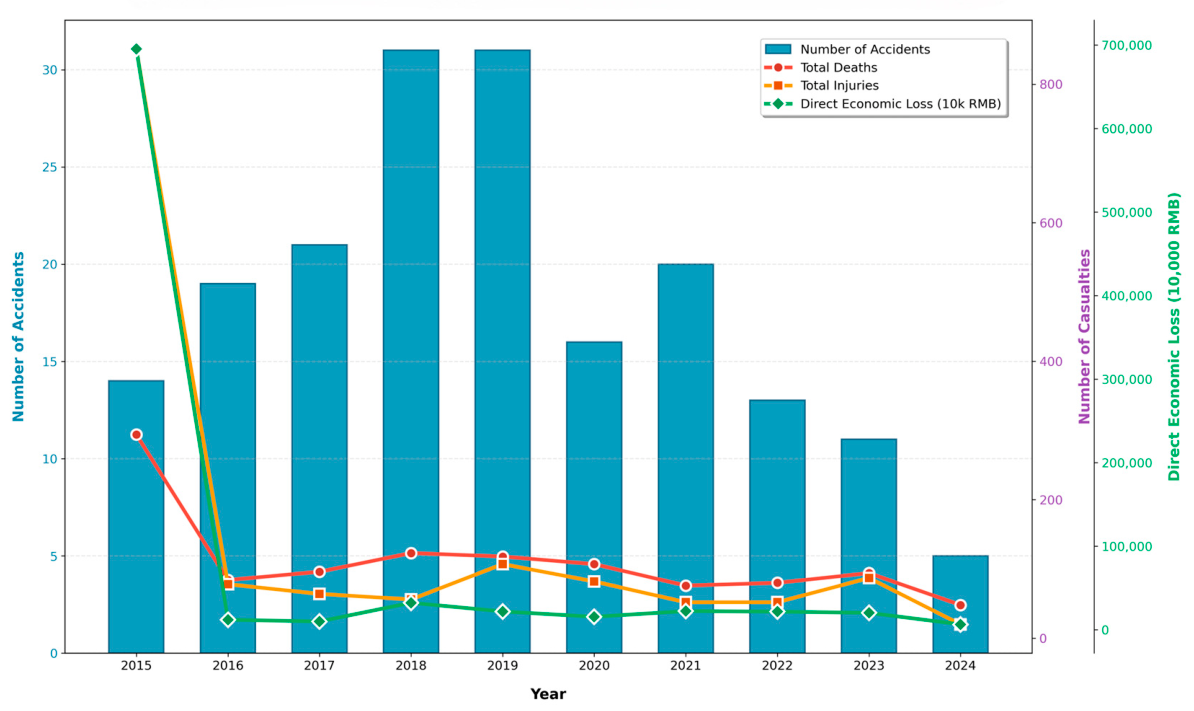
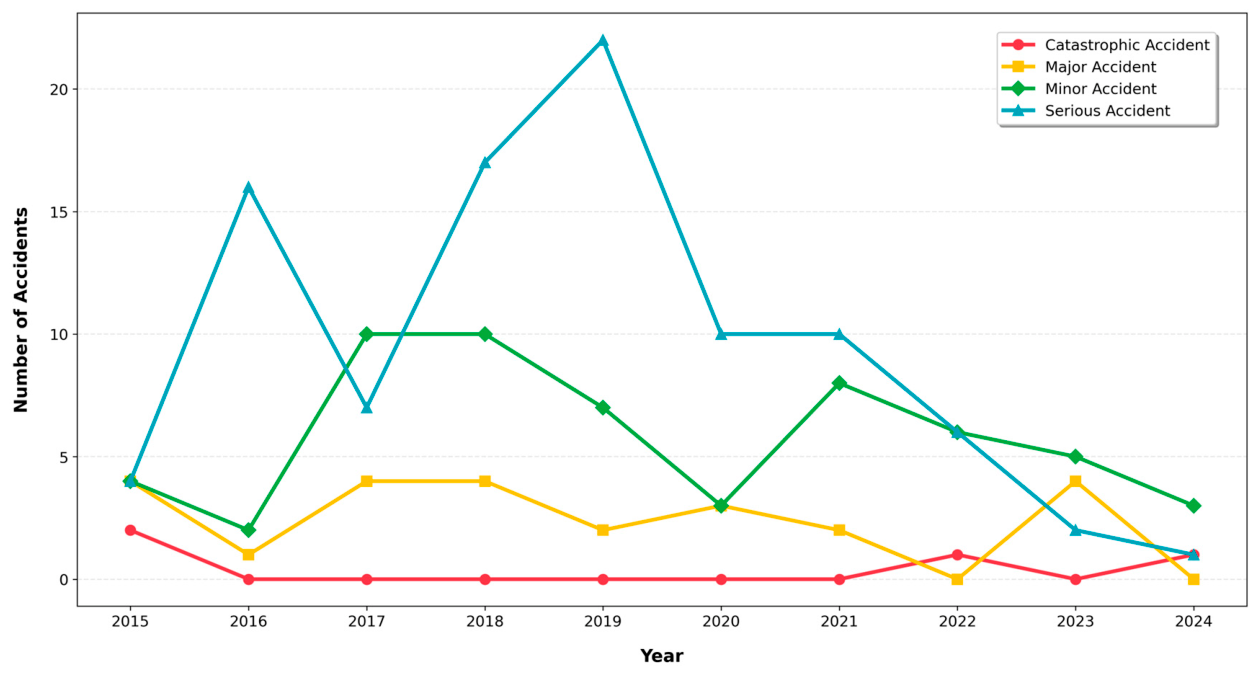
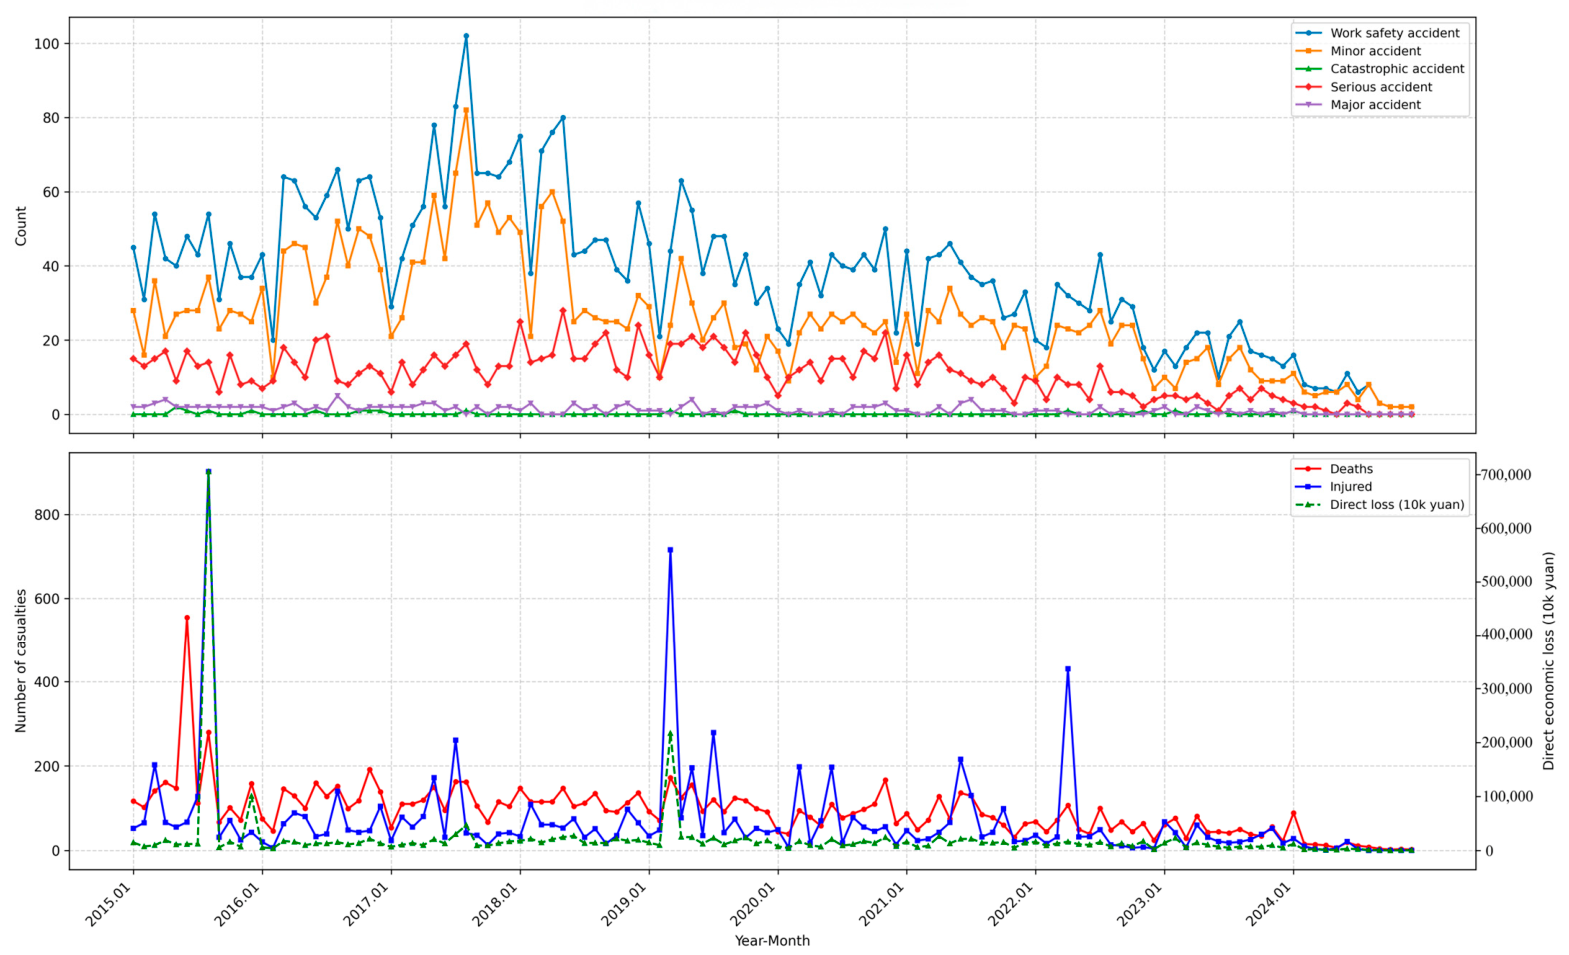
- Typical national fire accidents from 2015 to 2024 showed an improving trend. They were highly concentrated in four industries: commerce and trade, light industry, chemical industry, and construction. Among them, commerce and trade had the highest accident frequency. Although the number of accidents in the chemical industry was small, the consequences were more serious.
- (2)
- Workplace accident data have both linear evolution and local nonlinear fluctuation characteristics. The ARIMA-LSTM combined model, through the mechanism of “linear decomposition + nonlinear correction”, adapts to these dual features. Its prediction accuracy is better than that of single models, providing a feasible technical approach for such data prediction.
- (3)
- Under the accident dataset and verification scenario from 2015 to 2024, the MAE, RMSE, and MSE quantitative error indicators of the ARIMA-LSTM model were all better than those of the comparison models. The model had better adaptability to trend continuity and fluctuation response of accident data and can provide a quantitative reference for analyzing accident evolution laws.
- (4)
- These predictions enable early identification of high-risk periods and industries for targeted prevention, quantify accident trends to optimize safety resource allocation, and provide data support for policy-making and proactive prevention.
Author Contributions
Funding
Data Availability Statement
Conflicts of Interest
References
- Zhang, X.L.; Lin, Y.J.; Shi, C.L.; Zhang, J.P. Numerical simulation on the maximum temperature and smoke back-layering length in a tilted tunnel under natural ventilation. Tunn. Undergr. Space Technol. 2021, 107, 103661. [Google Scholar] [CrossRef] [Scilit]
- Qin, R.S.; Shi, C.C.; Chen, C.; Lan, M.; Liu, X.Y.; Xiao, J.F. Risk analysis on fire accident of urban commercial complex based on fuzzy Bayesian network. China Saf. Sci. J. 2023, 33, 176–182. [Google Scholar]
- Lin, X.; Song, S.; Zhai, H.; Yuan, P.; Chen, M. Using catastrophe theory to analyze subway fire accidents. Int. J. Syst. Assur. Eng. Manag. 2020, 11, 223–235. [Google Scholar] [CrossRef] [Scilit]
- Li, Y.; Rong, W. Analysis of subway fire accident based on Bayesian network. J. Phys. Conf. Ser. 2021, 1910, 012039. [Google Scholar] [CrossRef] [Scilit]
- Kim, J.; Youm, S.; Shan, Y.; Kim, J. Analysis of fire accident factors on construction sites using web crawling and deep learning approach. Sustainability 2021, 13, 11694. [Google Scholar] [CrossRef] [Scilit]
- Sharaf, A.; Moudhi, A. Bayesian hierarchical statistics for traffic safety modelling and forecasting. Int. J. Inj. Control Saf. Promot. 2020, 27, 99–111. [Google Scholar]
- Ordysński, S. Prediction of the injury severity of accidents at work: A new approach to analysis of already existing statistical data. Appl. Sci. 2025, 15, 10666. [Google Scholar] [CrossRef] [Scilit]
- Hong, D.H.; Kim, J.; Kim, W.; Lee, Y. Development of traffic accident prediction models by traffic and road characteristics in urban areas. Proc. East. Asia Soc. Transp. Stud. 2005, 5, 2046–2061. [Google Scholar]
- Dhamaniya, A. Development of accident prediction model under mixed traffic conditions: A case study. J. Traffic Transp. Eng. 2024, 12, 187–195. [Google Scholar] [CrossRef] [Scilit]
- Qu, L.; Jia, Y.Y.; Sabier, Z.L.J.; Ren, J.X. Research on highway accident prediction based on improved grey Markov model. In Proceedings of the CICTP 2025: Transportation, Artificial Intelligence, and Energy, Guangzhou, China, 22–25 July 2025. [Google Scholar]
- Yang, Y.H.; Zhang, Y.; Zheng, T.; Tian, Q.Y. Research on traffic accident prediction of expressway tunnel based on B-NB model. Traffic Inj. Prev. 2024, 25, 527–536. [Google Scholar] [CrossRef] [Scilit]
- Pandey, S.; Singh, A.K.; Parhi, S.; Jha, S.K. Towards safer steel operations with a multi-model framework for accident prediction and risk assessment simulation. Sci. Rep. 2025, 15, 13293. [Google Scholar] [CrossRef] [Scilit]
- Xia, X.; Xiang, P.; Khanmohammadi, S.; Gao, T.; Arashpour, M. Predicting safety accident costs in construction projects using ensemble data-driven models. J. Constr. Eng. Manag. 2024, 150, 15. [Google Scholar] [CrossRef] [Scilit]
- Shin, Y. Application of stochastic gradient boosting approach to early prediction of safety accidents at construction site. Adv. Civ. Eng. 2019, 157429, 9. [Google Scholar] [CrossRef] [Scilit]
- Chen, B.; Huang, Y.; Zheng, Y.; Liu, X. From prediction to prevention: Using text mining and explainable machine learning for urban bus accident analytics. Risk Anal. 2026, 46, e70183. [Google Scholar] [CrossRef] [Scilit]
- Zhang, C.; Zou, X.; Lin, C. Fusing XGBoost and SHAP models for maritime accident prediction and causality interpretability analysis. J. Mar. Sci. Eng. 2022, 10, 1154. [Google Scholar] [CrossRef] [Scilit]
- Brandt, P.; Munim, Z.H.; Chaal, M.; Kang, H. Maritime accident risk prediction integrating weather data using machine learning. Transp. Res. Part D 2024, 136, 104388. [Google Scholar] [CrossRef] [Scilit]
- Tang, J.M.; Huang, Y.; Liu, D.L.; Xiong, L.Y.; Bu, R.W. Research on traffic accident severity level prediction model based on improved machine learning. Systems 2025, 13, 31. [Google Scholar] [CrossRef] [Scilit]
- Chen, F.; Liu, X.Q.; Yang, J.J.; Liu, X.K.; Ma, J.H.; Chen, J.; Xiao, H.Y. Traffic accident severity prediction based on an enhanced MSCPO-XGBoost hybrid model. Sci. Rep. 2025, 15, 25729. [Google Scholar] [CrossRef] [Scilit] [PubMed]
- Kim, G.; Lim, S. Development of an interpretable maritime accident prediction system using machine learning techniques. IEEE Access. 2022, 10, 41313–41329. [Google Scholar] [CrossRef] [Scilit]
- Kumar, V.; Suman, S.K. Traffic accident analysis and development of accident prediction model for four-lane divided national highway. Int. J. Heavy Veh. Syst. 2025, 1, 798–822. [Google Scholar] [CrossRef] [Scilit]
- Xiong, M.L.; Hou, Z.G.; Wang, H.W.; Che, C.; Luo, R. An aviation accident prediction method based on MTCNN and Bayesian optimization. Knowl. Inf. Syst. 2024, 66, 6079–6100. [Google Scholar] [CrossRef] [Scilit]
- Zeng, H.; Ren, B.; Zhang, L.; Zhang, H.; Cui, L.; Guo, J. Enhanced small-sample aviation accident prediction via an improved WCGAN incorporating neural prophet and gradient penalty. Reliab. Eng. Syst. Saf. 2026, 265, 111524. [Google Scholar] [CrossRef] [Scilit]
- Bae, J.Y.; Song, C.H.; Song, J.H.; Lee, J.I.; Seo, M.; Kim, S.J. Prediction of severe accident progression using machine learning with data-driven surrogate modeling as operator support tool. Int. J. Energy Res. 2026, 1416259, 27. [Google Scholar] [CrossRef] [Scilit]
- Yin, X.; Jin, J.; Zhang, Z. Interpretable accident prediction at highway-rail grade crossings: A deep learning approach. Comput. Ind. Eng. 2025, 207, 111337. [Google Scholar] [CrossRef] [Scilit]
- Harada, K.; Maruyama, Y.; Tashiro, T.; Ohashi, G. Traffic accident prediction without object detection for single-vehicle accidents: Special section on image media quality. IEICE Trans. Fundam. Electron. Commun. Comput. Sci. 2025, E108-A, 906–916. [Google Scholar] [CrossRef] [Scilit]
- Li, C.J.; Zhang, B.R.; Wang, Z.Y.; Yang, Y.; Zhou, X.J.; Pan, S.R.; Yu, X.H. Interpretable traffic accident prediction: Attention spatial-temporal multi-graph traffic stream learning approach. IEEE Trans. Intell. Transp. Syst. 2024, 25, 15574–15586. [Google Scholar] [CrossRef] [Scilit]
- Hu, Y.Q.; Zheng, S.M.; Zhang, Z.R.; Wang, S.M.; Ye, D.D.; Wu, M.Q.; Li, X.H.; Yu, R. Leveraging LLMs in cloud-edge networks for traffic risk prediction and accident severity analysis. IEEE Trans. Netw. Sci. Eng. 2026, 13, 438–453. [Google Scholar] [CrossRef] [Scilit]
- Zhao, K.; Lu, X.L.; Wan, L.N.; Zhang, L.; Zhang, L.L.; Wang, Q.B.; He, M.; Gao, J.H. A knowledge graph-based method for hazardous chemical accident prediction. In Advanced Intelligent Computing Technology and Applications; Springer: Singapore, 2025. [Google Scholar]
- Oksana, M.; Nadezhda, F.; Yuriy, P. Hybrid model for time series of complex structure with ARIMA components. Mathematics 2021, 9, 1122. [Google Scholar] [CrossRef] [Scilit]
- Zhang, Y.Y.; Shang, J.; Chen, X.; Liang, K. A self-learning detection method of sybil attack based on LSTM for electric vehicles. Energies 2020, 13, 1382. [Google Scholar] [CrossRef] [Scilit]
- Wang, W.; Ma, B.; Guo, X.; Chen, Y.; Xu, Y. A hybrid ARIMA-LSTM model for short-term vehicle speed prediction. Energies 2024, 17, 3736. [Google Scholar] [CrossRef] [Scilit]
- Zhang, X.L.; Hu, L.H.; Delichatsios, M.A.; Zhang, J.P. Experimental study and analysis on flame lengths induced by wall-attached fire impinging upon an inclined ceiling. Proc. Combust. Inst. 2019, 37, 3879–3887. [Google Scholar] [CrossRef] [Scilit]
- Zhang, X.L.; Shi, C.L.; Hu, L.H. Temperature profile of impingement flow in the corner between wall and inclined ceiling induced by gaseous fuel jet flame. Fuel 2020, 259, 116232. [Google Scholar] [CrossRef] [Scilit]
- Zhang, W.Q.; Lin, Z.; Liu, X.L. Short-term offshore wind power forecasting- a hybrid model based on discrete wavelet transform (dwt), seasonal autoregressive integrated moving average (SARIMA), and deep-learning-based long short-term memory (LSTM). Renew. Energy 2022, 185, 611–628. [Google Scholar] [CrossRef] [Scilit]
- Dubey, A.K.; Kumar, A.; García-Díaz, V.; Sharma, A.K.; Kanhaiya, K. Study and analysis of SARIMA and LSTM in forecasting time series data. Sustain. Energy Technol. Assess. 2021, 47, 101474. [Google Scholar]






| Year | Number of Minor Accident Reports | Number of Serious Accident Reports | Number of Major Accident Reports | Number of Catastrophic Accident Reports |
|---|---|---|---|---|
| 2015 | 324 | 152 | 27 | 5 |
| 2016 | 475 | 151 | 24 | 4 |
| 2017 | 587 | 150 | 21 | 1 |
| 2018 | 422 | 215 | 16 | 0 |
| 2019 | 281 | 204 | 18 | 2 |
| 2020 | 262 | 151 | 13 | 0 |
| 2021 | 292 | 124 | 13 | 0 |
| 2022 | 233 | 79 | 7 | 2 |
| 2023 | 144 | 55 | 8 | 2 |
| 2024 | 63 | 13 | 1 | 1 |
| Total | 3083 | 1294 | 148 | 17 |
| Months | Number of Accidents | Minor Accident | Catastrophic Accident | Serious Accident | Major Accident |
|---|---|---|---|---|---|
| 1 | 16 | 7 | 1 | 8 | 0 |
| 2 | 15 | 2 | 0 | 10 | 3 |
| 3 | 13 | 2 | 0 | 11 | 0 |
| 4 | 19 | 8 | 0 | 8 | 3 |
| 5 | 15 | 5 | 1 | 8 | 1 |
| 6 | 17 | 5 | 0 | 9 | 3 |
| 7 | 16 | 6 | 0 | 9 | 1 |
| 8 | 20 | 7 | 1 | 10 | 2 |
| 9 | 15 | 8 | 0 | 5 | 2 |
| 10 | 11 | 2 | 0 | 7 | 2 |
| 11 | 14 | 4 | 1 | 6 | 3 |
| 12 | 10 | 2 | 0 | 4 | 4 |
| Total | 181 | 58 | 4 | 95 | 24 |
| Prediction Indicator | Model Evaluation Index | ARIMA | SARIMA | LSTM | SARIMA-LSTM | ARIMA-LSTM |
|---|---|---|---|---|---|---|
| Total Number of Accidents | MSE | 102.24 | 79.55 | 240.8 | 146.3864 | 10.0978 |
| RMSE | 10.11 | 8.92 | 15.52 | 12.099 | 3.1777 | |
| MAE | 9.33 | 8.26 | 14.11 | 11.5354 | 2.9252 | |
| Number of Minor Accidents | MSE | 31.55 | 34.14 | 299.18 | 49.0948 | 3.6594 |
| RMSE | 5.62 | 5.84 | 17.3 | 7.0068 | 1.9130 | |
| MAE | 5.06 | 5.49 | 16.49 | 6.4187 | 1.6154 | |
| Number of Serious Accidents | MSE | 15.48 | 21.8 | 126.64 | 13.8255 | 1.3306 |
| RMSE | 3.93 | 4.67 | 11.25 | 3.7183 | 1.1535 | |
| MAE | 3.75 | 4.32 | 10.8 | 3.4187 | 0.9813 | |
| Number of Major Accidents | MSE | 0.4 | 0.4 | 0.68 | 0.1797 | 0.0850 |
| RMSE | 0.63 | 0.63 | 0.82 | 0.4239 | 0.2915 | |
| MAE | 0.63 | 0.63 | 0.74 | 0.373 | 0.2103 | |
| Number of Catastrophic Accidents | MSE | 0.08 | 0.08 | 0.08 | 0.0879 | 0.0742 |
| RMSE | 0.28 | 0.28 | 0.29 | 0.2965 | 0.2724 | |
| MAE | 0.21 | 0.19 | 0.14 | 0.2478 | 0.1262 | |
| Number of Deaths | MSE | 1901.82 | 1587.54 | 2613.71 | 1890.4211 | 391.5299 |
| RMSE | 43.61 | 39.84 | 51.12 | 43.479 | 19.7871 | |
| MAE | 43.04 | 39.37 | 48.77 | 41.3306 | 13.6351 | |
| Number of Injuries | MSE | 5402.8 | 1026.25 | 5988.46 | 2937.1623 | 132.5097 |
| RMSE | 71.01 | 32.04 | 77.39 | 54.1956 | 11.5113 | |
| MAE | 70.45 | 30.95 | 59.73 | 45.6776 | 8.7090 | |
| Direct Economic Loss | MSE | 441,099,926.9 | 184,177,565.4 | 75,385,363.82 | 24,261,980.09 | 8,642,228.3706 |
| RMSE | 21,002.38 | 13,571.2 | 8682.47 | 4925.6451 | 2939.7667 | |
| MAE | 20,770.84 | 13,210.06 | 7872.02 | 4351.3774 | 2107.4933 |
Disclaimer/Publisher’s Note: The statements, opinions and data contained in all publications are solely those of the individual author(s) and contributor(s) and not of MDPI and/or the editor(s). MDPI and/or the editor(s) disclaim responsibility for any injury to people or property resulting from any ideas, methods, instructions or products referred to in the content. |
© 2026 by the authors. Licensee MDPI, Basel, Switzerland. This article is an open access article distributed under the terms and conditions of the Creative Commons Attribution (CC BY) license.
Share and Cite
Xue, F.; Wu, B.; Ding, J.; Wang, C.; Ding, W.; Ren, F. Research on Characteristic Analysis of Typical Fire Accidents and Trend Prediction of Workplace Accidents. Fire 2026, 9, 229. https://doi.org/10.3390/fire9060229
Xue F, Wu B, Ding J, Wang C, Ding W, Ren F. Research on Characteristic Analysis of Typical Fire Accidents and Trend Prediction of Workplace Accidents. Fire. 2026; 9(6):229. https://doi.org/10.3390/fire9060229
Chicago/Turabian StyleXue, Fangming, Binbin Wu, Jiawei Ding, Chao Wang, Wei Ding, and Fei Ren. 2026. "Research on Characteristic Analysis of Typical Fire Accidents and Trend Prediction of Workplace Accidents" Fire 9, no. 6: 229. https://doi.org/10.3390/fire9060229
APA StyleXue, F., Wu, B., Ding, J., Wang, C., Ding, W., & Ren, F. (2026). Research on Characteristic Analysis of Typical Fire Accidents and Trend Prediction of Workplace Accidents. Fire, 9(6), 229. https://doi.org/10.3390/fire9060229