Article

Structural Response of a Steel-Frame Building to Traveling Fire

Department of Building, Civil and Environmental Engineering, Concordia University, Montreal, QC H3G 1M8, Canada
*
Author to whom correspondence should be addressed.
Fire 2026, 9(4), 154; https://doi.org/10.3390/fire9040154
Submission received: 29 December 2025 / Revised: 23 March 2026 / Accepted: 27 March 2026 / Published: 9 April 2026
(This article belongs to the Special Issue Advances in Structural Fire Engineering)

Abstract

This article investigates the response of an unprotected three-storey steel moment-resisting frame subjected to a suite of horizontally traveling fire scenarios. A series of multi-step finite-element simulations was conducted to analyze the impact of traveling fires on both the global and local responses of a low-rise building frame. The research considers a range of fire types, both uniform and spatially varying, as well as different locations, and sizes to capture a diverse array of fire scenarios. Non-uniform compartment fires are modeled using the improved traveling fire method (iTFM), while uniform fires are simulated using the Eurocode parametric (EC) fire model. Four traveling fire scenarios with floor area coverage ranging from 5% to 48% are examined. The resulting deformation patterns, along with bending moment and axial force distributions in critical beam and column sections within the fire compartments, are thoroughly evaluated. The findings reveal that, within the case study frame and the range of parametric analyses, a uniform compartment fire does not necessarily yield the worst-case scenario commonly assumed in design codes. Instead, global and local structural responses are primarily influenced by traveling fire scenarios.

1. Introduction

Fire can significantly reduce the load-carrying capacity and overall structural integrity, and this effect is even more critical in unprotected steel structures. Recently observed structural collapses, including the events of 11 September 2001, at the World Trade Centers (WTCs) [1] and the 16-storey Plasco building in Tehran in January 2017 [2] have heightened awareness and concern about the fire performance of steel frames, particularly when subjected to horizontal and vertical traveling fires. In addition, post-earthquake fire (PEF) is an important consideration for fire safety [3,4].
Most numerical studies of structural performance under fire conditions use either the standard fire (e.g., ISO 834 [5] or ASTM E119 [6]) or the Eurocode parametric fire curves [7] to simulate the temperature field within the affected compartment. These models assume a uniform temperature distribution throughout the compartment, regardless of its size. However, this assumption may not be realistic for large open-plan buildings. Furthermore, these fire models are inherently limited to small- to medium-sized compartments of less than 500 sqm and a maximum compartment height of 4 m. Moreover, observations from accidental fires show that natural fires travel horizontally along the floor and spread vertically to adjacent floors.
Advances in the design, construction, and use of modern large open-plan buildings have created a need for alternative, realistic design fires, such as traveling fires, to complement traditional methods for performance-based design. Stern-Gottfried [8] proposed a pioneering traveling fire methodology (TFM) that more accurately simulates realistic compartment fire scenarios than conventional methods. Unlike conventional fire models, the traveling fire method assumes a nonhomogeneous spatial temperature distribution within a compartment and accounts for a range of possible fire sizes. Contrary to the previous notion that uniform fires are the most severe for structures, studies of traveling fires have found them to be critical to structures [3]. A brief literature review of the development and application of horizontally and vertically traveling fires in steel structures is presented, along with critical observations that may be equally applicable to reinforced concrete structures.
Rackauskaite et al. [9] improved the earlier TFM model by accounting for more localized fire dynamics and renamed it iTFM. In the iTFM, based on possible fire spread rates, the range of fire sizes has been further reduced. They introduced the concept of flapping angle, which accounts for variability in near-field temperatures from 800 °C to 1200 °C, whereas the previous version used a conservative 1200 °C. The detailed formulation of iTFM is discussed in the following section.
Based on a review of one of the earliest large-scale experimental fire tests in the St. Lawrence Burns project in 1958, Gales [10] inferred that the heterogeneity of compartment temperatures, as observed in thermocouple data, aligns with the recent and novel traveling fires framework proposed by Stern-Gottfried [8].
Dai et al. [11] conducted a literature review of traveling fire research and presented a state-of-the-art overview, including experimental and theoretical work from the past twenty years. They also compared current analytical traveling fire models. They highlighted that the main challenge in developing tools to incorporate traveling fires into design is the lack of large-scale test data, and they recommended conducting large-scale traveling fire experiments to develop an analytical model for an alternative design fire.
Rezvani et al. [12] studied a seven-storey steel moment-resisting frame subjected to traveling post-earthquake fire scenarios. A static pushover analysis of the building frame was performed, in which the gravity-loaded structure was laterally pushed with an equivalent seismic load, gradually increased until the top displacement reached the life safety performance level, and then the structure was unloaded to determine residual damage. Following that, the damaged structure was subjected to traveling fires of different sizes, corresponding to 16.7, 50, and 100% of the fire size. For comparison, the structure was subjected to a uniform fire using the ISO 834 fire curve in the fourth case. Local damage, defined by the maximum deflection in critical beams, governed the PEF resistance of the structure in traveling fire scenarios, and the frame’s global stability was not affected by the traveling PEF. The structural failure was observed at 12, 9, 11, and 16 min for the traveling fire with 16.7%, 50.0%, and 100% of the fire size, and for the ISO 834 fire curve, respectively. Contrary to the widely held view that a simultaneous uniform fire yields the least PEF resistance, the study found that structures can be vulnerable to the PEF effect when traveling fire is involved.
Roben et al. [13] studied the effect of vertically traveling fire occurring over three-stories of a high rise structure by varying inter-storey fire travel time delays. The natural fire model was used in the study, which examined the fire’s cooling regime and highlighted the importance of axial beam stiffness. The fire travel time was observed to significantly affect the structure’s global behavior. However, only a limited number of fire scenarios were considered, so the worst-case rate of spread for vertical fires could not be determined. The cyclic movement of columns at each floor level was found to be critical for traveling fire because of the alternating heating and cooling experienced at adjacent floors.
Behnam and Ronagh [14] presented a sequential analysis of the post-earthquake fire (PEF) scenario in a 10-storey moment-resisting steel frame designed for the life safety (LS) level of performance per FEMA 356. A nonlinear pushover analysis was followed by a sequential thermal–structural analysis. The vertical spread of fire from the first, fourth, and seventh floors was considered, with a time delay of 5 to 25 min. It was observed that, when the frame was subjected to delayed fire spread, it failed during the cooling phase, whereas in other scenarios, it failed during the heating phase.
Memari et al. [15] developed a multi-resolution finite-element model to assess the local behavior of a connection with a reduced beam section, commonly used in strong-column, weak-beam design, as well as the frame’s global behavior. The PEF scenario was simulated using time history analysis, followed by sequential thermal–structural analysis. Generally, a smaller lateral drift was observed under uniform fire conditions than under earthquake loading.
Rackauskaite et al. [16] studied the response of a 10-storey steel-frame building subjected to horizontally and vertically traveling fires. They varied the fire floors from 1 to 10 and applied 5 fire types in each case, including the standard fire and four traveling fire scenarios. Both the fire type and the number of fire floors influenced the failure time and collapse mechanism. A reduction in material strength contributed to structural failure with a low number of fire floors, whereas thermal expansion caused failure with a larger number of fire floors. The observed collapse mechanism was either the pull-in of external columns or the frame swaying toward the fire origin. They also reported that a vertically traveling fire, with a time lag, resulted in larger axial forces in beams. However, the simultaneous fire scenario was more onerous.
Chandra et al. [3] studied a low-rise, unprotected steel-frame building and examined the effects of post-earthquake traveling fire, finding that horizontally traveling fire plays a significant role in PEF response. However, the effect of traveling fire under fire-only conditions was not investigated in detail.
Most studies on traveling fire focus on medium-to-high-rise structures that are fire-protected for 1 to 2 h. However, this article investigates the structural fire performance of an unprotected steel moment-resisting frame under horizontally traveling fire. The case study building considered here has three stories and three bays, with an unprotected steel frame. Although modest in scale, the structure provides insight into the characteristic behavior of fire events in unprotected structures, as in the Broadgate fire in London, a 14-storey building under construction [16], or the fully functional Plasco building in Tehran, which was never designed to resist fire loads and hence had neither sprinkler systems nor any passive fire protection material for structural members [2].

2. Materials and Methods

2.1. Case Study Structure

The three-storey steel building frame used in this study was designed by Brandow & Johnston Associates for the SAC Steel Project and is typical of low-rise buildings in the Los Angeles, California, region. Building details are available in FEMA-355C [17]. The case study building was selected because it has been used in previous uniform Eurocode compartment fire scenarios in studies of structural fire behavior and post-earthquake fire performance [3,15]. The present study focuses on the effect of traveling fire in fire-only scenarios, without a preceding seismic event.
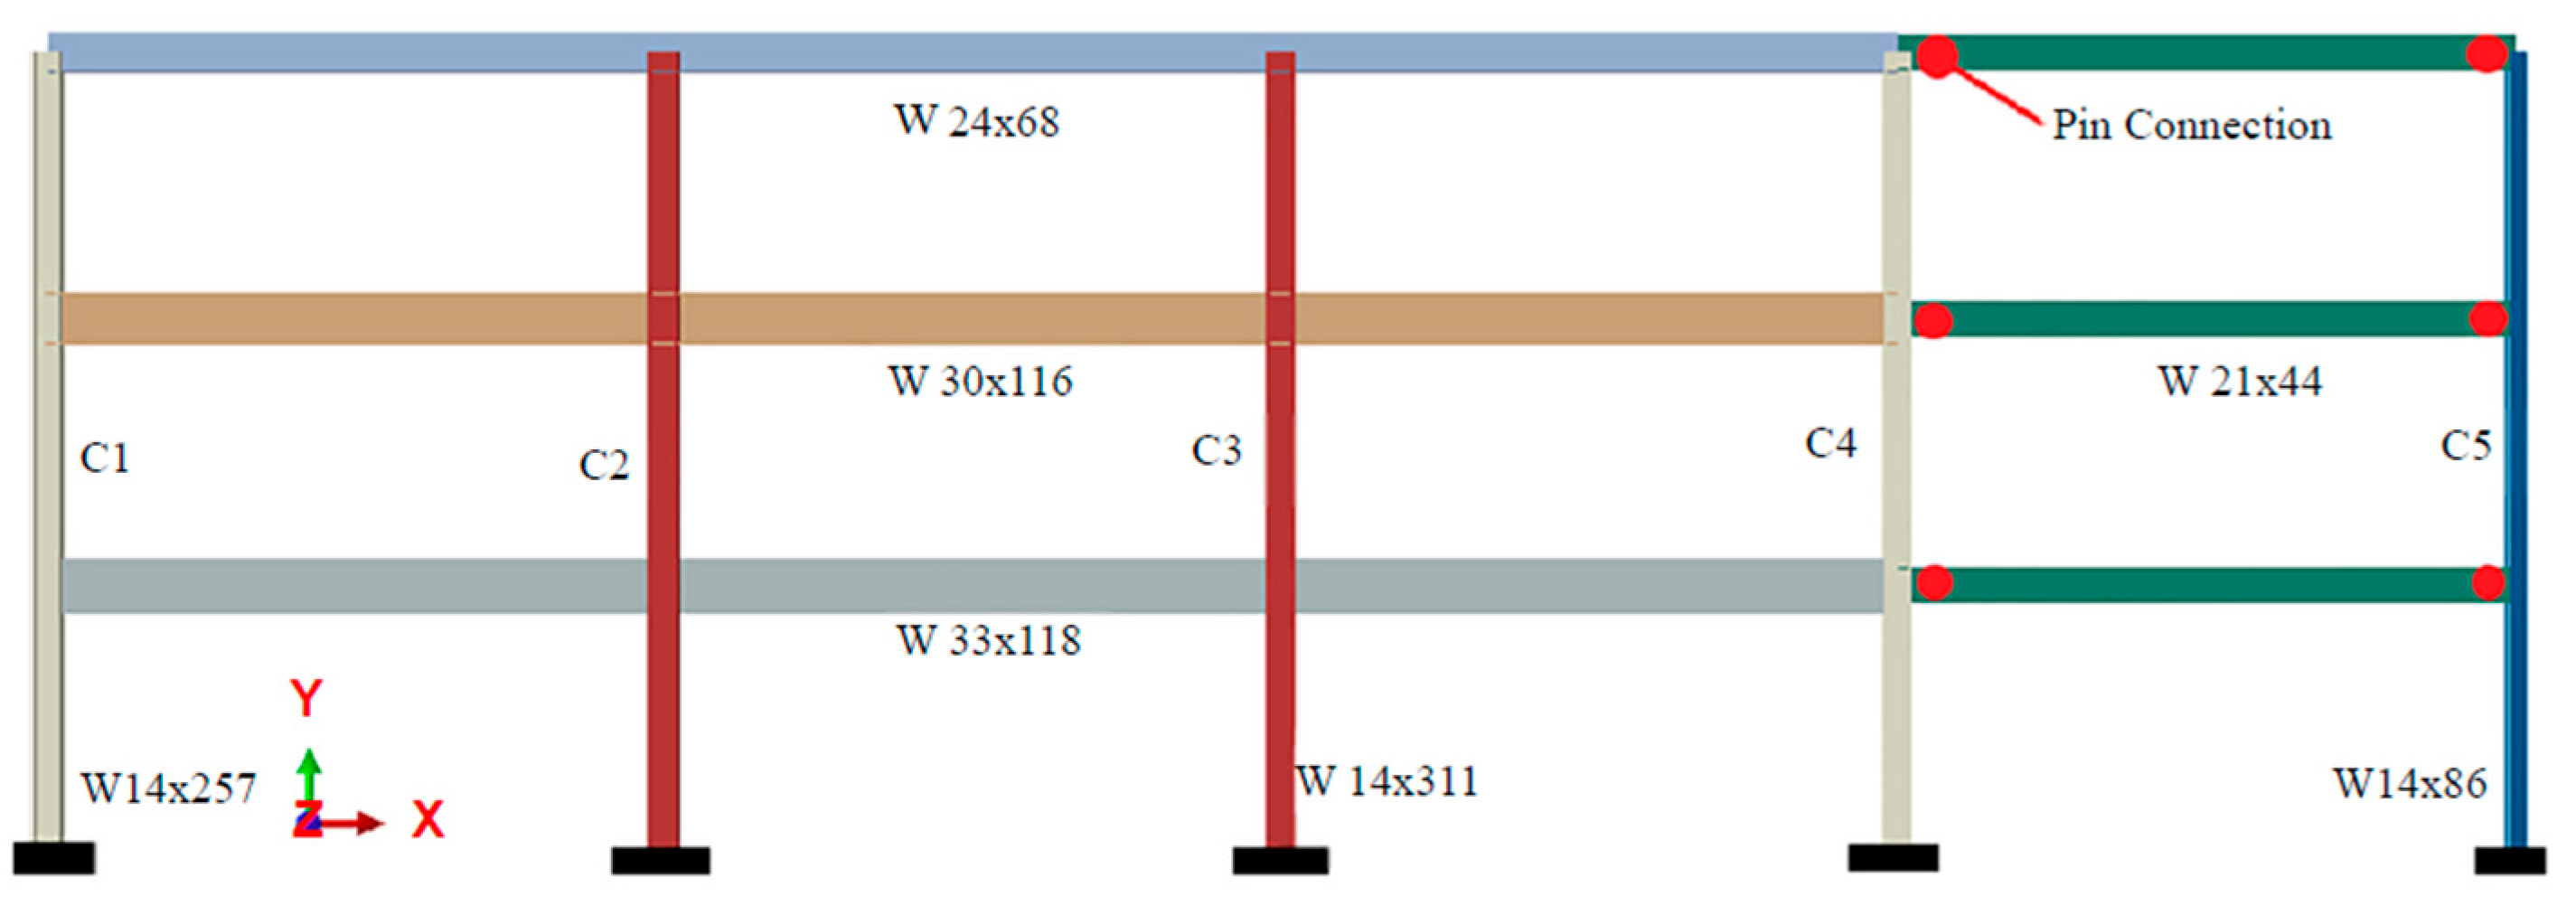
The building measures 36.58 m by 54.87 m in plan and stands 11.89 m above grade. Each bay is 9.15 m center-to-center in both directions. There are six bays in the east–west (E-W) direction and four in the north–south (N-S) direction. The typical floor height is 3.96 m. The column bases are considered fixed at the ground. The building’s lateral load-resisting system comprises four perimeter steel moment-resisting frames; the N-S perimeter frame is considered for the present study. The beam and column sections of the case-study frame are distinguished using unique colors. The beam-to-column connections in the first three bays are rigid, whereas the connection in the fourth bay is pinned, as indicated by the red circle in Figure 1.
The design dead loads on the floors and roof are 4.6 and 4 kPa, respectively, and the live load on all floors is 2.4 kPa [17]. The gravity load from a tributary width equal to half the bay width in the E-W direction was applied as a uniformly distributed load on the beams on each floor. The ASCE 7-prescribed load combinations are implemented in the sequential analysis steps. In the first step, the gravity load combination is 1.2 × D + 1.6 × L, and in the thermal–structural analysis step, the gravity load is reduced to 1.2 × D + 0.5 × L [18]. Table 1 summarizes the floor load and the equivalent uniformly distributed load on the beam in the two steps of analysis.
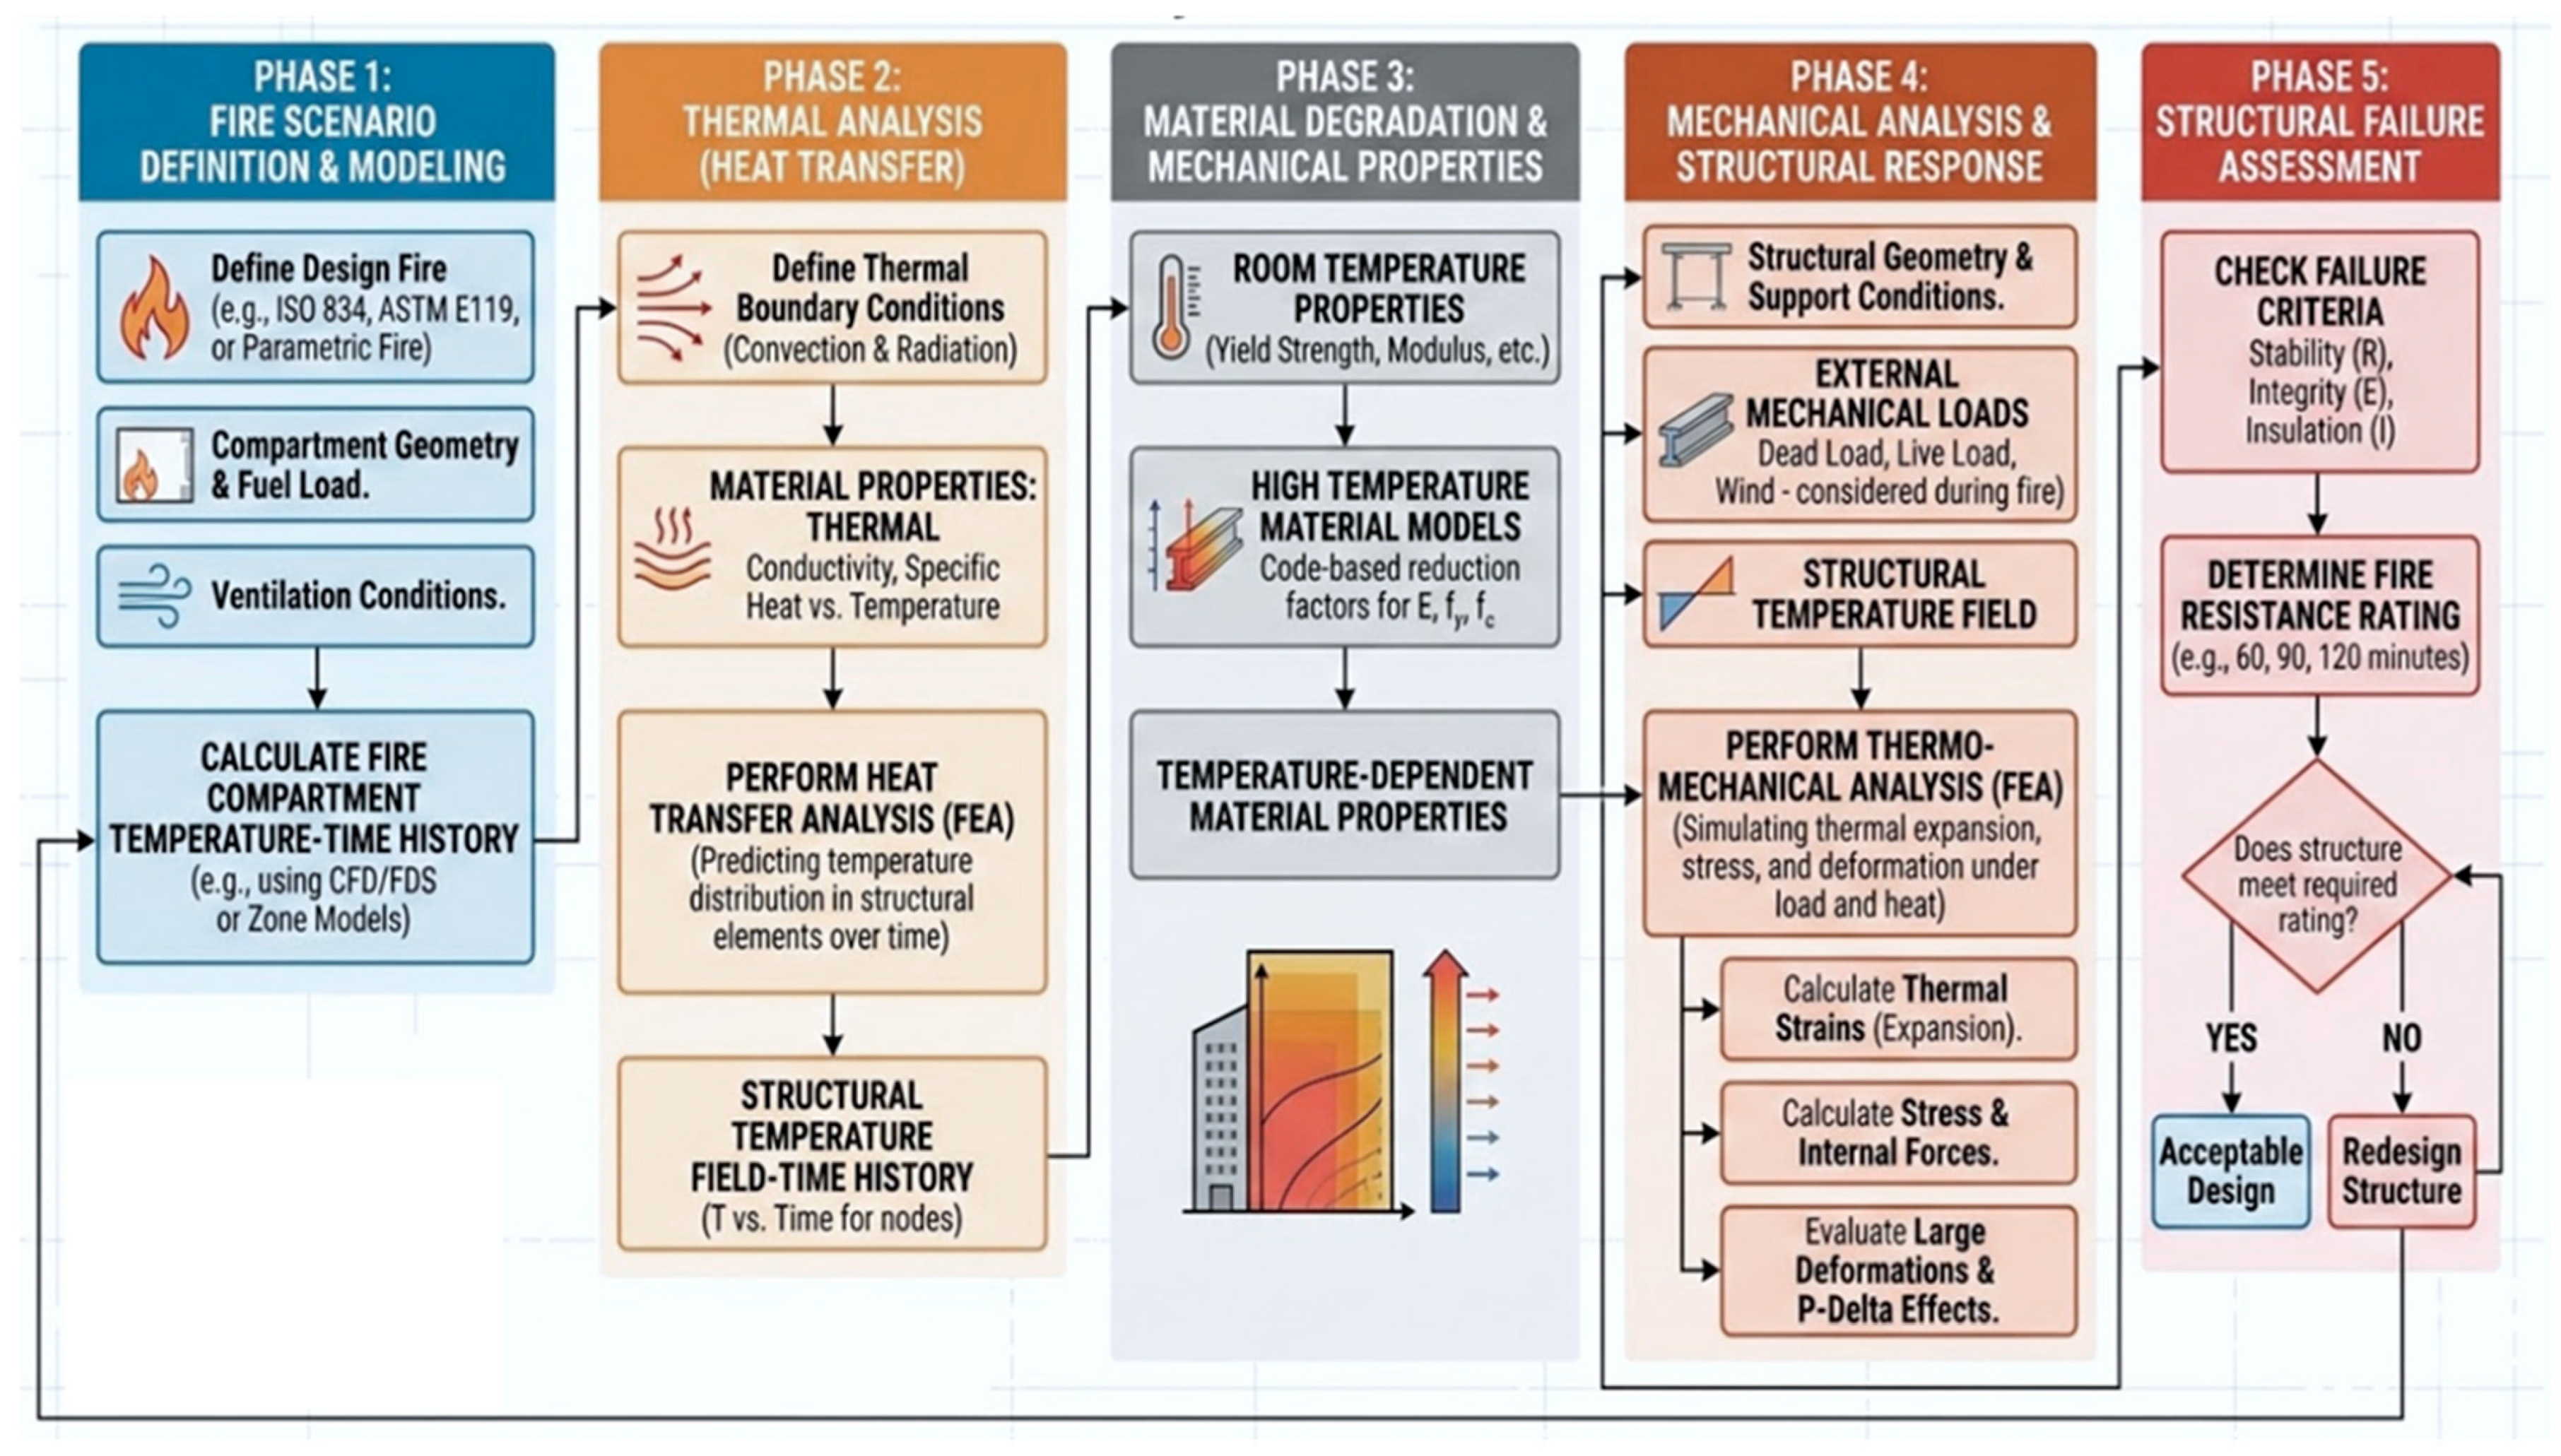
Figure 2 shows a flow chart for the typical steps for thermo-mechanical analysis of a building, subjected to high temperatures due to compartment fire. In Phase 1, the fire scenario is defined and modeled, which is followed by a heat-transfer analysis or thermal analysis of the structural section exposed to fire temperature (Phase 2). The temperature–time history in the body of the structural section determined from the heat-transfer analysis is then applied to the structure’s nodes of the structural or mechanical model and temperature-dependent material properties are assigned for the materials used in the structure (Phase 3). Using the temperature-dependent material model and the temperature–time history obtained from the thermal analysis and that applied to the structural model, a nonlinear mechanical analysis is performed to determine the structural response (Phase 4), which is then used for the structural failure analysis (Phase 5). The details of each phase of the analysis are provided in Figure 2. In this figure CFD and FDS appearing in Phase 1 indicate Computational Fluid Dynamics and Fire Dynamics Simulation, respectively; T vs. Time mentioned in Phase 2 indicates the variation of temperature with time; E, fy and fc mentioned in Phase 3 denote the modulus of elasticity, the yield strength of steel and crushing strength of concrete (where applicable), respectively; and P-Delta effect mentioned in Phase 4 indicates the axial force effect on the flexural response of the structure.
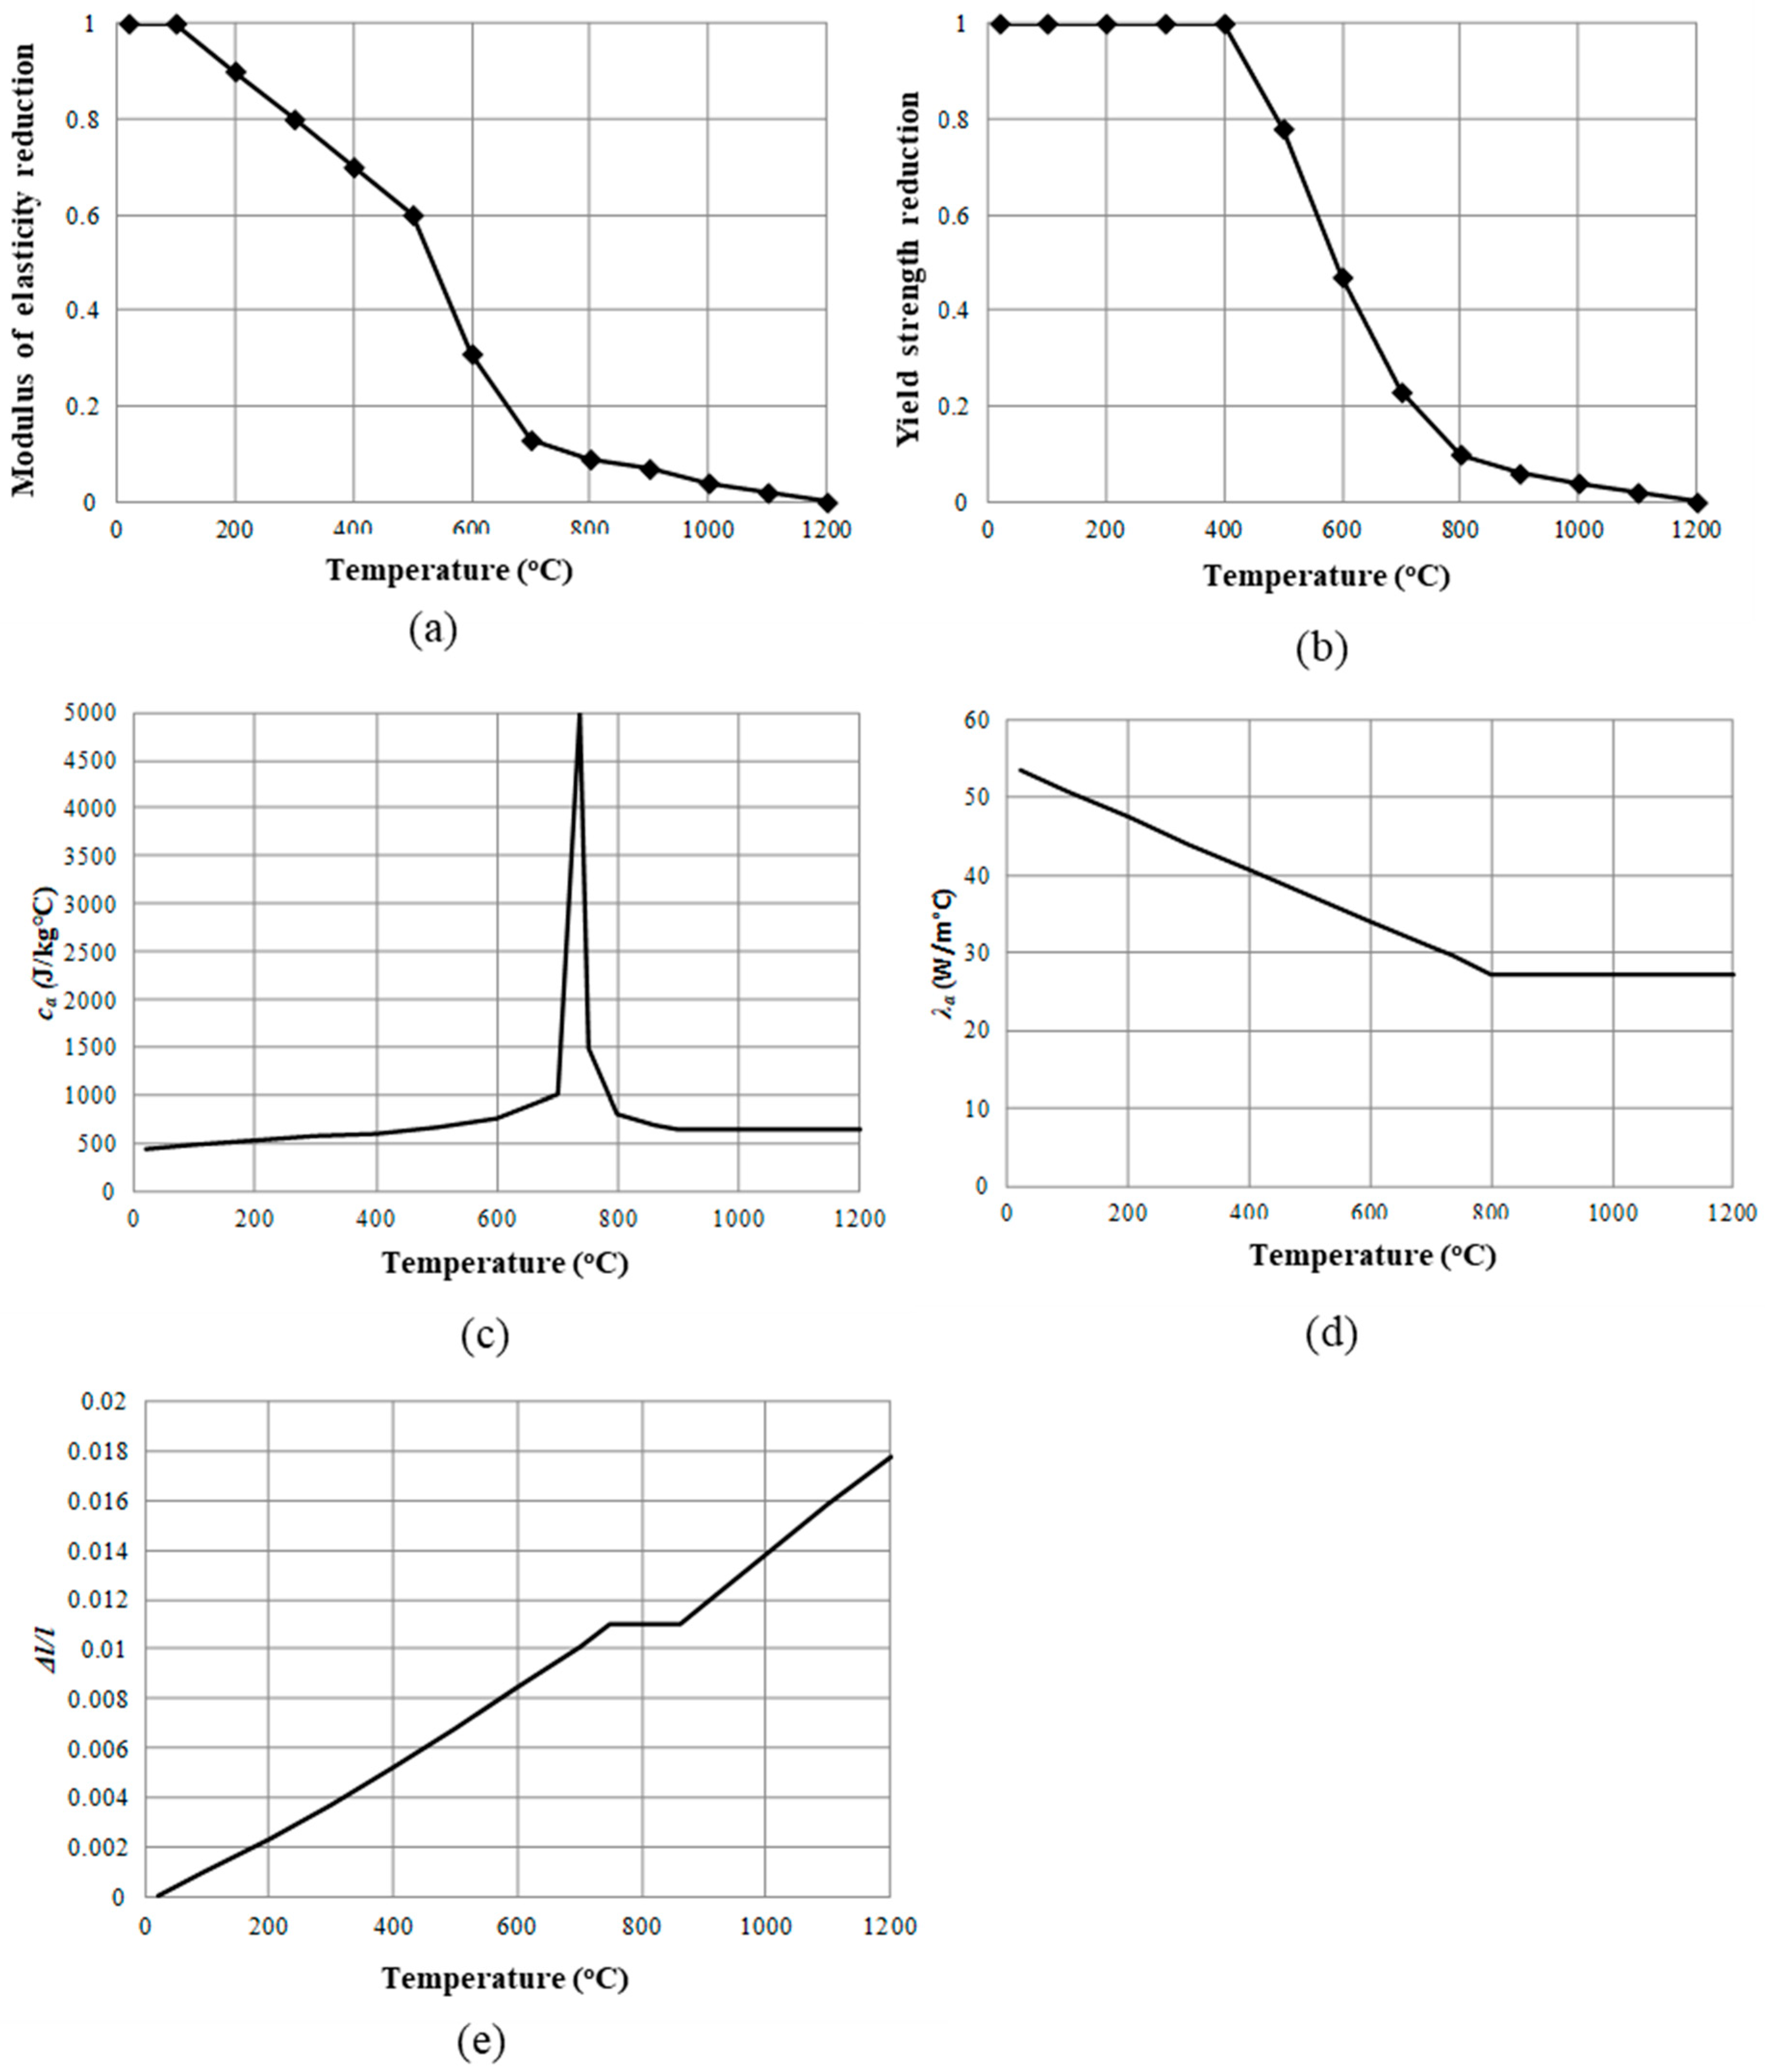
An elastic–perfectly plastic structural steel model, with a nominal yield strength of 345 MPa and modulus of elasticity 210 GPa, was used for the analysis of the frame under the gravity loadings. The thermo-mechanical analysis considered the transient yield strength and modulus of elasticity for the fire duration. The temperature-dependent material property formulations considered in the heat-transfer and thermal–structural analysis are shown in Figure 3 based on Eurocode 3 [19].

2.2. Fire Scenarios

The magnitude of fire, in terms of extent, duration, and peak temperature within large building compartments, varies widely and remains uncertain before such events. Consequently, it is inappropriate to assume a single fire temperature as depicted in standard fire models (ISO 834 [5] and ASTM E119 [6]) or in the parametric fire curve prescribed by the Eurocode [7]. Conversely, the traveling fire methodology, which considers a family of fire curves spanning a wide range of potential fire scenarios, provides a more realistic simulation and can accurately model the spatial variation in fire in large open-plan compartments [8]. Therefore, this study employs an improved version of the traveling fire method (iTFM), as developed by Rackauskaite et al. [9].
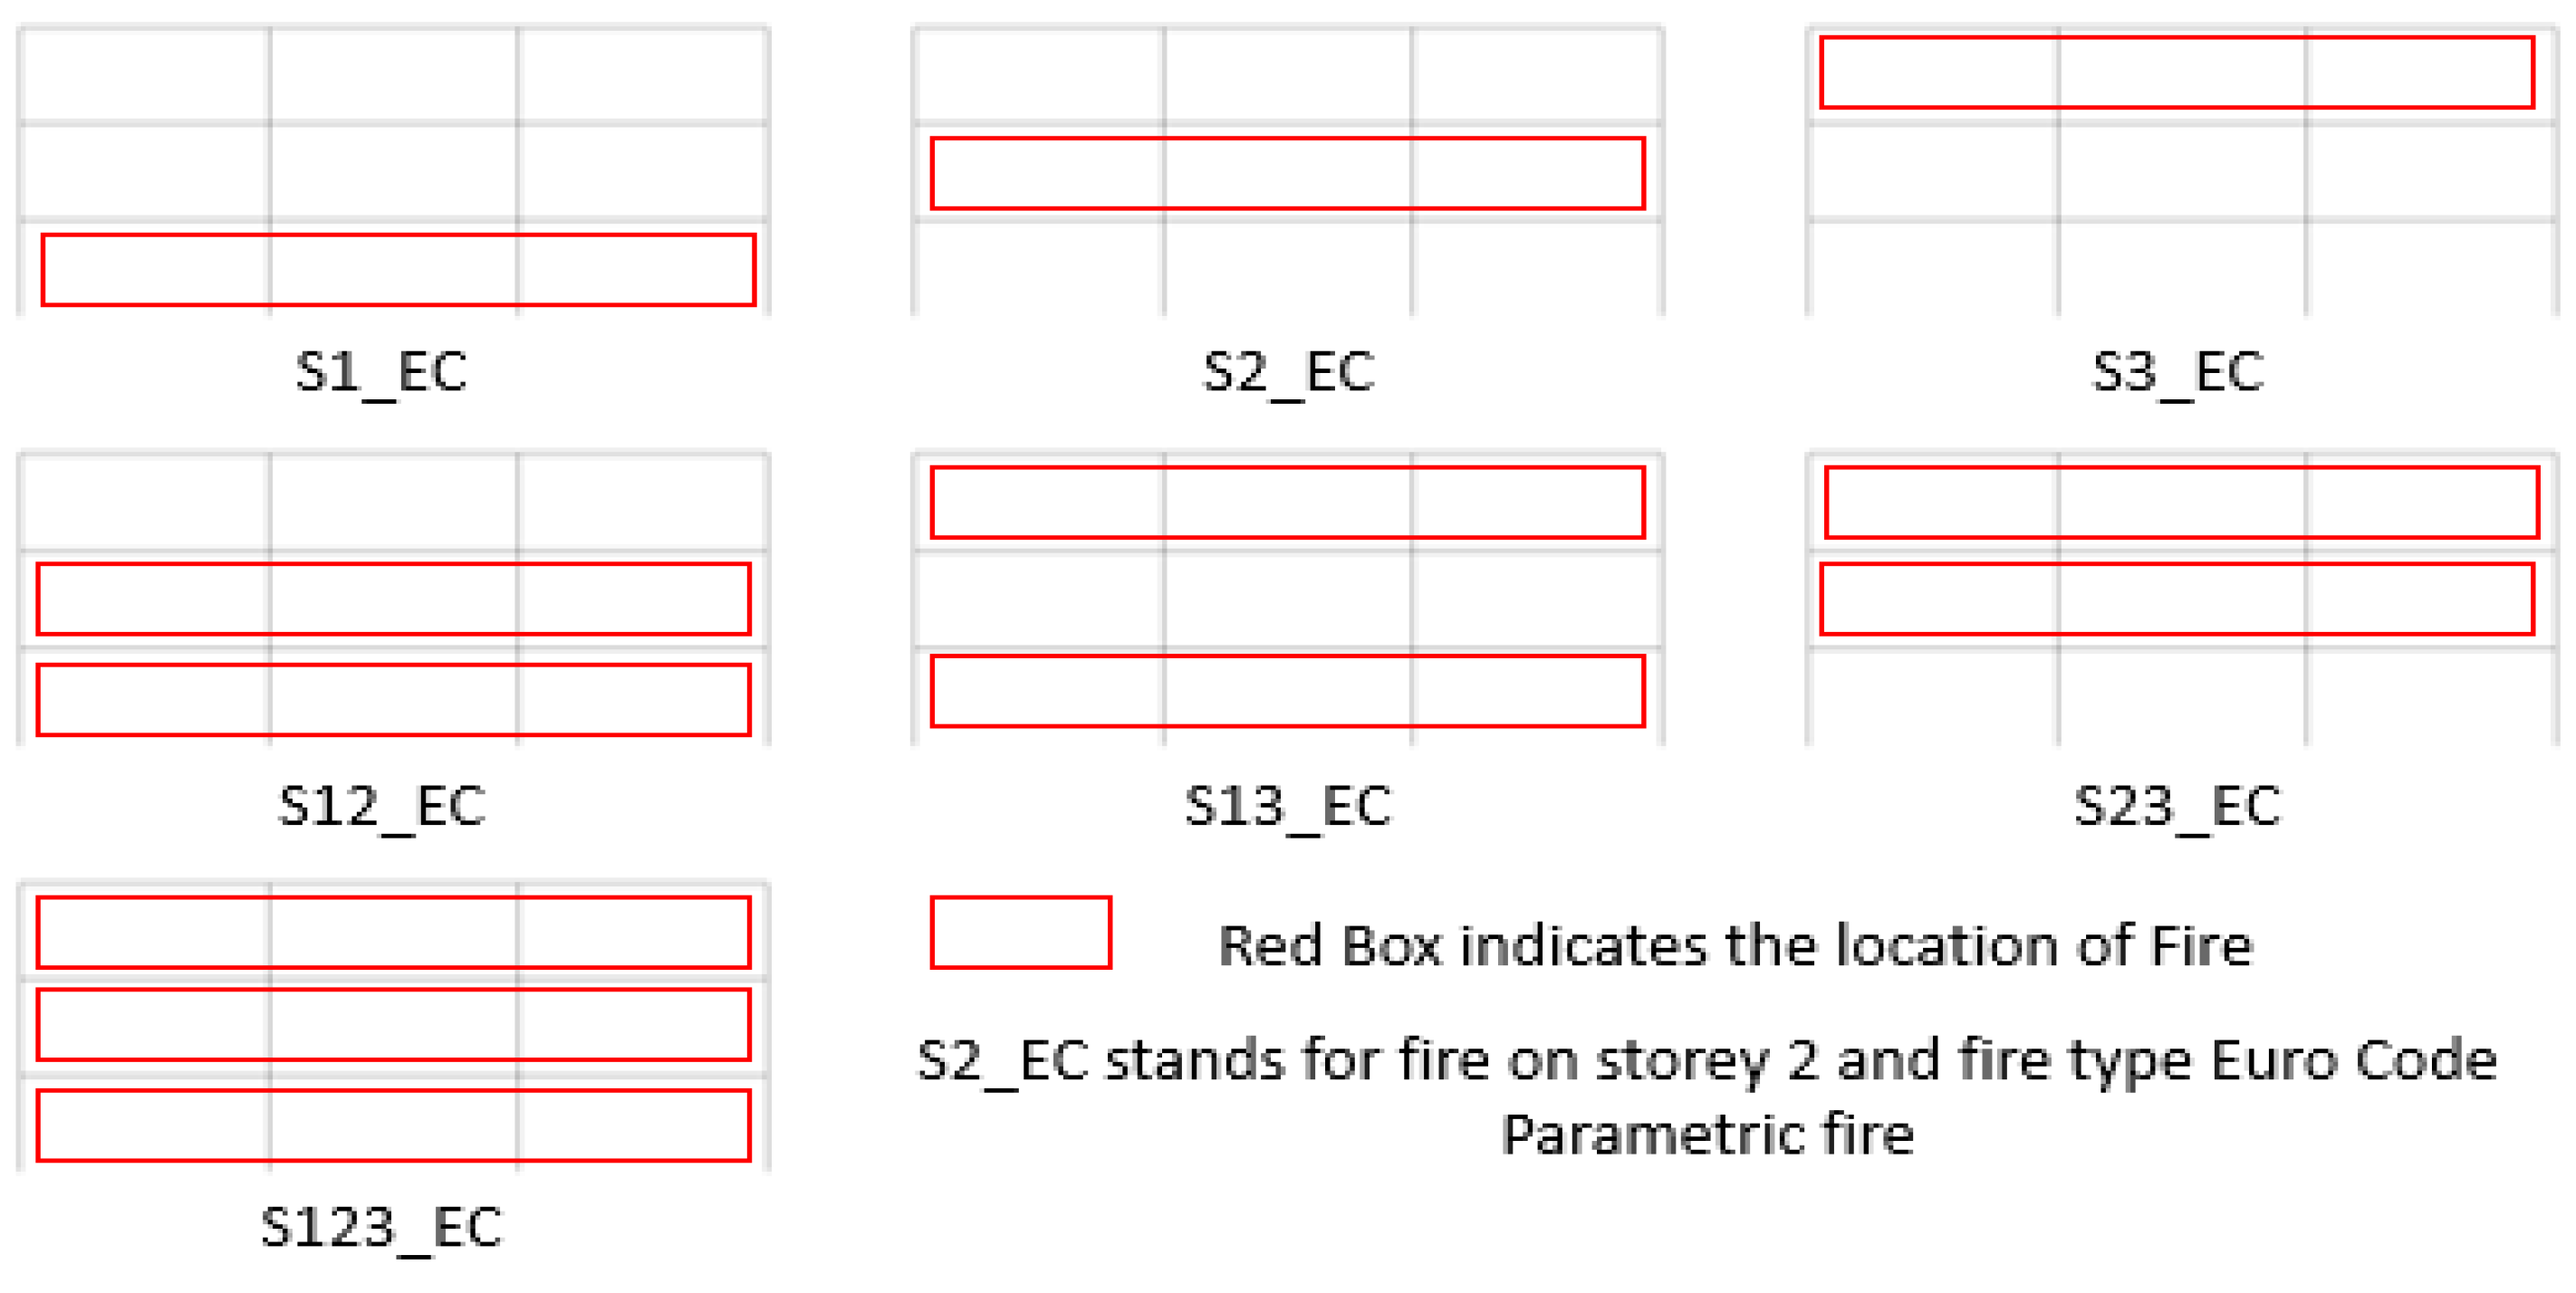
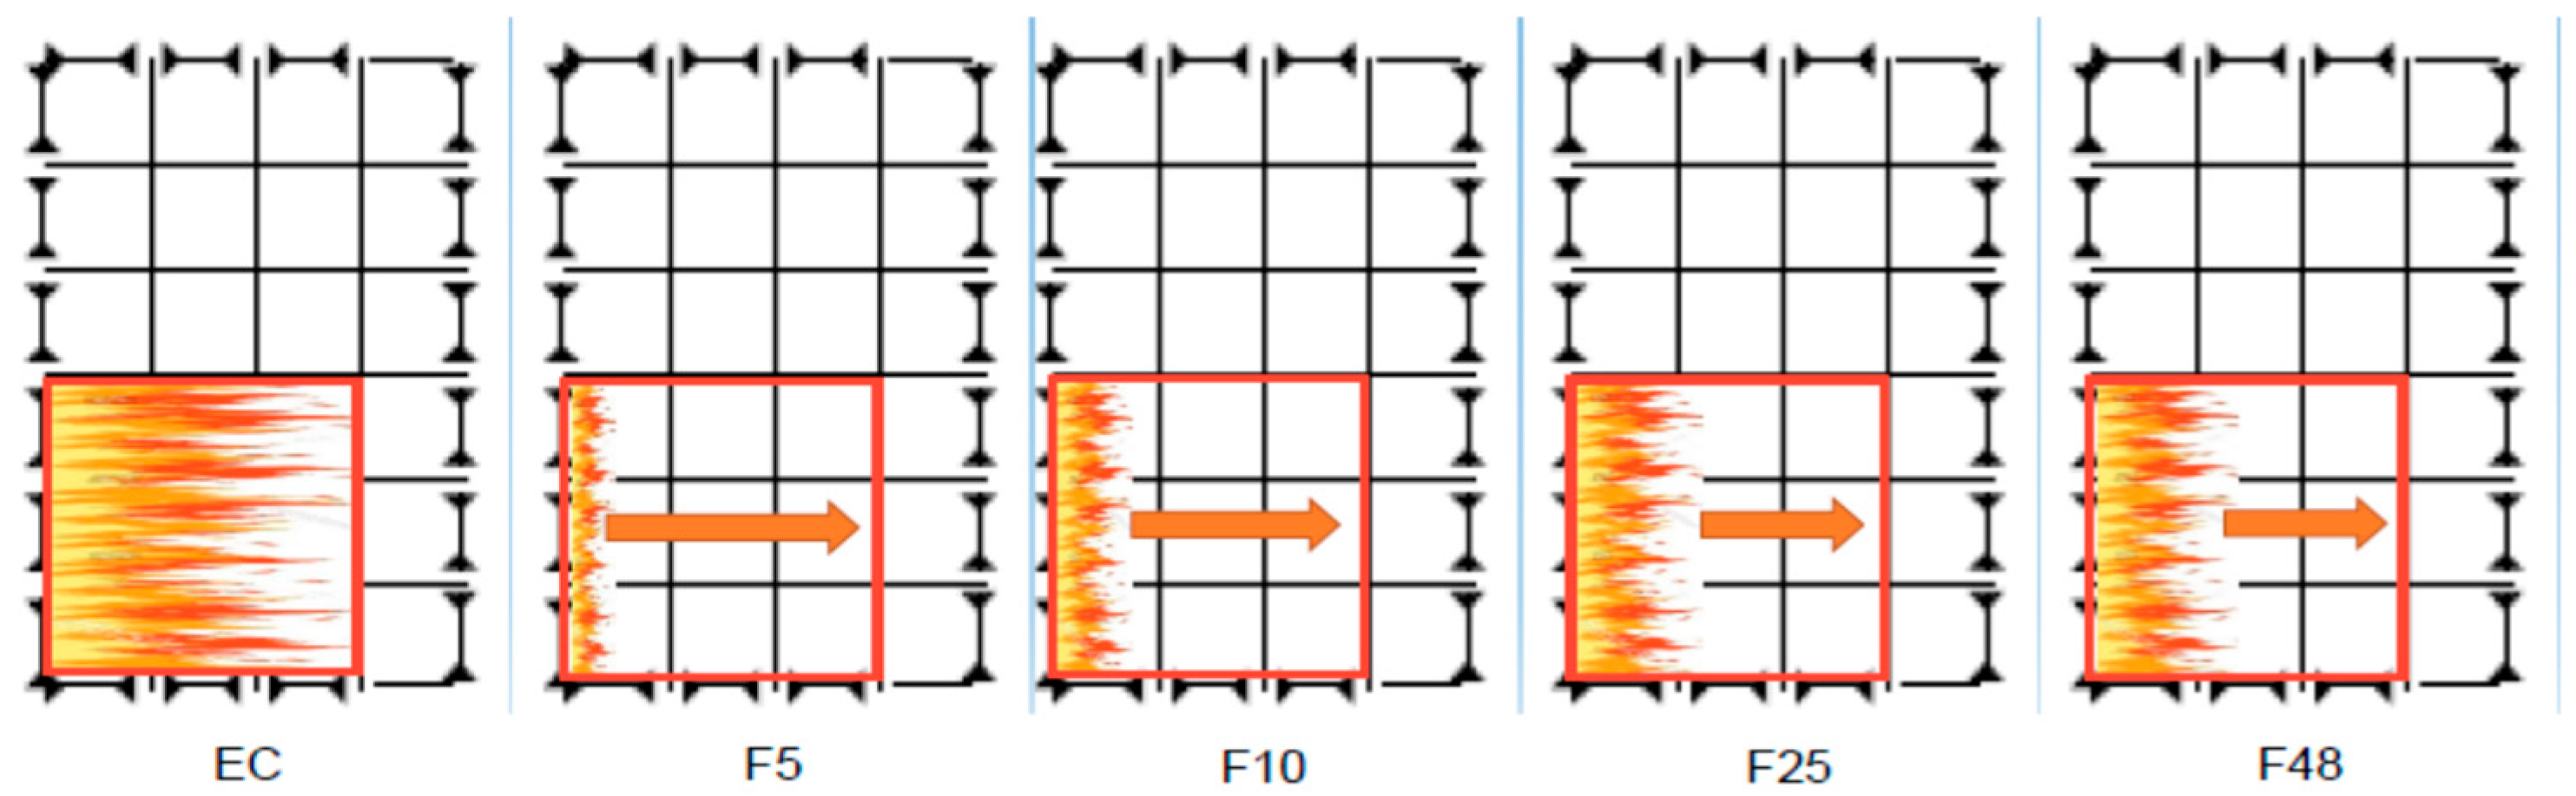
The objective of this study is to investigate the global and local response of a steel moment-resisting frame (MRF) subjected to horizontally traveling fires and to compare it with the response under a uniform fire scenario. Table 2 summarizes all 35 fire scenarios considered in this work. Parameters for the study include (a) the effect of fire types and locations on one-, two-, and three-storey uniform and horizontally traveling fires; (b) fire size to simulate slow, medium, and fast travel times for horizontally traveling fire. Figure 4 illustrates all seven uniform parametric fire (EC) scenarios that have been considered. The analysis for the same 7 location-based fire scenarios was repeated for each of the four traveling fires. A fire scenario is designated by S followed by the storey(s) on fire, followed by the fire type or size. Here, S denotes storey, with the number following indicating the specific floor(s) exposed to fire. EC refers to Eurocode parametric fire, while F followed by a number specifies the size of the traveling fire (e.g., F25 represents a 25% traveling fire).
Figure 5 illustrates the fire scenarios considered for a compartment within the structure, comparing a uniform fire (EC) with four traveling fires. The first image (EC) corresponds to a spatially uniform fire acting over the entire compartment (indicated by red box). The subsequent images depict the four traveling fire sizes, indicating both the direction of fire travel (arrow) and the extent of the floor area in fire. The traveling fire is denoted by “F” followed by the percentage of the floor area or length (e.g., 5%, 10%, 25%, and 48%) that burns at a time.

2.3. Fire Modeling

2.3.1. Eurocode Parametric Fire (EC)

The uniform fire in the compartment was modeled using the Eurocode parametric fire formulation [7], consistent with the approach adopted in [15], to enable a direct comparison with their post-earthquake fire assessment of the SAC3 frames. In the EC fire curve’s heating phase, the temperature θ (°C) is a function of fictitious time t * , as shown in Equation (1), where t * is given by the product Γ . t   and Γ is a dimensionless parameter equal to ( O / b ) 2 / ( 0.04 / 1160 ) 2 , where O is an opening factor, b is the thermal absorptivity of the surrounding surfaces of the compartment, and t is the time in hours (h)
θ = 20 + 1325 ( 1 0.324 e 0.2 t * 0.204 1.7 t * 0.472 e 19 t * )
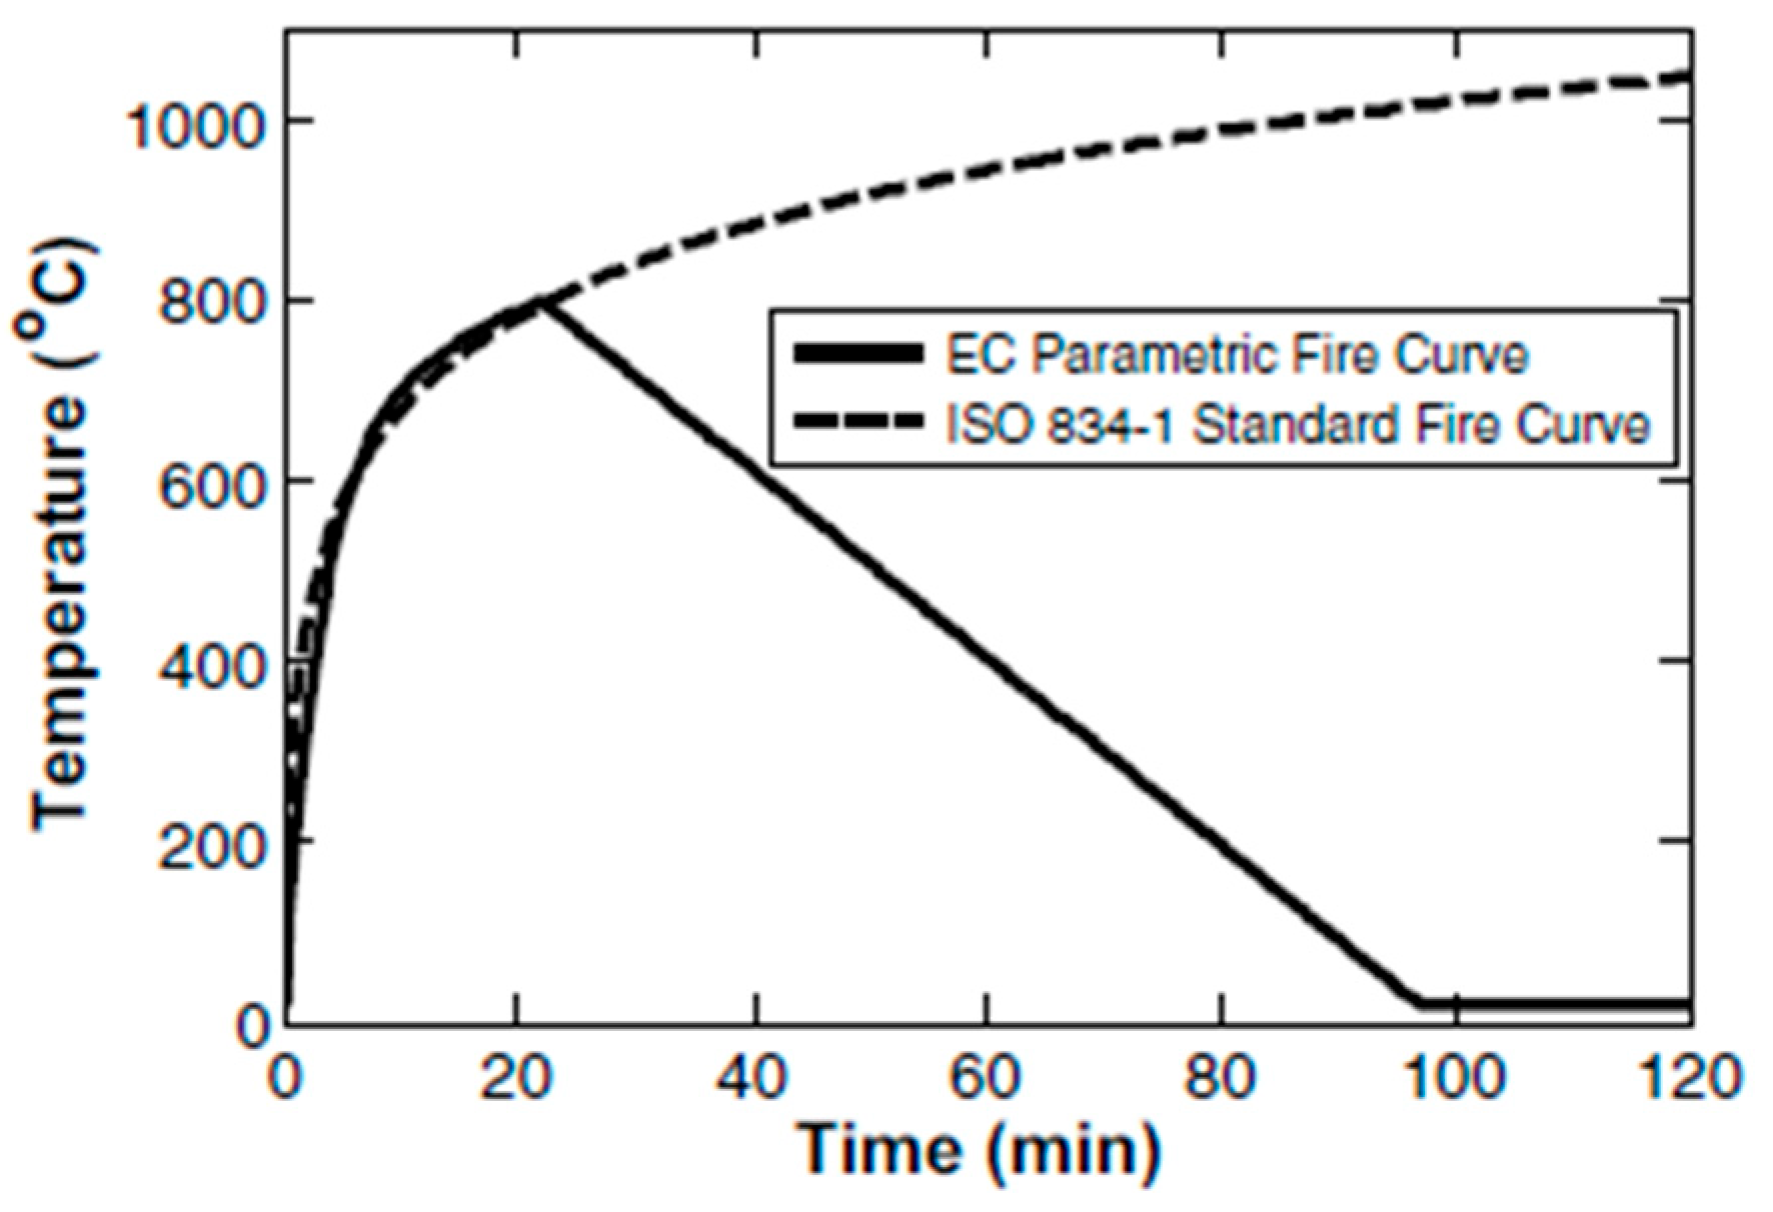
In this study, Γ was assumed to be unity to yield a heating phase that approximates the ISO 834-1 standard fire curve, and the peak temperature of 800 °C was observed at 22 min [15].
The descending curve for the EC parametric curve follows Equation (2), where θ m a x = 800   ° C and t m a x * = 0.366   h are the peak temperature ( ° C ) and time (h), respectively.
θ = θ m a x 625 ( t * t m a x * )
Figure 6 shows the uniform Eurocode parametric fire used in the present study, compared with the standard ISO 834 fire.

2.3.2. Traveling Fire Analytical Model

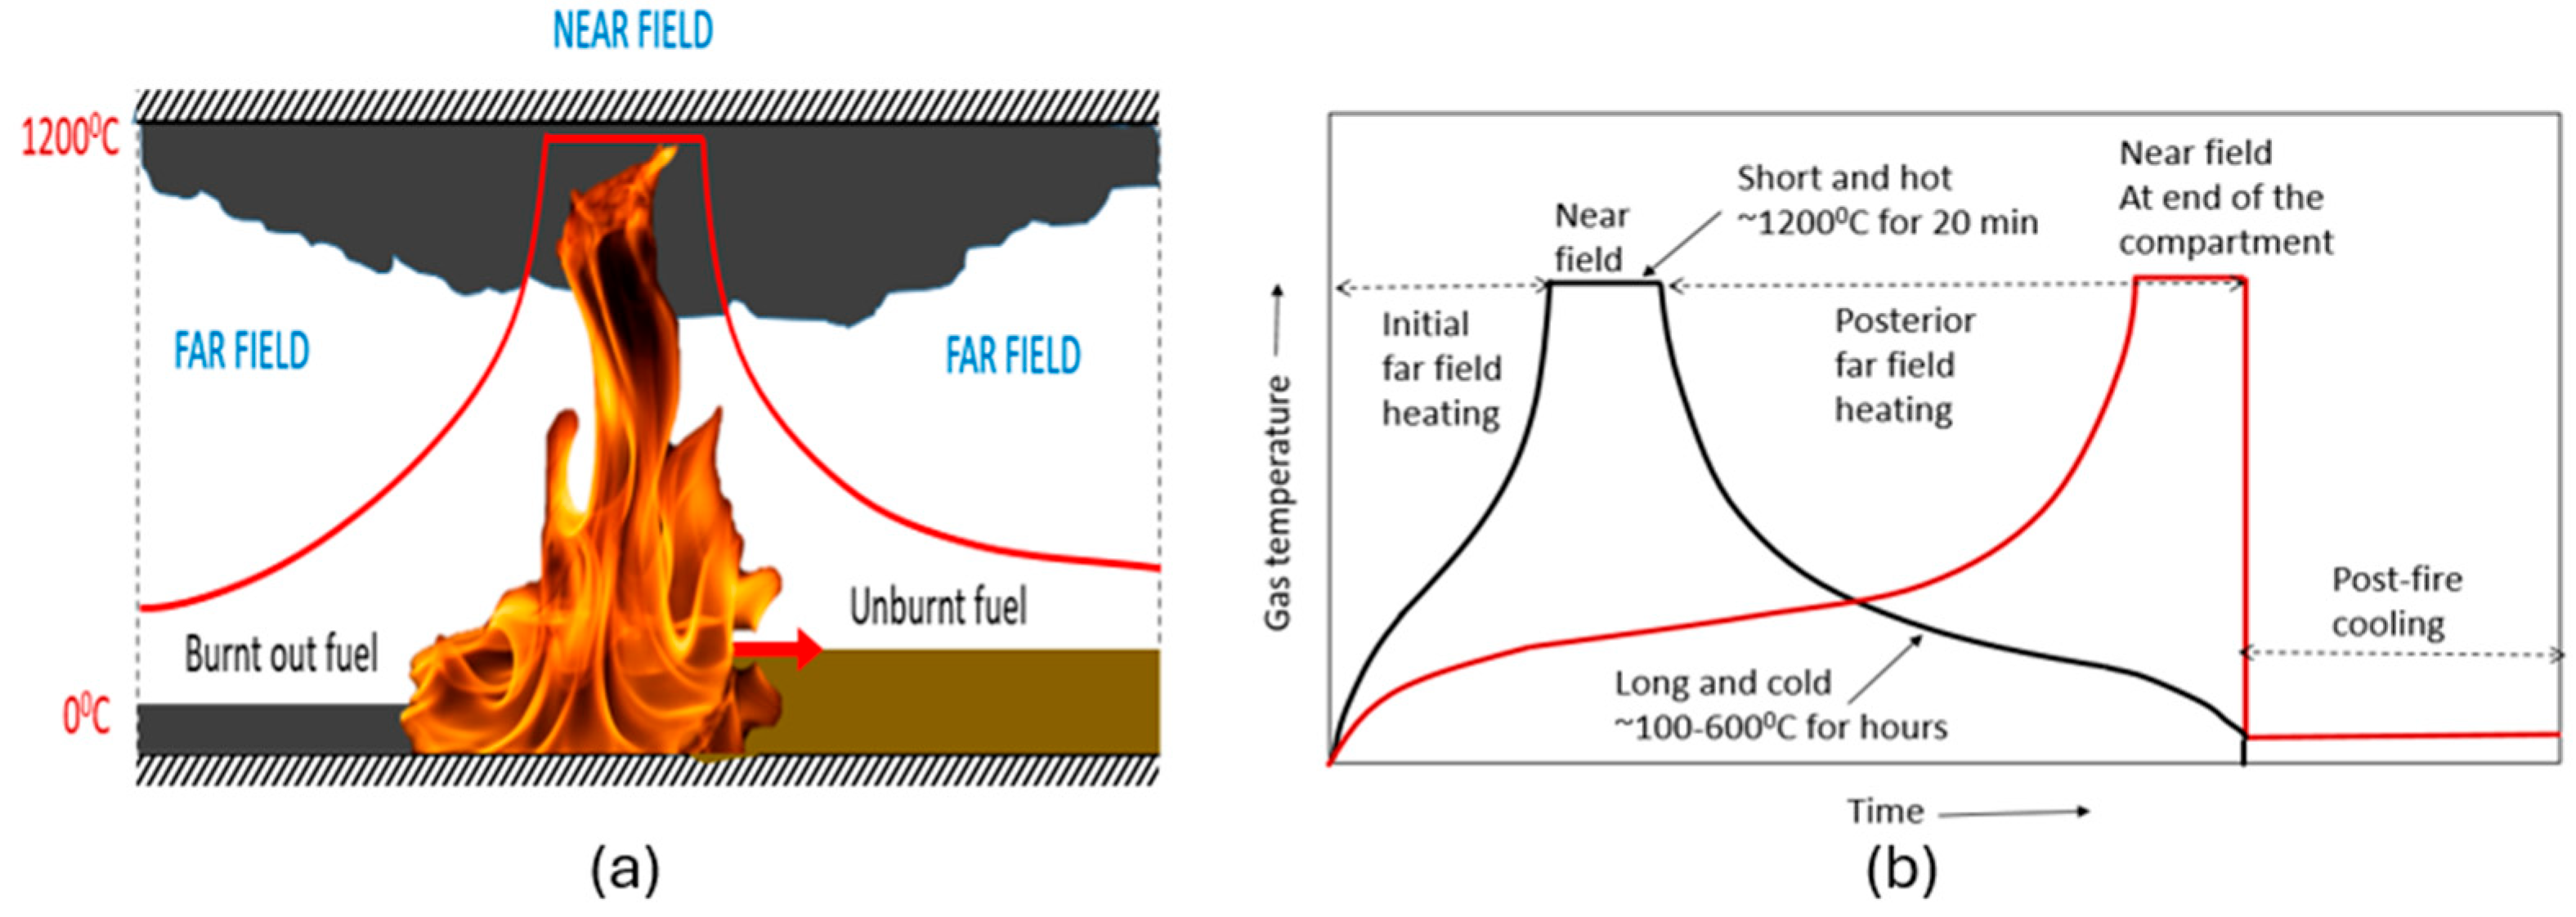
Unlike traditional “compartment” fires where the entire room is assumed to have the same temperature (the “post-flashover” assumption), traveling fire methodology (TFM) recognizes that in large, open-plan modern buildings, the fire moves across the space over time. This creates a localized “near-field” of intense heat and a “far-field” of smoke, which induces complex thermal expansion and contraction within the same structural system. TFM provides flexibility for simulating non-uniform fire spread in large open spaces, enabling the generation of a temperature-versus-time curve at the ceiling of a fire compartment. The fire curve typically has two regions, near-field and far-field heating, as shown in Figure 7a. In the near-field heating region, the flame is active; in the far-field heating region, the fuel is already spent, or the fire has not yet arrived. Figure 7b shows the surrounding gas temperature around structural members at two locations in a typical fire compartment.
The steps followed for traveling fire analysis are briefly described below.
  • Defining the Fire Parameters: This step involves characterization of the fuel and the speed at which the fire spreads.
  • Thermal Input Calculation: Instead of a single temperature–time curve, the engineer must generate a “moving” temperature profile characterized by gas temperature and exposure duration.
  • Heat-Transfer to the Structure: Using the gas temperatures from Step 2, the analysis determines the internal temperature of the structural members.
  • Thermo-Mechanical Analysis (Structural Response): This is the most critical phase where the mechanical effects of the traveling fire are realized. This step is characterized by the following factors: non-uniform thermal expansion, compatibility stresses between cool and hot sections affecting the local stability, and global instability leading to a progressive collapse.
  • Failure Criteria and Redundancy: Finally, the structure’s performance is evaluated against specific safety limits, such as defection limits, connection integrity, etc.
The primary assumptions in traveling fire modeling are as follows: (a) the fuel load distribution is uniform across the path of the fire along the floor dimension; and (b) the burning rate of the fire is constant, which produces a heat release rate that is typical for buildings. The total heat release rate is given by
Q ˙ = A f Q ˙
where Q ˙ is the heat release rate per square meter of the area (kW/m2); A f is the total floor area under fire (m2); and Q ˙ is the total heat release (kW). The total burning time of the fire over an area,   A f is calculated by
t b = q f Q ˙
where q f is the fuel load density (kJ/m2), and t b is the burning time (s). The temperature of the hot gases farther from the actual fire region defines the far-field temperature. The simple ceiling jet correlation developed by Alpert [20] has been used to obtain the far-field temperature in the traveling fire methodology.
T m a x T = 5.38 Q ˙ / r 2 / 3 H
where T is the ambient temperature (K), T m a x is the maximum temperature within the ceiling jet (K); Q ˙ is the heat release rate (HRR) (kW); H is the floor-to-ceiling height (m); and r is the distance from the center of fire (m).
TFM offers flexibility, allowing different levels of fire and floor coverage (ranging from 1% to 100% of the fire compartment) to be considered in the analysis. In TFM, uniform fuel load distribution and a constant fire spread rate are assumed. As a result, the total fire duration depends mainly on its size. The study considered a fuel load density of 570 MJ/m2 (corresponding to the 80th-percentile design for an office building) and a heat release rate of 500 kW/m2 (appropriate for a densely furnished space), in line with the fire parameters adopted in [9].
Rackauskaite et al. [9] observed that near-field temperatures in various building fires can range from 800 °C to 1200 °C. Although the near-field ceiling temperature is often conservatively assumed to be 1200 °C, the flame temperature at the ceiling varies continuously between 800 °C and 1200 °C due to lateral flame fluctuations. The improved TFM (iTFM) accounts for this variability through a parameter called the flame flapping angle. This study used a near-field temperature of 1000 °C and a flame flapping angle of 6.5° [9]. The compartment was assumed to be 27.45 m × 27.45 m × 3.96 m, with the fire extent limited by an E-W firewall. Table 3 summarizes the key parameters for the four traveling fire scenarios used in this study. Detailed formulations of the iTFM methodology can be found in [9].
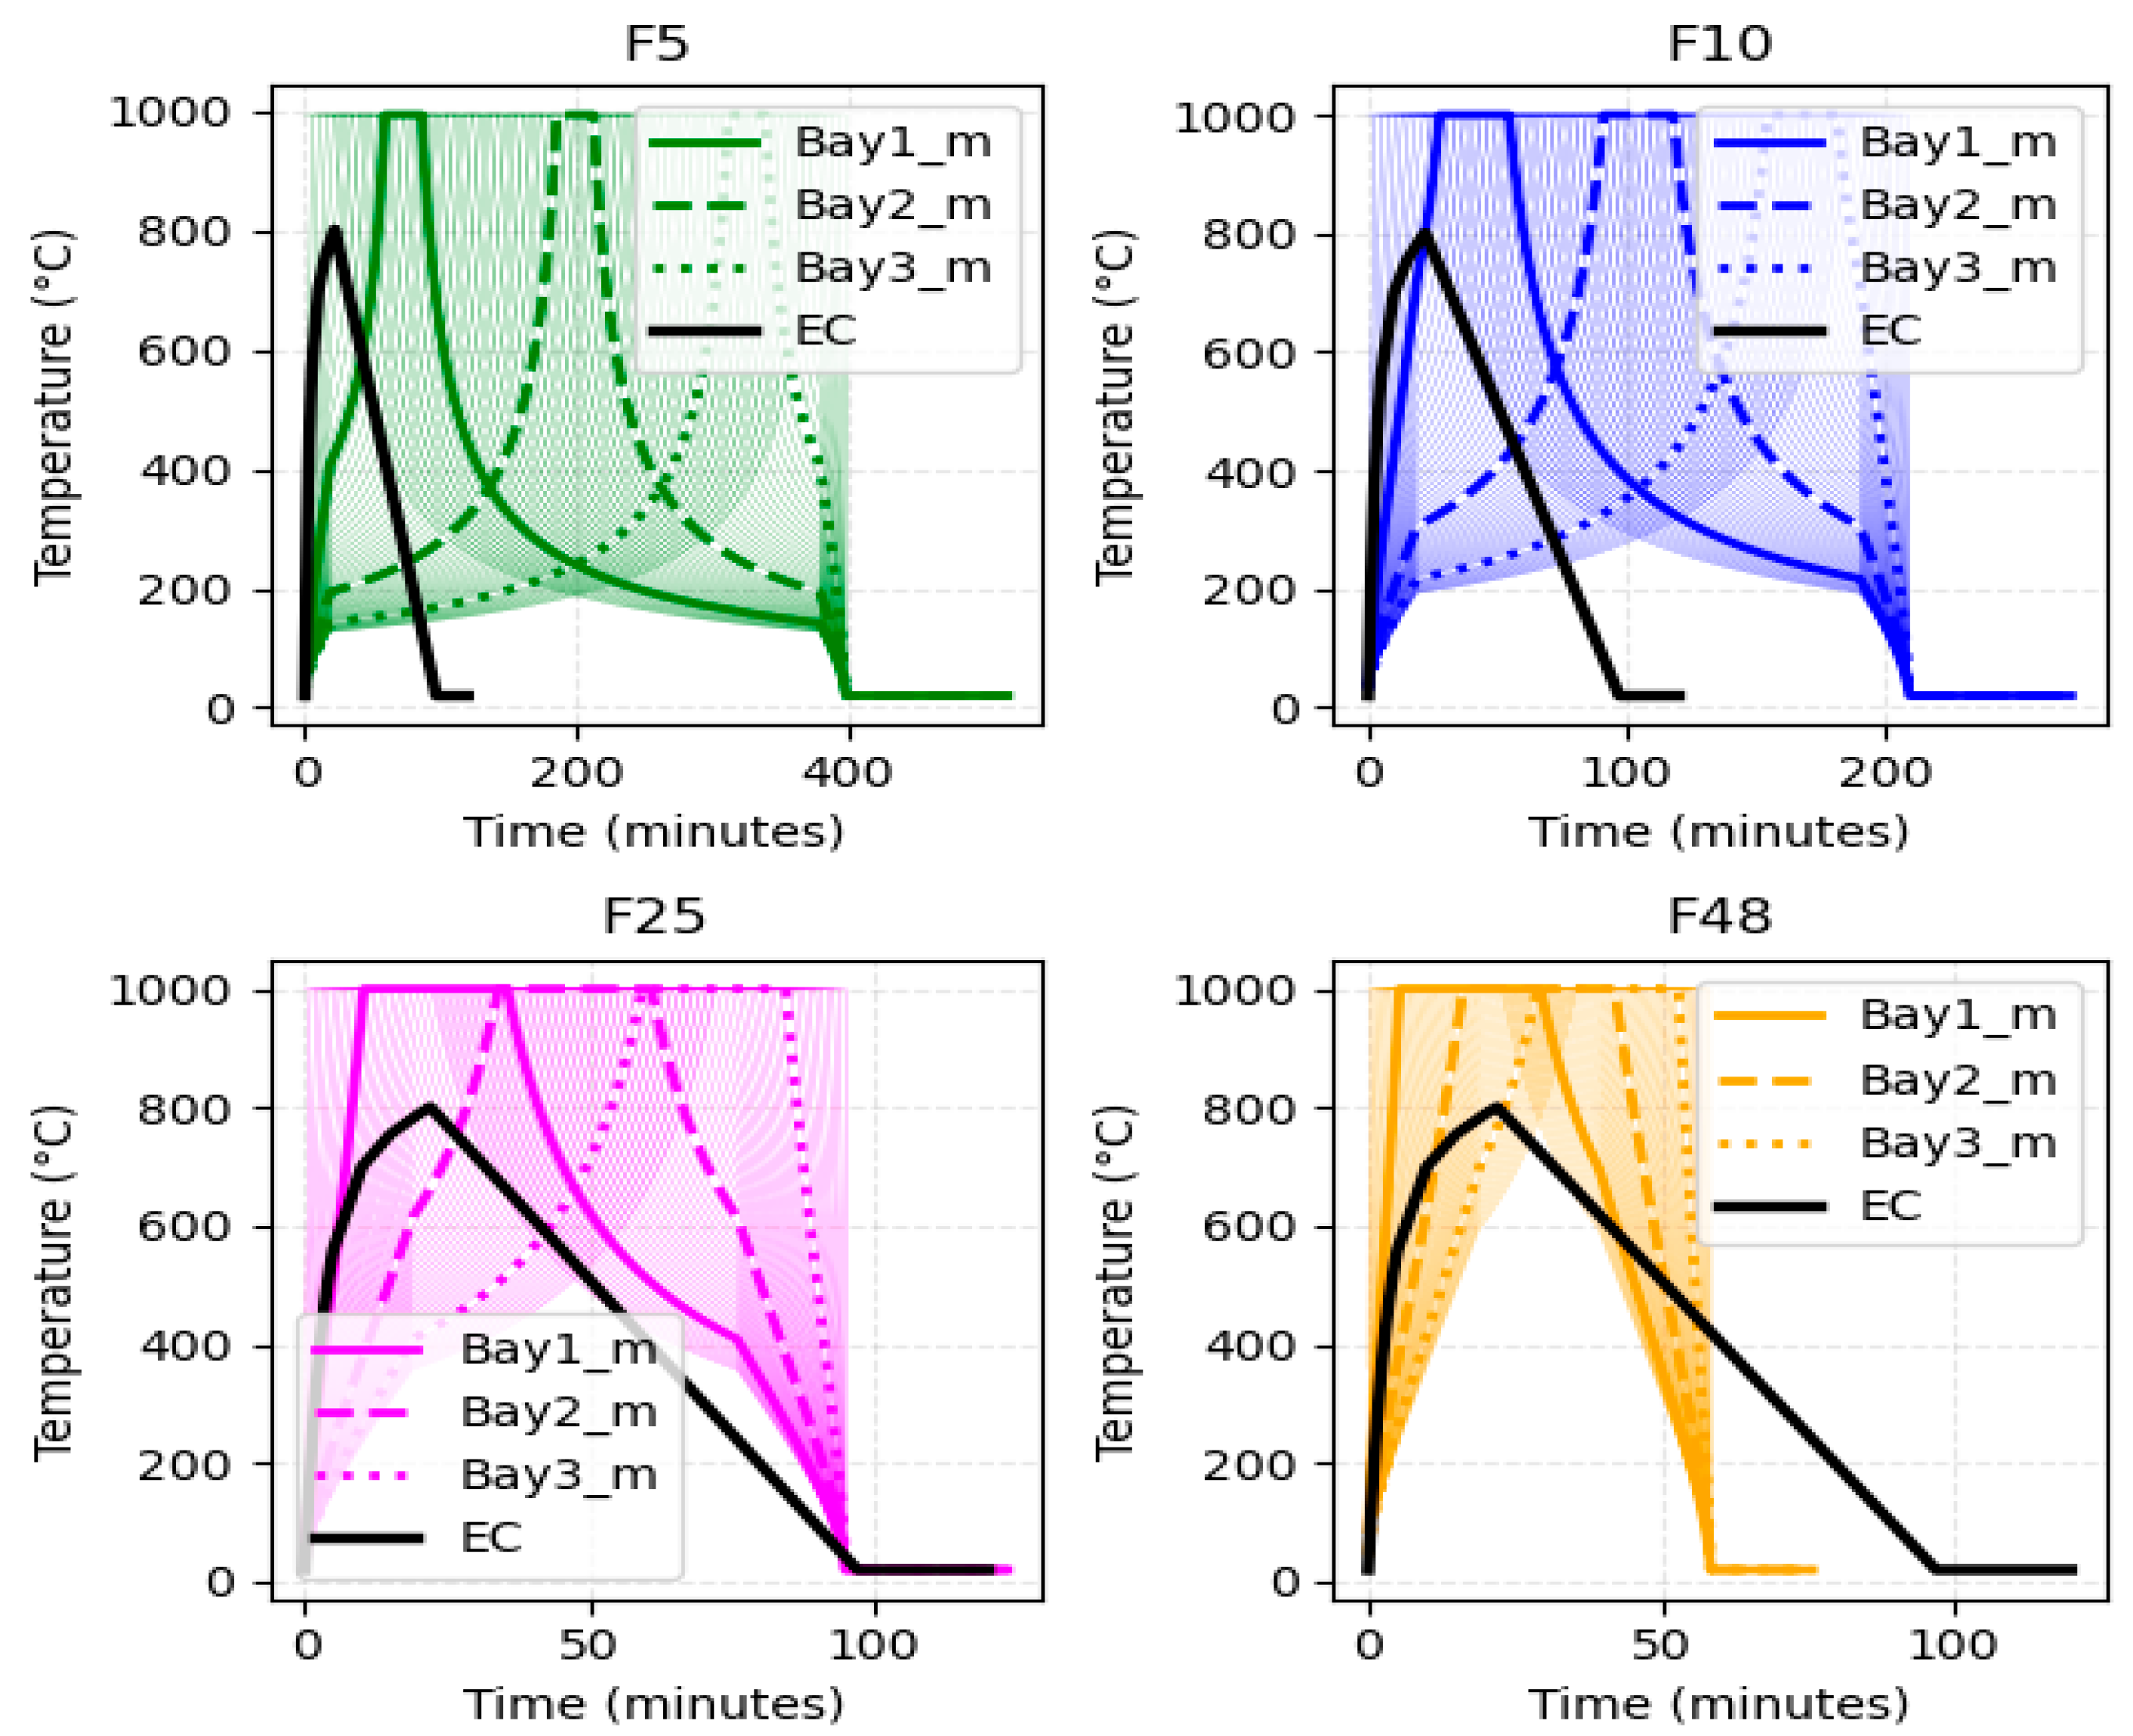
Figure 8 shows the spatial and temporal variation in the four traveling fire temperatures along the length of the compartment. As mentioned earlier, the traveling fire scenario assumes a unique temperature–time history at a particular location along the fire’s path. Each subplot shows the temperature at each of the 61 nodes’ (spaced 457.5 mm apart) locations along the fire’s travel path. The temperatures in the middle of the bays are labeled as Bay1_m, Bay2_m, and Bay3_m, respectively. The uniform EC parametric fire curve is overlaid in black in each subplot for comparison, while the traveling fire temperatures in each subplot is represented using distinct color corresponding to the respective traveling fire. Note that all nodes of a column on a storey experience the same traveling fire temperature, as the current iTFM formulation conservatively assumes a single time–temperature profile across the full column height. In the traveling fire method, the total fire duration depends on the proportion of the compartment that burns; for fire sizes of 5%, 10%, 25%, and 48%, the durations were 519, 272, 124, and 76 min, respectively. In contrast to the traveling fire, the uniform parametric fire (EC) lasted 120 min.

2.4. Numerical Modeling

2.4.1. Finite-Element Modeling of the Steel Frames

An in-plane finite-element model of the N-S peripheral steel moment frame was developed using ABAQUS [21]. All beam–column joints, except in the rightmost bay, were assumed rigid, which is a default connection in ABAQUS model. The pin joints in the beams of the fourth bay were modeled with MPC pins (multi-point constraint pins). The beams and columns in each bay were discretized using 2-noded linear beam elements (B31). Beams were divided into 20 elements (457.5 mm long), whereas the columns were meshed into 10 elements (396 mm long). Out-of-plane displacements, including the displacement along the Z-axis and rotations about the X and Y axes, were constrained in all analysis steps. The column bases were fixed to the ground. A mesh sensitivity study was performed by varying the number of elements per bay. While the model with 20 elements per bay predicted a rundown failure time similar to that obtained from the finer 40-element mesh, it underestimated the post-rundown residual displacement by approximately 10%. Given the large number of heat-transfer analyses required at each node for the traveling fire simulations, the 20-element mesh was adopted as a practical balance between accuracy and computational cost.
A two-step analysis was implemented in the finite-element model. First, a gravity load analysis was performed using the static procedure. The effect of geometric nonlinearity was accounted for with a large displacement formulation (by setting NLGEOM to “ON” in the step editor). In the second step, a sequentially coupled thermal-stress analysis using a dynamic-implicit procedure was adopted to investigate the structure’s behavior in a fire. For the dynamic-implicit solver, automatic step incrementation was used. The maximum number of increments was set to 1 × 10⁷, with an initial increment size of 1 × 10⁻⁵ and a minimum increment size of 5 × 10⁻⁶.
Nodal temperature loads were estimated independently by conducting heat-transfer analyses of various structural members for each fire scenario. The time–temperature histories for all affected members (nodes in a traveling fire) were entered as nodal temperatures (amplitudes) into the stress analysis, and thermal loads were then applied as predefined fields over the fire-affected structural members (nodes). A Python (version 3.10.9) script was written to read the heat-transfer analysis results, and they were applied to the structural model for a given fire location and type. It should be noted that, as the sections are unprotected, the temperature at the centroid of each beam or column cross-section was applied to the corresponding elements in the structural model and the temperature-gradient effects were not considered in this study. All nodes were assumed to be rigidly connected. A more detailed model could be developed in future work to incorporate explicit connection behavior, allowing for joint-rigidity degradation due to elevated temperatures and potential connection failure, particularly during the cooling phase of the fire.
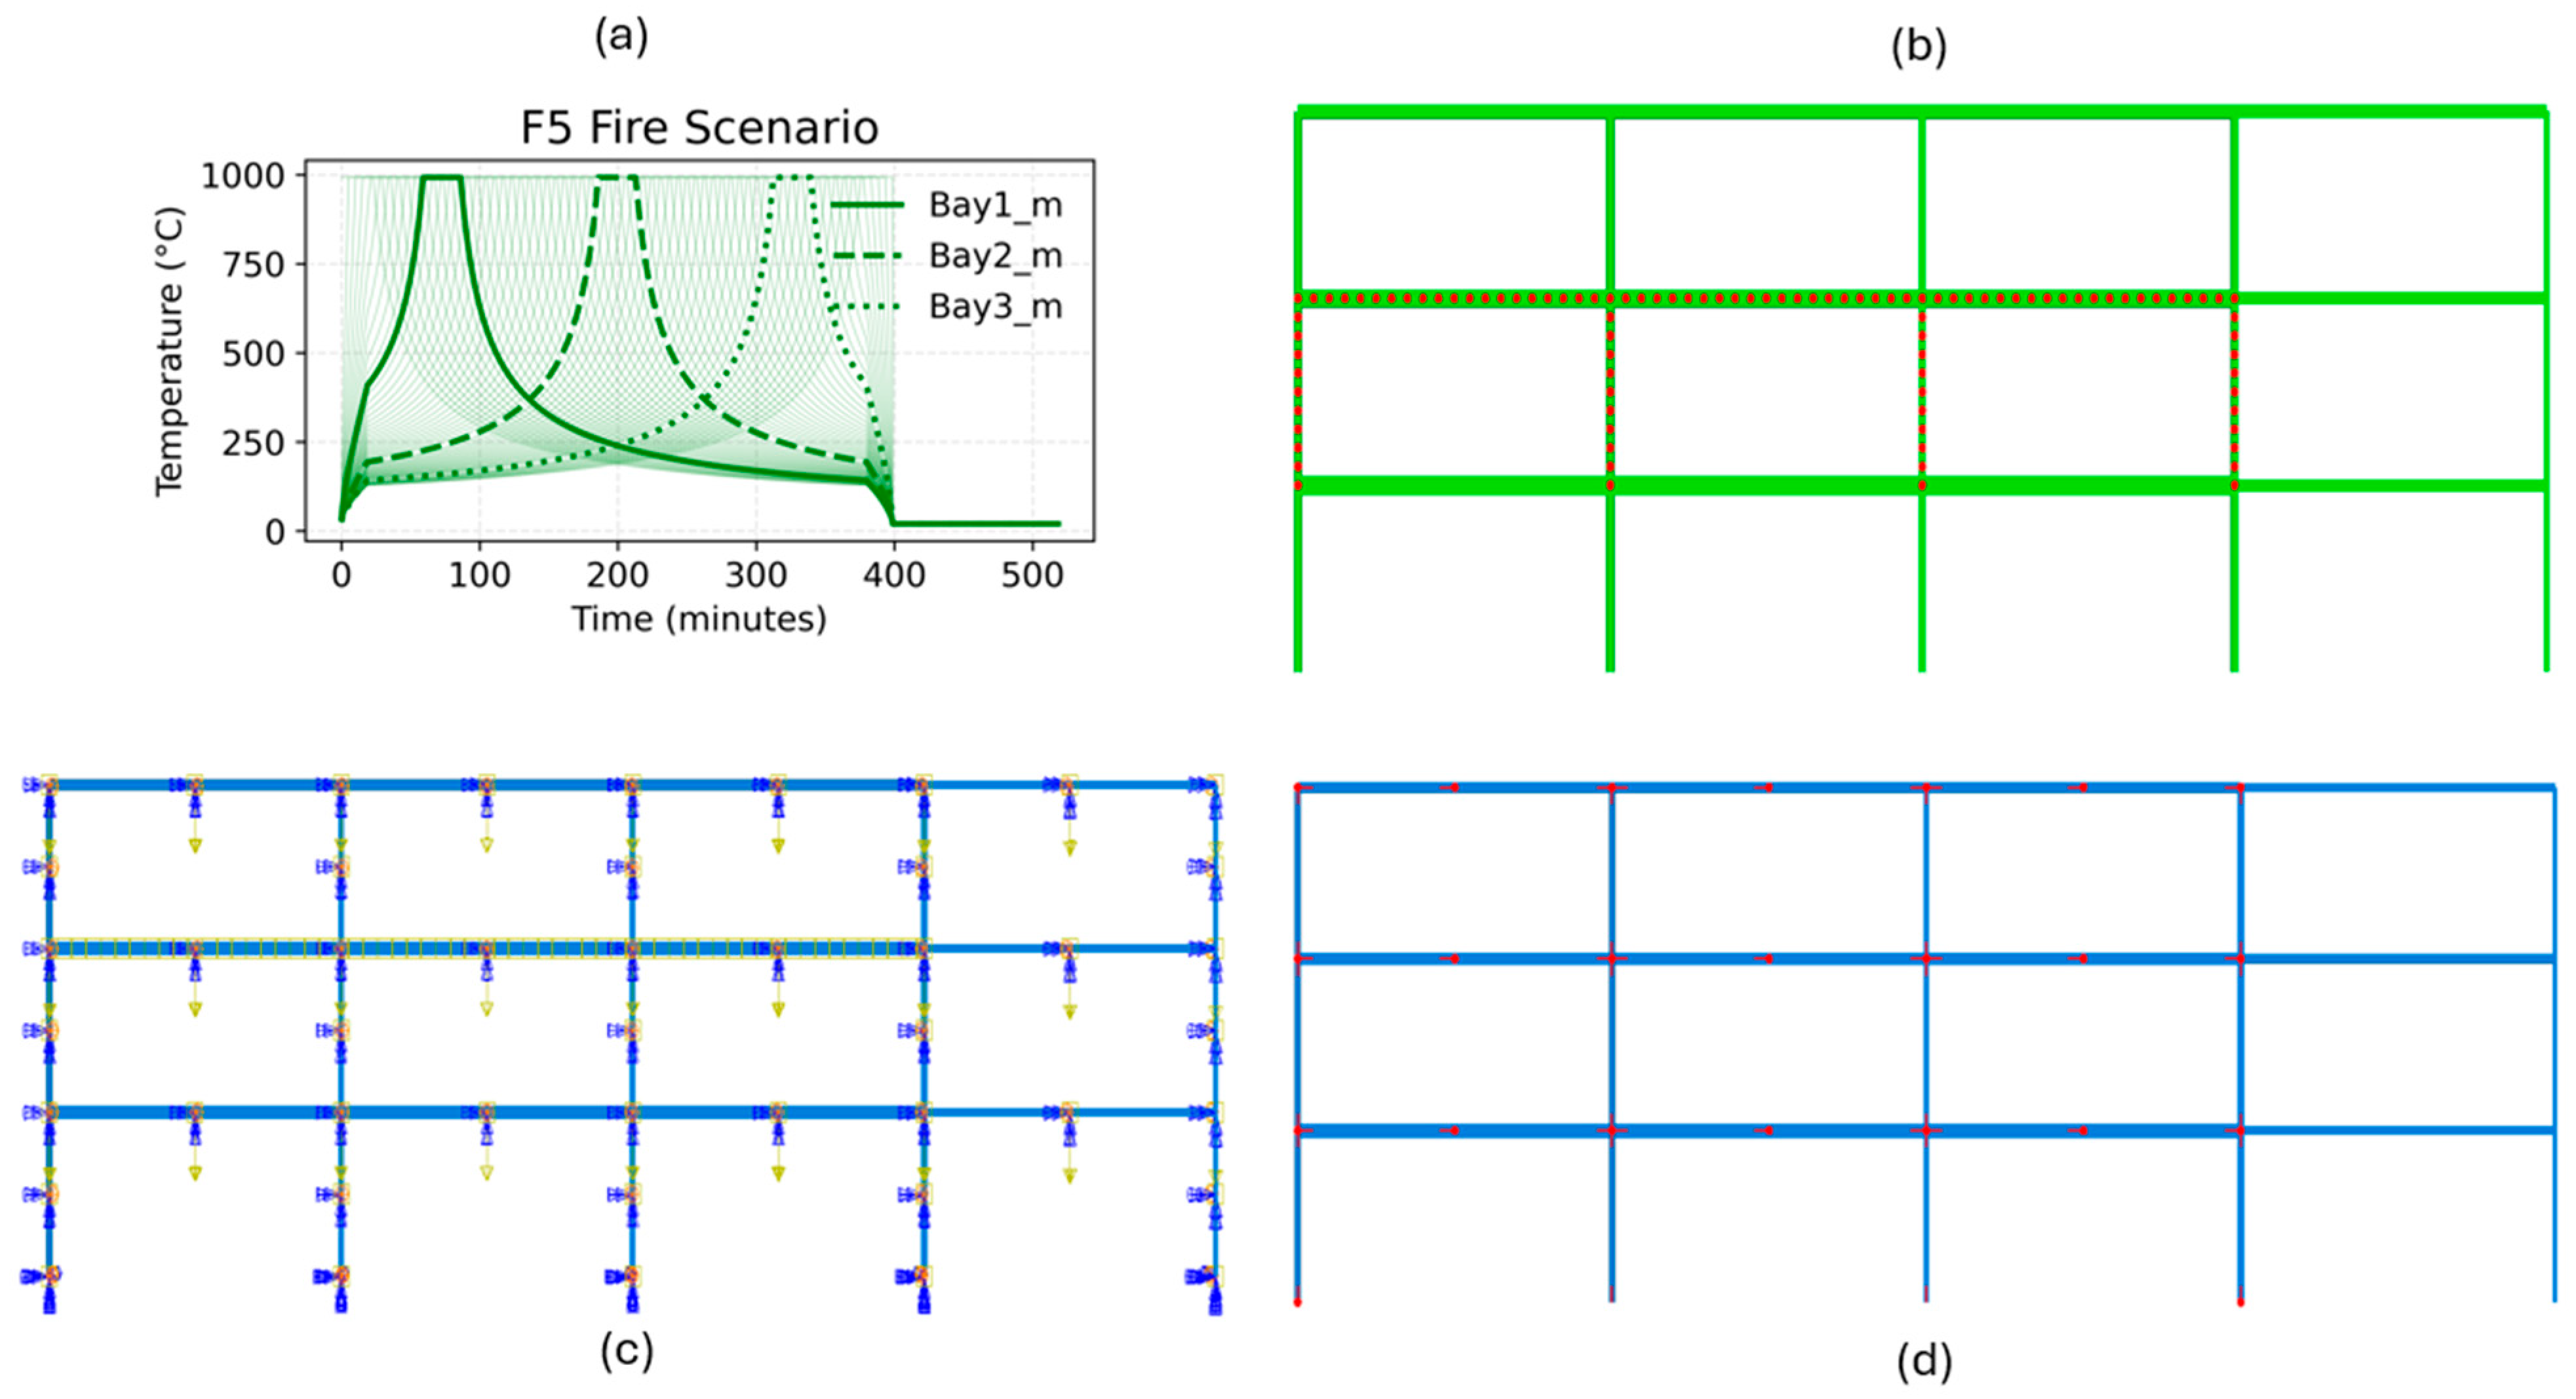
Figure 9 illustrates the thermal–structural model for the S2_F5 scenario. Subplot (a) presents the time–temperature histories for second-storey beam and column nodes in a 5% traveling fire, while subplot (b) identifies the nodes to which predefined temperatures are assigned. Subplot (c) shows the out-of-plane displacement restraints, and subplot (d) marks the critical beam and column elements and the beam midpoints used for result analysis. The thermal–structural analysis in the respective fire scenarios was continued for the entire fire duration, except when the system lost stable equilibrium, and the results did not converge. In such cases, the analysis was aborted when the beam deflection reached the floor depth.
The study investigates the failure of heated beams and column sections that may trigger a bay or storey failure, or, in some cases, lead to progressive failure of frames, if any, and does not investigate connection failure. The mid-span deflection of the heated beam and the frame’s inter-storey drift ratios are the critical parameters used to determine local and global failure in a fire scenario. The critical beam deflection limit in fire is L/20; exceeding this limit indicates local beam failure. While the frame’s IDR threshold of 2.5% is assumed, exceeding this limit indicates global failure of the frame.

2.4.2. Heat-Transfer Modeling

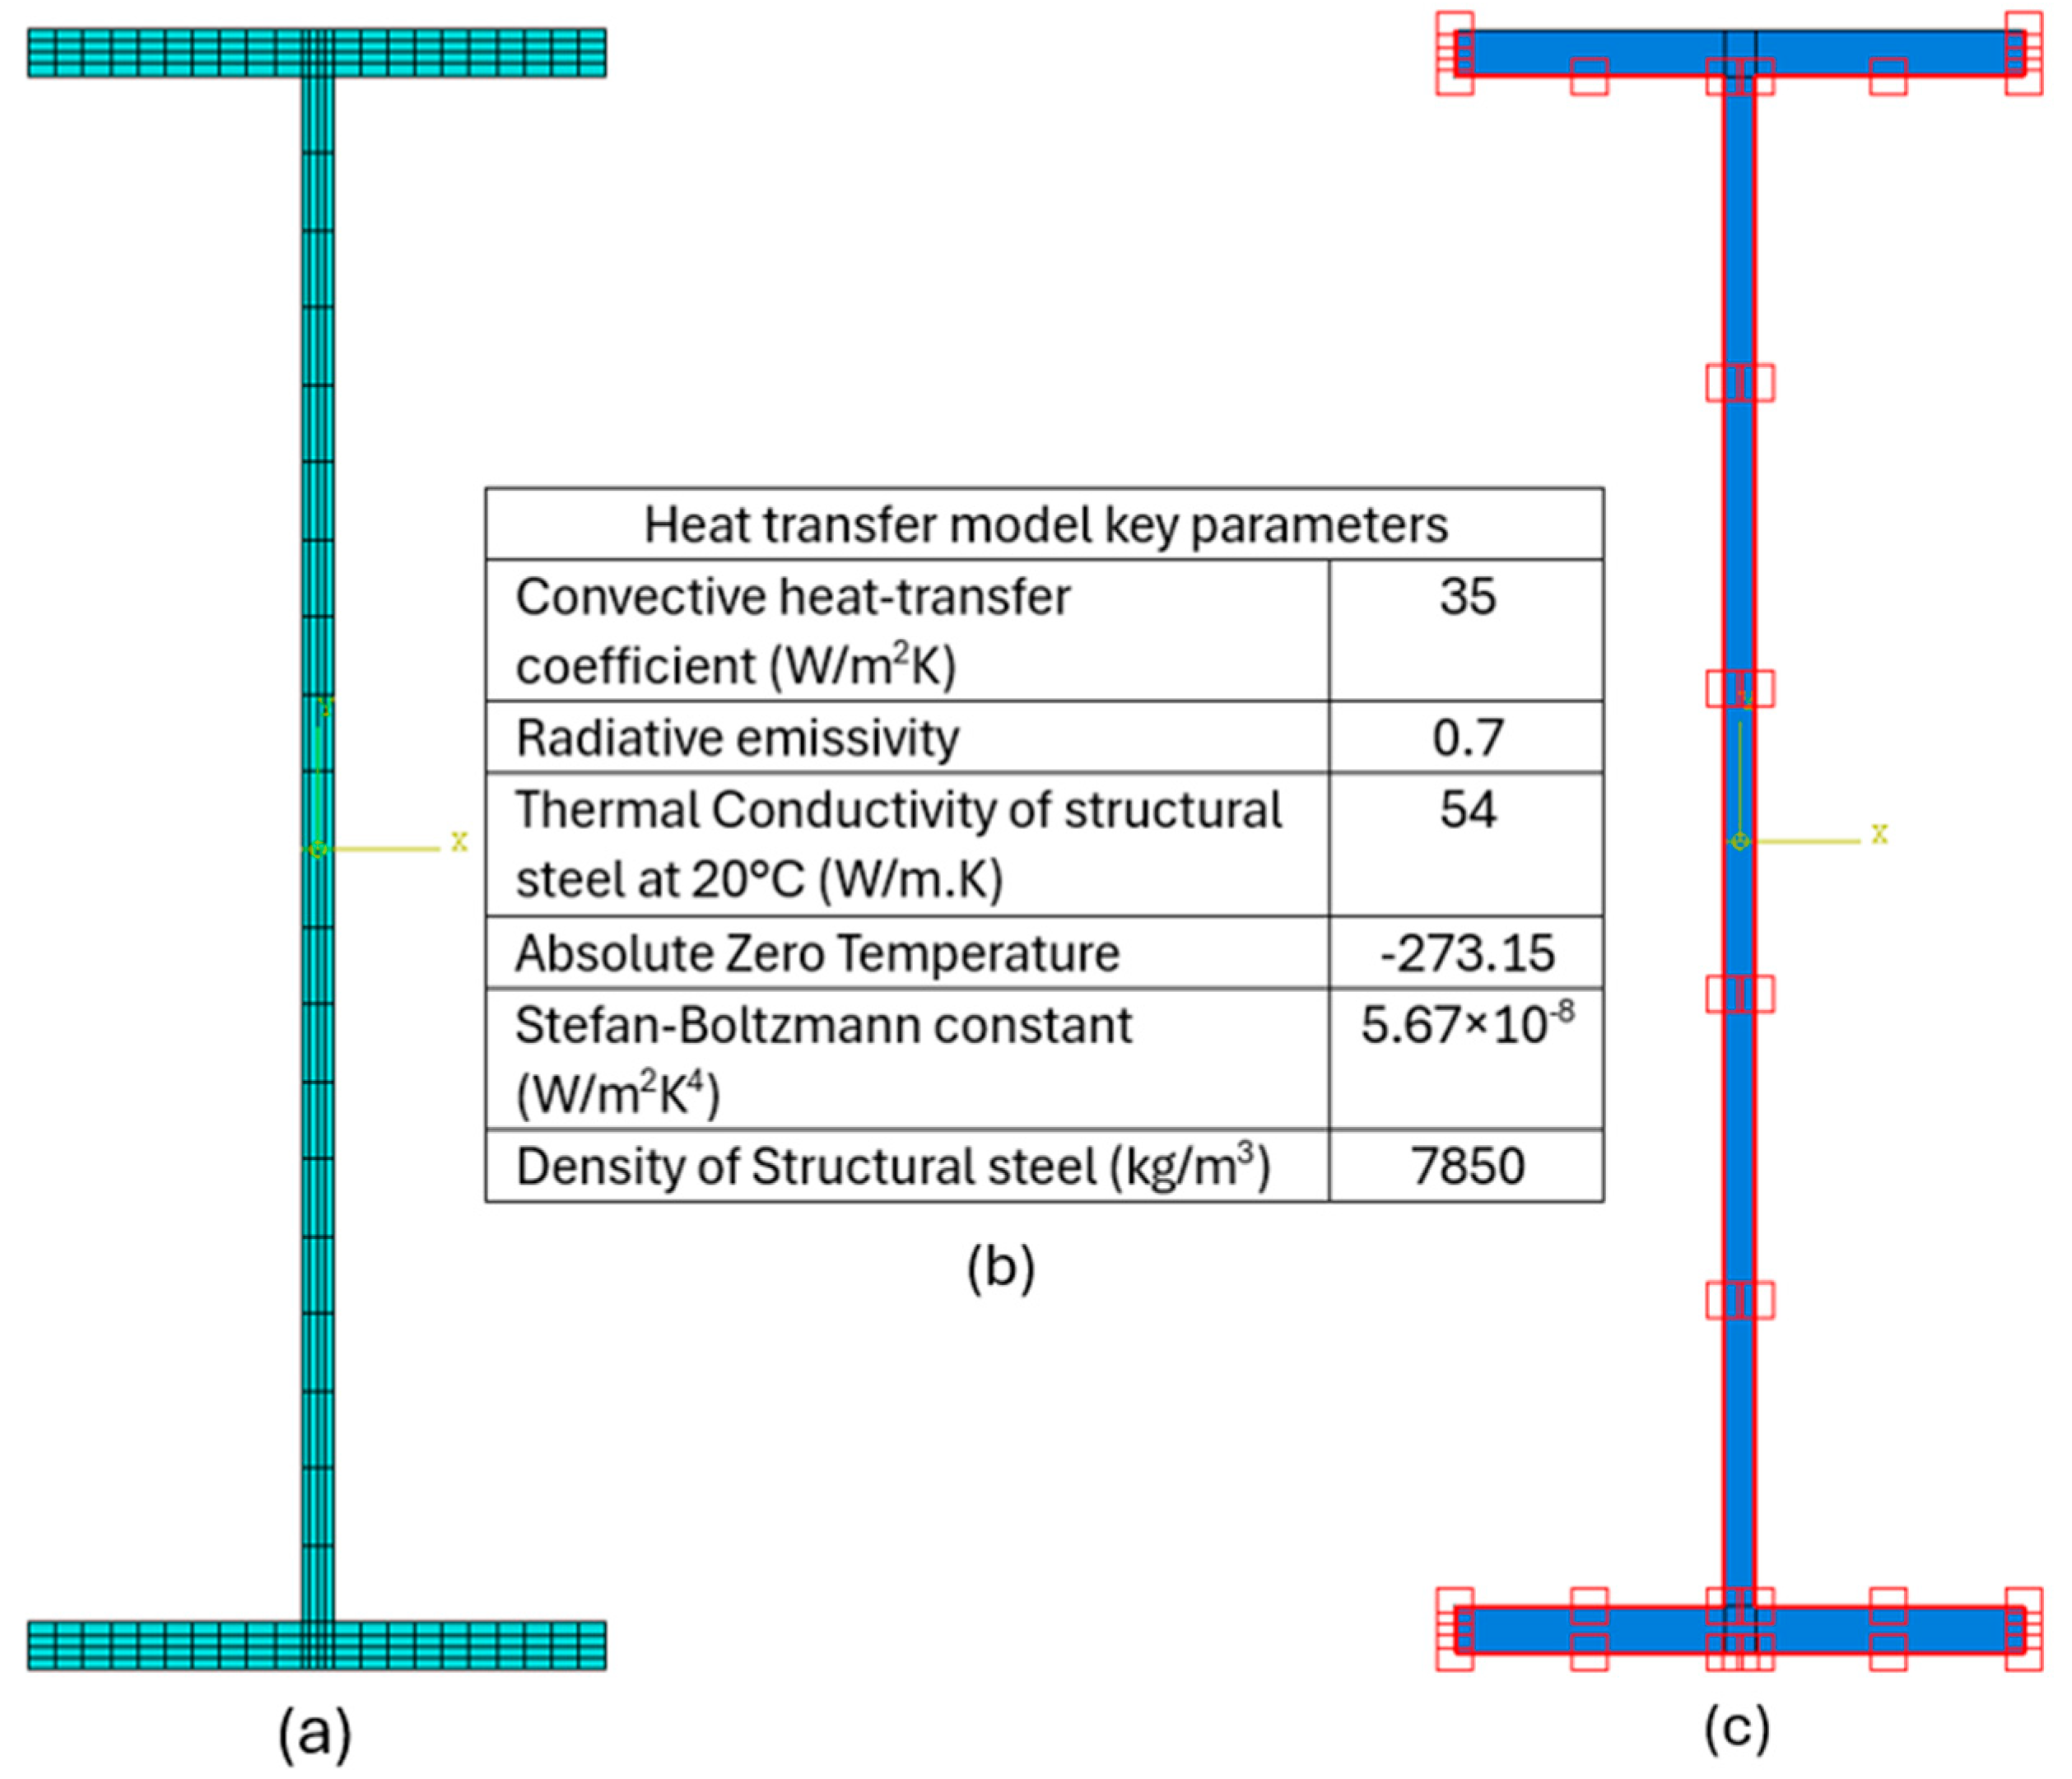
The beam and column cross-sections were modeled using 2-dimensional 4-noded rectangular heat-transfer elements DC2D4 in ABAQUS [21]. Material properties such as density, temperature-dependent specific heat, and structural steel conductivity are specified as per Eurocode 3-Part 1-2 [19]. A constant convective heat-transfer coefficient of 35 W/m2K and a radiative emissivity of 0.7 were used to simulate heat-transfer from the ambient to the structure. Figure 10 shows the beam cross-section mesh (a), boundary conditions (b), and three faces exposed to fire as shown in red in (c). For columns, all four faces were conservatively exposed to fire. The step increment for the heat-transfer analysis was also set to automatic, with an initial increment of 1 s and minimum and maximum increments of 0.00072 and 60 s, respectively.

2.5. Validation of the Thermal–Structural Analysis Procedure

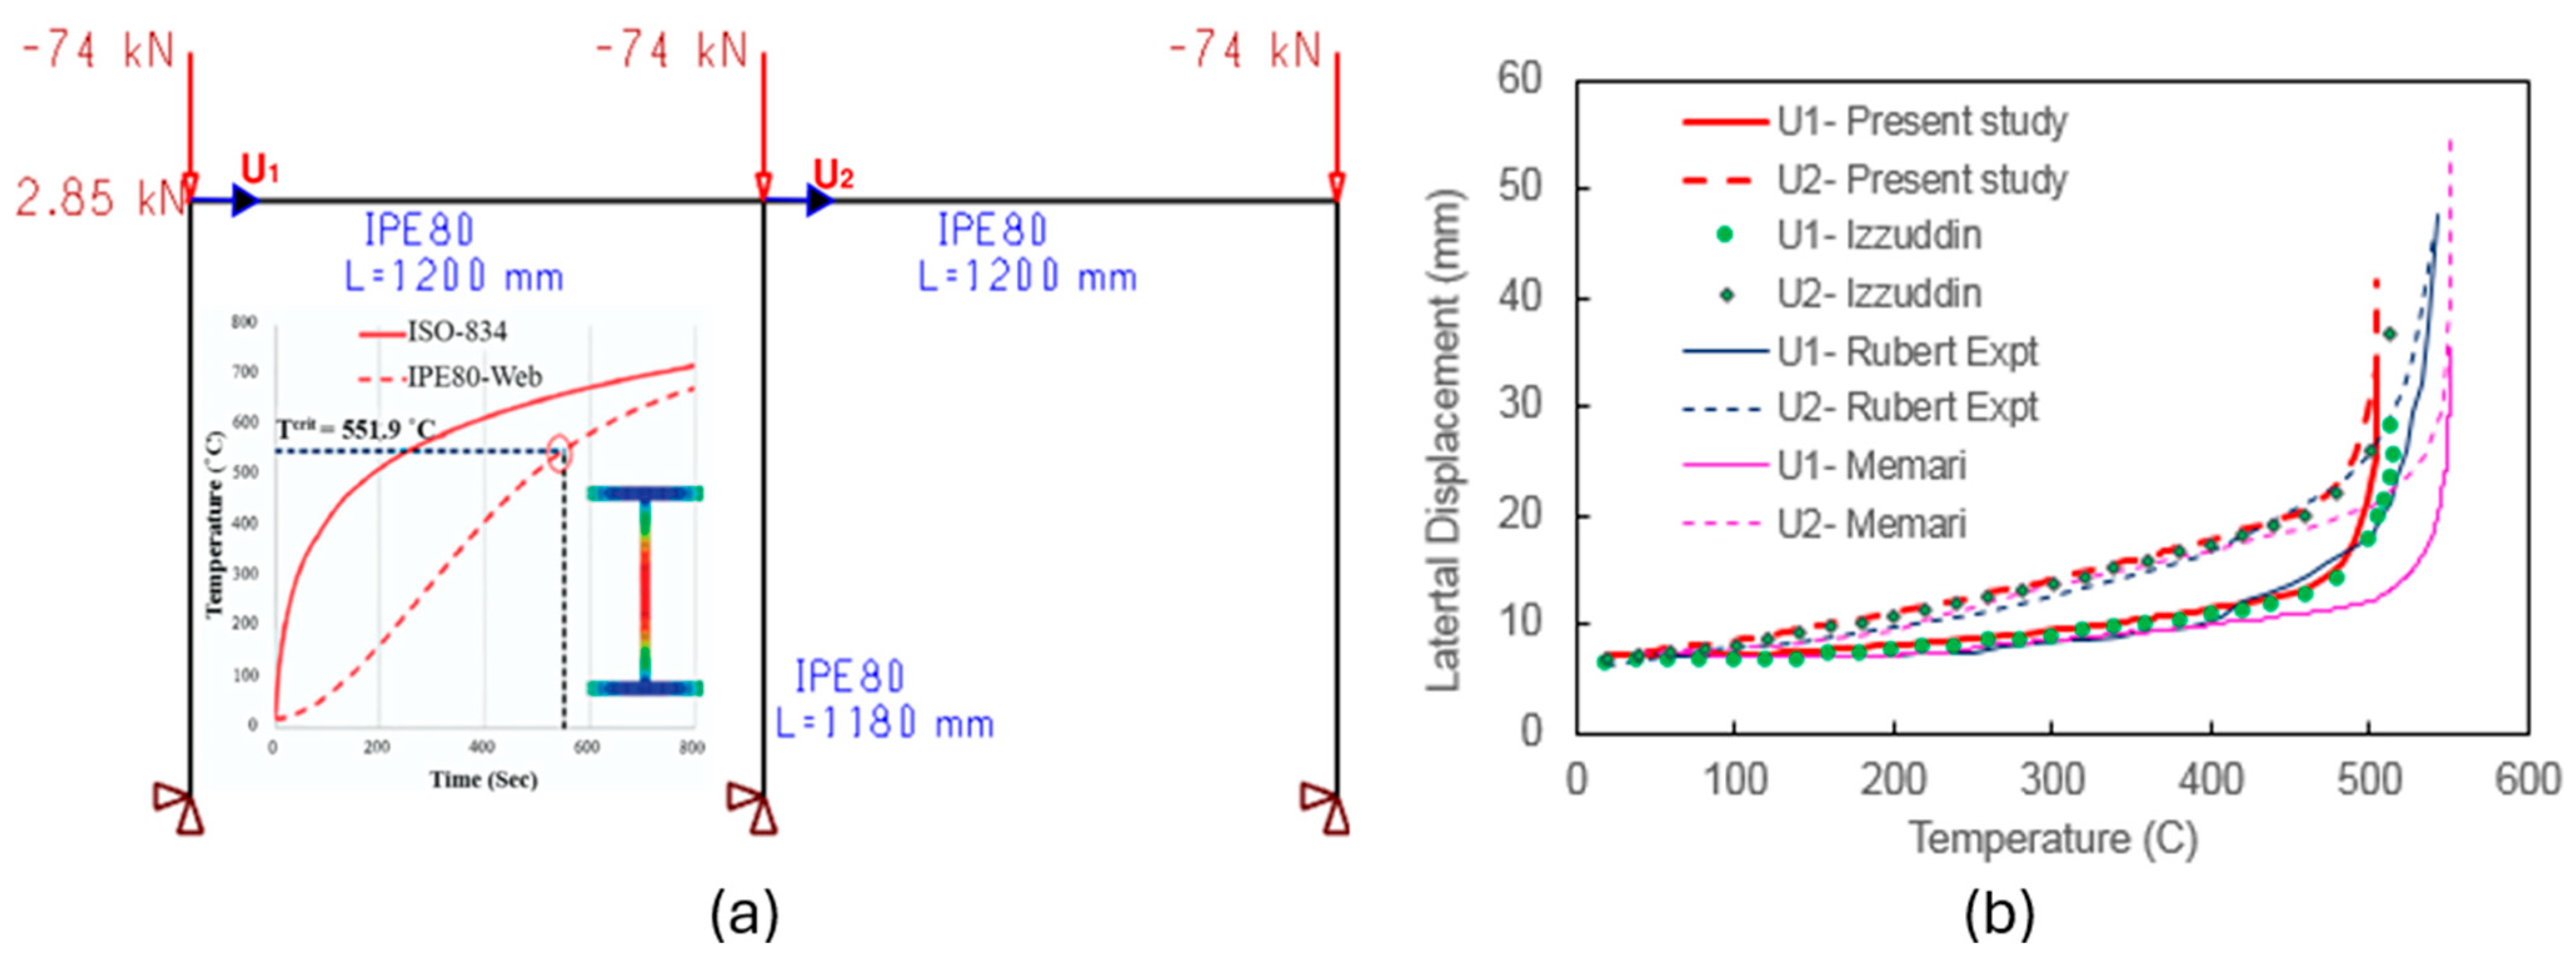
The sequentially coupled thermal–structural analysis model was validated against the small-scale fire test conducted by Rubert and Schaumann [22]. The test specimen, designated ZSR1, was a one-storey, two-bay steel frame with 1200 mm beam spans and 1180 mm column heights. All members were fabricated from IPE 80 sections. The column bases were pinned, and the beam–column joints were rigidly connected. The frame was subjected to vertical point loads of 74 kN at each beam–column intersection and a lateral load of 2.85 kN at the top of the left-hand column.
Figure 11 shows the frame geometry, section properties, boundary conditions, applied loads, and fire exposure configuration. In the structural model, the bottom end of each column is restrained in both horizontal and vertical directions as shown in Figure 11a. Each beam and column was meshed with ten two-node B31 elements. The out-of-plane displacements were restrained throughout the analysis. The steel was modeled as an elastic–perfectly plastic material with an ambient temperature yield strength of 355 MPa and an elastic modulus of 210 GPa. Temperature-dependent yield strength, elastic modulus, and thermal expansion coefficients were assigned in accordance with Eurocode 3-1-2 [19]. The temperature time history of the standard fire and the corresponding temperature at the centre of the web of a column exposed to fire are also shown in Figure 11a, along with the column section where the hotter parts (e.g., web) are shown in red and the cooler parts (e.g., flanges) are shown in blue or green, where blue being cooler than green.
Only the left bay was exposed to the ISO 834 standard fire, resulting in elevated temperatures in the corresponding beam and column members. Steel temperature–time histories were obtained from an independent two-dimensional heat-transfer analysis. The temperature–time history at the centroid of each cross-section was input into the thermal–structural analysis.
For the heat-transfer model, the IPE80 section was discretized using 2D four-noded DC2D4 elements. Temperature-dependent material properties, including specific heat and thermal conductivity, were defined in accordance with Eurocode 3-1-2 [19], while the steel density was kept constant at 7850 kg/m3. The thermal analysis boundary conditions included a convective heat-transfer coefficient of 35 W/m2K and a radiative emissivity of 0.7 applied on all four exposed faces. The ISO-834 furnace temperature–time curve (solid line) and the resulting web temperature at the section centroid (red dashed line) are shown in Figure 11a. A qualitative temperature contour for the IPE80 section is presented, indicating higher temperature at the centroid of the section (red) relative to the temperature in the flanges. The centroid temperature is conservatively adopted as the representative member temperature in the thermal structural analysis.
The analysis was conducted in two stages. First, the gravity-only response was computed. Subsequently, the sequential thermal–structural analysis was performed until large displacements triggered a rundown failure of the left bay beam. Figure 11b compares the predicted lateral displacement histories at the top nodes of the left-hand bay with the experimental results of Rubert and Schaumann [22] and other numerical studies [15,23]. The results show good agreement between the present model and both the experimental and numerical benchmarks.
The experimental study reported the onset of large displacement at a furnace temperature of 547 °C [23], whereas the present analysis predicted a rundown failure at 551.9 °C, further supporting the validity of both the heat-transfer and thermal–structural numerical models.

3. Results and Discussion

3.1. Heat-Transfer Analysis Results

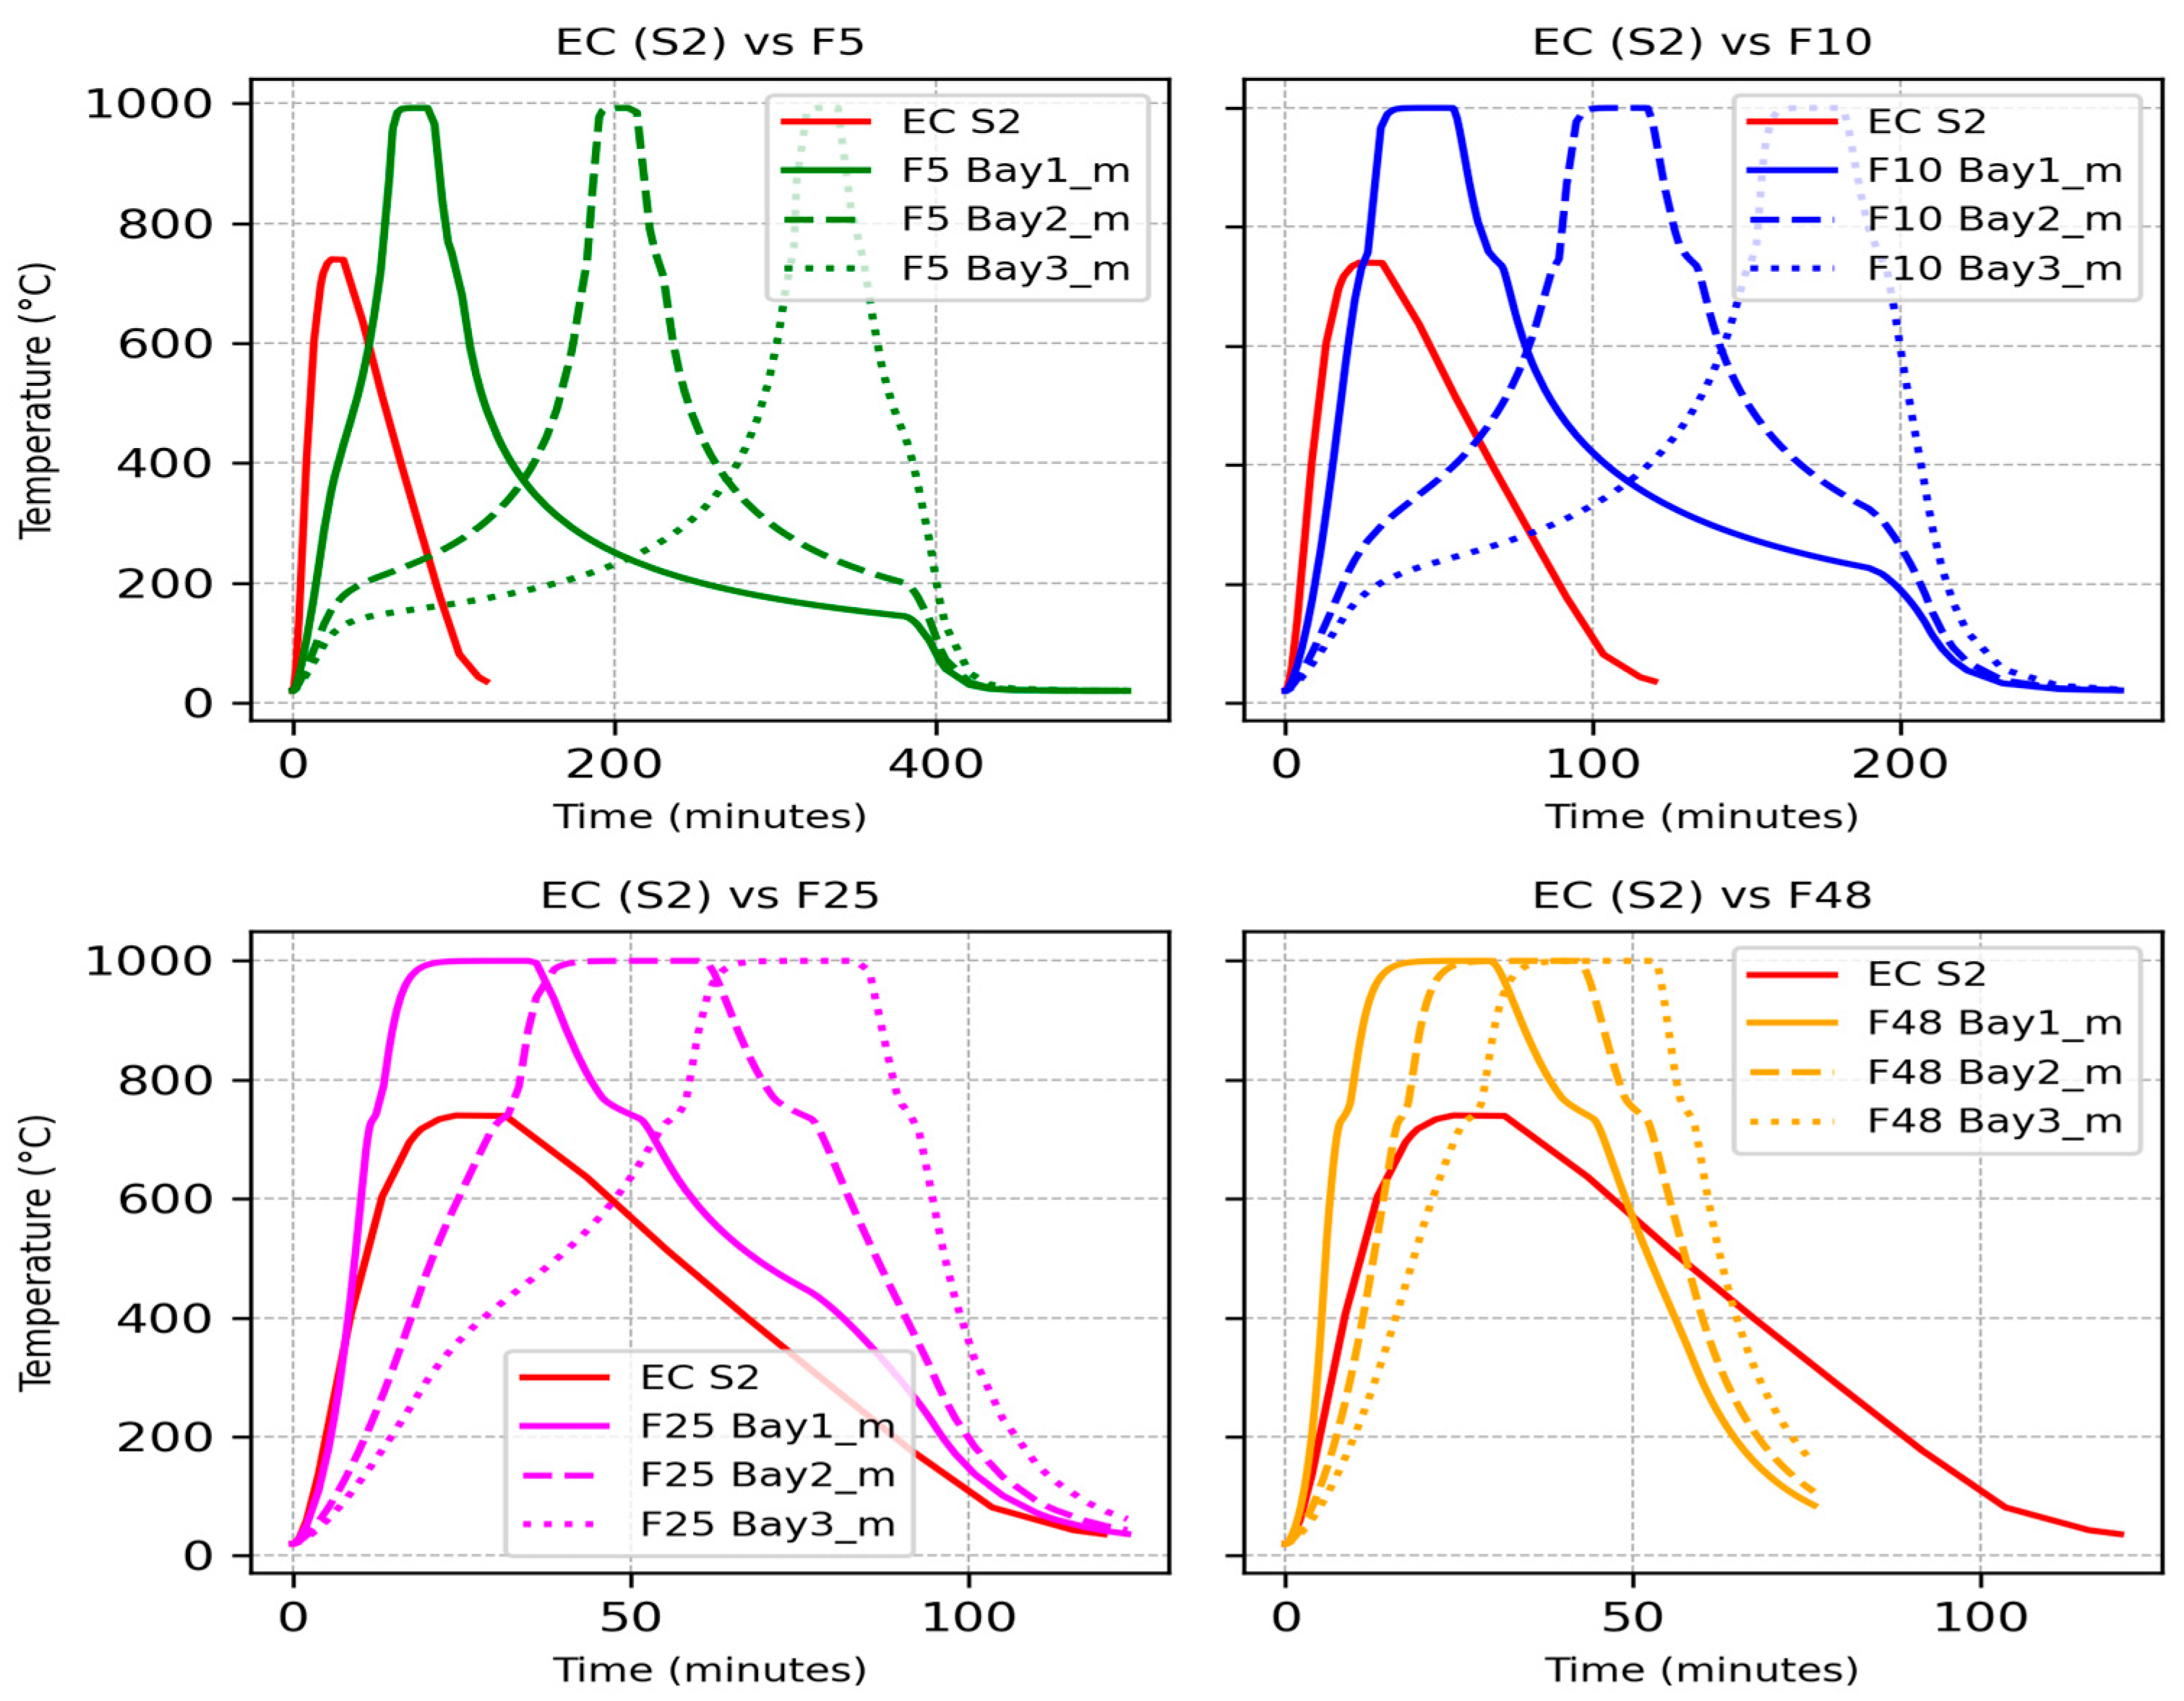
Figure 12 presents the temperature histories of the second–storey beam section (W30×116) at the mid-span of each bay in respective traveling fire scenario (indicated on top of the subplot). Within each subplot, the temperatures at the beam mid-span locations are distinguished by line types (solid, dashed and dotted). The teperature at the middle of the bays reached its peak as the fire travels from left to right and the beam mid point is subjected to the corresponding near field temperature. The beam section temperature history in EC parametric fire is unique for a given cross-section irrespective of location, which is shown in red line for a comparison.
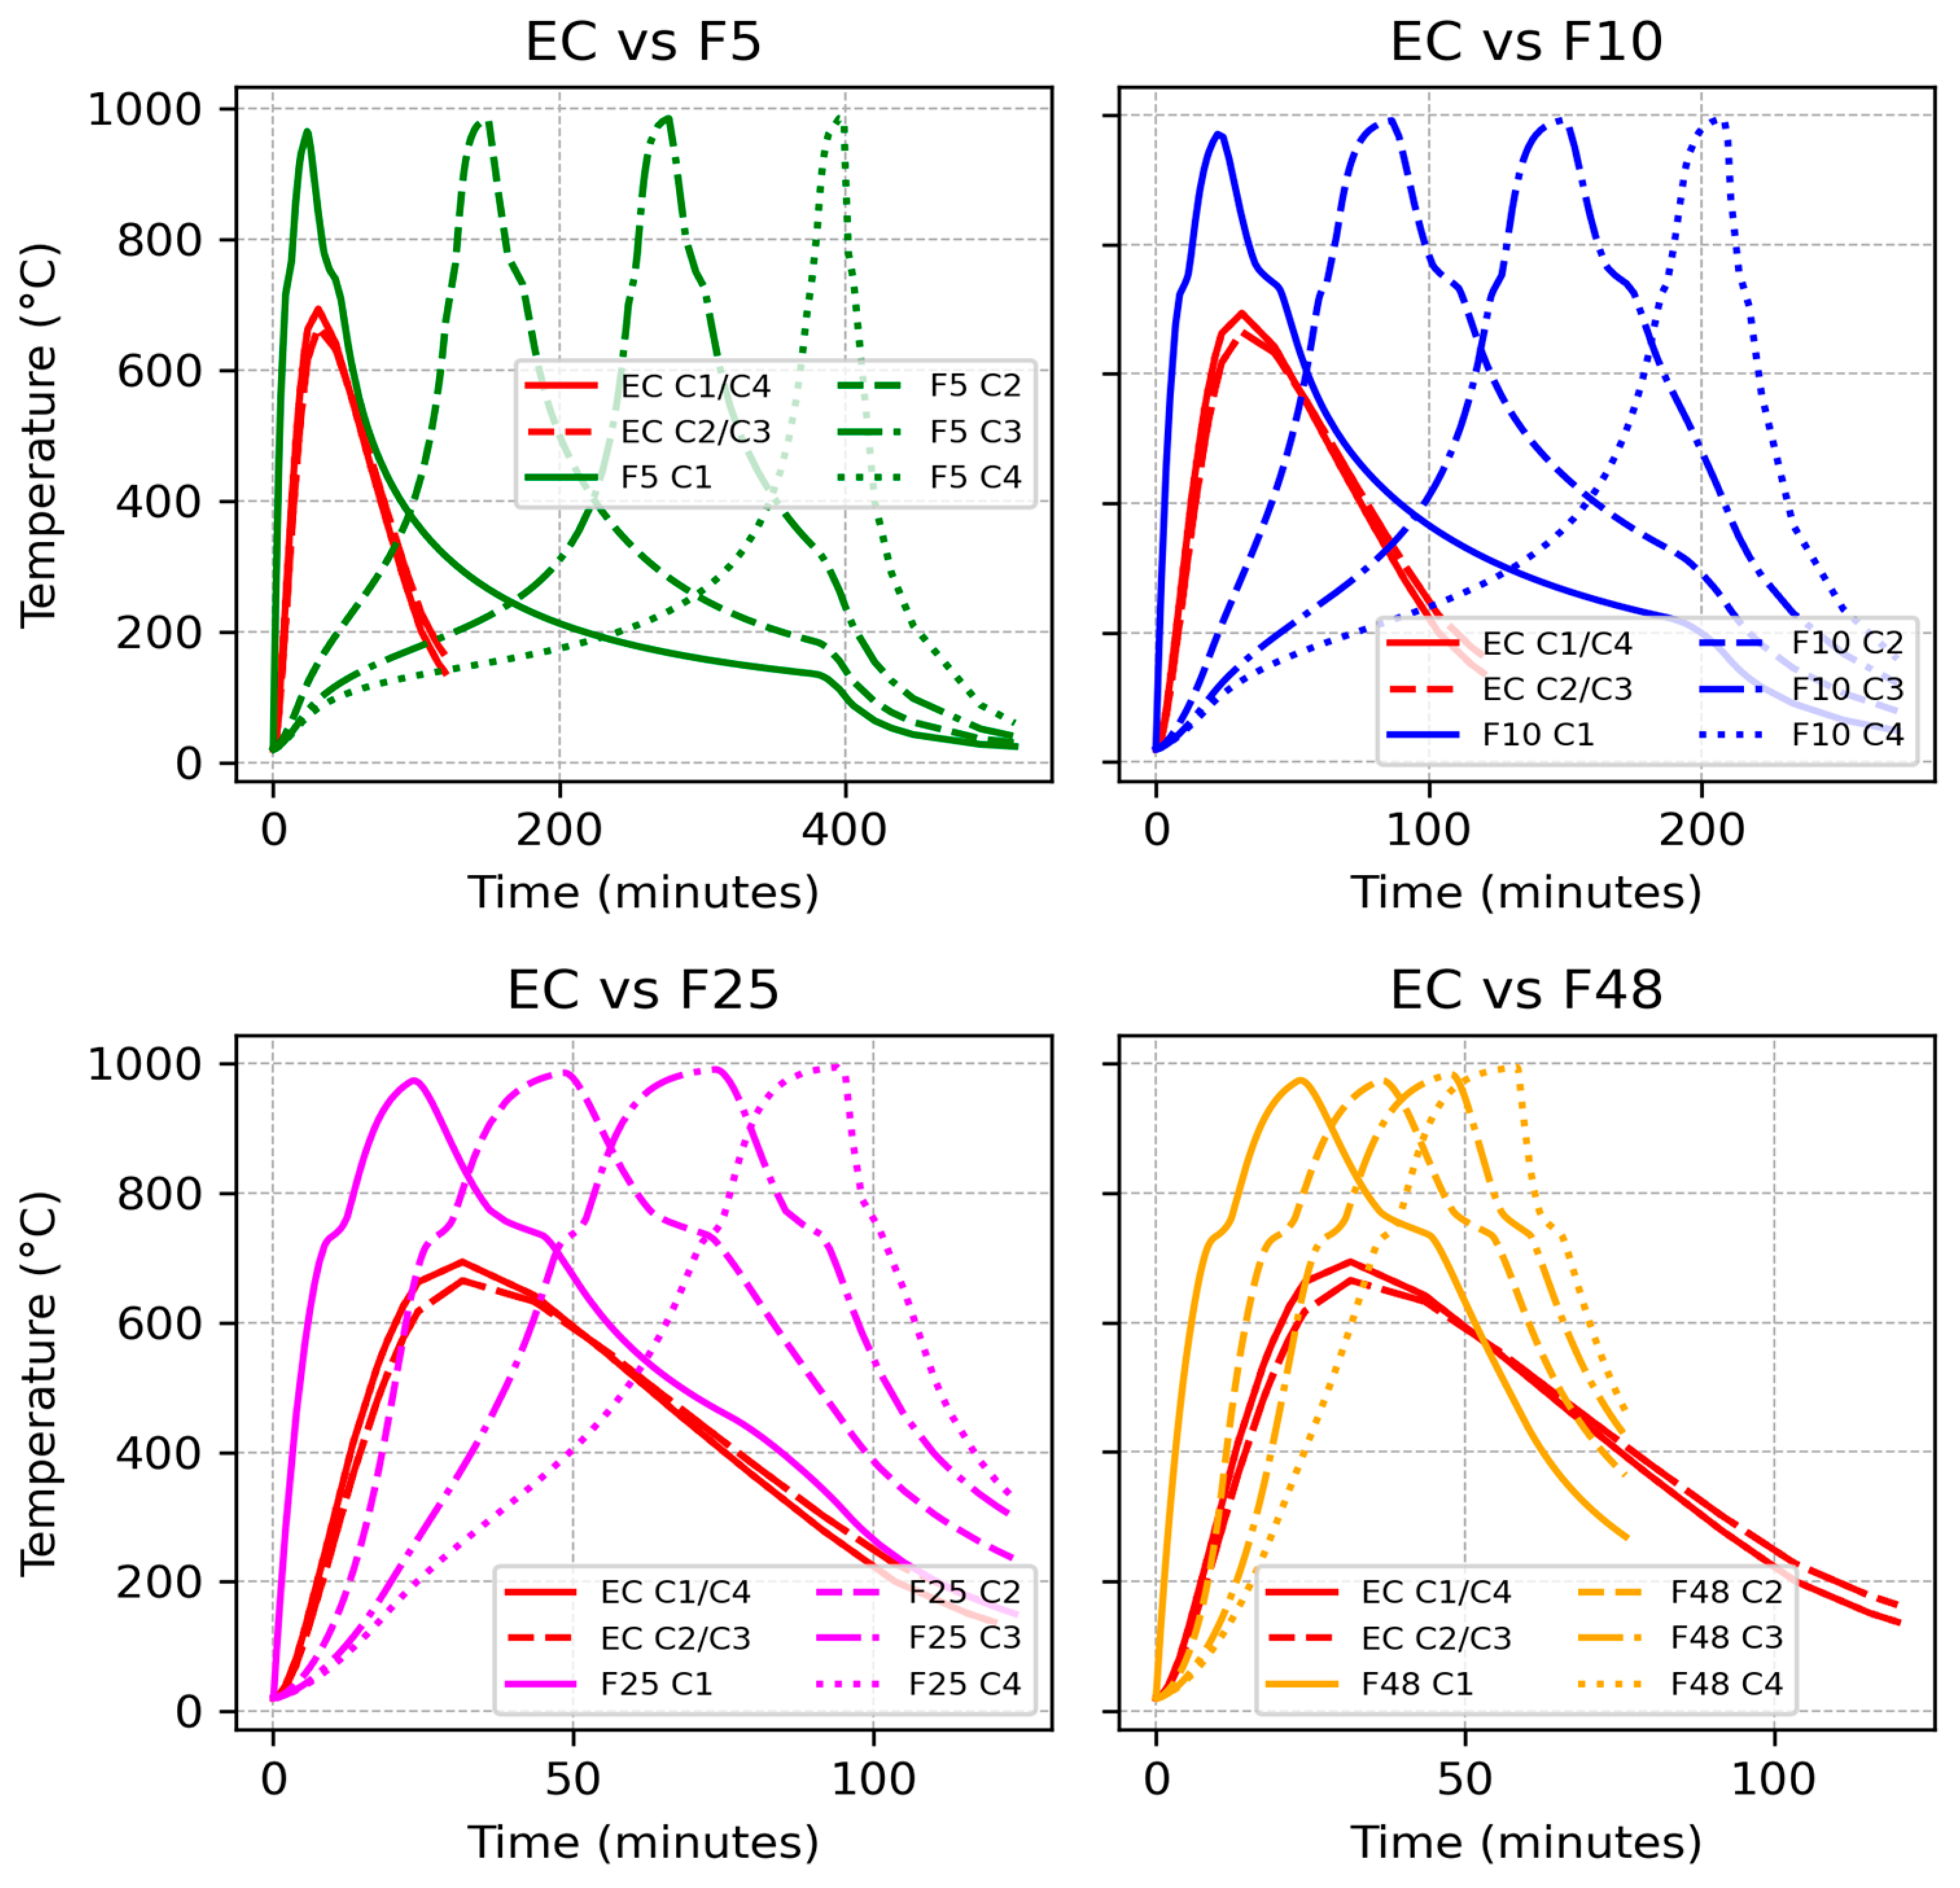
Figure 13 shows the temperature for each of the column sections in all four traveling fire scenarios compared to the column section temperature in EC fire. The column temperature in uniform EC fire is unique for a given cross-section size (for instance, the pair of columns C1 and C4 having the same cross-section has unique temperature in EC fire, irrespective of their location). On the contrary, the the column section temperature in traveling fire is location-dependent. Within each subplot, the column temperature from left to right is distinguished by line types (solid (C1), dashed (C2), dash-dotted (C3) and dotted line (C4) respectively). Further, a prolonged heating in traveling fire results in higher peak temperatures in the same column cross-section along the direction of fire travel. For instance, C4 (W14×257) has higher peak temperature in each traveling fire scenario compared to C1 (W14×257).

3.2. Structural Response of the Case Study Frame to Traveling Fire

Axial Force Developed in Beams at Full EC Fire and Different TFM Scenarios

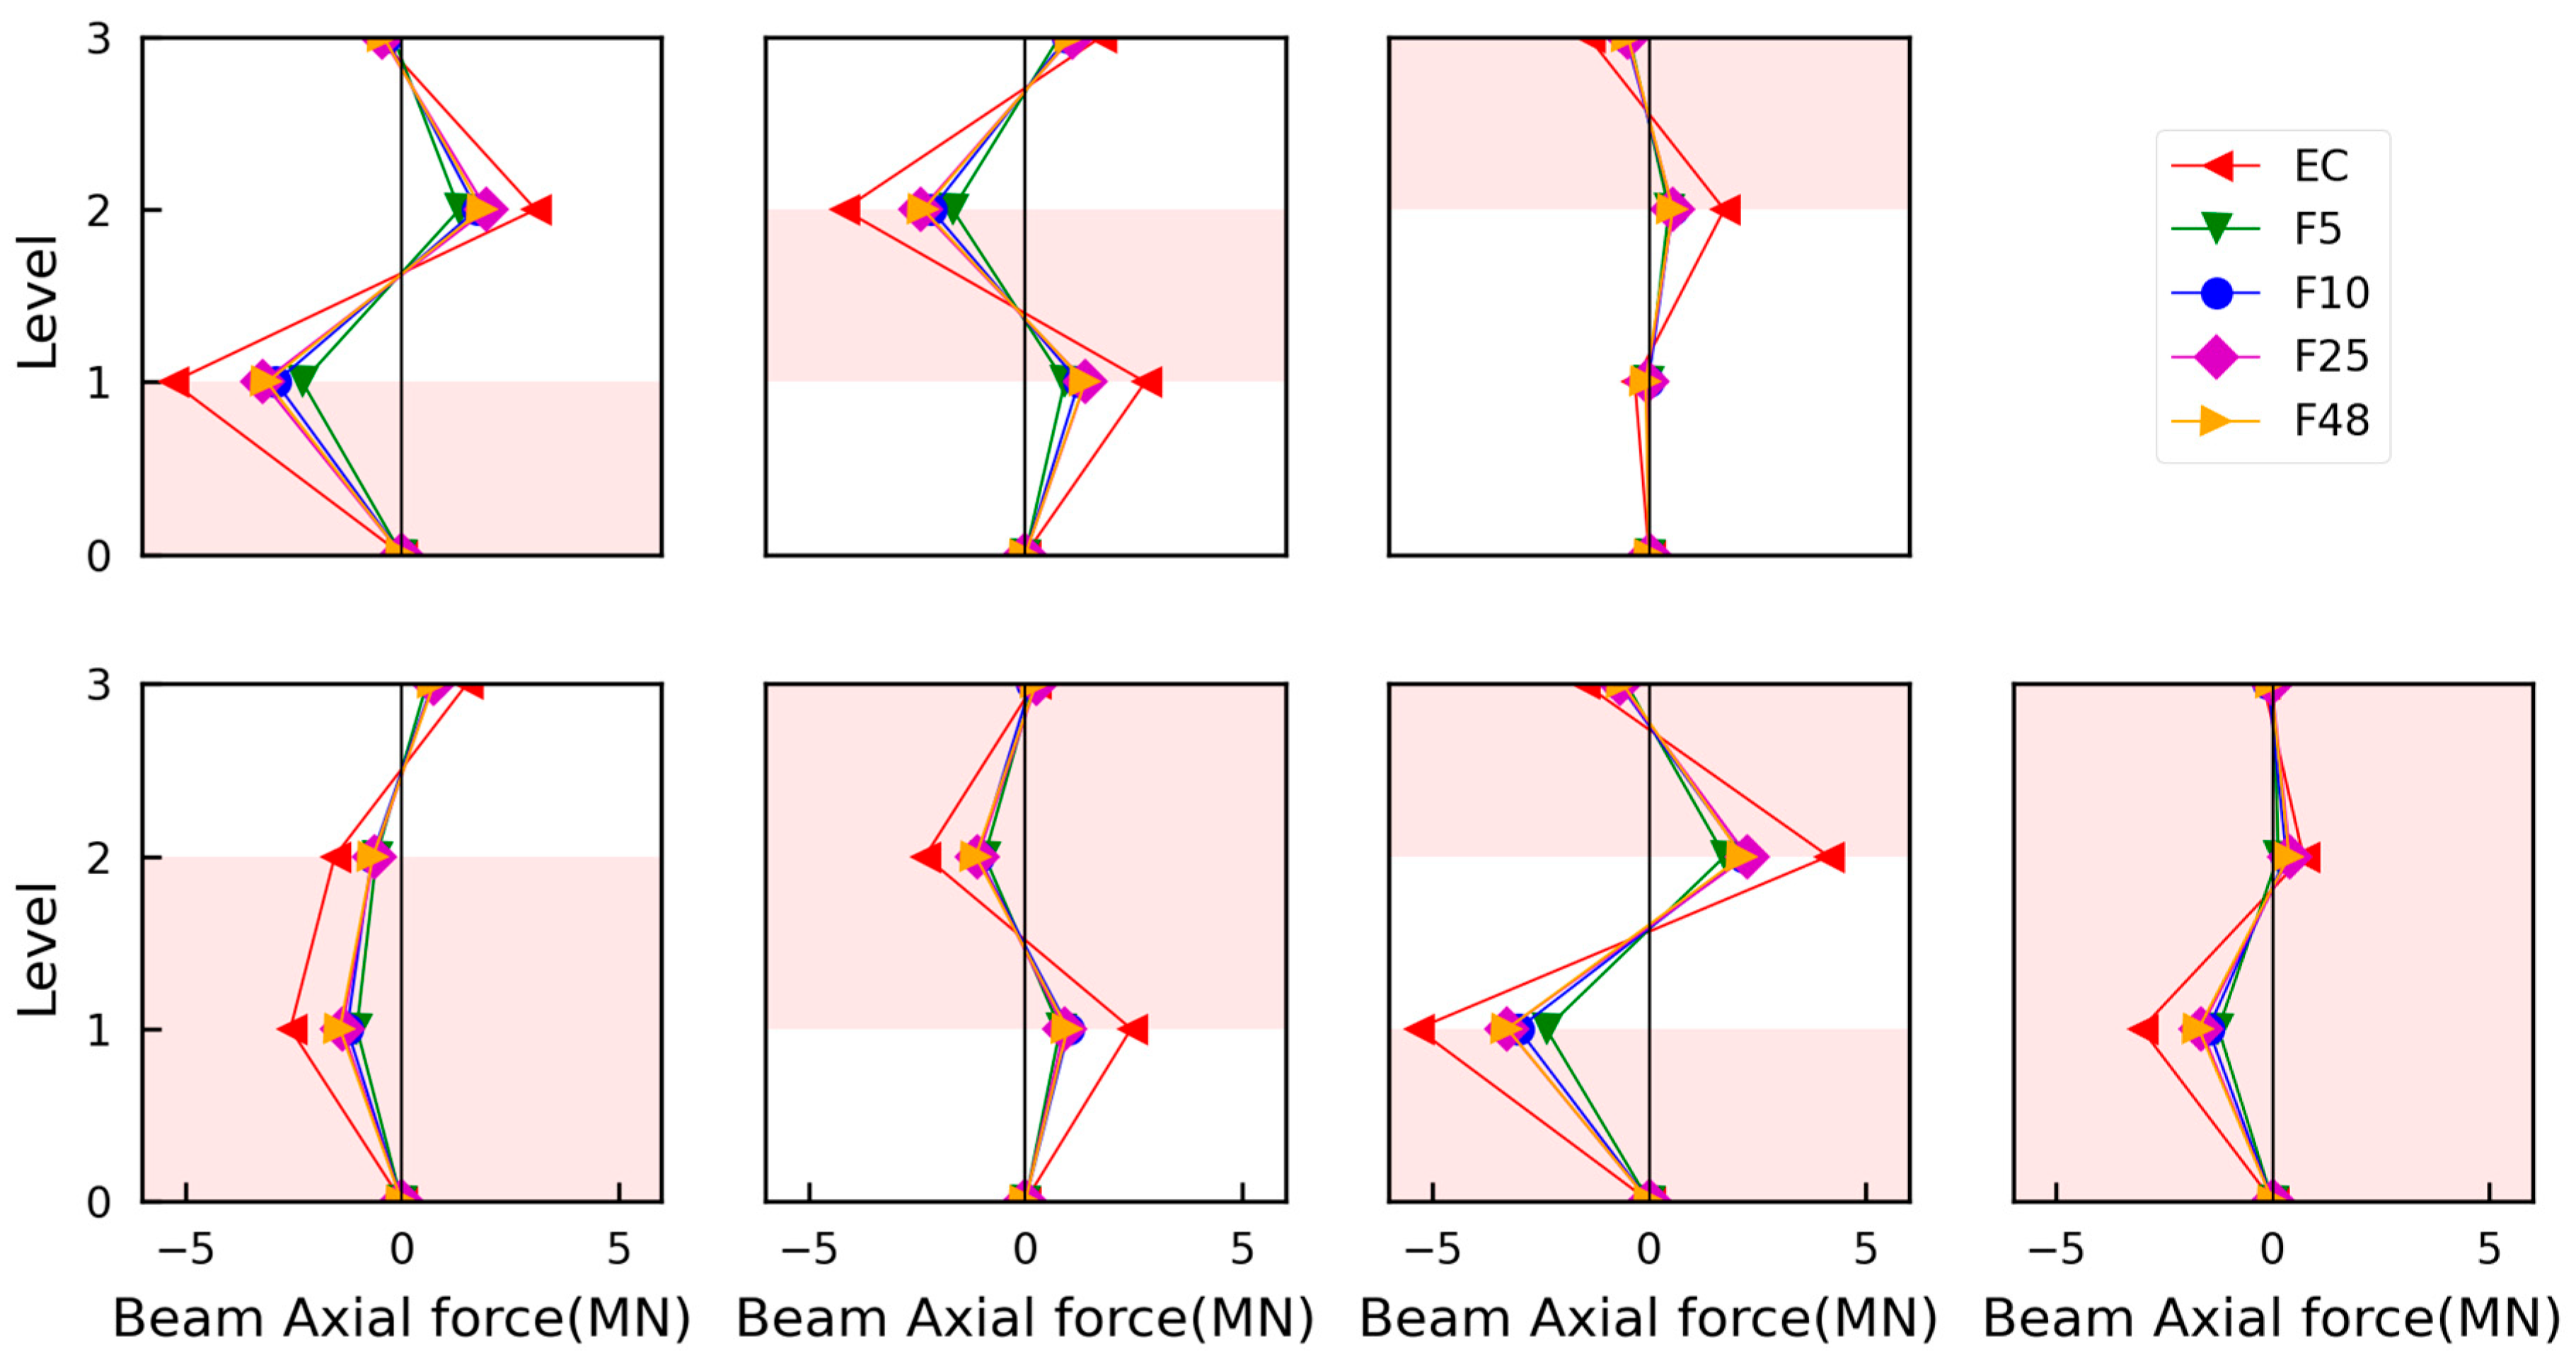
A total of 35 fire scenarios have been considered here, and thermal and structural analyses have been performed for all cases. Figure 14 and Figure 15 present the peak axial forces in the beams due to different fire scenarios across different floors. The time histories of axial forces were monitored for each bay and plotted for selected representative fire scenarios. For these plots, axial forces were tracked at the element at the center of the middle bay of each floor, and the corresponding peak values were recorded. Beam moments were monitored at both ends and at mid-span, while column moments and axial forces were tracked at the element ends. Fire on different floors is indicated by “S” followed by the floor number(s). Figure 14 shows the maximum compressive force acting on the beam in the central bay of the heated floor (or on the stiffer floor in multi-story fire scenario). On the cooler floors, the forces exhibited at that instant act in an alternating and opposing manner. For instance among the one-story fire, the beam on Floor 1 experiences the maximum compressive force during a full EC fire on that floor (S1). A similar level of force is developed in a 1st-floor beam when the fire is on Floors 1 and 3 (S13). The maximum axial force in the 2nd floor beam is also high when the fire is on that floor (S2). In case of multi-floor fire, the stiffer floor on fire is subjected to a maximum compressive force. In all fire scenarios the maximum compressive force on the heated beam is experienced in the uniform fire scenario, whereas amongst the traveling fire scenarios the 25% traveling fires induce the maximum compressive forces in the heated beams.
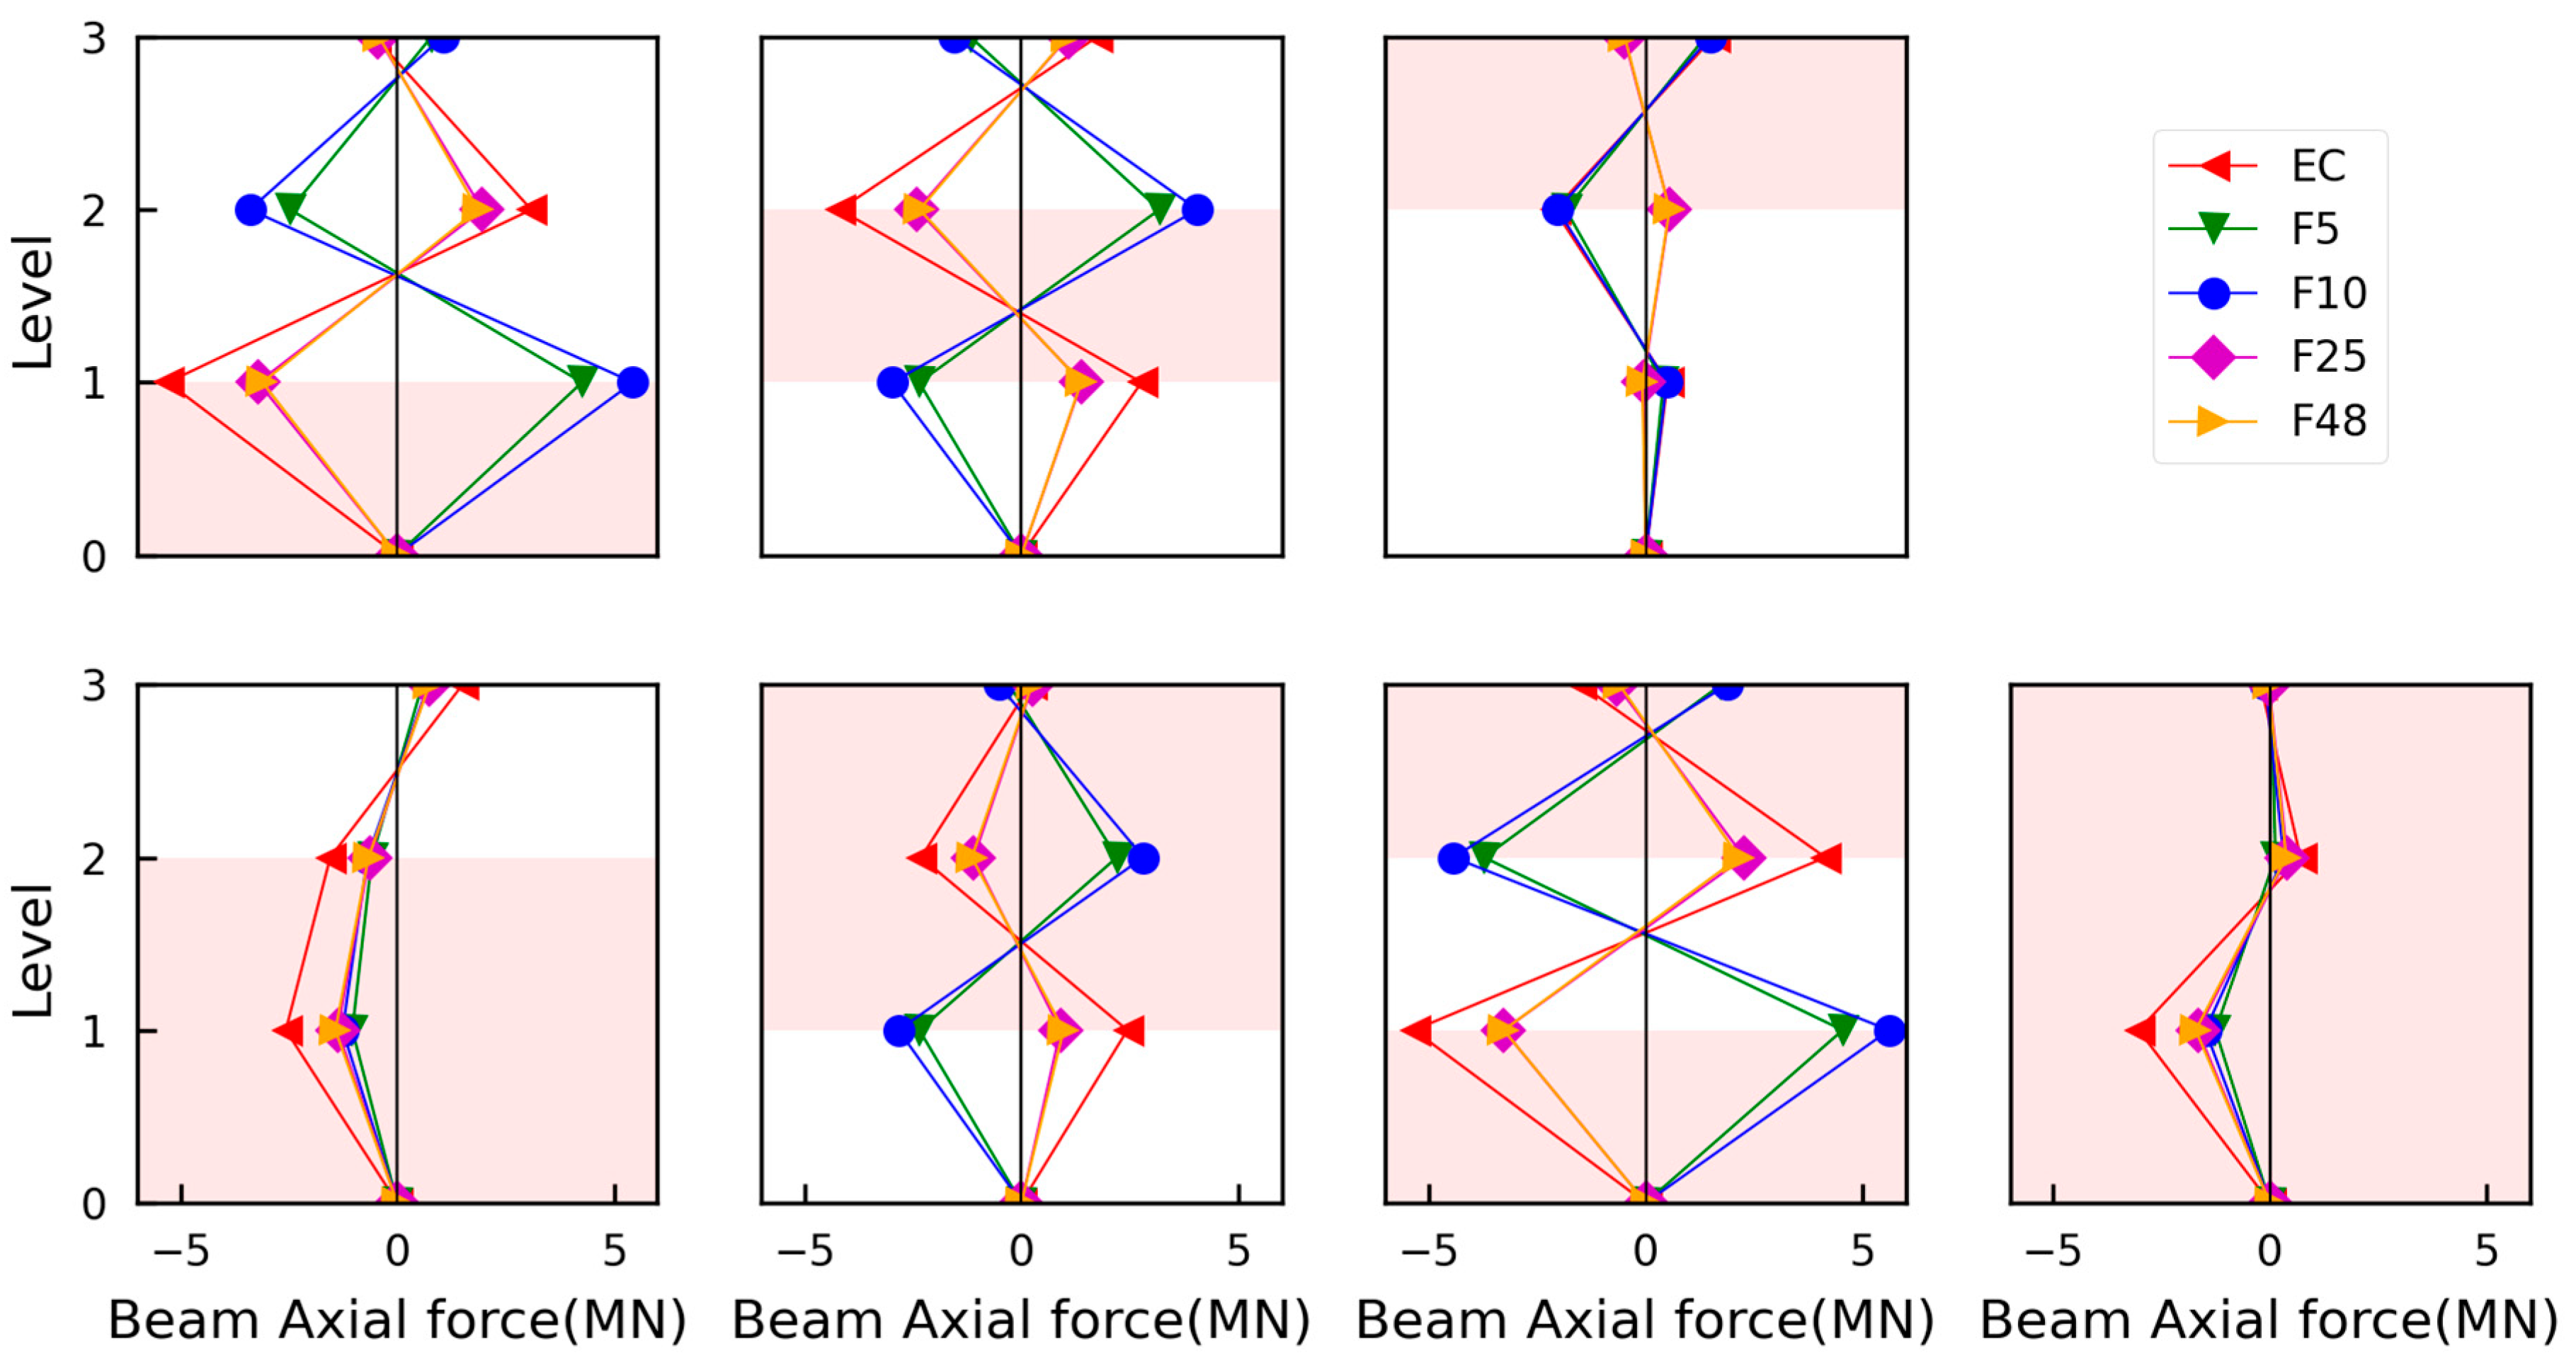
On the other hand, Figure 15 shows the peak axial force developed in beams during an entire fire event, irrespective of the beam is heated or not, corresponding to full EC fire and traveling fires corresponding to 5%, 10%, 25% and 48% TFM, as indicated by F5 through F48, respectively. The results in Figure 15 indicate that during the cooling phase, smaller travelling fire (F5 and F10) induces large tensile forces in the heated floor which in turn induces even greater compressive forces on the cooler floors than the heated beam experienced during the heating phase. From the figure, it is noted that, except for the fire scenario on S12 and S123, the beams on a fire floor experienced large tensile force; thereby, the cooler beams on an adjacent floor experienced even greater compressive forces.
Figure 14 and Figure 15 indicate that the axial forces developed in the beams are substantially lower when all three floors are exposed to fire compared with the other two scenarios. In general, axial forces are developed in beams due to thermal restraints imposed by the cooler surrounding structural members, such as unheated floors above the fire. When all storeys are simultaneously exposed to fire, the adjacent floors heat, expand, and contract together in a synchronized manner, resulting in significantly reduced restraint. Consequently, the axial forces generated in the members are much lower in case of fire on all floors than in cases where adjacent floors remain cooler and impose greater thermal restraints.

3.3. Response Under Full EC Fire and TFM

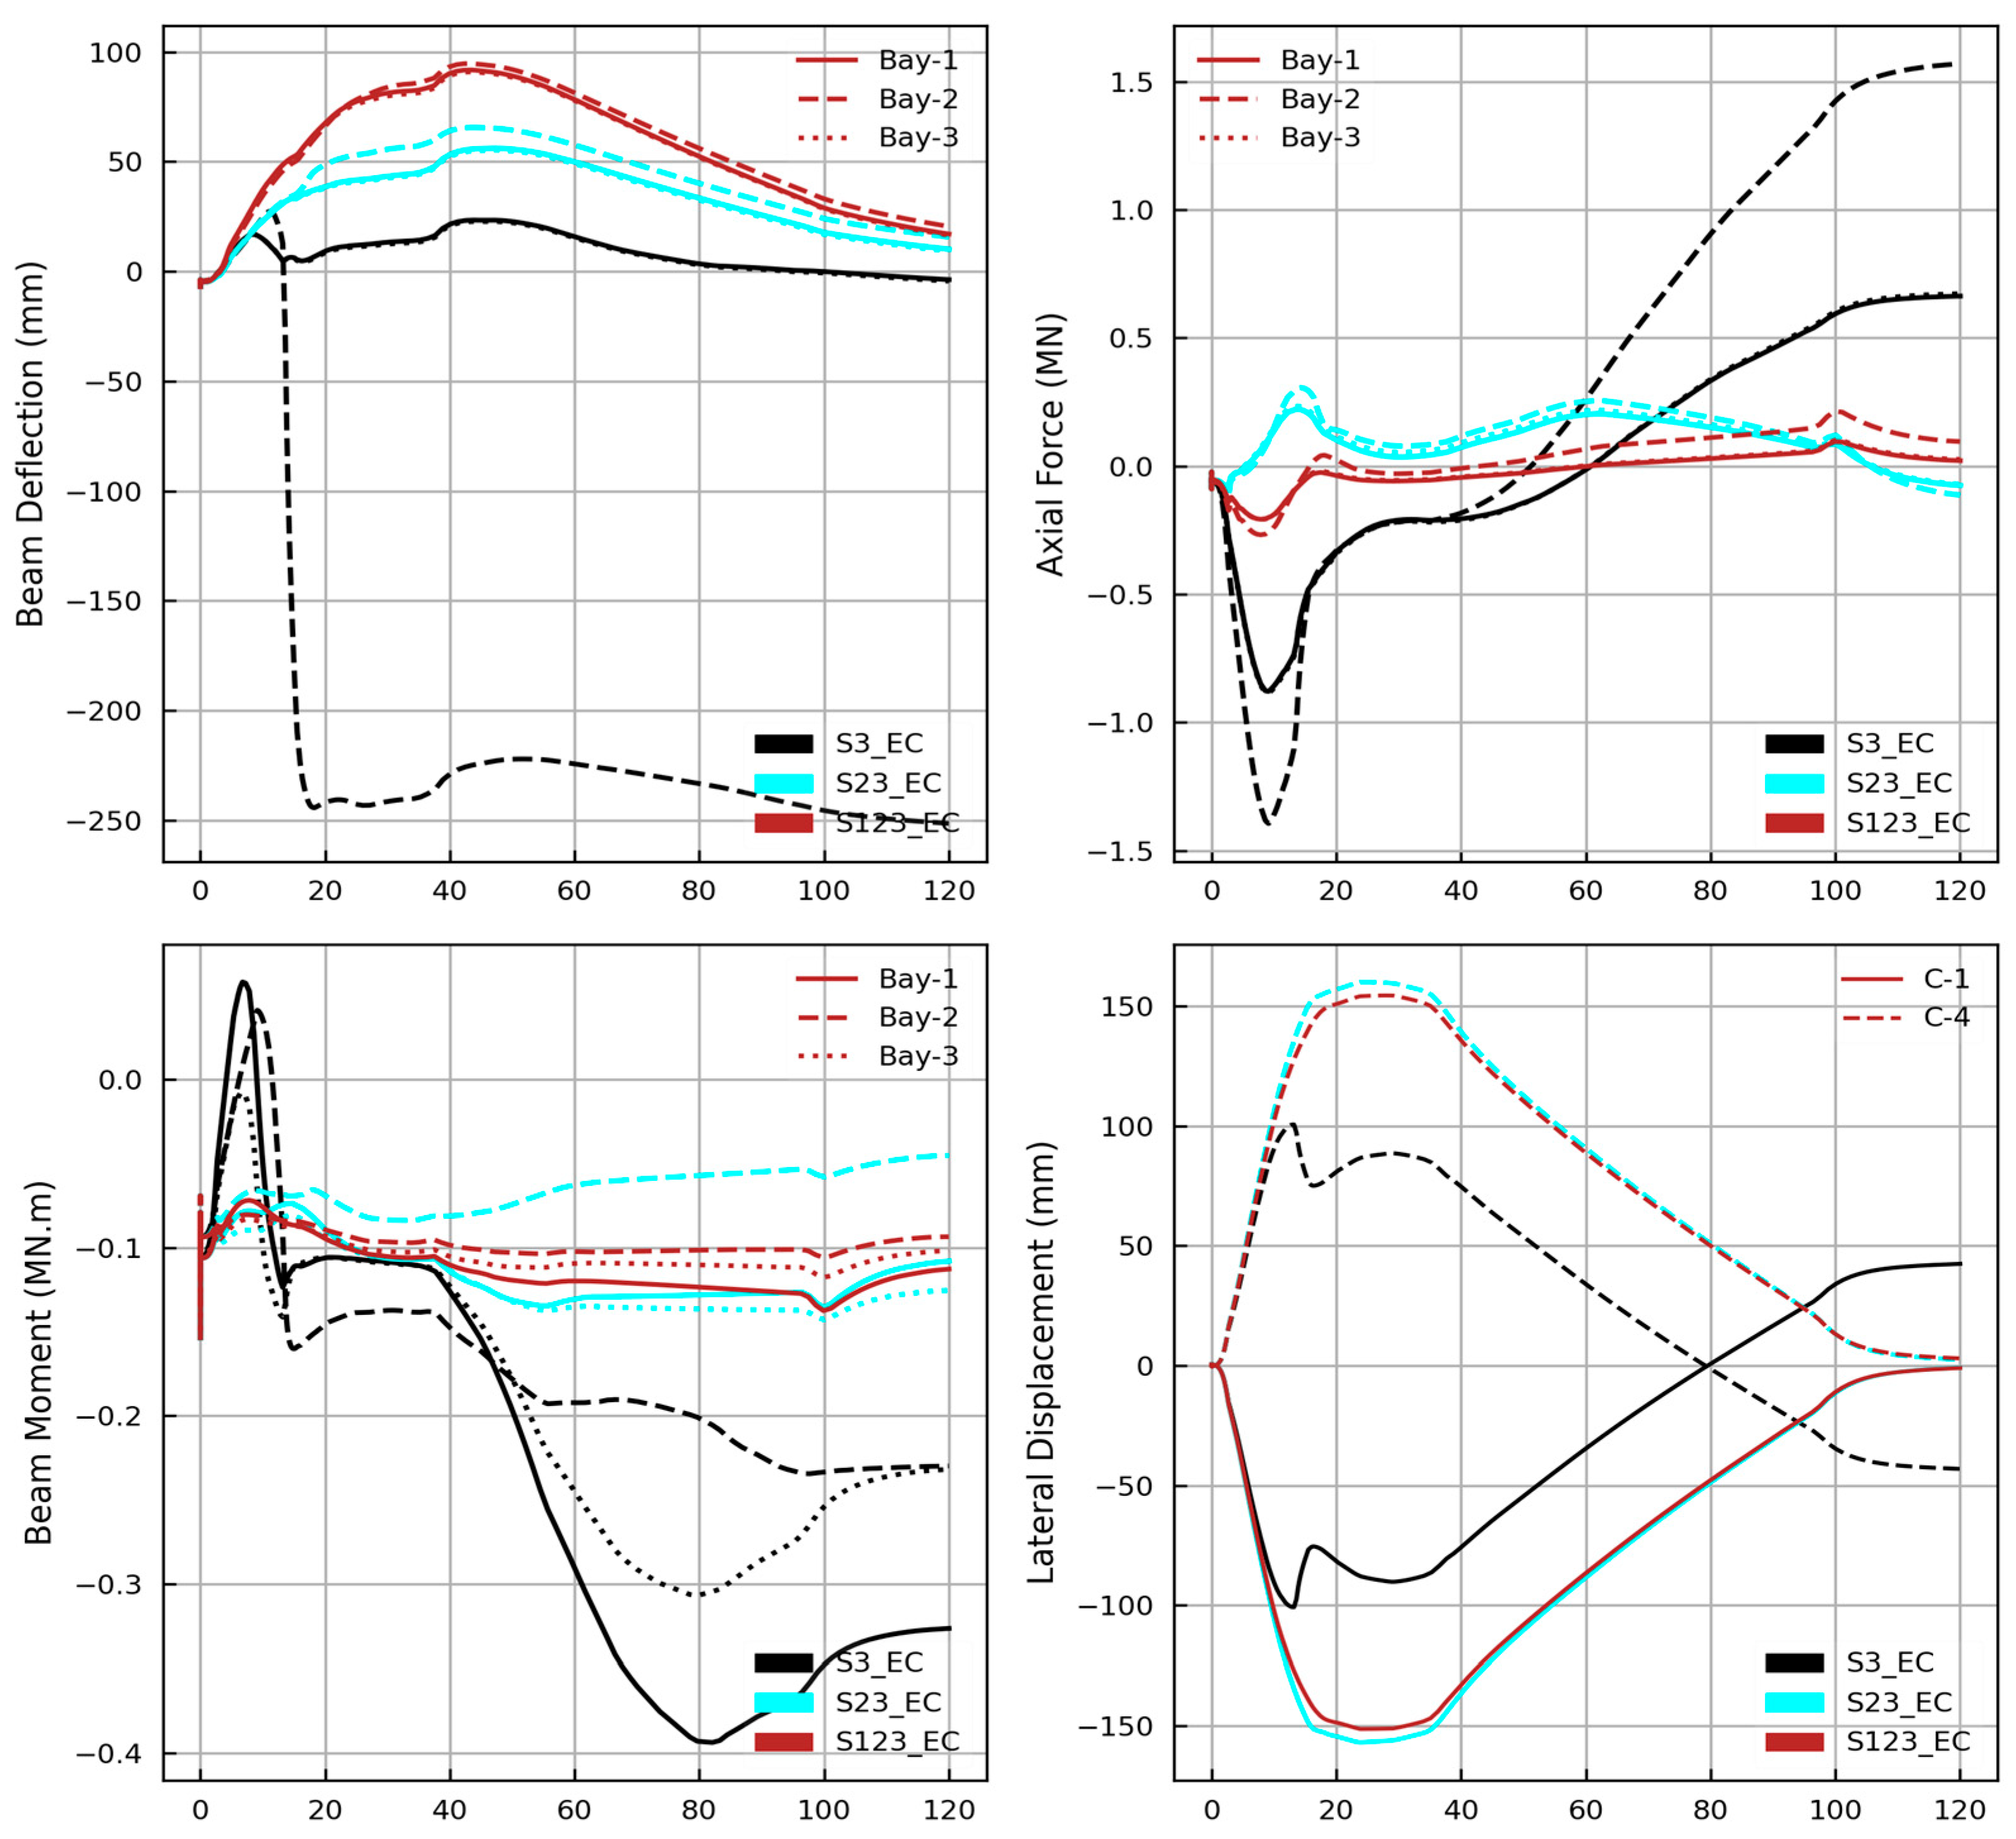
Figure 16 and Figure 17 show the sample results for the full EC fire and the 25% TFM (F25), respectively, at the third-floor level. The full EC fire subjects the whole structure to uniform fire distribution, according to the standard fire temperature–time history. It is observed from Figure 16 that full EC fire produces the maximum vertical displacement in the Bay 2 beam on the third floor, while the maximum bending moment on the beam on that floor is produced in Bay 1. Peak axial force is also developed in the Bay 2 beam. Lateral displacements at the columns are symmetric when a full EC fire is applied, and the lateral displacement becomes quite low at the end of the fire event, which indicates that there is no instability in the frame.
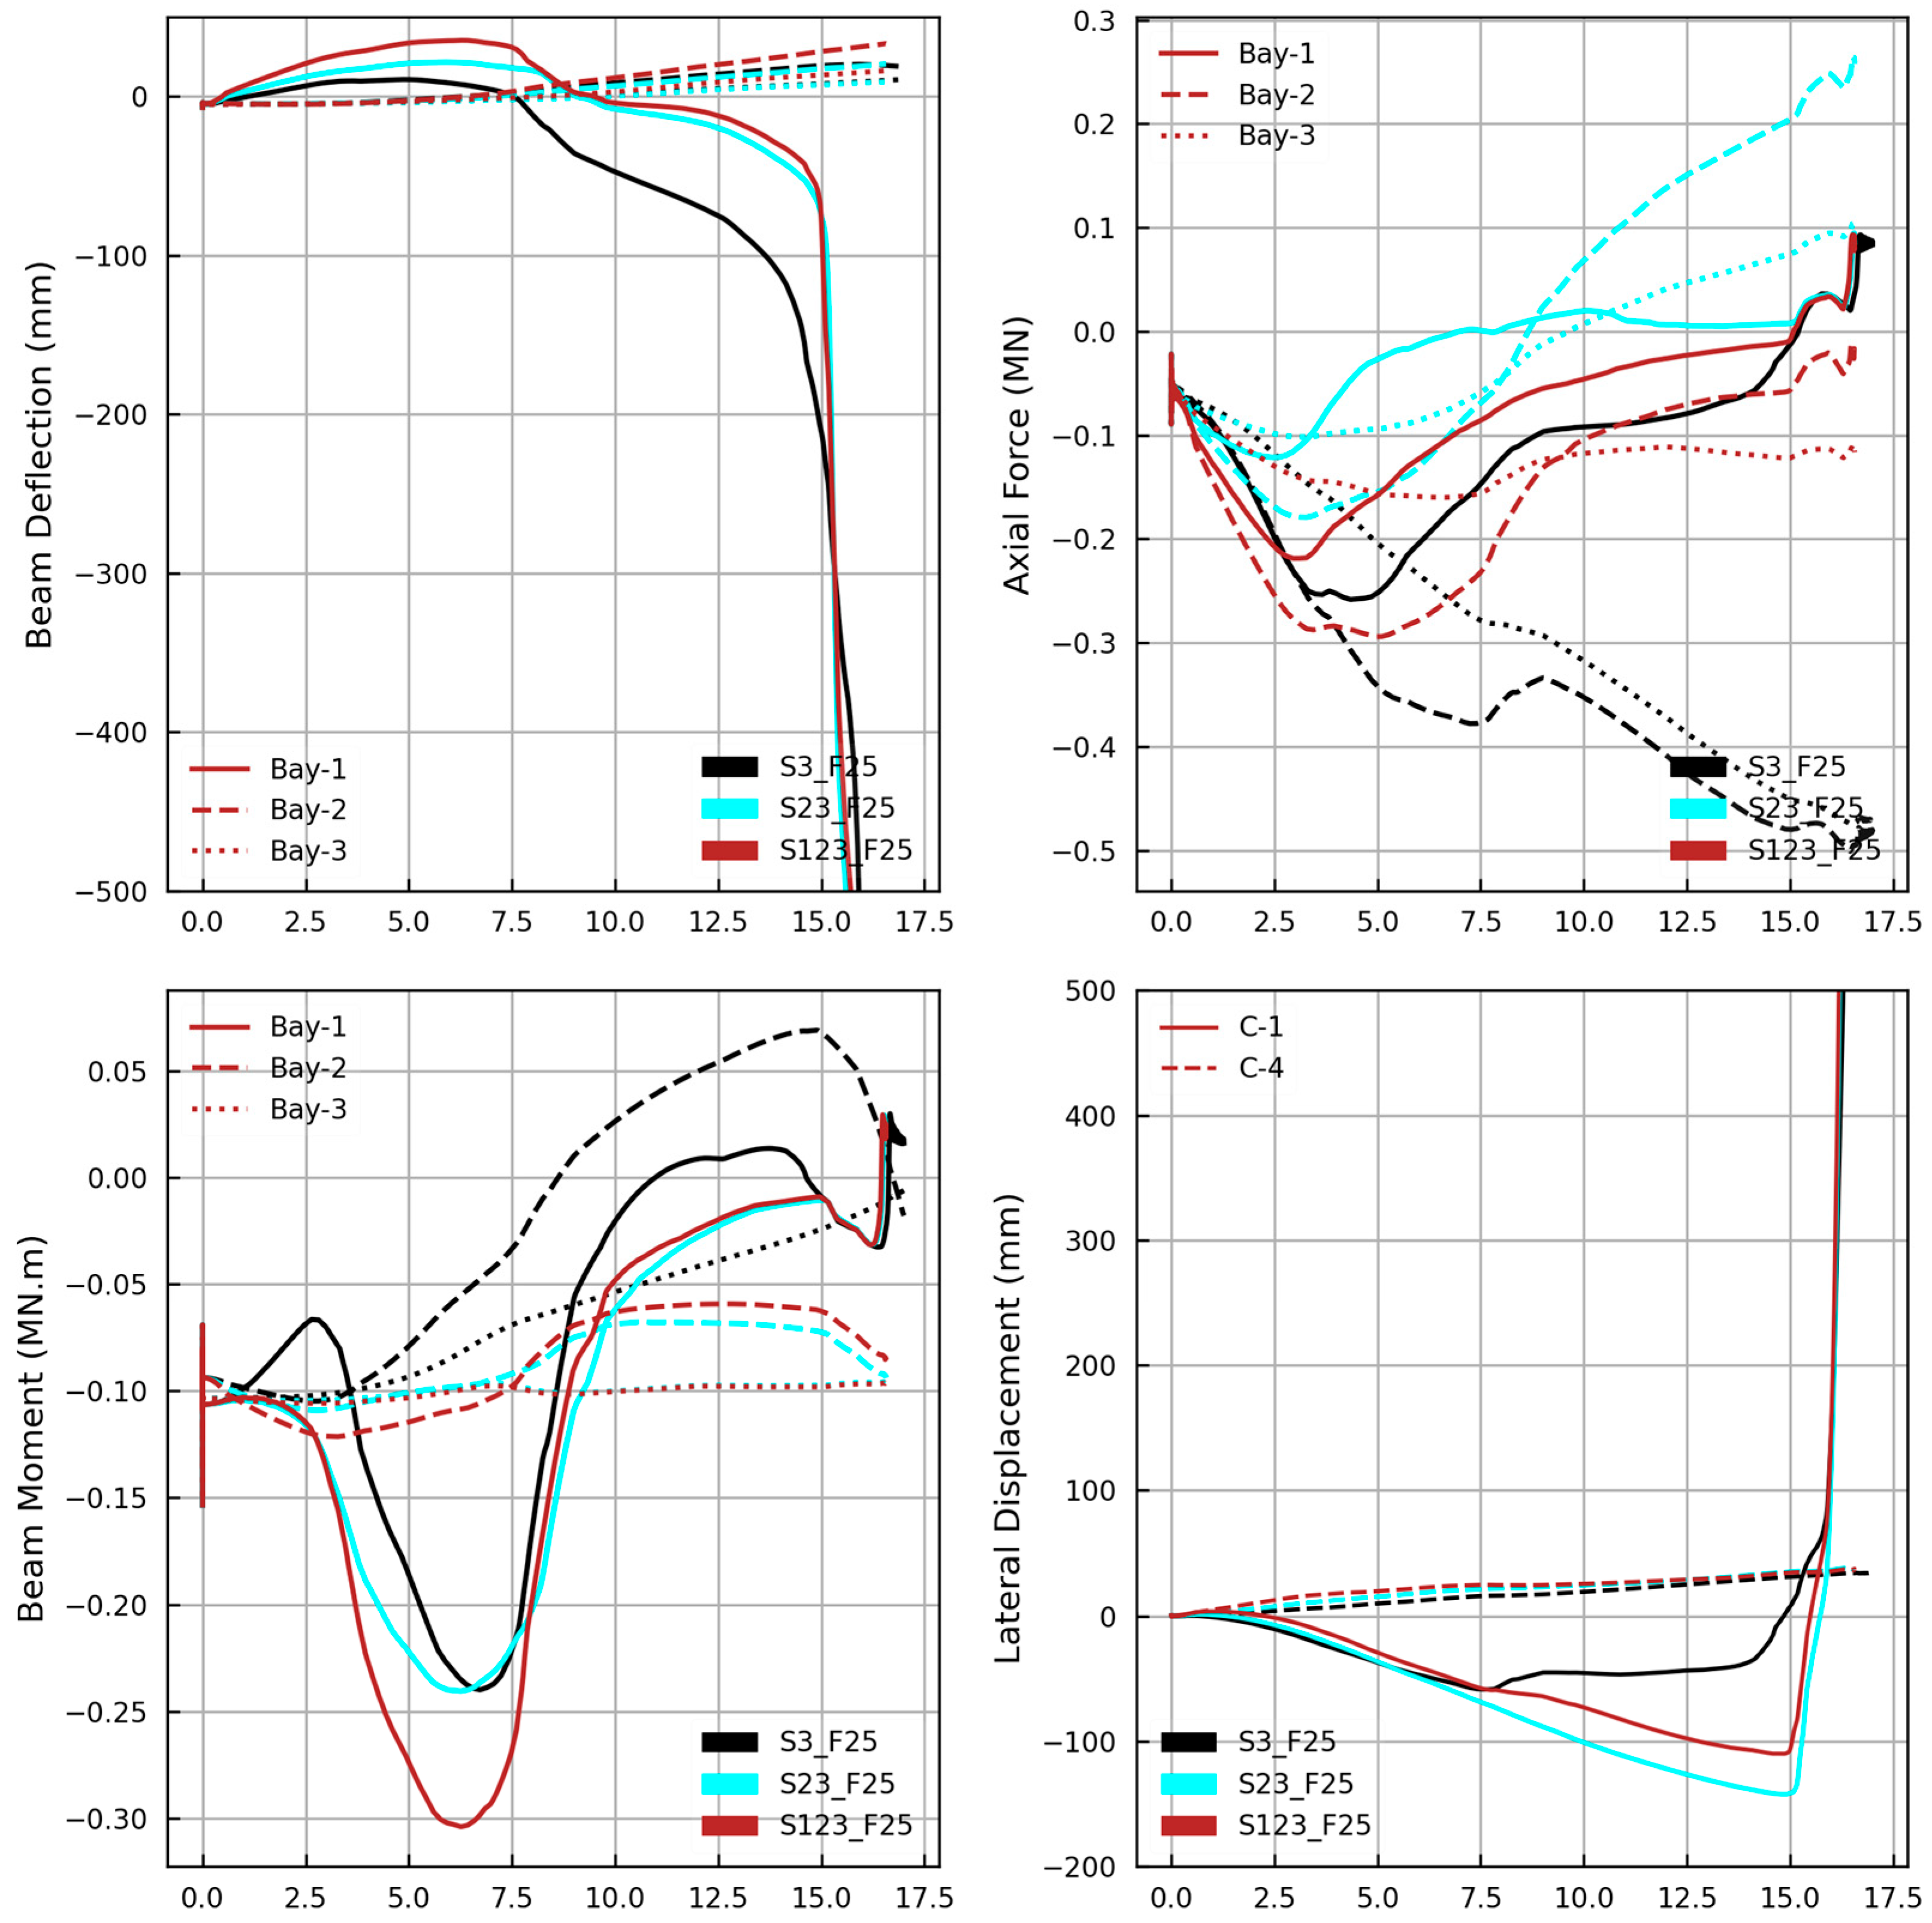
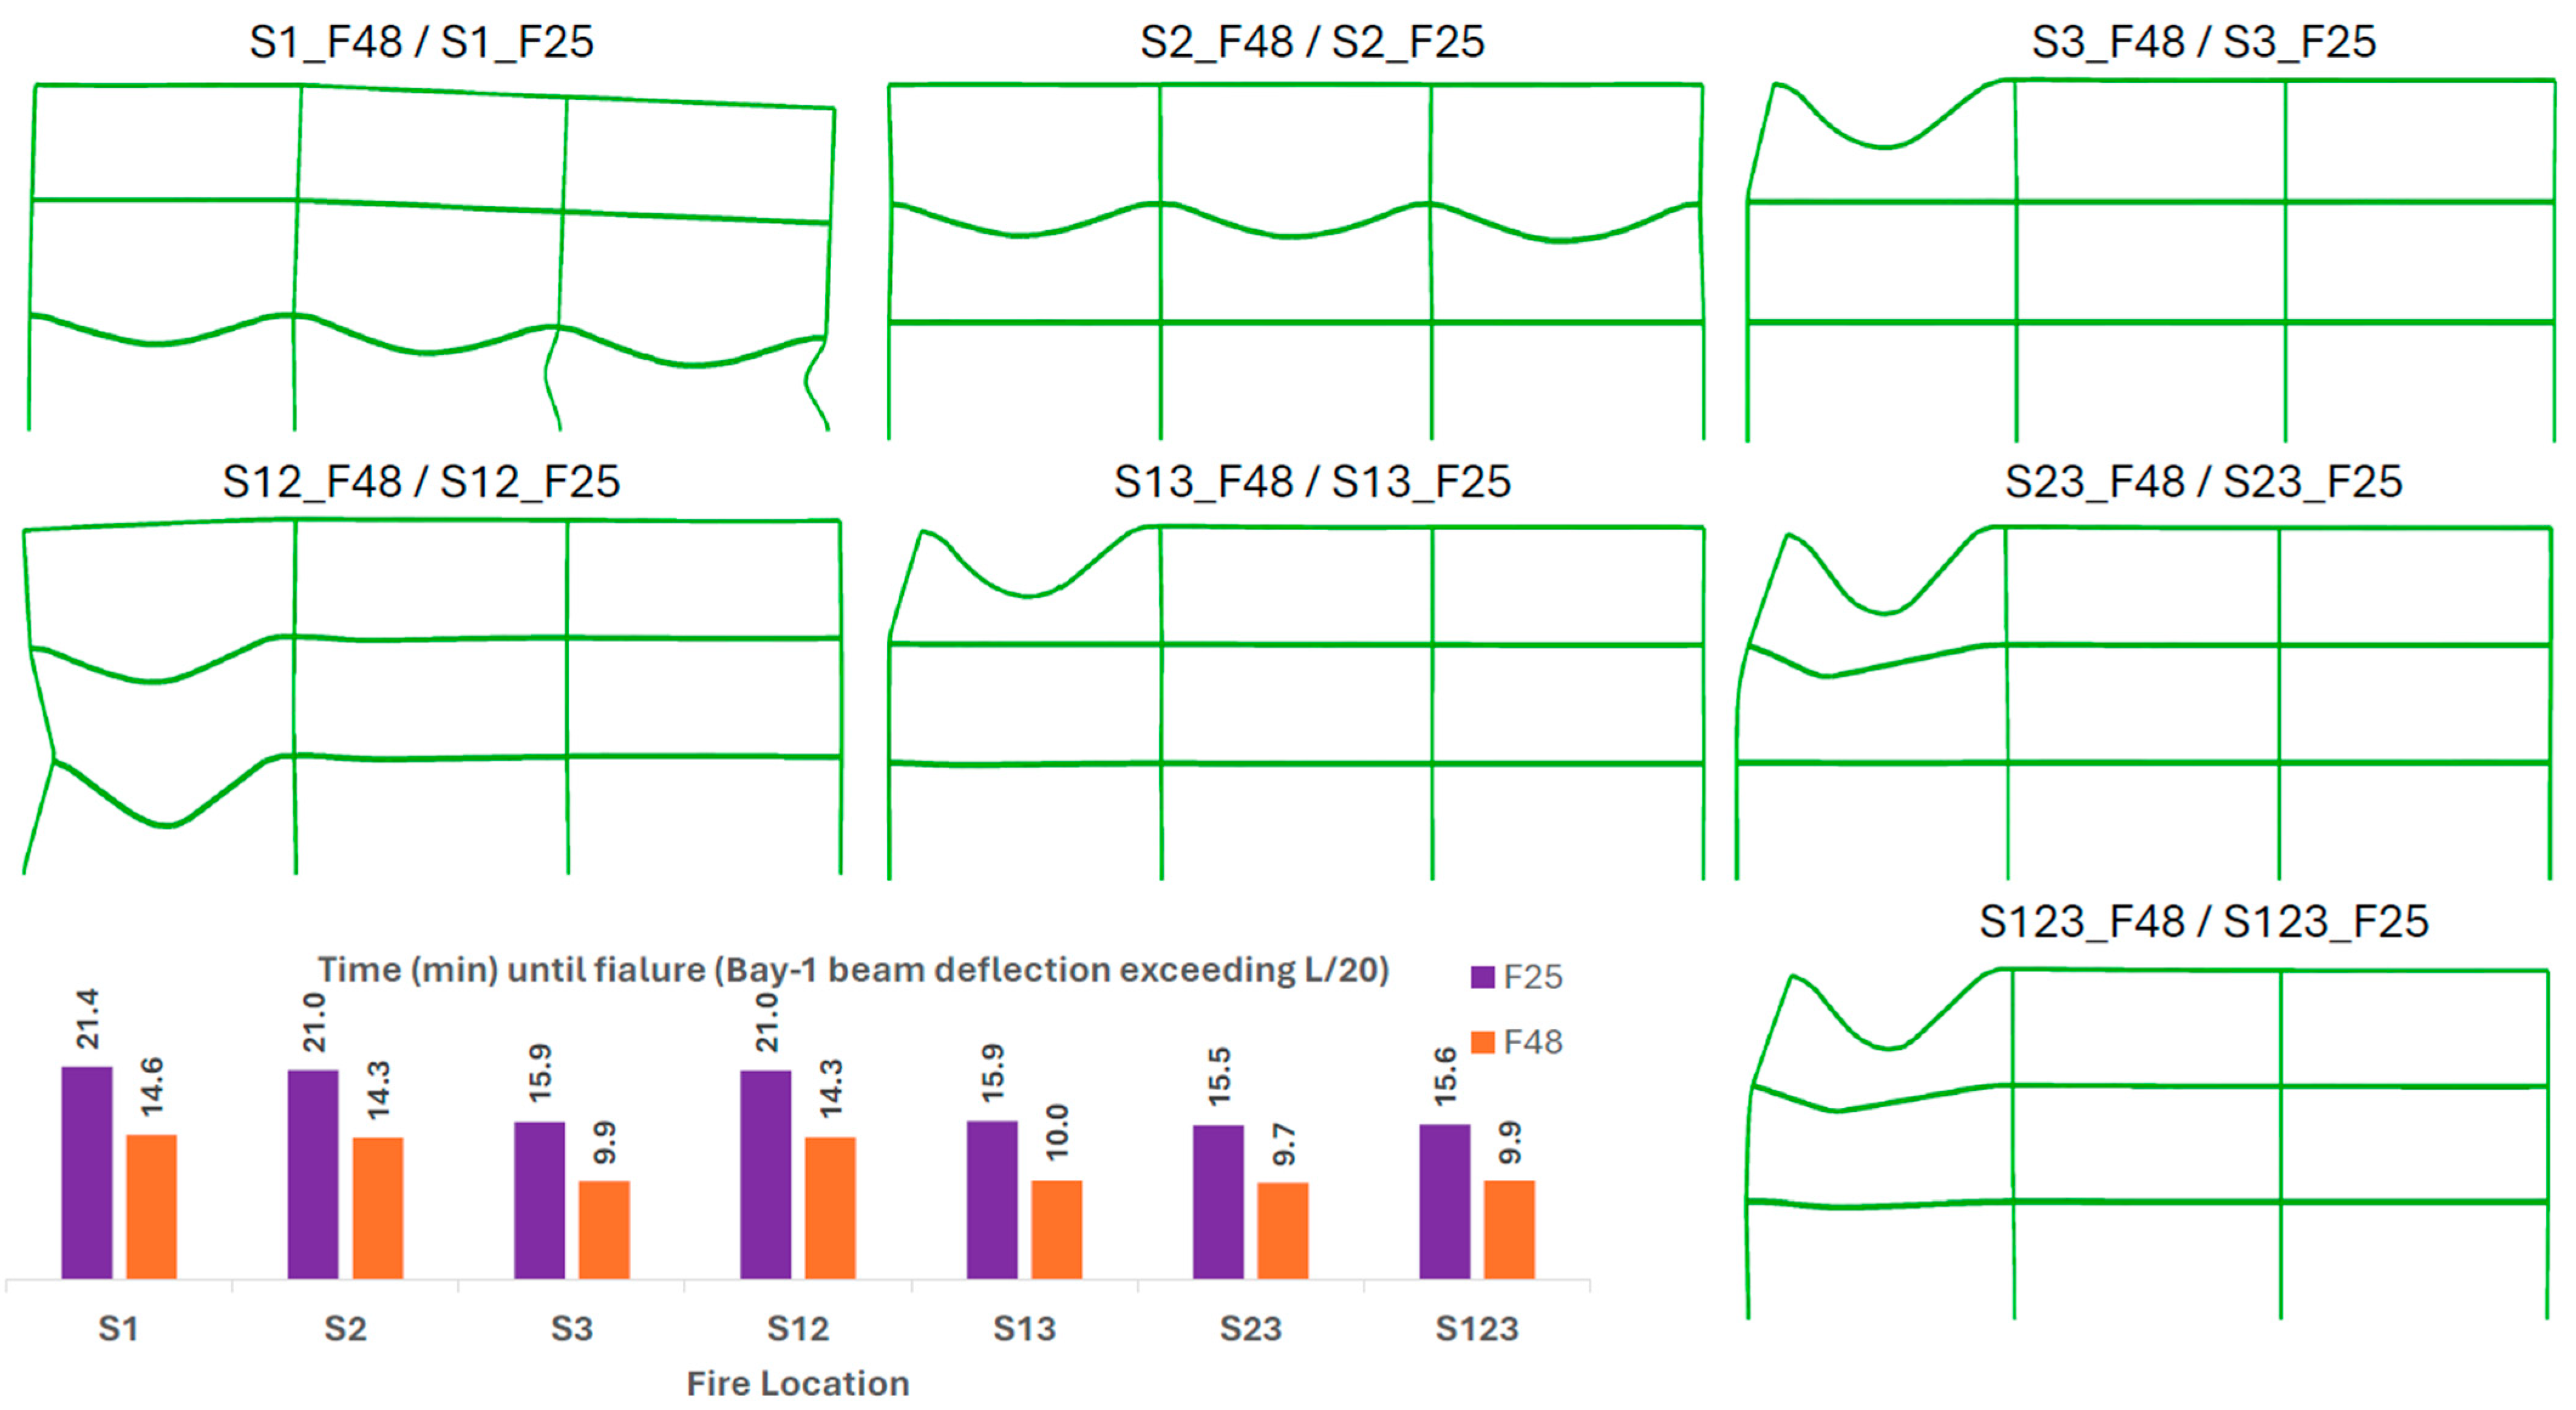
Figure 16 shows the response of the third storey beams and columns due to full EC fire. Figure 17 demonstrates that, for S3_F25, S23_F25, and S123_F25, fire scenarios, the maximum vertical displacement in the left bay of the third-floor beam exceeded the critical deflection limits (L/20), while in the corresponding full EC fire scenario (shown in Figure 16) the critical deflection limits were not exceeded. The 25% and 48% TFM cases are critical and they produce similar failure mode and deflection patterns, while F28 reaches the failure criteria sooner. Figure 17 presents only the results for F25 as samples, and the deformed shapes and the time to failure for F25 and F48 are shown in Figure 18. Although traveling fires generally reduce compressive forces in the beams relative to the full EC fire, they can induce substantial tensile forces; for instance, beam S123_F25 in Bay 2 experiences significant tension during the traveling fire event. The largest axial tensile force occurs when the third floor is subjected to a traveling fire, reaching a value approximately 15% greater than that under the full EC fire.
The maximum bending moment and lateral displacement occur when Floors 2 and 3 are exposed to a traveling fire. Under the full EC fire, column lateral displacements remain symmetric (Figure 16), whereas the TFM produces distinctly asymmetric responses (e.g., Figure 17), confirming the robustness and consistency of the modeling framework. The peak lateral displacement in the columns under the traveling fire scenario is about 56% higher than that observed for the full EC fire. This asymmetric deformation suggests that the frame may be susceptible to instability when subjected to a traveling fire.
The earliest local failure in the heated beams under the full EC fire occurs in the central bay, whereas in all traveling fire scenarios, the first beam-element failure is observed in the left bay, where the fire originates.
For the columns, the earliest failure consistently occurs at the bottom end of the heated column C1 in the fire floor, located at the fire-initiation point. Beam failures in the first- and second-floor fire scenarios are governed primarily by axial forces, while in multi-floor fire scenarios involving the third floor, failure results from a combined effect of axial force and bending moment. In general, for a given fire location, the earliest beam failure occurs under the 10% traveling fire scenario, with a few exceptions such as the S2 and S23 fires. In contrast, the time to local column failure decreases as the fire size increases.
Despite the occurrence of local failures in beams and columns across all scenarios, the structure remains largely resistant to progressive collapse, except in S1_F48 fire scenario wherein the system collapse was triggered at approximately 47.6 min. In all the 25% and 48% traveling fire scenarios the rundown failure of the beams was observed, which was initiated at the 1st bay of the top story in fire. On the other hand, the critical deflection limit was not exceeded in any of the Eurocode parametric fire (EC) and smaller traveling fire (F5 and F10) scenarios. Further, in case of smaller traveling fires scenarios involving the fire on 1st story (such as S1_F5, S12_F5, S123_F5, S13_F5, S1_F10, S12_F10, and S13_F10), the buckling of column C4 on the 1st story was observed. However, despite buckling of column C4 on the 1st story in all the slower traveling fire scenarios, the frame remained stable for the respective fire analysis duration.
Figure 18 shows the deflected shape of the frame for 25% and 48% TFM scenarios. The deflection shape and failure mode of the frame in the larger travelling fires (F25 and F48) are similar, except in the S1_F48 fire scenario wherein an overall frame collapse was trigerred due to column C4 buckling. The rundown failure time (i.e., beam deflection exceeding the critical limit L/20) of the 1st bay of the top story in fire is also compared in Figure 18. Traveling fire size and location have significant effects on global failure time and mechanism. For instance, the S3_48 traveling fire triggered partial collapse of the third floor at 9.9 min. As the number of fire floors increased (S23 and S123), a progressive failure of the respective floors from the top down is observed in 48% TFM scenarios, whereas in 25% traveling fire on S3, S23 and S123, the damage was primarily concentrated on the third floor only.

4. Conclusions

A study on the influence of traveling fire on a simple steel-frame structure is presented here and compared with the effect of Eurocode parametric fire. The following observations are made based on the present study.
(1)
The literature shows that TFM analysis of building frames subjected to vertically and horizontally propagating fire can produce higher displacements and forces in a structure, thereby accentuating the local response and fire-induced structural damage. A traveling fire tends to develop column buckling during the cooling phase. The findings of the current study are consistent with that.
(2)
However, most studies reported in the literature on TFM are performed on fire-protected steel frames. The present study explores the behavior of an unprotected steel frame in TFM scenarios.
(3)
From the present study, it is found that TFM produces greater deformation and forces in the structure, and the lateral deformation at a storey is asymmetric and higher than that produced under full EC fire, in which case the lateral displacement is symmetric.
(4)
Traveling fire size and location has a significant effect on global failure time and mechanism. It can be inferred that the critical buckling load on a column is expected to be much lower in the case of TFM because of higher lateral displacements and asymmetry. This could lead to local failure and result in partial or progressive collapse. Further investigation is required in this regard.
While traveling fire is an important consideration in determining the fire performance of a structure, a more substantive study is required to derive a general conclusion and suggest appropriate design guidelines. Further work is therefore needed in this area, considering different configurations and material types and boundary conditions. The validation study presented here was done on a benchmark steel frame with exposure to standard fire. The same modeling assumptions and process were maintained for the case study building to achieve consistent results for traveling fire. However, a detailed sensitivity analysis needs to be performed to ensure the robustness of the analysis scheme. It is also important to note that three-dimensional models for thermal–structural analysis for fire exposure could provide a more accurate understanding for a real building fire scenario.

Author Contributions

A.C., A.K.B. and A.B. developed the methodology and concept. A.C. developed and analyzed the finite element models. A.C., A.K.B. and A.B. analyzed the findings and aided in writing the article. A.K.B. and A.B. arranged for funding and supervised this study. All authors have read and agreed to the published version of the manuscript.

Funding

This research was funded by Concordia University, Montreal, QC, Canada (grant number VE0130 & VE0191), and the Natural Sciences and Engineering Research Council of Canada (Grant No.# N01063 & N01396).

Data Availability Statement

The data presented in this study are available upon request from the corresponding author.

Acknowledgments

The support of the Natural Sciences and Engineering Research Council of Canada (NSERC) and Concordia University is gratefully acknowledged.

Conflicts of Interest

The authors declare no conflicts of interest.

References

  1. Usmani, A.S. Stability of the World Trade Center Twin Towers Structural Frame in Multiple Floor Fires. J. Eng. Mech. 2005, 131, 654–657. [Google Scholar] [CrossRef]
  2. Behnam, B. Fire Structural Response of the Plasco Building: A Preliminary Investigation Report. Int. J. Civ. Eng. 2019, 17, 563–580. [Google Scholar] [CrossRef]
  3. Chandra, A.; Bhowmick, A.; Bagchi, A. Performance of Steel Moment-Resisting Frames in Post-Earthquake Horizontally Traveling Fire. J. Struct. Fire Eng. 2021, 12, 541–566. [Google Scholar] [CrossRef]
  4. Norouzi, A.; Bhowmick, A.; Bagchi, A.; Chandra, A. Parametric Study on Post-Earthquake Fire Behavior of Steel Moment Resisting Frames. In Proceedings of the CSCE Annual Conference, Fredericton, NB, Canada, 13–16 June 2018. [Google Scholar]
  5. ISO 834-1:2025; Fire-Resistance Tests—Elements of Building Construction—Part 1: General Requirements. ISO: Geneva, Switzerland, 2025.
  6. ASTM E119; Test Methods for Fire Tests of Building Construction and Materials. ASTM International: West Conshohocken, PA, USA, 2022. [CrossRef]
  7. EN 1991-1-2:2002; Eurocode 1: Actions on Structures—Part 1-2: General Actions—Actions on Structures Exposed to Fire. European Union: Brussels, Belgium, 2022.
  8. Stern-Gottfried, J. Travelling Fires for Structural Design. Ph.D. Thesis, The University of Edinburgh, Edinburgh, UK, 2011. [Google Scholar]
  9. Rackauskaite, E.; Hamel, C.; Law, A.; Rein, G. Improved Formulation of Travelling Fires and Application to Concrete and Steel Structures. Structures 2015, 3, 250–260. [Google Scholar] [CrossRef]
  10. Gales, J. Travelling Fires and the St. Lawrence Burns Project. Fire Technol. 2014, 50, 1535–1543. [Google Scholar] [CrossRef]
  11. Dai, X.; Welch, S.; Usmani, A. A Critical Review of “Travelling Fire” Scenarios for Performance-Based Structural Engineering. Fire Saf. J. 2017, 91, 568–578. [Google Scholar] [CrossRef]
  12. Behnam, B.; Hashemi Rezvani, F. Structural Evaluation of Tall Steel Moment-Resisting Structures in Simulated Horizontally Traveling Postearthquake Fire. J. Perform. Constr. Facil. 2016, 30, 04014207. [Google Scholar] [CrossRef]
  13. Röben, C.; Gillie, M.; Torero, J. Structural Behaviour during a Vertically Travelling Fire. J. Constr. Steel Res. 2010, 66, 191–197. [Google Scholar] [CrossRef]
  14. Behnam, B.; Ronagh, H.R. Behavior of Moment-Resisting Tall Steel Structures Exposed to a Vertically Traveling Post-Earthquake Fire. Struct. Des. Tall Spec. Build. 2014, 23, 1083–1096. [Google Scholar] [CrossRef]
  15. Memari, M.; Mahmoud, H.; Ellingwood, B. Post-Earthquake Fire Performance of Moment Resisting Frames with Reduced Beam Section Connections. J. Constr. Steel Res. 2014, 103, 215–229. [Google Scholar] [CrossRef]
  16. Rackauskaite, E.; Kotsovinos, P.; Rein, G. Structural Response of a Steel-Frame Building to Horizontal and Vertical Travelling Fires in Multiple Floors. Fire Saf. J. 2017, 91, 542–552. [Google Scholar] [CrossRef]
  17. FEMA 355C; State of the Art Report on Systems Performance of Steel Moment Frames Subject to Earthquake Ground Shaking. Federal Emergency Management Agency: Washington, DC, USA, 2000.
  18. ASCE/SEI 7-16; Minimum Design Loads and Associated Criteria for Buildings and Other Structures. American Society of Civil Engineers: Reston, VA, USA, 2017. [CrossRef]
  19. EN 1993-1-2:2005; Eurocode 3: Design of Steel Structures—Part 1-2: General Rules—Structural Fire Design. European Union: Brussels, Belgium, 2005.
  20. Alpert, R.L. Calculation of Response Time of Ceiling-Mounted Fire Detectors. Fire Technol. 1972, 8, 181–195. [Google Scholar] [CrossRef]
  21. Smith, M. ABAQUS/Standard User’s Manual, Version 2018; Dassault Systèmes Simulia Corp: Providence, RI, USA, 2018; p. 1146. [Google Scholar]
  22. Rubert, A.; Schaumann, P. Structural Steel and Plane Frame Assemblies under Fire Action. Fire Saf. J. 1986, 10, 173–184. [Google Scholar] [CrossRef]
  23. Izzuddin, B.A.; Song, L.; Elnashai, A.S.; Dowling, P.J. An Integrated Adaptive Environment for Fire and Explosion Analysis of Steel Frames—Part II: Verification and Application. J. Constr. Steel Res. 2000, 53, 87–111. [Google Scholar] [CrossRef]
Figure 1. Case study frame with beams and columns sections.
Fire 09 00154 g001
Figure 2. Analysis flow for thermo-mechanical analysis of structures subjected to high temperature due to compartment fire.
Fire 09 00154 g002
Figure 3. Temperature-dependent material properties (normalized) of structural steel: (a) modulus of elasticity; (b) yield strength; (c) specific heat; (d) thermal conductivity; and (e) thermal expansion [19].
Fire 09 00154 g003
Figure 4. Fire location in one, two, and all stories of the frame in Eurocode fire scenarios.
Fire 09 00154 g004
Figure 5. Various fire types and sizes are considered in the analysis.
Fire 09 00154 g005
Figure 6. The EC parametric fire curve overlaid with ISO-834 fire (figure adapted from [15]).
Fire 09 00154 g006
Figure 7. (a) Near-field and far-field temperature in traveling fire. (b) Spatially varying time–temperature at an intermediate and the end of the fire compartment (figure adapted from [9]).
Fire 09 00154 g007
Figure 8. Spatial and temporal variation in the four traveling fire temperatures along the length of the compartment compared with a uniform Eurocode fire (EC) in the compartment.
Fire 09 00154 g008
Figure 9. Thermal–structural analysis model for S2_F5 fire scenarios; (a) time–temperature history for all the 2nd-storey beam nodes and columns in F5 fire; (b) the node sets where the predefined temperature is applied; (c) out-of-plane displacement restraint; (d) critical beam and column elements, and the beam midpoints highlighted where the analysis results are investigated.
Fire 09 00154 g009
Figure 10. Heat-transfer analysis model for the beam section showing (a) beam cross-section mesh, (b) convection (in consistent units of N/s·mm·K) and radiative boundary conditions, (c) three-face fire exposure for the beams.
Fire 09 00154 g010
Figure 11. (a) Thermal–structural validation model, (b) plot of U1 and U2 with nodal temperature.
Fire 09 00154 g011
Figure 12. Storey-2 beam section temperature in all traveling fires compared with that in EC fire.
Fire 09 00154 g012
Figure 13. Column sections temperatures in all traveling fires compared with those in the EC fire.
Fire 09 00154 g013
Figure 14. Initial peak beam axial forces developed at three stories when the axial force is maximum compressive on one of the heated fire floors. (The shading of the story level in each subplot indicates the fire location).
Fire 09 00154 g014
Figure 15. Peak beam axial forces developed at three stories occurred anytime during the entire fire exposure. The shading of the story level in each subplot indicates the fire location.
Fire 09 00154 g015
Figure 16. Response of the 3rd-storey beams and laterral deflection of columns due to different vertical distribution of full EC fire (the line types indicate the bay location or colum type, and the color indicates the fire scenarios). The horizontal axis in all subplots indicate the time in seconds.
Fire 09 00154 g016
Figure 17. Response of the 3rd-storey beams due to different vertical distribution of 25% TFM (the line types indicate the bay location, and the color indicates the fire scenarios). The horizontal axis in all subplots indicate the time in seconds.
Fire 09 00154 g017
Figure 18. Deflected shape of the frame for 25% and 48% TFM scenarios.
Fire 09 00154 g018
Table 1. Gravity loads for the two steps of analysis.
Gravity Loads
Storey LevelFloor loadsEquivalent uniformly distributed load on MRF-beams
(tributary width 4.575 m)
GravityThermal–Structural
Dead (D)Live (L)(1.2 × D + 1.6 × L)(1.2 × D + 0.5 × L)
(kPa)(kPa)(kN/m)(kN/m)
1 and 24.62.442.830.7
Roof42.439.527.5
Table 2. Fire scenarios (35) combining 7 locations and 5 fire types in the present study.
Fire Location (7)Fire Types (5)
One-Storey Fire Two-Storey Fire Three-Storey Fire
S1_ECS12_ECS123_ECEC, F5, F10, F25, F48
S2_ECS23_EC
S3_ECS13_EC
S denotes storey, with the number following indicating the specific floor(s) exposed to fire. EC refers to Eurocode parametric fire, while F followed by a number specifies the size of the traveling fire (e.g., S123_F48 represents a 48% traveling fire on all three stories).
Table 3. Key parameters for traveling fire.
Improved Traveling Fire Methodology Parameters
ParametersF5F10F25F48
Fire Size ( F s i z e )0.050.100.250.48
Heat Release Rate, HRR ( Q ˙ ) (kW/m2)500500500500
Fuel Load Density ( q f ) (MJ/m2)570570570570
Peak Near-Field Temperature ( T N F ) (°C)1000100010001000
Flapping Angle (°) ( F a n g l e )6.56.56.56.5
Local Burning Time (s) ( t B = q f Q ˙ ) 1140114011401140
Total Fire Duration (s) T T o t a l = 1 + 1 F s i z e × t B 23,94012,54057003515
Length of fire at an instant (m) L F = L × F s i z e
( L = 27.45 m, length of fire compartment)
1.37252.7456.862513.176
Duration for which the temperature is calculated (s) T L i m = 1.3 × T T o t a l 31,12216,30274104569.5
Spread rate of fire (S) (mm/s) S = L F t B × 100 1.22.4611.6
Flapping Length (m) = L F + 2 × H × tan F a n g l e × π 180
(H = 3.96 m, height of the compartment)
2.33.67.814.1
Disclaimer/Publisher’s Note: The statements, opinions and data contained in all publications are solely those of the individual author(s) and contributor(s) and not of MDPI and/or the editor(s). MDPI and/or the editor(s) disclaim responsibility for any injury to people or property resulting from any ideas, methods, instructions or products referred to in the content.