Article

Vented Explosion Characteristics of Gasoline Vapor–Air Mixtures in Confined Spaces Under Different Ignition Modes


1
PLA Joint Logistics Support Force University of Engineering, Chongqing 401311, China
2
Aerospace Technology Institute of CARDC, Mianyang 621000, China
3
No. 32676 Troop, Yantai 265301, China
4
School of New Energy and Materials, Southwest Petroleum University, Chengdu 610500, China
*
Author to whom correspondence should be addressed.
Fire 2026, 9(6), 215; https://doi.org/10.3390/fire9060215
Submission received: 8 April 2026 / Revised: 11 May 2026 / Accepted: 22 May 2026 / Published: 23 May 2026
(This article belongs to the Special Issue Fire and Explosion Hazards in Energy Systems)

Abstract

In a weakly constrained, confined space, four common ignition sources—electrical spark, open flame, tungsten filament, and electrochemical igniter—were employed to investigate how the ignition mode influences the overpressure and flame-propagation characteristics during the vented explosion of gasoline vapor. The results show that the explosion process can be divided into four stages, featuring three typical overpressure peaks. The flame velocity exhibits two pronounced accelerations: one upon rupture of the vent membrane and another when the flame reaches the vent opening. Among the ignition sources tested, the electric spark produced the most severe destructive effects associated with overpressure, while the electrochemical igniter yielded the fastest flame propagation, and the tungsten filament ignition generated the longest external flame, constituting the greatest external fire threat. Explosions initiated by the tungsten filament and electrochemical igniter experience flame instability at the outset, induced by disturbances from the ignition source itself.

1. Introduction

Oils in confined spaces such as oil tanks, pump rooms, and pipe trenches are prone to volatilization and mixing with air, forming flammable vapor–air mixtures. When these mixtures reach a critical concentration and encounter an ignition source, they can ignite or explode, causing significant losses [1]. Zheng et al. [2] analyzed 50 tank fire and explosion accidents in China from 1959 to 2009, revealing that most incidents occurred during maintenance, repair, and loading/unloading processes, with primary ignition sources being open flames, electrical sparks, and static electricity. Zhao et al. [3] statistically analyzed ignition sources causing fires in oil storage areas, highlighting significant differences in ignition characteristics among sources. Numerous studies worldwide have compared the effects of different ignition sources on flammable gases and dust, demonstrating that ignition sources significantly influence explosion characteristics. Gill et al. [4] simulated the Buncefield oil depot explosion using a commercial electrical control box as an ignition source, observing distinct flame structures compared to traditional large-scale vented explosion experiments. Alvarez et al. [5] compared laser ignition and coil ignition on methane–air mixture explosions, finding that the lower explosive limit (2.9%) for coil ignition was much lower than that for laser ignition (5.0%). Gadha et al. [6] compared electric spark and pyrotechnic igniters for dust explosions, showing that pyrotechnic igniters resulted in higher pressure rise rates. Wang et al. [7] studied gas products from methane explosions ignited by electric sparks and high-temperature sources, revealing that electric sparks produced more CO, while high-temperature sources generated more CO2. Wu et al. [8] measured overpressure characteristics of under-expanded hydrogen jet explosions under auto-ignition and electric spark conditions, finding that auto-ignition produced higher peak overpressures, faster pressure rise rates, and more stable explosion development. Ren et al. [9] experimentally studied liquefied petroleum gas (LPG) cloud explosions in open spaces under spark plugs and detonating cords, observing deflagration under weak ignition and detonation under strong ignition.
To minimize explosion risks, venting is recognized as the most cost-effective method. During explosions, rising internal overpressure activates venting structures, rapidly releasing overpressure and flames to the external environment, thereby reducing explosion severity and protecting equipment and buildings. Previous studies [10,11,12] investigated venting characteristics of confined gas explosions. Wang et al. [13] conducted venting experiments on petroleum fuel–air mixtures under varying static burst pressures, identifying three overpressure-time curve patterns and five typical stages. Yu et al. [14] investigated lateral vent positions on methane–air explosions, revealing that venting effectiveness depended on both side vent locations and end vent induction. Lu et al. [15] studied hydrogen concentration effects on venting, showing that concentration variations influenced secondary explosions, altering flame morphology, propagation speed, and temperature distribution.
In summary, most studies on gas explosion (venting) characteristics employ single or dual ignition methods (e.g., sparks, hot surfaces, tungsten filaments). However, differences in gas composition, structural dimensions, and venting conditions hinder quantitative analysis of ignition source impacts on gasoline vapor–air venting. This study addresses this gap by experimentally investigating the effects of four common ignition sources (electric spark, open flame, tungsten filament, and electrochemical igniter) on gasoline vapor–air venting characteristics in confined spaces, focusing on flame structure and overpressure evolution, aiming to provide theoretical insights for explosion prevention and analysis.

2. Experimental Setup and Methods

2.1. Experimental System

The experimental platform comprises six components: a combustion chamber, CH gas concentration analyzer, gas mixing system, ignition sources, pressure acquisition system, and schlieren instrument (Figure 1).
The combustion chamber measures 150 mm × 150 mm × 200 mm, constructed from 20 mm thick fully transparent plexiglass. The bottom is sealed with a blind plate, and the top is sealed with a polyethylene film, forming a weakly confined space. The measured static burst pressure of the polyethylene film was 1.9 ± 0.15 kPa, determined through five independent calibration tests using the slow pressurization method [16]. All tests were performed using films from the same batch to minimize variability. The ignition source is positioned at the chamber’s base center. A 20 mm diameter hole is drilled in the blind plate center, threaded to screw in an ignition sleeve containing different sources, ensuring consistent placement and sealing. The sleeve protrudes 10 mm into the chamber. A GXH-1050 infrared hydrocarbon analyzer (precision: 0.01%, Jun-fang-li-hua Technology-research Institute, Beijing, China), operating on the non-dispersive infrared (NDIR) absorption principle, is used to measure the hydrocarbon volume fraction. The gas mixing system includes an air pump, hoses, a three-way valve, valves, and an oil bottle. Four ignition sources are tested: electric spark, open flame, tungsten filament, and electrochemical igniter. The electric spark is generated by a WGDH-5 high-voltage igniter at 1500 V, with an energy of approximately 1.125 J per spark. The open flame is produced by an SPKM-13Z open-flame igniter (Spican Smoking Accessories Co., Ltd. Wenzhou, China) fueled by butane, with a flame temperature of approximately 800 °C, a heat release rate of approximately 50 W, a heating duration of approximately 10 ms, and a total thermal energy of approximately 0.5 J; the tungsten filament has a diameter of 0.3 mm and a length of 2 mm, operated at 220 V with a measured current of 0.455 A, heating for approximately 10 ms with a total energy of approximately 1 J. The electrochemical igniter consists of zirconium powder, barium nitrate, and barium peroxide mixed in a 4:3:3 ratio, with a total mixture mass of 0.1 g and a total chemical energy of approximately 400 J. The pressure acquisition system includes a piezoresistive pressure sensor (Model ZXP-660, Zhixing, range: 0–5 kPa, accuracy: 0.5%, Zhixing Sensor Co., Ltd. Baoji, China), a transient signal analyzer, and acquisition software. The detection principle of the sensor is based on the piezoresistive effect of a silicon diaphragm. The sensor is located 50 mm below the top and 75 mm from both sides. The schlieren instrument comprises a light source (He-Ne laser tube, 1000 mm in length, 50 mm in diameter, output power 50 mW), a plane mirror, a concave mirror, a knife edge, and a high-speed camera (FASTCAM-Ultima 512, 1000 fps, Photron Ltd. Tokyo, Japan), configured in a Z-type layout. The schlieren field of view has a diameter of 340 mm and is captured at 512 × 512 pixels, yielding a spatial resolution of approximately 0.664 mm/pixel. The transient signal analyzer and high-speed camera are synchronized via a controller.
It must be emphasized that the four ignition sources differ not only in mechanism but also in total energy and power density. Constrained by practical preparation conditions, this study compares practical ignition sources as they naturally occur in industrial scenarios, rather than under controlled energy conditions. Therefore, the observed differences in overpressure and flame speed reflect the combined effects of ignition mechanism, energy magnitude, and induced flow-field disturbances. Decoupling these factors will require future experiments under standardized ignition energy, which is acknowledged as a key limitation of this study.

2.2. Experimental Methods

The initial temperature was 20 °C, and the initial pressure was atmospheric. The ignition source was positioned at the center of the chamber base. To ensure experimental accuracy, three trials were conducted for each ignition source. Before each experiment, the CH gas concentration analyzer and the pressure sensor were calibrated to ensure that measurement errors remained within acceptable limits. An air pump circulated gasoline vapor from the oil bottle into the combustion chamber in a closed-loop configuration, simultaneously agitating the gas inside the chamber to promote a uniform gasoline vapor–air mixture. The sampling inlet and outlet of the CH gas concentration analyzer were inserted through side ports of the chamber to monitor the gasoline vapor volume fraction in real time. When the gasoline vapor volume fraction reached 1.7%, the left and right valves on the oil bottle were closed, and the upper valve was opened; the air pump then continued to circulate and mix the gas to ensure homogeneity. After circulating for 2 min, the air pump was shut off and the mixture was allowed to settle for 3 min. If the gasoline vapor volume fraction remained unchanged during this period, the mixture was deemed uniformly mixed. All valves were subsequently closed. The synchronization controller was then activated to trigger the transient signal analyzer and the high-speed camera at preset times, thereby acquiring pressure data and flame images. Upon triggering, the designated ignition source was activated to ignite the mixture. Finally, the instruments were shut down and the data were analyzed.

3. Result and Discussion

3.1. Explosion Evolution Process

3.1.1. Overpressure and Flame Structure

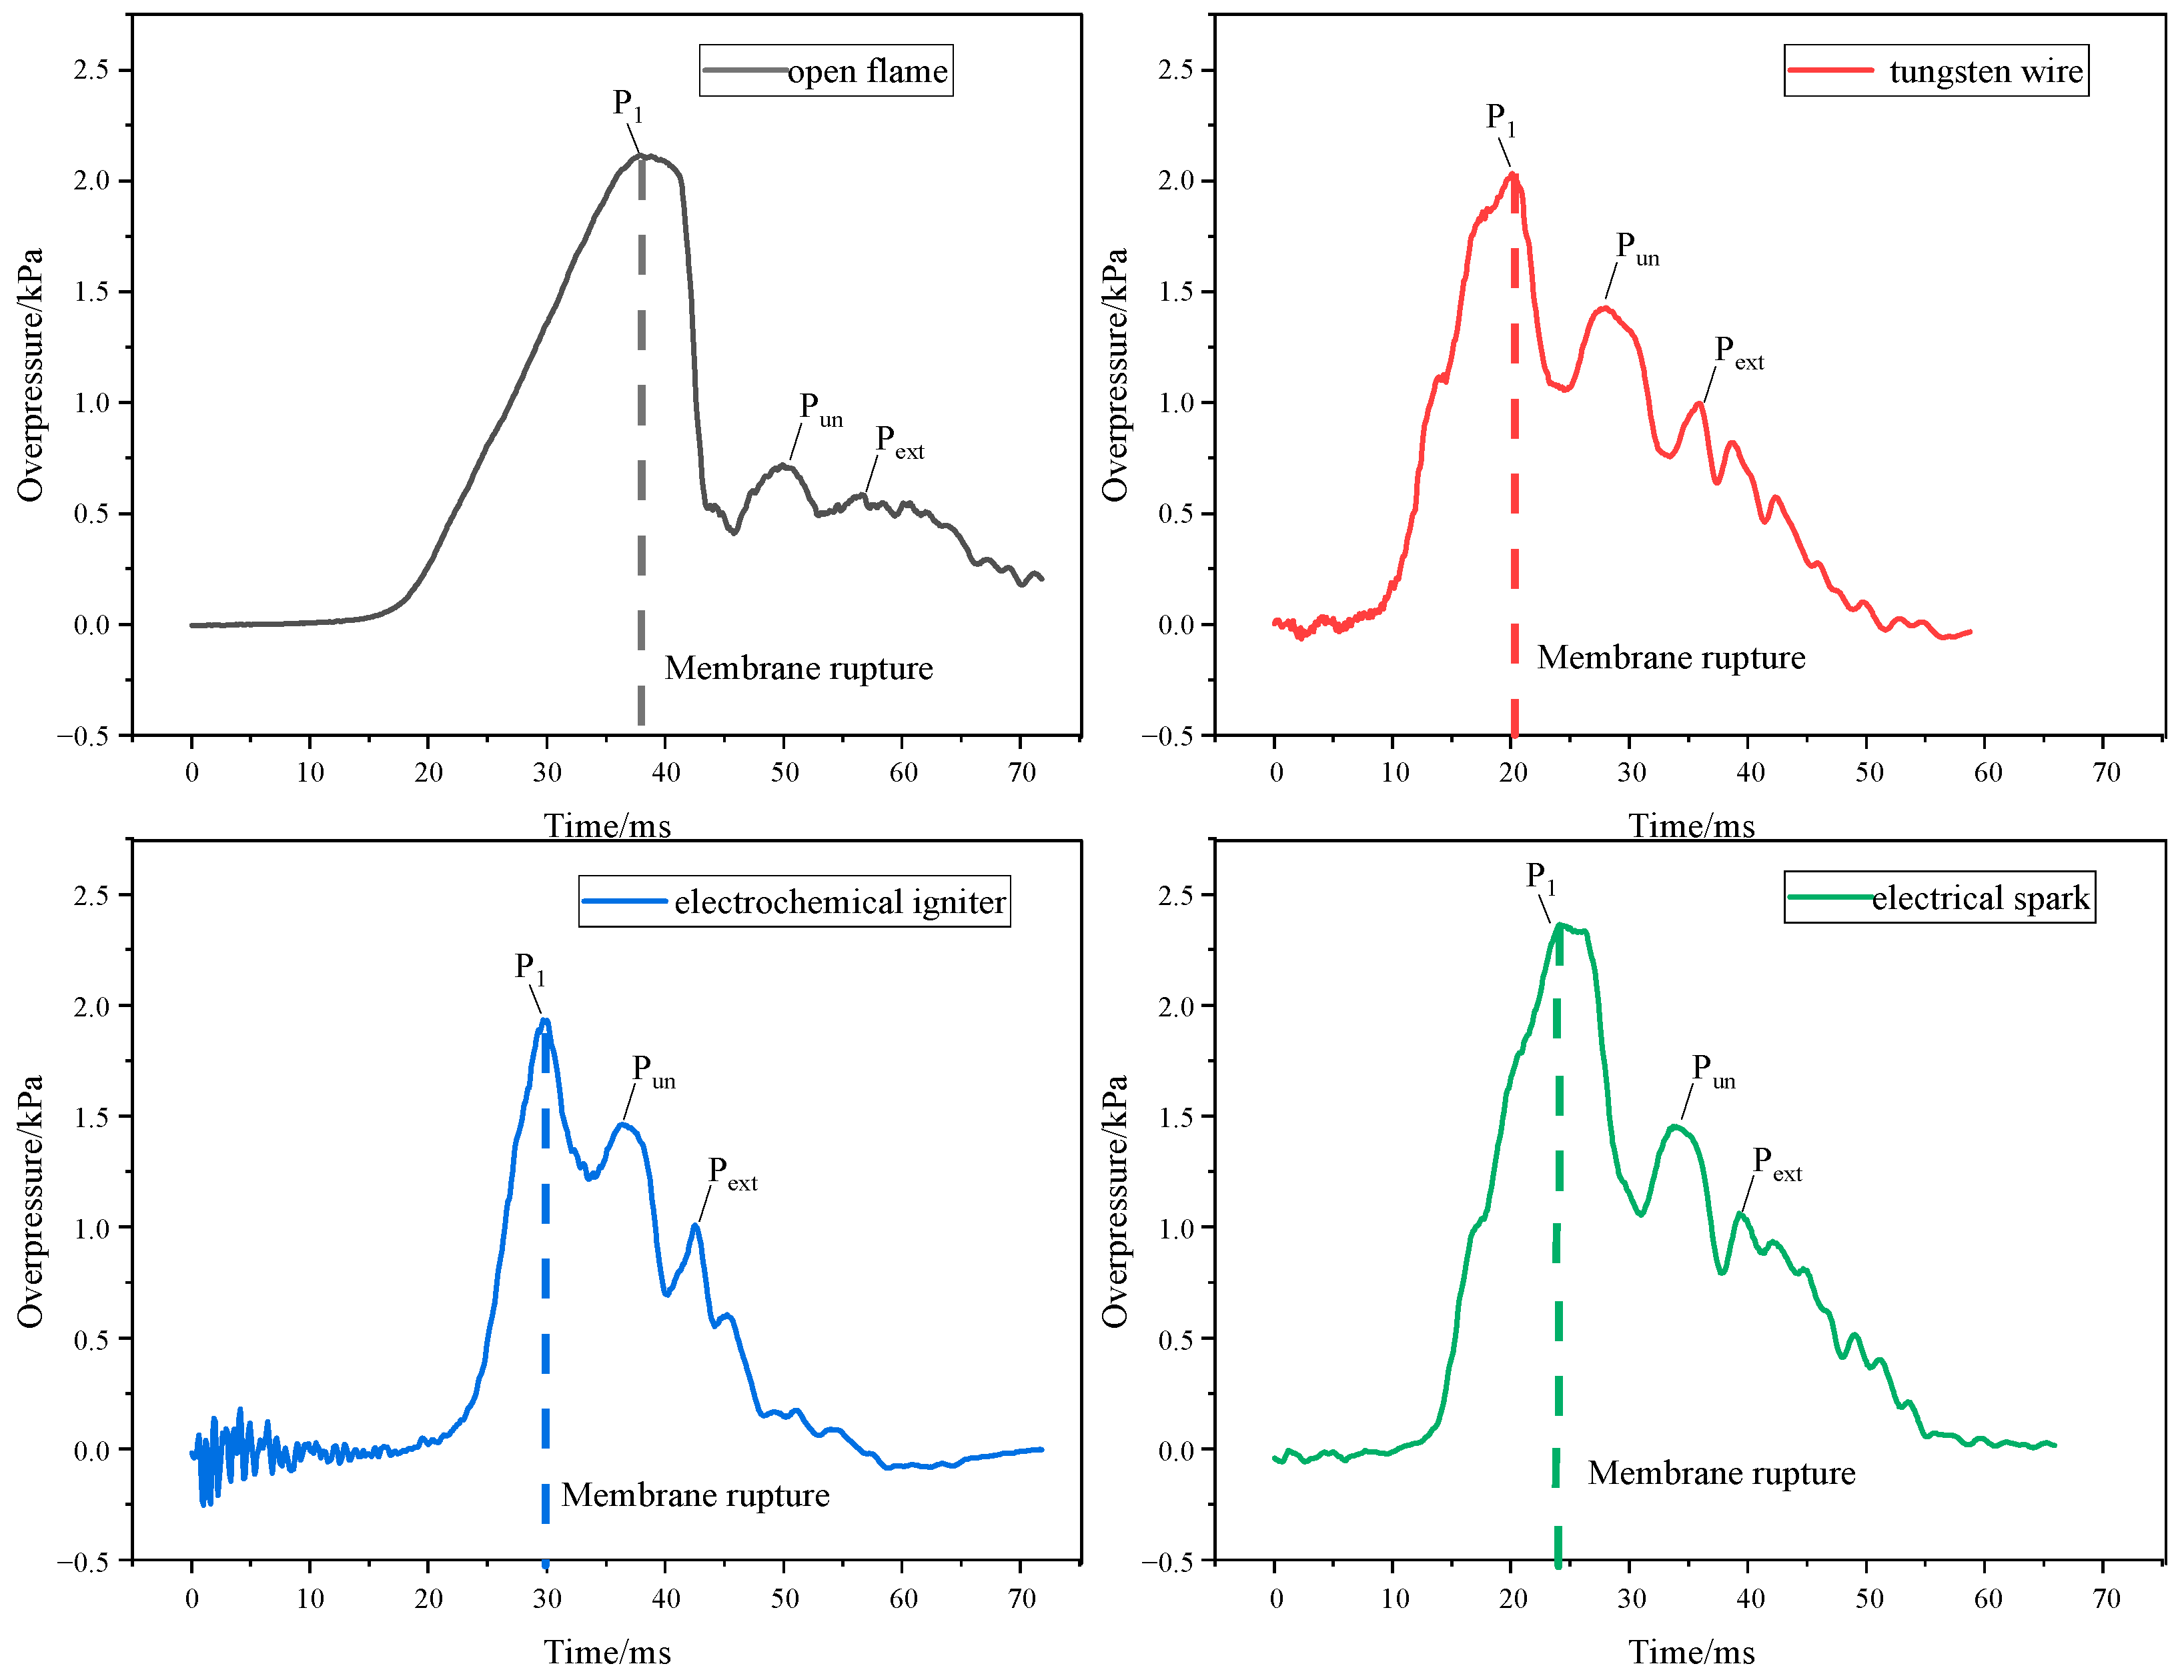
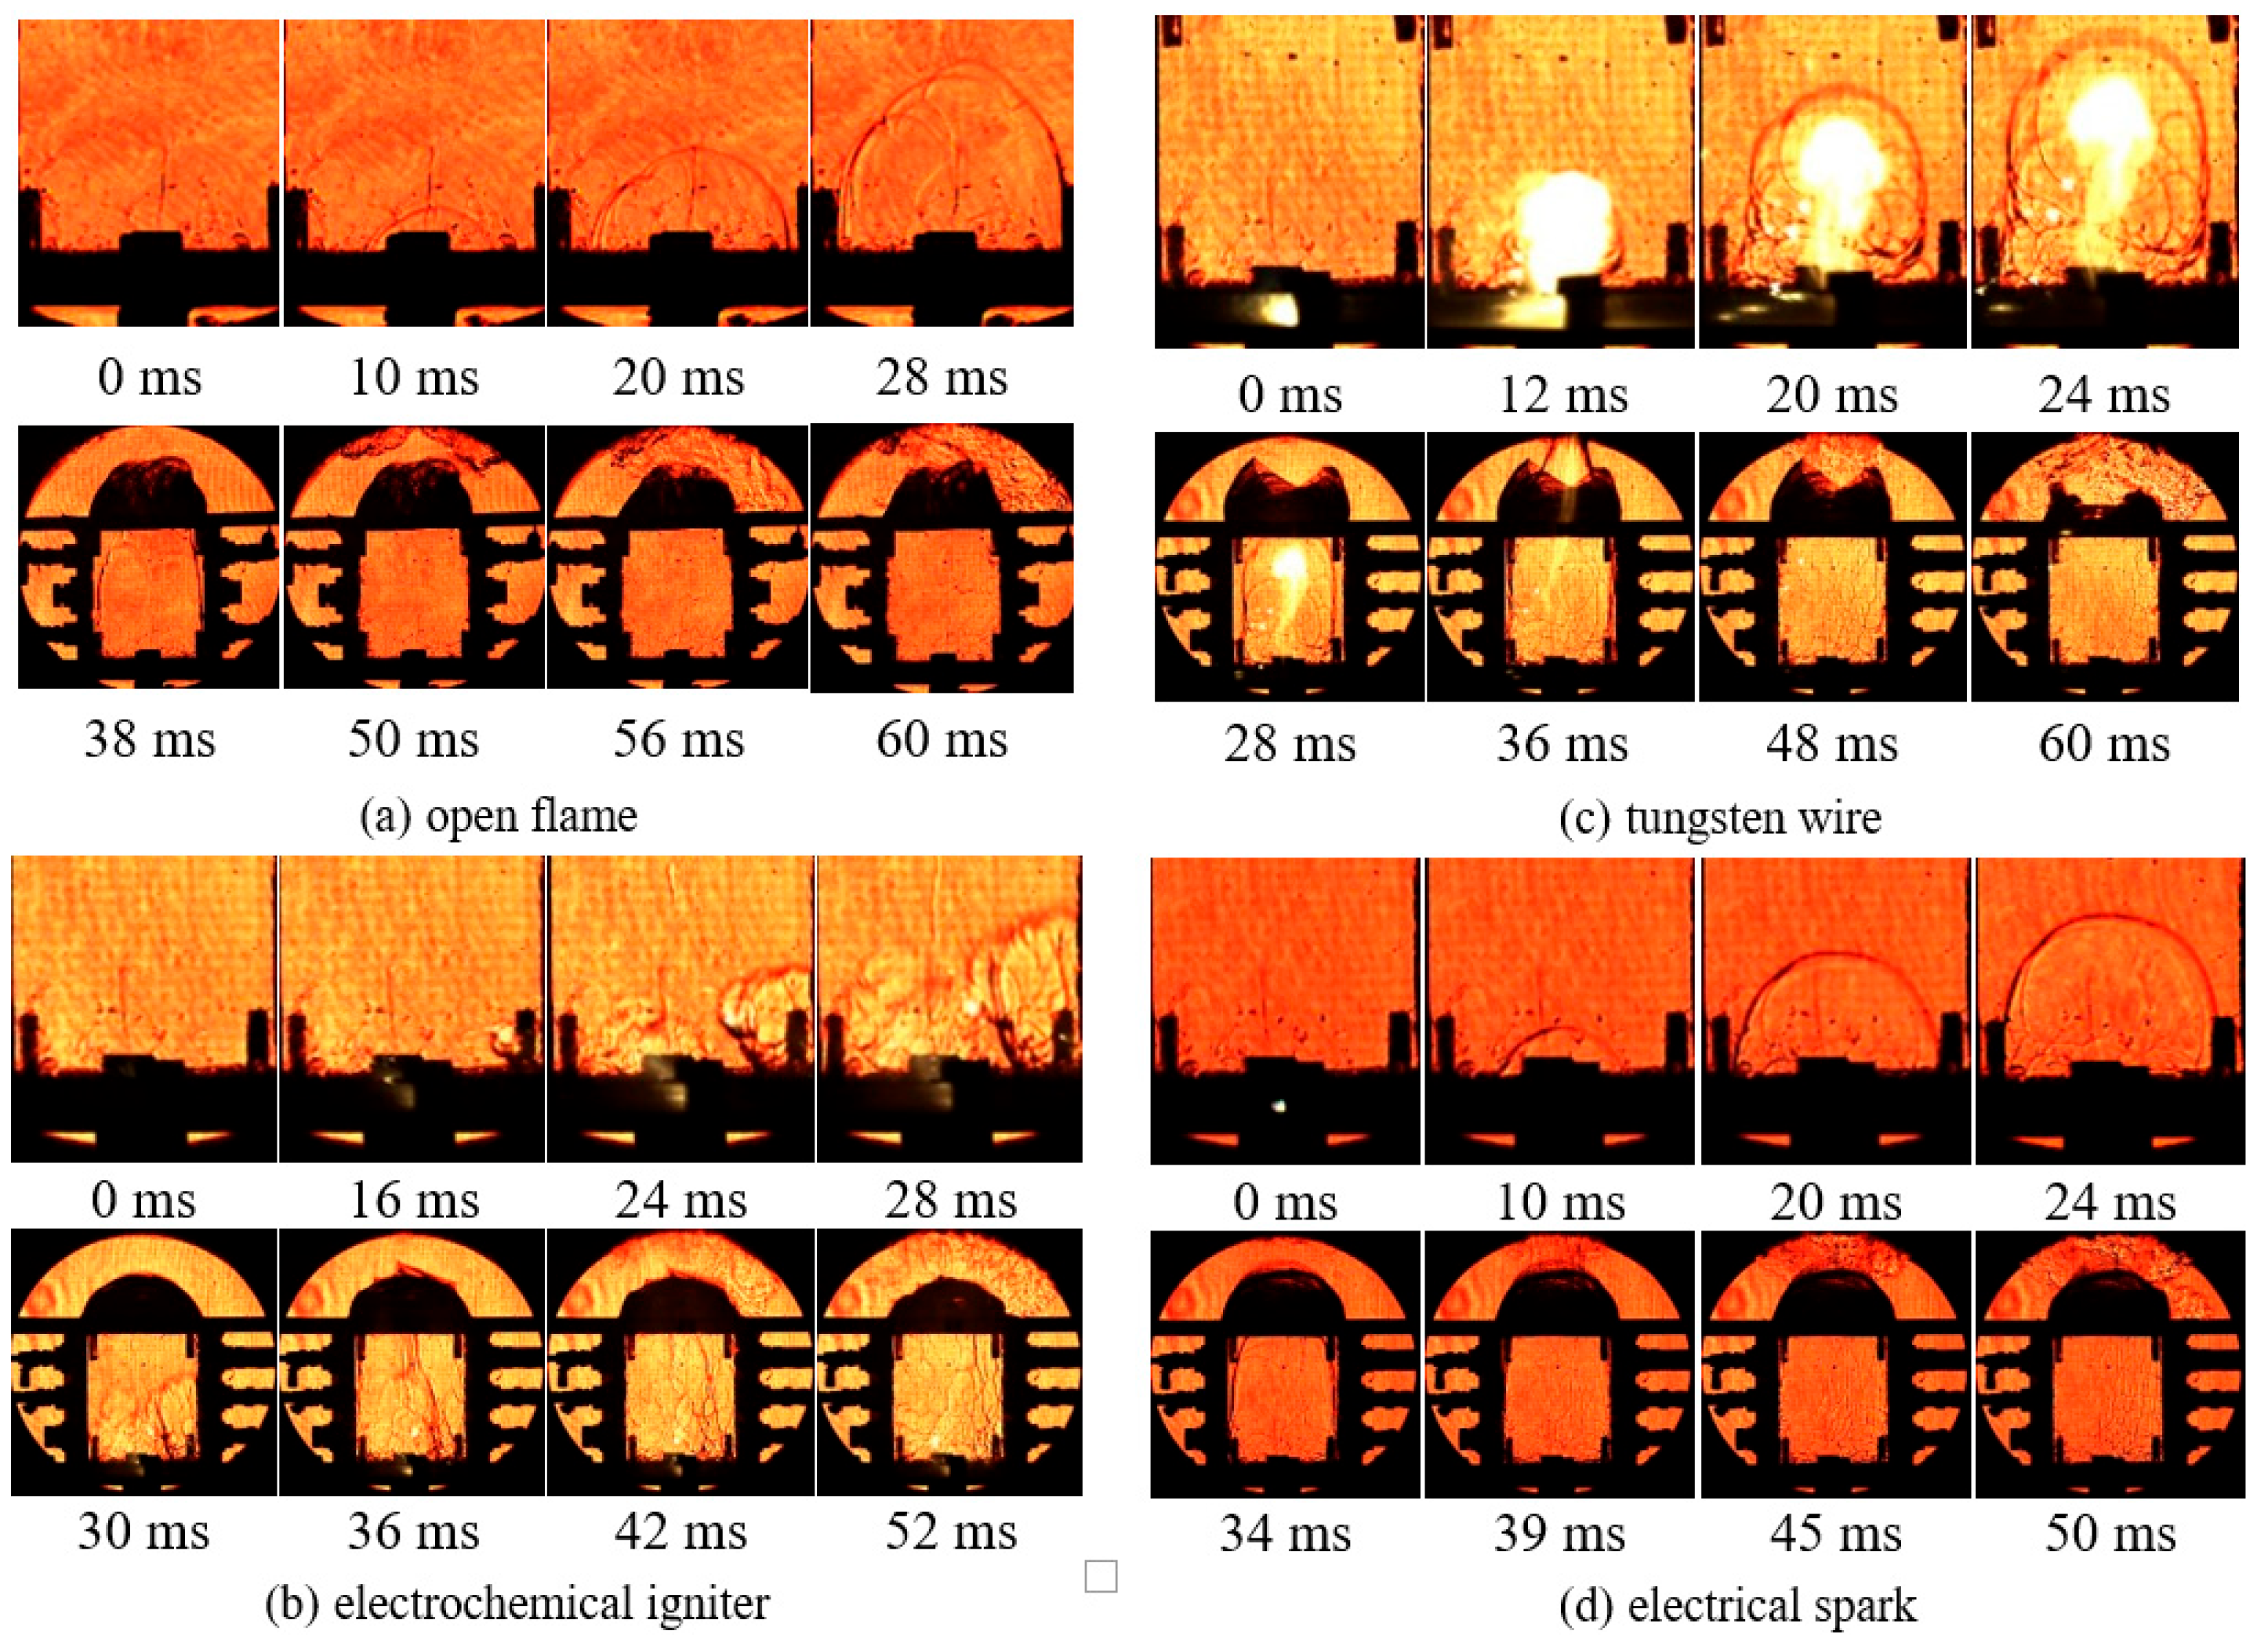
After ignition, overpressure changes in both internal and external fields exhibited similar trends under different ignition sources. Taking open flame ignition as an example (Figure 2), three pressure peaks (P1, Pun, and Pext) were observed in the internal field following explosion. Combined with schlieren images of the gasoline vapor–air explosion (Figure 3), the explosion process can be divided into four stages: “confined space explosion”, “rapid venting”, “external explosion”, and “pressure oscillation”. Since flames had not yet propagated to the external field during the early stage, the schlieren images were magnified for accurate flame structure analysis. For each ignition method, the first four images only depict the internal flame structure.
Confined Space Explosion Stage (0 ms–37.8 ms): This stage spans from ignition to membrane rupture. As shown in Figure 3, the internal flame structure transitions from “ellipsoidal” to “finger-like.” With increasing flame area, the temperature of unburned gas rises, and combustion products expand. Under gas expansion and pressure wave effects, internal pressure rapidly increased. Due to the sealed chamber, the overpressure rise rate is proportional to flame velocity and flame area. At 37.8 ms, the membrane ruptures, forming the first pressure peak P1; P1 denotes the first overpressure peak induced by membrane rupture (opening of the vent). Notably, during the early ignition stage, thermal particle scattering from both the tungsten filament and the electrochemical igniter induces pressure oscillations. For the electrochemical igniter, the initial exothermic reaction generates high-pressure gases that create initial turbulence, rendering the pressure oscillations particularly pronounced. Small particles with steep temperature gradients fail to ignite the gasoline vapor–air mixture; sustained splashing thermal particles achieve successful ignition only at approximately 16 ms. This delayed ignition results in irregular flame morphology and significantly compromised flame stability.
Rapid Venting Stage (37.8 ms–49.9 ms): After membrane rupture, internal flow accelerates outward due to pressure differences. This process has two effects: ① A large volume of compressed gas is instantaneously released. At this point, the total amount of unburned gas vented exceeds the combustion products generated, causing overpressure to decline. ② Internal flame propagation speed increased, accelerating combustion. At 45.5 ms, the volume generation rate from combustion expansion exceeds the volume reduction rate from venting, leading to rising overpressure. By 50 ms, all unburned gas inside the chamber is ignited. Here, the volume generation rate falls below the reduction rate, causing overpressure to decrease and forming the pressure peak Pun; Pun denotes the second overpressure peak associated with the combustion of unburned gas inside the chamber during the rapid venting stage. Due to low burst pressure, the flame front remains finger-like and propagates to the chamber mouth without significant deformation.
External Explosion Stage (49.9 ms–55.9 ms): Flames propagate to the external field, rapidly igniting unburned gas. The external flame front undergoes severe deformation, curling outward on both sides of the chamber mouth, forming large-scale turbulent combustion. Pressure waves from the external explosion propagate inward, causing overpressure to rise again and forming the external pressure peak Pext at 56 ms; Pext denotes the third overpressure peak caused by the external explosion resulting from the ignition of vented unburned gas by the emerging flame. This stage involves complex overpressure dynamics, influenced by vent area, concentration and extent of external gas, internal–external pressure differences, and overlapping pressure wave propagation.
Overpressure Oscillation Stage (55.9 ms onward): Reverse-propagating pressure waves from the external explosion compress internal gas, while internal inertia-driven venting creates reciprocating interactions. This leads to overpressure oscillations within the chamber. As external gas is consumed, oscillation amplitudes diminish until stabilization at zero.

3.1.2. Flame Front Position and Propagation Speed

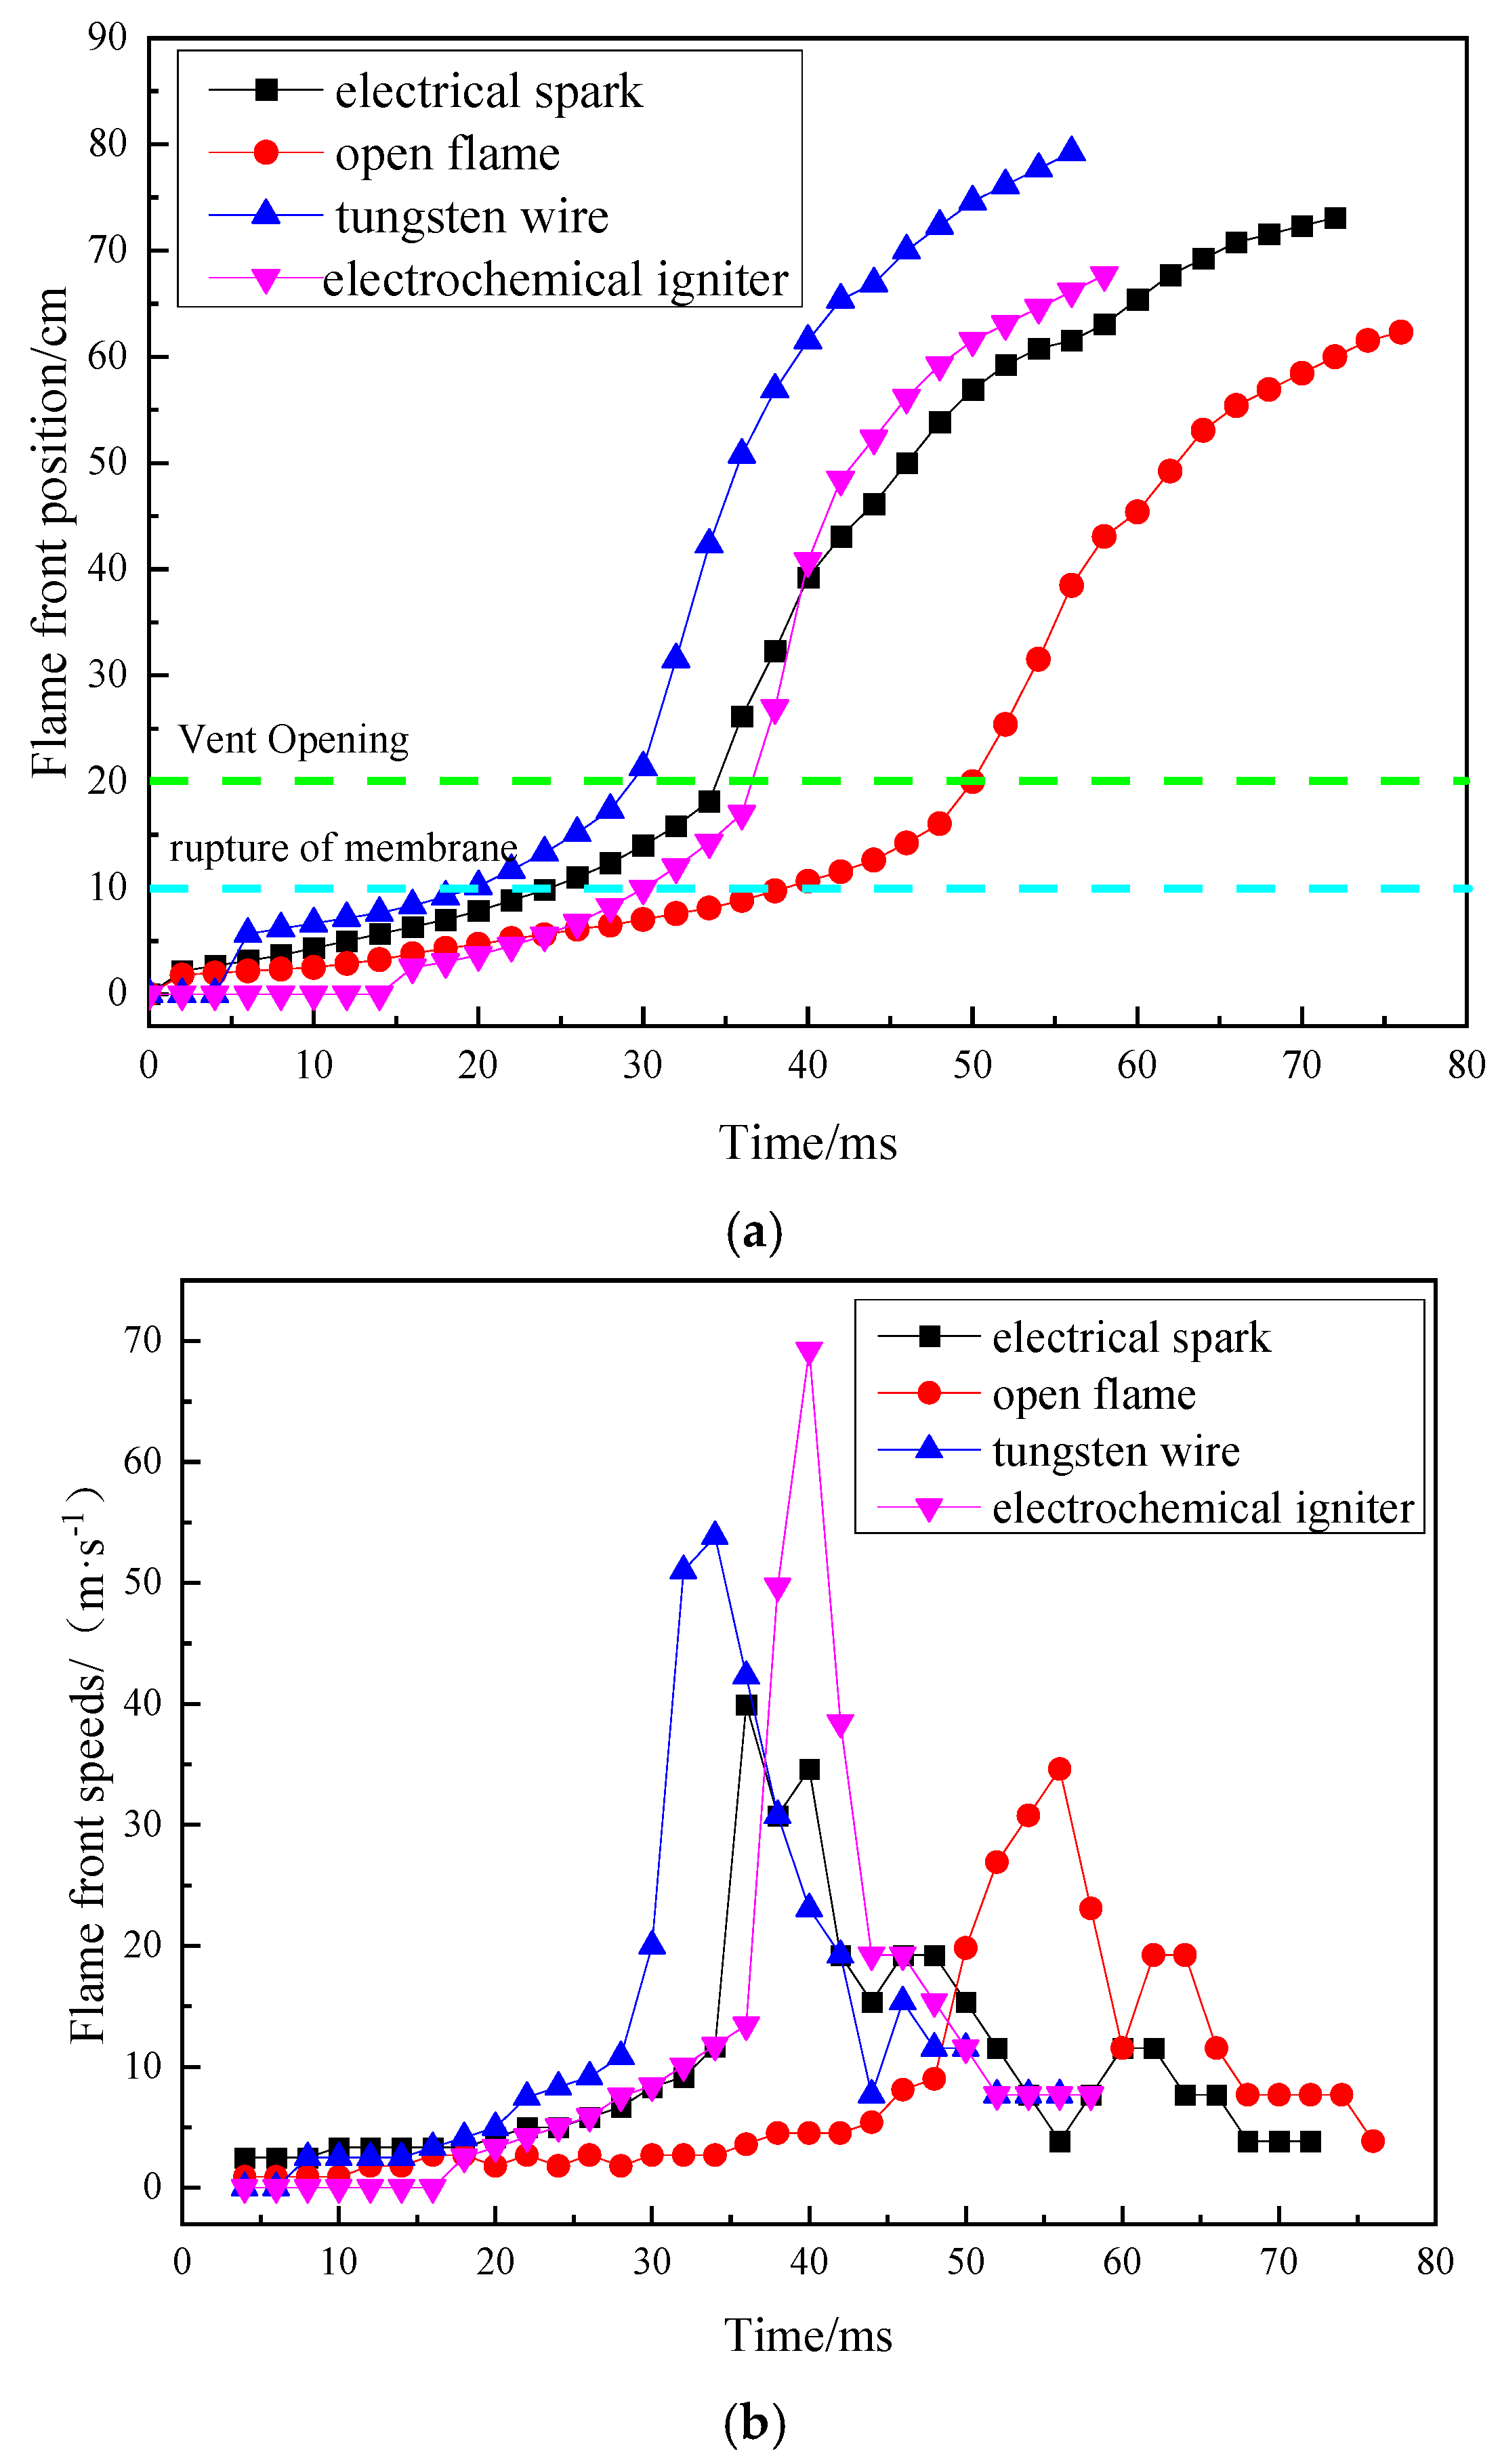
Figure 4 shows the flame front positions and propagation speed curves at different time points. The flame front position was defined as the leading edge of the continuous density gradient discontinuity, extracted using the Canny edge detection algorithm [17]. The position was measured from the ignition source center to the farthest continuous flame front along the vertical axis. For the tungsten filament and electrochemical igniter, images captured during the pre-ignition glow phase (before actual flame propagation) were screened using dual-criteria discrimination: the schlieren density gradient must exhibit a continuous flame front structure rather than merely discrete bright spots, and the pressure curve must display a sustained rise, indicating volumetric combustion rather than localized glow. Images obtained prior to the simultaneous satisfaction of both criteria were classified as “pre-ignition disturbance” and excluded from the flame position measurement.
It can be observed that, at the same moment, the tungsten filament produces the largest flame front position. This is because the tungsten filament concentrates energy, leading to a larger initial ignition zone, allowing the flame to rapidly rise to a higher position. The flame propagation exhibits two distinct accelerations:
First Acceleration (Flame Front Position ~10 cm): The first acceleration occurs during the rapid venting stage (after membrane rupture), not the initial confined stage. At this stage, internal–external pressure differences drive the venting of unburned gas. This venting increased local flow velocity, which in turn accelerates flame propagation. Consequently, the flame surface area expands rapidly, producing a sharp rise in the flame front position.
Second Acceleration (Flame Propagation to the Vent Opening, 20 cm): The vented unburned gas cloud is ignited, and under Kelvin–Helmholtz instability, the previously vented unburned gas is entrained sideways, increasing the flame wrinkling area. This triggers turbulent combustion, causing a sudden surge in flame propagation speed and further rapid advancement of the flame front.
Before membrane rupture, flame propagation speed remains low (<5 m/s). After rupture, the speed rapidly increased to >10 m/s, exceeding laminar flame speed, indicating small-scale turbulent combustion. Upon reaching the vent opening, the speed peaks but lasts briefly (<8 ms). The maximum propagation speeds, ranked from highest to lowest, are as follows: electrochemical igniter (69.2 m/s), tungsten filament (53.8 m/s), electric spark (39.9 m/s), and open flame (34.6 m/s). However, it must be emphasized that the high flame speeds observed for the tungsten filament and electrochemical igniter are not intrinsic properties of the gasoline vapor–air mixture. For the tungsten filament, the melting of tungsten introduces molten metal particles and potential tungsten oxidation, creating a multiphase reaction medium and an enlarged initial ignition zone that artificially accelerates flame propagation. For the electrochemical igniter, a pre-ignition delay of approximately 16 ms involves jet-induced turbulence and thermal particle dispersion, establishing multi-source ignition and non-quiescent initial conditions. Consequently, the flame speed rankings reported here apply specifically to these practical ignition sources with their inherent disturbances, and do not represent a fundamental comparison of ignition mechanisms under identical, quiescent initial conditions. After reaching peak speed, the propagation rate sharply declines due to rapid fuel consumption. Subsequently, during the overpressure oscillation stage, the flame front position slowly increased, and propagation speed exhibits oscillatory decay. Once the flame reaches its maximum distance, fuel depletion causes rapid flame extinction.
As shown in Figure 4a, shorter membrane rupture times correspond to longer external flame lengths. The tungsten filament achieves the shortest rupture time (20 ms) and the longest external flame length (0.59 m), while the open flame has the longest rupture time (38 ms) and the shortest flame length (0.42 m). This is because shorter rupture times result in less internal fuel consumption and greater vented unburned gas volume, allowing flames to propagate farther during external ignition.

3.2. Effects of Ignition Sources on Explosion Characteristic Parameters

3.2.1. Effects of Ignition Sources on Explosion Overpressure Parameters

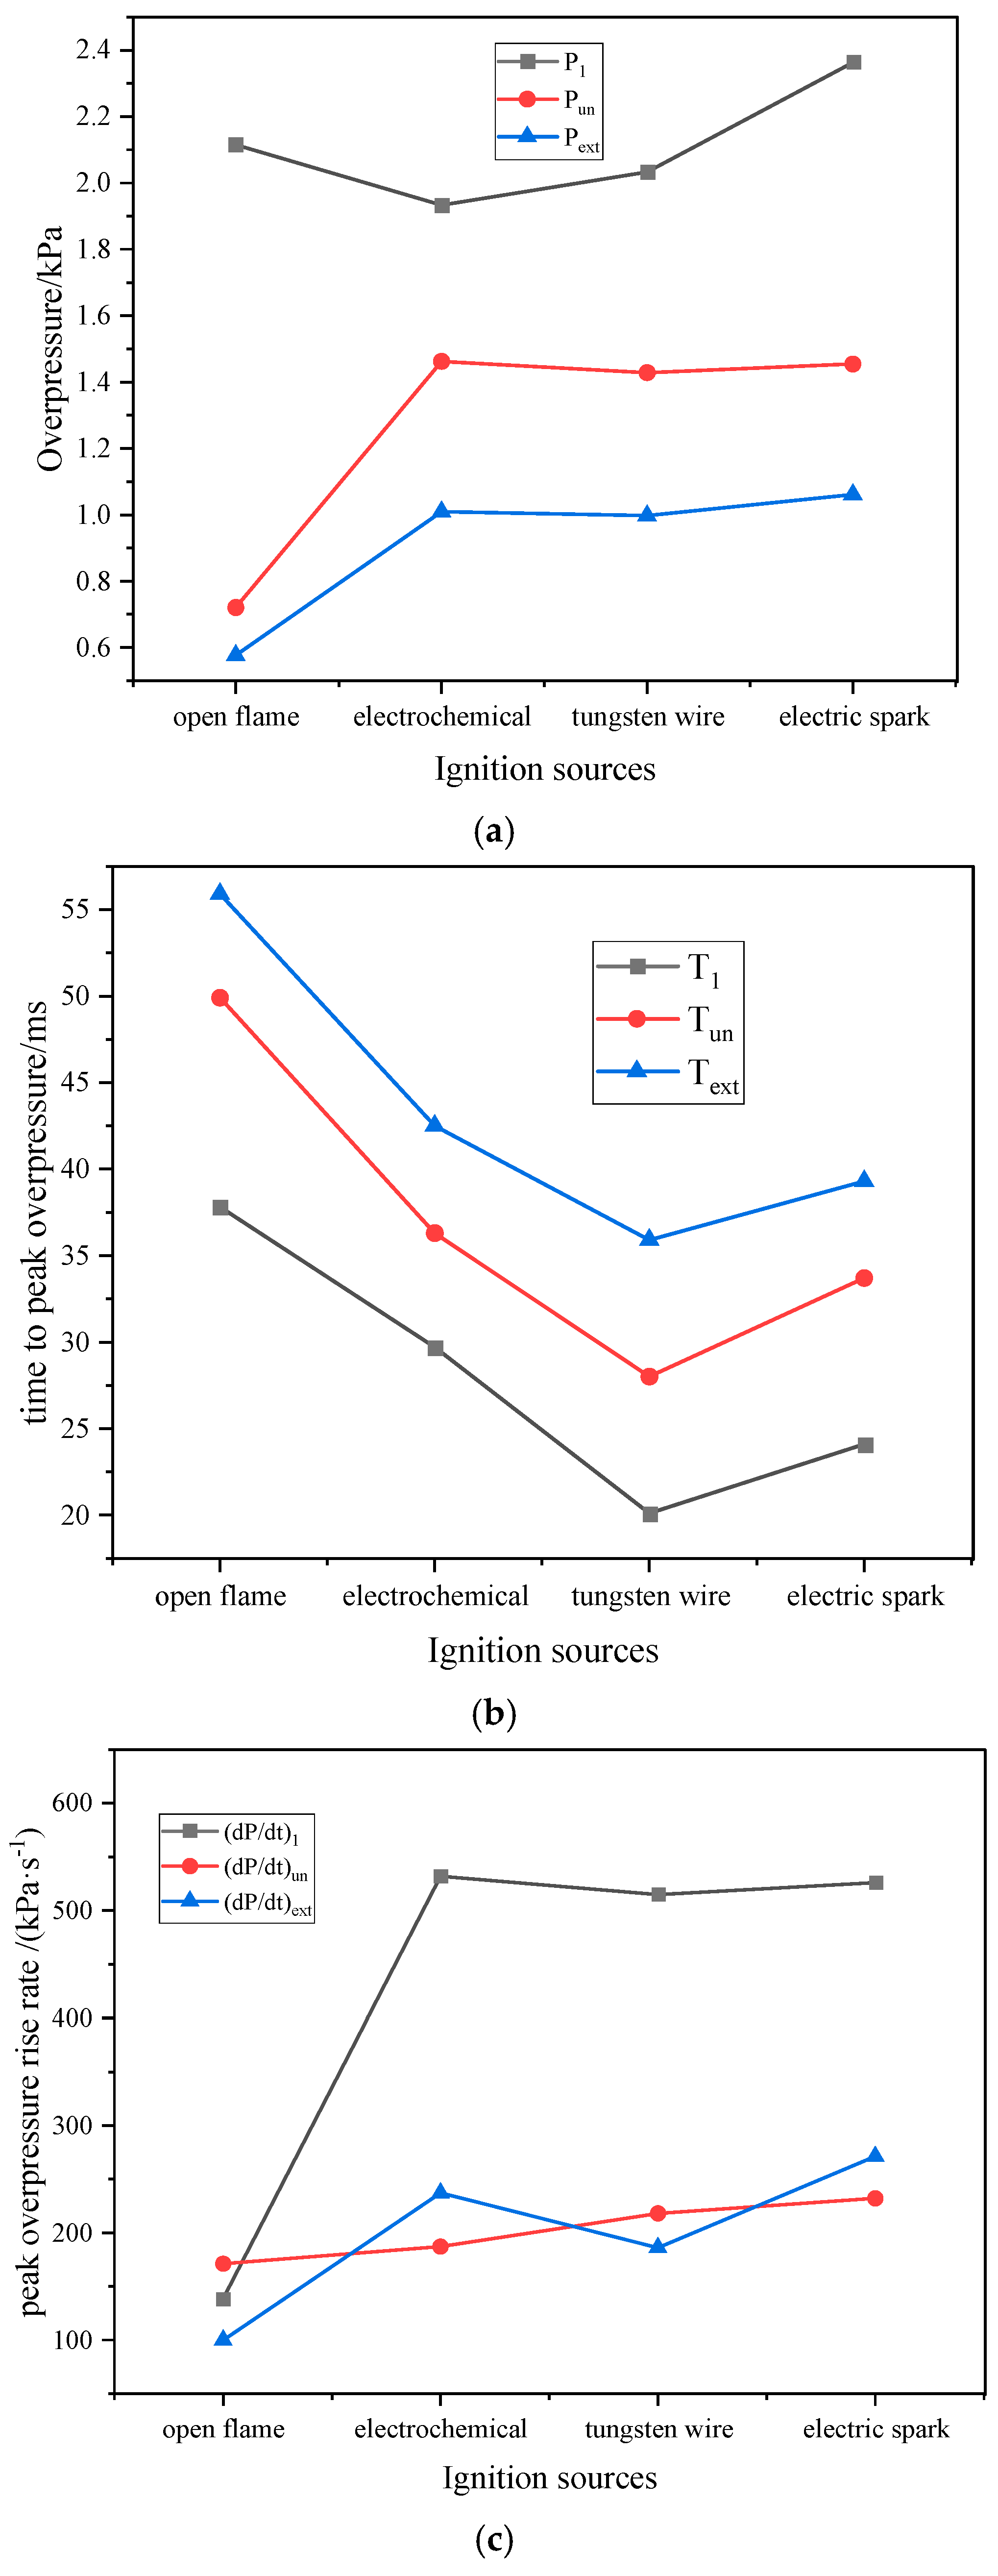
Figure 5 presents the peak overpressure values, time to reach peak overpressure, and peak overpressure rise rates across different stages for various ignition sources. It can be observed that ignition sources significantly differ in their explosion overpressure parameters. The burst pressures (P1) for different ignition sources show minimal variation, with the maximum value being 1.22 times the minimum. This is primarily due to the fact that burst pressure is closely related to the mechanical strength of the membrane itself. Compared to other ignition sources, open flame ignition produces the lowest peak overpressure values for Pun and Pext, reaching only 49.25% and 54.29% of the maximum peaks observed with other ignition sources, respectively. Additionally, the time required to reach these peaks is longer. As shown in Figure 5c, during the rapid venting stage, the peak overpressure rise rates across all ignition sources are relatively similar. This occurs because the flame front positions and peak overpressure values at membrane rupture are nearly identical, leading to comparable overpressure rise effects induced by combustion and membrane rupture inertia-driven venting. However, during other stages, electric spark, tungsten filament, and electrochemical igniters exhibit faster pressure rise rates, while open flame ignition shows the slowest pressure rise.
The influence of different ignition sources on overpressure peak values, corresponding peak times, and peak overpressure rise rates across stages varies significantly. Qualitative analysis alone cannot determine the extent of these effects. To quantitatively characterize these relationships, α, β, and γ are defined as the overpressure peak influence coefficient, peak time influence coefficient, and peak overpressure rise rate influence coefficient, respectively [18]. Their mathematical formulations are as follows:
α ( i ) = ( P ( i ) P ave ( i ) ) / P ave ( i ) β ( i ) = ( T ( i ) T ave ( i ) ) / T ave ( i ) γ ( i ) = ( d P / d t ( i ) d P / d t ave ( i ) ) / d P / d t ave ( i )
where the subscript (i) denotes the different stages—1, un, and ext, and the subscript ave represents the average value of the parameter across the four ignition sources. The influence coefficients for each stage are thus obtained (see Table 1).
Meanwhile, the average value formula of the three influence coefficients is defined as:
α ave = ( α 1 + α u n + α ext ) / 3 β ave = ( β 1 + β u n + β ext ) / 3 γ ave = ( γ 1 + γ u n + γ ext ) / 3
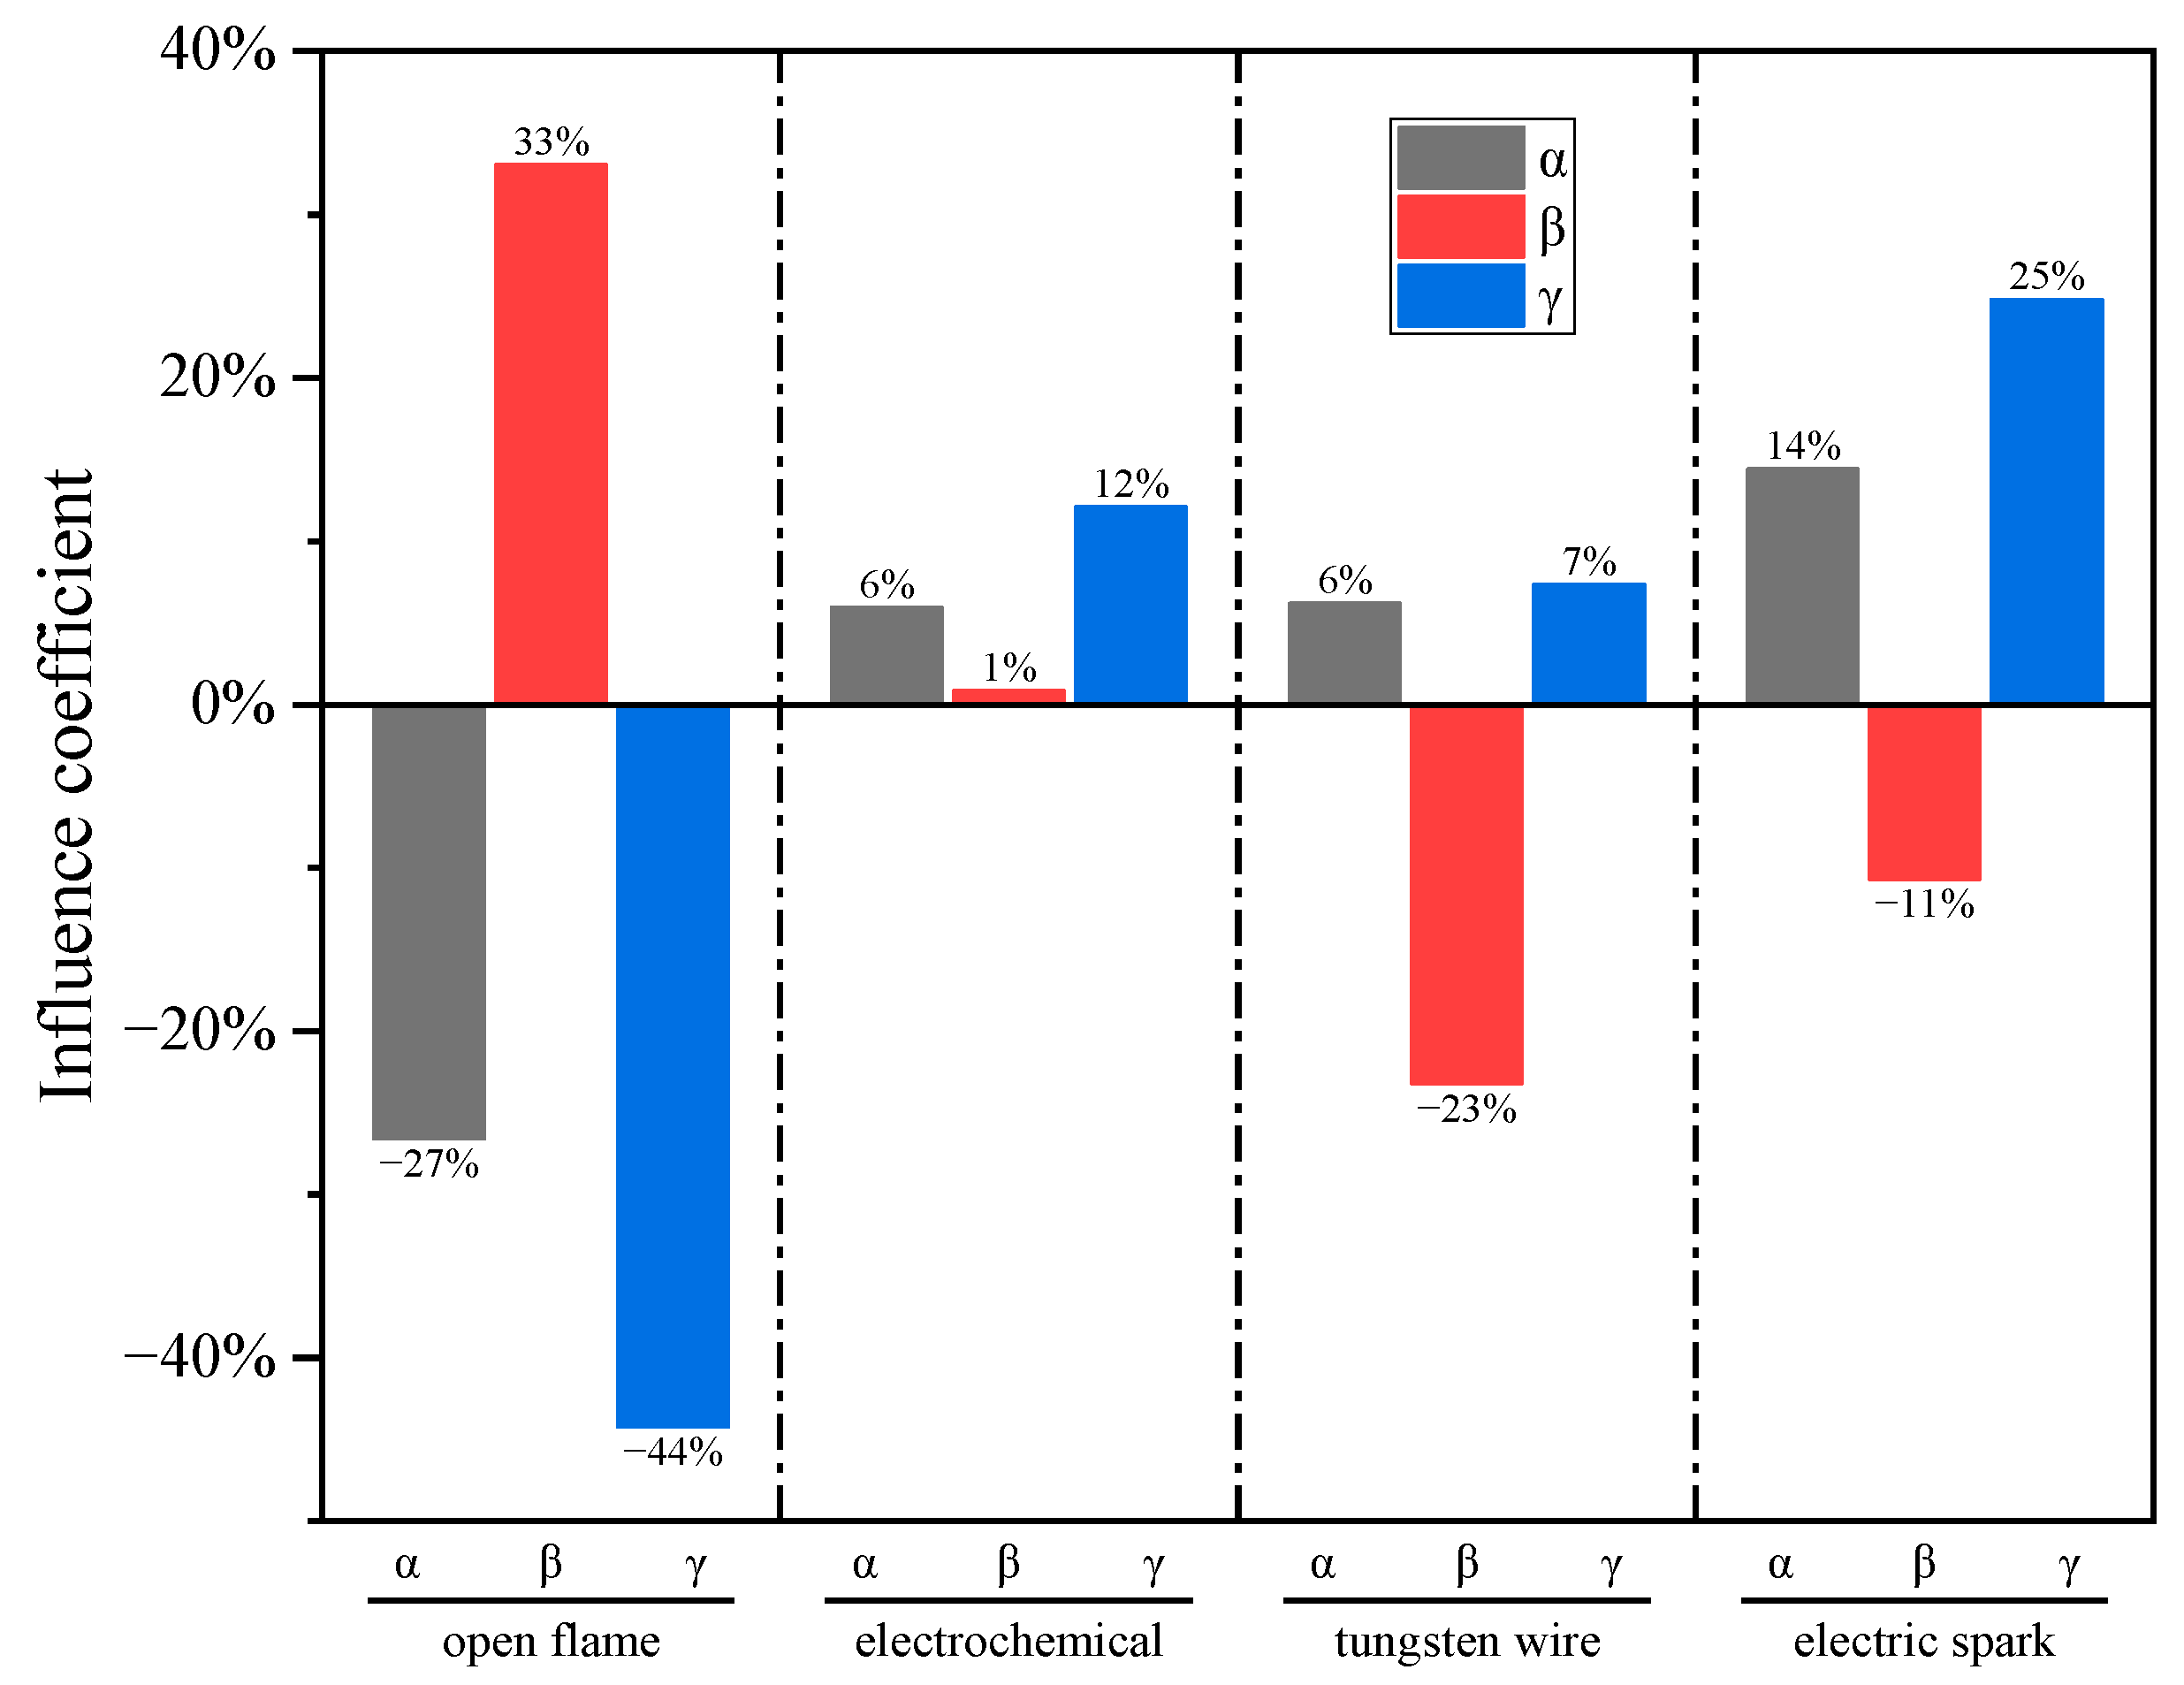
The larger the α ave value, the greater the ignition source’s enhancement effect on the overpressure peak. The larger the β ave , the more prolonged the ignition source’s effect on the time to reach the overpressure peak. And the larger the γ ave , the more pronounced the ignition source’s enhancement effect on the peak overpressure rise rate. The results are shown in Figure 6. It can be seen that the enhancement effects of different ignition sources on the overpressure peak, from greatest to least, are electric spark (14.43%) > tungsten filament (6.19%) > electrochemical igniter (5.95%) > open flame (−26.56%). For prolonging the time to reach the overpressure peak, the order is open flame (33.04%) > electrochemical igniter (0.82%) > electric spark (−10.67%) > tungsten filament (−23.19%). Regarding the enhancement of the peak overpressure rise rate, the order is electric spark (24.78%) > electrochemical igniter (12.11%) > tungsten filament (7.33%) > open flame (−44.22%).
Taking the overpressure peak and the peak overpressure rise rate as indicators of explosion damage, the electric spark produces the most severe destructive effect among the four practical ignition sources tested, whereas the open flame produces the least severe. This ranking is governed by the quantified heat-release characteristics of each source, specifically the power density and energy deposition rate. For the electric spark, the voltage across the electrode gap reaches the breakdown threshold, generating an instantaneous high-temperature spark of 8000–12 000 °C. Because the energy is discharged over a microsecond-scale duration, the spark channel achieves a power density of 106 W/cm2. This rapid energy deposition activates gasoline vapor molecules almost instantaneously, significantly accelerating chemical reaction rates and causing a sharp pressure rise. Consequently, both the overpressure peak and the peak rise rate are markedly higher than those of the other sources. In contrast, the open flame releases heat continuously at approximately 50 W, with a combustion temperature of only 800 °C and an instantaneous power density of approximately 20 W/cm2. Its much lower power density results in relatively slow chemical reaction rates and a more gradual rise in overpressure. For gasoline vapor–air mixtures at different concentrations, although the absolute overpressure values vary with concentration, the relative ranking of ignition source severity is expected to remain valid within the flammable range. This is because such ranking is governed by the heat release rate and energy deposition mechanism of the ignition source, rather than solely by the chemical energy of the mixture. The instantaneous high temperature of an electric spark maximizes the initial reaction rate regardless of concentration, whereas the slower heat release rate of an open flame still produces a more gradual overpressure rise.
In practical engineering applications, for scenarios involving oil tank maintenance, pump rooms, and pipe trenches, priority should be given to eliminating electric spark hazards (from equipment failure or electrostatic discharge), as they yield the most severe overpressure peaks and the fastest pressure rise rates. Regarding pressure relief devices, the structural design must not only withstand the primary burst pressure peak (P1) but also account for the secondary internal peak (Pun) and the external explosion-induced peak (Pext).

3.2.2. Analysis of Flame Instability Induced by Different Ignition Sources

Flame instability is influenced by two main factors: ① Intrinsic Flame Instability: This type of instability arises from the stable heat release rate of the flame itself, directly related to the ignition and explosion process of the material. It is typically referred to as intrinsic flame instability. ② External Perturbation-Induced Instability: This occurs due to fluctuations in the heat release rate or structural constraints, leading to flame destabilization caused by external disturbances.
For gasoline vapor–air explosions triggered by different ignition sources, under no external interference during the initial ignition phase, the internal flame should be in a laminar combustion state where intrinsic flame instability does not play a role. However, when tungsten filaments or electrochemical igniters are used, significant cellular structures appear within the flame, indicating an imbalance between chemical reactions and flow dynamics. The formation mechanisms differ and will be analyzed below with schlieren images.
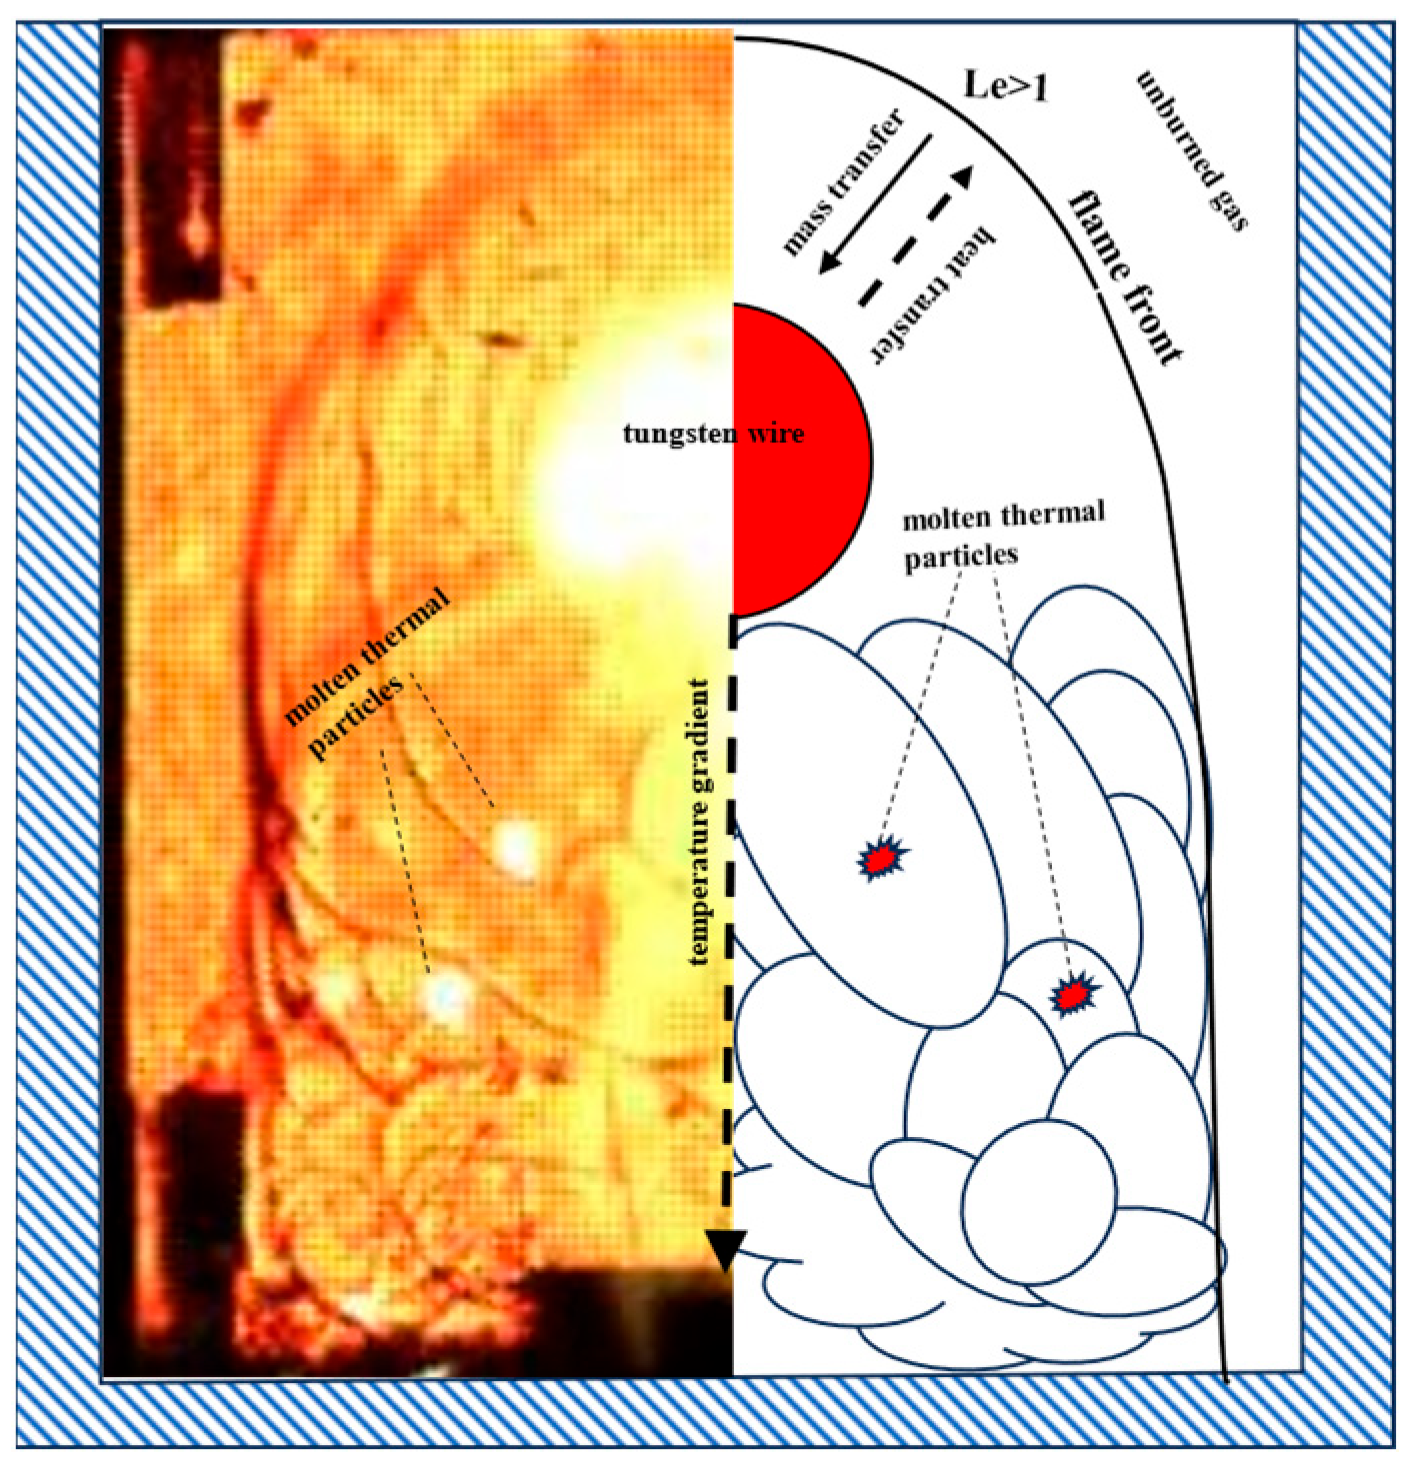
Figure 7 shows the schlieren images of tungsten filament ignition at 26 ms post-ignition; combined with Figure 3, it can be seen that, initially, the tungsten filament melts and emits a bright white light at its melting point of 3410 °C. Subsequently, the bottom of the flame shows noticeable wrinkles and numerous cells. These phenomena result from small vortices formed by molten thermal particles in the flame, causing cracks that branch and intersect, forming larger cells. By 26 ms, a large temperature gradient forms between the melted tungsten center and the flame front, spreading heat into unburned regions (Le > 1) [19]. Under the influence of thermal diffusion instability, the flame front remains smooth and elliptical while numerous cells form behind the flame due to three primary reasons: ① Early-stage turbulence induced by molten thermal particles disturbs the flame structure. ② Faster combustion in high-temperature areas near the tungsten center versus slower combustion in lower-temperature rear areas leads to uneven heat distribution. ③ Localized quenching followed by re-ignition by neighboring combustion zones alters local temperature fields, enhancing instability.
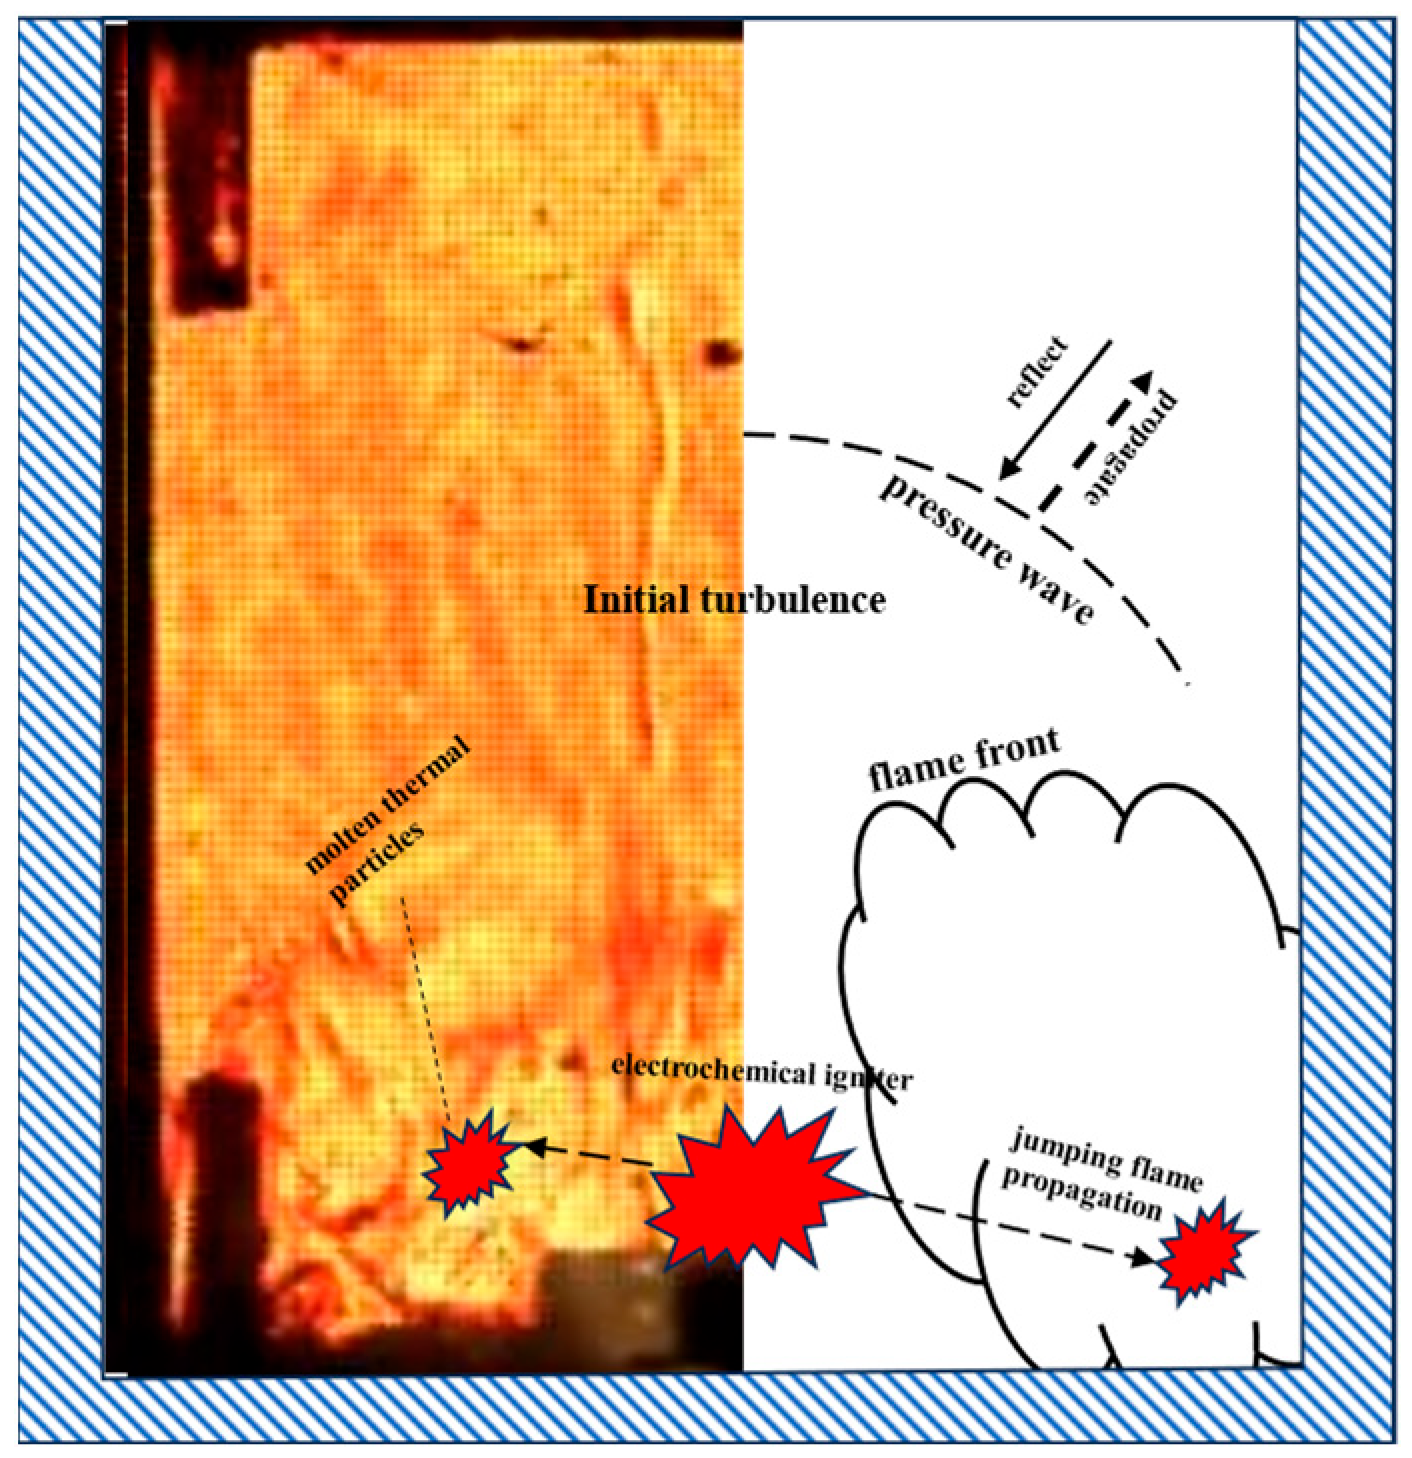
Figure 8 shows the schlieren images of gasoline vapor ignition by the electrochemical igniter. Combined with Figure 2, after ignition, pressure oscillations occur due to exothermic chemical reactions and scattered thermal particles. The container’s internal turbulence increased. Due to the small size of thermal particles, the gasoline vapor–air mixture is not immediately ignited. At 16 ms, sustained splashing thermal particles ignite the gasoline vapor–air mixture in the lower left and right corners, creating a “multi-source ignition” effect. Pressure oscillation-induced turbulence causes significant wrinkles on the flame front. As the explosion progresses, two flame fronts merge and propagate upwards, continuously increasing cellular structures. The instability here is primarily influenced by: ① Initial ignition turbulence caused by the reaction between zirconium powder (Zr) and oxygen, producing ZrO2 and releasing high-pressure gases, inducing pressure oscillations and initial turbulence. ② Partially vaporized zirconium powder may exist as molten or solid particles, forming new combustion points, leading to jumping flame propagation and unstable interactions among multiple ignition points.
It must be acknowledged that the flame behaviors observed with the tungsten filament and electrochemical igniter are significantly influenced by artifacts introduced by the ignition sources themselves. The melting of the tungsten filament introduces solid/molten metal particles and potential tungsten oxidation, transforming the system into a multiphase, non-premixed-like ignition scenario. Similarly, the electrochemical igniter generates a jet and thermal particle dispersion during a pre-ignition delay, creating turbulent, multi-point initial conditions that differ fundamentally from the quiescent, single-point ignition conditions of the electric spark and open flame. Consequently, the cellular structures reported for these two sources should be interpreted as ignition-source-induced artifacts rather than intrinsic characteristics of gasoline vapor–air explosions.

4. Conclusions

This study investigated the effects of four common ignition sources—electric spark, open flame, tungsten filament, and electrochemical igniter—on the vented explosion overpressure and flame propagation characteristics of a 1.7% gasoline vapor–air mixture in a weakly confined space. Key findings include:
(1) The explosion process can be divided into four stages, generating three typical overpressure peaks. Flame propagation speeds show two distinct accelerations upon membrane rupture and flame reaching the vent opening. Maximum propagation speeds rank as follows: electrochemical igniter > tungsten filament > electric spark > open flame.
(2) Considering peak overpressure and peak rise rates, electric spark ignition exhibits the greatest destructive effect. While the electrochemical igniter yielded the fastest flame propagation, and the tungsten filament ignition generated the longest external flame, constituting the greatest external fire threat.
(3) During early ignition with tungsten filaments or electrochemical igniters, flame instability is induced by ignition source perturbations. Specifically, tungsten filament ignition is mainly affected by molten thermal particle disturbances and uneven heat distribution, whereas electrochemical igniter ignition is influenced by initial turbulence and multi-point ignition effects.

Author Contributions

Conceptualization, R.L.; methodology, X.J.; resources, K.L. and S.W. (Sai Wang); data curation, J.L.; writing—original draft preparation, R.L. and G.Y.; writing—review and editing, S.W. (Shimao Wang); visualization, T.T. All authors have read and agreed to the published version of the manuscript.

Funding

This work was supported by Chongqing Technology Innovation and Application Development Special Funding Program (CSTB2023TIAD-KPX0089), the National Natural Science Foundation of China (No. 52204077), Science and Technology Research Program of Chongqing Municipal Education Commission (KJQN202512903).

Data Availability Statement

The data presented in this study are available in this article.

Conflicts of Interest

The authors declare that they have no known competing financial interests or personal relationships that could have appeared to influence the work reported in this paper.

References

  1. Zhu, Y.; Qian, X.-M.; Liu, Z.-Y.; Huang, P.; Yuan, M.-Q. Analysis and assessment of the Qingdao crude oil vapor explosion accident: Lessons learnt. J. Loss Prev. Process Ind. 2015, 33, 289–303. [Google Scholar] [CrossRef] [Scilit]
  2. Zheng, B.; Chen, G.H. Storage tank fire accidents. Process Saf. Prog. 2011, 30, 291–293. [Google Scholar] [CrossRef] [Scilit]
  3. Zhao, W.S.; Ren, C.X.; Wang, L.; Zhang, X.; Zhang, Y. Study on ignition characteristics and control strategy of ignition source in oil storage area. Fire Sci. Technol. 2018, 37, 1024–1027. (In Chinese) [Google Scholar]
  4. Gill, J.; Atkinson, G.; Cowpe, E.; Phylaktou, H.; Andrews, G. Experimental investigation of potential confined ignition sources for vapour cloud explosions. Process Saf. Environ. Prot. 2020, 135, 187–206. [Google Scholar] [CrossRef] [Scilit]
  5. Álvarez-Fernández, M.-I.; Prendes-Gero, M.-B.; Pola-Alonso, I.; Conde-Fernández, L.; Luengo-García, J.-C. Determination of the explosion parameters of methane-air mixtures as function of the ignition source and the volume and shape of the explosion chambers. J. Loss Prev. Process Ind. 2022, 80, 104938. [Google Scholar] [CrossRef] [Scilit]
  6. El Gadha, C.; Bernard, S.; William-Louis, M. A comparative study between two ignition sources: Electric igniter versus pyrotechnic igniter. J. Loss Prev. Process Ind. 2023, 83, 105038. [Google Scholar] [CrossRef] [Scilit]
  7. Wang, H.Y.; Zhang, L.; Lü, J.X. Study on Gas Product of Gas Explosion Under Different Ignition Modes. Coal Mine Saf. 2020, 51, 16–20. (In Chinese) [Google Scholar]
  8. Wu, Z.C.; Wang, Z.L.; Li, R.Y.; Li, K.X.; Hua, M.; Pan, X.H.; Wang, S.M.; Jiang, J.C. Study on the effect of ignition mode on overpressure of underexpanded hydrogen jet explosion. CIESC J. 2023, 74, 1409–1418. (In Chinese) [Google Scholar]
  9. Ren, X.J.; Zhang, Q.M.; Xue, Y.J. Experimental Research on Blasting Effects of Unconfined Hemispherical Liquid Gas Cloud by Different Ignition methods. Acta Armamentarii 2014, 35, 139–143. (In Chinese) [Google Scholar]
  10. Sun, H.; Yang, G.; Ma, X.; Sheng, Z.; Li, S.; Cui, Y.; Xv, Z.; Yang, X.; Wang, H.; Qi, B. Effects of vent size and pressure on hydrogen explosion dynamic characteristics. ACS Omega 2024, 9, 39743–39756. [Google Scholar] [CrossRef] [Scilit] [PubMed]
  11. Yang, Y.; Yang, S.; Fang, Q.; Xiang, H.; Sun, W.; Liu, X. Large-scale experimental and simulation study on gas explosion venting load characteristics of urban shallow buried pipe trenches. Tunn. Undergr. Space Technol. 2022, 123, 104409. [Google Scholar] [CrossRef] [Scilit]
  12. Huang, Y.; Cao, L.; Hou, L.; Ge, X.; Luo, Z. Study of explosion relief mechanisms in lateral explosion relief conduits of gas pipelines. Process Saf. Prog. 2024, 43, 774–783. [Google Scholar] [CrossRef] [Scilit]
  13. Wang, S.; Dong, X. Effect of static rupture pressure on internal overpressure characteristics during petroleum fuel-air venting explosion process: A small-scale experimental study. Energy Rep. 2025, 13, 107097. [Google Scholar] [CrossRef] [Scilit]
  14. Yu, M.; Wan, S.; Zheng, K.; Guo, P.; Chu, T.; Yuan, Z. Influence on the methane/air explosion characteristics of the side venting position in a pipeline. Process Saf. Environ. Prot. 2017, 111, 292–299. [Google Scholar] [CrossRef] [Scilit]
  15. Lu, Y.; Fan, R.; Wang, Z.; Cao, X.; Guo, W. The influence of hydrogen concentration on the characteristic of explosion venting: Explosion pressure, venting flame and flow field microstructure. Energy 2024, 293, 130562. [Google Scholar] [CrossRef] [Scilit]
  16. Zhang, Y.; Chen, R.; Zhao, M.; Luo, J.; Feng, W.; Fan, W.; Tan, Y.; Cao, W.; Shu, C.-M.; Yu, C. Hazard Evaluation of Explosion Venting Behaviours for Premixed Hydrogen-Air Fuels with Different Bursting Pressures. Fuel 2020, 268, 117313. [Google Scholar] [CrossRef] [Scilit]
  17. Yao, L.L.; Wang, X.Q.; Xi, G.J.; Zhou, Z.X. Study on the relationship between flame morphology evolution and propagation velocity of gas explosion Based on OpenCV. J. N. China Inst. Sci. Technol. 2023, 20, 17–22. (In Chinese) [Google Scholar]
  18. Wang, S.; Zhao, Y.; Li, G.; Xie, Y.; Wu, D. Effect of Different Vent Covers on the Overpressure and Flame Propagation Characteristics of Hydrocarbon Fuel-Air Mixture Venting Explosion. Fuel 2022, 324, 120543. [Google Scholar] [CrossRef] [Scilit]
  19. Bhatt, D.; Rodriguez, D. Linear Analysis of Thermo-Diffusive Instability from Edge Flames to Fully-Premixed Laminar Flames with a Wide Range of Damköhler Number and Lewis Number Greater Than Unity. Combust. Flame 2026, 284, 114567. [Google Scholar] [CrossRef] [Scilit]
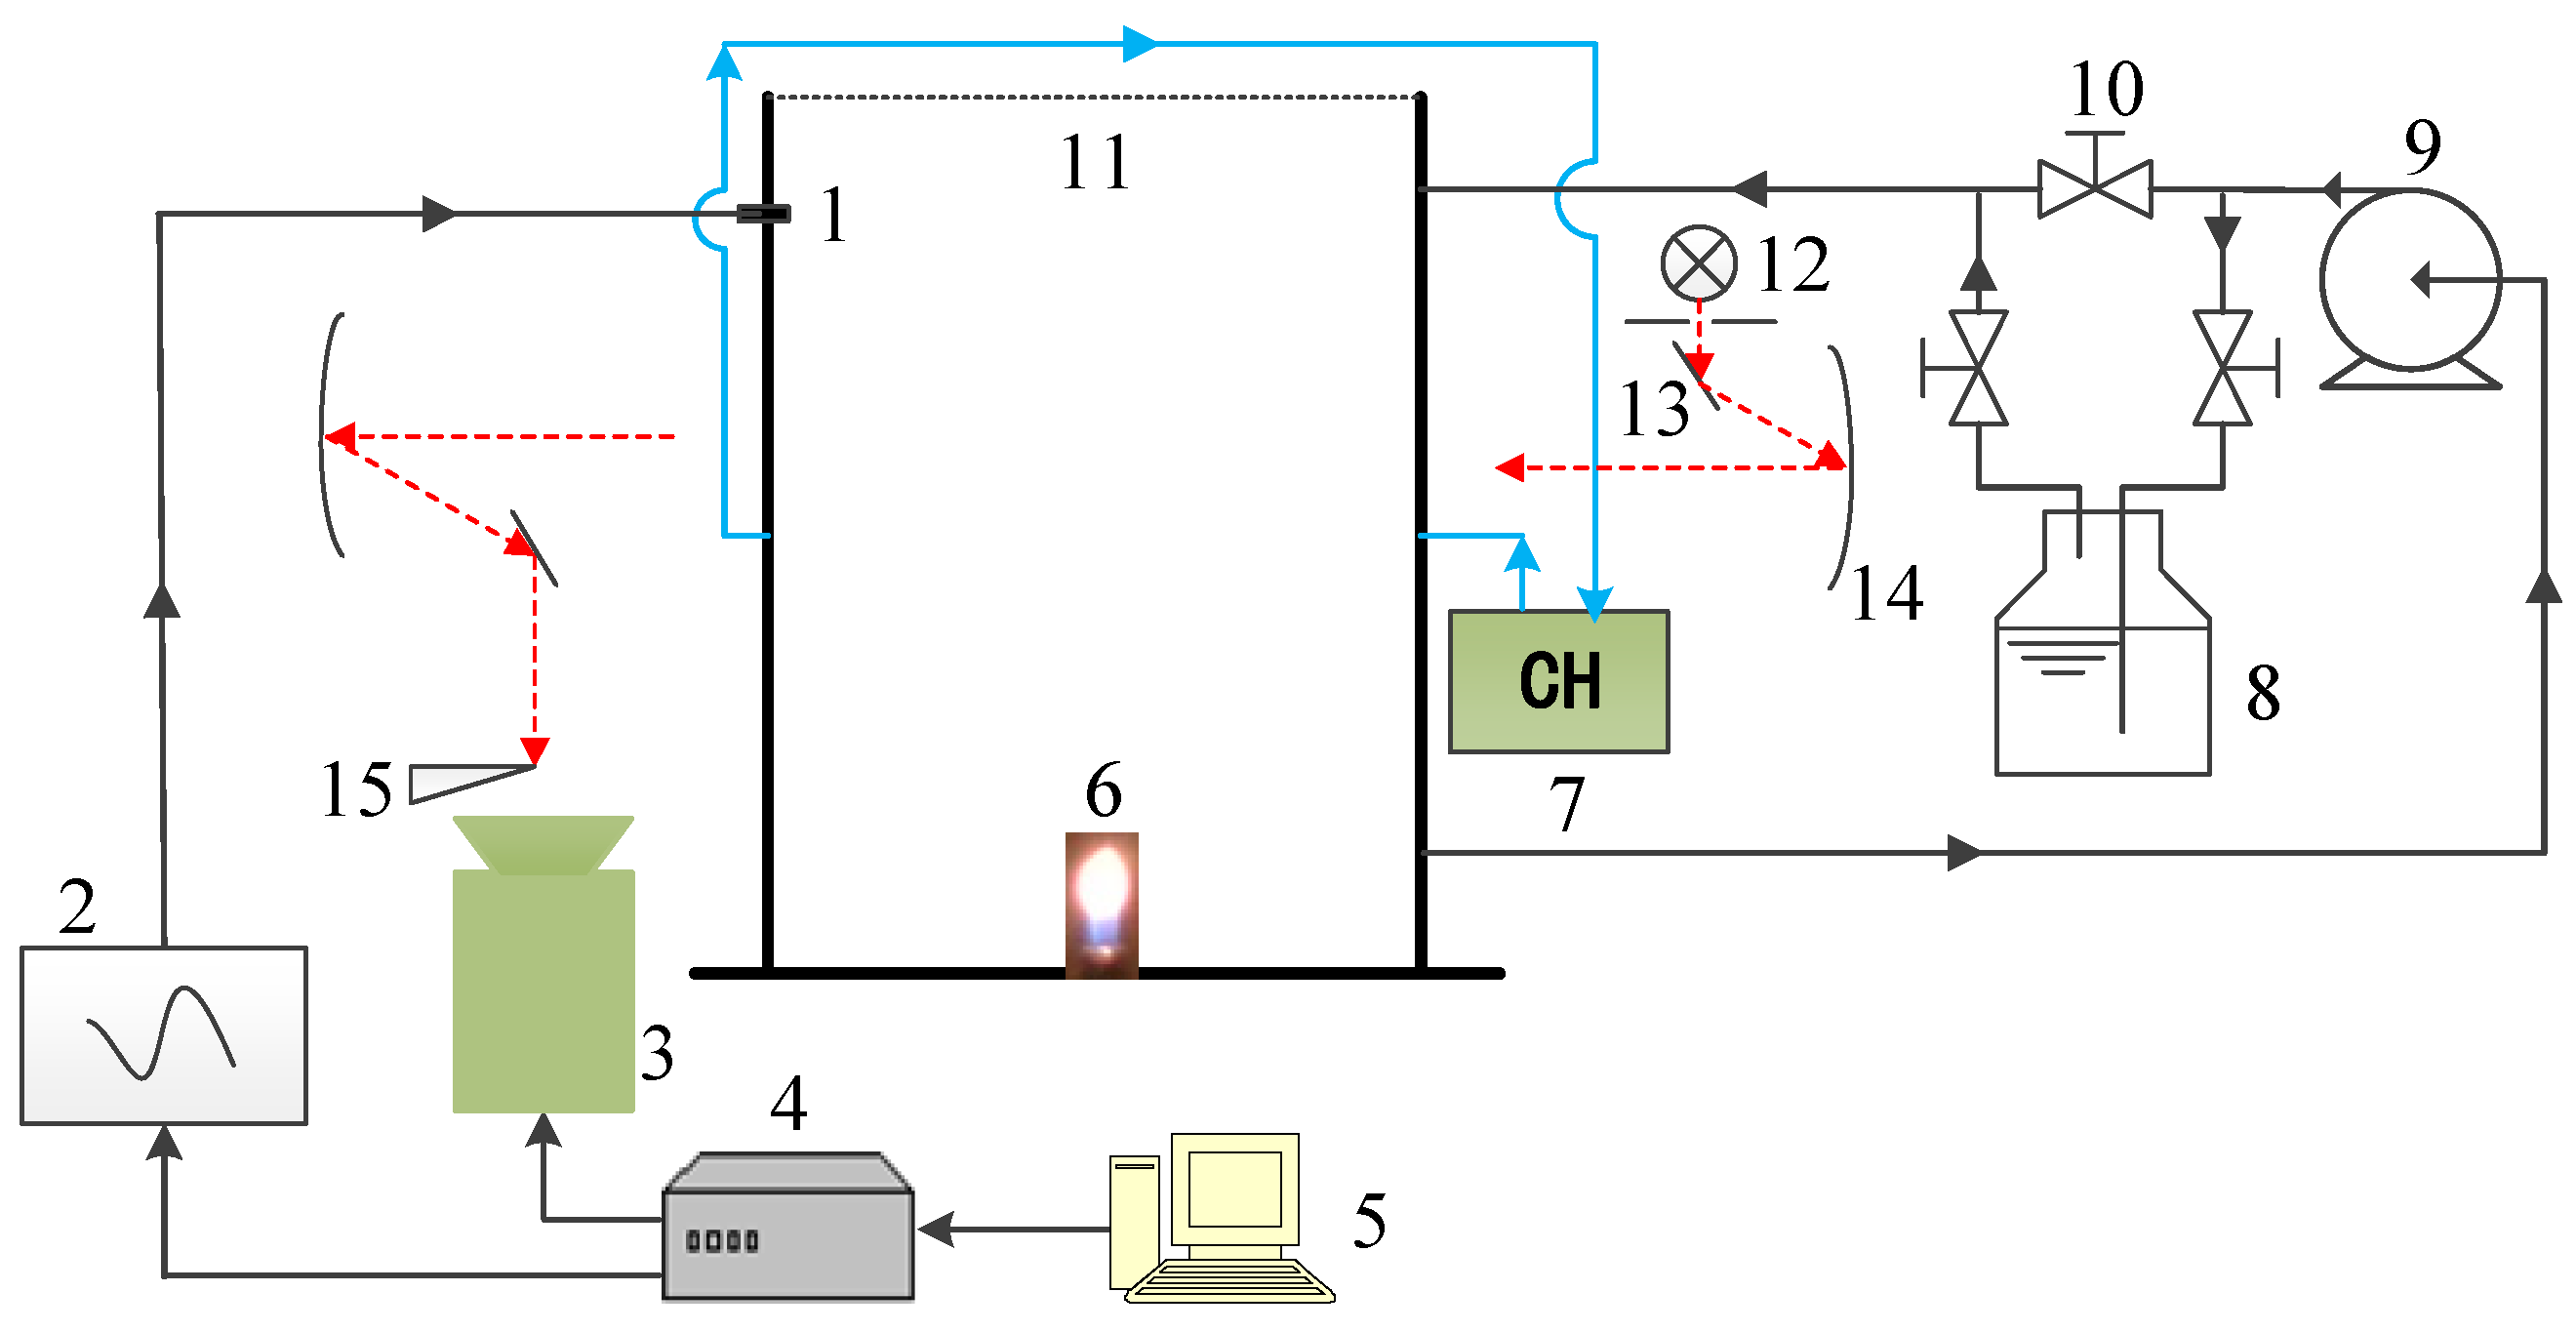
Figure 1. Experimental Platform. 1—sensor; 2—transient signal analyzer; 3—high-speed camera; 4—synchronization controller; 5—computer; 6—ignition source; 7—CH gas analyzer; 8—gasoline bottle; 9—electromagnetic air pump; 10—valve; 11—polyethylene film; 12—light source; 13—mirror; 14—concave mirror; 15—knife edge.
Fire 09 00215 g001
Figure 2. Overpressure variation curves of gasoline vapor ignition by different ignition sources.
Fire 09 00215 g002
Figure 3. Schlieren images of gasoline vapor ignition by different ignition sources.
Fire 09 00215 g003
Figure 4. Flame front position and flame front speeds curves of gasoline vapor ignition by different ignition sources. (a) Flame front position; (b) flame front speeds.
Fire 09 00215 g004
Figure 5. Peak overpressure, time to peak overpressure, and peak overpressure rise rates at different stages for gasoline vapor ignition by different ignition sources. (a) Peak overpressure; (b) time to peak overpressure; (c) peak overpressure rise rates.
Fire 09 00215 g005
Figure 6. Average influence coefficients of peak overpressure, time to peak overpressure, and peak overpressure rise rate for gasoline vapor ignition by different ignition sources.
Fire 09 00215 g006
Figure 7. Schlieren images of gasoline vapor ignition by a tungsten filament.
Fire 09 00215 g007
Figure 8. Schlieren images of gasoline vapor ignition by an electrochemical igniter.
Fire 09 00215 g008
Table 1. Influence coefficients of different ignition sources on peak overpressure, time to peak overpressure, and peak overpressure rise rate.
Ignition SourcesPeak OverpressureTime to Peak OverpressurePeak Overpressure Rise Rate
α1αunαextβ1βunβextγ1γunγext
open flame0.19%43.13%36.76%35.36%34.96%28.80%−67.60%−15.35%−49.71%
electrochemical igniter−8.43%15.48%10.79%6.36%−1.83%−2.07%24.33%−7.43%19.43%
tungsten filament−3.69%12.80%9.47%−28.02%−24.27%−17.28%20.35%7.92%−6.27%
electrical spark11.94%14.85%16.50%−13.70%−8.86%−9.45%22.92%14.85%36.56%
Disclaimer/Publisher’s Note: The statements, opinions and data contained in all publications are solely those of the individual author(s) and contributor(s) and not of MDPI and/or the editor(s). MDPI and/or the editor(s) disclaim responsibility for any injury to people or property resulting from any ideas, methods, instructions or products referred to in the content.