Article

Characterizing Human-Caused Wildfire Based on the Fire Weather Index in South Korea
1
Department of Forestry and Environmental Systems, Kangwon National University, Chuncheon 24341, Republic of Korea
2
Division of Forest Science, Kangwon National University, Chuncheon 24342, Republic of Korea
*
Author to whom correspondence should be addressed.
Fire 2026, 9(4), 147; https://doi.org/10.3390/fire9040147
Submission received: 24 February 2026 / Revised: 1 April 2026 / Accepted: 2 April 2026 / Published: 4 April 2026

Abstract

This study examines the effects of meteorological fire danger and human activity on wildfire ignition patterns in South Korea using records from 2004 to 2023. A percentile-based Fire Weather Index (FWI) classification, derived from negative binomial regression, identified critical daily fire frequency thresholds at FWI 4.39 (μ ≥ 1 fire/day) and FWI 6.84 (μ ≥ 2 fires/day). Bivariate LISA analysis revealed a spatial mismatch between resident population density and wildfire frequency: High–High (HH) clusters were concentrated in the Seoul metropolitan fringe, while Low–High (LH) clusters appeared in mountainous provinces where forest visitor ignitions and agricultural burning are the primary causes. In HH clusters, cigarette-related ignitions and structure-to-forest transitions were comparatively more frequent. Wildfire events were concentrated in age class 4–5 coniferous and broadleaf stands, and mean ignition-to-building distances in metropolitan areas frequently fell below 150 m. These findings suggest that prevention strategies should shift from uniform resident-oriented approaches toward spatially differentiated management targeting transient populations in LH areas and Wildland-Urban Interface (WUI) exposure in HH areas.

1. Introduction

Wildfire risk has been increasing globally in response to climate-driven shifts in temperature and precipitation patterns, with fire-prone seasons becoming longer and drier across many regions [1,2]. South Korea exhibits pronounced seasonality in wildfire occurrence, with fire events concentrated in spring and, to a lesser extent, winter, when low atmospheric humidity and strong winds combine to reduce fuel moisture and increase the potential for fire spread [3,4,5,6]. Approximately 64% of Korea’s land area is forested, and human settlement areas, agricultural land, and infrastructure are widely distributed adjacent to these forests. The spatial proximity of human activity to forest cover increases both ignition exposure and the potential for socio-economic losses when fires do occur [7,8].
Unlike many fire-prone regions, wildfires in South Korea are predominantly caused by human activities rather than lightning. Analysis of wildfire records from 2004 to 2023 shows that forest visitor ignitions accounted for the largest share (35.5%), followed by agricultural burning at field and ridge boundaries (13.3%), waste burning (12.1%), cigarette-related ignitions (6.6%), structure fires spreading to forests (4.5%), and other or unclassified causes (21.7%). Lightning-caused ignitions are rare, comprising approximately 0.12% of all events [9]. This ignition profile underscores that the spatial distribution of wildfire occurrence in South Korea is governed not only by weather conditions but also by patterns of human activity and land use.
Wildfire danger is determined by how meteorological conditions reduce fuel moisture content and how readily ignition occurs when a fuel source contacts an ignition point. In a setting where anthropogenic ignitions dominate, high fire weather does not necessarily result in high fire frequency if potential ignition sources are absent, and conversely, moderate fire weather may be associated with elevated fire frequency in areas where human activities are concentrated [10,11]. Effective prevention of human-caused wildfires requires analyses that integrate meteorological conditions with human activity patterns—including land use, agricultural burning behavior, and accessibility—and socio-demographic characteristics such as population density, settlement distribution, and Wildland-Urban Interface (WUI) exposure. When analyses focus solely on fire counts, municipalities with dense populations near forests tend to appear as the primary risk zones, while fire frequency normalized by resident population or structural fuel exposure in rural and montane areas may be underestimated [12,13].
Against this background, an analytical framework that explicitly links meteorological fire danger, human activity patterns, and spatial population structure is needed. Wildfire occurrence is a count process with substantial overdispersion that is not well approximated by Poisson-based models, and the spatial distribution of fire events exhibits strong heterogeneity across administrative units [14,15]. A framework combining standardized fire-weather thresholds with spatially explicit indicators of human activity can support more targeted prevention planning and resource allocation than weather-based assessments alone.
The Canadian Fire Weather Index (FWI) System is widely used internationally as a weather-based indicator of wildfire danger and provides a consistent basis for comparing fire-prone conditions across time and space [16,17]. In this study, daily FWI values were converted to percentile-based classes so that meteorological severity could be interpreted relative to the long-term national distribution rather than only by raw index magnitude.
To model wildfire occurrence under different weather severities, we applied a negative binomial model, which is appropriate for over-dispersed count data and commonly preferred to a simple Poisson specification when the variance exceeds the mean. This allowed us to estimate expected daily wildfire frequency and identify practical fire-weather thresholds for risk categorization.
To quantify the local relationship between human presence and wildfire occurrence, we used bivariate LISA, which identifies municipality-level clustering patterns such as High–High (HH) and Low–High (LH) associations. This approach is especially useful for distinguishing areas where wildfire activity aligns with resident population density from areas where wildfire activity is disproportionately high relative to resident population [18].
We further interpreted these spatial clusters using ignition-cause categories, administrative types, forest stand characteristics, and building proximity metrics. This design enables a more complete explanation of wildfire ignition mechanisms by linking meteorological danger, population structure, and landscape context in a single analytical framework [19,20].
Accordingly, the objectives of this study were to: (1) derive percentile-based FWI thresholds and model wildfire occurrence probabilistically; (2) identify seasonal and risk-specific bivariate spatial clusters between wildfire occurrence and population density; and (3) interpret cluster-specific ignition mechanisms using administrative, forest, and WUI-related indicators.

2. Materials and Methods

2.1. Study Area and Data Sources

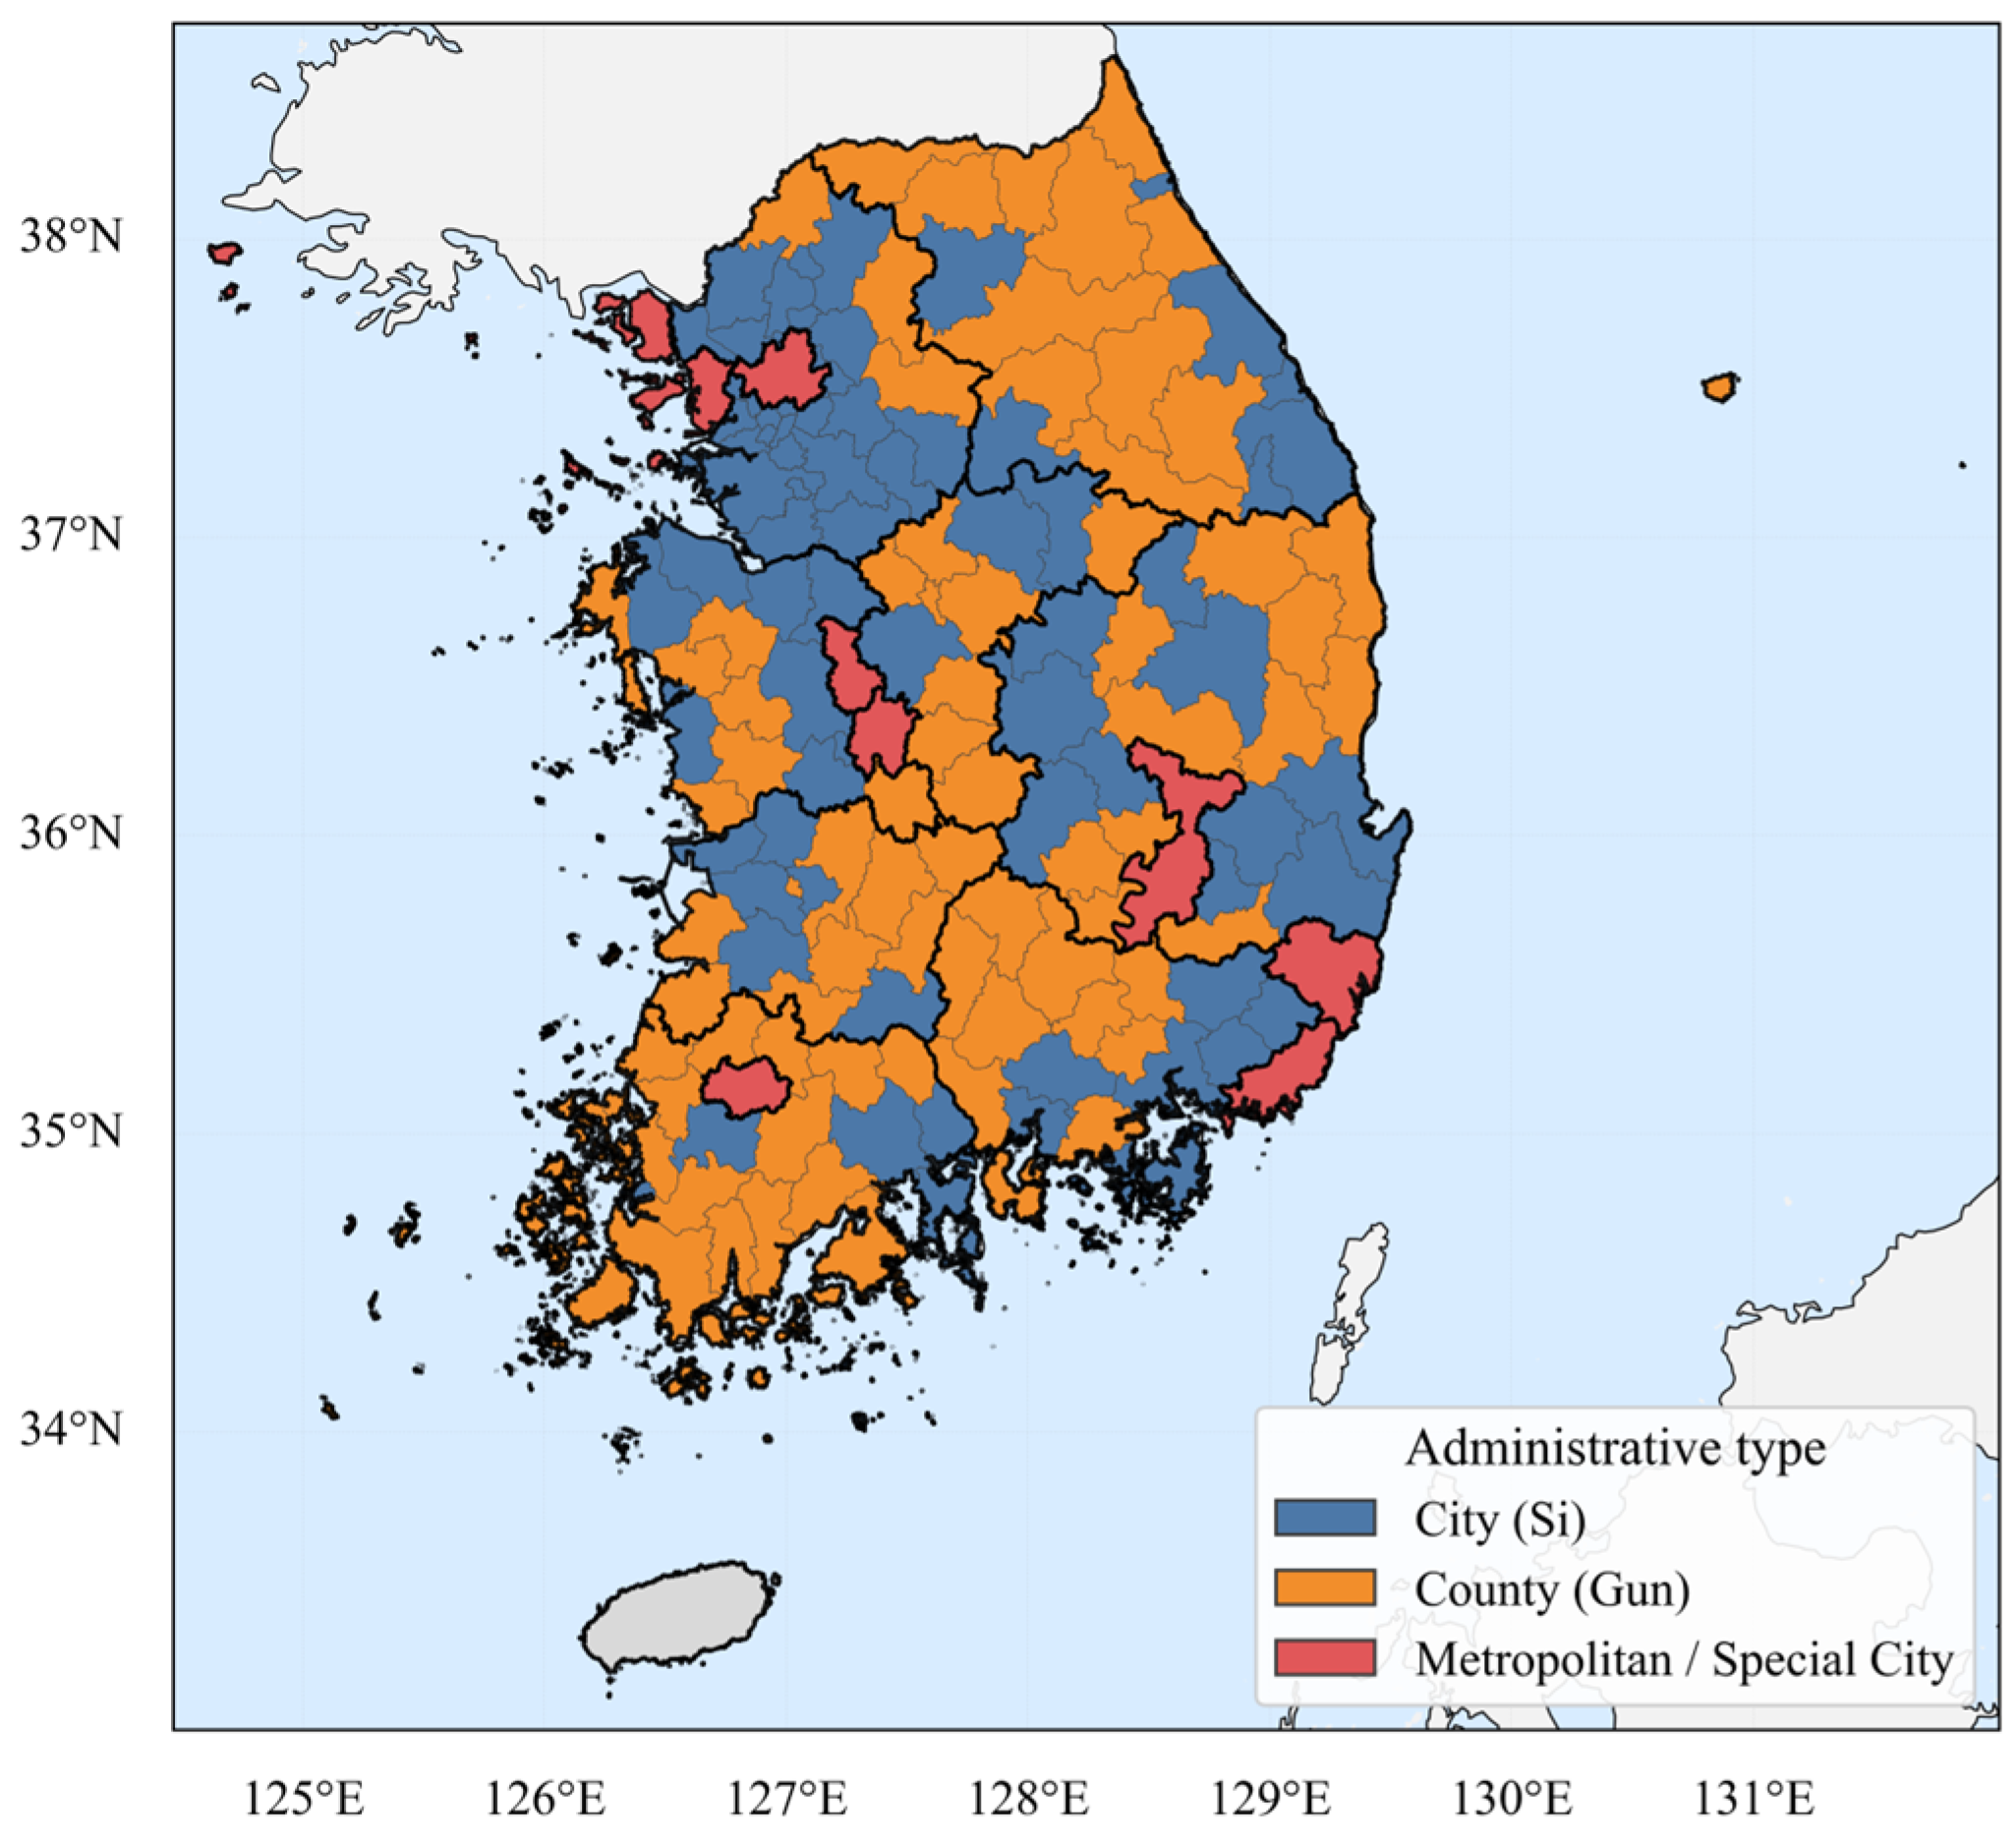
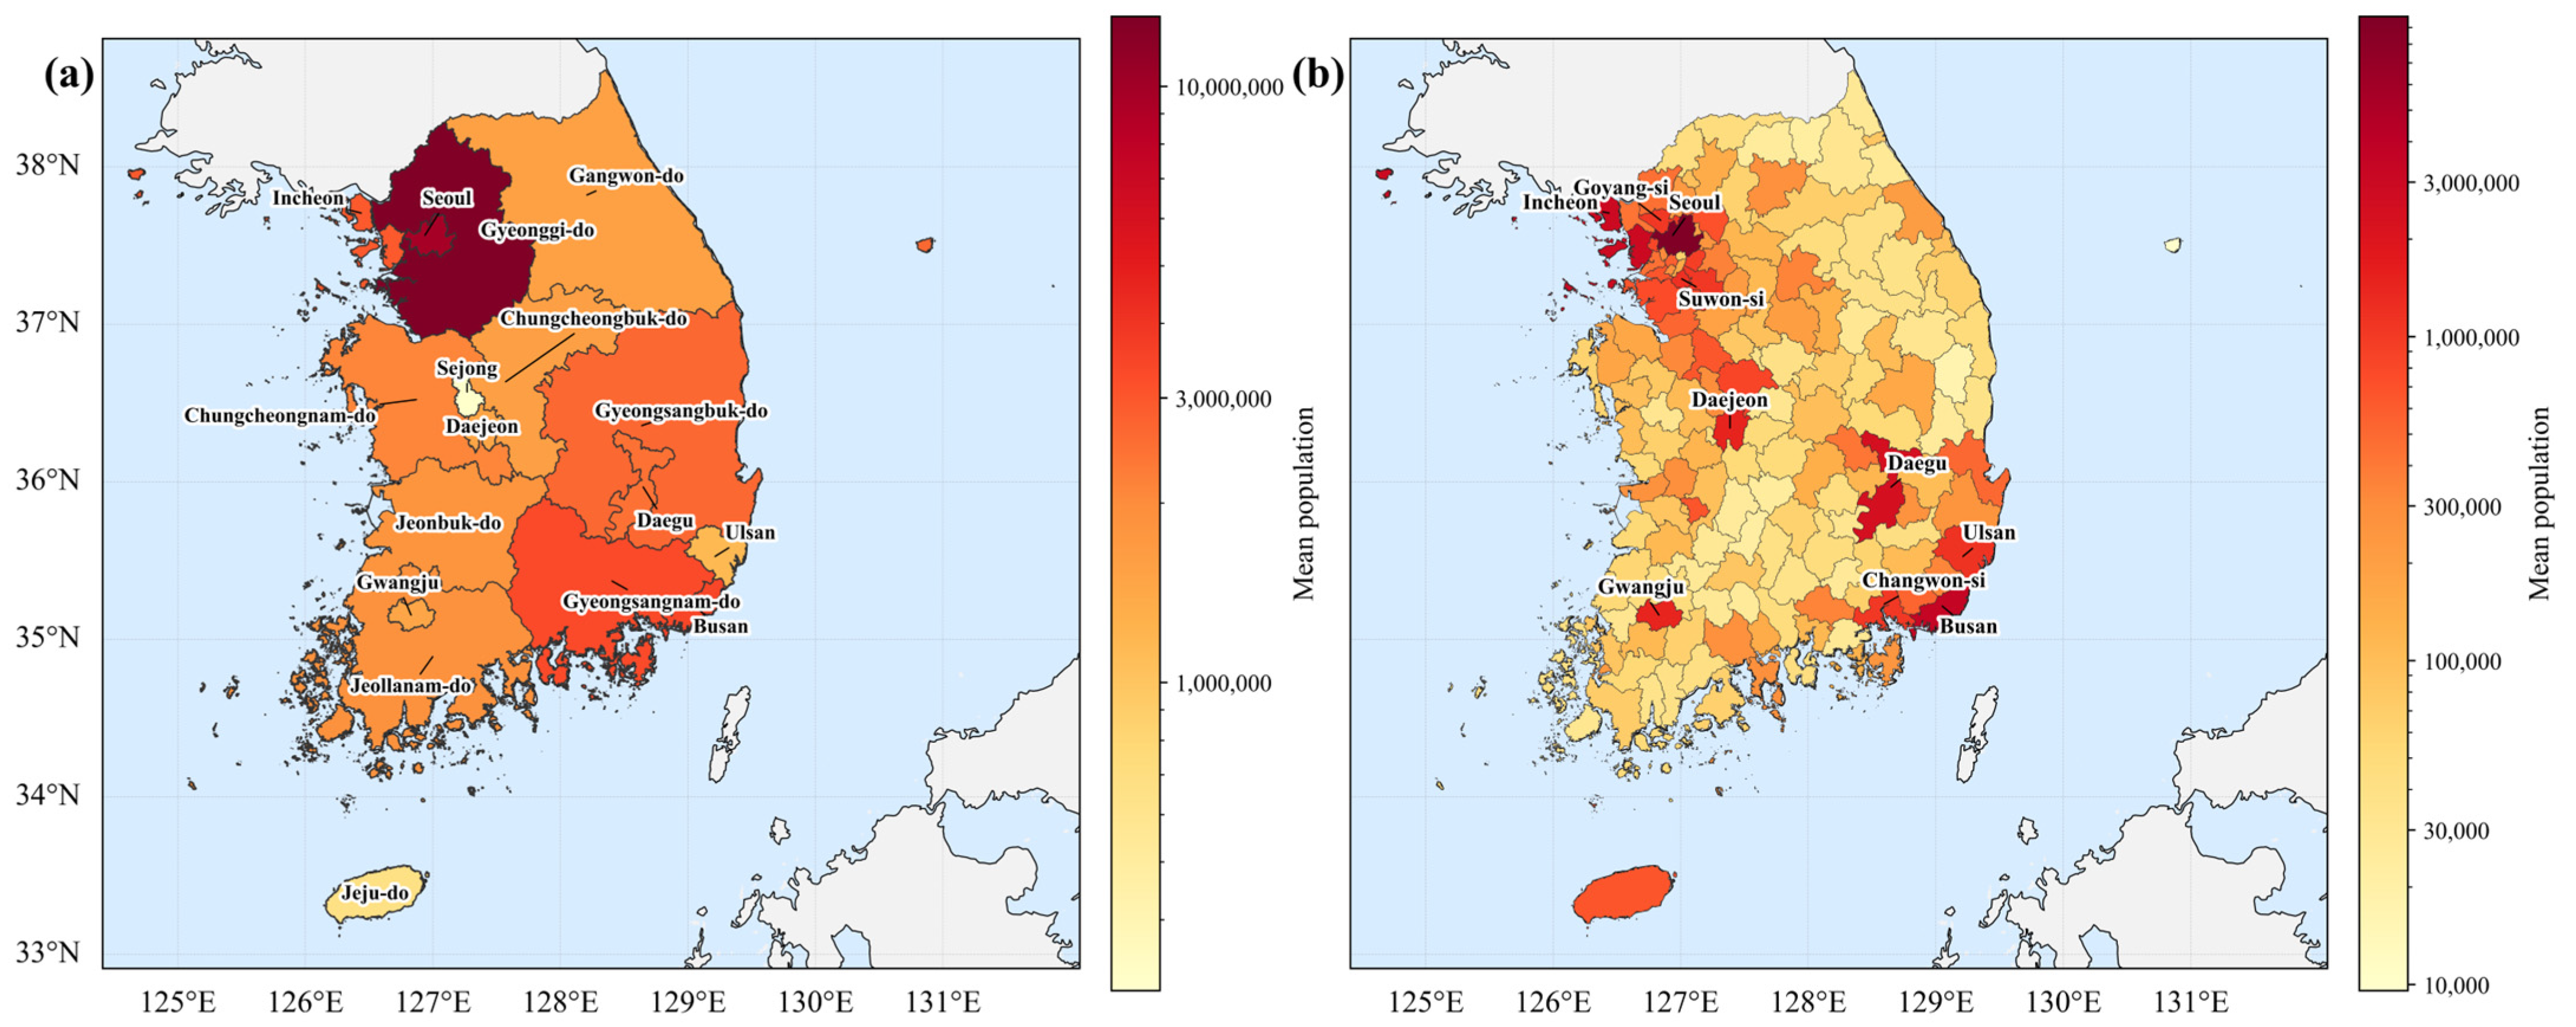
The spatial unit of analysis in this study is the municipal-level administrative district of South Korea. The administrative hierarchy consists of eight Metropolitan Cities and eight Provinces. Within these provinces, municipalities are further categorized into Si (City) and Gun (County) based on demographic and functional characteristics (Figure 1). A Si is typically defined as an urbanized municipality with a population of 50,000 or more, whereas a Gun represents predominantly rural or agricultural areas (Figure 2). This research analyzed 8 Metropolitan Cities and 152 lower-level municipalities (Cities and Counties) to capture the diverse dynamics of wildfires across both urbanized and rural landscapes.
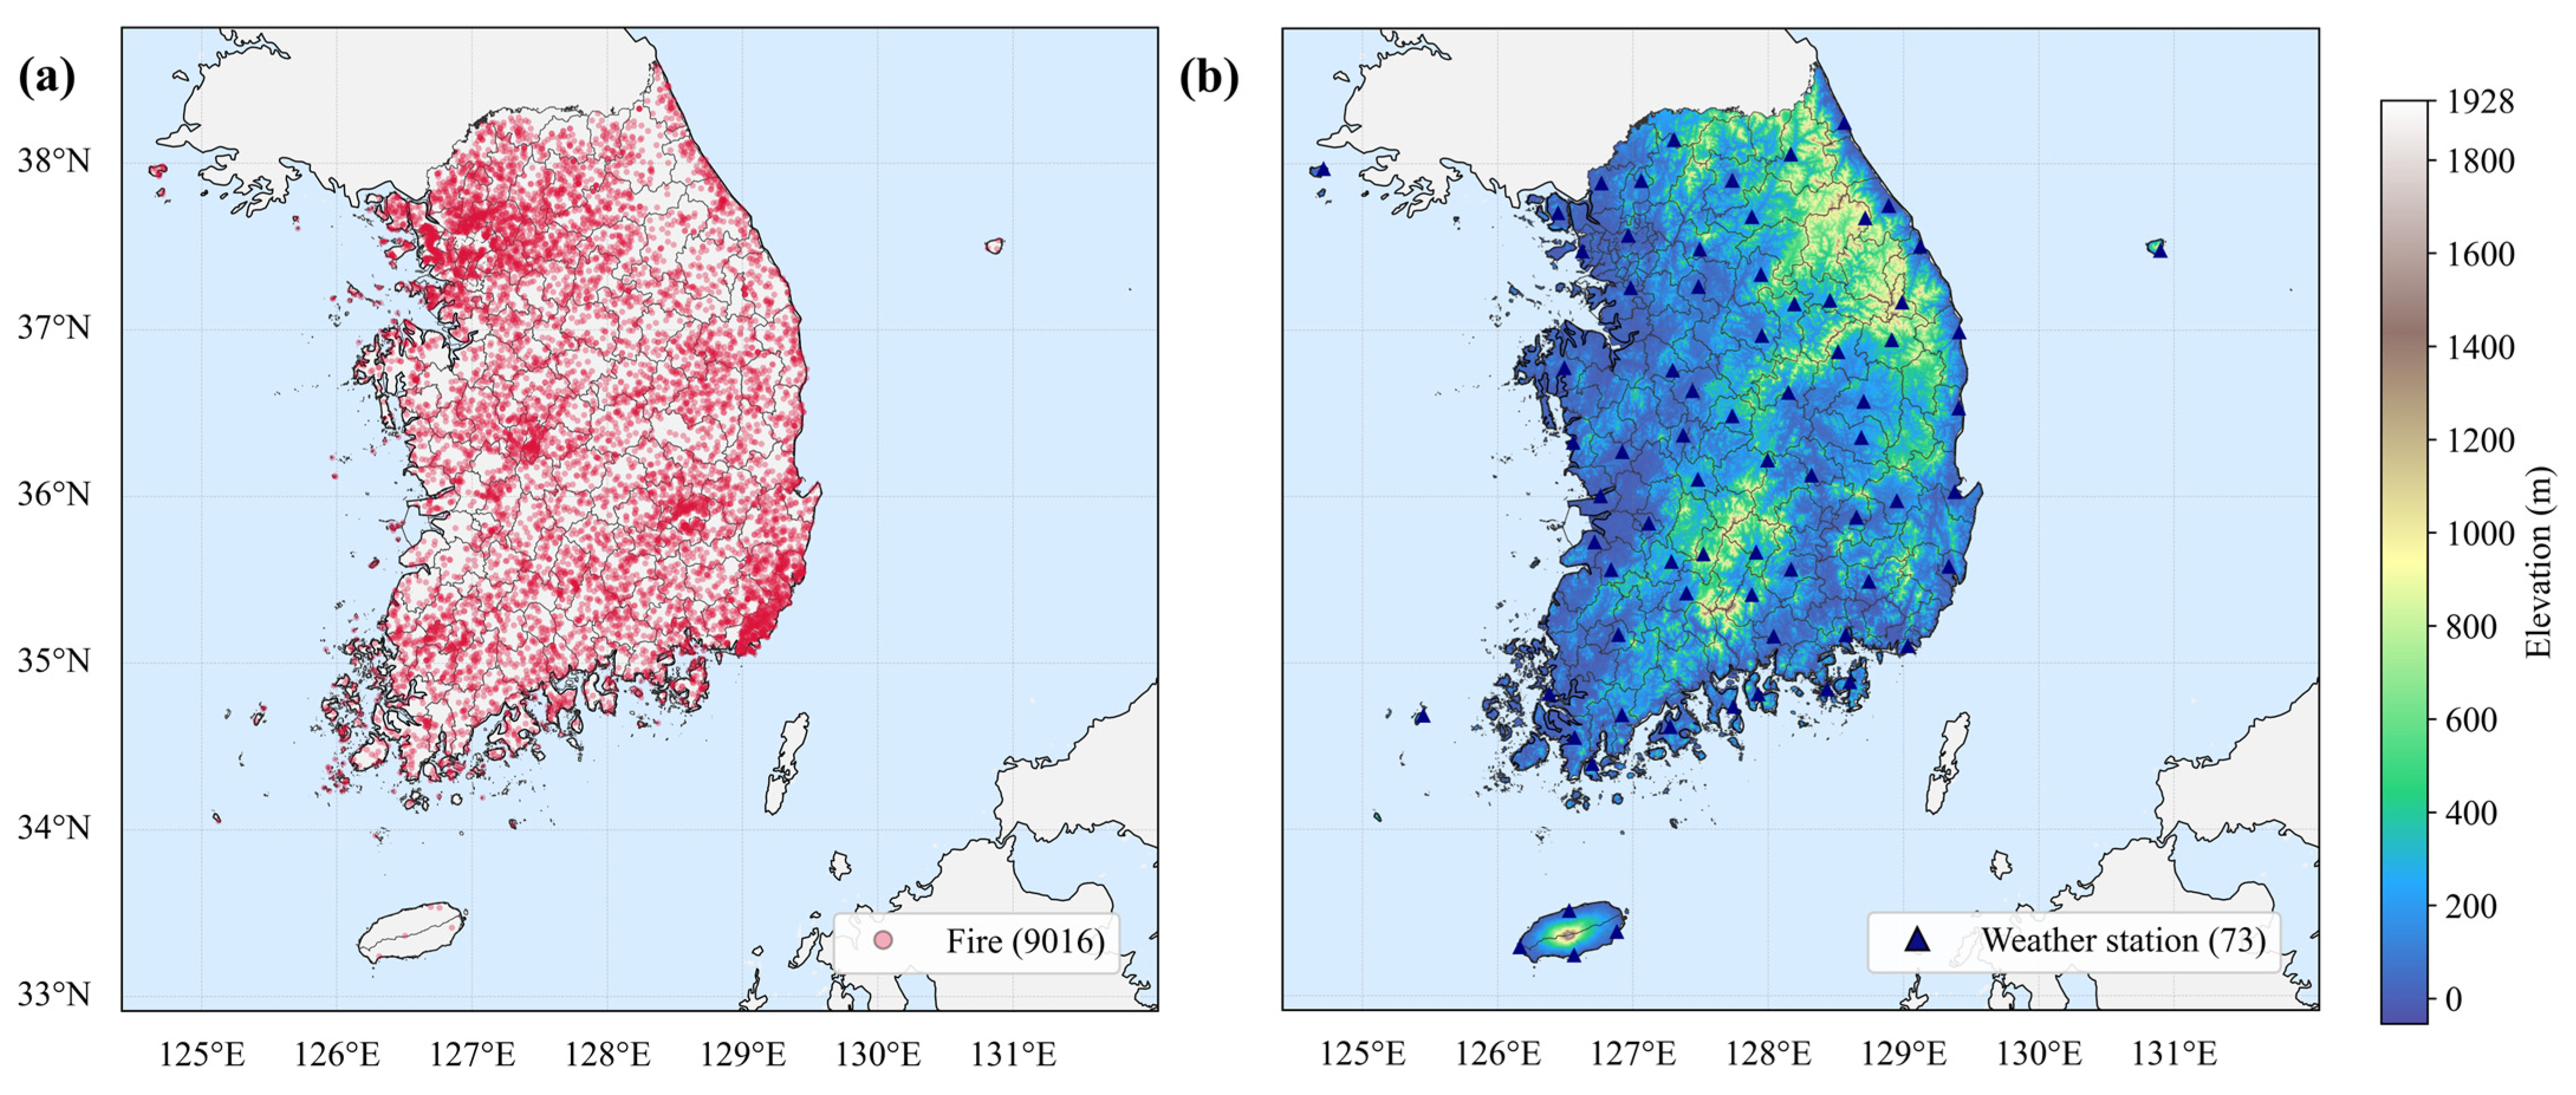
Wildfire ignition records were obtained from the Korea Forest Service (KFS) database for the period 2004 to 2023. Daily weather observations were collected from the Korea Meteorological Administration (KMA) Automated Synoptic Observing System (ASOS) weather station network for the period 2003 to 2023, with the additional year (2003) used for FWI spin-up prior to the analysis period (Figure 3). Municipal resident population statistics were compiled from the Korean Statistical Information Service (KOSIS); as 20-year continuous population data were not available at the municipal level, the mean population density over the most recent 10-year period was used as a representative value for each administrative unit. Additional geospatial layers included forest type, building footprints, and a digital elevation model (DEM).

2.2. Fire Weather Index Calculation and Percentile Standardization

Daily FWI values were calculated from weather station observations using the cffdrs package in the software R version 4.5.2 with initial values set at 85, 6, and 15 for the Fine Fuel Moisture Code (FFMC), Duff Moisture Code (DMC), and Drought Code (DC) [21]. These initial values (FFMC = 85, DMC = 6, DC = 15) follow the standard startup values by the Canadian Forest Fire Danger Rating System [22]. Weather inputs included air temperature, relative humidity, wind speed, and precipitation. A one-year spin-up simulation using 2003 weather data was performed to stabilize the initial FFMC, DMC, and DC values. The stabilized outputs were subsequently used to compute FWI values for each weather station from 2004 to 2023.
To produce a nationally comparable fire-weather metric, station-level FWI values were aggregated to a daily representative value and transformed into percentile classes based on the empirical distribution of all study-period daily values. Percentile binning was conducted at 1% intervals (0–100%).
To estimate meteorological conditions at wildfire ignition points, we applied a modified inverse distance weighting (IDWm) interpolation method that accounts for both horizontal distance and elevation difference between weather stations and fire locations [23,24,25]. The weighting function is defined as:
w i = h i a · d i k
where w i is the weight assigned to station i; d i is the horizontal distance (km) between the fire location and station i; h i is the absolute elevation difference (m); and a and k are positive parameters controlling the influence of elevation and distance, respectively. Following established guidance for terrain-sensitive interpolation, we set a = 1 and k = 3 .
The Haversine formula was used to calculate spherical distances. The full interpolation formula for estimating variable v (temperature, relative humidity, wind speed, or precipitation) at fire location m on date t is:
v m , t = i = 1 n w i · v i t i = 1 n w i = i = 1 n h i a · d i k · v i t i = 1 n h i a · d i k
This method was applied to estimate daily temperature, humidity, wind speed, and precipitation at each wildfire ignition location using station data from the preceding year. The analyses were performed using the software Python version 3.13.9.

2.3. Negative Binomial Regression and Meteorological Risk Classification

Because daily wildfire counts exhibit overdispersion relative to Poisson assumptions, we modeled the relationship between wildfire occurrence and FWI percentile using a negative binomial (NB) regression with an exposure offset [26]. Let Y p denote the total number of fires in percentile bin p . We assumed:
Y p NB n days , p μ p , α
where μ p is the expected daily fire rate for bin p , n days , p is the number of days in bin p , and α is the dispersion parameter. The linear predictor was specified as:
log μ p = β 0 + β 1 p
where p is treated as a continuous predictor (0–100), and n days , p enters the likelihood as an exposure term. Model parameters were estimated by maximum likelihood. The predicted mean daily wildfire count is:
μ p = exp β ^ 0 + β ^ 1 p
Days were classified into three meteorological risk classes: Low ( μ < 1 ), Mid ( 1 μ < 2 ), and High ( μ 2 ). This approach yields thresholds that are directly interpretable in terms of expected daily wildfire counts and are derived from the empirical weather–fire relationship.

2.4. Bivariate Local Indicators of Spatial Association (LISA)

To evaluate the spatial relationship between population density and wildfire frequency, we employed bivariate LISA [27,28]. The independent variable (x) represents the population density of each municipality (persons km−2), and the dependent variable (y) denotes the total number of wildfire occurrences within the same administrative boundaries. The local Moran’s I for the bivariate case is formulated as:
I i xy = z i x j = 1 , j i n s ij z j y
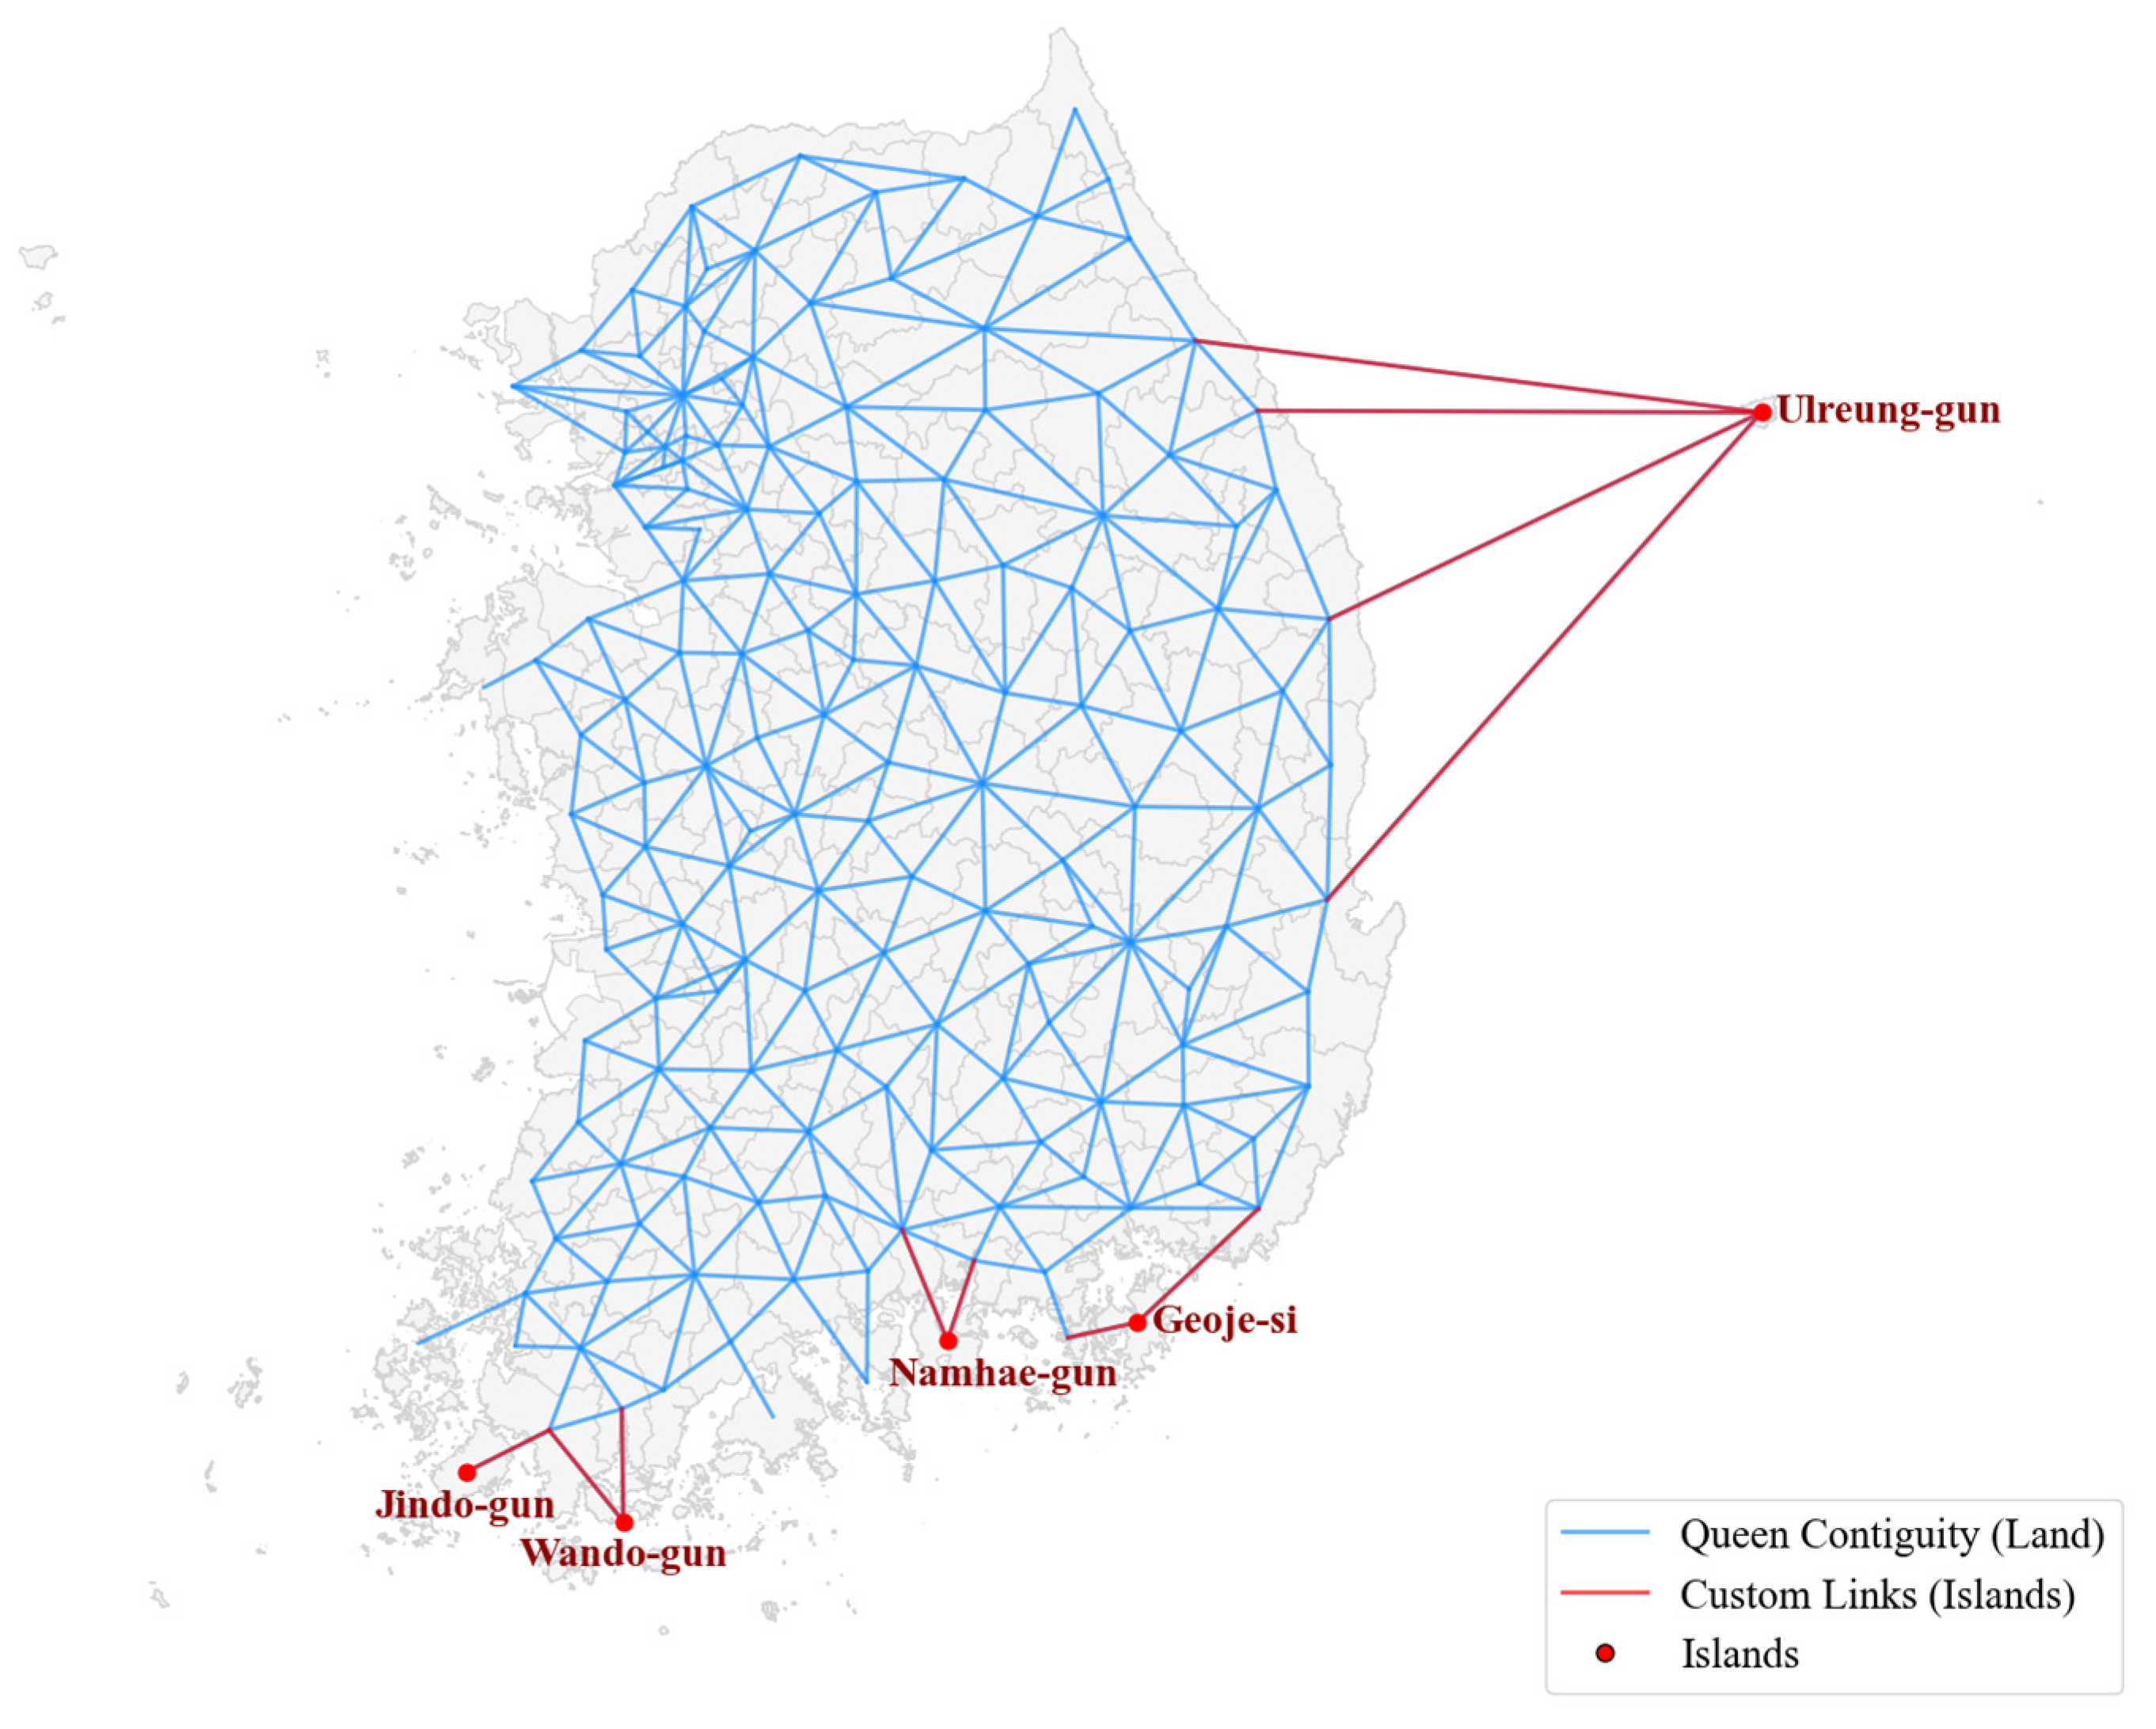
where I i xy is the local bivariate Moran’s I for municipality i ; z i x is the standardized value of population density at location i ; z j y is the standardized wildfire frequency at neighboring location j ; and s ij represents the spatial weight matrix (Figure 4). Statistical significance was assessed through 999 random permutations [27].
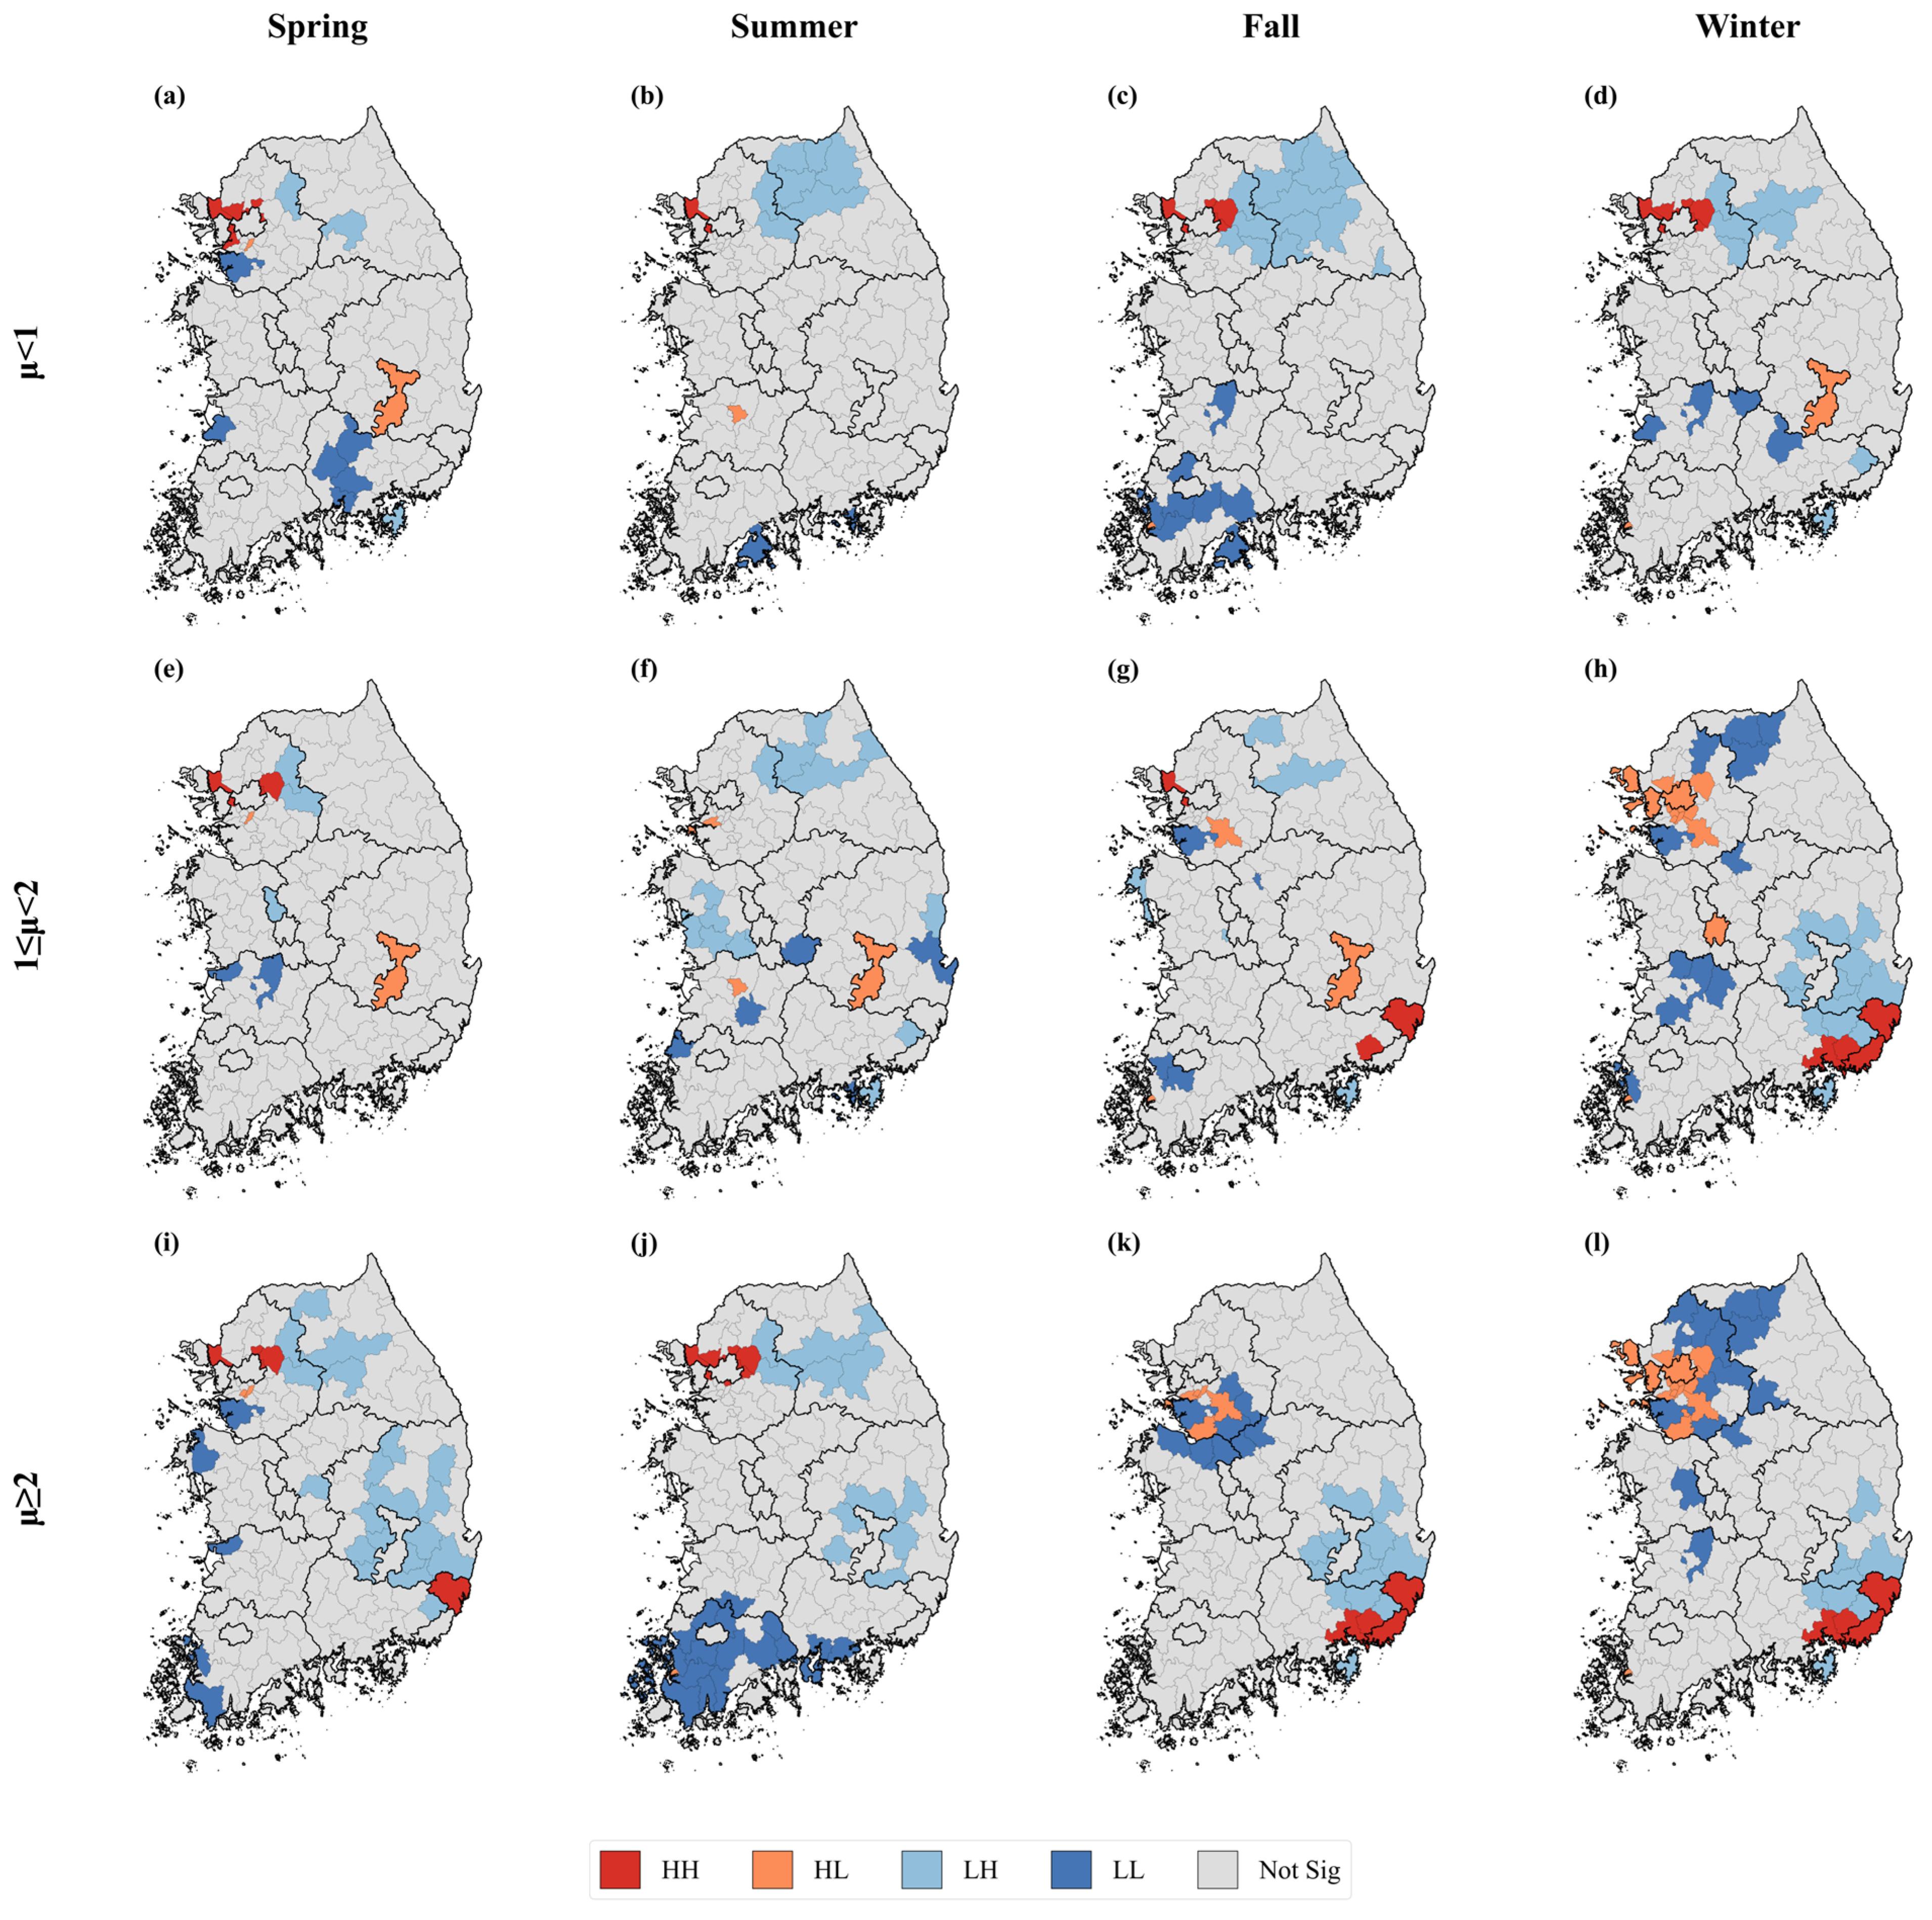
Cluster labels were interpreted as follows: HH (high population density with high wildfire occurrence), LL (low population density with low wildfire occurrence), LH (low population density with high wildfire occurrence), and HL (high population density with low wildfire occurrence). Non-significant units were retained as a separate class.

2.5. Ignition Causes, Forest Characteristics, and WUI Proximity

Forest type and age-class attributes were extracted for wildfire locations to assess whether specific stand conditions were over-represented in high-risk classes. These summaries were used as indicators of structural fuel vulnerability rather than direct measurements of fuel load.
To approximate WUI exposure, the nearest distance from each wildfire ignition point to mapped building footprints was calculated, and seasonal summaries were compared across administrative types (Metropolitan City, City, and County). Shorter ignition-to-building distances were interpreted as indicating greater potential for WUI-related damage and more constrained suppression windows, consistent with established WUI risk frameworks [29,30].

3. Results

3.1. Seasonal and Spatial Patterns of Wildfire Occurrence

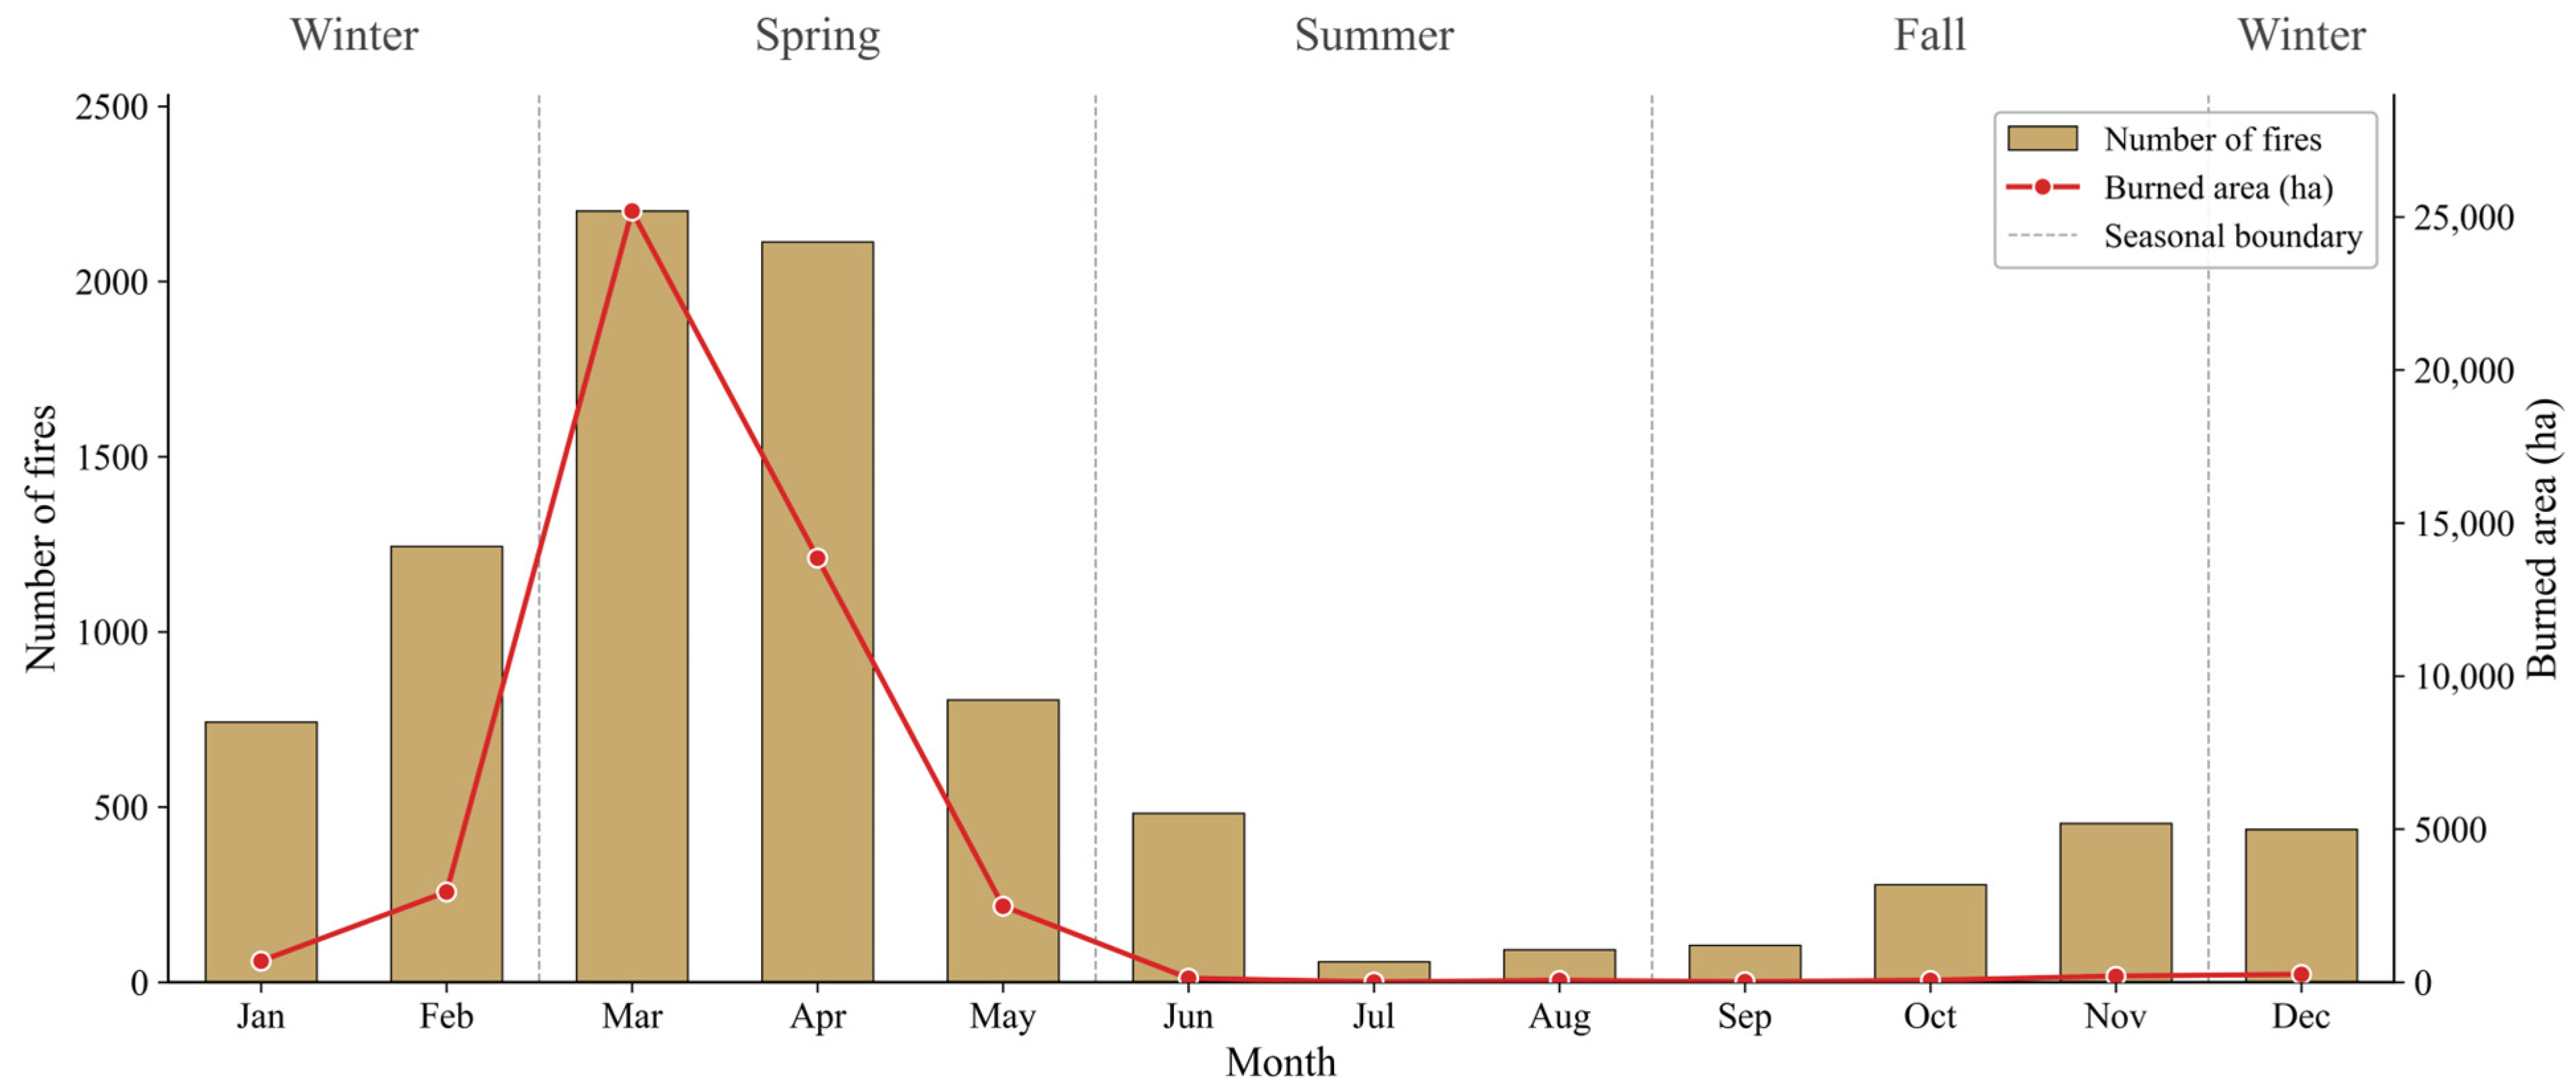
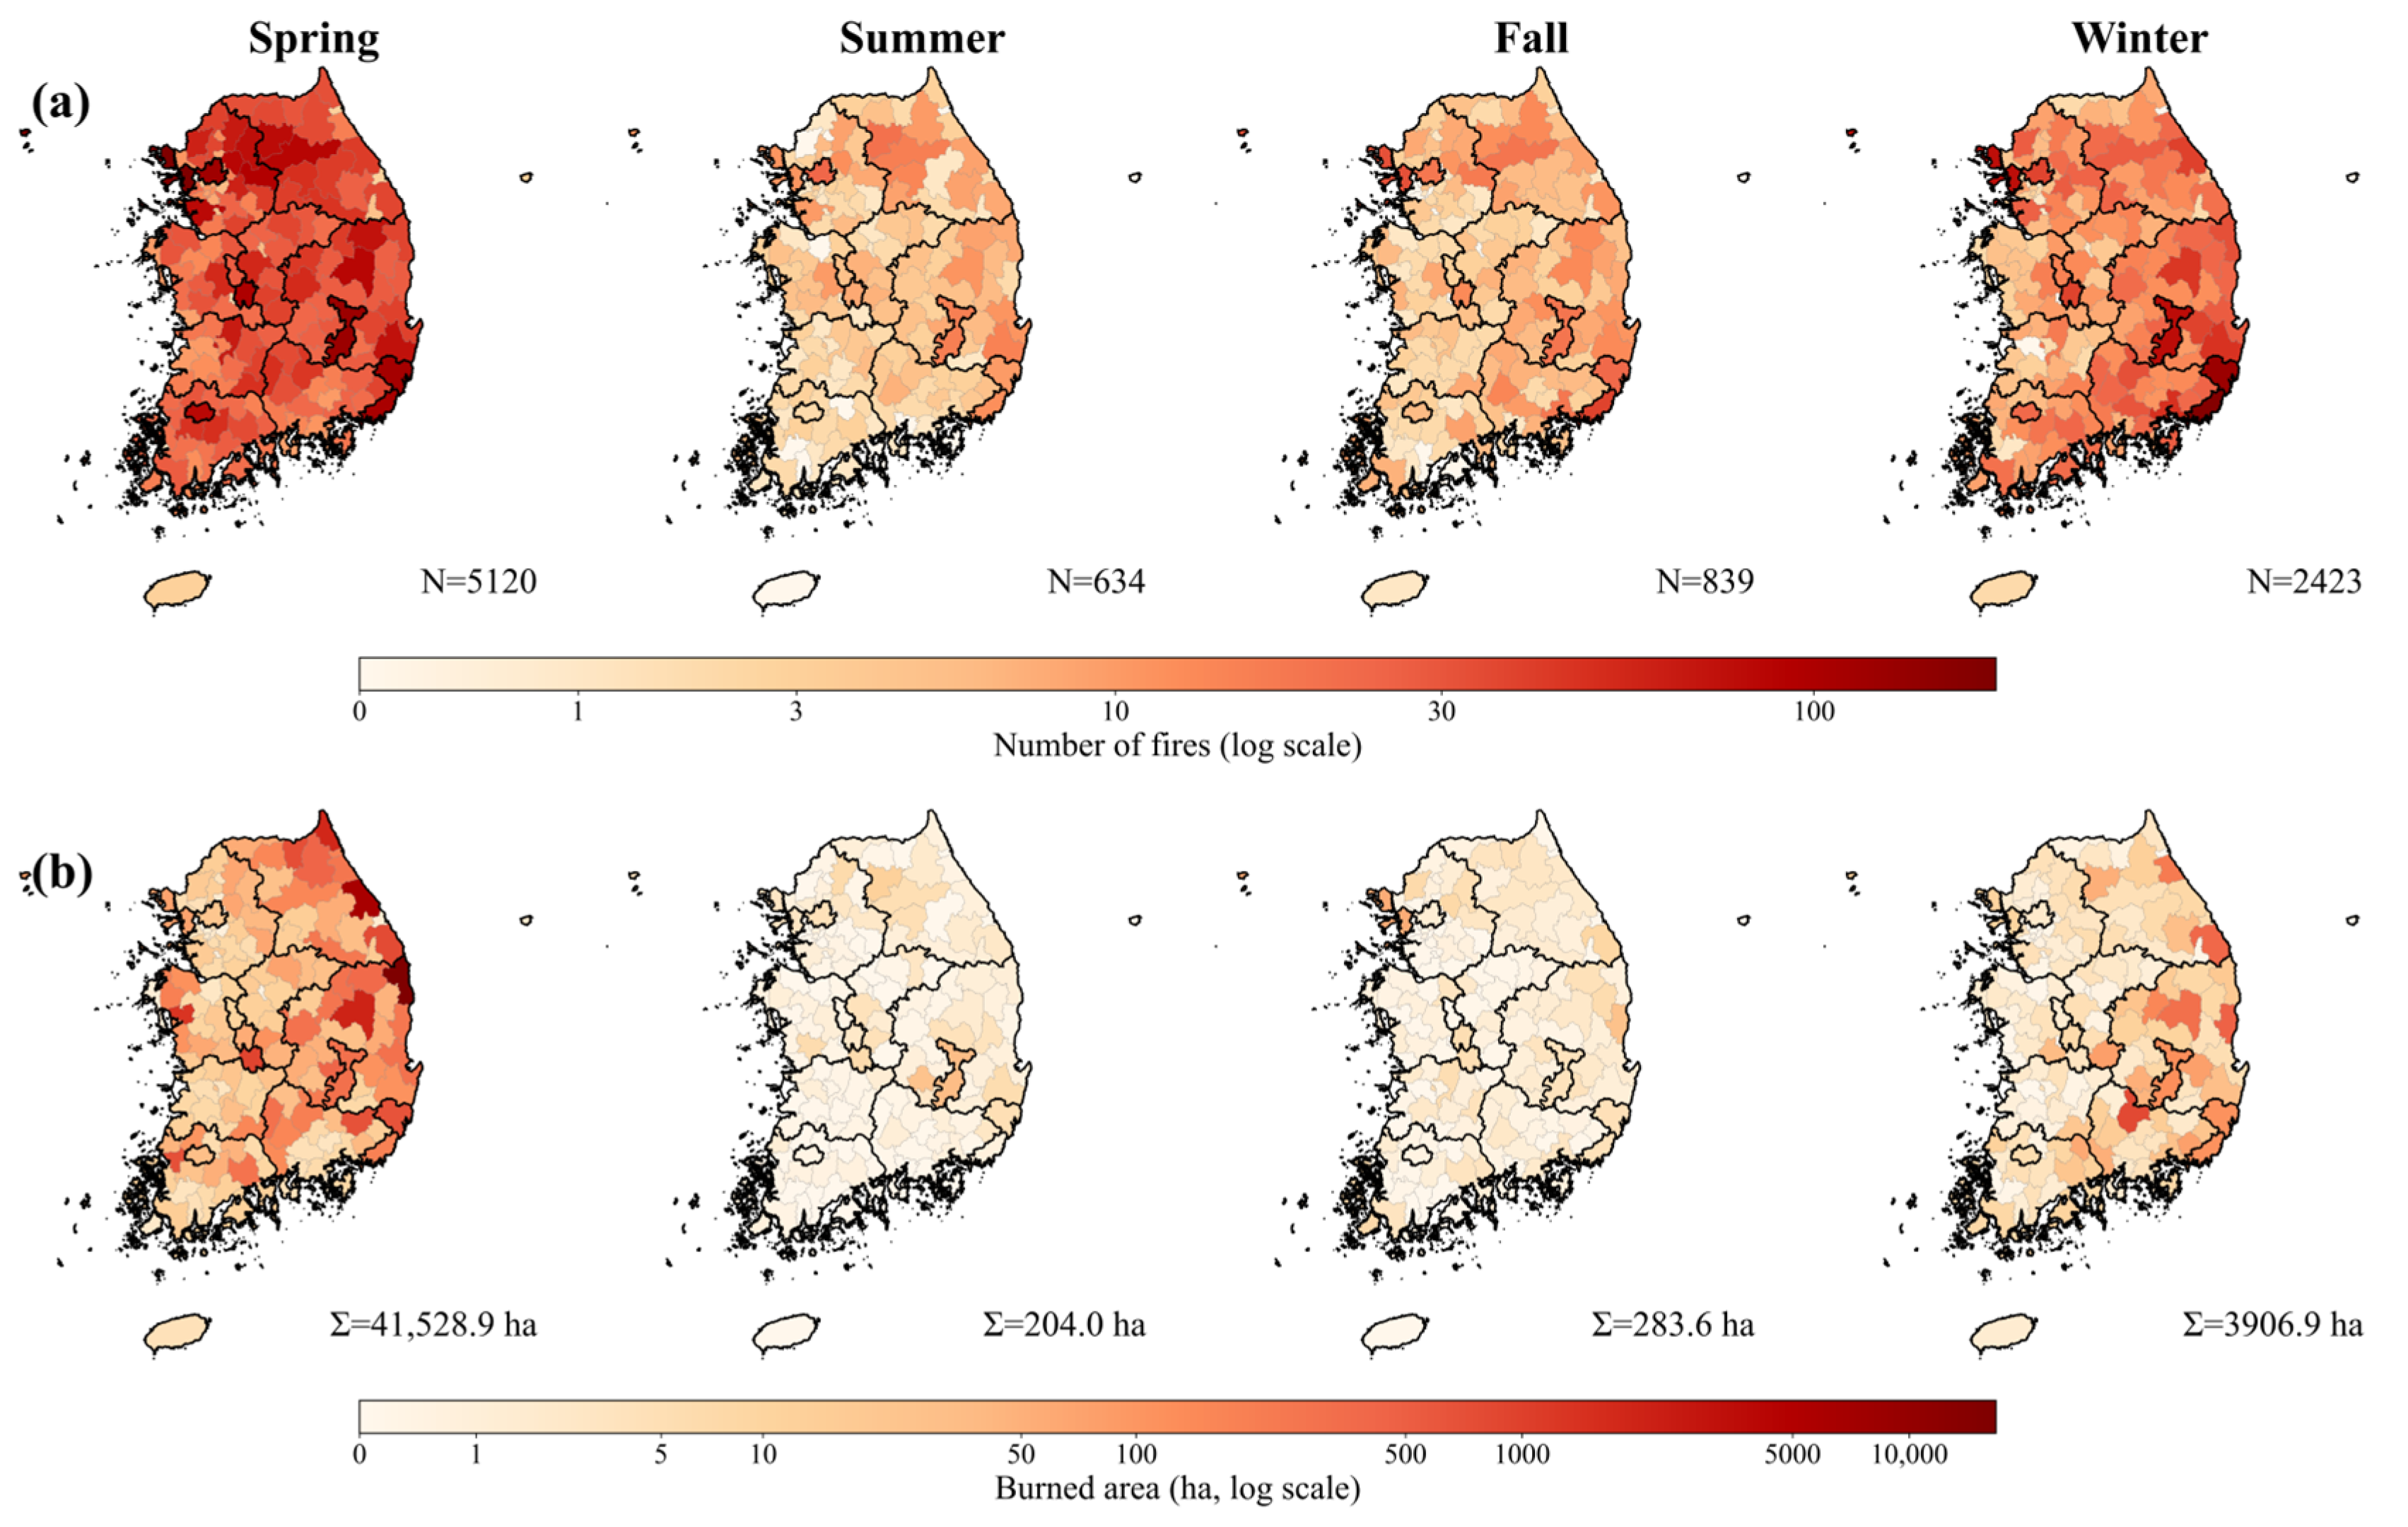
Over the study period from 2004 to 2023, wildfire occurrence in South Korea exhibited clear seasonal variation in both fire frequency and burned area (Figure 5). Fire counts were highest in spring, peaking in March and April, and remained relatively elevated in winter months (January, February, and December). Burned area was also greatest in spring, particularly in March, whereas winter fires were associated with comparatively smaller burned areas despite their frequency.
The spatial distribution of wildfires varied by season (Figure 6). Spring and winter both showed widespread fire occurrence across the country. Fire occurrence was notably concentrated in metropolitan and surrounding areas across all seasons.

3.2. Probabilistic Modeling of Wildfire Occurrence Based on FWI

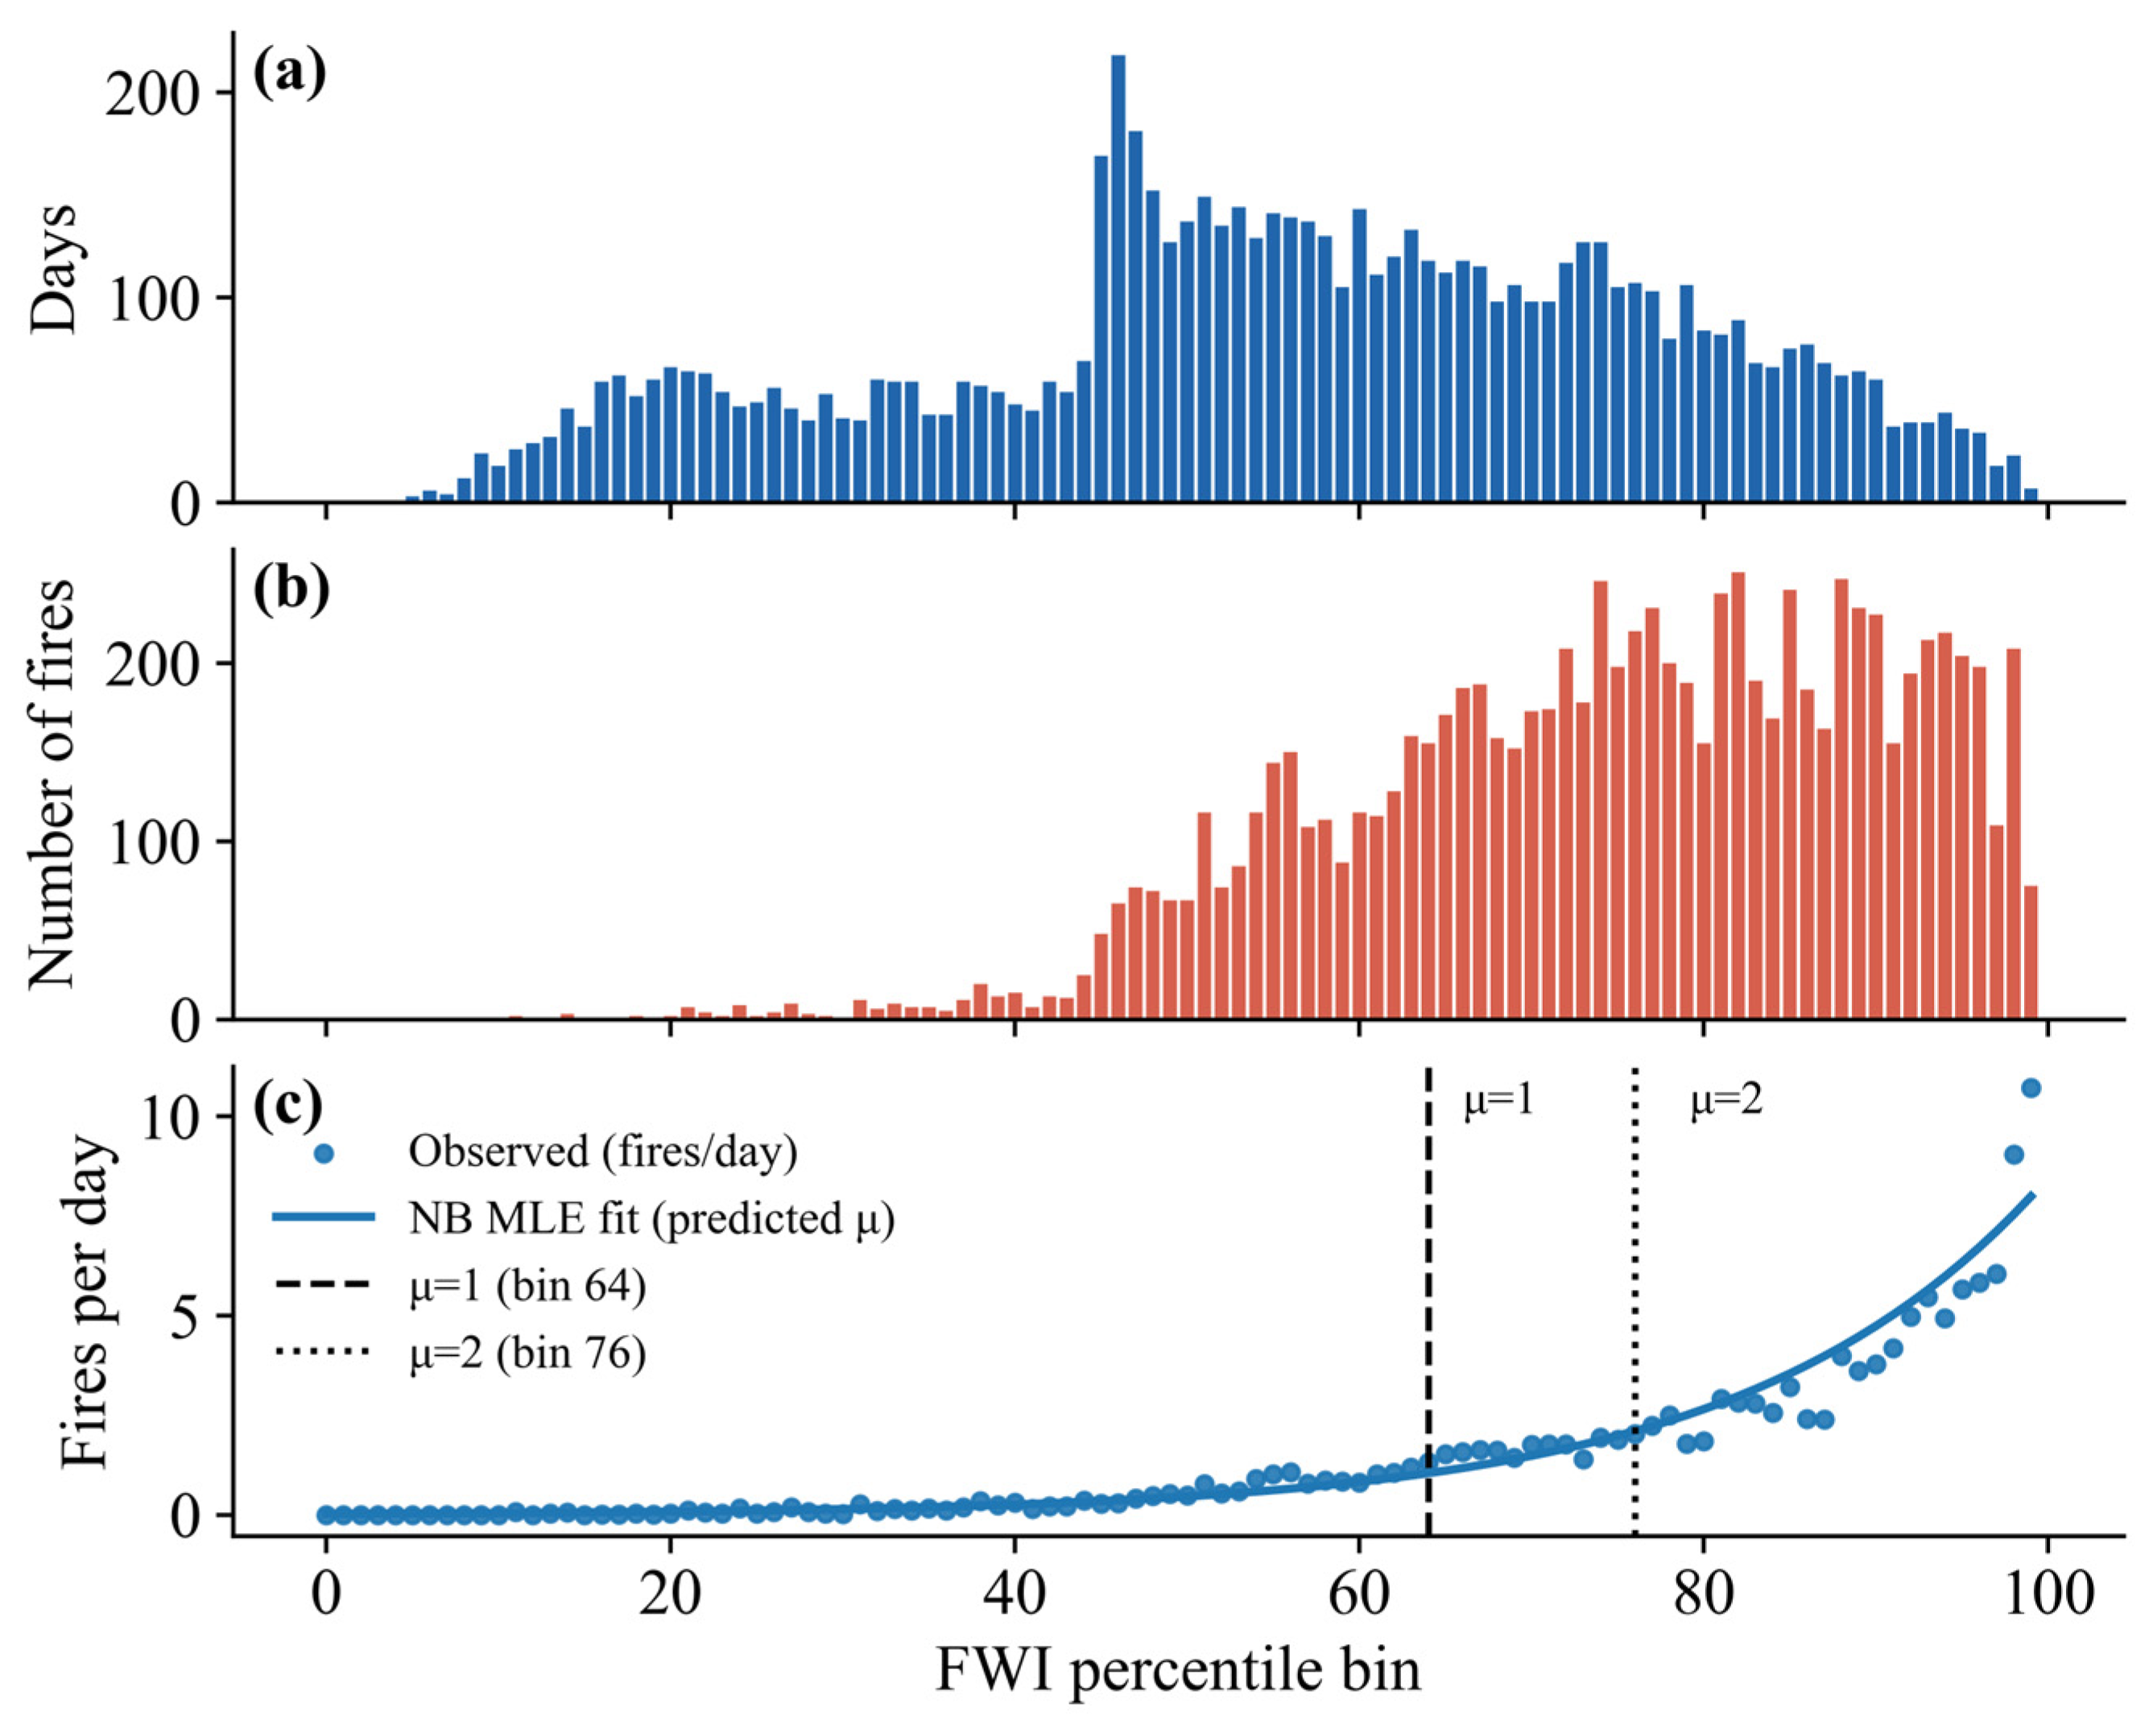
The cumulative distribution of FWI from 2004 to 2023 served as the baseline for normalizing weather severity into 100 percentile-based bins. The FWI values corresponding to the 50th, 80th, and 95th percentiles were 1.89, 7.80, and 13.82, respectively.
The NB maximum likelihood estimation revealed a statistically significant positive relationship between the FWI percentile bin and the daily fire occurrence rate (p < 0.001, Pseudo R2 = 0.29). The model effectively accounted for the overdispersion inherent in wildfire count data, as evidenced by the estimated α parameter. Based on the regression results, specific FWI thresholds were derived where the expected daily fire frequency ( μ ) reached critical levels of 1.0 and 2.0 fires day−1. The expected fire rate exceeds 1.0 fire day−1 when the FWI surpasses 4.39 (corresponding to the 64th percentile bin) and escalates to 2.0 fires day−1 when the FWI reaches 6.84 (the 76th percentile bin) (Figure 7).
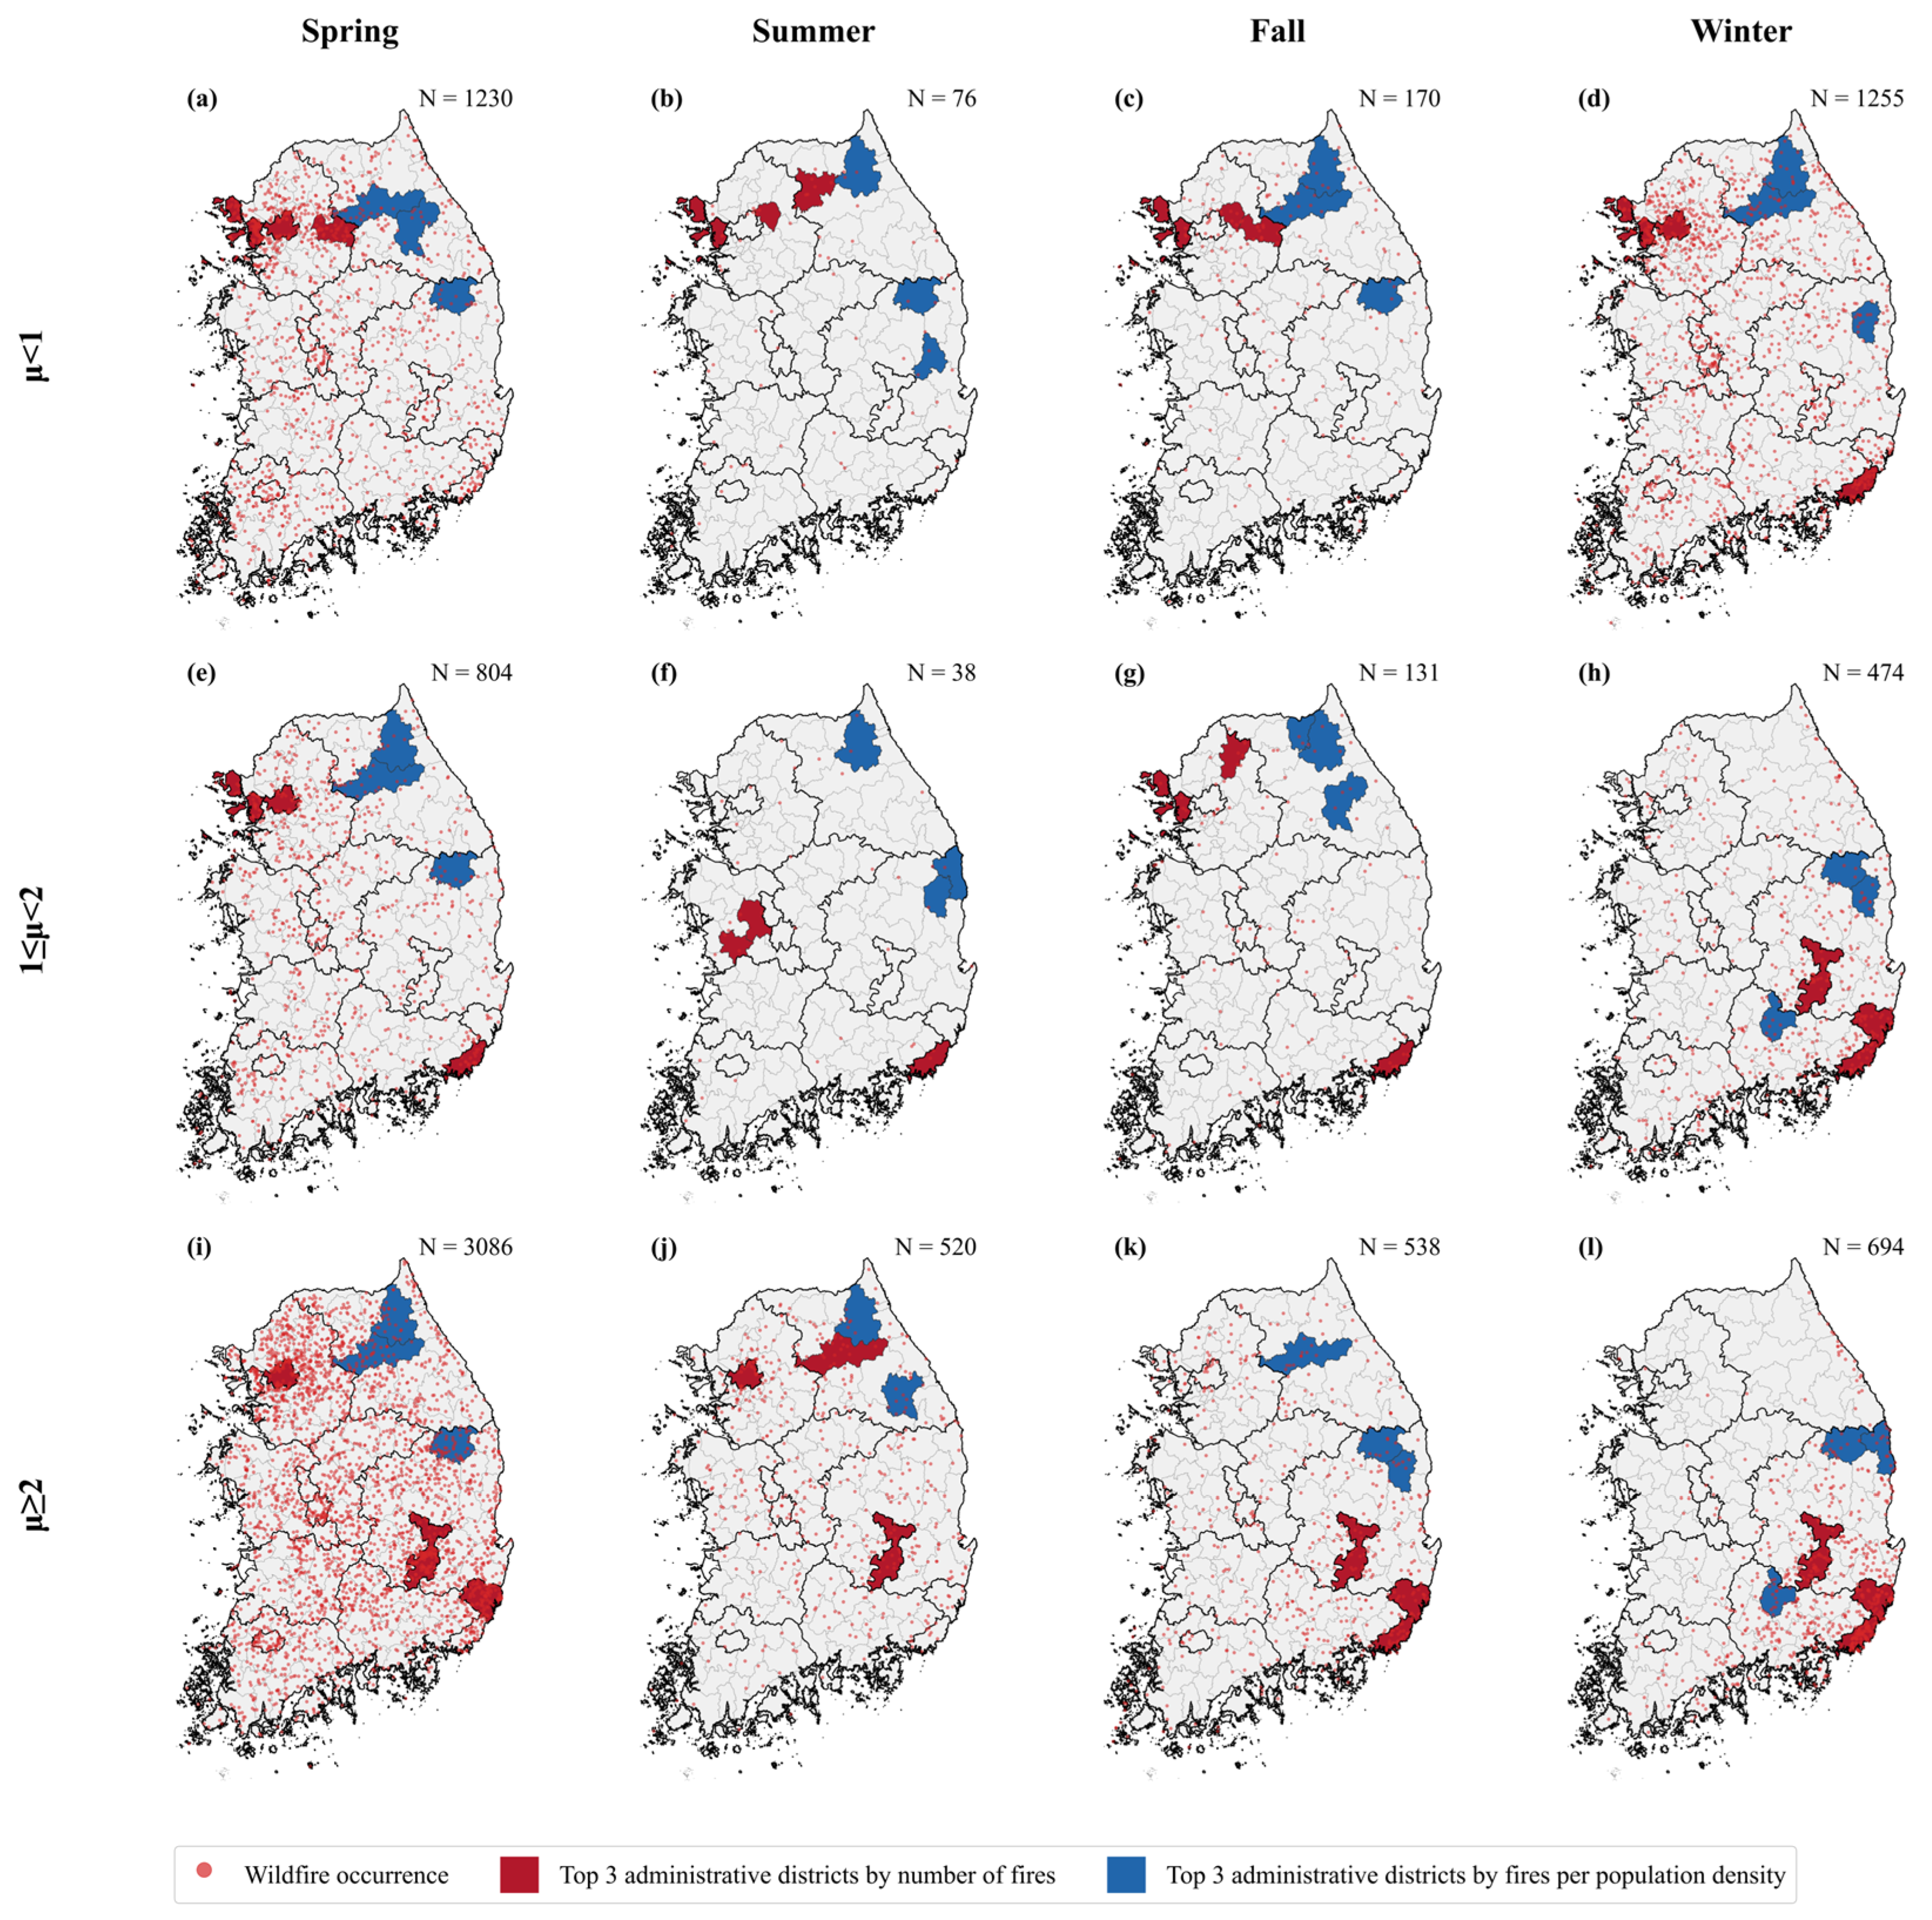
Spatial validation across seasons demonstrated that actual fire events are heavily concentrated in the higher FWI percentile bins, particularly during spring and winter. As μ increased, spatial clusters of fire occurrences became more pronounced in the Seoul Metropolitan Area. In all seasons except winter, wildfire counts were highest when μ ≥ 2. In winter, however, the greatest number of fires occurred when μ < 1. Wildfires occurring when μ ≥ 2 in winter were geographically concentrated in Gyeongsangbuk-do and Gyeongsangnam-do, whereas fires when μ < 1 were distributed broadly across the country (Figure 8).
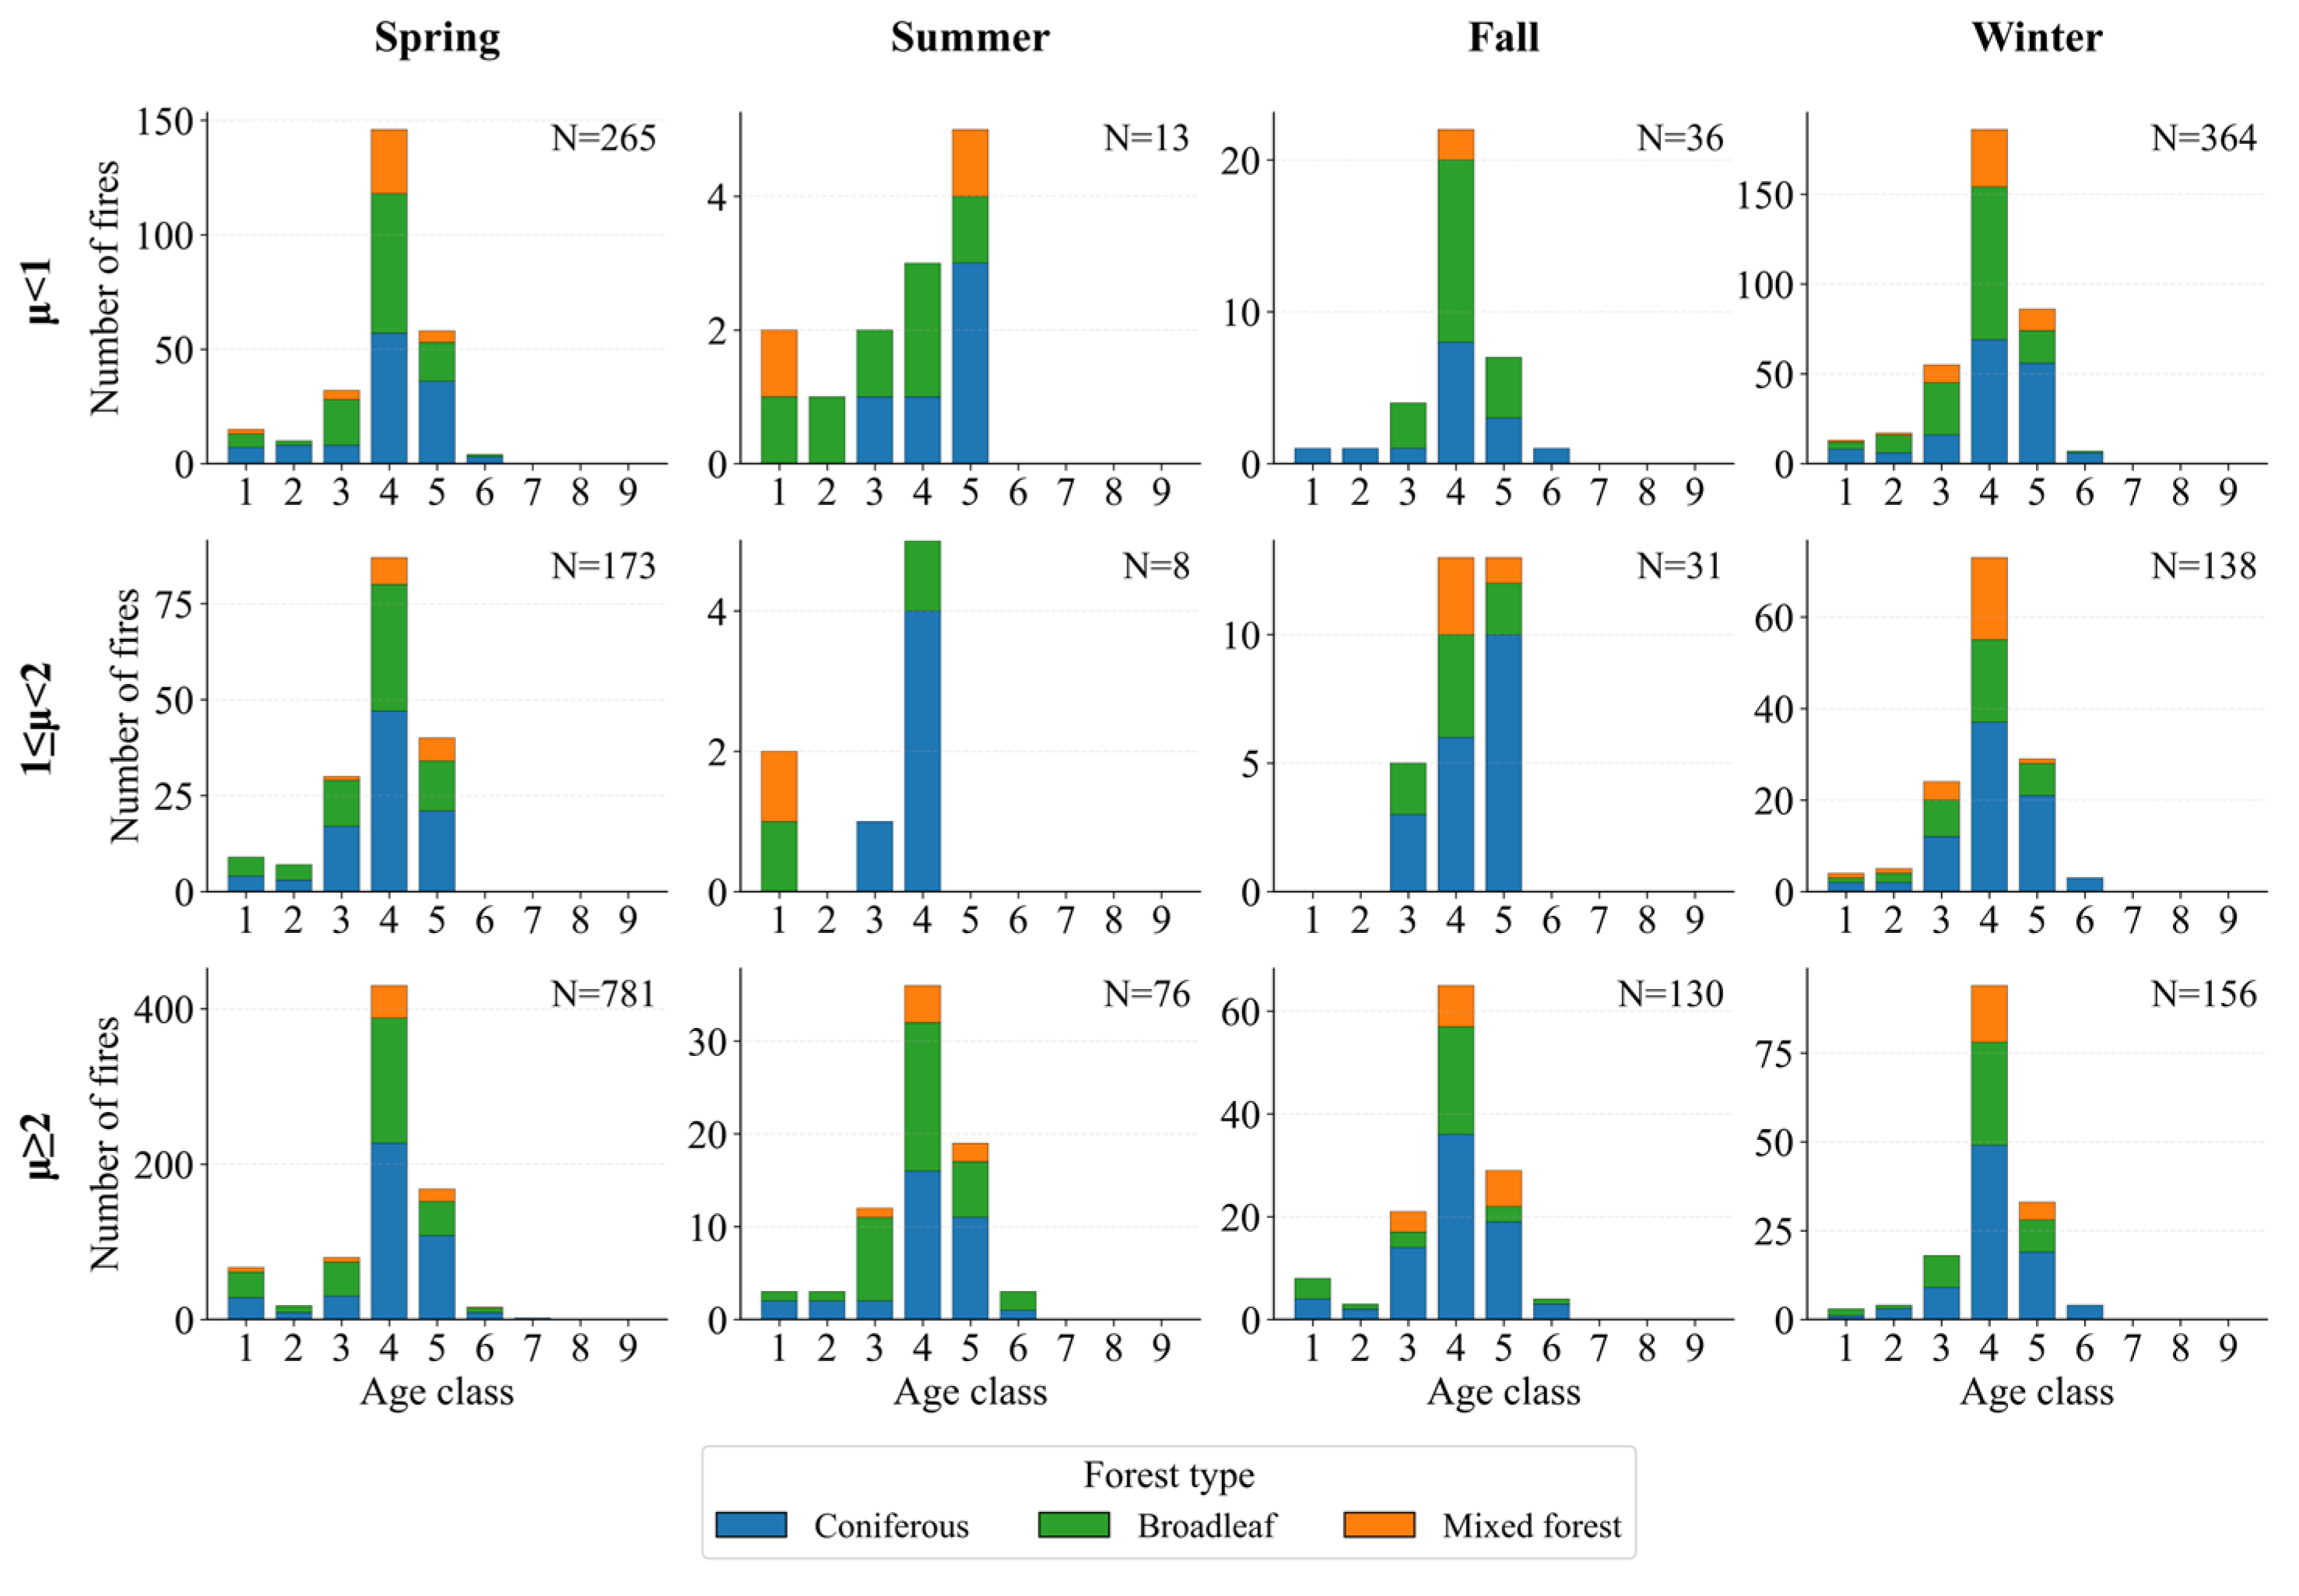
The structural characteristics of forests affected by wildfires were further analyzed by age class and forest type across seasons and daily fire rate class ( μ ). Wildfires were most frequent in forest stands of age classes 4 and 5 (age class 4: 31–40 years, age class 5: 41–50 years), with coniferous and broadleaf forests being vulnerable across all seasons (Figure 9).
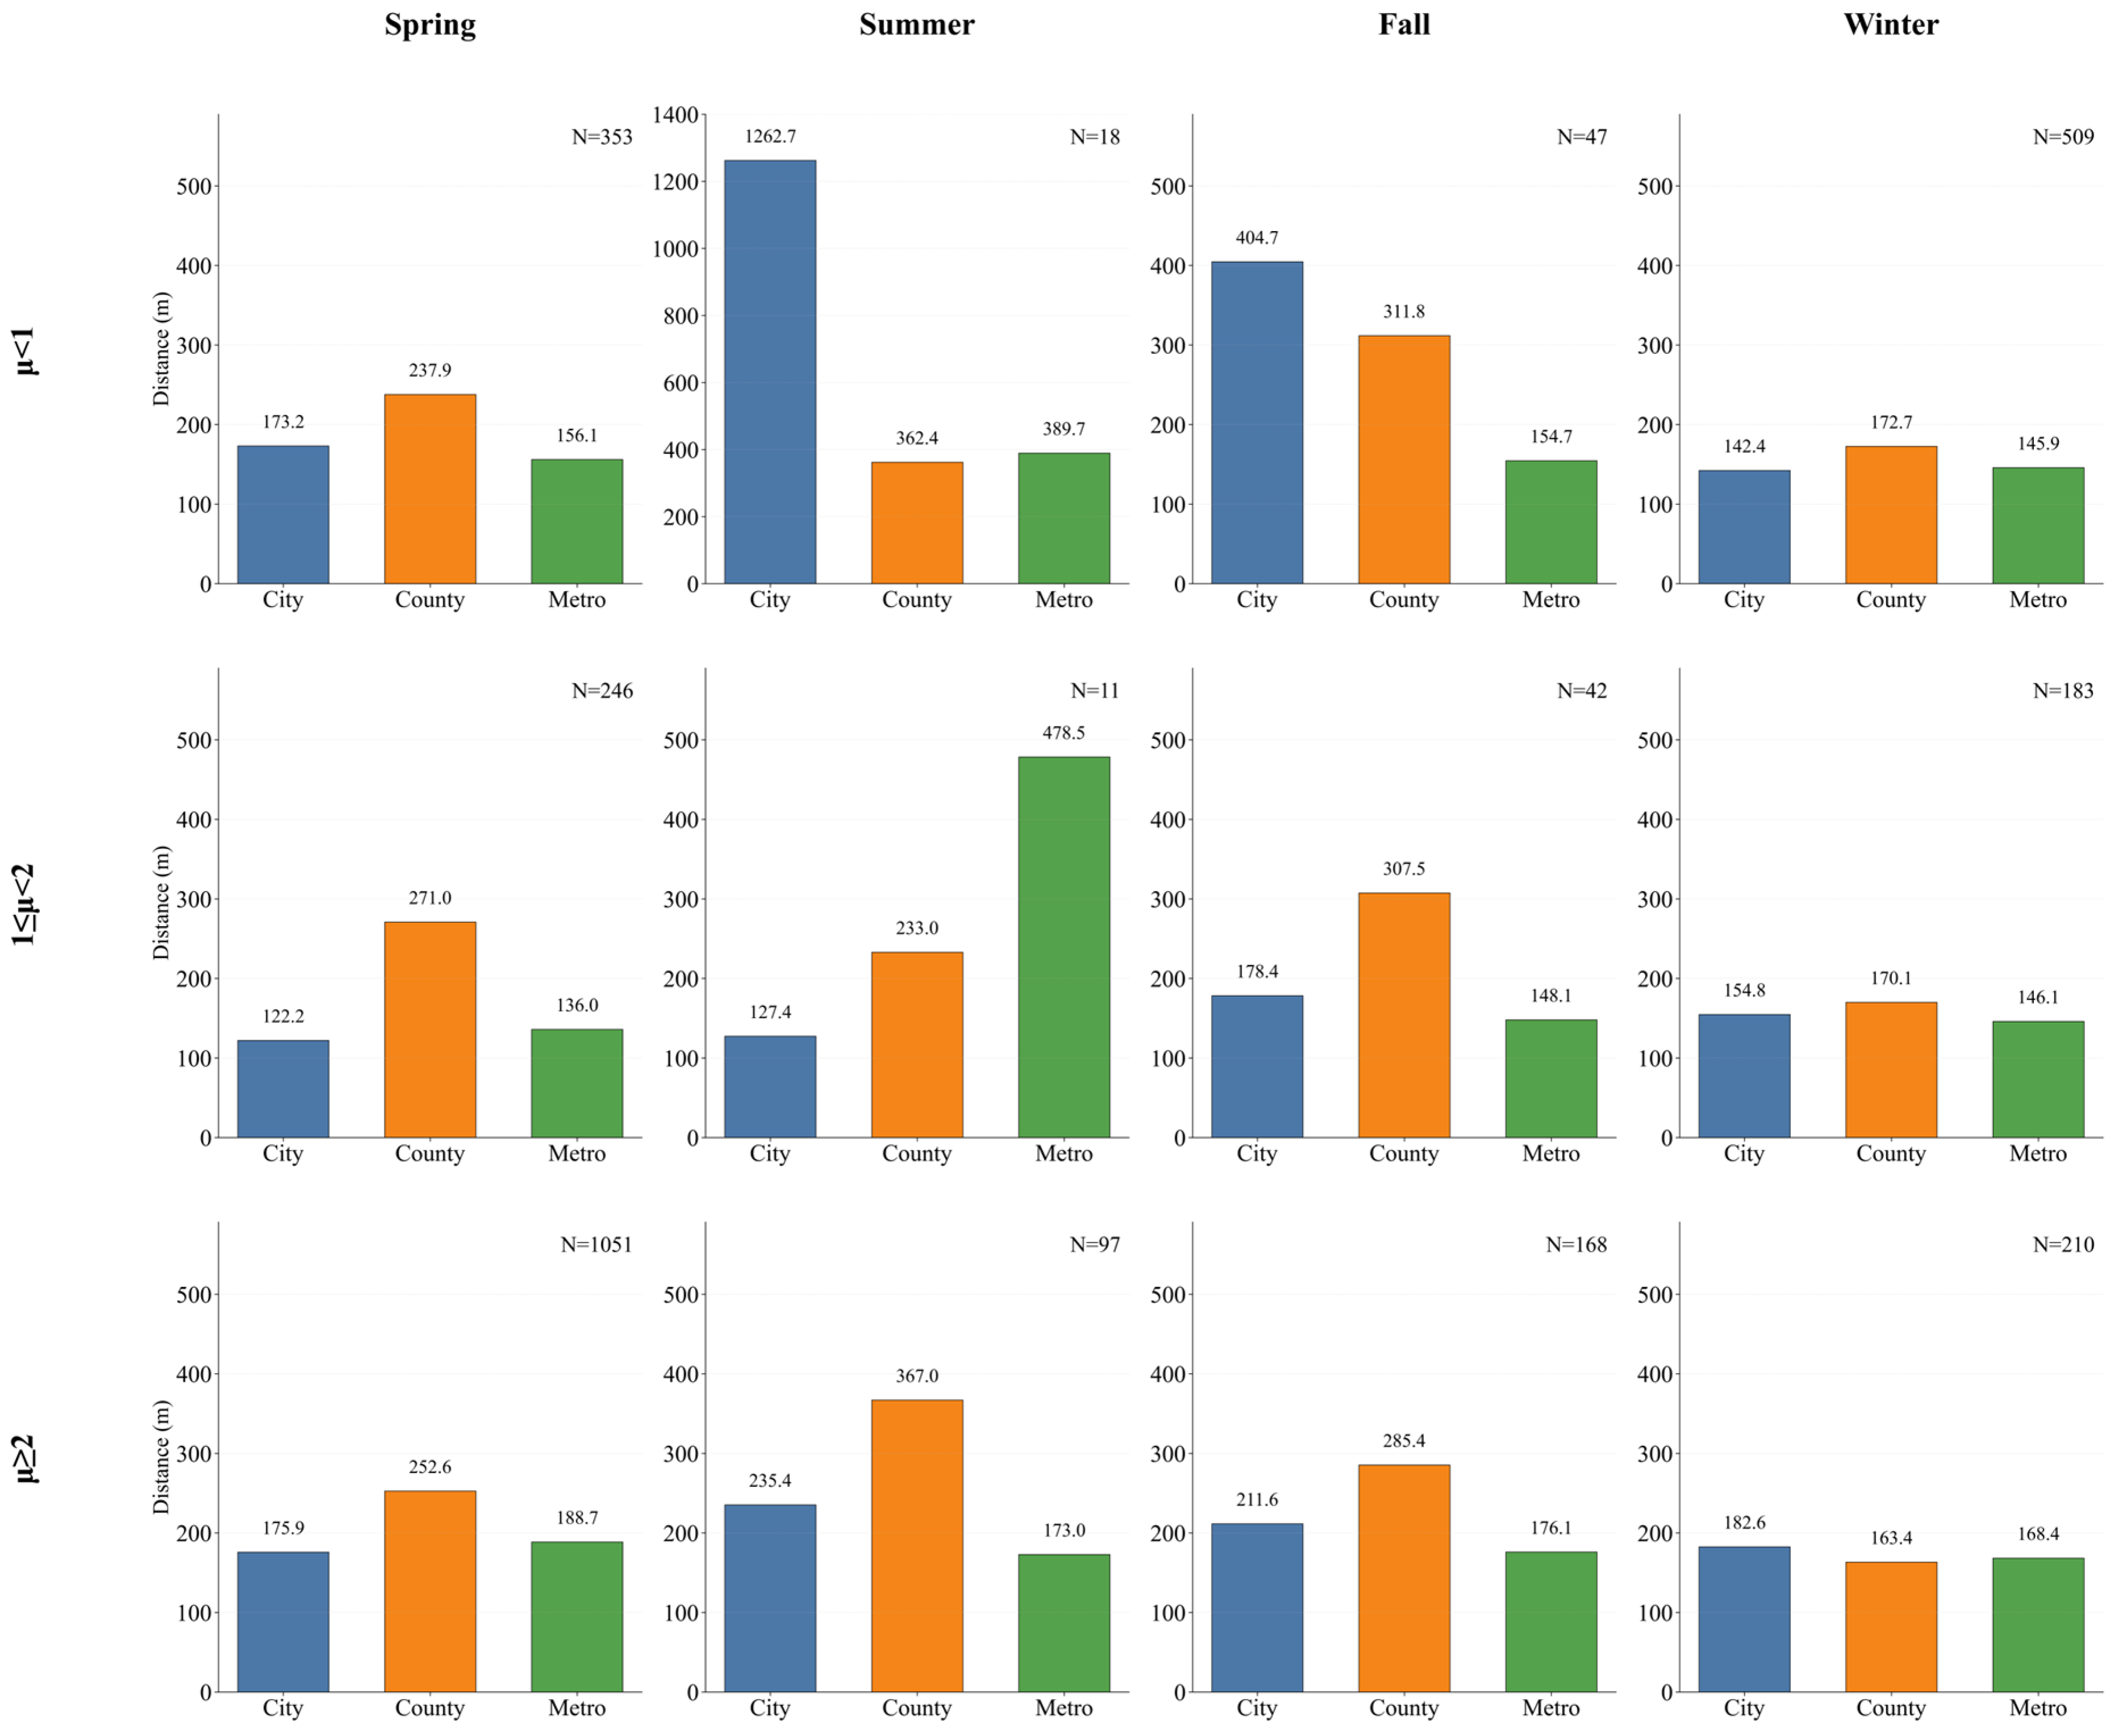
To assess the potential for WUI disasters, the mean distance from ignition points to the nearest building was analyzed (Figure 10). Across most seasons and risk levels, County areas exhibited the greatest mean distance, often exceeding 200 m, whereas City and Metropolitan areas showed significantly closer proximity. Notably, during spring and winter, the mean distance in Metropolitan areas often dropped below 150 m, indicating a heightened risk of fire transition from forests to residential structures.

3.3. Spatial Association and Ignition Causes via Bivariate LISA Analysis

The bivariate LISA analysis revealed distinct spatial clustering patterns (Figure 11). HH clusters were predominantly observed in the fringes of the Seoul Metropolitan Area and major metropolitan centers, reflecting the direct impact of dense human settlements on fire occurrence. LH clusters were prominently located in the mountainous regions of Gangwon-do, Gyeongsangbuk-do, and Gyeongsangnam-do—spatial outliers where wildfire frequency cannot be explained solely by residential population density, suggesting the influence of transient populations.
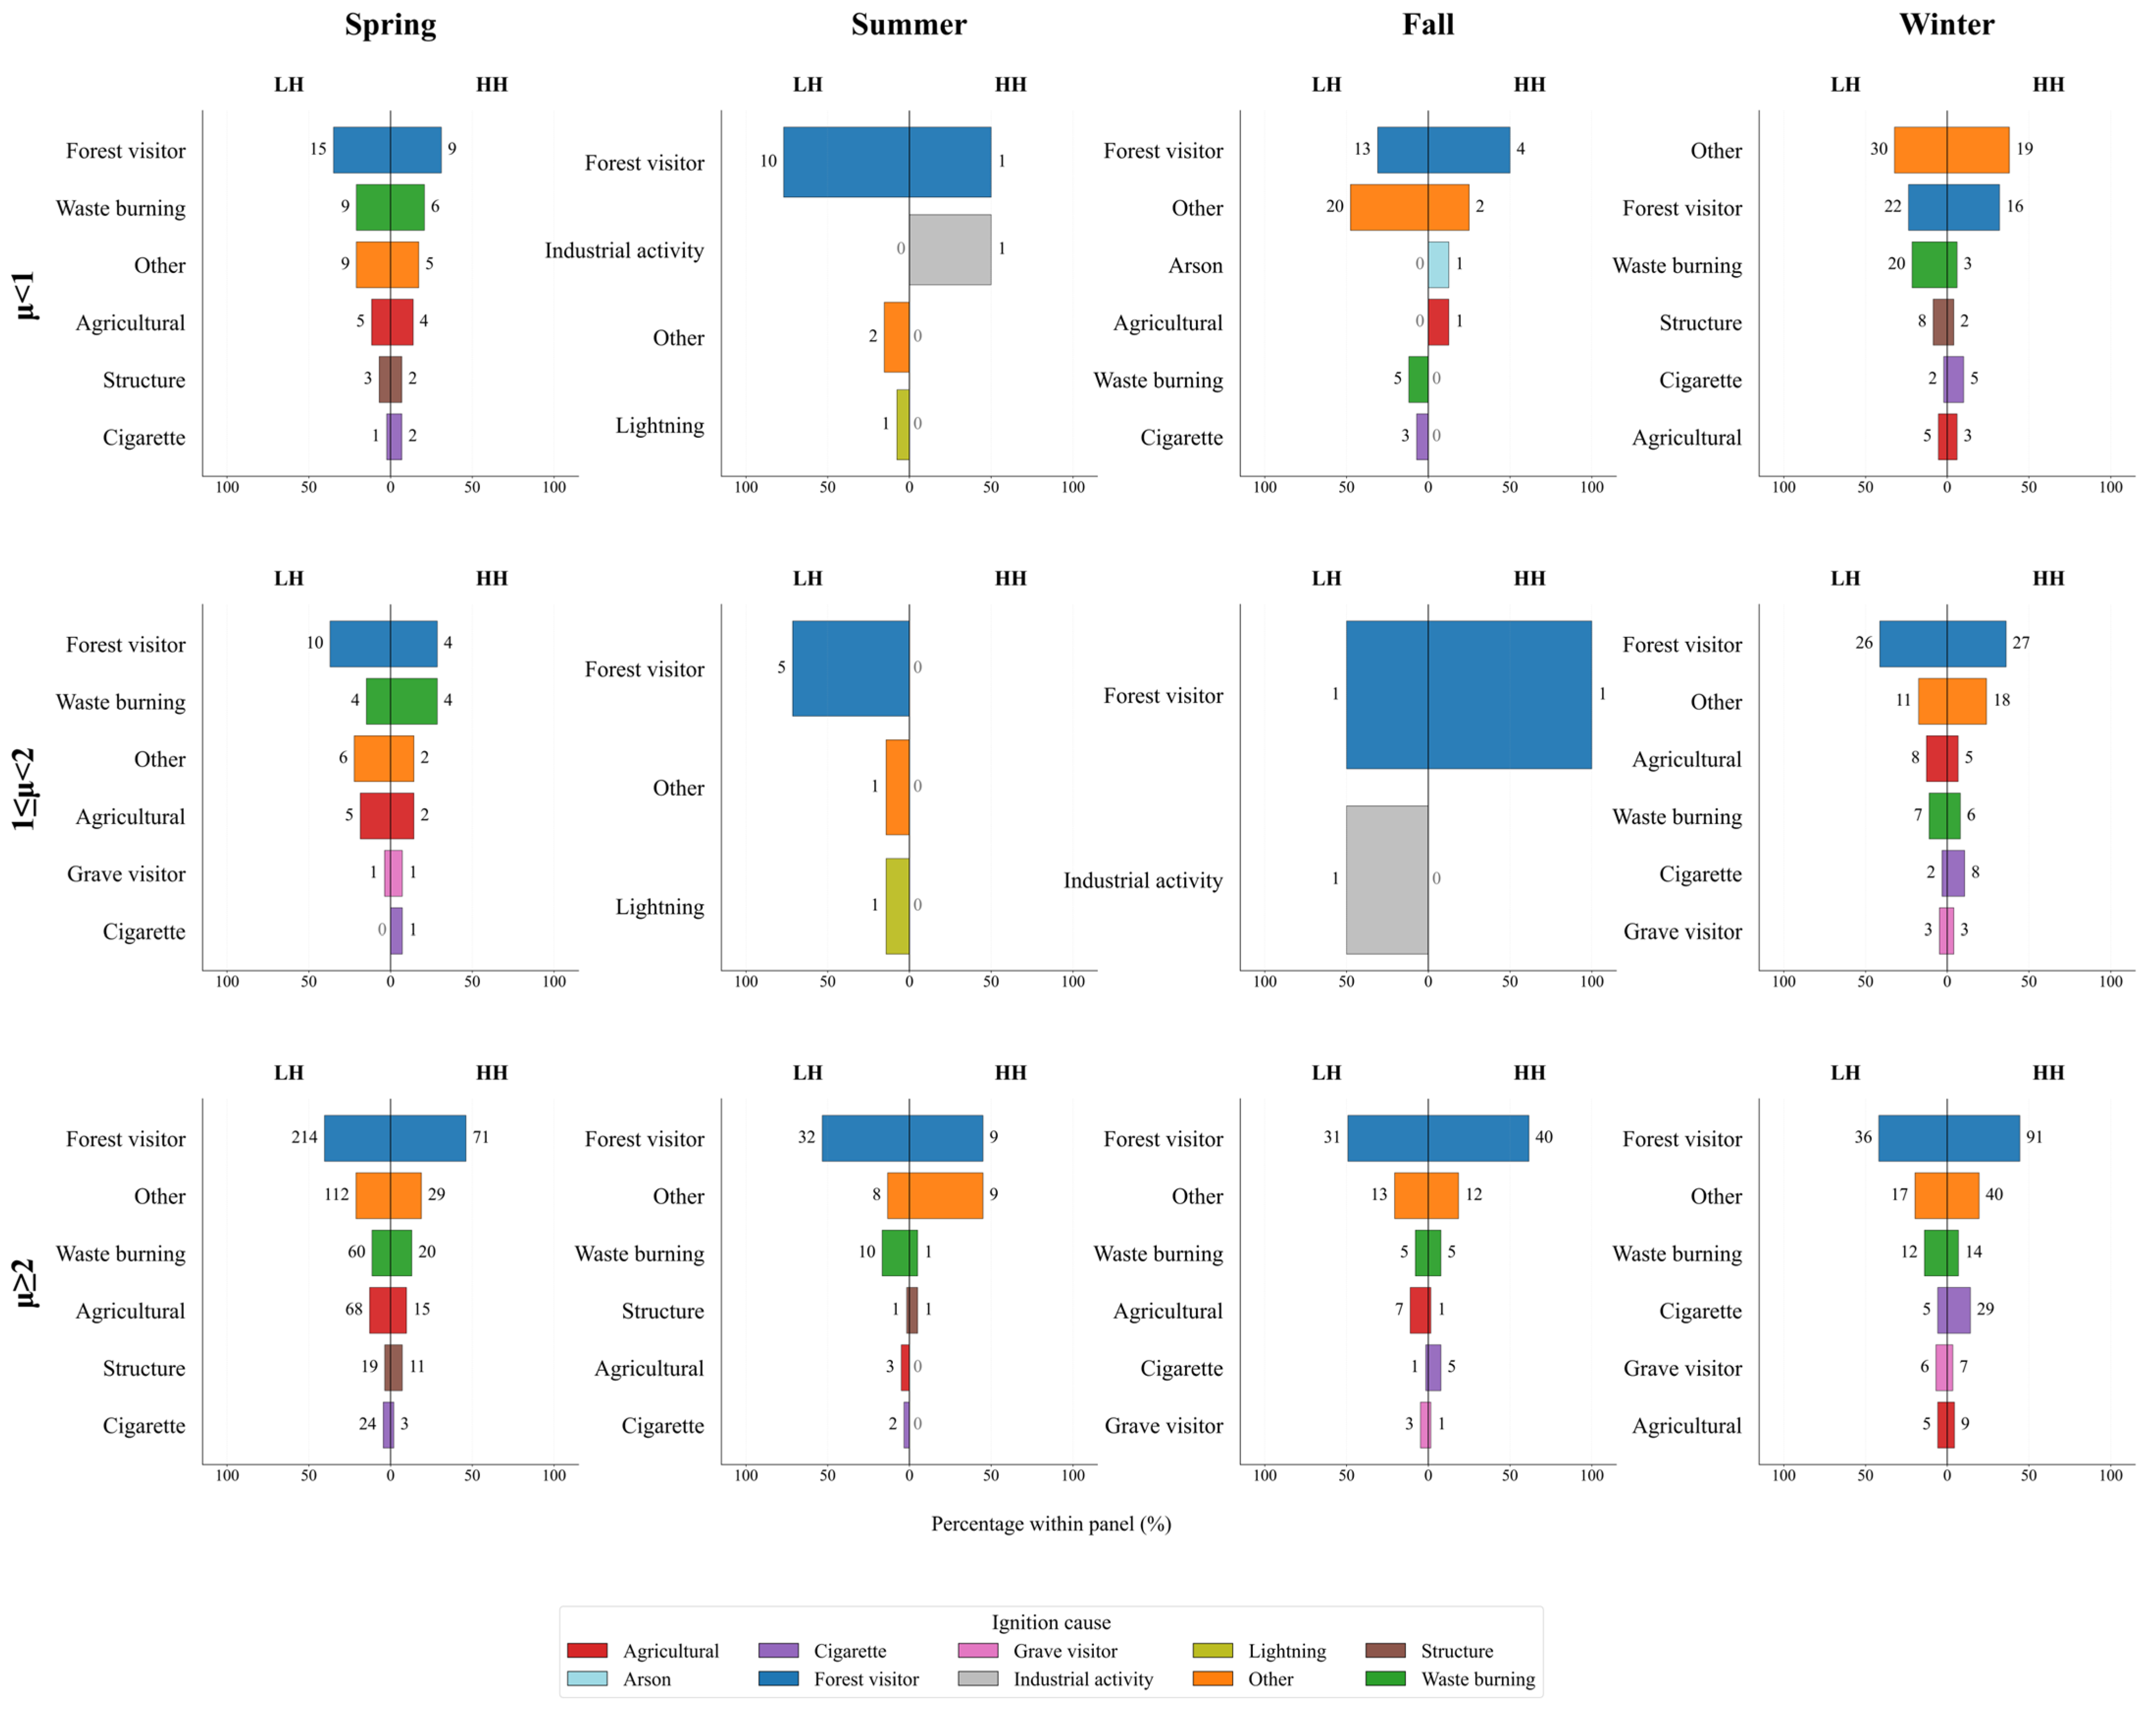
A comparative analysis of ignition causes within clusters highlighted socio-demographic differences in fire causality (Figure 12). In LH clusters, despite low residential density, fire occurrences were primarily driven by forest visitor ignitions, followed by waste burning and agricultural burning. In contrast, HH clusters showed a higher relative frequency of cigarette-related ignitions compared to LH regions.
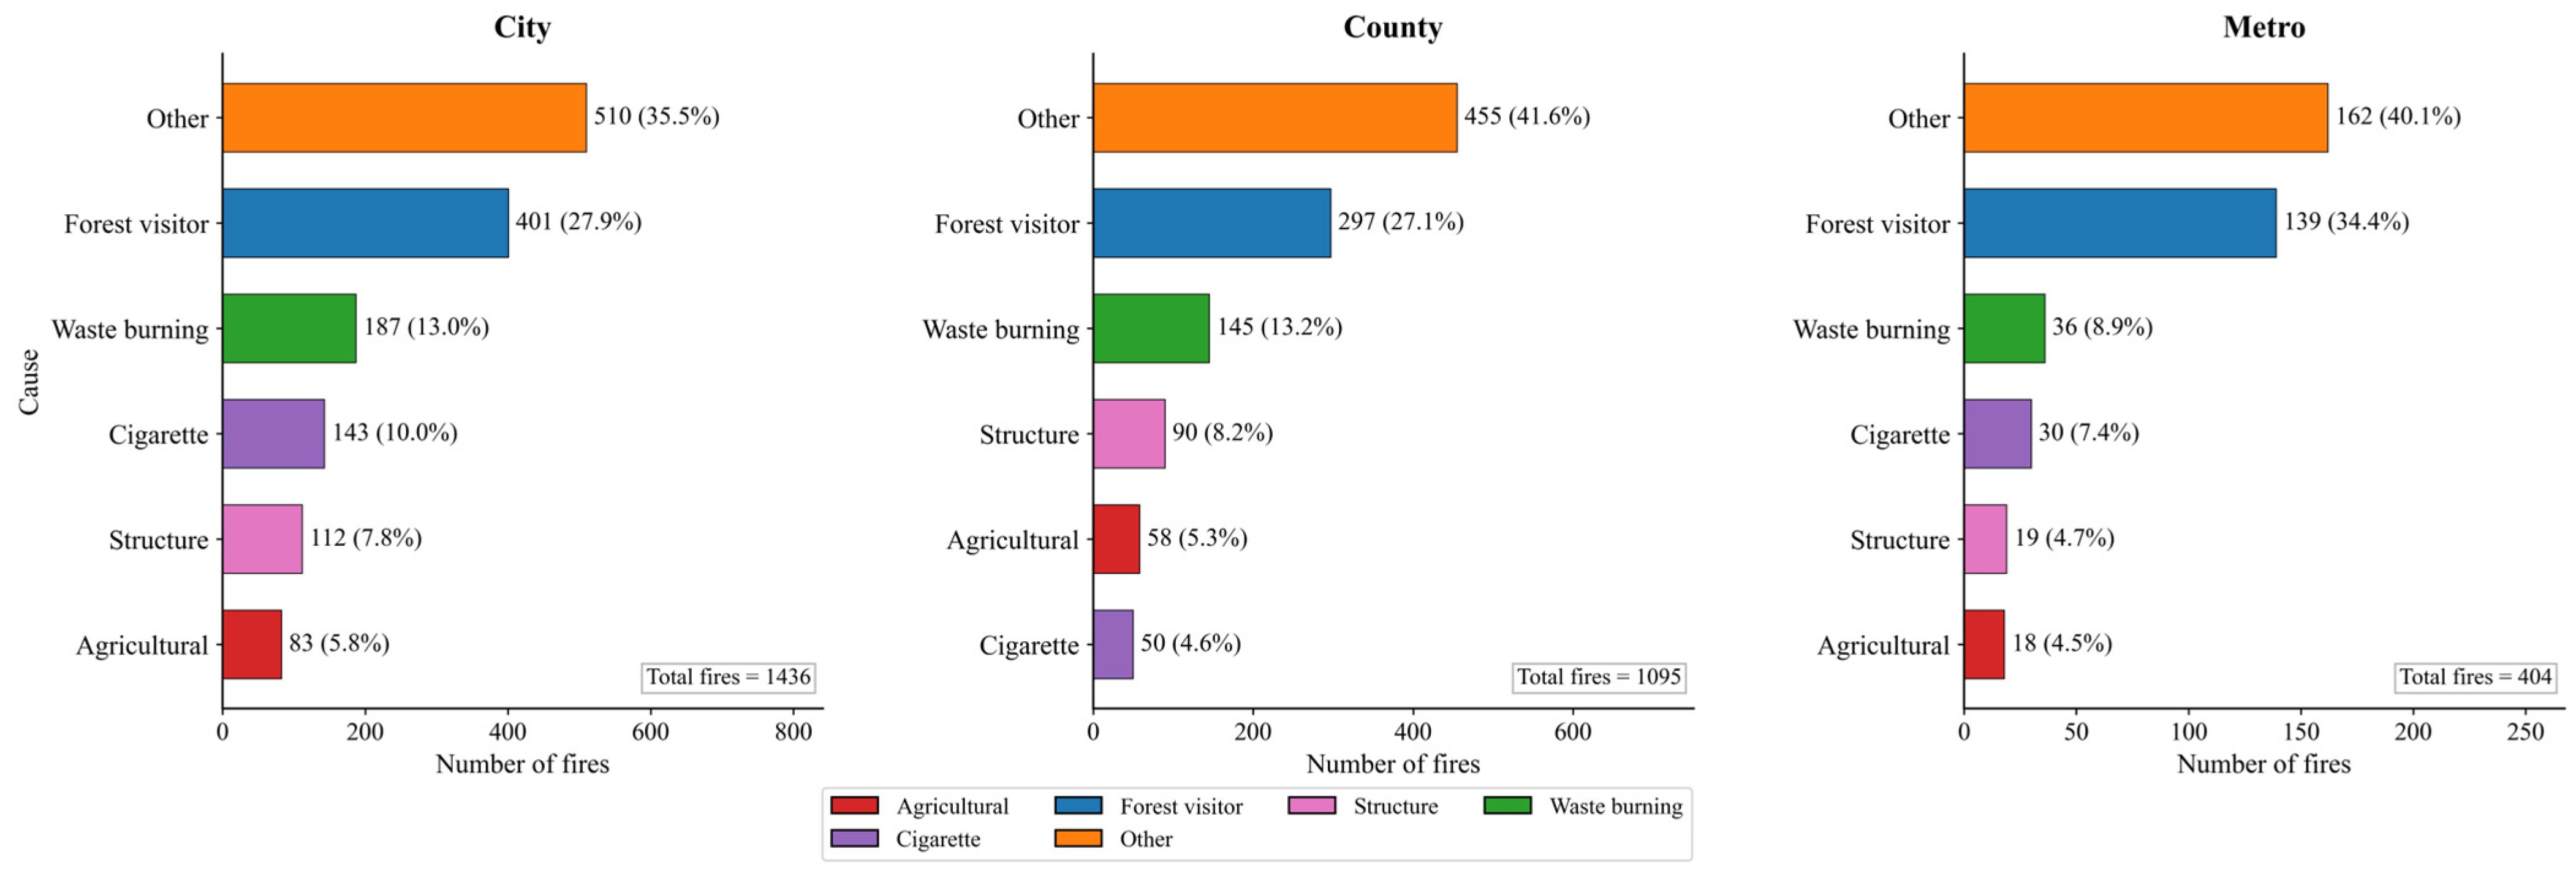
This pattern is further supported by the ignition cause distribution across administrative types based on the most recent five years of records (Figure 13). Across all three administrative types, Other and Forest visitor consistently ranked as the top two ignition causes, together accounting for over 60% of wildfires in each type. County areas were characterized by a higher proportion of structure fires (8.2%) and agricultural burning (5.3%) compared to City (7.8% and 5.8%, respectively) and Metropolitan areas (4.7% and 4.5%), reflecting the land-use composition of rural municipalities. Cigarette-related ignitions accounted for the highest share in City areas (10.0%), followed by Metropolitan areas (7.4%) and County areas (4.6%). These findings indicate that the specific anthropogenic activities driving wildfire ignitions differ systematically by degree of urbanization and administrative type, reinforcing the spatial patterns identified in the LISA cluster analysis.

4. Discussion

4.1. Spatial Mismatch and the Role of Transient Populations

A primary contribution of this research is the identification of LH spatial clusters, which reveal a significant mismatch between residential population density and wildfire frequency. While traditional fire risk models often assume a positive correlation between resident density and ignition probability, the prevalence of LH clusters in mountainous provinces such as Gangwon and Gyeongsang suggests that wildfires in these regions are driven by non-residential factors. This pattern is consistent with findings from other regions where recreational activity and agricultural land use are associated with elevated ignition rates independent of residential population [31,32].
The ignition cause analysis within LH clusters provides empirical evidence for this interpretation, showing a dominant influence of forest visitor ignitions (e.g., hikers) and agricultural practices (waste and agricultural burning) rather than residential accidents. This implies that fire management strategies in sparsely populated forest zones should shift from resident-oriented education toward targeted regulation of transient populations and management of forest–farm interfaces [33]. In particular, the concentration of agricultural burning ignitions in LH clusters highlights the importance of spatially and temporally differentiated open-burning regulations tied to fire-weather conditions [34].

4.2. Urbanization and the Heightened Risk of WUI Disasters

In contrast to the LH patterns, HH clusters in metropolitan fringes highlight the vulnerability of the WUI [35]. The proximity analysis revealed that the mean distance from ignition points to buildings is shorter in Metropolitan and City areas—often less than 150 m—compared to rural Counties. Short ignition-to-structure distances reduce the time available for suppression response and increase the likelihood of fire transition to structures through direct flame contact or ember transport [36].
This spatial closeness, combined with the higher relative frequency of cigarette-related ignitions and structure-to-forest fire transitions in urbanized districts, indicates that even a single ignition event can result in significant structural and socio-economic losses under high-FWI conditions. WUI management in metropolitan areas should emphasize establishing defensible space buffers, reducing structural ignitability through ember-resistant retrofitting, and ensuring adequate pre-positioned suppression capacity [36]. Home ignitability rather than landscape-level fuel management may be the more tractable intervention in densely built WUI zones.

4.3. Meteorological Thresholds and Forest Vulnerability

The probabilistic modeling using NB regression established critical FWI thresholds that provide a data-driven basis for escalating fire danger classifications [37,38]. The concentration of fire in age 31–40 years and 41–50 years forests during high-risk periods (μ ≥ 2) is consistent with the general pattern that older forests accumulate greater surface and ladder fuel loads, increasing both ignition probability and fire spread potential under drying conditions [39]. This suggests that forest restoration and thinning projects should consider stand age in addition to spatial location when prioritizing interventions within high-risk LISA clusters [40]. The seasonal intensification observed in spring and winter indicates that meteorological severity can amplify the underlying anthropogenic risks identified in the HH and LH clusters, particularly where age 31–40 years and 41–50 years forest fuel conditions are also unfavorable.

4.4. Implications for Wildfire Prevention Policy

The spatial mismatch identified by the bivariate LISA analysis has direct implications for resource allocation. In LH cluster municipalities, the dominant role of forest visitor ignitions and agricultural burning suggests that prevention programs should target visitor management, trailhead monitoring, and regulation of open burning practices [32]. Seasonal restriction of agricultural burning during high-FWI periods may be particularly effective in these areas. In HH cluster municipalities, where ignitions occur in close proximity to residential buildings, efforts should focus on WUI-specific measures, including defensible space requirements, ember-resistant retrofitting, and pre-positioned suppression resources [41,42].
The concentration of wildfire in age 31–40 years and 41–50 years coniferous stands supports targeted forest management interventions in high-priority spatial clusters. Thinning treatments and species diversification in coniferous stands within or adjacent to HH and LH cluster areas may reduce fire behavior potential under high-FWI conditions, though such measures require evaluation of feasibility and cost-effectiveness at the landscape scale [43]. Forest management interventions complement behavioral and regulatory prevention approaches but are unlikely to substitute for them given the predominantly anthropogenic origin of ignitions in South Korea.

4.5. Limitations and Future Research

While this study provides a useful framework for spatial fire risk assessment, several limitations should be noted. The use of administrative boundaries as the unit of analysis may mask finer-scale spatial variations within a single municipality. Additionally, while the bivariate LISA identified spatial associations, further longitudinal studies are required to establish causal links between specific transient population flows and ignition events. Future research should integrate real-time mobile signal data or transportation flux data to more precisely quantify the spatial footprint of non-resident populations in LH clusters [44]. Incorporating visitor count data from national parks and trail systems may also improve the accuracy of ignition risk assessments in mountainous LH regions [45]. Furthermore, a multi-variable spatial analysis incorporating road network accessibility, trail density, and recreational land use could provide a more mechanistic explanation for ignition patterns in remote and mountainous areas, moving beyond the structural residential population metrics employed in the present study.

5. Conclusions

This study quantitatively identified the complex interactions between meteorological factors and socio-demographic variables and their combined impact on wildfire occurrence patterns throughout South Korea. By constructing a probabilistic model using 20 years of long-term meteorological and wildfire data, this research established statistical thresholds (μ ≥ 1, μ ≥ 2) for daily wildfire frequency based on the FWI, providing an objective framework for assessing fire risk according to percentile changes in meteorological indices.
The bivariate LISA analysis clearly demonstrated a significant spatial discordance between residential population density and wildfire frequency. LH clusters in the mountainous provinces of Gangwon-do and Gyeongsang-do revealed that high fire frequency is driven by non-residential factors despite low resident density. The ignition cause analysis confirmed that recreational pressure from transient populations and traditional agricultural practices are the primary drivers in these LH regions. Conversely, HH clusters in metropolitan fringes underscored the extreme vulnerability of urbanized forest boundaries, where short ignition-to-building distances heighten the risk of socio-economic disasters.
Furthermore, the structural analysis of forest stands indicated that coniferous forests in age classes 4 and 5 exhibit the highest vulnerability across all seasons, with accumulated fuel loads increasing the probability of ignition and fire spread under high-danger meteorological conditions. These findings indicate that an effective wildfire management strategy should integrate not only meteorological alerts but also spatial cluster characteristics, regional ignition causes, and structural forest attributes into a unified spatial decision-support system.
In conclusion, this research provides a scientific foundation for a more precise wildfire forecasting and response system by spatially and statistically elucidating the anthropogenic ignition mechanisms in South Korea. Amid the increasing trend of large-scale wildfires due to climate change, the findings of this study are expected to serve as a critical policy guideline for minimizing human and property losses through evidence-based forest management and targeted administrative interventions.

Author Contributions

Conceptualization, C.J.L. and H.C.; methodology, C.J.L. and H.C.; software, C.J.L.; validation, H.C.; formal analysis, C.J.L.; investigation, C.J.L.; resources, C.J.L.; data curation, C.J.L.; writing—original draft preparation, C.J.L.; writing—review and editing, H.C.; visualization, C.J.L.; supervision, H.C. All authors have read and agreed to the published version of the manuscript.

Funding

This work was supported by the National Research Foundation of Korea (NRF) grant funded by the Korea government (RS-2023-NR076912), and the R&D Program for Forest Science Technology (Project No. RS-2024-00402624), provided by the Korea Forest Service (Korea Forestry Promotion Institute).

Institutional Review Board Statement

Not applicable.

Informed Consent Statement

Not applicable.

Data Availability Statement

The original contributions of this study are included in this article. Further inquiries related to the data can be directed to Chan Jin Lim at lim6581@kanwon.ac.kr.

Conflicts of Interest

The authors declare no conflicts of interest.

References

  1. Abatzoglou, J.T.; Kolden, C.A.; Cullen, A.C.; Sadegh, M.; Williams, E. Climate change has increased the odds of extreme regional forest fire years globally. Nat. Commun. 2025, 16, 6185. [Google Scholar] [CrossRef] [PubMed]
  2. Oliveira, A.P.; Gil Martins, P. Global shifts in fire regimes under climate change: Patterns, drivers, and ecological implications across biomes. Forests 2025, 17, 104. [Google Scholar] [CrossRef]
  3. Chang, D.Y.; Jeong, S.; Park, C.-E.; Park, H.; Shin, J.J. Unprecedented wildfires in Korea: Historical evidence of increasing wildfire activity due to climate change. Agric. For. Meteorol. 2024, 349, 109920. [Google Scholar] [CrossRef]
  4. Park, J.A.; Suh, J.-H.; Baek, M. Climatic and forest drivers of wildfires in South Korea (1980–2024): Trends, predictions, and the role of the wildland–urban interface. Forests 2025, 16, 1476. [Google Scholar] [CrossRef]
  5. Lee, C.; Choi, E.H.; Han, Y.; Lee, Y. Year-round daily wildfire prediction and key factor analysis using machine learning: A case study of Gangwon State, South Korea. Sci. Rep. 2025, 15, 15508. [Google Scholar] [CrossRef]
  6. Choi, S.; Son, M.; Kim, C.; Kim, B. A forest fire prediction model based on meteorological factors and the multi-model ensemble method. Forests 2024, 15, 1981. [Google Scholar] [CrossRef]
  7. Cho, M.; Park, C. Predicting anthropogenic wildfire occurrence using explainable machine learning models: A nationwide case study of South Korea. Fire 2026, 9, 126. [Google Scholar] [CrossRef]
  8. Kim, S.J.; Lim, C.-H.; Kim, G.S.; Lee, J.; Geiger, T.; Rahmati, O.; Son, Y.; Lee, W.-K. Multi-temporal analysis of forest fire probability using socio-economic and environmental variables. Remote Sens. 2019, 11, 86. [Google Scholar] [CrossRef]
  9. Chung, Y.S.; Kim, H.S. Satellite monitoring of forest fires and associated smoke plumes occurring in Korea. Air Qual. Atmos. Health 2008, 1, 111–118. [Google Scholar] [CrossRef]
  10. Heo, S.; Ahn, S.; Lee, Y.E.; Jung, S.C.; Jang, M. Bridging climate and socio-environmental vulnerability for wildfire risk assessment using explainable machine learning: Evidence from the 2025 wildfire in Korea. Forests 2025, 17, 182. [Google Scholar] [CrossRef]
  11. Lee, J.; Ahn, S.; Im, S. Spatial prediction of forest fire occurrence integrating human proximity: A machine learning approach for Korea’s eastern coast. Forests 2026, 17, 281. [Google Scholar] [CrossRef]
  12. Kwak, H.; Lee, W.-K.; Saborowski, J.; Lee, S.-Y.; Won, M.-S. Estimating the spatial pattern of human-caused forest fires using a generalized linear mixed model with spatial autocorrelation in South Korea. Int. J. Geogr. Inf. Sci. 2012, 26, 1589–1602. [Google Scholar] [CrossRef]
  13. Choi, J.-S.; Chae, H. Assessing wildfire risk in South Korea under climate change using the maximum entropy model and shared socioeconomic pathway scenarios. Atmosphere 2024, 16, 5. [Google Scholar] [CrossRef]
  14. Su, Z.; Hu, H.; Tigabu, M.; Wang, G.; Zeng, A. Geographically weighted negative binomial regression model predicts wildfire occurrence in the Great Xing’an Mountains better than negative binomial model. Forests 2019, 10, 377. [Google Scholar] [CrossRef]
  15. Boateng, E.; Granville, K. A time series analysis of monthly fire counts in Ontario, Canada, with consideration of climate teleconnections. Fire 2024, 9, 44. [Google Scholar] [CrossRef]
  16. Lim, C.J.; Chae, H.M. Application of the Canadian fire weather index for forest fire danger assessment in South Korea. Forests 2025, 16, 1058. [Google Scholar] [CrossRef]
  17. Kudláčková, L.; Bartošová, L.; Linda, R.; Bláhová, M.; Poděbradská, M. Assessing fire danger classes and extreme thresholds of the Canadian fire weather index across global environmental zones: A review. Environ. Res. Lett. 2025, 20, 013001. [Google Scholar] [CrossRef]
  18. Anselin, L. Local indicators of spatial association—LISA. Geogr. Anal. 1995, 27, 93–115. [Google Scholar] [CrossRef]
  19. Jo, H.-W.; Krasovskiy, A.; Hong, M.; Corning, S.; Kim, W. Modeling historical and future forest fires in South Korea: The FLAM optimization approach. Remote Sens. 2023, 15, 1446. [Google Scholar] [CrossRef]
  20. Choi, J.; Yun, Y.; Chae, H. Forest fire risk prediction in South Korea using Google Earth Engine: Comparison of machine learning models. Land 2025, 14, 1155. [Google Scholar] [CrossRef]
  21. Wang, X.; Wotton, B.M.; Cantin, A.S.; Parisien, M.A.; Anderson, K.; Moore, B.; Flannigan, M.D. cffdrs: An R package for the Canadian forest fire danger rating system. Ecol. Process. 2017, 6, 5. [Google Scholar] [CrossRef]
  22. Van Wagner, C.E. Development and Structure of the Canadian Forest Fire Weather Index System; Forestry Technical Report 35; Canadian Forestry Service: Ottawa, ON, Canada, 1987. [Google Scholar]
  23. Hwang, Y.; Clark, M.P.; Rajagopalan, B.; Leavesley, G. Spatial interpolation schemes of daily precipitation for hydrologic modeling. Stoch. Environ. Res. Risk Assess. 2012, 26, 295–320. [Google Scholar] [CrossRef]
  24. Ly, S.; Charles, C.; Degré, A. Different methods for spatial interpolation of rainfall data for operational hydrology and hydrological modelling at watershed scale: A review. Biotechnol. Agron. Soc. Environ. 2013, 17, 392–406. [Google Scholar]
  25. Chang, C.L.; Lo, S.L.; Yu, S.L. Interpolating precipitation and its relation to runoff and non-point source pollution. J. Environ. Sci. Health 2005, 40, 1963–1973. [Google Scholar] [CrossRef]
  26. Fávero, L.P.; Belfiore, P.; Santos, M.A. Overdisp: A Stata package for direct detection of overdispersion. Stat. Optim. Inf. Comput. 2020, 8, 773–789. [Google Scholar] [CrossRef]
  27. Chas-Amil, M.L.; Prestemon, J.P.; McClean, C.J.; Touza, J. Spatial patterns of social vulnerability in relation to wildfire risk and wildland-urban interface presence. Landsc. Urban Plan. 2022, 228, 104577. [Google Scholar] [CrossRef]
  28. Gaither, C.J.; Poudyal, N.C.; Goodrick, S.; Bowker, J.M.; Malone, S.; Gan, J. Wildland fire risk and social vulnerability in the Southeastern United States: An exploratory spatial data analysis approach. For. Policy Econ. 2011, 13, 24–36. [Google Scholar] [CrossRef]
  29. Fernández-García, V.; Beltrán-Marcos, D.; Suárez-Seoane, S.; Fernández-Guisuraga, J.M.; Fernández-Manso, A.; Quintano, C.; Marcos, E.; Calvo, L. Building patterns and fuel features drive wildfire severity in wildland-urban interfaces in Southern Europe. Landsc. Urban Plan. 2023, 230, 104646. [Google Scholar] [CrossRef]
  30. Argañaraz, J.P.; Radeloff, V.C.; Bar-Massada, A.; Gavier-Pizarro, G.I.; Scavuzzo, C.M.; Bellis, L.M. Assessing wildfire exposure in the wildland-urban interface area of the mountains of central Argentina. J. Environ. Manag. 2017, 196, 499–510. [Google Scholar] [CrossRef]
  31. Jenkins, J.S.; Abatzoglou, J.T.; Rupp, D.E.; Fleishman, E. Human and climatic influences on wildfires ignited by recreational activities in national forests in Washington, Oregon, and California. Environ. Res. Commun. 2023, 5, 091001. [Google Scholar] [CrossRef]
  32. Calef, M.P.; Varvak, A.; McGuire, A.D. Differences in human versus lightning fires between urban and rural areas of the boreal forest in interior Alaska. Forests 2017, 8, 422. [Google Scholar] [CrossRef]
  33. Catry, F.X.; Rego, F.C.; Bacao, F.; Moreira, F. Modeling and mapping wildfire ignition risk in Portugal. Int. J. Wildland Fire 2009, 18, 641–652. [Google Scholar] [CrossRef]
  34. Campos-Ruiz, R.; Parisien, M.-A.; Flannigan, M.D. Temporal patterns of wildfire activity in areas of contrasting human influence in the Canadian boreal forest. Forests 2018, 9, 159. [Google Scholar] [CrossRef]
  35. Montoya Alvis, J.; Orozco Mendoza, G.L.; Zartha Sossa, J.W. Extreme fire events in wildland–urban interface areas: A review of the literature concerning determinants for risk governance. Sustainability 2025, 17, 4505. [Google Scholar] [CrossRef]
  36. Roberts, M.E.; Rawlinson, A.A.; Wang, Z. Ember risk modelling for improved wildfire risk management in the peri-urban fringes. Environ. Model. Softw. 2021, 138, 104956. [Google Scholar] [CrossRef]
  37. Ager, A.A.; Preisler, H.K.; Arca, B.; Spano, D.; Salis, M. Wildfire risk estimation in the Mediterranean area. Environmetrics 2014, 25, 384–396. [Google Scholar] [CrossRef]
  38. Bradstock, R.A.; Hammill, K.A.; Collins, L.; Price, O. Effects of weather, fuel and terrain on fire severity in topographically diverse landscapes of south-eastern Australia. Landsc. Ecol. 2009, 25, 607–619. [Google Scholar] [CrossRef]
  39. Agee, J.K.; Skinner, C.N. Basic principles of forest fuel reduction treatments. For. Ecol. Manag. 2005, 211, 83–96. [Google Scholar] [CrossRef]
  40. North, M.P.; Hurteau, M.D.; Innes, J.C. Fire suppression and fuels treatment effects on mixed-conifer carbon stocks and emissions. Ecol. Appl. 2009, 19, 1385–1396. [Google Scholar] [CrossRef]
  41. Cohen, J.D. Preventing disaster: Home ignitability in the wildland-urban interface. J. For. 2000, 98, 15–21. [Google Scholar] [CrossRef]
  42. Dossi, S.; Messerschmidt, B.; Ribeiro, L.M.; Almeida, M.; Rein, G. Relationships between building features and wildfire damage in California, USA and Pedrógão Grande, Portugal. Int. J. Wildland Fire 2022, 31, 1076–1088. [Google Scholar] [CrossRef]
  43. Johnson, M.C.; Kennedy, M.C. Altered vegetation structure from mechanical thinning treatments changed wildfire behaviour in the wildland–urban interface on the 2011 Wallow Fire, Arizona, USA. Int. J. Wildland Fire 2019, 28, 220–229. [Google Scholar] [CrossRef]
  44. Creany, N.; Monz, C.; D’Antonio, A.; Sisneros-Kidd, A.M.; Wilkins, E.J. Estimating trail use and visitor spatial distribution using mobile device data: An example from the Nature Reserve of Orange County, California USA. Environ. Res. Commun. 2021, 3, 100171. [Google Scholar] [CrossRef]
  45. Gurung, B.; Peterson, B.A.; Fleming, S.; Drury, S.; Thomas, A. Identification of high fire potential and high-use spatial intersections at a national forest to understand recreation displacement related to wildfire events. Ann. Am. Assoc. Geogr. 2025, 115, 2364–2374. [Google Scholar] [CrossRef]
Figure 1. Administrative divisions of the study area in South Korea.
Fire 09 00147 g001
Figure 2. Population density of the study area in South Korea ((a) mean population density of province; (b) mean population density of cities from 2014 to 2023).
Fire 09 00147 g002
Figure 3. Spatial distribution of historical wildfire events and meteorological monitoring network: (a) geographic locations of the 9016 analyzed wildfire occurrences (2004–2023); (b) digital elevation model (SRTM DEM) and locations of the 73 ASOS stations used for fire-weather index calculation.
Fire 09 00147 g003
Figure 4. Queen-based spatial weights network with custom island connections.
Fire 09 00147 g004
Figure 5. Monthly patterns of wildfire occurrence and burned area in South Korea (2004–2023).
Fire 09 00147 g005
Figure 6. Spatial patterns of wildfire occurrence and burned area across seasons: (a) number of fires; (b) burned area.
Fire 09 00147 g006
Figure 7. Negative binomial regression of daily fire by FWI percentile: (a) exposure days per FWI percentile bin; (b) number of fires per FWI percentile bin; (c) observed and modeled wildfire rate (fires day−1).
Fire 09 00147 g007
Figure 8. Spatiotemporal distribution of wldfire occurrence by predicted daily fire rate class (μ) and season: (al) spatial distribution during Spring, Summer, Fall, and Winter across meteorological risk classes (μ < 1, 1 ≤ μ < 2, and μ ≥ 2).
Fire 09 00147 g008
Figure 9. Seasonal wildfire occurrence as a function of forest age class and forest type under varying predicted daily fire rate class (μ) from negative binomial regression (2019–2023).
Fire 09 00147 g009
Figure 10. Mean distance to the nearest building categorized by administrative type across various seasons and predicted daily fire rate class (μ) from negative binomial regression (2019–2023).
Fire 09 00147 g010
Figure 11. Spatiotemporal clustering of population-fire association via bivariate LISA: (al) identification of significant spatial clusters (HH, HL, LH, LL) across different seasons and predicted daily fire rate class (μ) from negative binomial regression.
Fire 09 00147 g011
Figure 12. Analysis of ignition drivers within significant spatial clusters: comparative distribution of primary wildfire ignition causes for Low–High (LH) and High–High (HH) clusters across seasons and predicted daily fire rate class (μ) from negative binomial regression.
Fire 09 00147 g012
Figure 13. Distribution of primary wildfire ignition causes by City, County, and Metropolitan areas (2019–2023).
Fire 09 00147 g013
Disclaimer/Publisher’s Note: The statements, opinions and data contained in all publications are solely those of the individual author(s) and contributor(s) and not of MDPI and/or the editor(s). MDPI and/or the editor(s) disclaim responsibility for any injury to people or property resulting from any ideas, methods, instructions or products referred to in the content.