Article

Research on the Retardant Effect of Deep Eutectic Inhibitor for Coal Spontaneous Combustion

1
School of Resource, Environment and Safety Engineering, Hunan University of Science and Technology, Xiangtan 411201, China
2
Hunan Engineering Research Center for Fire and Explosion Prevention Materials and Equipment in Underground Spaces, Xiangtan 411201, China
3
Key Laboratory of Fire and Explosion Prevention and Emergency Technology in Hunan Province, Xiangtan 411201, China
*
Author to whom correspondence should be addressed.
Fire 2026, 9(3), 129; https://doi.org/10.3390/fire9030129
Submission received: 10 February 2026 / Revised: 11 March 2026 / Accepted: 13 March 2026 / Published: 18 March 2026

Abstract

To address the challenges of rapid water loss and insufficient long-term inhibition efficiency of conventional inhibitors in the high-temperature environments of deep goafs, a novel, environmentally friendly Deep Eutectic Inhibitor (DEI) was synthesized. This DEI utilizes citric acid (Ca) and proline (Pr) as the hydrogen bond donor and acceptor, respectively, with ascorbic acid (VC) and propyl gallate (PG) serving as antioxidants. A moisture retention evaluation model based on Fick’s law of diffusion was established to systematically investigate the liquid-domain stability of the DEI across a temperature range of 30 °C to 120 °C. The results demonstrate that the DEI exhibits superior moisture retention capabilities under high-temperature conditions, with the relative moisture retention peaking in the 80–110 °C range. Mechanistically, the formation of a robust hydrogen bond network effectively counteracts moisture evaporation driven by thermal kinetic energy. Furthermore, the DEI demonstrated significant inhibition effects on four coal samples with varying degrees of metamorphism. Tests on oxidative heat release characteristics revealed that DEI treatment delayed the initial oxidation temperature of the coal. Kinetic analysis further indicated that during the critical oxidation stage (200–300 °C), the apparent activation energy of the treated coal samples increased by 10.28–18.9 kJ/mol, effectively suppressing the spontaneous combustion process. This study contributes to the development of high-efficiency and eco-friendly fire prevention materials for coal mines.

1. Introduction

Coal serves as the cornerstone of energy security in China, and its efficient and safe extraction is of paramount importance to the development of the national economy. However, with the continuous increase in mining depth, the risk of coal spontaneous combustion (CSC) has intensified due to high geothermal temperatures, high ground pressure, and complex goaf environments [1,2,3]. CSC not only results in the waste of valuable resources but also generates large quantities of toxic and harmful gases, posing a severe threat to operational safety and the health of personnel [4,5]. Consequently, the development of highly efficient, stable, and environmentally friendly inhibiting materials is critical for the safe and efficient mining of deep coal seams.
Currently, technologies for inhibiting coal spontaneous combustion (CSC) are primarily categorized into gaseous, solid, and liquid forms based on the physical state of the materials. In general, these technologies function through two main mechanisms: physical inhibition (covering) and chemical suppression. Regarding physical inhibition, blocking foams and gels are extensively utilized due to their superior coverage and oxygen barrier properties. Vinogradov et al. [6] developed a novel silica foam based on in situ sol–gel technology, which forms a stable inorganic scaffold at high temperatures, exhibiting fire-extinguishing efficiency up to 50 times greater than water. In terms of chemical inhibition, antioxidants and other inhibitors are frequently formulated into solutions to deactivate reactive functional groups. For instance, Arisoy and Beamish [7] systematically investigated the reaction kinetics of coal oxidation at low temperatures, emphasizing that chemical suppression can significantly elevate the apparent activation energy of coal oxidation. Among solid fire prevention materials, inorganic salt inhibitors are commonly applied. Onifade [8] provided a comprehensive review of various countermeasures against coal spontaneous combustion, emphasizing that the application of inorganic salts remains a critical strategy due to their ability to effectively passivate reactive functional groups and enhance the thermal stability of coal. Gaseous fire prevention materials, on the other hand, primarily rely on flow and diffusion within the goaf to achieve physical inerting. Qiao et al. [9] developed an improved computational fluid dynamics (CFD) model to simulate gas migration and coal spontaneous combustion control, providing a theoretical framework for optimizing inert gas injection strategies in complex goaf environments. In recent years, water-based environmentally friendly retardants have emerged as a research hotspot. Jefferson et al. [10] reviewed the potential applications of natural fiber composites in eco-friendly fire retardancy. Costes et al. [11] reviewed the development of sustainable bio-based fire retardants, highlighting the potential of nature-derived materials in forming protective barriers on organic substrates. Similarly, Noreen et al. [12] reviewed the recent trends in environmentally friendly water-borne coatings, emphasizing the critical role of aqueous systems in enhancing the sustainability and environmental compatibility of functional protective materials. Despite these achievements, existing inhibition technologies still face severe challenges. Although gaseous materials are clean, they are prone to loss through air leakage in open or semi-enclosed goaf environments, making it difficult to maintain a persistent inert atmosphere at high-temperature zones [13]. Solid powder inhibitors (e.g., inorganic salts) are limited by their fluidity, making it difficult to penetrate deep into coal micro-fissures; furthermore, certain halide salt additives pose risks of equipment corrosion and secondary pollution [14]. Even for water-based environmentally friendly retardants, rapid water evaporation remains a prevalent issue in deep mines with high geothermal temperatures, leading to the drying, cracking, and eventual failure of the inhibiting film. Therefore, the development of a water-based environmentally friendly retardant that combines high thermal stability, excellent permeability, and environmental safety has become an urgent priority in the field of green mine fire prevention.
To address these issues, a DEI with high thermal stability was developed using a deep eutectic solvent as the liquid carrier. By constructing a water retention evaluation model based on Fick’s law of diffusion, this study systematically investigated the effects of different temperature ranges (30–120 °C) on the liquid-phase stability of DEI. Furthermore, combined with micro-calorimetry (MCC) and kinetic calculations, the inhibition effects of DEI on various coal samples were compared, and the inhibition mechanism of DEI on coal oxidation was revealed. This study aims to provide theoretical support for green fire prevention and control in deep mines subject to thermal hazards.

2. Materials and Methods

2.1. Preparation of Deep Eutectic Inhibitor

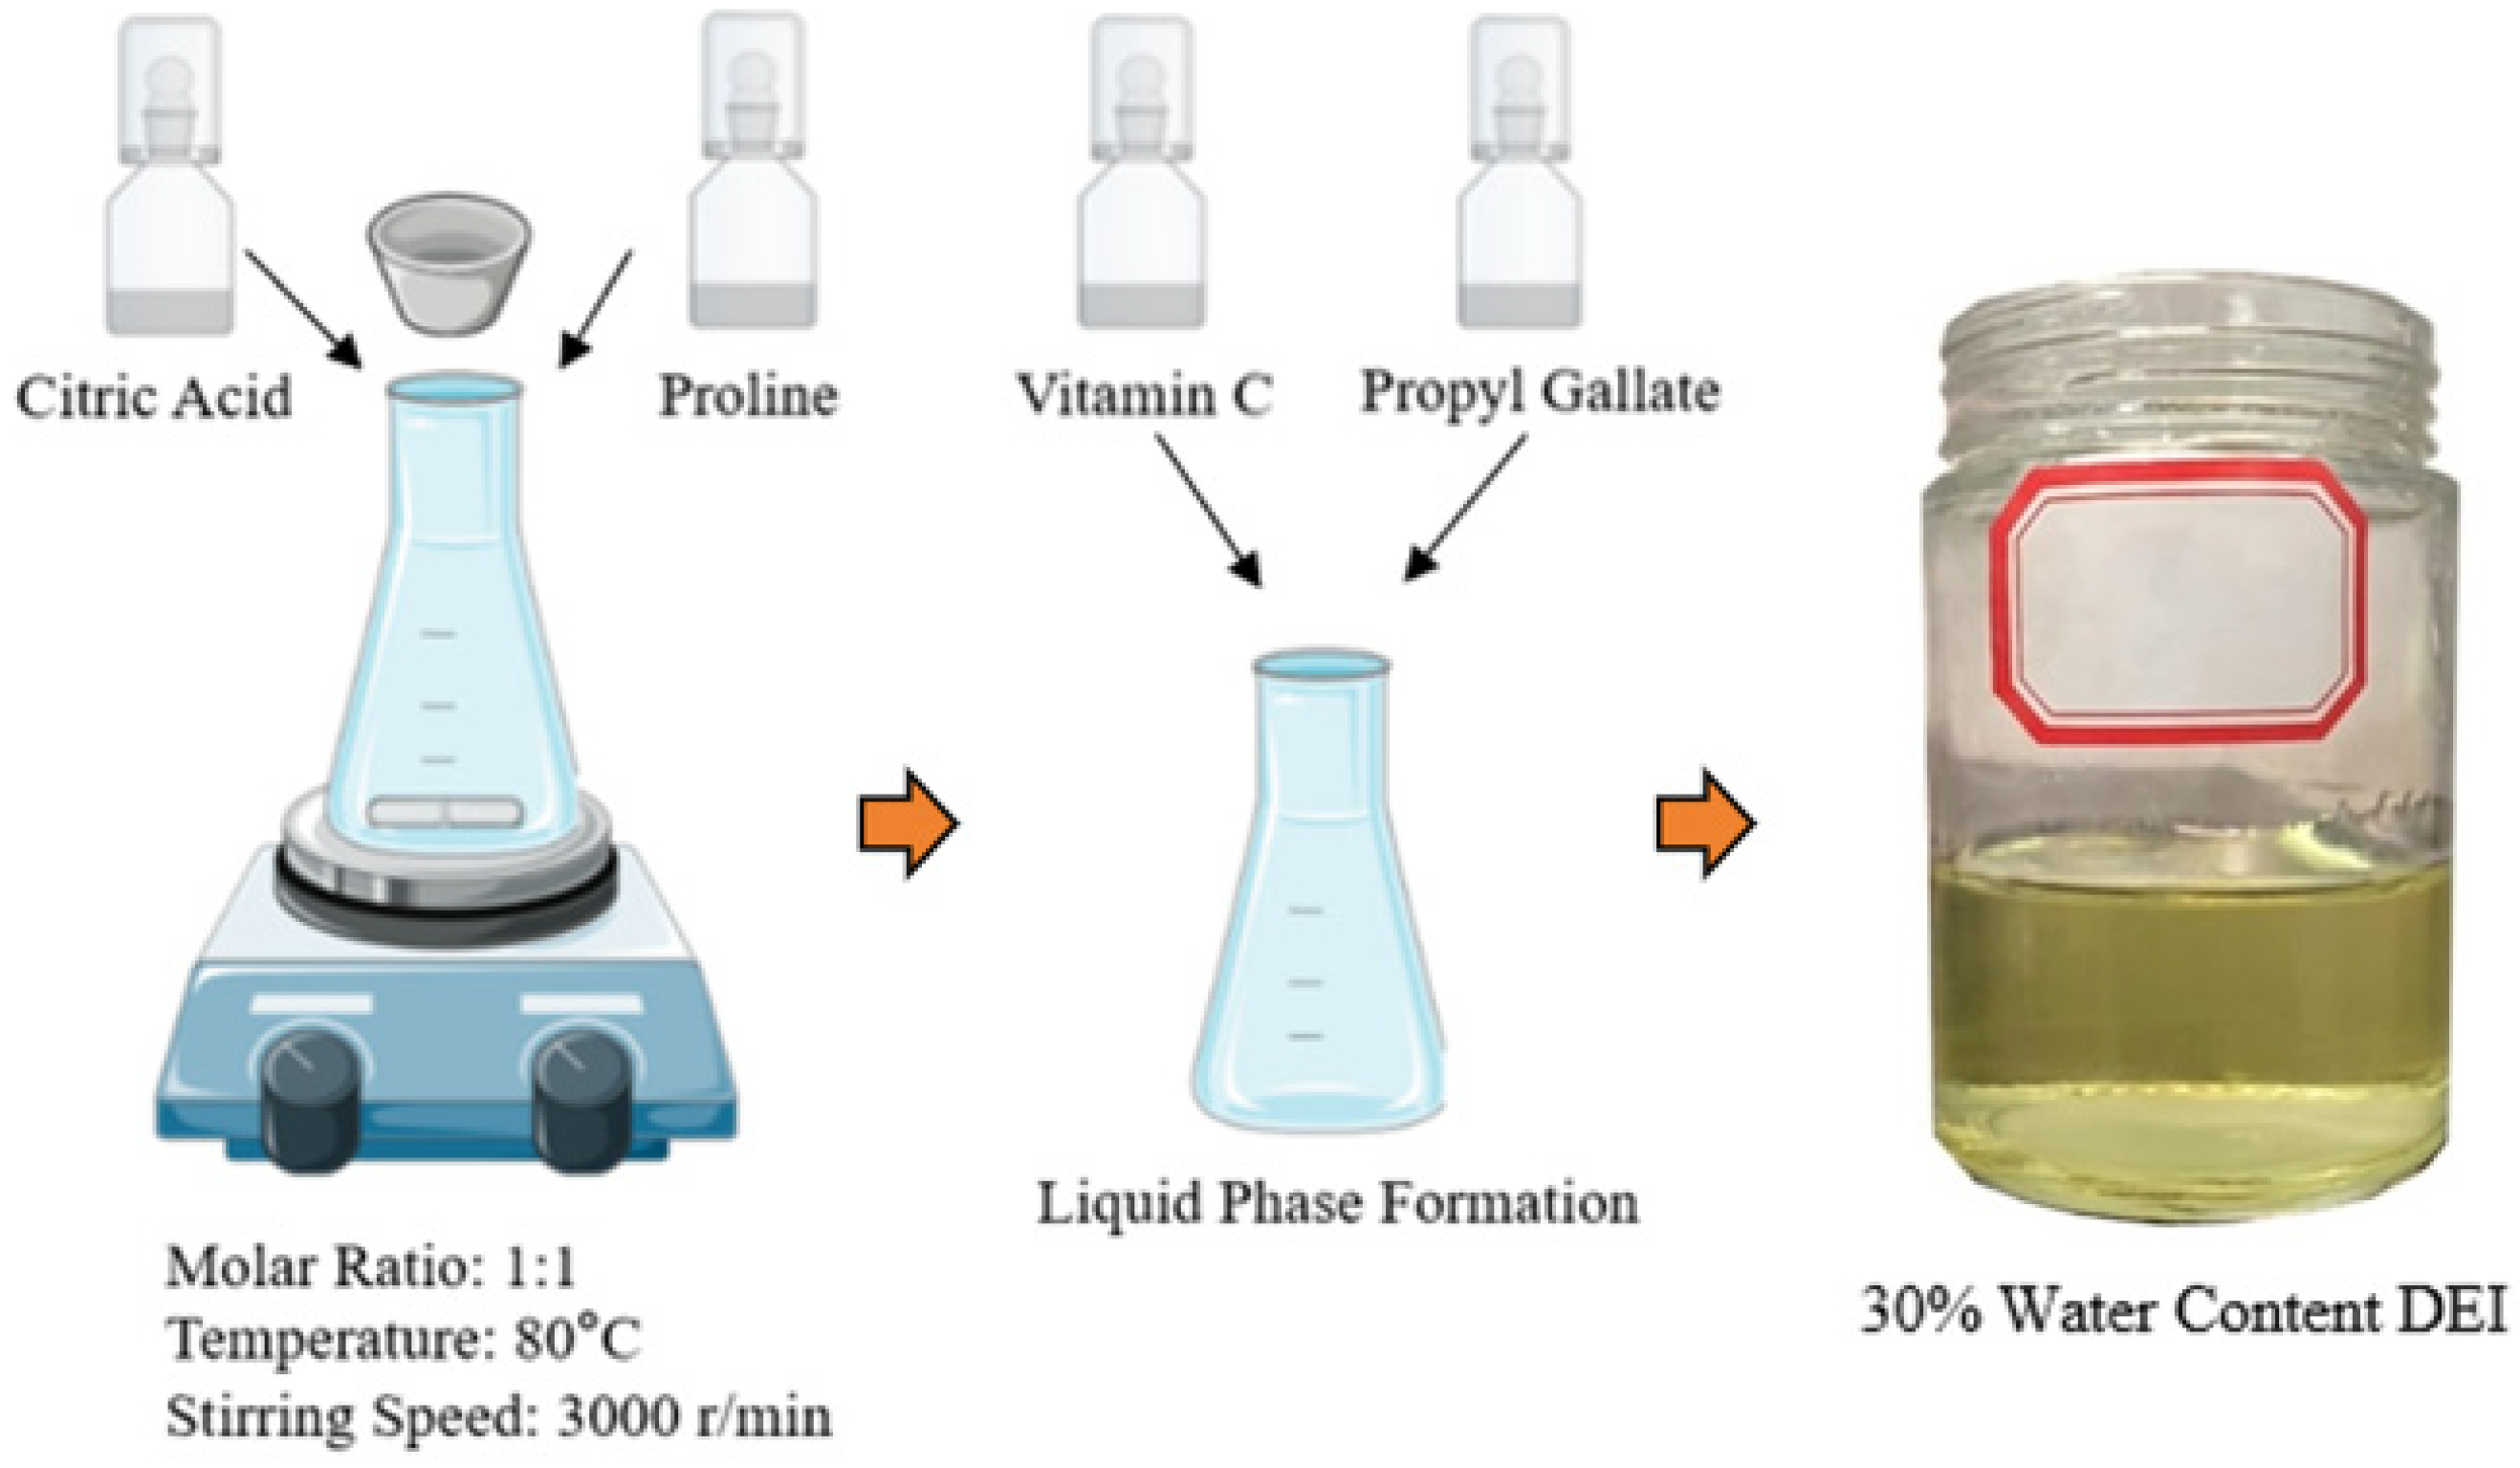
The synthesis process of the DEI used in this study is as shown in Figure 1: First, Citric acid (Ca, ≥99.5% purity) and Proline (Pr, ≥99% purity), both purchased from Shanghai Rhawn Chemical Reagent Co., Ltd. (Shanghai, China), were mixed at a molar ratio of 1:1, and pure water was added until the water content reached 30% of the total weight. The mixture was then stirred in a magnetic stirrer at 80 °C with a rotation speed of 3000 r/min until a homogeneous liquid mixture was obtained. Subsequently, Ascorbic acid (Vitamin C, VC, ≥98.5% purity) and Propyl gallate (PG, ≥99.5% purity), also obtained from Shanghai Rhawn Chemical Reagent Co., Ltd., Shanghai, China, were each added to the beaker at 0.25% of the total weight and stirred continuously. After achieving a uniform mixture, the final product was transferred to a sealed container for storage.

2.2. Coal Sample Selection and Preparation of Inhibited Samples

The coal samples selected for the experiments included coking coal from the Wangjialing Coal Mine in Shanxi (WJLCC), anthracite from the Dalin Coal Mine in Guizhou (DLAC), gas coal from the Liuzhuang Coal Mine in Anhui (LZGC), and lignite from the Donghuai Coal Mine in Guangxi (DHLC). Fresh lump coal, unexposed to air, was collected from the working faces, wrapped in plastic film, sealed in canisters, and transported to the laboratory. Using standard sieving procedures, pulverized coal particles with a size distribution between 40 and 80 mesh (0.180–0.425 mm) were selected. To eliminate the interference of moisture on oxidation kinetics, the sieved samples were dried in a vacuum oven at 60 °C for 24 h. Once constant weight was achieved, the samples were transferred to a desiccator for storage.
DEI-loaded coal samples were prepared using the impregnation method at a controlled temperature of 25 °C. Dried coal samples were weighed and immersed in inhibitor solutions of varying concentrations at a solid-to-liquid ratio of 5:2. The mixtures were treated in a constant-temperature shaker for 24 h at room temperature to ensure that DEI molecules could fully penetrate and cover the active sites on the coal surface via diffusion. Upon completion of impregnation, the mixtures were subjected to suction filtration. The separated inhibited coal samples were then dried in an oven at 40 °C until constant weight was achieved. Finally, the prepared samples were sealed and stored for subsequent water retention evaluation, MCC testing, and inhibition mechanism analysis.

2.3. Experimental Methods

2.3.1. Liquid-Phase Stability Test

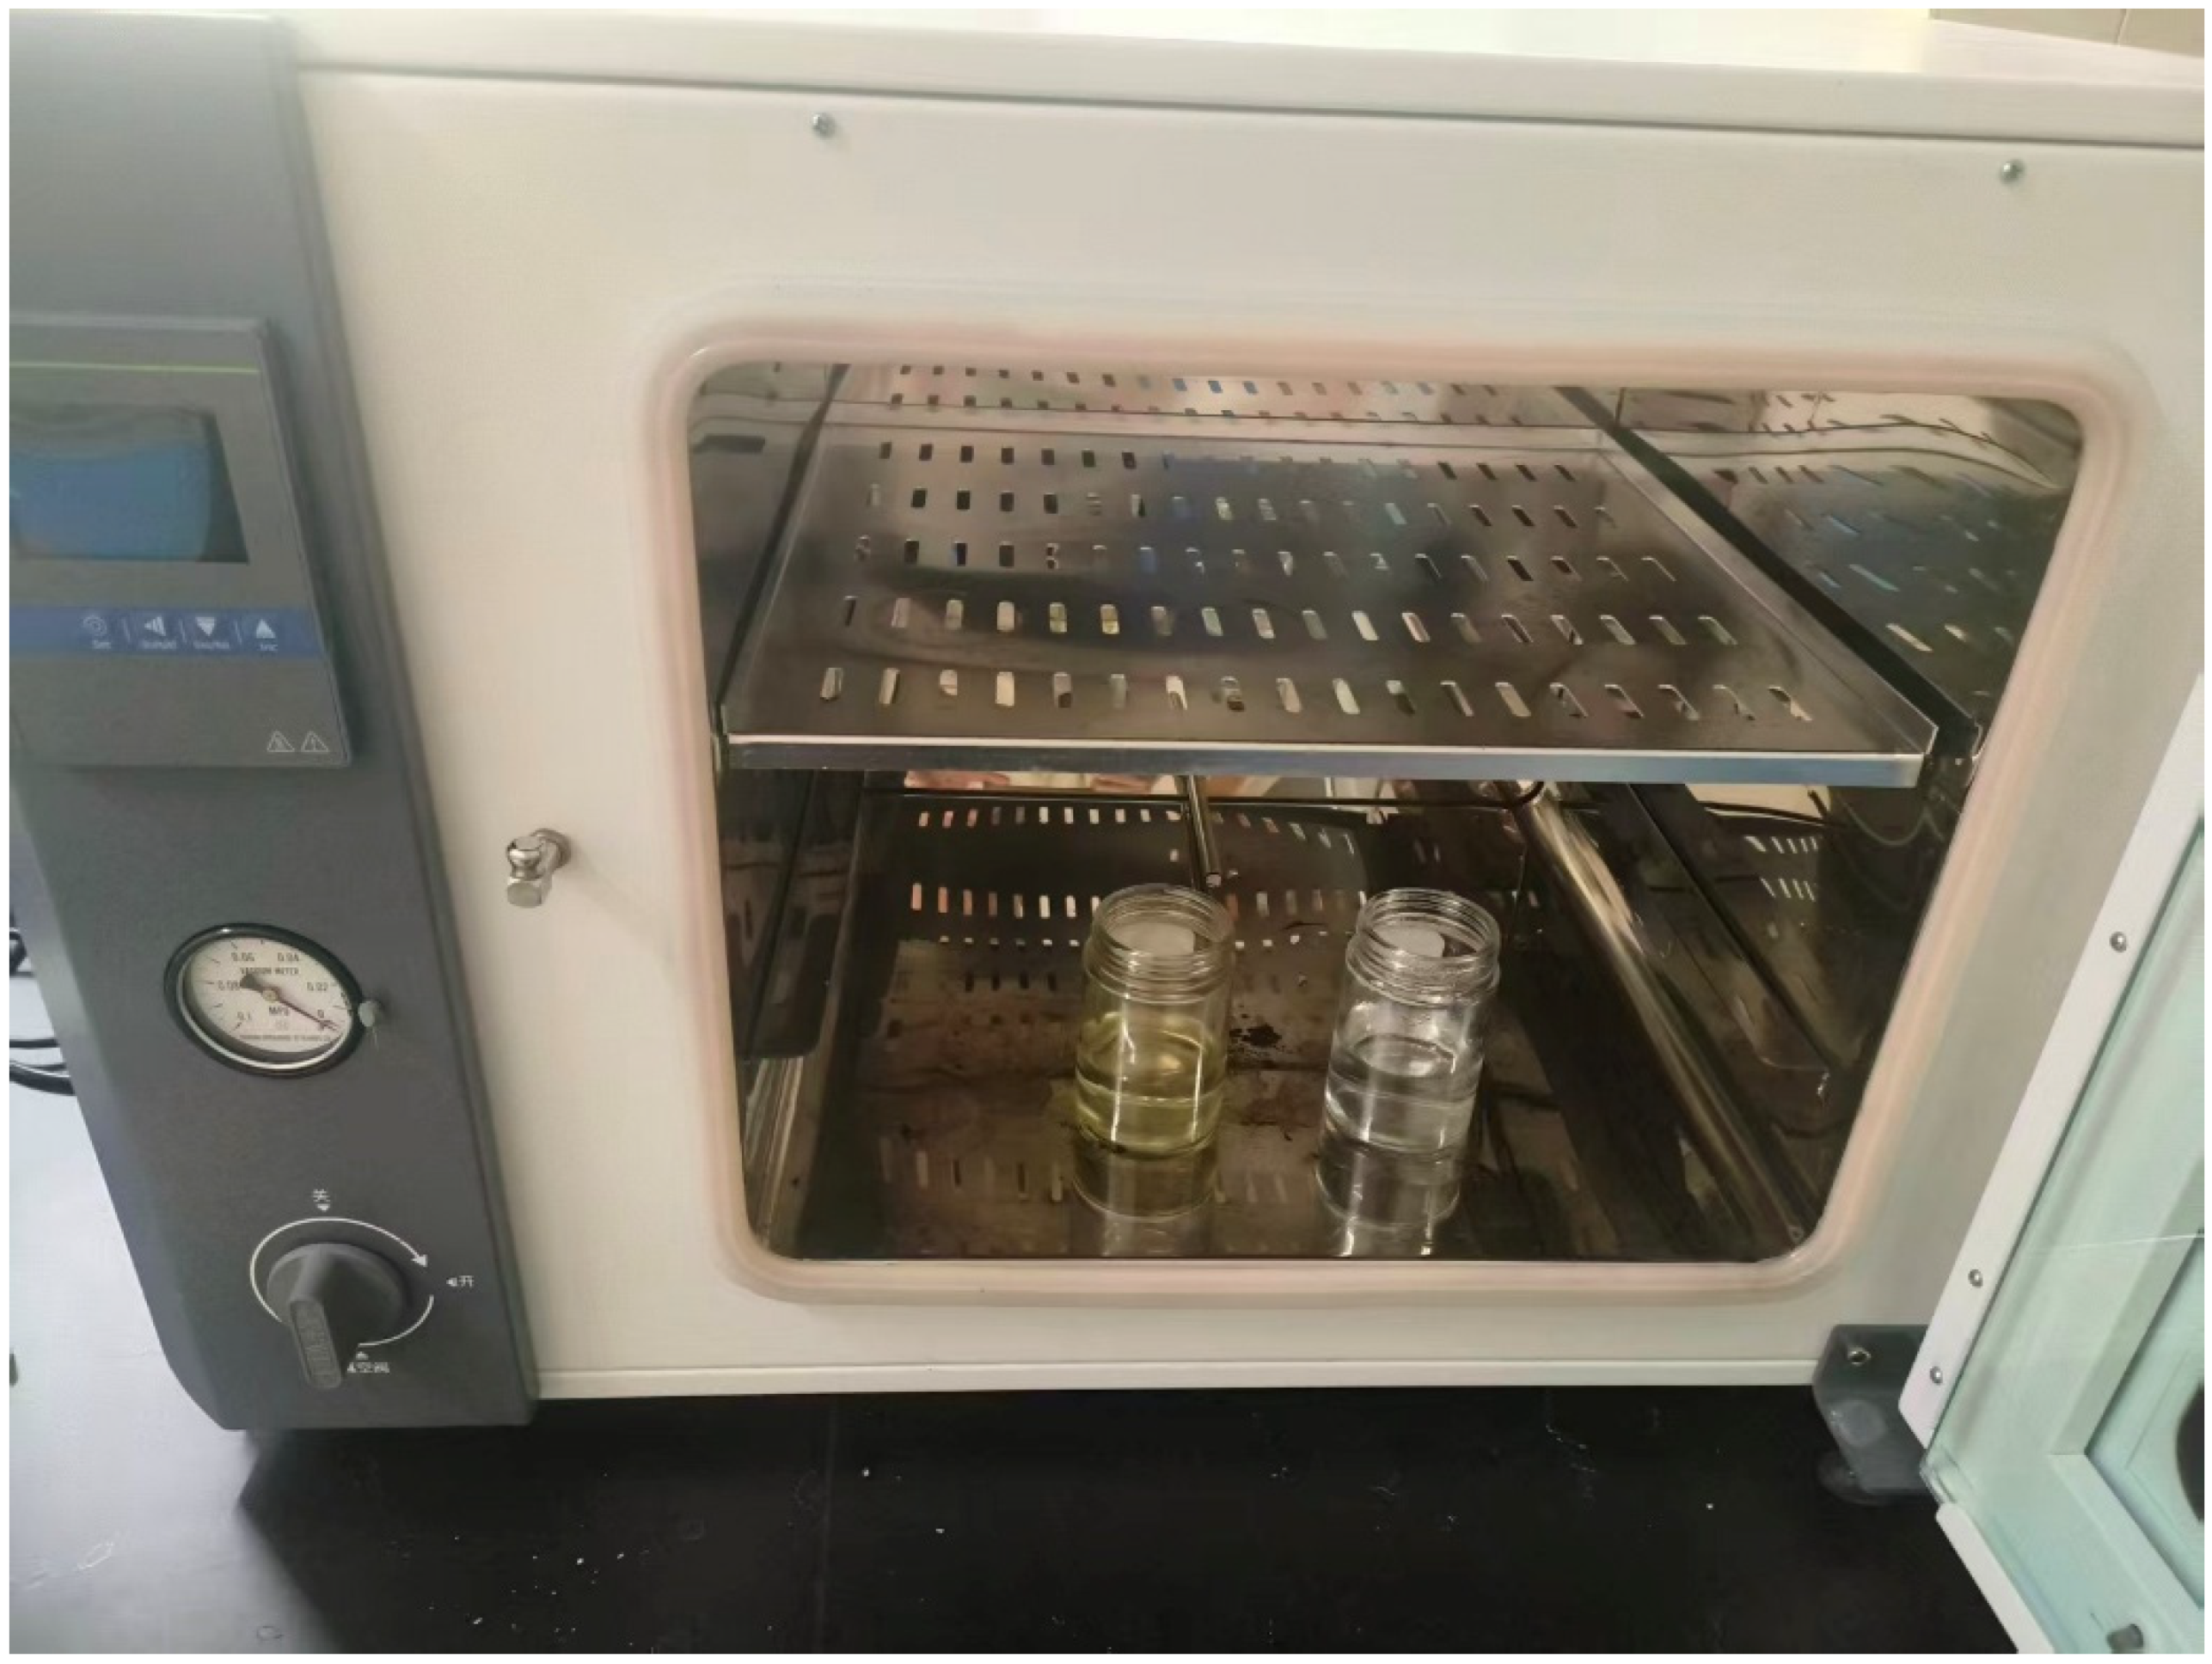
As shown in Figure 2, to systematically investigate the moisture migration and retention behavior of DEI under varying thermal environments, an isothermal drying method was employed to simulate medium-to-high temperature conditions. The liquid-phase thermal stability was evaluated by monitoring the mass evolution of the samples during the heating process. Specifically, DEI solutions (100 g, 30% water content) were prepared as the experimental group, while an equivalent mass of ultrapure water served as the control group to eliminate environmental interference. Subsequently, all samples were placed in a precision constant-temperature drying oven. The temperature gradient ranged from 30 °C to 120 °C, covering 10 specific points (30, 40, 50, 60, 70, 80, 90, 100, 110, and 120 °C) to comprehensively investigate water evaporation behaviors across different temperature ranges. During drying, the samples were weighed every 2 h using a high-precision electronic balance (accuracy: 0.001 g) until a constant mass was reached, thereby obtaining continuous kinetic data on mass loss.

2.3.2. Coal Oxidation Kinetics Experiment

The low-temperature oxidation exothermic characteristics of the coal samples were investigated using a C600 micro-calorimeter. Four raw coal samples (LZGC, DLAC, DHLC, and WJLCC) and their corresponding DEI-treated samples, totaling eight samples, were selected for this study. Prior to the experiment, 50 mg of coal samples with the specified particle size were accurately weighed using a high-precision balance and spread evenly in the sample cell to ensure sufficient contact with the airflow. The experimental atmosphere was maintained as air with a constant flow rate. The temperature was programmed to increase from 30 °C to 600 °C. To accurately capture subtle heat flow variations during the oxidation process, a low heating rate of 1.0 °C/min was employed. Heat flow signals and heat release data across the entire temperature range were automatically recorded to evaluate the inhibition efficiency of DEI on the coal samples.

3. Results and Analysis

3.1. Results of Liquid-Phase Stability Test

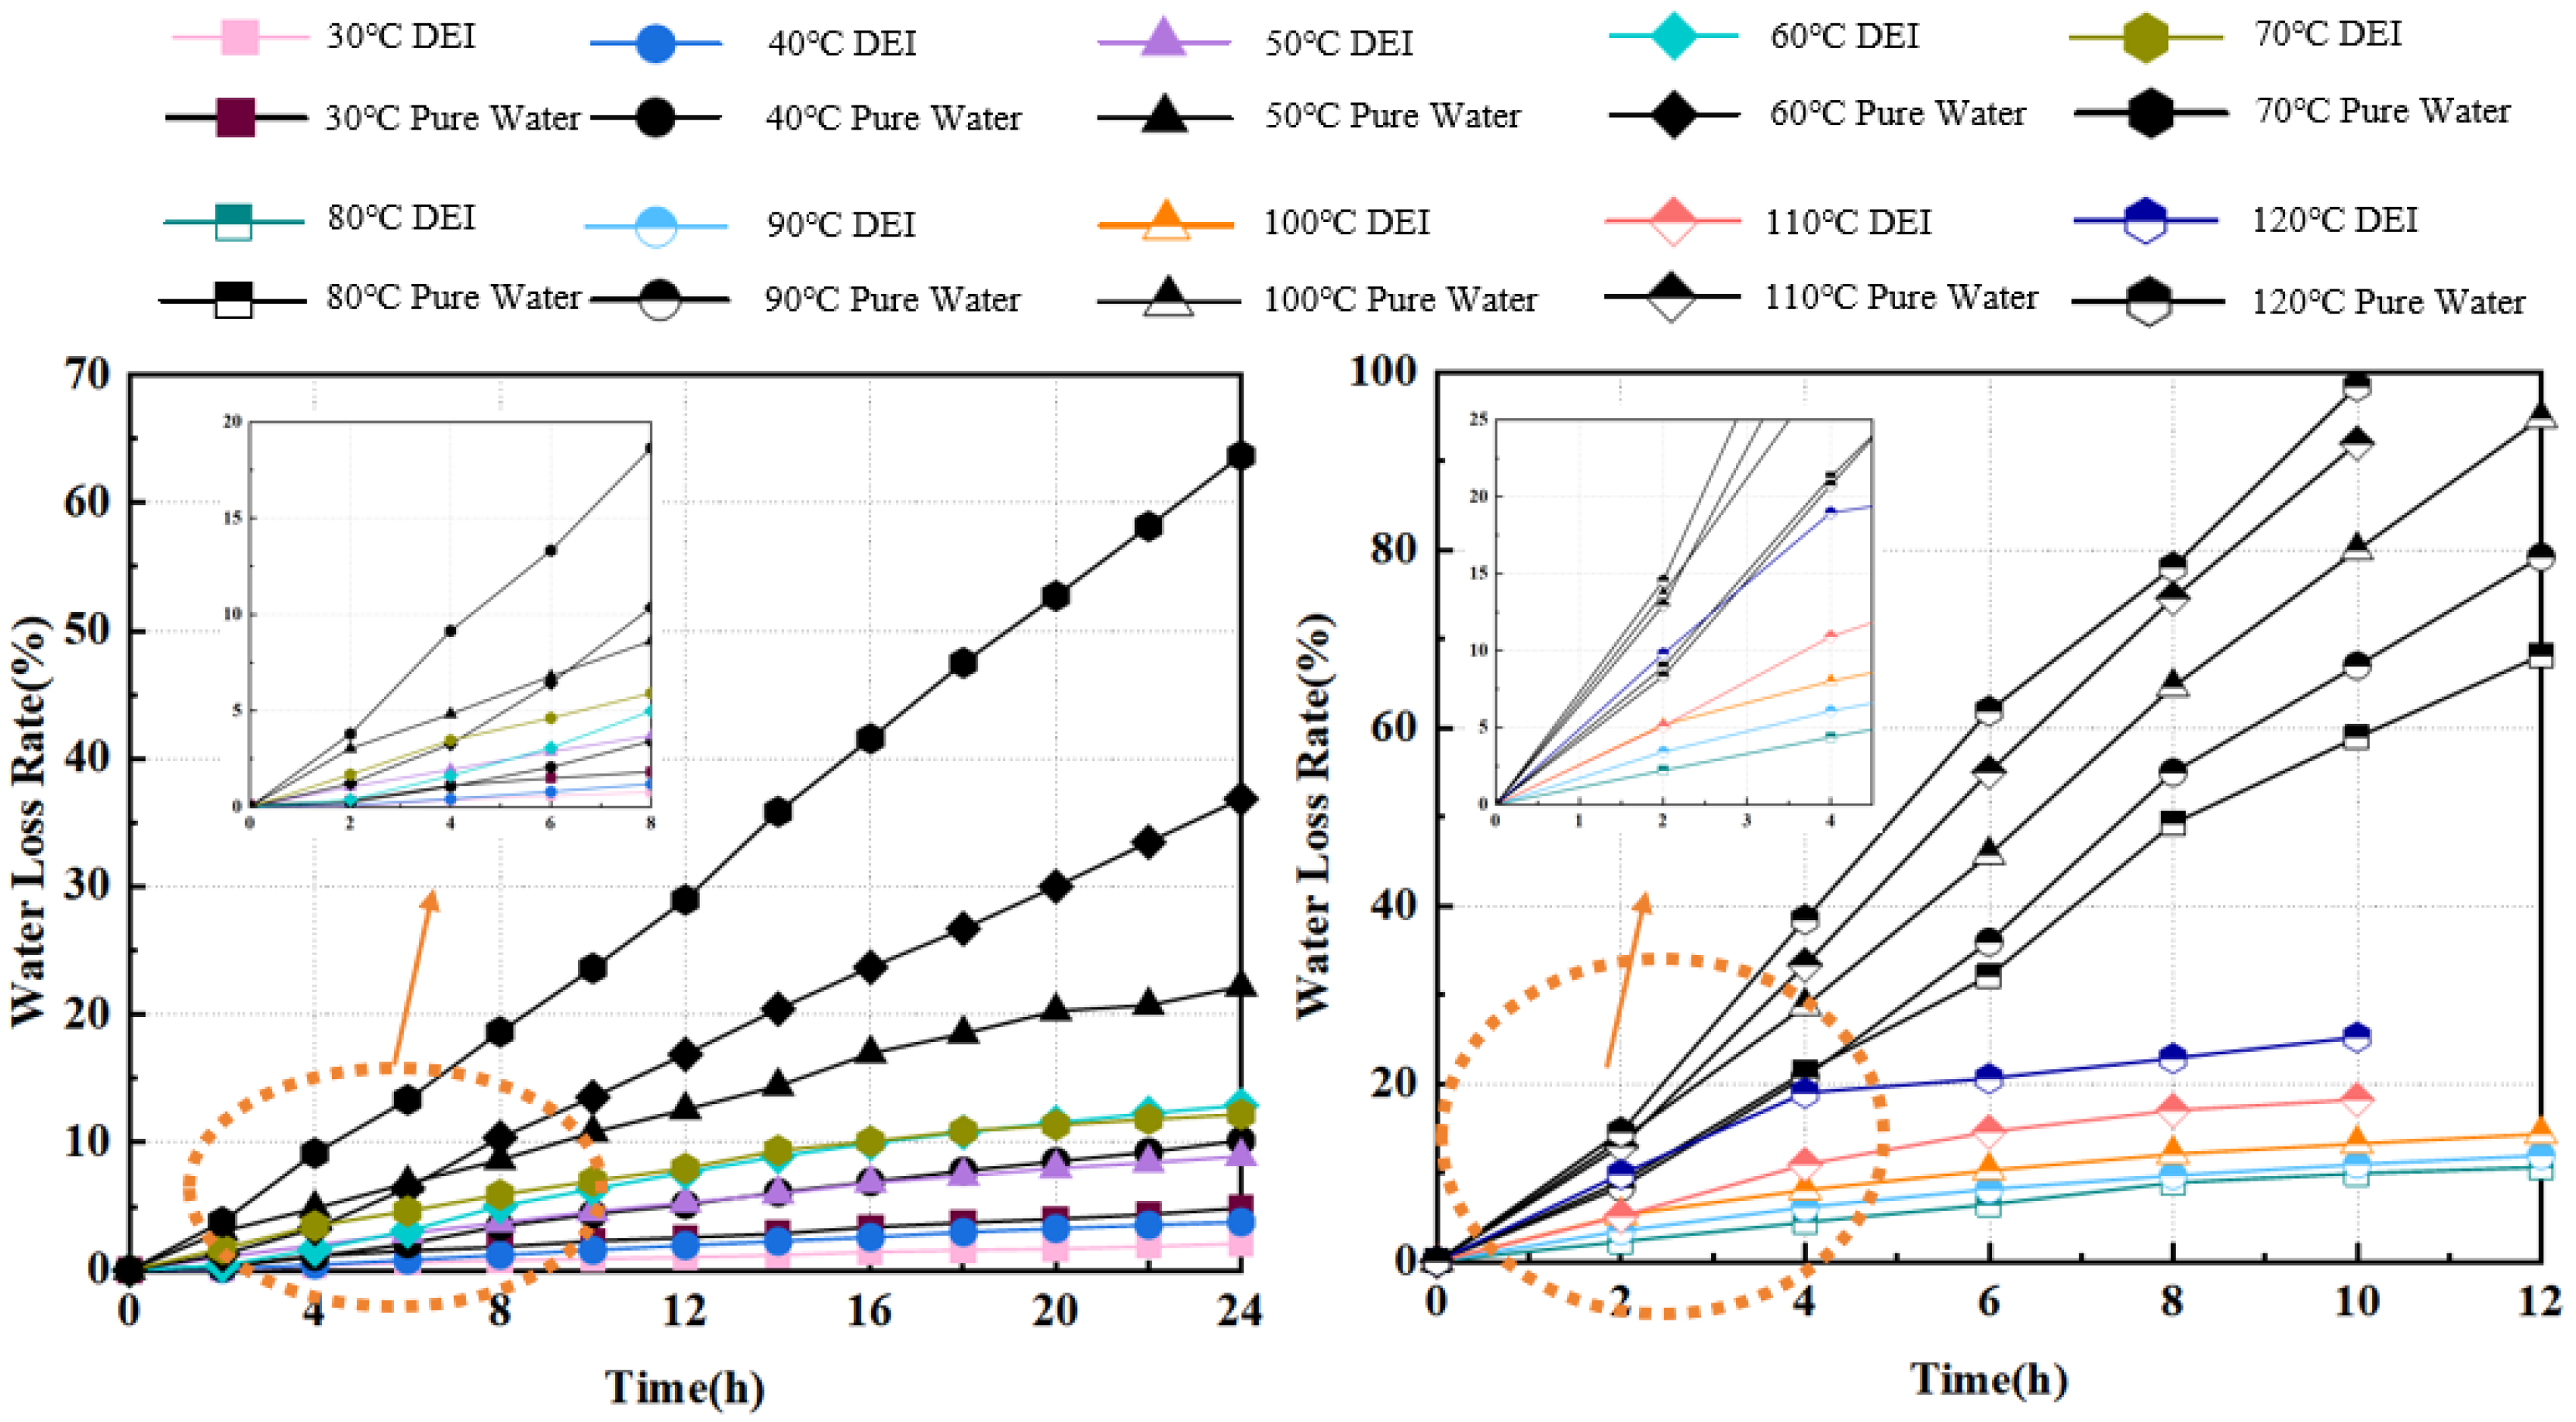
The water loss rate of DEI with an initial moisture content of 30% was determined using a constant-temperature drying oven within a temperature range of 30 °C to 120 °C to investigate its water loss behavior under varying thermal environments.
As illustrated in Figure 3, the moisture evaporation behavior of DEI differs distinctly from that of pure water. An analysis of the variation in water loss over time reveals a linear correlation between the evaporation rate and the ambient temperature. It can be observed that within the temperature range of 30–70 °C, the water volatilization of DEI is significantly inhibited.
The water loss rate (WL) of the samples was calculated using the following mathematical formula:
W L = W 0 W t W 0 × 100 %
where W0 represents the initial weight of the sample (g), and Wt represents the measured weight of the sample at a specific temperature (g).
As shown in Table 1, the cumulative water loss over 24 h at 40 °C is merely 3.754%, and even at 60 °C, it remains limited to 12.895%. Although the evaporation rate increases with rising temperature, the magnitude of this increase is marginal and significantly lower than that of pure water under identical conditions. Conversely, in the range of 80–120 °C, water evaporation accelerates markedly once the temperature exceeds 80 °C. The 12 h water loss at 80 °C reaches 10.595%, whereas it surges to 27.089% at 120 °C over the same duration. Consequently, the evaporation rate escalates from 0.365%/h to 1.123%/h.
To evaluate the water retention capacity of DEI (with a 30% moisture content) at different temperatures, the water evaporation rate was calculated based on Fick’s diffusion model. Regarding diffusion modeling, Crank was the first to propose a mathematical solution for the single-pore homogeneous model based on Fick’s diffusion theory. Subsequently, scholars have further extended and applied this model [15,16,17]. Fick’s first law describes the diffusion driven by a concentration gradient under steady-state conditions. This diffusion arises from the random thermal motion of microscopic particles within a liquid and represents a mass transfer phenomenon independent of macroscopic mixing, specifically characterized by the migration of substances from regions of high concentration to those of low concentration. By integrating Fick’s first law with the liquid-phase stability test, the one-dimensional form is expressed as follows:
J = D d C d x
where J represents the diffusion flux kg/(m2⋅s) or mol/(m2⋅s), defined as the amount of substance passing through a unit area per unit time; D is the diffusion coefficient (m2/s); and dC/dx denotes the concentration gradient (kg/m4 or moL/m4). The negative sign indicates that the direction of diffusion is opposite to the direction of increasing concentration.
By combining Fick’s first law with the experimental conditions, the concentration gradient dC/dx can be approximated as linear under steady-state conditions:
d C d x C δ C 0 δ 0 = C δ C 0 δ
Here, C0 represents the water vapor concentration at the liquid–gas interface (x = 0, mol/m3); Cδ denotes the water vapor concentration at the outer edge of the boundary layer (x = δ, mol/m3); and δ is the thickness of the “stagnant air boundary layer” existing above the solution surface (m). Within this boundary layer, mass transfer is governed solely by molecular diffusion; whereas outside the layer, the concentration remains uniform due to air flow.
It should be noted that the boundary layer thickness δ is treated as an aerodynamic parameter rather than an intrinsic property of the liquid. In the context of Fick’s diffusion model, δ strictly represents the thickness of the ‘stagnant air boundary layer’ above the solution surface, which is governed by external macroscopic conditions such as the airflow velocity field, the geometry of the sample container, and the relative distance from the liquid surface to the container rim. Since both the DEI samples and the pure water control group were tested under identical experimental configurations (same containers, initial liquid levels, and positions), the physical thickness δ remains constant regardless of the liquid type. This approach allows for the physical decoupling of aerodynamic environmental parameters from the intrinsic material properties.
Substituting Equation (3) into Equation (2) yields:
J = D C δ C 0 δ = D C 0 C δ δ
Based on the ideal gas equation of state:
C = n V = P R T
where P is the partial pressure of water vapor (Pa); n is the amount of substance (mol); V is the volume (m3); R represents the universal gas constant 8.314 J/(moL⋅K); and T denotes the absolute temperature (K). Therefore, the concentration difference can be expressed in terms of the partial pressure difference:
C 0 C δ = P 0 P δ R T
where P0 is the saturated water vapor pressure at the temperature of the solution surface (Pa); and Pδ represents the water vapor pressure of the ambient air (Pa) (Pδ = ϕP0, where ϕ denotes the ambient relative humidity (dimensionless)).
Substituting Equation (6) into Equation (4) yields:
J = D P 0 P δ R T δ
The mass flux Jm (kg/(m2·s)) is obtained by multiplying the diffusion flux J by the molar mass of water Mw:
J m = M w J = M w D P 0 P δ R T δ = M w D P 0 1 ϕ R T δ
where the molar mass of water Mw is 0.018 kg/mol; the universal gas constant R is 8.314 J/(mol·K); and the relative humidity inside the drying oven ϕ is 30%.
For each sample, the evaporation flux can be calculated as:
J m ,       e x p = Δ m A · Δ t
where Δm represents the mass loss within the time interval (kg); A is the evaporation area (m2); and Δt denotes the time interval (s).
Given the liquid surface diameter of 6 cm, the area is calculated as A = π × (0.03)2 = 0.002827 m2.
The boundary layer thickness δ was calibrated using pure water as follows:
δ = M w D a w P 0 1 ϕ R T J m
Table 2 lists the key physical parameters and the calculated boundary layer thickness δ at different temperatures.
For samples with a moisture content of w, a water activity correction must be applied:
P s o l u t i o n = a w · P 0
J m = M w D a w P 0 1 ϕ R T δ
The water activity (aw) at different moisture contents was calculated using the Norrish model:
a w = x w · exp K · x s 2
where xw is the mole fraction of water (dimensionless); xs represents the mole fraction of solute (dimensionless), xs = 1 − xw; and K denotes the Norrish constant (dimensionless), which is taken as 3 in this study.
Substituting xw and xs into Equation (13) yields a value of 0.6837.
Consequently, Fick’s law can be rearranged as follows:
D e f f = J m ,       e x p R T δ M w a w P 0 1 ϕ
Finally, the water retention capacity of the material is characterized by the relative water retention (Rt, dimensionless):
R t = 1 D e f f D
The calculated values are listed in Table 3:
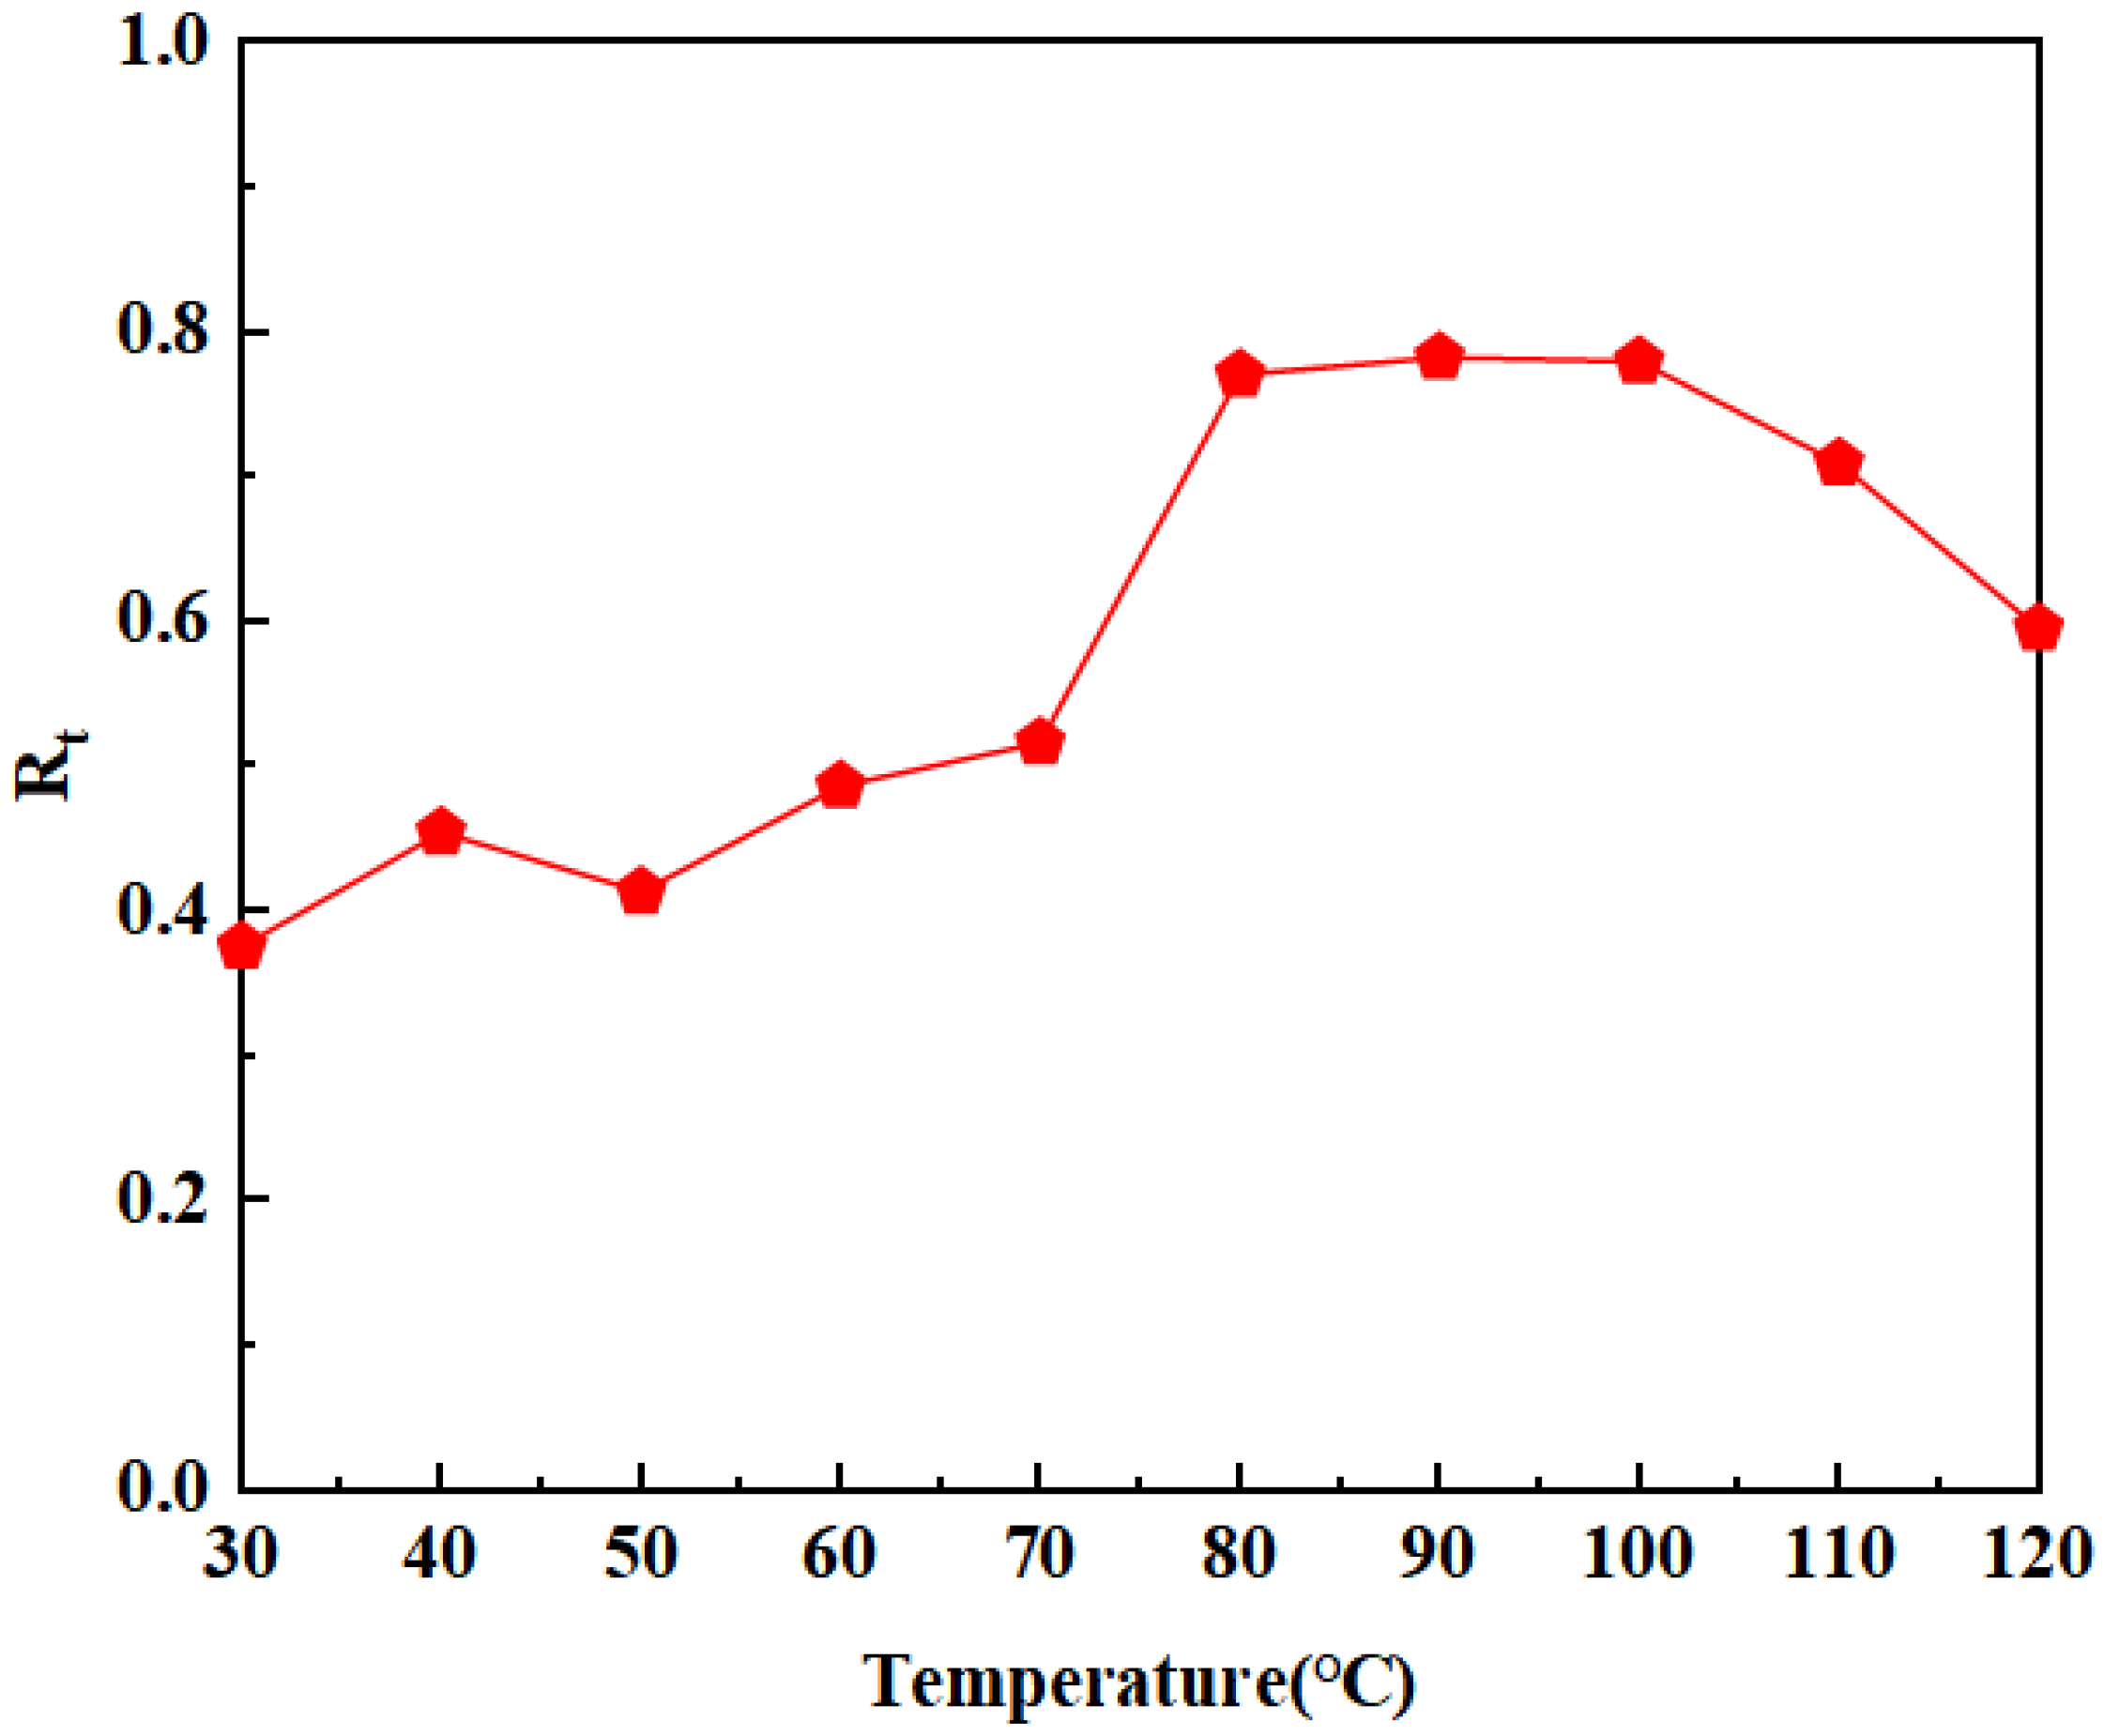
Figure 4 illustrates the variation in the relative water retention Rt of DEI with temperature. In contrast to the macroscopic water loss rate, which increases monotonically with temperature, the relative water retention performance of DEI exhibits non-monotonic fluctuation characteristics.
In the temperature range of 30–70 °C, Deff initially increases, then decreases, and subsequently increases again, causing corresponding fluctuations in the Rt values. As thermal energy increases, some weak hydrogen bonds within the system begin to rupture, leading to a weakening of the binding forces acting on water molecules. Simultaneously, the rise in temperature causes a decrease in system viscosity, thereby reducing the diffusion resistance for water molecules. The combined effect of these factors results in transient fluctuations in water retention performance.
The temperature range of 80–110 °C represents the optimal zone for water retention, where Rt reaches its peak value. Within this temperature range, following the partial evaporation of water, the hydrogen bond network of the system undergoes reconstruction. Hydrogen bond sites previously occupied by water molecules re-associate with the hydrogen bond acceptor (HBA) and hydrogen bond donor (HBD), thereby enhancing the strength of the hydrogen bond network and forming a denser three-dimensional network structure capable of effectively locking in water molecules [18]. This dense network generates a significant steric hindrance effect, substantially increasing the tortuosity of the diffusion paths for water molecules.
In the temperature range above 120 °C, Deff rises to 1.95 × 10⁻⁵ m2/s, while Rt drops to 0.63. At this stage, the thermal energy has exceeded the stability threshold of the internal hydrogen bond network and Van der Waals forces within the DEI. Consequently, a large number of strong hydrogen bonds rupture, causing bound water to transform into highly mobile free water.

3.2. Thermo-Kinetic Analysis of Oxidation of DEI-Inhibited Coal

Heat flow curves for eight groups of coal samples during the oxidation heating process were obtained using a Micro-scale Combustion Calorimeter (MCC). Oxidation kinetic fitting was performed on each experimental group to calculate the apparent activation energy, thereby comprehensively characterizing the oxidation propensity of the coal and the specific suppression performance of the DEI.
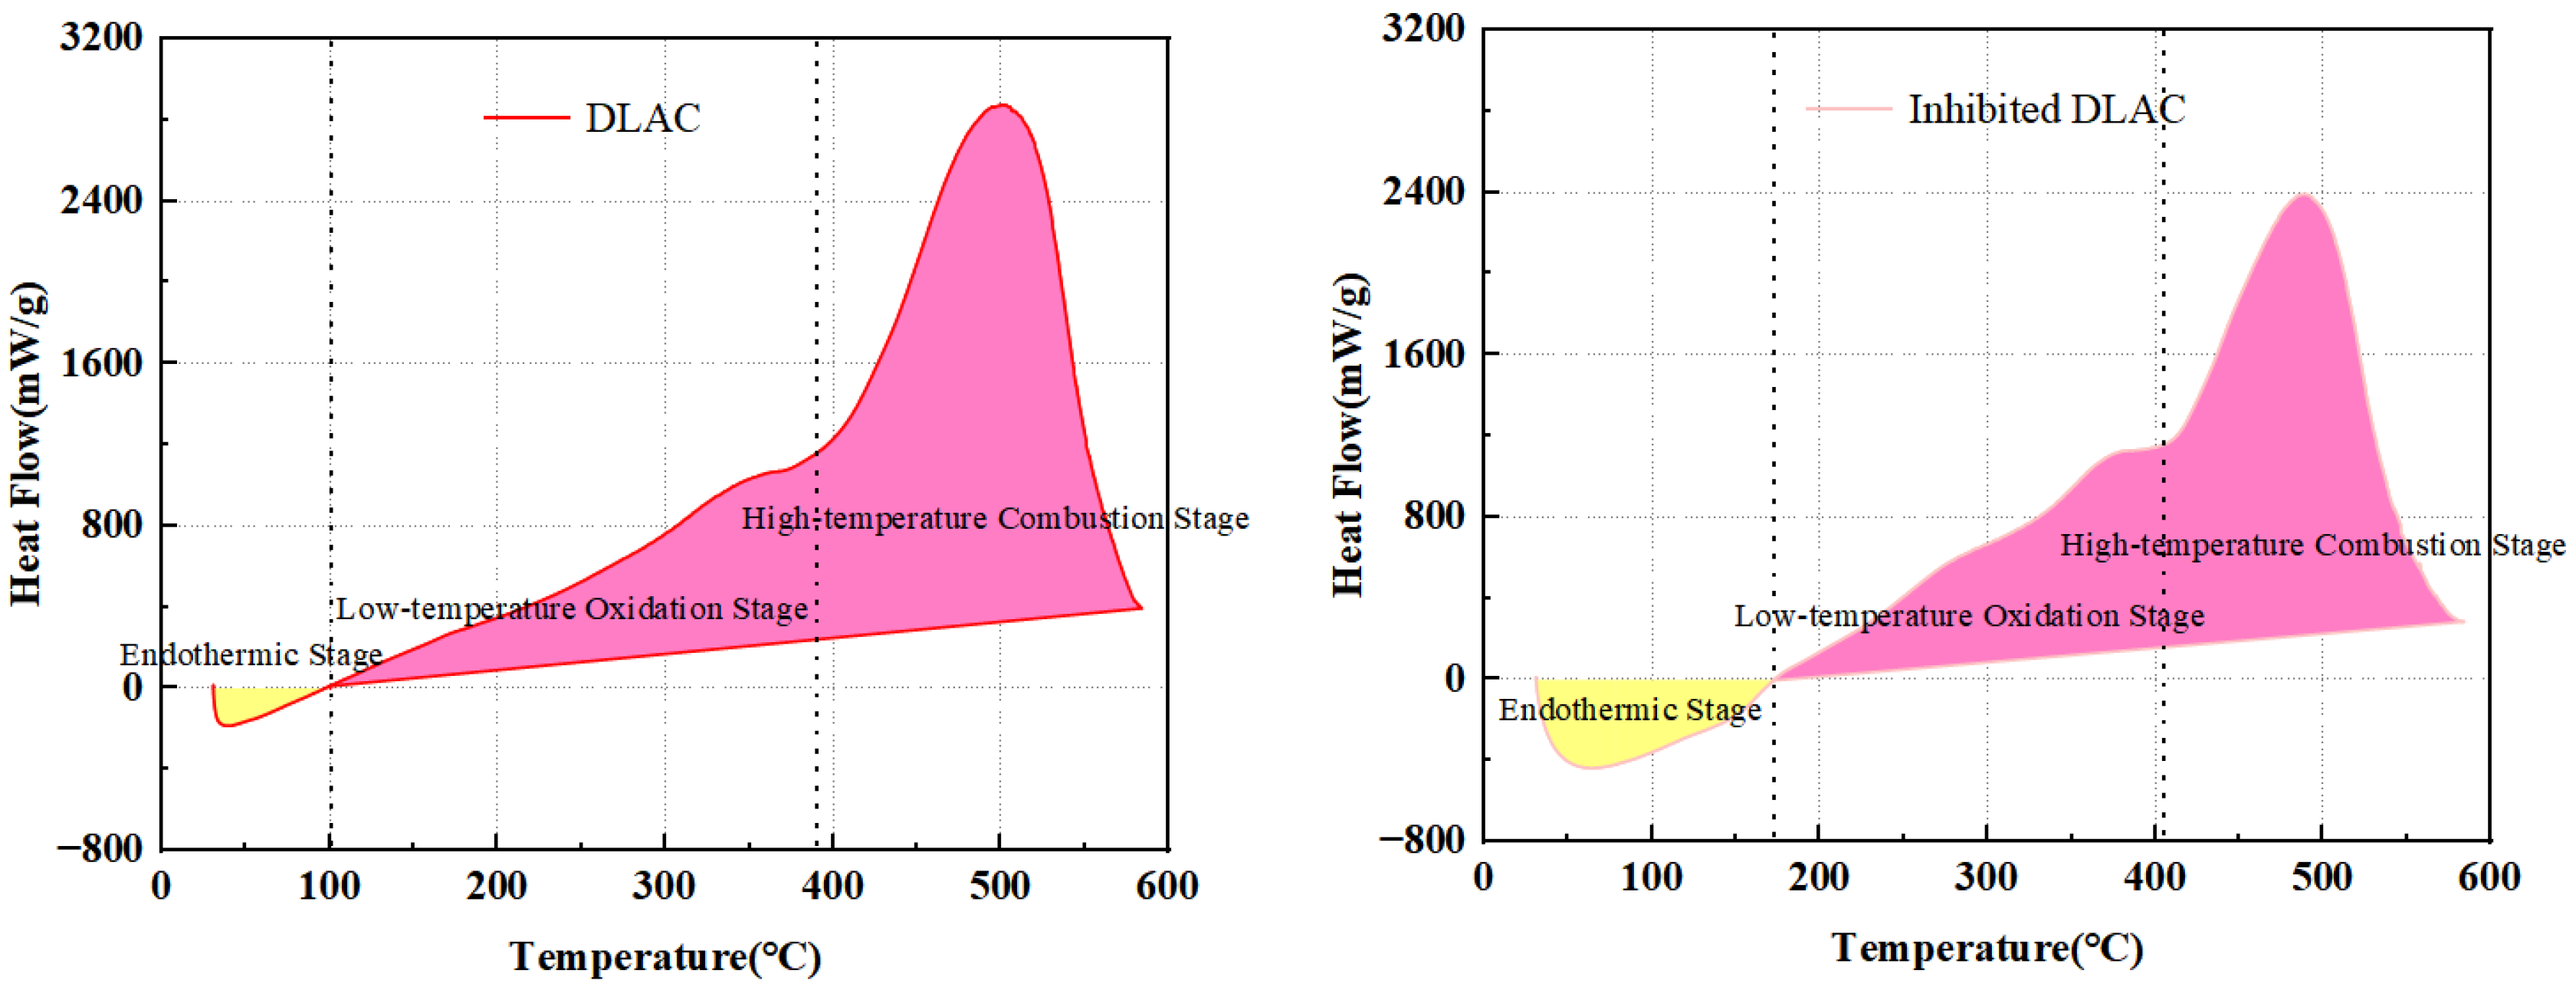
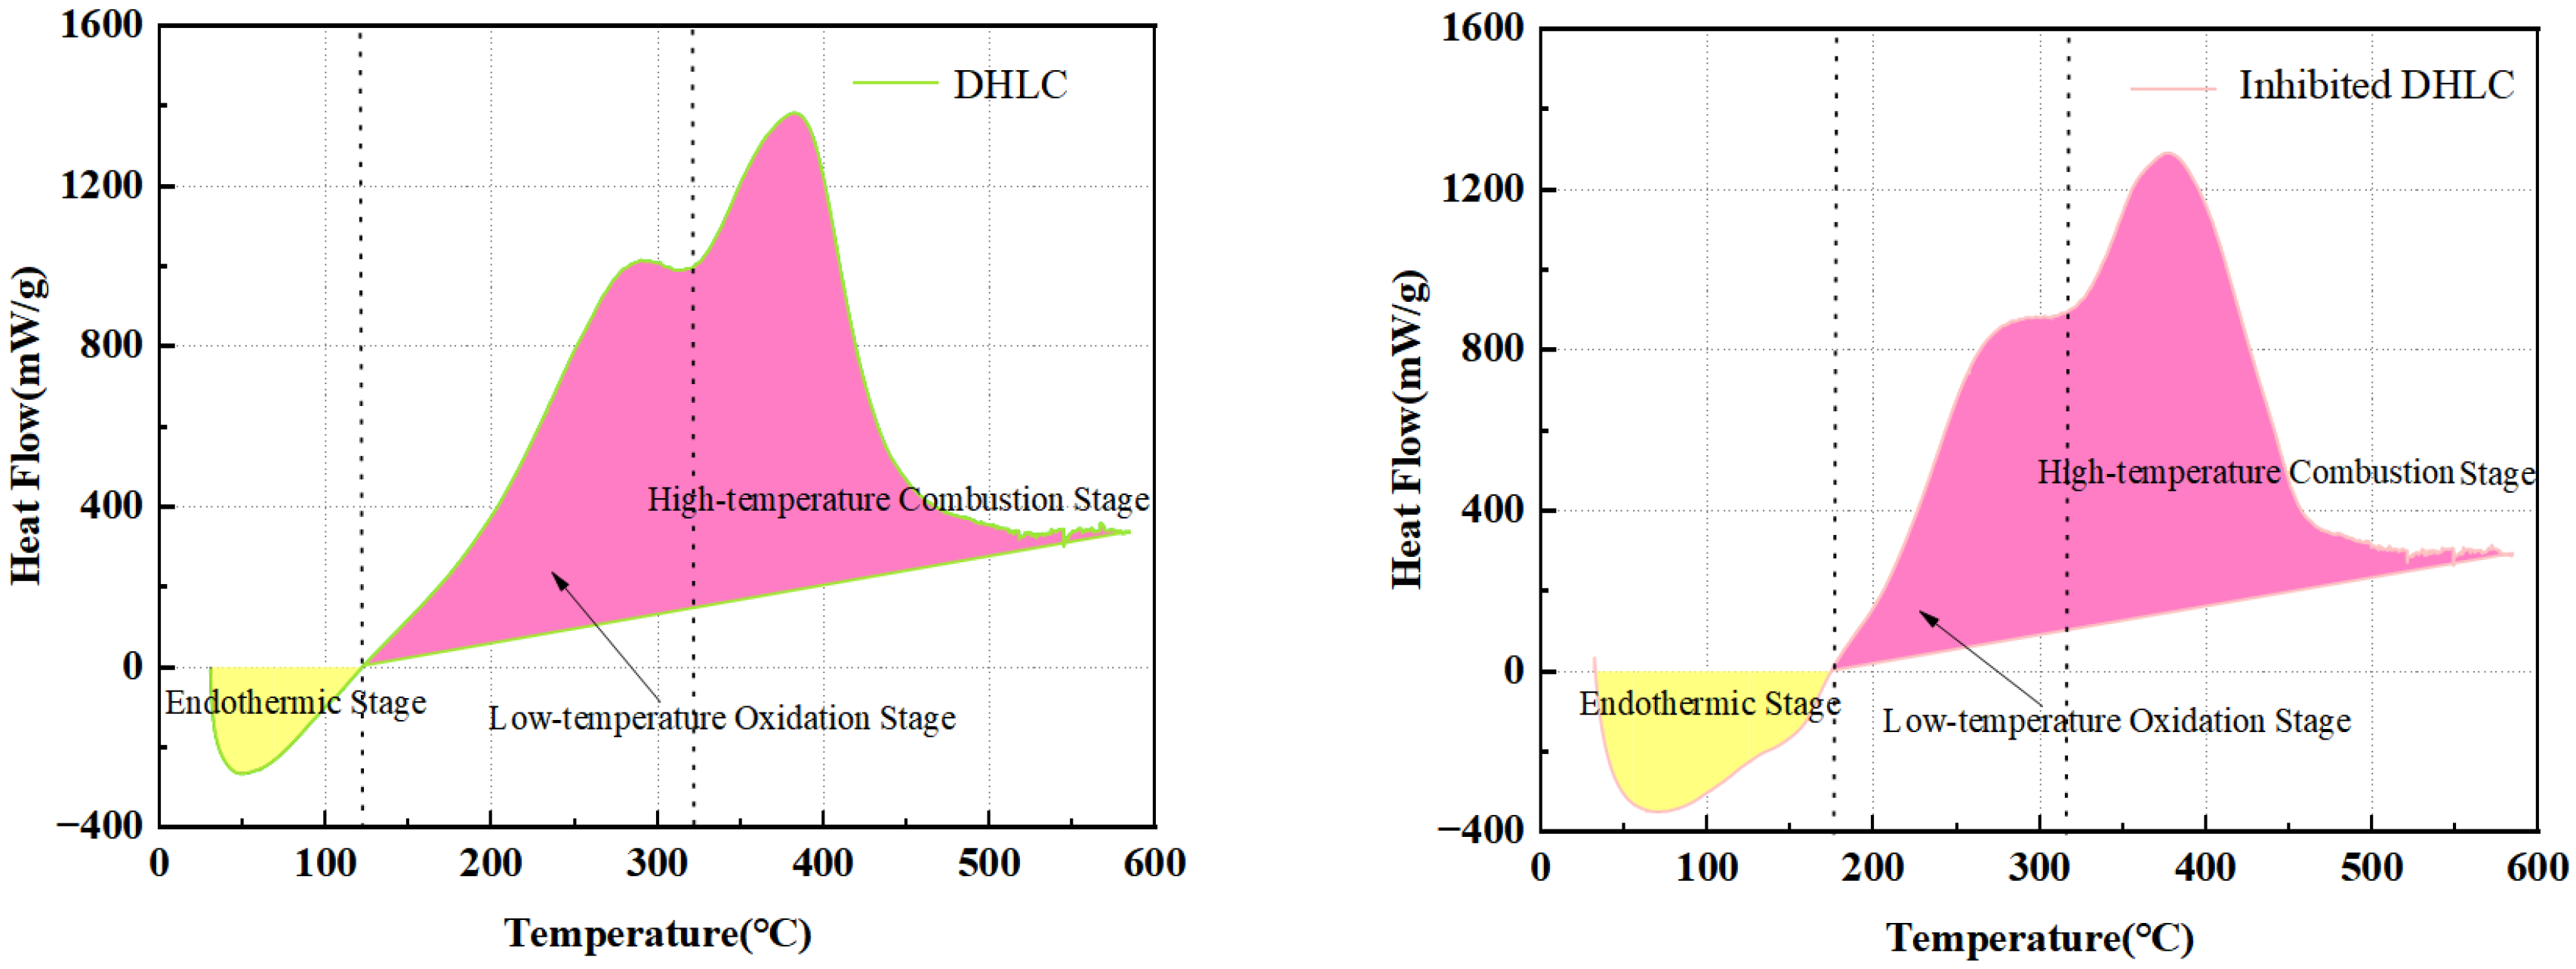
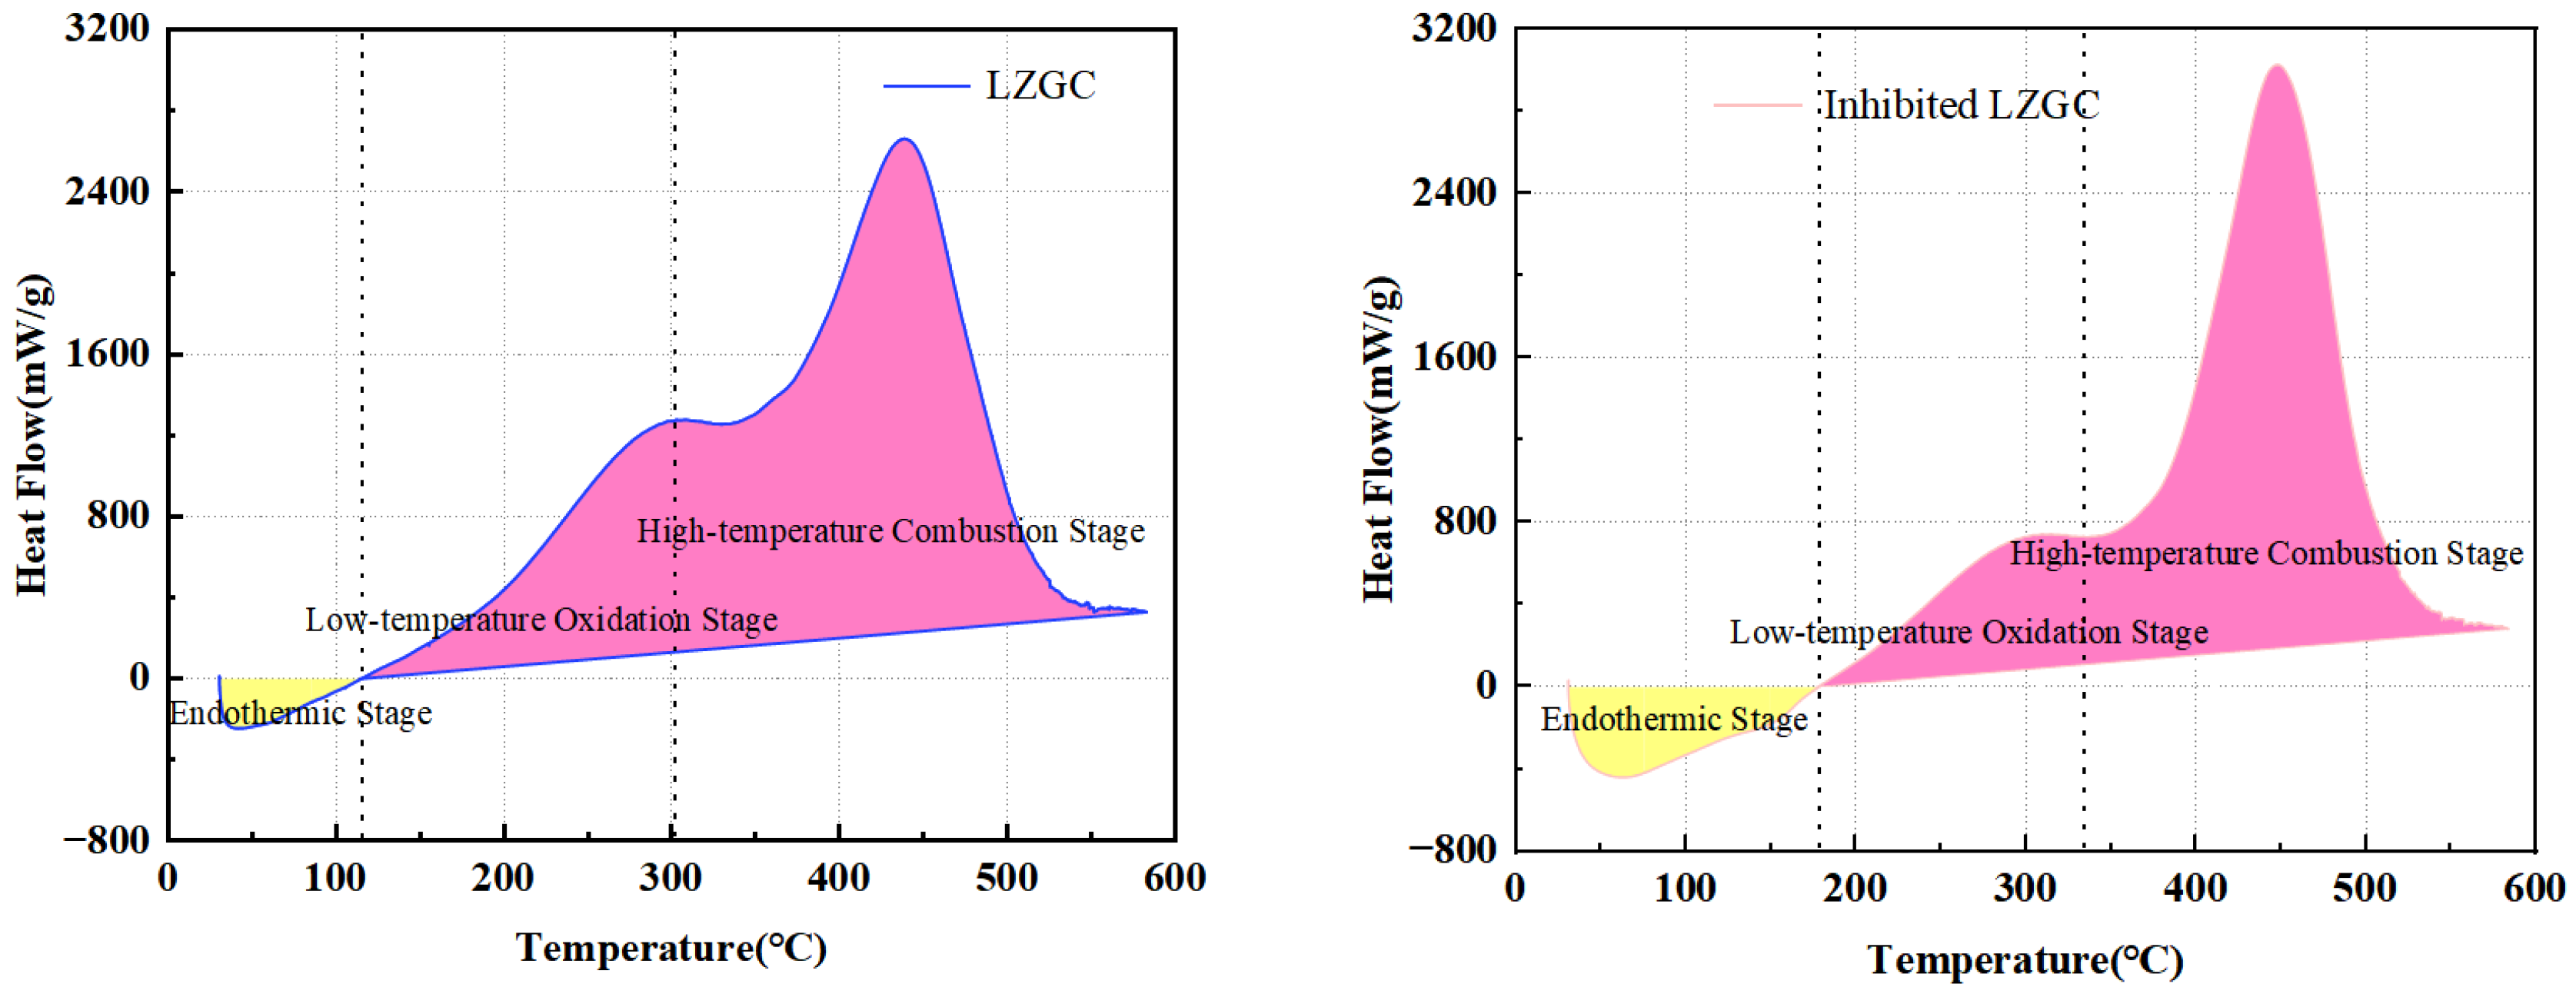
Based on the characteristics of the heat flow curves, the oxidation process of the coal samples across the entire temperature range was categorized into three critical stages: the endothermic stage, the low-temperature oxidation stage, and the high-temperature combustion stage [19]. This segmentation strategy effectively eliminates the interference of moisture evaporation and intense combustion, allowing for the quantification of the inhibitory efficacy of DEI on the incubation period of coal spontaneous combustion.
As shown in Figure 5, the oxidation heat release process of the coal samples exhibits distinct staged characteristics with increasing temperature. The onset oxidation temperature of the raw DHLC was 49 °C, whereas that of the inhibited DHLC was delayed to 78 °C. This phenomenon indicates that the inhibitor effectively suppressed the contact between active sites and oxygen during the initial stage of low-temperature oxidation, thereby postponing the occurrence of the oxidation reaction. As the temperature continued to rise, the oxidation reaction intensified, and a distinct exothermic peak appeared in the heat flow curve. The peak heat flow of DHLC reached 1381.8 mW/g, with a corresponding peak temperature of 382 °C. In contrast, the peak heat flow of the inhibited DHLC decreased to 1290 mW/g, representing a reduction of 6.64%, with a corresponding peak temperature of 378.5 °C.
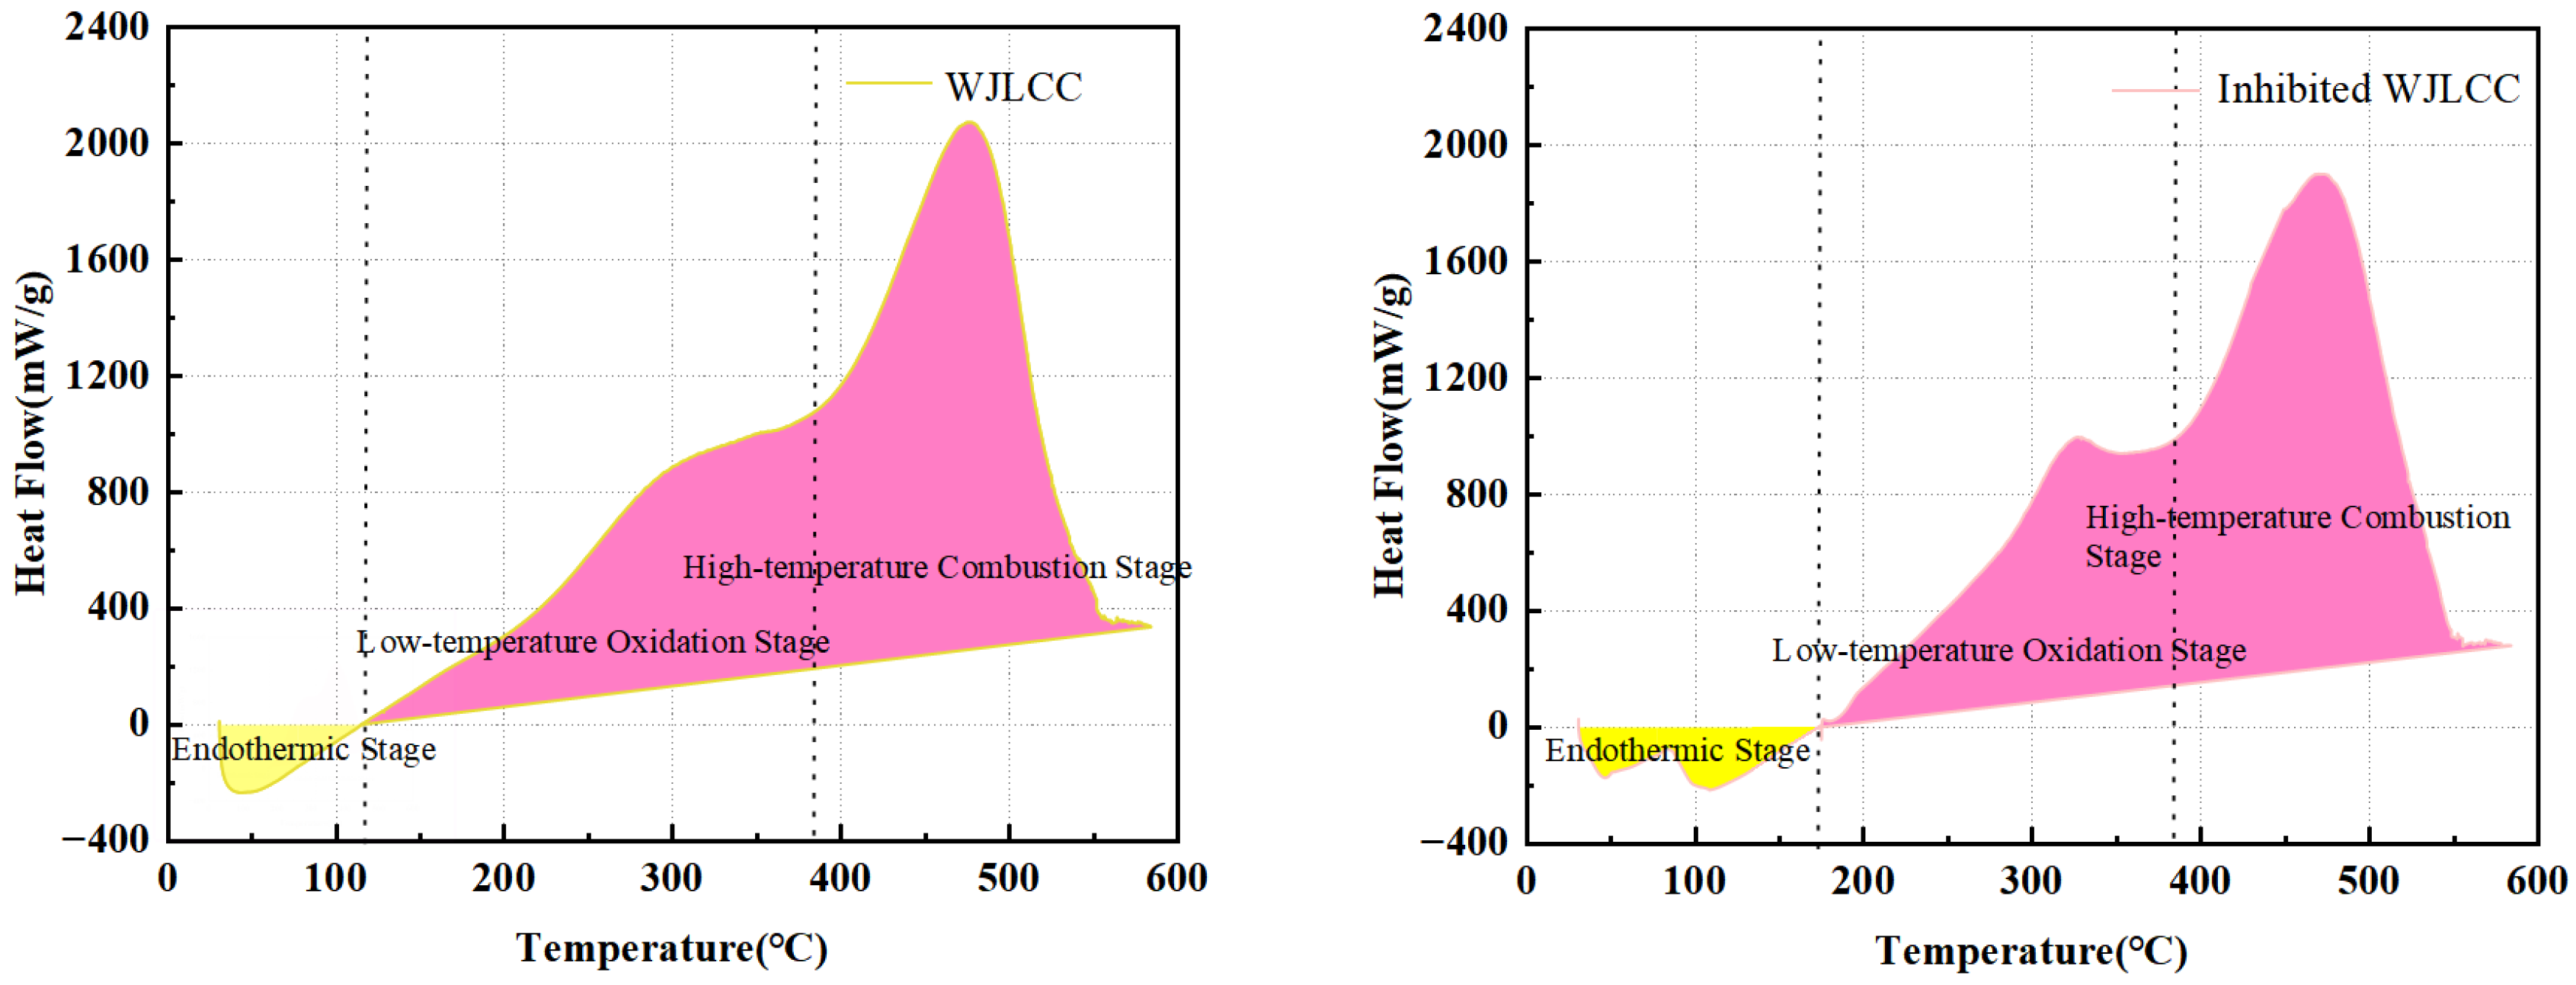
As shown in Figure 6, the onset oxidation temperature of the raw WJLCC was 42.5 °C, while that of the inhibited WJLCC was delayed to 42.9 °C. Although the inhibitor postponed the occurrence of the oxidation reaction, the effect was less pronounced compared to that observed for DHLC. As the temperature continued to rise, the oxidation reaction intensified, resulting in a distinct exothermic peak in the heat flow curve. The peak heat flow of WJLCC reached 2073.4 mW/g, with a corresponding peak temperature of 477 °C. In contrast, the peak heat flow of the inhibited WJLCC decreased to 1901.3 mW/g, representing a reduction of 8.30%, with a corresponding peak temperature of 473 °C.
As shown in Figure 7, the onset oxidation temperature of the raw DLAC was 40.1 °C, whereas that of the inhibited DLAC was delayed to 64.2 °C, indicating that the inhibitor effectively postponed the occurrence of the oxidation reaction. As the temperature continued to rise, the oxidation reaction intensified, resulting in a distinct exothermic peak in the heat flow curve. The peak heat flow of DLAC reached 2874 mW/g, with a corresponding peak temperature of 502 °C. In contrast, the peak heat flow of the inhibited DLAC decreased to 2391.5 mW/g, representing a reduction of 16.79%, with a corresponding peak temperature of 489 °C.
As shown in Figure 8, the onset oxidation temperature of the raw LZGC was 42.5 °C, while that of the inhibited LZGC was delayed to 42.9 °C, indicating that the inhibitor delayed the occurrence of the oxidation reaction. As the temperature continued to rise, the oxidation reaction intensified, resulting in a distinct exothermic peak in the heat flow curve. The peak heat flow of LZGC reached 2662.2 mW/g, with a corresponding peak temperature of 438 °C. However, in contrast to the other samples, the peak heat flow of the inhibited LZGC increased to 3026.3 mW/g, representing an increase of 13.68%, with a corresponding peak temperature of 447.8 °C.
As indicated in Table 4, during the high-temperature oxidation stage (200–400 °C), the apparent activation energy (Ea) of all DEI-treated coal samples exhibited a significant increase. Moreover, the Ea values of the inhibited samples were consistently higher than those of the corresponding raw coal samples. This phenomenon confirms, from a kinetic perspective, the potent inhibitory effect of DEI on the heat and gas generation processes during coal spontaneous combustion.
The heat flow q (mW/g) measured by the micro-calorimeter reflects the rate of the coal-oxygen reaction. According to the Arrhenius law, the relationship between the reaction rate constant k and temperature T is given by:
k = A · e x p E a R T
where k is the reaction rate constant, and A represents the pre-exponential factor. In micro-calorimetry experiments, assuming that the reaction order and oxygen concentration remain relatively constant within a specific stage, the relationship between heat flow q and temperature T can be simplified to a linear logarithmic form:
l n q = C E a R T
where q is the heat flow (mW/g); T is the absolute temperature (K); R is the universal gas constant (8.314 J/(mol·K)); Ea is the apparent activation energy (kJ/mol); and C is a constant term related to the pre-exponential factor and the heat of reaction.
The kinetic analysis was focused on the 200–400 °C range because the heat flow (q) in the early stage (<200 °C) is dominated by endothermic moisture evaporation, resulting in negative values that preclude the use of the logarithmic Arrhenius equation. Instead, the inhibitory effect during the incubation period was characterized by transition and onset oxidation temperatures.
The total heat release Q during the coal oxidation process is calculated using the following formula:
Q = T e n d T s t a r t q T q b a s e β d T
where Q represents the cumulative heat release per unit mass of the coal sample (J/g); Tstart and Tend denote the initial and final temperatures of the integration interval (°C), respectively; qT is the experimentally measured heat flow at a given temperature (mW/g); qbase is the baseline heat flow (mW/g); and β is the programmed heating rate (K/s). In this experiment, β was set to 1 °C/min (equivalent to 0.0167 K/s).
The baseline function, qbase is expressed as follows:
q b a s e = q s t a r t + q e n d q s t a r t T e n d T s t a r t × T T s t a r t
where qstart is the measured heat flow at the starting point of integration (mW/g); qend is the measured heat flow at the ending point of integration (mW/g); Tstart is the onset temperature of the low-temperature oxidation stage (°C); and Tend is the termination temperature of the high-temperature combustion stage (°C).
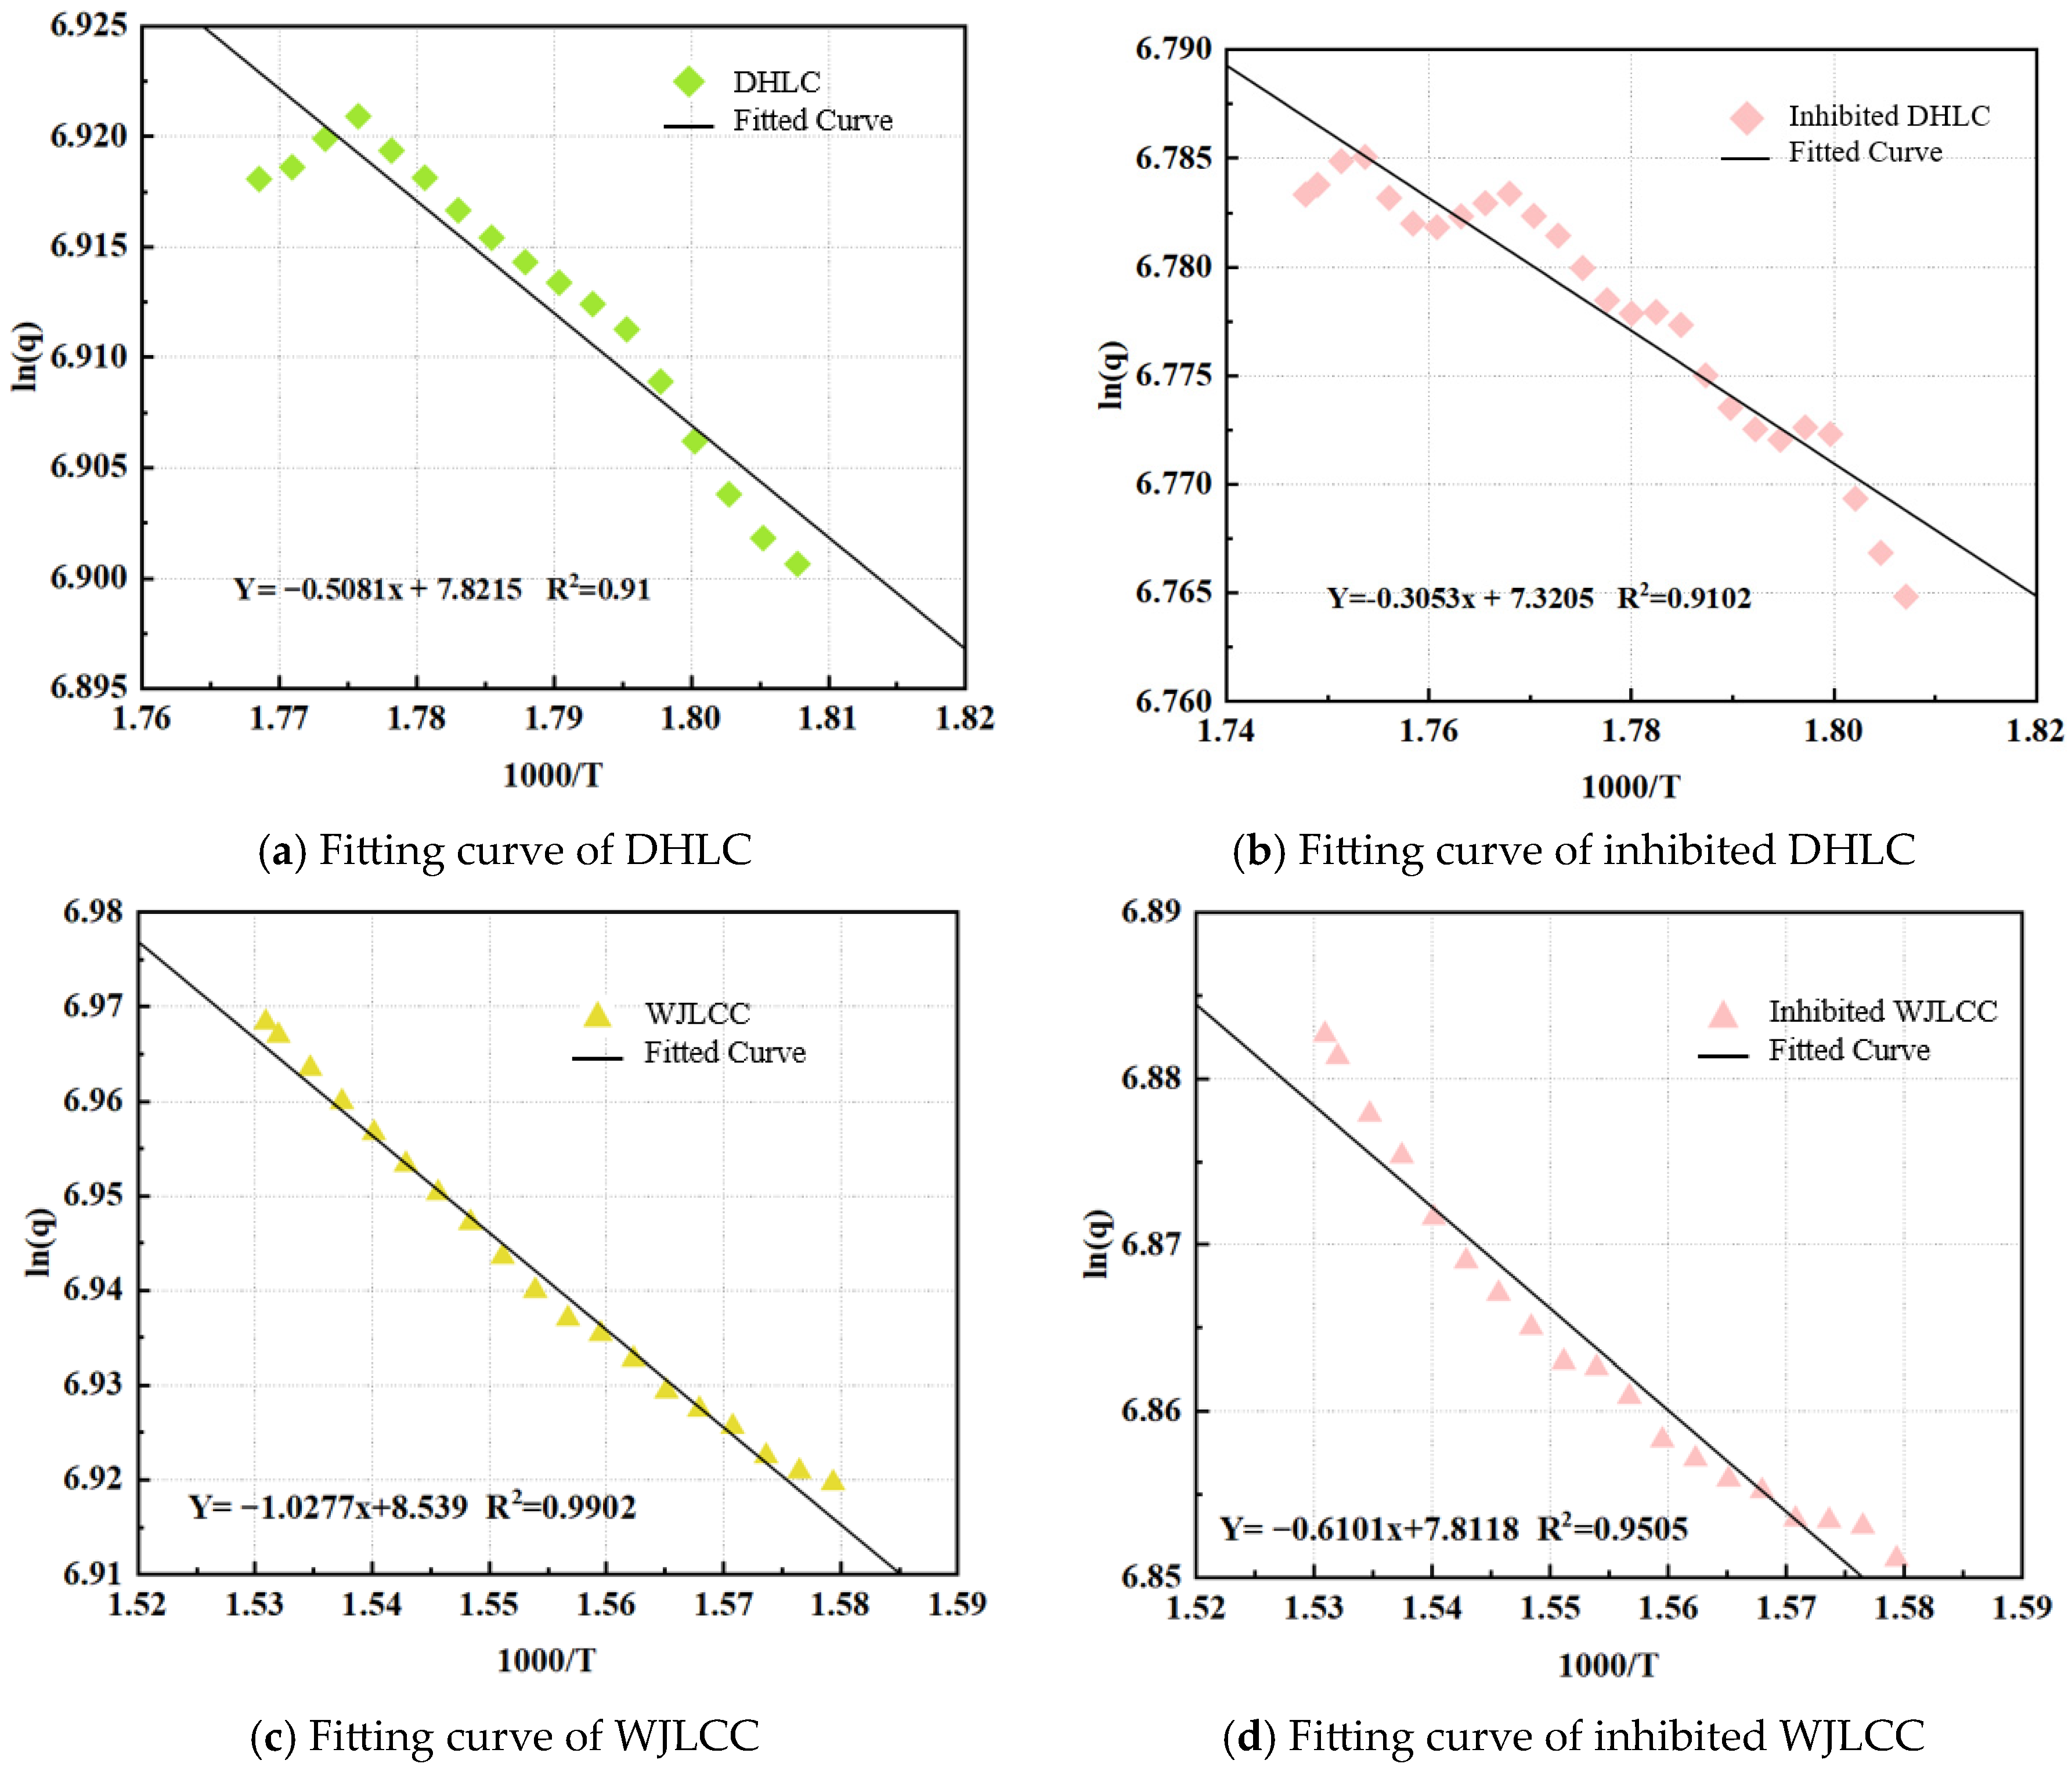
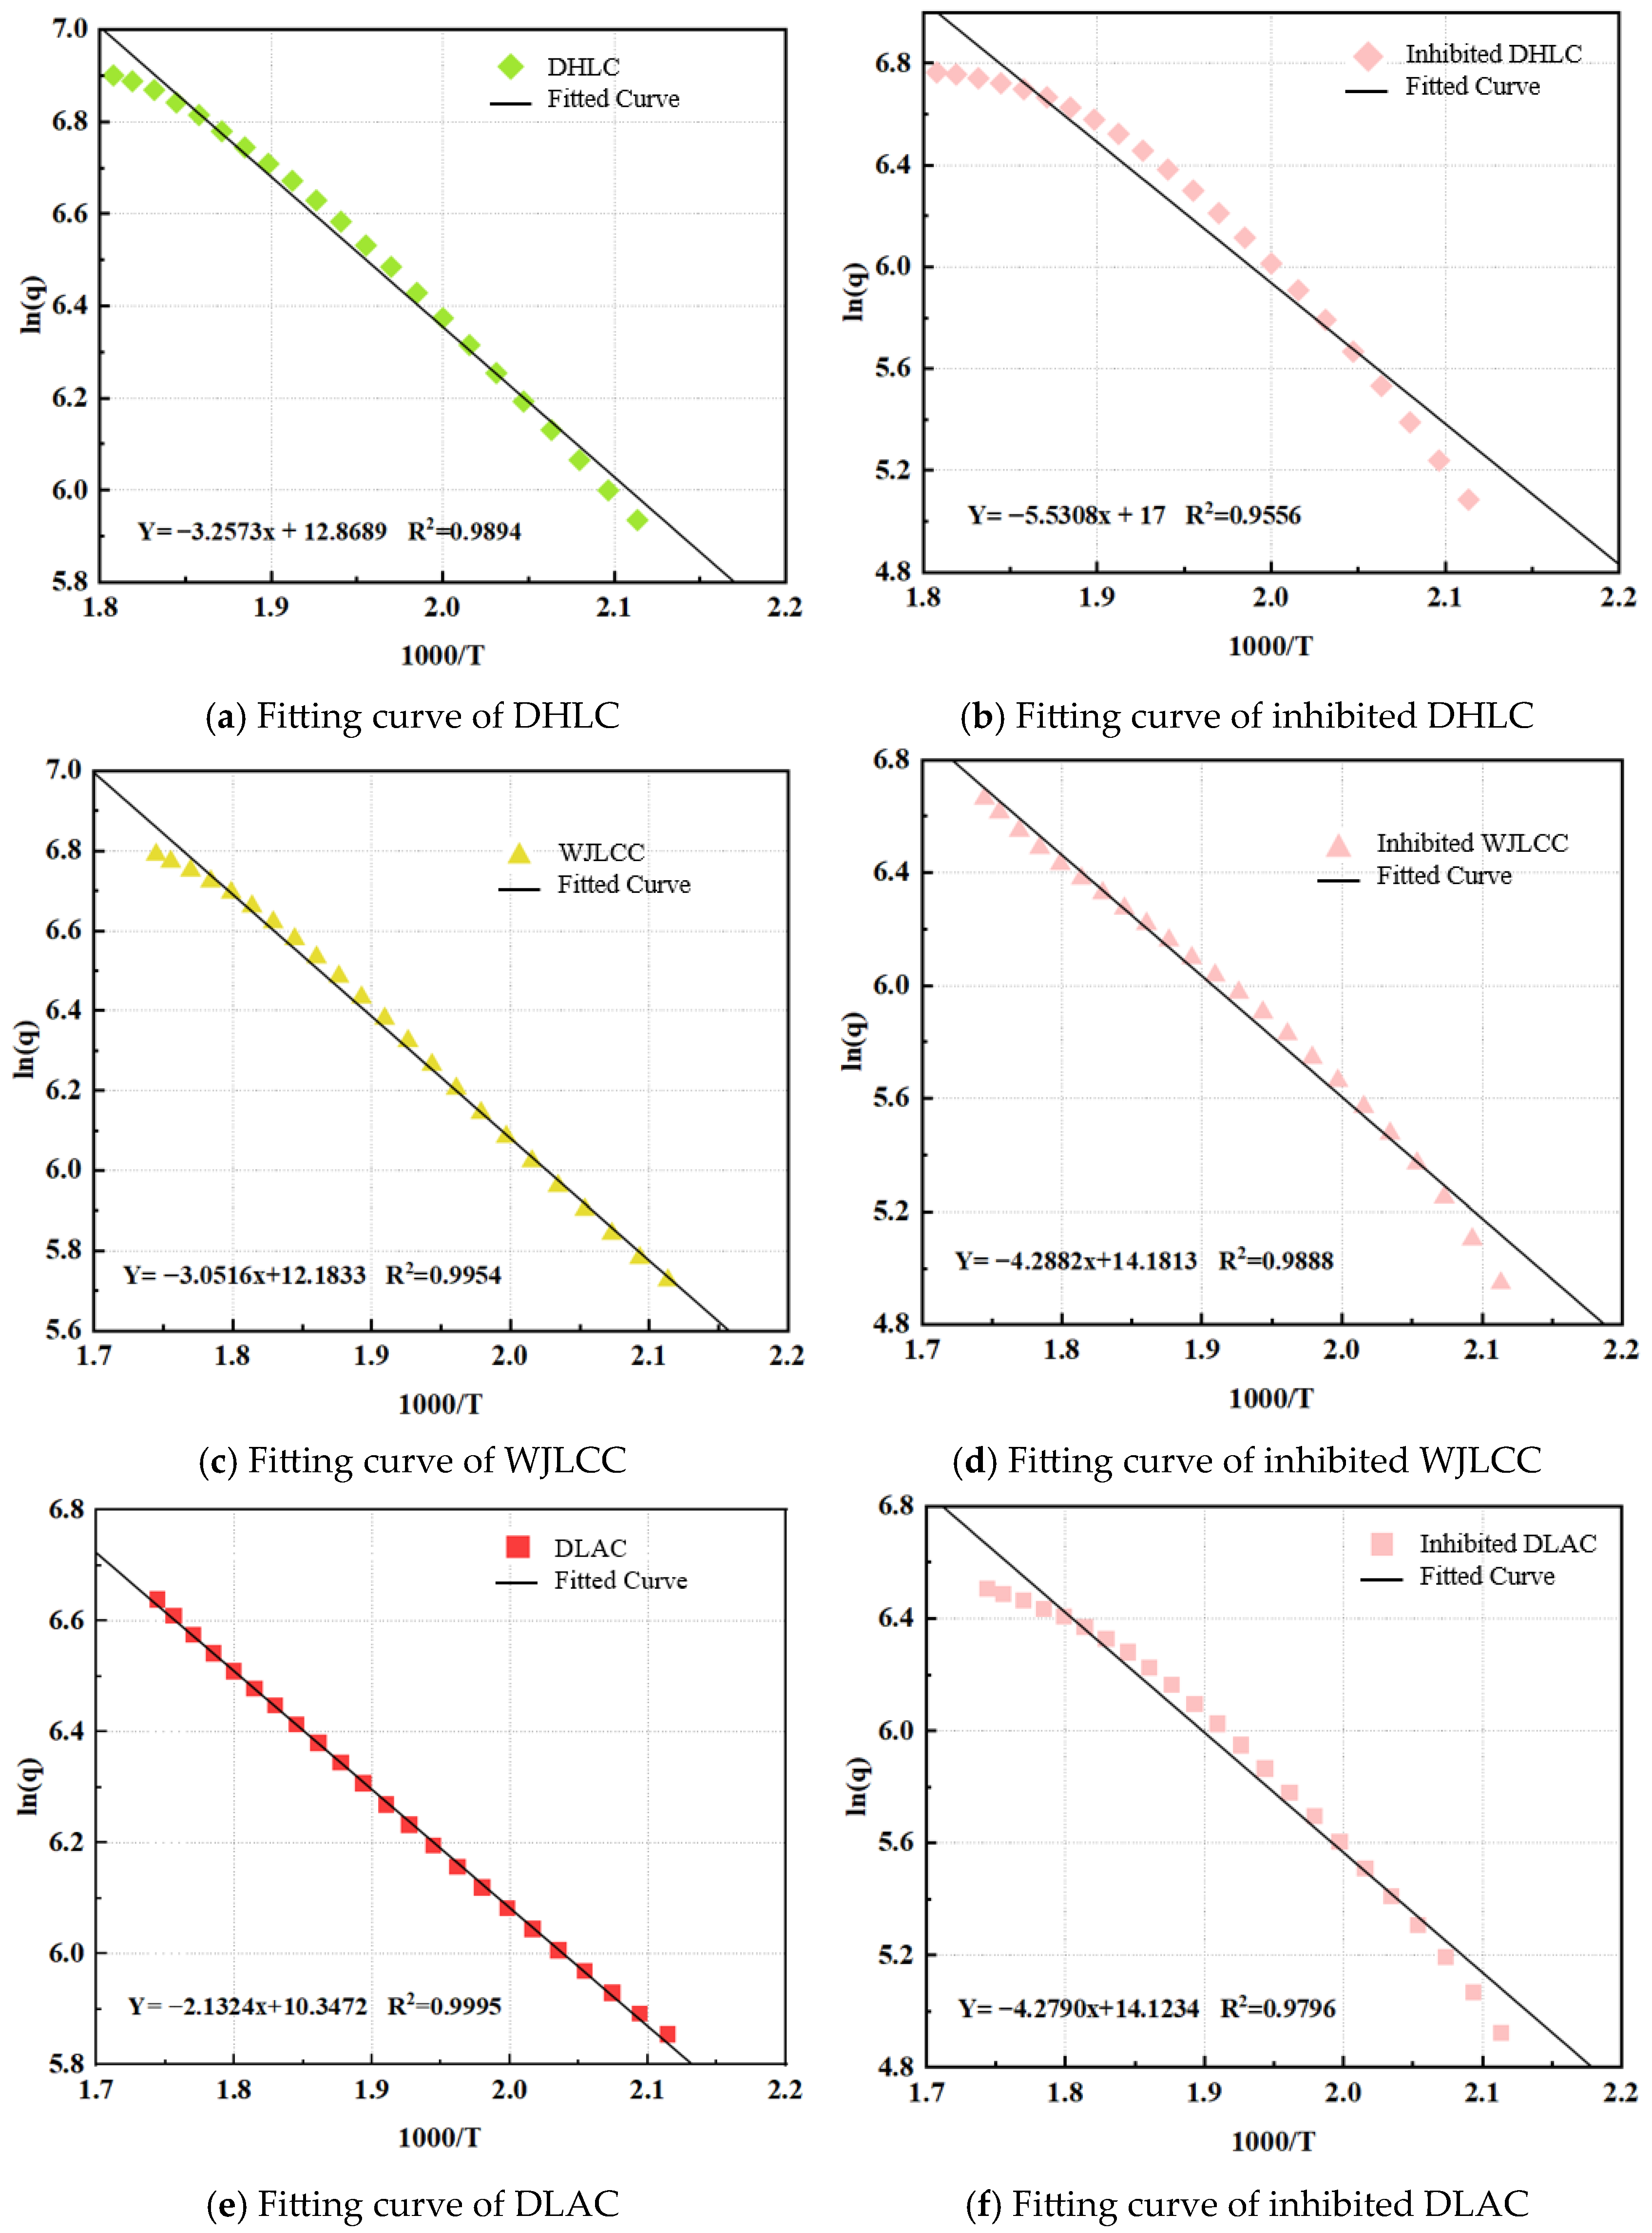
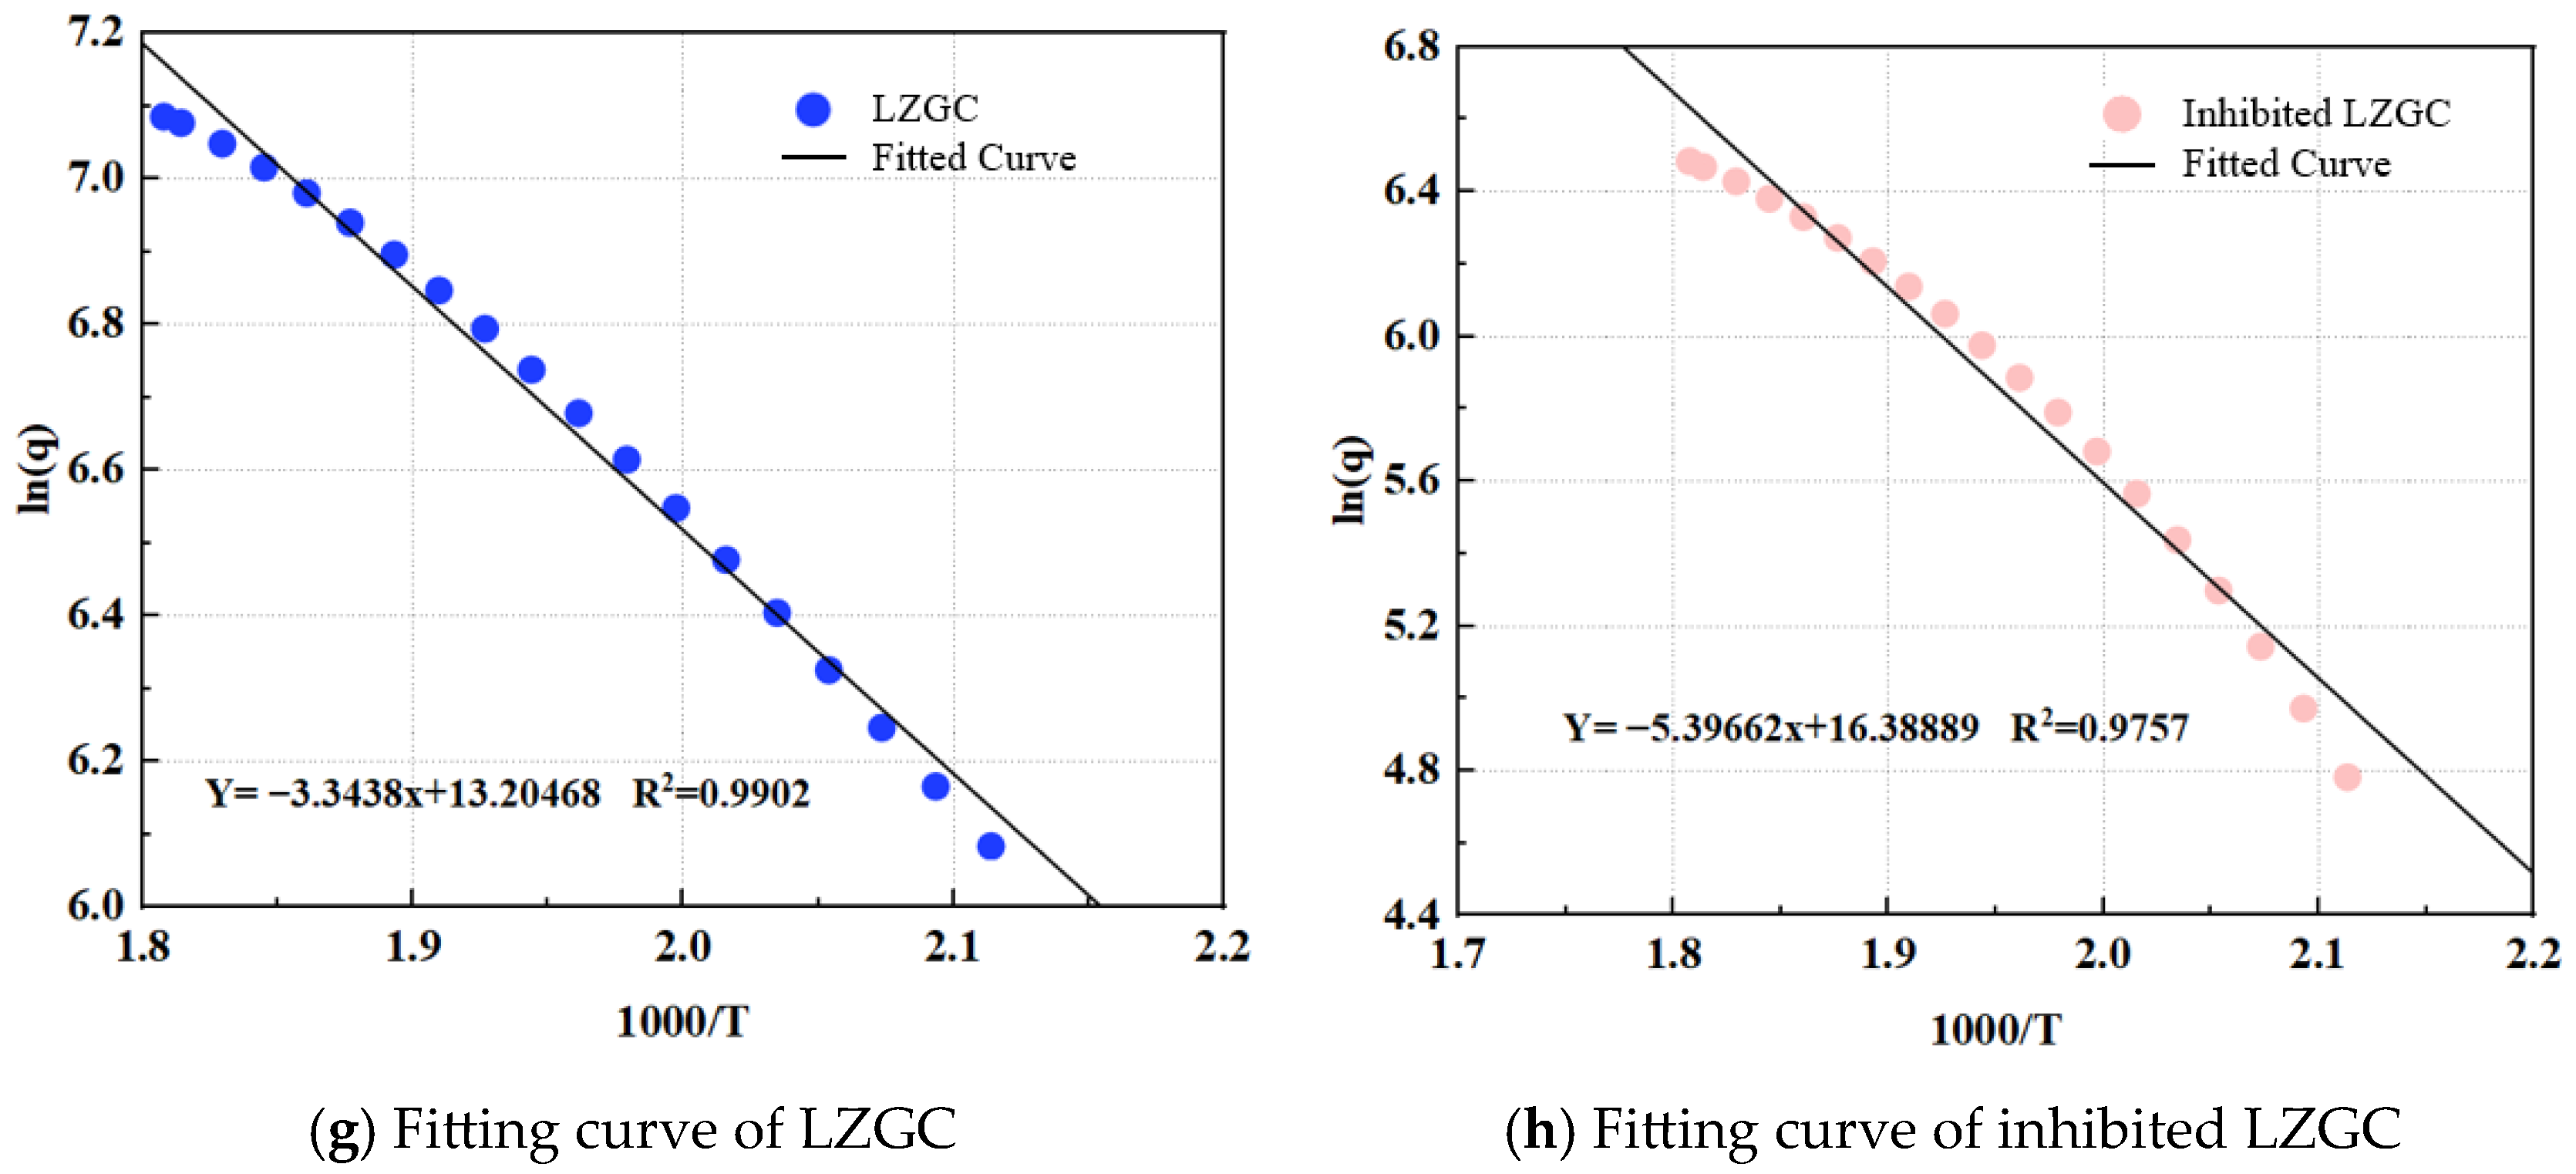
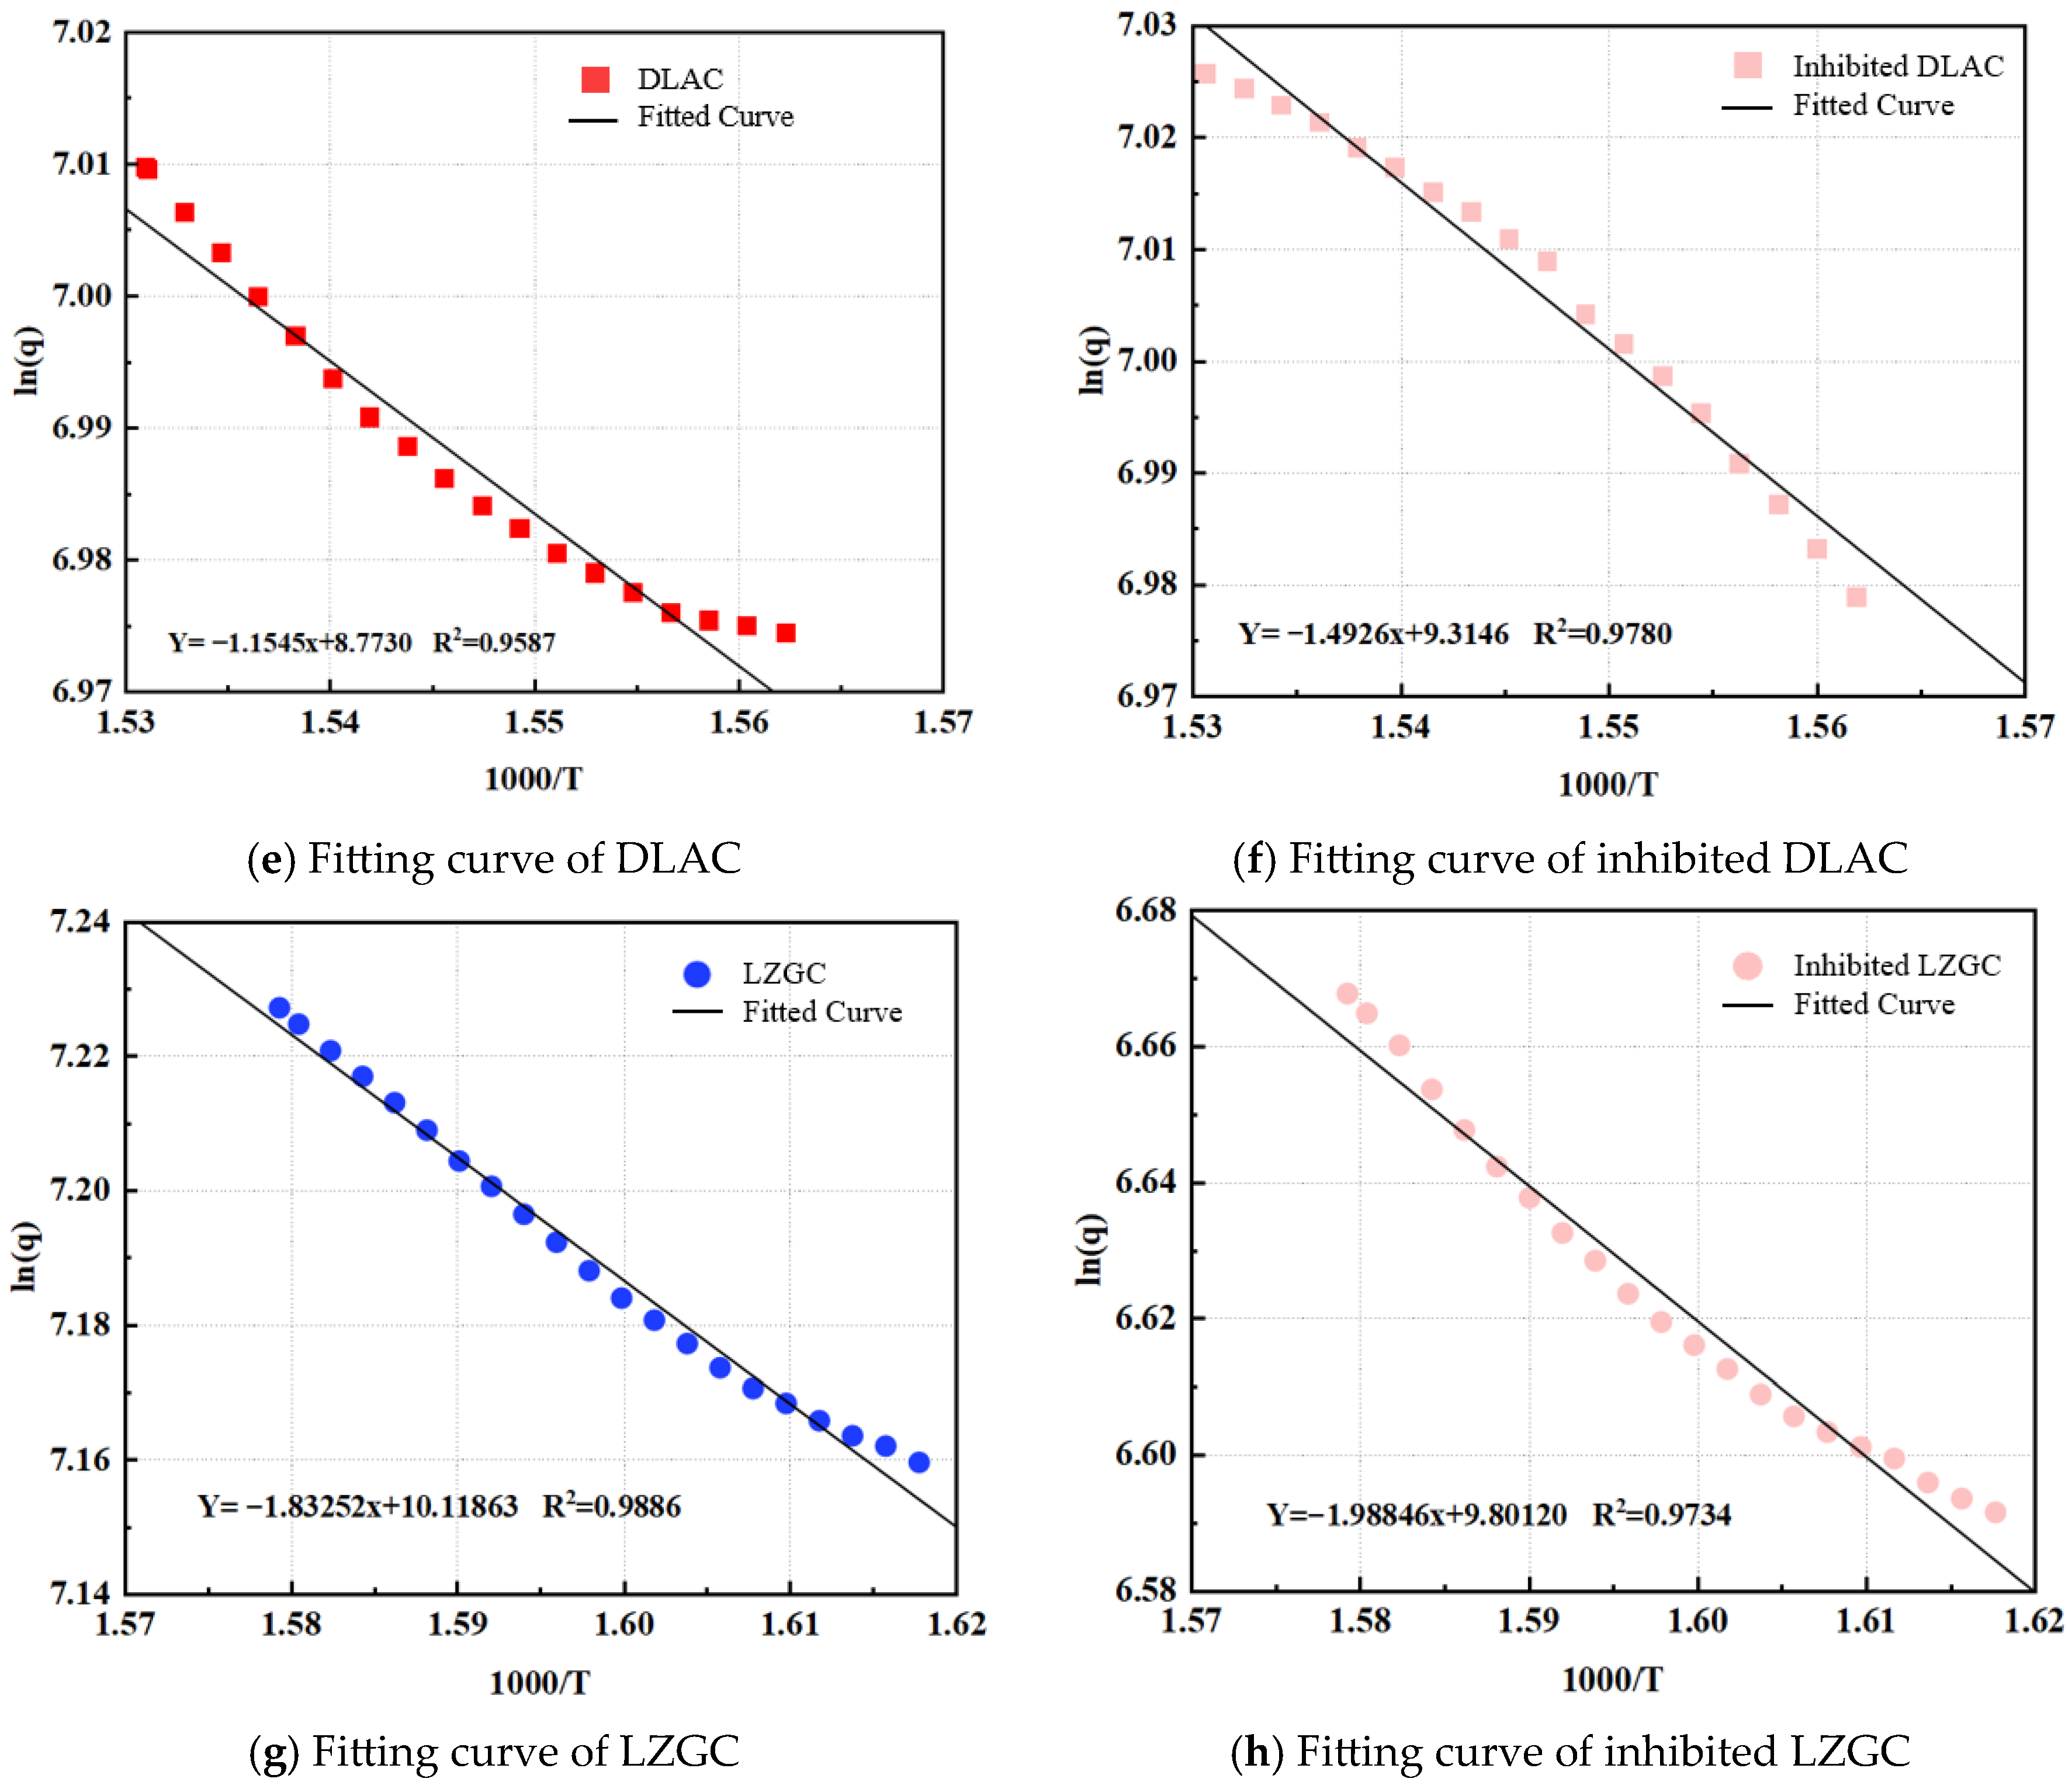
Consequently, the heat flow curves corresponding to the low-temperature oxidation stage were selected to perform oxidation kinetic fitting for the different coal samples within the temperature range of 200–400 °C. The resulting fitted curves are presented in in Figure 9 and Figure 10.
The correlation coefficients of the linear fitting for all coal samples exceeded 0.91, indicating a satisfactory fitting result. Based on the formula, the apparent activation energies of the different coal samples were calculated. The apparent activation energy of the coal oxidation reaction serves as a quantitative parameter to characterize the reaction rate during the oxidation process. Generally, a lower apparent activation energy indicates that the oxidation reaction occurs more readily, characterized by a faster reaction rate and more pronounced exothermic behavior, thereby signifying a higher propensity for spontaneous combustion. Furthermore, given that the quantity and species of free radicals in coal play a pivotal role in oxidation reactions and heat release properties, the apparent activation energy can effectively reflect the influence of the antioxidant components (within the inhibitor/extract) on the generation and evolution of free radicals during the coal heating process. The fitting equations and apparent activation energy values for different coal samples are shown in Table 5.
Within the temperature range of 200–300 °C, the apparent activation energy of all coal samples varied between 17.73 kJ/mol and 45.98 kJ/mol. The ranking order of the Ea values is as follows: Inhibited DHLC > Inhibited LZGC > Inhibited WJLCC > Inhibited DLAC > LZGC > DHLC > WJLCC > DLAC.
In the 300–400 °C range, the Ea values for all samples fell between 2.54 kJ/mol and 16.53 kJ/mol, with the ranking order being: Inhibited LZGC > LZGC > Inhibited DLAC > DLAC > WJLCC > Inhibited WJLCC > DHLC > Inhibited DHLC.
Across the entire 200–400 °C interval, the apparent activation energy of almost all DEI-treated coal samples was higher than that of the corresponding raw coal. This indicates that the antioxidant components within the Deep Eutectic Inhibitor (DEI) effectively suppress the reaction process from the oxygen absorption (weight gain) stage to the combustion stage. Consequently, the DEI increases the activation energy barrier required for the coal-oxygen reaction, thereby enhancing the coal’s resistance to oxidation.

3.3. Mechanism Analysis of DEI Inhibition

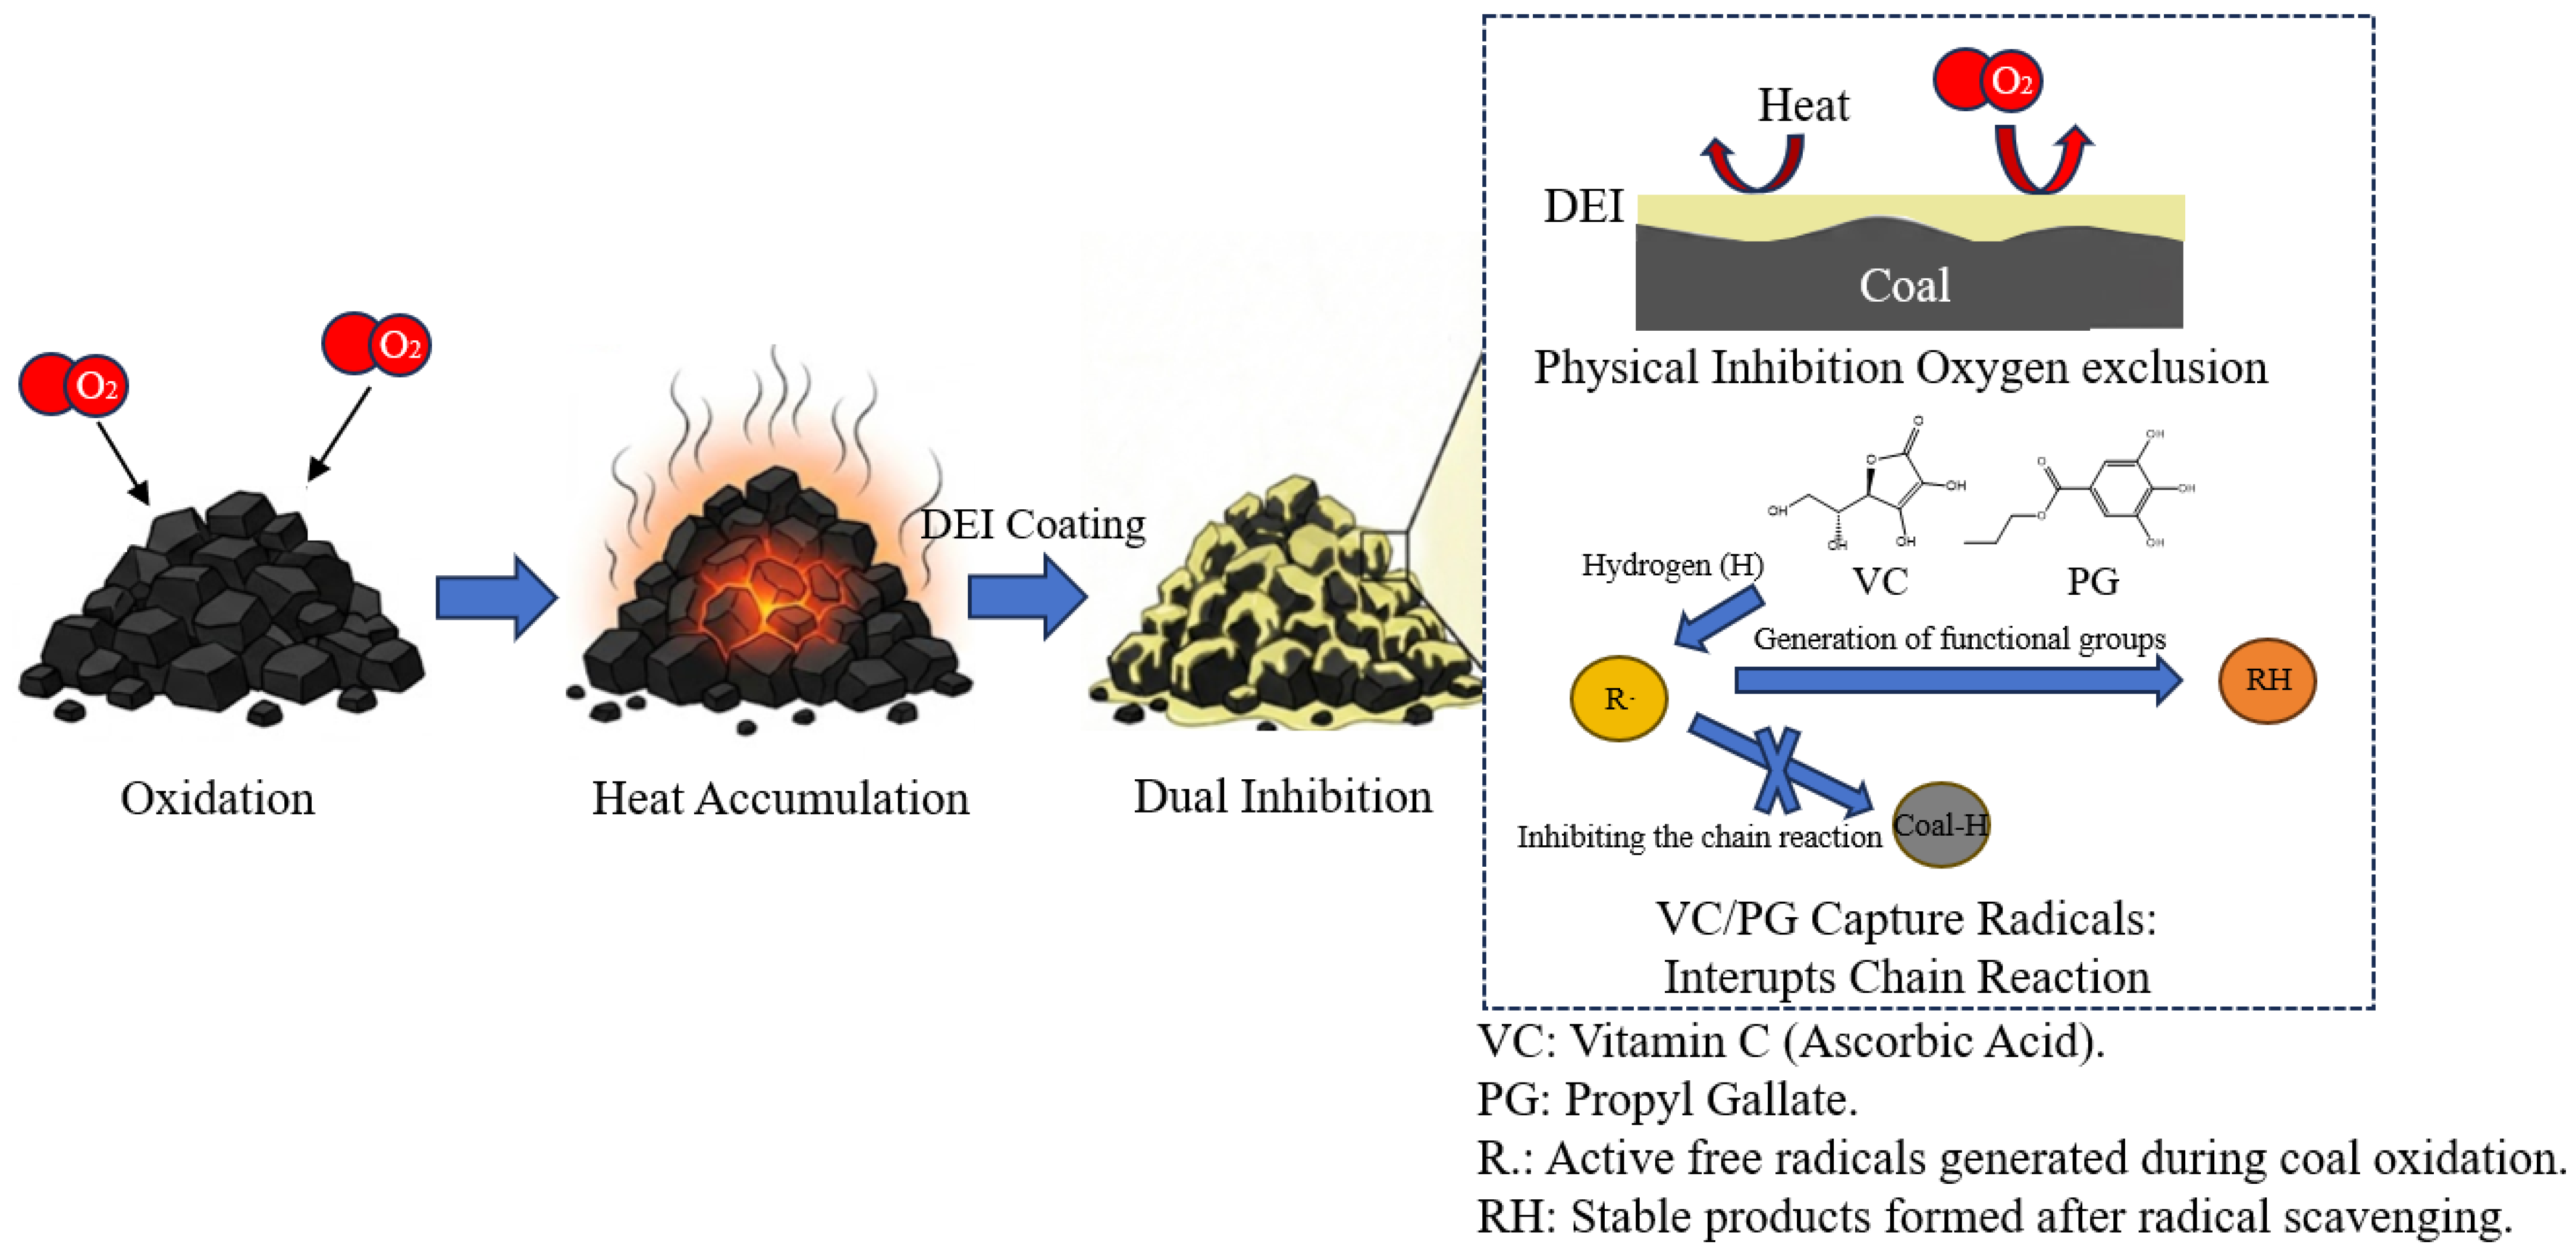
As illustrated in Figure 11, the inhibitory effect of DEI reveals a triple synergistic mechanism comprising “physical shielding (macroscopic), structural adaptability (mesoscopic), and chemical passivation (microscopic).”Firstly, regarding physical inhibition, DEI exhibits excellent wettability and film-forming properties. Upon spraying, it rapidly forms a continuous and dense liquid inhibition film (labeled as DEI Coating) on the surface of coal particles. This liquid film effectively severs the diffusion channel of oxygen from the air to the coal matrix, creating a suffocation effect (Oxygen exclusion). Acting as a poor thermal conductor, the film blocks the transfer of external heat into the coal body while simultaneously slowing down the temperature rise caused by the coal’s self-heating accumulation (Heat Accumulation). Secondly, regarding structural adaptability, DEI molecules are relatively loose at low temperatures. However, as the temperature rises to the critical range for coal spontaneous combustion, the DEI does not volatilize rapidly like common solvents; instead, it undergoes hydrogen bond reconstruction. High temperatures induce the directional alignment of DEI components, constructing a dense supramolecular network with high mass transfer resistance [20]. This structural adaptability creates a strong steric hindrance effect, firmly locking water molecules within the network, thereby maintaining a high moisture content and sustaining the endothermic cooling effect of water vaporization even at elevated temperatures. Thirdly, regarding chemical passivation, the abundant active functional groups (e.g., hydroxyl -OH, amino -NH2) in the biomass materials interact strongly with oxygen-containing groups on the substrate. The carboxyl and hydroxyl groups in DEI not only form stable internal supramolecular structures but also preferentially form high-strength hydrogen bonds with active oxidation sites on the coal surface. This interaction essentially occupies the active sites, establishing a chemical barrier at the molecular level that passivates the coal’s reactivity. Furthermore, as shown in the right panel of Figure 11, the active components in the retardant system, specifically Aa and Pg, serve as radical scavengers. During the initiation stage of coal oxidation, they react preferentially with the generated active radicals (R) [21]. This process interrupts the chain reaction of free radicals, thereby suppressing continuous heat release at the source.

4. Conclusions

  • Liquid domain stability experiments demonstrated that DEI with 30% moisture content exhibited excellent stability within the 30–120 °C range, with a water loss rate significantly lower than that of pure water. In the 80–110 °C interval, the system displayed unique retention behavior. The mechanism is attributed to the high-temperature-induced directional alignment of DEI components and hydrogen bond reconstruction, which constructed a dense supramolecular network with high mass transfer resistance. This allowed the system to maintain the stability of the liquid domain under extreme thermal environments through a structural adaptability effect.
  • Micro-calorimetry tests revealed that the onset oxidation temperature of DEI-treated coal samples was significantly delayed (e.g., DHLC delayed from 49 °C to 78 °C), and the endothermic-exothermic transition temperature was substantially increased. By forming a persistent liquid coating film on the coal surface and establishing hydrogen bonds with active functional groups, the inhibitor significantly reduced the peak heat flow during coal oxidation. In the critical oxidation stage of 200–400 °C, the Ea of all DEI-treated samples was significantly improved compared to raw coal. Notably, in the 200–300 °C range, the Ea of inhibited DHLC increased from 27.08 kJ/mol to 45.98 kJ/mol. This confirms, from the origin of energy release, that DEI can effectively retard the energy accumulation process involved in the transition from self-heating to open flame.
  • The triple synergistic inhibition mechanism of DEI was elucidated. Macroscopically, the DEI liquid film rapidly covers the coal surface, acting as a dense barrier to block oxygen diffusion and heat transfer. Mesoscopically, high temperatures induce internal hydrogen bond reconstruction within DEI to form a dense supramolecular network, achieving adaptive water locking and sustained cooling. Microscopically, the antioxidant components effectively scavenge free radicals and occupy reactive active sites, thereby interrupting the chain reaction of coal oxidation at the source.

Author Contributions

Conceptualization, Y.L. and T.W.; methodology, Y.W.; validation, S.S. (Shiliang Shi) and Y.L.; formal analysis, Y.W. and S.S. (Shiliang Shi); investigation, S.S. (Shuzhen Shao); resources, Y.L.; data curation, Y.W.; writing—original draft preparation, S.S. (Shuzhen Shao). All authors have read and agreed to the published version of the manuscript.

Funding

This work was supported by the National Natural Science Foundation of China (52274196, 52504216, 52374200, 52174180), National Program for Support of Top-notch Young Professionals (2022QB06801), Research Innovation Capacity Support Program for Young Faculty in Universities (SRICSPYF-BS2025041) and Leading Talents in Science and Technology Innovation in Hunan (2024RC1063).

Institutional Review Board Statement

Not applicable.

Informed Consent Statement

Not applicable.

Data Availability Statement

The data presented in this study are available on request from the corresponding author.

Acknowledgments

We are grateful for the support of the laboratories and assistants who provided the experimental conditions for this study.

Conflicts of Interest

The authors declare no conflicts of interest.

References

  1. Ranjith, P.G.; Zhao, J.; Ju, M.; De Silva, R.V.; Rathnaweera, T.; Bandara, A.K. Opportunities and challenges in deep mining: A brief review. Engineering 2017, 3, 546–551. [Google Scholar] [CrossRef] [Scilit]
  2. Beamish, B.B.; Crosdale, P.J. Instantaneous outbursts in underground coal mines: An overview and association with coal type. Int. J. Coal Geol. 1998, 35, 27–55. [Google Scholar] [CrossRef] [Scilit]
  3. Taraba, B.; Michalec, Z. Effect of longwall face advance rate on spontaneous heating process in the gob area–CFD modelling. Fuel 2011, 90, 2790–2797. [Google Scholar] [CrossRef] [Scilit]
  4. Stracher, G.B.; Taylor, T.P. Coal fires burning out of control around the world: Thermodynamic recipe for environmental catastrophe. Int. J. Coal Geol. 2004, 59, 7–17. [Google Scholar] [CrossRef] [Scilit]
  5. Onifade, M.; Genc, B. Spontaneous combustion of coals and coal-shales. Int. J. Min. Sci. Technol. 2018, 28, 933–940. [Google Scholar] [CrossRef] [Scilit]
  6. Vinogradov, A.V.; Kuprin, D.S.; Abduragimov, I.M.; Kuprin, G.N.; Serebriyakov, E.; Vinogradov, V. Silica Foams for Fire Prevention and Firefighting. ACS Appl. Mater. Interfaces 2016, 8, 294–301. [Google Scholar] [CrossRef] [Scilit]
  7. Arisoy, A.; Beamish, B. Reaction kinetics of coal oxidation at low temperatures. Fuel 2015, 159, 412–417. [Google Scholar] [CrossRef] [Scilit]
  8. Onifade, M. Countermeasures against coal spontaneous combustion: A review. Int. J. Coal Prep. Util. 2022, 42, 2953–2975. [Google Scholar] [CrossRef] [Scilit]
  9. Qiao, M.; Ren, T.; Roberts, J.; Liu, H.; Yang, X.; Tan, L.; Wu, J. Improved computational fluid dynamics modelling of coal spontaneous combustion control and gas management. Fuel 2022, 324, 124456. [Google Scholar] [CrossRef] [Scilit]
  10. Jefferson, A.J.; Sain, M.; Ramakrishna, S.; Jawaid, M.; Dhakal, H.N. Environmentally friendly fire retardant natural fibre composites: A review. Int. Mater. Rev. 2024, 69, 267–308. [Google Scholar] [CrossRef] [Scilit]
  11. Costes, L.; Laoutid, F.; Brohez, S.; Dubois, P. Bio-based flame retardants: When nature meets fire protection. Mater. Sci. Eng. R Rep. 2017, 117, 1–25. [Google Scholar] [CrossRef] [Scilit]
  12. Noreen, A.; Zia, K.M.; Zuber, M.; Tabasum, S.; Saif, M.J. Recent trends in environmentally friendly water-borne polyurethane coatings: A review. Korean J. Chem. Eng. 2016, 33, 388–400. [Google Scholar] [CrossRef] [Scilit]
  13. Salisbury, O.; Linde, G.; Beamish, B. Some operational perspectives on spontaneous combustion management of a longwall goaf. In Proceedings of the 2022 Resource Operators Conference; University of Wollongong: Wollongong, Australia, 2022; Volume 145. [Google Scholar]
  14. Onifade, M.; Genc, B. A review of research on spontaneous combustion of coal. Int. J. Min. Sci. Technol. 2020, 30, 303–311. [Google Scholar] [CrossRef] [Scilit]
  15. Charrière, D.; Behra, P. Water sorption on coals. J. Colloid Interface Sci. 2010, 344, 460–467. [Google Scholar] [CrossRef] [Scilit] [PubMed]
  16. Smith, E.L.; Abbott, A.P.; Ryder, K.S. Deep eutectic solvents (DESs) and their applications. Chem. Rev. 2014, 114, 11060–11082. [Google Scholar] [CrossRef] [Scilit] [PubMed]
  17. Busch, A.; Gensterblum, Y.; Krooss, B.M.; Littke, R. Methane and carbon dioxide adsorption–diffusion experiments on coal: Upscaling and modeling. Int. J. Coal Geol. 2004, 60, 151–168. [Google Scholar] [CrossRef] [Scilit]
  18. Hammond, O.S.; Bowron, D.T.; Edler, K.J. Liquid structure of the choline chloride-urea deep eutectic solvent (reline) from neutron diffraction and atomistic modelling. Green Chem. 2016, 18, 2736–2744. [Google Scholar] [CrossRef] [Scilit]
  19. Wang, H.; Dlugogorski, B.Z.; Kennedy, E.M. Coal oxidation at low temperatures: Oxygen consumption, oxidation products, reaction mechanism and kinetic modelling. Prog. Energy Combust. Sci. 2003, 29, 487–513. [Google Scholar] [CrossRef] [Scilit]
  20. Francisco, M.; van den Bruinhorst, A.; Kroon, M.C. Low-transition-temperature mixtures (LTTMs): A new generation of designer solvents. Angew. Chem. Int. Ed. 2013, 52, 3074–3085. [Google Scholar] [CrossRef] [Scilit] [PubMed]
  21. Nimse, S.B.; Pal, D. Free radicals, natural antioxidants, and their reaction mechanisms. RSC Adv. 2015, 5, 27986–28006. [Google Scholar] [CrossRef] [Scilit]
Figure 1. Preparation process of DEI.
Fire 09 00129 g001
Figure 2. Constant-temperature drying oven.
Fire 09 00129 g002
Figure 3. Water loss rate of DEI with 30% moisture content at 30–120 °C.
Fire 09 00129 g003
Figure 4. Relative water retention of DEI at different temperatures.
Fire 09 00129 g004
Figure 5. Heat flow curves of DHLC and inhibited DHLC with temperature.
Fire 09 00129 g005
Figure 6. Heat flow curves of WJLCC and inhibited WJLCC with temperature.
Fire 09 00129 g006
Figure 7. Heat flow curves of DLAC and inhibited DLAC with temperature.
Fire 09 00129 g007
Figure 8. Heat flow curves of LZGC and inhibited LZGC with temperature.
Fire 09 00129 g008
Figure 9. Oxidation kinetic fitting curves of different coal samples (200–300 °C).
Fire 09 00129 g009aFire 09 00129 g009b
Figure 10. Oxidation kinetic fitting curves of different coal samples (300–400 °C).
Fire 09 00129 g010aFire 09 00129 g010b
Figure 11. Inhibition mechanism of DEI.
Fire 09 00129 g011
Table 1. Water loss rates of DEI and pure water at different ambient temperatures.
Water Loss Rate
(%/h)
DEIPure Water
Ambient Temperature (°C) Minimum ValueMaximum ValueMinimum ValueMaximum Value
300.01600.12600.16900.2640
400.04600.20200.11000.6770
500.21100.46700.22501.5180
600.06300.95700.35601.9680
700.22300.89001.88103.4550
800.36501.21704.46808.5640
900.50801.70904.17009.5310
1000.54802.58906.83909.4540
1100.61202.90706.478010.8560
1201.12304.89707.272011.9510
Table 2. Key physical parameter data.
Temperature (T, K)Saturated Vapor
Pressure (P0, Pa)
Diffusion Coefficient of Water (D, m2/s)Evaporation Flux of Pure Water (Jm, kg/(m2·s))Boundary Layer Thickness (δ, m)
303.1542462.63 × 10−51.99 × 10−50.0280
313.1573812.88 × 10−54.15 × 10−50.0250
323.1512,3403.14 × 10−59.1 × 10−50.0200
333.1519,9463.41 × 10−51.49 × 10−40.0210
343.1531,1643.69 × 10−51.51 × 10−40.0370
353.1547,3733.98 × 10−55.58 × 10−40.0150
363.1570,1174.28 × 10−56.48 × 10−40.0190
373.15101,3254.59 × 10−57.77 × 10−40.0240
383.15143,2604.92 × 10−59.04 × 10−40.0310
393.15197,4005.25 × 10−59.67 × 10−40.0410
Table 3. Diffusion coefficients and relative water retention of DEI at different temperatures.
Temperature (°C)3040506070
D e f f 1.64 × 10−51.57 × 10−51.84 × 10−51.75 × 10−51.78 × 10⁻⁵
R t 0.380.460.410.490.52
Temperature (°C)8090100110120
D e f f 0.91 × 10−50.93 × 10−51.01 × 10−51.43 × 10−51.95 × 10⁻⁵
R t 0.770.780.780.710.63
Table 4. Heat release parameters of different coal samples.
Coal SamplesEndothermic-
Exothermic Transition Temperature (°C)
Oxidation-
Combustion
Transition
Temperature (°C)
Heat Absorption (J/g)Heat Release of Low-Temperature Oxidation (J/g)Heat Release of Combustion (J/g)
DHLC120.2320.2899.36659.29817.9
Inhibited DHLC178.9315.62350.74339.111045
DLAC100.9392.4497.49568.425,074.8
Inhibited DLAC174.5405.12595.98360.610,683.0
LZGC155.4305.8979.95754.016,672.0
Inhibited LZGC183.6332.42737.03940.38264.8
WJLCC128.3385.6800.28710.212,695.5
Inhibited WJLCC175.2368.52213.76271.15333.4
Table 5. Fitting equations and apparent activation energies of different coal samples.
Coal SamplesFitting EquationCorrelation Coefficient (R2)Apparent Activation Energy (kJ/mol)
200~300 °CDHLCY = −3.2573x + 12.86890.989427.08
inhibited DHLCY = −5.5308x + 170.955645.98
WJLCCY = −3.0516x + 12.18330.995425.37
inhibited WJLCCY = −4.2882x + 14.18130.988835.65
DLACY = −2.1324x + 10.34720.999517.73
inhibited DLACY = −4.2790x + 14.12340.979635.58
LZGCY = −3.3438x + 13.204680.990227.8
inhibited LZGCY = −5.39662x + 16.388890.975744.87
300~400 °CDHLCY = −0.5081x + 7.82150.91004.22
inhibited DHLCY = −0.3053x + 7.32050.91022.54
WJLCCY = −1.0277x + 8.5390.99028.54
inhibited WJLCCY = −0.6101x + 7.81180.95055.07
DLACY = −1.1545x + 8.77300.95879.60
inhibited DLACY = −1.4926x + 9.31460.978012.41
LZGCY = −1.83252x + 10.118630.988615.24
inhibited LZGCY = −1.98846x + 9.801200.973416.53
Disclaimer/Publisher’s Note: The statements, opinions and data contained in all publications are solely those of the individual author(s) and contributor(s) and not of MDPI and/or the editor(s). MDPI and/or the editor(s) disclaim responsibility for any injury to people or property resulting from any ideas, methods, instructions or products referred to in the content.