Article

Study on Smoke Flow and Temperature Distribution Patterns in Fires at Deeply Buried Subway Stations

1
School of Safety Engineering, China University of Mining and Technology, Xuzhou 221116, China
2
Jiangsu Key Laboratory of Urban Fire Prevention and Control, Xuzhou 221116, China
*
Author to whom correspondence should be addressed.
Fire 2025, 8(8), 296; https://doi.org/10.3390/fire8080296
Submission received: 3 June 2025 / Revised: 25 June 2025 / Accepted: 9 July 2025 / Published: 28 July 2025
(This article belongs to the Special Issue Advances in Fire Science and Fire Protection Engineering)

Abstract

To enhance the fire safety protection level of deeply buried metro stations, this study conducted full-scale fire experiments based on Wulichong Station of Guiyang Metro Line 3. It systematically investigated the laws of smoke movement and temperature distribution under the coupled effects of different fire source powers and smoke extraction system states. Through the set up of multiple sets of comparative test conditions, the study focused on analyzing the influence mechanism of the operation (on/off) of the smoke extraction system on smoke spread characteristics and temperature field distribution. The results indicate that under the condition where the smoke extraction system is turned off, the smoke exhibits typical stratified spread characteristics driven by thermal buoyancy, with the temperature rising significantly as the vertical height increases. When the smoke extraction system is activated, the horizontal airflow generated by mechanical smoke extraction significantly alters the flame morphology (with an inclination angle exceeding 45°), effectively extracting and discharging the hot smoke and leading to a more uniform temperature distribution within the space.

1. Introduction

By the end of 2023, 59 cities in China had opened urban rail transit systems, with a total of 338 operational lines and a total mileage of 11,224.54 km, marking an unprecedented period of development for urban rail transit [1]. Among these, subway operational lines account for 8543.11 km, or 76.11% of the total, making subways one of the most important forms of rail transit. Subways are typically buried underground, characterized by enclosed environments, high passenger density and flow, and numerous electrical facilities. In the event of a fire, the flames can spread rapidly, and smoke can easily accumulate, making evacuation difficult. As subway lines and passenger traffic continue to increase, the potential for fire-related injuries and property damage also rises. As a crucial component of urban transportation, subway safety has garnered significant attention [2]. Subway fires can cause significant casualties and economic losses. To reduce the number of injuries and property damage in the event of a subway fire, it is necessary to study the smoke flow and temperature distribution patterns [3], thereby enabling targeted rescue and disaster prevention efforts.
Currently, scholars and research institutions both domestically and internationally have conducted extensive research on subway fires, yielding numerous results. These primarily focus on passenger evacuation, smoke flow patterns, and temperature distribution during fires in typical subway stations [4,5,6,7]. Chen Si [8] used Pathfinder software to create a full-scale model of a subway carriage, simulating safe evacuation times and analyzing the impact of six different evacuation scenarios, including the longitudinal and transverse arrangement of subway seats and mainstream evacuation methods, on the necessary safe evacuation time during a fire. Zahra T [9] used FDS software to simulate smoke evacuation on island-style and double-sided platforms, finding that platform structure significantly affects the smoke evacuation and emission diffusion process. Rie D [10] conducted physical fire experiments to study three fire source locations, combined with the operation of the smoke exhaust system, analyzing the distribution of platform temperature, CO, and visibility. Zheng Anping [11] investigated the ventilation modes and fire linkage modes of domestic subway stations, studying the principles of fire ventilation linkage modes in subway tunnel sections. Cheng Xin [12] used PyroSim software to create a full-scale numerical model of a subway station in Hefei, analyzing the main factors affecting the smoke-blocking effectiveness of air curtains during platform fires through orthogonal experiments: jet wind speed, jet angle, and nozzle width. Liu Zhiyuan [13] established a full-scale simulation model of a subway carriage, analyzing the internal wind speed distribution without a fire source and comparing the impact of air supply and different fire source locations on the internal temperature field distribution. Chen Kecheng [14] used FDS software to create a model of Guangzhou University Town North Subway Station, determining the boundary conditions required for numerical simulation based on measured temperature and wind speed data within the station, and studying the fire smoke diffusion patterns using large eddy simulation methods and message passing interfaces. Jae [15] employed the Fire Dynamics Simulator (FDS V406) to develop a subway station fire model. By integrating fire simulation and evacuation simulation methods, they quantitatively analyzed the impact of PSD and ventilation systems on passenger evacuation time. The study demonstrated that the synergistic effect of PSD and ventilation systems could provide passengers with approximately 350 additional seconds of safe evacuation time. Li [16] established a formal model of subway fire emergency response processes based on Petri nets. They proposed an optimization framework incorporating resource conflict detection algorithms and priority strategies (critical-task-first/shortest-wait-first). Experimental results confirmed that this approach could improve process execution efficiency by over 30%.
Current research on subway fires, both domestically and internationally, has primarily focused on shallow-buried stations, employing scaled-down experiments and numerical simulation methods, while systematic studies on deep-buried subway stations remain notably insufficient. Scaled-down experiments, due to geometric limitations, struggle to fully replicate the complex physical phenomena of real fires; numerical simulations, constrained by simplified boundary conditions and idealized computational models, deviate from actual conditions. Deep-buried subway stations, owing to their unique structural characteristics, face two prominent challenges during fires: first, the unconventional vertical evacuation distance significantly increases the difficulty of personnel escape; second, the complex three-dimensional spatial structure makes smoke control more challenging [17,18,19,20]. Existing research has largely been confined to computer simulations, failing to adequately account for the special boundary conditions and practical engineering variables in deep-buried environments, thereby limiting the practical applicability of the findings. Consequently, conducting full-scale fire experiments in deep-buried subway stations holds significant theoretical and practical importance for deepening the understanding of fire development patterns in unique spatial environments, optimizing smoke control system designs, and improving evacuation efficiency.
To better study the smoke movement and temperature distribution patterns during fires in deeply buried subway stations and to obtain results that are closer to real-world conditions, this paper will use Wulichong Station on Line 3 of the Guiyang Metro as the research subject, conducting full-scale fire experiments on the platform level of Wulichong Station.

2. Full-Scale Fire Experiment

2.1. Experimental Conditions

The experimental station is Wulichong Station on the first phase of Guiyang Rail Transit Line 3, located within the Shizishan rock mass. The station has a maximum overburden thickness of 82 m, a maximum height difference of 40 m from the platform to the ground, and a height difference of approximately 35 m from the concourse level to the entrance platform. The station is a two-level underground island-style station with an effective platform width of 14 m, featuring three entrances, four safety exits, two groups of ventilation shafts, two elevators, and three evacuation staircases. Entrance 1 is located on the north side of the concourse, near the abandoned gas station at the southern foot of Shizishan near Guihuang Road; Entrance 2 is located on the west side of the concourse, on the east side of the community open road, at the western foot of Shizishan Mountain Park; Entrance 3 is located on the southeast side of the concourse, on the east side of the community open road, at the western foot of Shizishan Mountain Park, near Duhui Avenue. Safety Exit 1 serves as the main safety exit for the station’s equipment area, Safety Exit 2 meets the fire evacuation requirements for the long entrance passage of Entrance 3, Safety Exit 3 serves the long entrance passage of Entrance 2 and the elevator (with a lift height exceeding 11 m), and Safety Exit 4 meets the fire evacuation requirements for the long entrance passage of Entrance 1 and the station’s equipment area. All safety exits are equipped with positive-pressure fan rooms. Non-motorized vehicle parking lots and other public transportation facilities are set up near the station entrances to ensure smooth connections between the subway station and ground public transportation.
Due to the significant height difference between the platform and concourse levels and the ground, in the event of a fire, smoke cannot be expelled solely through natural ventilation, and mechanical ventilation is required for smoke extraction. To explore the temperature field and smoke distribution during a fire in a deeply buried subway station, full-scale fire experiments were conducted on the platform level at the deepest point. The experiments were divided into two sets of conditions, one with mechanical ventilation turned off and one with mechanical ventilation operating normally, to investigate the fire conditions in a deeply buried subway station under extreme circumstances. Each set of conditions was further divided into three experiments based on fire source power, which was varied by changing the number of fire pans (1, 2, or 4 fire pans), resulting in a total of six experiments. The overall view of the platform level and the fire source location are shown in Figure 1.

2.2. Fire Source Setup

The fire source system and measurement system are the main components of the full-scale fire experiment system. The fire source system is used to generate hot smoke with a preset fire power, including combustion pans, smoke generators (smoke cans), and protective devices. The oil pans are made of 3.0 mm thick steel plates welded together, with waterproof characteristics. The combustion pans measure 0.5 m × 0.5 m × 0.1 m, with steel supports at the bottom to prevent high temperatures from damaging the floor. Since the subway station is already in operation, conducting hot smoke experiments could potentially damage the station’s facilities. Therefore, ethanol was selected as the fuel to heat cold smoke, thereby achieving an effect that simulates hot smoke experiments. To avoid generating toxic smoke during the experiments, industrial-grade liquid ethanol with 99% purity was selected as the fuel. The fire source power was calculated based on the methodology described in Shi Congling’s paper [21], with the corresponding fuel consumption quantities presented in Table 1.
A total of six experiments were conducted. Experiments 1, 3, and 5, and Experiments 2, 4, and 6 formed control groups with different fire source powers. Experiments 1 and 2, Experiments 3 and 4, and Experiments 5 and 6 formed control groups with different states of the smoke exhaust system. Since the temperature distribution during the fire was summarized through the control experiments of Experiments 1 and 2 and Experiments 3 and 4, this section will not repeat the explanation for Experiments 5 and 6. Due to excessive errors in some data, they were excluded from the analysis, specifically the temperature data recorded at the 2 m height of Thermocouple Tree 1 and the 1 m height of Thermocouple Tree 2.
Experiment 7, under the same conditions as the previous six experiments, placed thermocouples at a height of 4.5 m (i.e., at the ceiling) to measure the temperature of the smoke at the top. The arrangement of the thermocouple tree is shown in Figure 2.

2.3. Temperature Measurement System

The temperature measurement system consists of thermocouples and an Agilent data acquisition unit. Thermocouples are one of the most commonly used temperature measurement instruments in fire experiments. This experiment used K-type thermocouples, which can directly measure temperatures ranging from 0 to 1300 °C, with a diameter of 3 mm.
The experiment used a data acquisition unit to record the temperature data collected by the thermocouples. The main unit of the data acquisition unit is the DAQ970A model, and the acquisition card is the DAQM901A model. The main unit can support three acquisition cards, and each card can support 20 channels of data acquisition. The data acquisition unit was connected to a computer, and the corresponding software was used to directly display and record the temperature data during the experiment.
In the experiment, Thermocouple Tree 1 was placed 1 m from the fire source, Thermocouple Tree 2 was placed 2 m from the fire source, and Thermocouple Tree 3 was placed 3 m from the fire source. As the smoke was heated by the thermal plume and spread across the platform level, the temperature could indirectly reflect the spread of the smoke. The initial temperature on the platform level was around 19 °C.

2.4. Wind Speed Measurement Device

A wind speed measurement instrument was placed at a height of 1.5 m at the staircase entrance to measure the wind speed at the platform level staircase entrance.

2.5. Video Recording System

Cameras were set up on stands and tablets at four directions (east, south, west, and north) 5 m from the fire source to record the real-time status of the fire source and smoke.

2.6. Harmful Gas Monitoring Device

The concentration of harmful gas CO was measured. CO concentration measurement instruments were used, placed at two locations 10 m apart to verify the accuracy of the measurements. The CO concentration testing instruments were set at a height of 1.5 m in the human breathing zone to obtain CO concentration distribution data at this height. The experiment used smoke cans and smoke generators to produce smoke, which in principle does not produce CO. However, to avoid the possibility of incomplete combustion producing CO, CO concentration testing instruments were set up to provide early warnings of gas concentration.

3. Experimental Results and Analysis

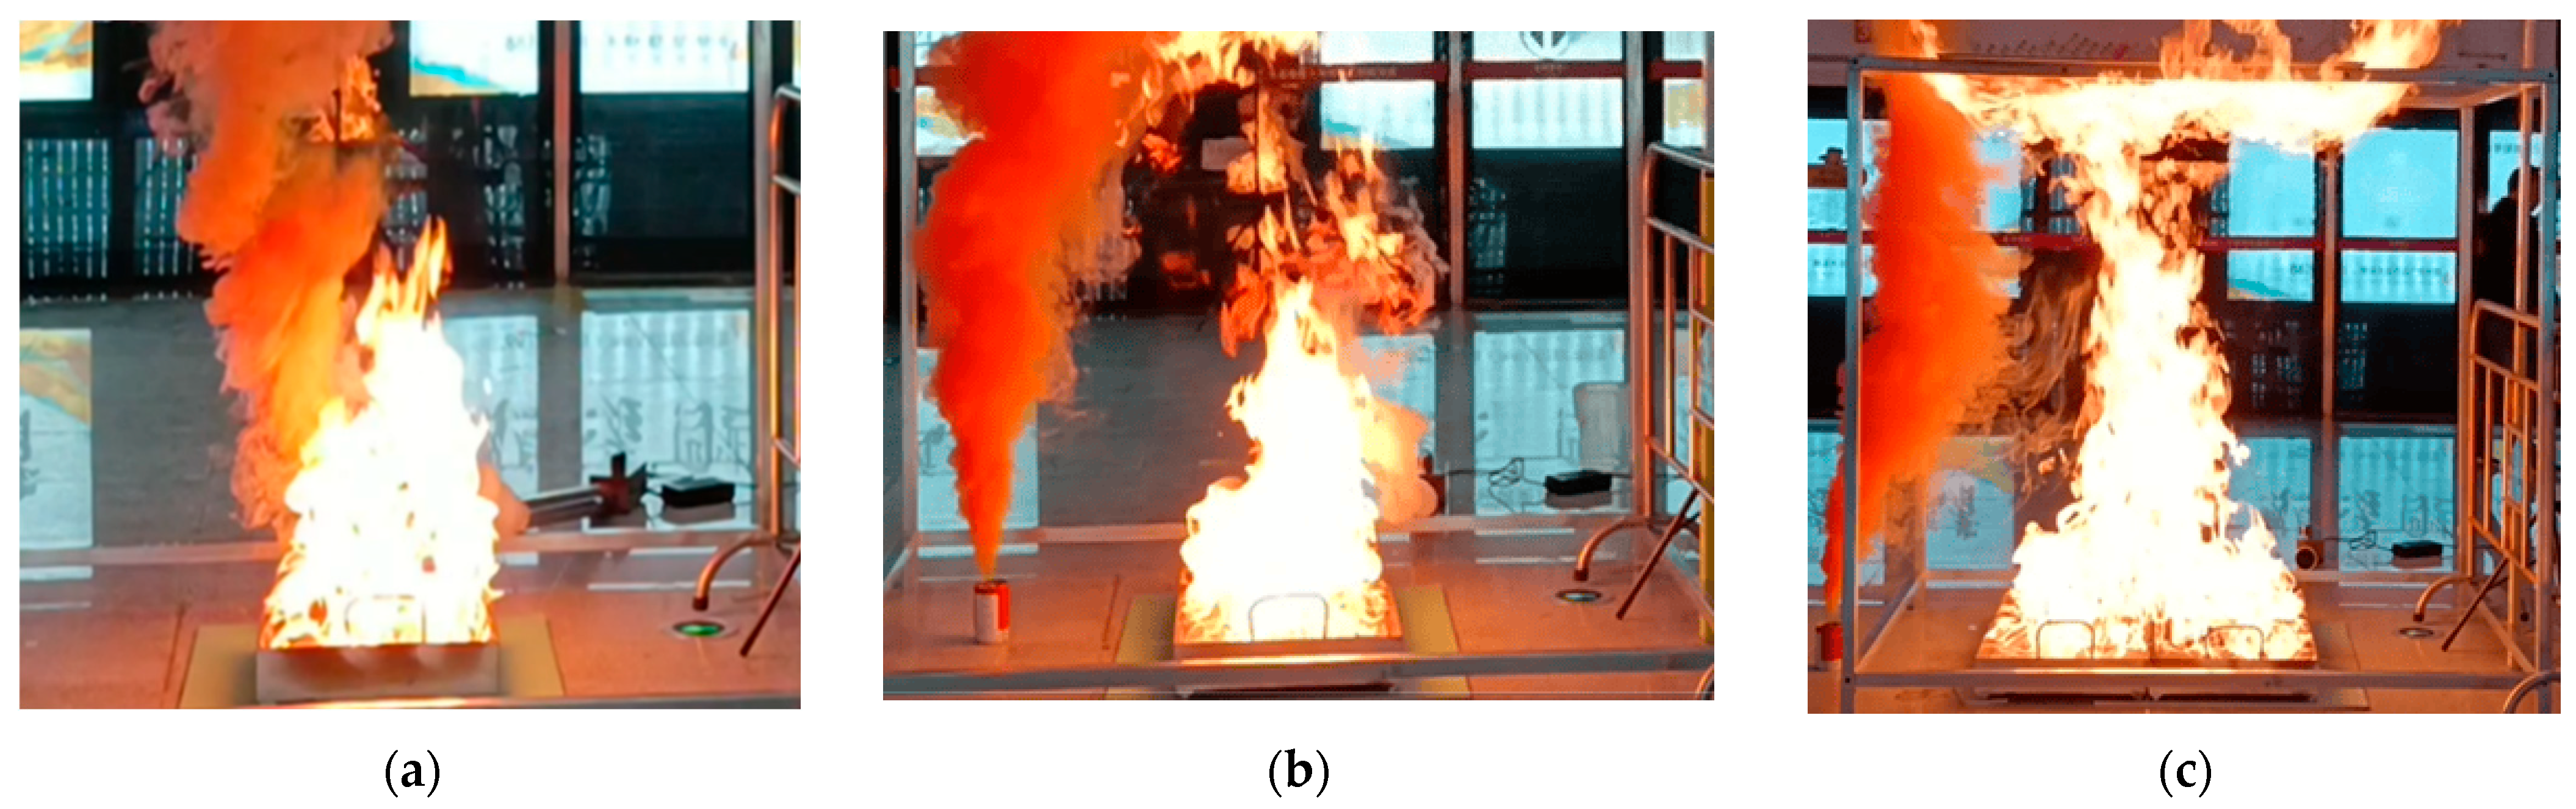
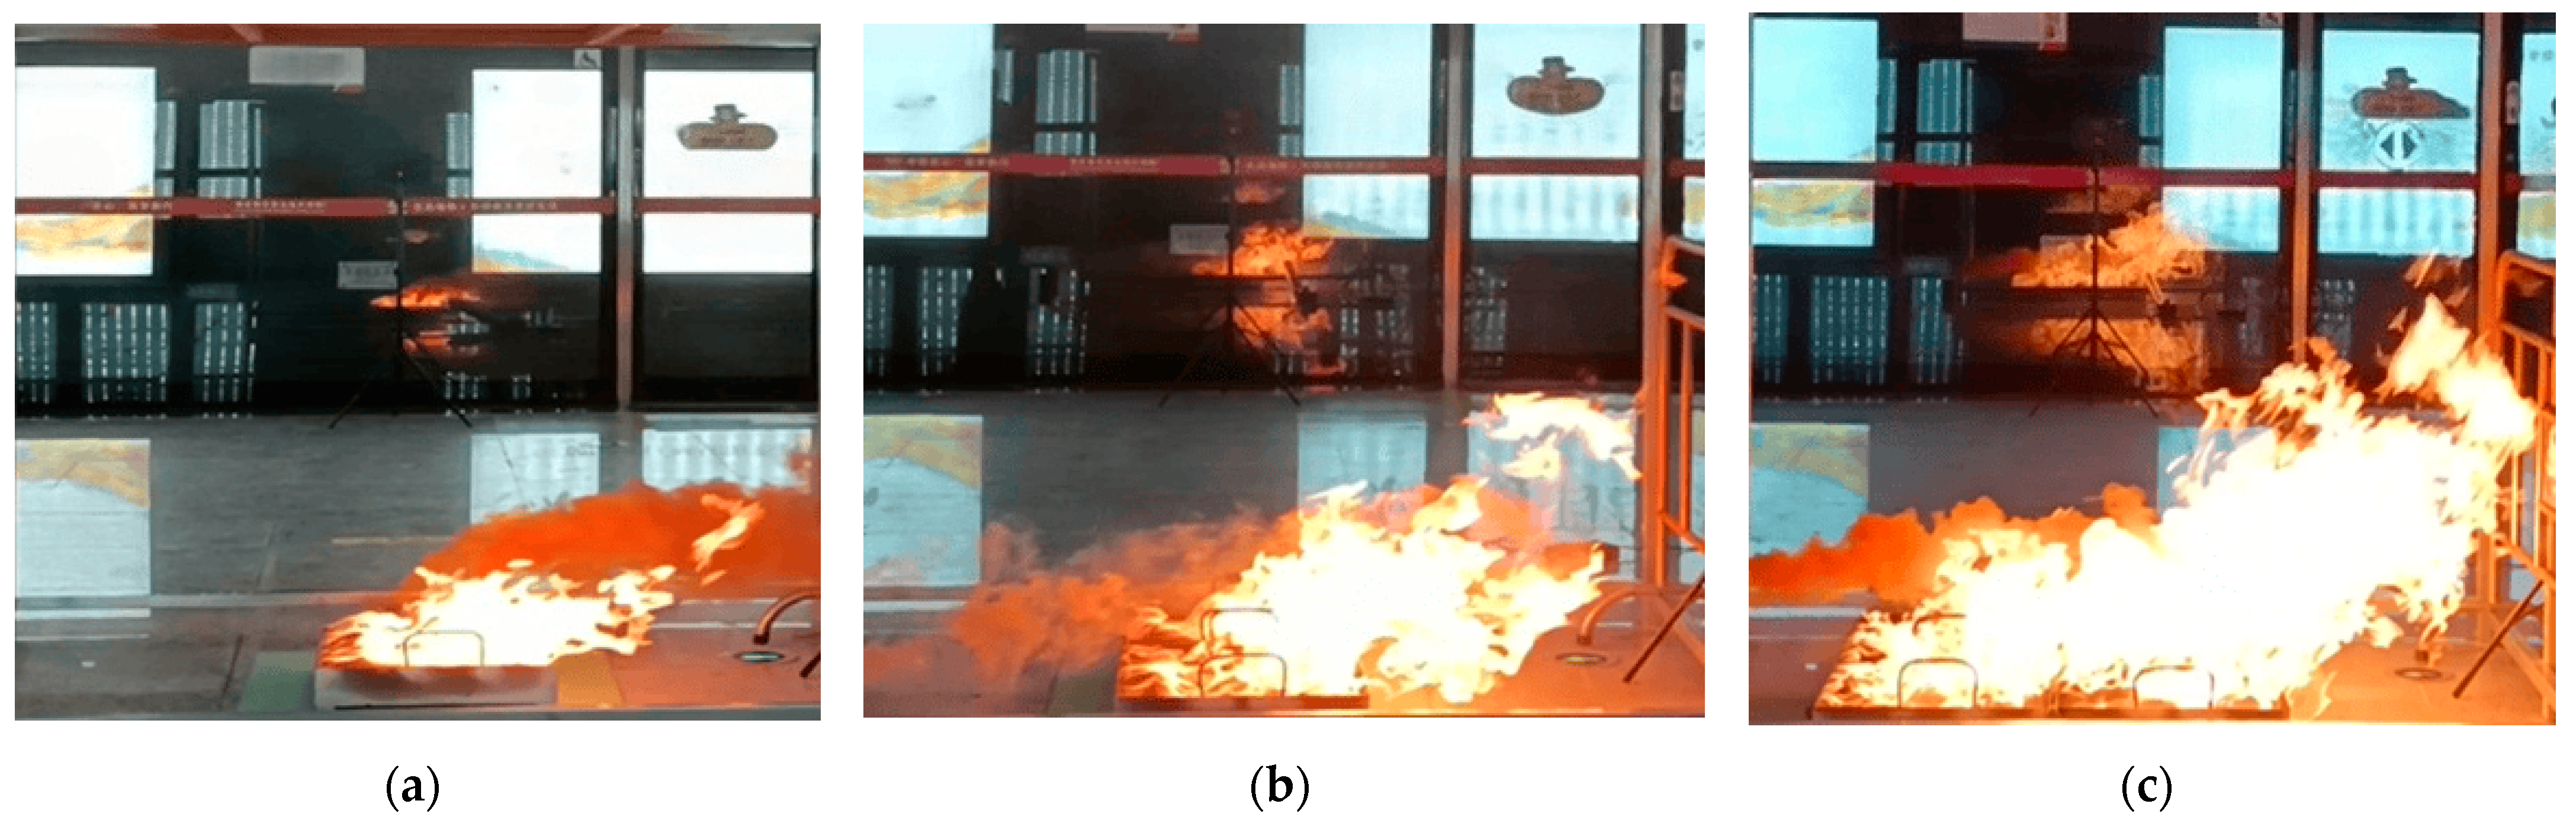
3.1. Fire Source Combustion During the Experiment

The experiment controlled the fire source power by using different numbers of oil pans, and the operation of the ventilation system also affected the combustion of the fire source. The specific combustion conditions are shown in Figure 3 and Figure 4.
From Figure 3a–c and Figure 4a–c, it can be observed that in deeply buried subway stations, natural ventilation is almost non-existent, and the ventilation conditions significantly affect the height of the fire source. In the absence of mechanical smoke exhaust, the fire source burns steadily after ignition, with no tilting of the flame and a relatively high flame height. When mechanical smoke exhaust is activated, the downward wind speed at the staircase entrance can reach up to 1.5 m/s. Under these conditions, the flame tilts more than 45 degrees from vertical due to the wind force.

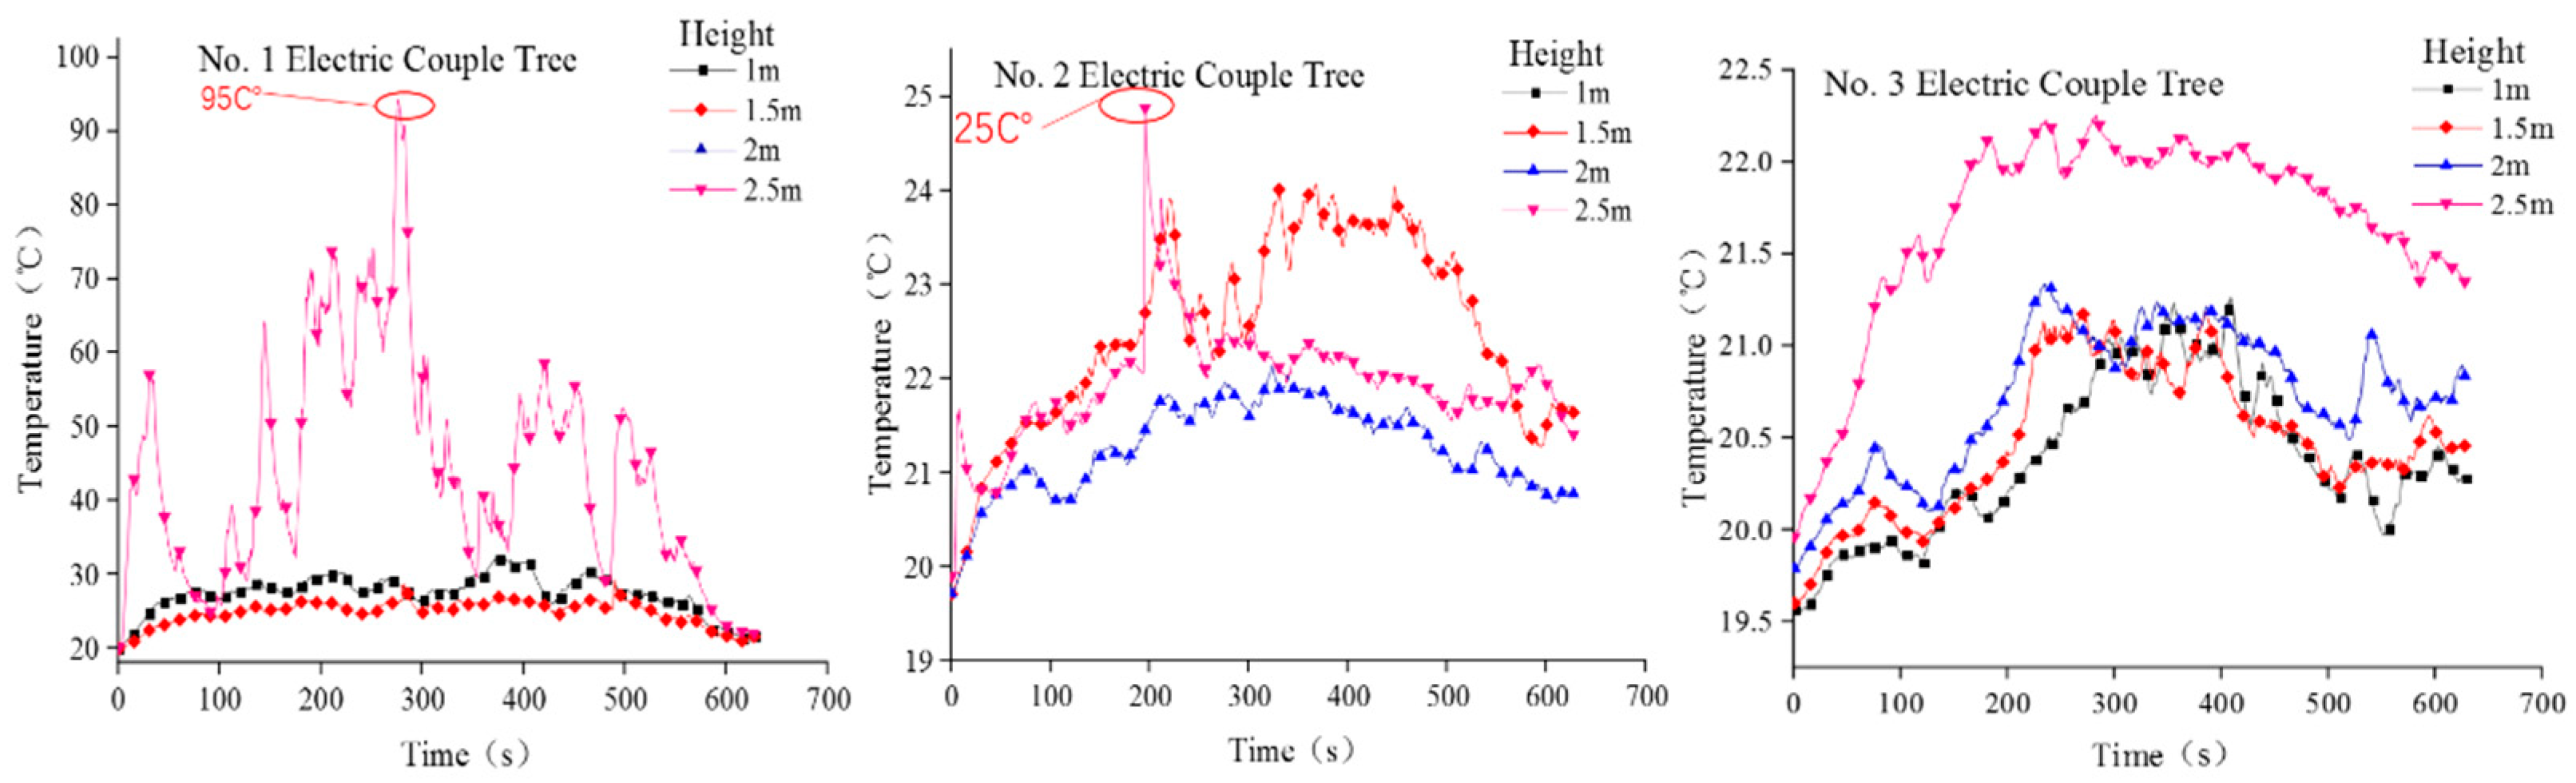
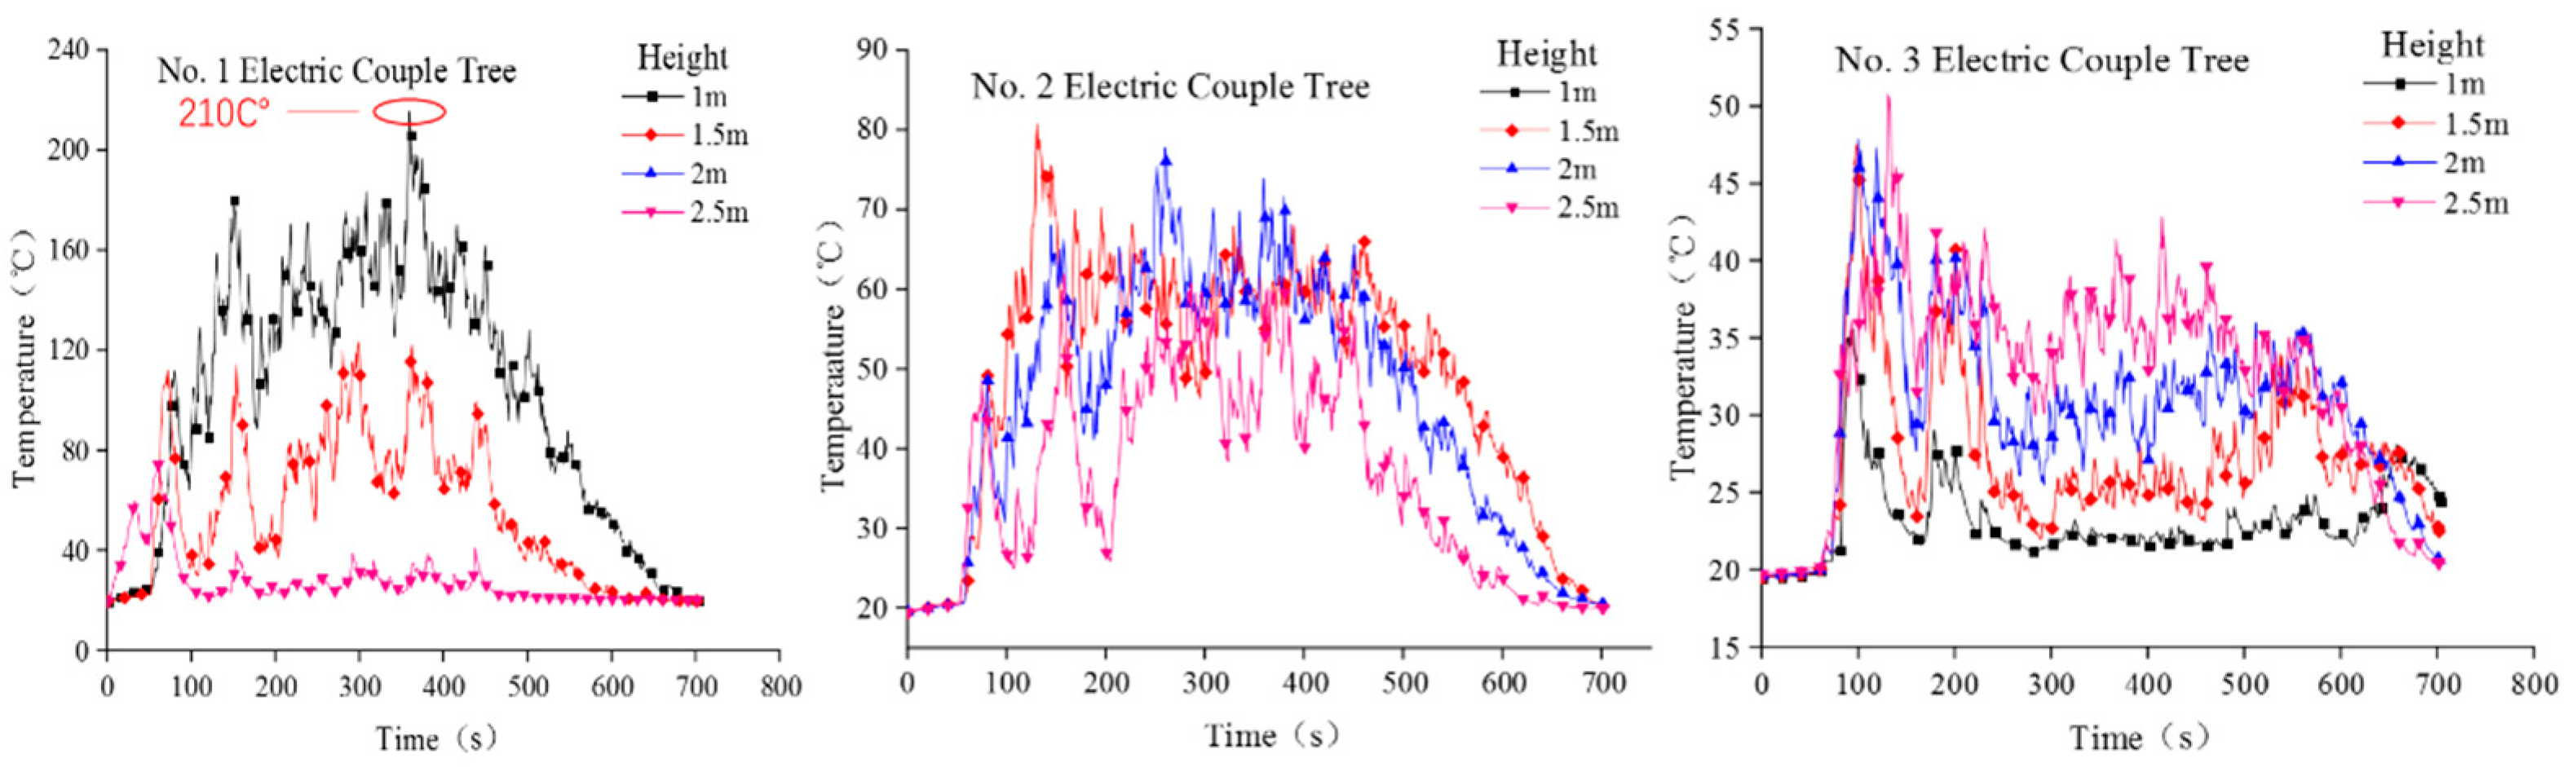
3.2. Temperature Distribution of the Smoke Layer

Experiment 1 used a single 0.5 m × 0.5 m oil pan as the fire source, and the smoke exhaust system was turned off. The temperature distribution curve of the smoke layer in the tunnel during the fire is shown in Figure 5.
Experiment 2 used a single 0.5 m × 0.5 m oil pan as the fire source, and the smoke exhaust system was turned on. The temperature distribution curve of the smoke layer in the tunnel during the fire is shown in Figure 6.
From Figure 5, it can be observed that under a fire source power of approximately 160 kW, the temperature at a distance of 1 m from the fire source can reach up to 95 °C. However, as the distance increases to 2 m and 3 m, the temperature drops sharply, with the maximum temperature reaching only 25 °C. From Figure 3 and Figure 5, it can be seen that after the smoke exhaust system is turned on, the flame tilts significantly under the influence of the wind, causing it to directly contact Thermocouple Tree 1. As a result, the thermocouple at the 1 m height heats up extremely quickly due to direct contact with the flame, reaching a maximum temperature of 210 °C. Therefore, if the smoke exhaust system is activated, the flame will be blown to a nearly horizontal state, increasing the heat radiation area in the horizontal direction. Consequently, the thermocouple temperatures in Experiment 2 are significantly higher compared to those in Experiment 1.
The temperature variation curve in Figure 5 shows that the temperatures at each measurement point fluctuate considerably, but the overall trend is an initial rise followed by a decline. The temperature at the 2.5 m height is significantly higher than that at the 2 m height. Combined with the video recordings during the experiment, this reflects that the smoke layer, after being heated, rises and then settles at a height above 2 m. A comparison of data from different thermocouple trees indicates that as the height of the thermocouples decreases vertically, the measured smoke temperature also decreases, demonstrating a stratified temperature distribution within the platform level. When the smoke exhaust system is turned off, the temperature at the 2 m position shows only a slight increase due to thermal radiation, but the overall trend remains that the higher the height, the higher the temperature, although the effect is minor. In Experiment 2, with the smoke exhaust system turned on, the hot smoke is drawn away by the system, so the higher areas no longer accumulate hot smoke, resulting in lower temperatures compared to the lower areas.
Additionally, Figure 5 shows that with the smoke exhaust system turned off, the smoke temperatures measured by the thermocouples at 2 m and 3 m from the fire source are only 3–6 °C higher than the initial room temperature. This indicates that the fire source’s combustion has a limited impact on the temperature at breathing height in more distant locations.
Experiment 3 used two 0.5 m × 0.5 m oil pans as the fire source, and the smoke exhaust system was turned off. The temperature distribution curve of the smoke layer in the tunnel during the fire is shown in Figure 7.
Experiment 4 used two 0.5 m × 0.5 m oil pans as the fire source, and the smoke exhaust system was turned on. The temperature distribution curve of the smoke layer in the tunnel during the fire is shown in Figure 8.
In Experiments 3 and 4, the fire source power was set at 348 kW. From Figure 7, it can be observed that with the smoke exhaust system turned off, the highest temperature at a height of 2.5 m and 1 m from the fire source reached 118 °C, compared to 95 °C at the same location in Experiment 1. From Figure 8, it can be seen that with the smoke exhaust system turned on, the highest temperature at a height of 1 m and 1 m from the fire source reached 280 °C, compared to 210 °C at the same location in Experiment 2. Therefore, as the fire source power increases, the temperature on the platform level continues to rise.
In summary, compared to Experiments 1 and 2, increasing the fire source power resulted in higher temperatures measured by the thermocouples, but the overall trends remained consistent with the patterns summarized in Experiments 1 and 2: With the smoke exhaust system turned off, the smoke rises and spreads upward due to the heating by the fire source, causing the temperature at each measurement point to gradually increase with height. With the smoke exhaust system turned on, the flame is pushed closer to or even directly contacts some thermocouples due to the wind, and the hot smoke is drawn away by the smoke exhaust system. As a result, temperatures are higher at lower heights and lower at higher heights. The temperature gradient between 2 m and 2.5 m heights decreased compared to Experiments 1 and 2, while the gradient between 1.5 m and 2 m heights increased. Combined with experimental observations and records, it can be concluded that the smoke settlement height has decreased to approximately 2 m or even below that.

3.3. Longitudinal Distribution of Ceiling Temperature Field

The temperature distribution curves of the smoke layer under different experimental conditions measured in Experiment 7 are shown in Figure 9.
Figure 9(1,3,5) represent data measured with mechanical ventilation turned off, while Figure 9(2,4,6) represent data measured with mechanical ventilation turned on. From the figures, it can be observed that the temperature at the top of the platform level gradually increases as the fire progresses, reaching its peak at around 5 min. The highest temperature was recorded in the experimental condition with a fire source power of 751 kW and the smoke exhaust system turned off, reaching a maximum of 135 °C.
From the above curves, the following can be concluded:
Without a smoke exhaust system, the smoke rises and spreads upward under the heating of the fire source, accumulating directly above the fire source before gradually dispersing. The amount of smoke accumulated at each measurement point is inversely proportional to the distance from the fire source. The temperature at the platform ceiling increases due to the influence of the hot smoke, ultimately showing a pattern where temperatures are higher closer to the fire source. The temperature differences between measurement points are significant and become more pronounced as the fire source power increases. When the fire source power reaches 751 kW, the maximum temperature difference exceeds 15 °C.
With the smoke exhaust system turned on, the smoke still rises under the heating of the fire source but does not accumulate directly above it or disperse widely. Instead, the smoke flows with the wind direction under the influence of the smoke exhaust system and is gradually expelled from the platform level. Since the smoke is in a flowing state, the amount of smoke at each measurement point is relatively uniform, resulting in nearly identical temperatures at all measurement points with almost no temperature difference. However, compared to Experiments 1, 3, and 5, the temperatures at all measurement points show a certain degree of decrease. Under the condition of a 751 kW fire source power, the temperature drop can exceed 70 °C.

4. Conclusions

(1) In the case of the smoke extraction system being turned off, the longitudinal distribution law of the fire temperature field on the platform level of a deeply buried subway station is as follows: After hot smoke spreads upward under the heating of the fire source, it begins to settle. Therefore, the temperature gradually increases with the increase in height. However, a temperature fault occurs at heights of 2.5 m and 2 m, indicating that the settlement height of hot smoke is higher than 2 m. Its transverse distribution law is as follows: The temperatures at measuring points at different distances exhibit obvious stratification, with the overall trend being that the closer the distance to the fire source, the higher the temperature. The law of smoke movement is as follows: Smoke rises upon heating from the fire source and starts to accumulate at the ceiling before subsequently dispersing in all directions. The temperature field around it is mainly affected by the distribution of smoke, so the smoke concentration is inversely proportional to the distance from the fire source.
(2) In the case of the smoke extraction system being turned on, the longitudinal distribution law of the fire temperature field on the platform level of a deeply buried subway station is as follows: The fire source is blown to a nearly horizontal position under the action of the smoke extraction system, with some measuring points even coming into direct contact with the fire source. Meanwhile, the hot smoke is drawn away by the smoke extraction system, with a relatively small impact on the temperature at the measuring points. Finally, it appears that as the height increases, the temperature at the measuring points gradually decreases. However, due to the reduction in the lateral distance from the fire source, the temperature is higher compared to when the smoke extraction system is turned off. Its transverse distribution law is as follows: The temperatures at various measuring points remain almost consistent, and the overall temperature is lower compared to when the smoke extraction system is turned off. The law of smoke movement is as follows: After being generated at the fire source, the smoke is influenced by the fan and flows out of the platform level along the direction of the smoke extraction system. As the smoke is in a flowing state and does not accumulate, the temperature field around it is uniformly distributed, with almost consistent temperatures. Turning on the smoke extraction system can cause the temperature field to decrease to varying degrees, with a more pronounced temperature drop for higher fire source power.
(3) Experimental observations indicate that although the smoke extraction system effectively reduces the overall smoke concentration, there is still a phenomenon of residual smoke lingering on the platform level, particularly in key evacuation route areas such as stairwells. To ensure the safety of personnel evacuation, it is recommended to install smoke curtains at stairwells to control smoke diffusion and optimize the arrangement of smoke extraction outlets to form local negative-pressure zones, thereby further enhancing the efficiency of smoke extraction. This improvement measure can effectively reduce the smoke concentration in evacuation corridors and provide a more sufficient time guarantee for safe personnel evacuation.
(4) Compared with current research on shallow-buried subway stations, deep-buried stations demonstrate significant thermal accumulation effects under smoke extraction system failure conditions due to their enclosed structural characteristics. Experimental data reveals approximately 40% higher temperature increases and about 20% lower smoke layer descent heights compared to shallow stations. These differences primarily stem from the lack of natural ventilation in deep-buried structures, which significantly impacts smoke transport processes and consequently creates more challenging evacuation environments.

Author Contributions

Methodology, Y.Z.; Formal analysis, H.Y.; Data curation, Z.B.; Writing—original draft, H.L. All authors have read and agreed to the published version of the manuscript.

Funding

This research was funded by the National Key Research and Development Program of China (2024YFE0112000). The APC was funded by the National Key Research and Development Program of China.

Informed Consent Statement

Informed consent was obtained from all subjects involved in the study.

Data Availability Statement

The datasets generated and analyzed during this study are not publicly available due to privacy concerns and restrictions imposed by the institutional review board/ethics committee.

Conflicts of Interest

The authors declare no conflicts of interest.

References

  1. Zhang, Y.Z. Study on Smoke Movement and Control in Atrium-Style Subway Station Fires. Master’s Thesis, Southwest Jiaotong Universy, Chengdu, China, 2022. [Google Scholar]
  2. Yang, Y. Simulation Analysis of Smoke in Subway Platform Fires. J. Hefei Univ. (Compr. Ed.) 2021, 38, 121–127. [Google Scholar]
  3. Nie, C.T.; Chi, X.W.; Xie, Y. Research on the Evaluation Index System of Subway Fire Risk. Urban Mass Transit. 2023, 26, 147–151+156. [Google Scholar]
  4. Li, Y.F.; Su, Z.H. A Review of Research on Thermal Environment Evolution and Evacuation Safety in Subway Tunnel Fires. Tunn. Undergr. Eng. Disaster Prev. Control. 2024, 6, 1–12. [Google Scholar]
  5. Xu, D.N. Study on Influencing Factors and Control of Smoke Spread in Rectangular-like Subway Tunnels. Master’s Thesis, Dalian Jiaotong University, Dalian, China, 2023. [Google Scholar]
  6. Gao, H.H. Study on Smoke Characteristics in Subway Tunnel Fires Considering Train Blockage Effect and Slope Influence. Master’s Thesis, Henan University of Technology, Zhengzhou, China, 2023. [Google Scholar]
  7. Zhou, D.; Tang, Z.T.; Hu, T.E. Study on the Influence of Tunnel Radius on Smoke Spread Characteristics in Subway Train Fires. J. Railw. Sci. Eng. 2023, 20, 3918–3927. [Google Scholar]
  8. Chen, S.; Tao, T.; Zhou, X.Y. Simulation Study on Evacuation in Typical Scenarios of Subway Carriage Fires. Urban Mass Transit. 2023, 26, 147–154. [Google Scholar]
  9. Zahr, T.; Omid, A.; Mahmoud, Y. 3D Simulations of Smoke Exhaust System in Two Types of Subway Station Platforms. Int. J. Vent. 2021, 20, 65–81. [Google Scholar]
  10. Rie, D.; Ryu, J. Sustainable Urban Planning Technique of Fire Disaster Prevention for Subway. Sustainability 2020, 12, 372. [Google Scholar] [CrossRef]
  11. Zheng, A.P.; Liu, C.H.; Pang, M.X. Application Research on the Linkage Mode of Subway Tunnel Ventilation System and Interval Fire. Fire Sci. Technol. 2023, 42, 931–934. [Google Scholar]
  12. Cheng, X. Simulation Study on the Smoke Blocking Performance of Air Curtains in Subway Platforms. Master’s Thesis, Anhui Jianzhu University, Hefei, China, 2024. [Google Scholar]
  13. Liu, Z.Y.; Li, X.; Zhou, X. Temperature Distribution in Subway Carriage Fires under Air Supply Conditions. J. Tsinghua Univ. (Nat. Sci. Ed.) 2023, 63, 1529–1536. [Google Scholar]
  14. Chen, K.C.; Xie, J.B.; Yao, Q.H. Simulation and Analysis of Smoke Diffusion in Subway Platform Fires. J. Sun Yat-Sen Univ. (Nat. Sci. Ed.) 2019, 58, 15–22. [Google Scholar]
  15. Roh, J.S.; Ryou, H.S.; Park, W.H.; Jang, Y.J. CFD simulation and assessment of life safety in a subway train fire. Tunn. Undergr. Space Technol. 2009, 24, 447–453. [Google Scholar] [CrossRef]
  16. Li, Q.M.; Deng, Y.L.; Liu, C.; Zeng, Q.T.; Lu, Y. Modeling and analysis of subway fire emergency response: An empirical study. Saf. Sci. 2016, 84, 171–180. [Google Scholar] [CrossRef]
  17. Wang, L. Study on Combustion Characteristics of Transverse Double Fire Sources in Mountain Highway Tunnels. Master’s Thesis, Chongqing Jiaotong University, Chongqing, China, 2023. [Google Scholar]
  18. Wang, Z.Y.; Li, J.; Fu, M. Evacuation Simulation of Deep-buried Subway Stations Considering Fatigue and Visibility. Fire Sci. Technol. 2019, 38, 1698–1702. [Google Scholar]
  19. Wen, K.; Ni, T.X.; Peng, J.Z. Calculation Method and Application of Natural Air Supply Pathway Resistance in Deep-buried Subway Stations. Mod. Urban Transit. 2022, 06, 89–93. [Google Scholar]
  20. Lan, B. Study on Smoke Movement and Evacuation Strategies in Deep-buried Subway Station Fires. Master’s Thesis, Chongqing University of Science and Technology, Chongqing, China, 2021. [Google Scholar]
  21. Shi, C.L.; Zhong, M.H.; He, L. Full-scale fire experiment research in subway station and tunnel (1): Experimental design. J. Saf. Sci. Technol. 2012, 8, 22–28. [Google Scholar]
Figure 1. The overall view of the platform level and the fire source location.
Fire 08 00296 g001
Figure 2. The arrangement of thermocouples in the experiment.
Fire 08 00296 g002
Figure 3. Flame state with ventilation system turned off.
Fire 08 00296 g003
Figure 4. Flame state with ventilation system turned on.
Fire 08 00296 g004
Figure 5. The temperature distribution curve of the smoke layer in Experiment 1.
Fire 08 00296 g005
Figure 6. The temperature distribution curve of the smoke layer in Experiment 2.
Fire 08 00296 g006
Figure 7. The temperature distribution curve of the smoke layer in Experiment 3.
Fire 08 00296 g007
Figure 8. The temperature distribution curve of the smoke layer in Experiment 4.
Fire 08 00296 g008
Figure 9. The temperature distribution curve of the smoke layer in Experiment 7.
Fire 08 00296 g009
Table 1. Experimental parameters.
Experimental ConditionPan Size (m)Number of PansHeat Release Rate (kW/m2)Fire Source
Power (kW)
1. Without exhaust0.5 × 0.5 × 0.11658165
2. With exhaust0.5 × 0.5 × 0.11658165
3. Without exhaust0.5 × 0.5 × 0.12696348
4. With exhaust0.5 × 0.5 × 0.12696348
5. Without exhaust0.5 × 0.5 × 0.14751751
6. With exhaust0.5 × 0.5 × 0.14751751
Disclaimer/Publisher’s Note: The statements, opinions and data contained in all publications are solely those of the individual author(s) and contributor(s) and not of MDPI and/or the editor(s). MDPI and/or the editor(s) disclaim responsibility for any injury to people or property resulting from any ideas, methods, instructions or products referred to in the content.

