Article

Risk Analysis of Fuel Leakage and Explosion in LNG-Powered Ship Cabin Based on Computational Fluid Dynamics

1
Navigation College, Dalian Maritime University, Dalian 116026, China
2
China Waterborne Transport Research Institute, Beijing 100013, China
3
School of Mechanical-Electronic and Vehicle Engineering, Beijing University of Civil Engineering and Architecture, Beijing 102616, China
4
School of Construction Engineering, Shenzhen Polytechnic University, Shenzhen 518000, China
*
Author to whom correspondence should be addressed.
Fire 2025, 8(5), 192; https://doi.org/10.3390/fire8050192
Submission received: 31 March 2025 / Revised: 7 May 2025 / Accepted: 7 May 2025 / Published: 10 May 2025
(This article belongs to the Special Issue Confined Space Fire Safety and Alternative Fuel Fire Safety)

Abstract

In order to analyze the explosion risk of the engine room, this paper uses CFD software to simulate the LNG leakage process in the engine room of the ship, and uses the combustible gas cloud obtained from the leakage simulation to simulate the explosion, analyzing its combustion and explosion dynamics. On the basis of previous studies, this paper studies the coupling of leakage and explosion simulation to ensure that it conforms to the real situation. At the same time, taking explosion overpressure, explosion temperature, and the mass fraction of combustion products as the breakthrough point, this paper studies the harm of explosion to human body and the influence of ignition source location on the propagation characteristics of LNG explosion shock wave in the engine room, and discusses the influence of obstacles on gas diffusion and accumulation. The results show that the LNG leakage reaches the maximum concentration in the injection direction, and the obstacles in the cabin have a significant effect on the diffusion and accumulation of gas. In the explosion simulation based on the leakage results, it can be determined that the shape of the pressure field generated by the explosion is irregular, and the pressure field at the obstacle side has obvious accumulation. Finally, in order to reduce the explosion hazard, the collaborative strategy of modular layout, directional ventilation, and gas detection is proposed, which provides ideas for the explosion-proof design of the cabin.

1. Introduction

Ships have played a pivotal role in advancing global economic development and facilitating cultural exchange. However, in response to environmental changes and increasingly stringent international regulations on fuel emissions, the widespread adoption of LNG has emerged as a trend. Nevertheless, the unique properties of LNG pose significant challenges in its utilization and transportation [1]. Liquefied Natural Gas (LNG) has the characteristics of low density and high calorific value. In the event of a leak, LNG evaporates quickly to form a flammable cloud. If this gas cloud encounters an ignition source, there is a significant risk of explosion, which could cause serious damage to life, property, health, and equipment. Under normal conditions, LNG is usually stored at low temperatures, which makes it difficult to ignite or explode. If natural gas leaks and mixes with the surrounding air to a concentration within its explosive range (with a volume concentration of approximately 5.3% to 14.4%), it becomes susceptible to explosion upon contact with an ignition source [2,3]. Therefore, simulation studies on leakage, dispersion, and explosion processes are of critical importance. The physical and chemical properties of LNG are shown in Table 1.
The thermophysical parameters in the table are related to their temperature, and the formula is as follows [4]:
F 1 = 2183.875 0.24973 T + 0.01199 T 2 9.56 × 1 0 6 T 3 + 2.457 × 1 0 9 T 4
F 2 = 0.00935 + 1.4028 × 1 0 4 T + 3.318 × 1 0 8 T 2
F 3 = 3.844 × 1 0 7 + 4.0112 × 1 0 8 T 1.4303 × 1 0 11 T 2
In recent years, with the rapid development of computer technology, numerical simulation has become the core means to study gas leakage, diffusion, and explosion phenomena. In the field of gas leakage and diffusion, scholars have revealed the dynamic laws under the coupling of multiple factors through computational fluid dynamics (CFD). Gopalaswami et al. analyzed the evaporation and diffusion process of LNG in a confined waterway based on CFD and pointed out that the wind field significantly affects the distribution of vapor cloud through entrainment and convection [5]; Li et al. further studied the ship engine room environment and found that in the case of small leaks, the flammable concentration of natural gas is confined to the local space, while medium leaks tend to form a diffuse cloud at the top [6]. In terms of research methods, Liu et al. innovatively combined particle image velocimetry (PIV) with CFD to improve the accuracy of leakage prediction under multiple working conditions [7]; The Euler–Lagrangian three-dimensional model established by Sun et al. has expanded the research dimension of underwater gas diffusion [8]. In addition, equivalent models and experimental verifications further enhance the reliability of simulation results, such as the equivalent small tube model of submarine natural gas release [9] and the verification of the applicability of the k-ε turbulence model in closed spaces [10]. The analysis of key influencing factors shows that leakage rate, environmental conditions, and leakage port parameters play a decisive role in the diffusion behavior [5,8,9,11].
In terms of explosion mechanism and disaster prevention and control, the explosion characteristics of confined spaces and their influencing factors have become the focus of research, such as short-term impact and long-term pressure loads [12]. In this regard, FLACS software has been widely used in explosion simulations of complex scenarios: Zhang et al. found that the dominant effect of vapor cloud shape on explosion intensity exceeded that of fuel mass [13], while Z. Li et al. pointed out that the length of the natural gas tank and the ignition position had limited effects on the maximum overpressure [14]. In terms of explosion suppression, studies such as the fire-extinguishing mechanism of ultrafine water mist [15] and the reduction effect of ventilation systems on hydrogen explosion risks [16] have provided theoretical support for safety design. Dynamic evolution research, through a combination of experiments and simulations, has revealed the regulation of the size of the pressure relief port on the explosion pressure and flame structure [17], as well as the applicability of the detached vortex simulation and thickening flame model in explosion evolution [18].
Safety research on specific flammable gases and scenarios presents differentiated characteristics. Regarding hydrogen energy safety, scholars focus on the acceleration effect of pipeline obstacles on flame propagation [19], the coupling risk of a methane–hydrogen mixed explosion [20], and the propagation law of shock waves in hydrogen refueling stations [21]; in the field of LNG and natural gas, they focus on the analysis of ship leakage accidents [22] and the prevention and control of steam-cloud explosions in pipeline corridors [13,14]. In addition, the explosion prediction model of gasoline evaporation and diffusion [23] and the overpressure distribution of solid and liquid fuel cloud explosions [24] have expanded the research boundaries of traditional combustibles. In multi-factor coupling and risk assessment, the sensitivity of water temperature and water level to steam explosion [25] and the interaction of multi-source explosion pressure waves [26] reveal the disaster-chain effect of complex environments, while the EU DEMO reactor hydrogen explosion risk assessment [27] and the quantitative design of ventilation systems [16] have promoted the engineering application of risk prediction models.
In general, current research shows three major trends: first, the high precision of tools such as CFD and FLACS and the coupling of multiple physical fields, such as PIV-CFD combination [7]; second, the shift in safety design from passive prevention and control to active suppression, such as ultra-fine water mist [15] and ventilation optimization [
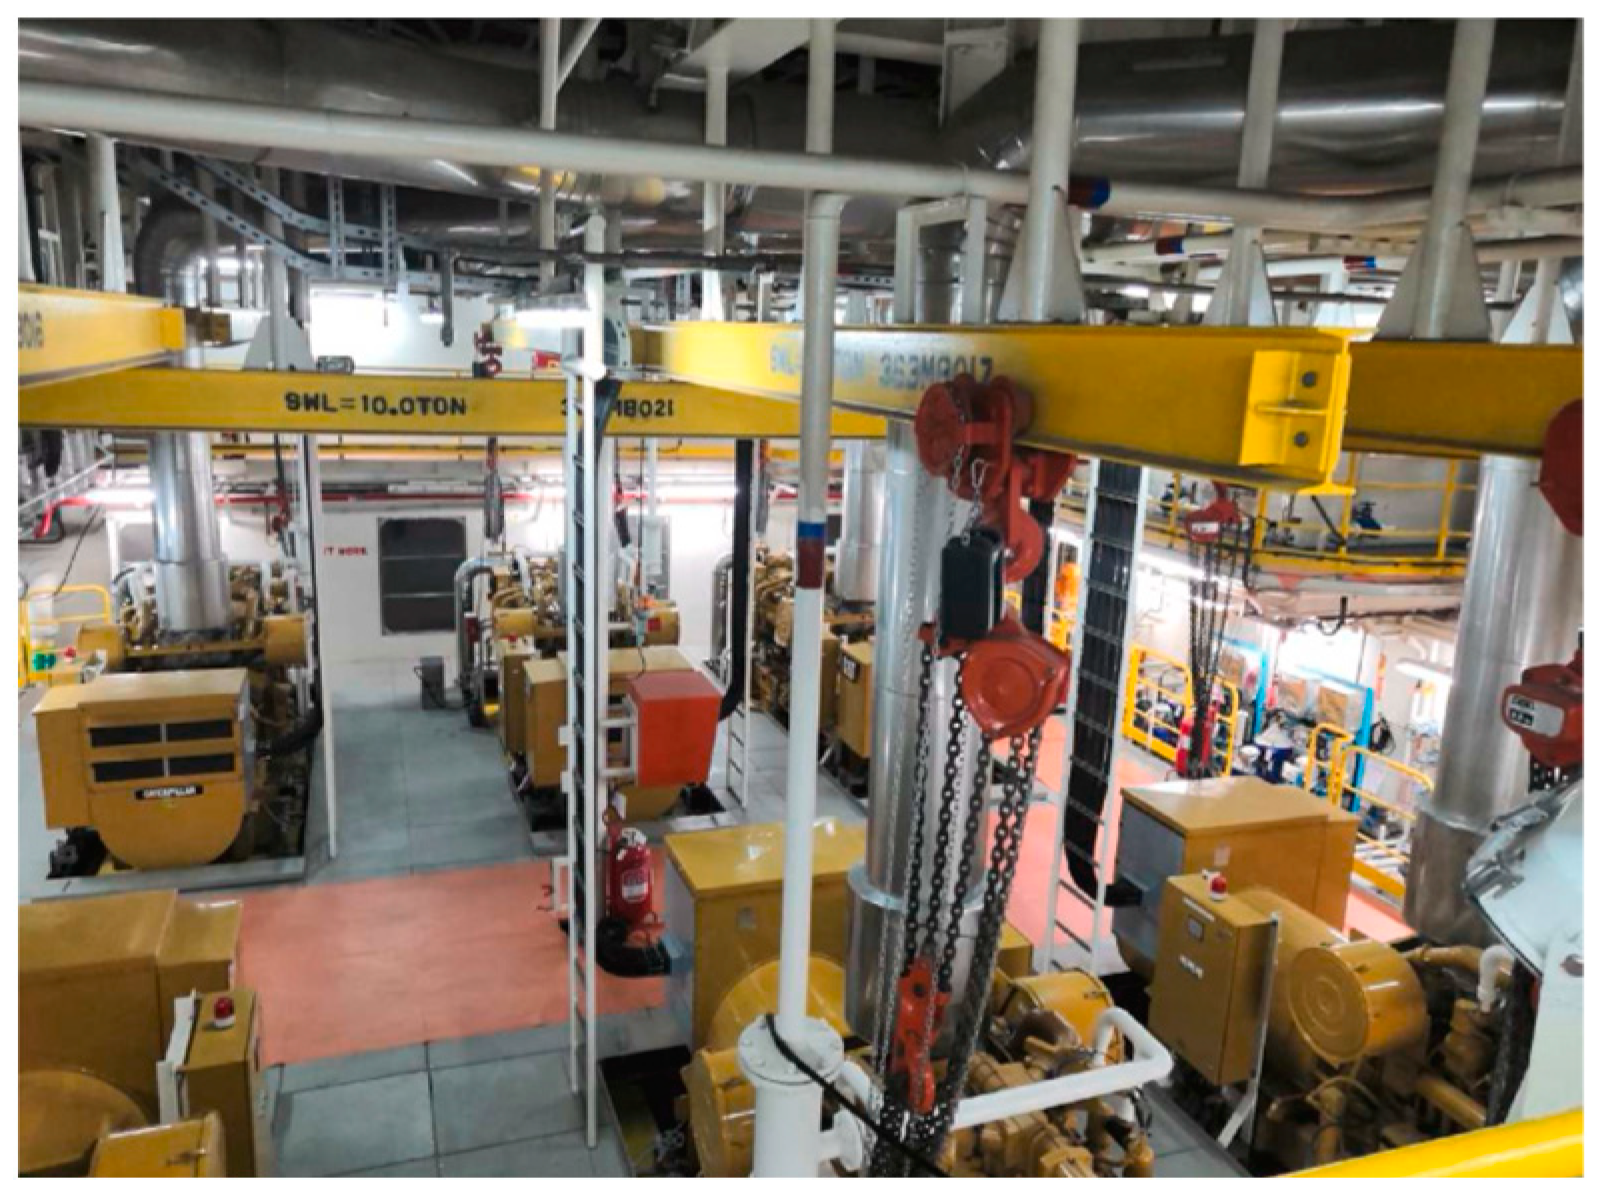
16]; third, the extension of scenarios from industrial facilities to new energy and extreme environments. In the future, further breakthroughs are needed in the refined modeling under complex boundary conditions, the development of new explosion suppression materials and technologies, and the dynamic assessment of multi-scale risk chains. Based on the above literature, it can be considered that the research on LNG ship leakage and explosion has made certain progress, but the research on the safety of the LNG ship engine room is still insufficient; the simulation research on the coupled gas leakage, diffusion, and explosion in the ship engine room, especially, is still relatively limited. In addition, compared with other closed places, the structure of the ship engine room is relatively special. Affected by the behavior of the ship and environmental conditions, the internal layout, ventilation, and other factors are more complicated, the safety challenges are more severe, and the rescue is more difficult.
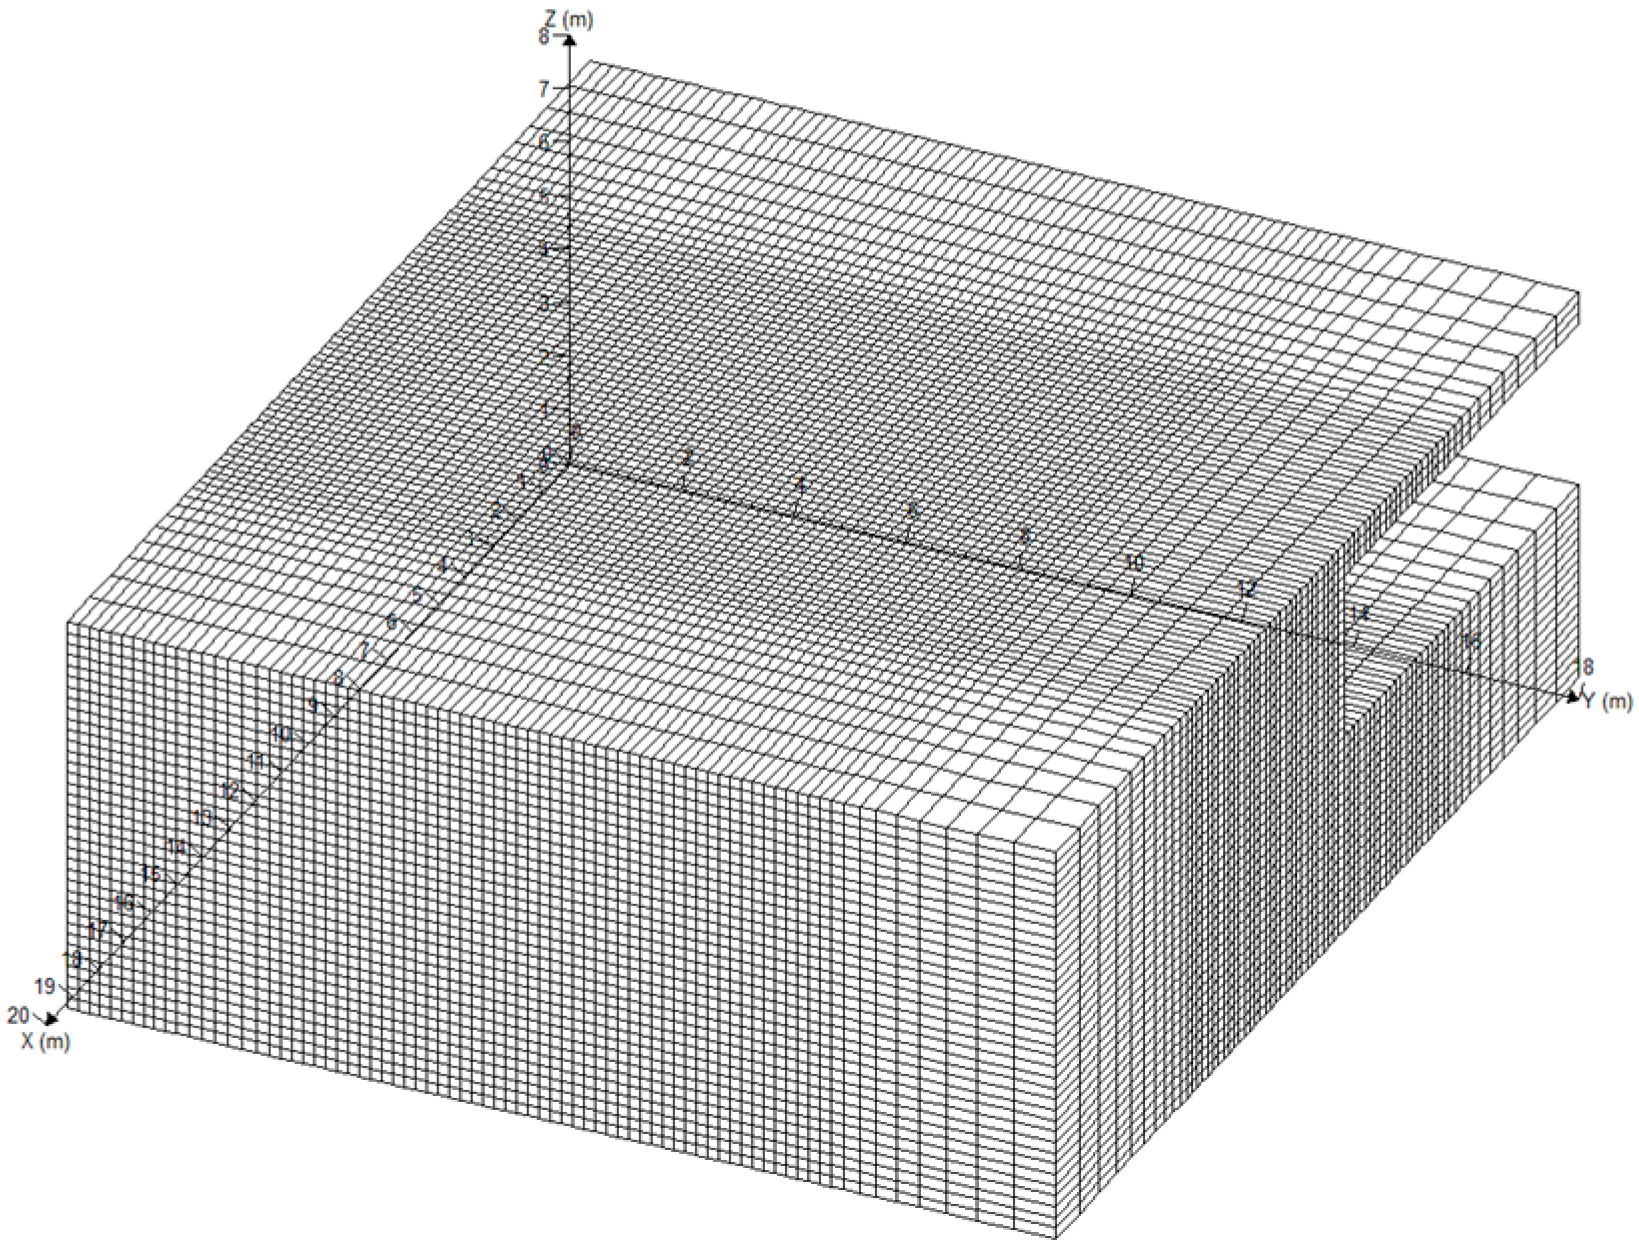
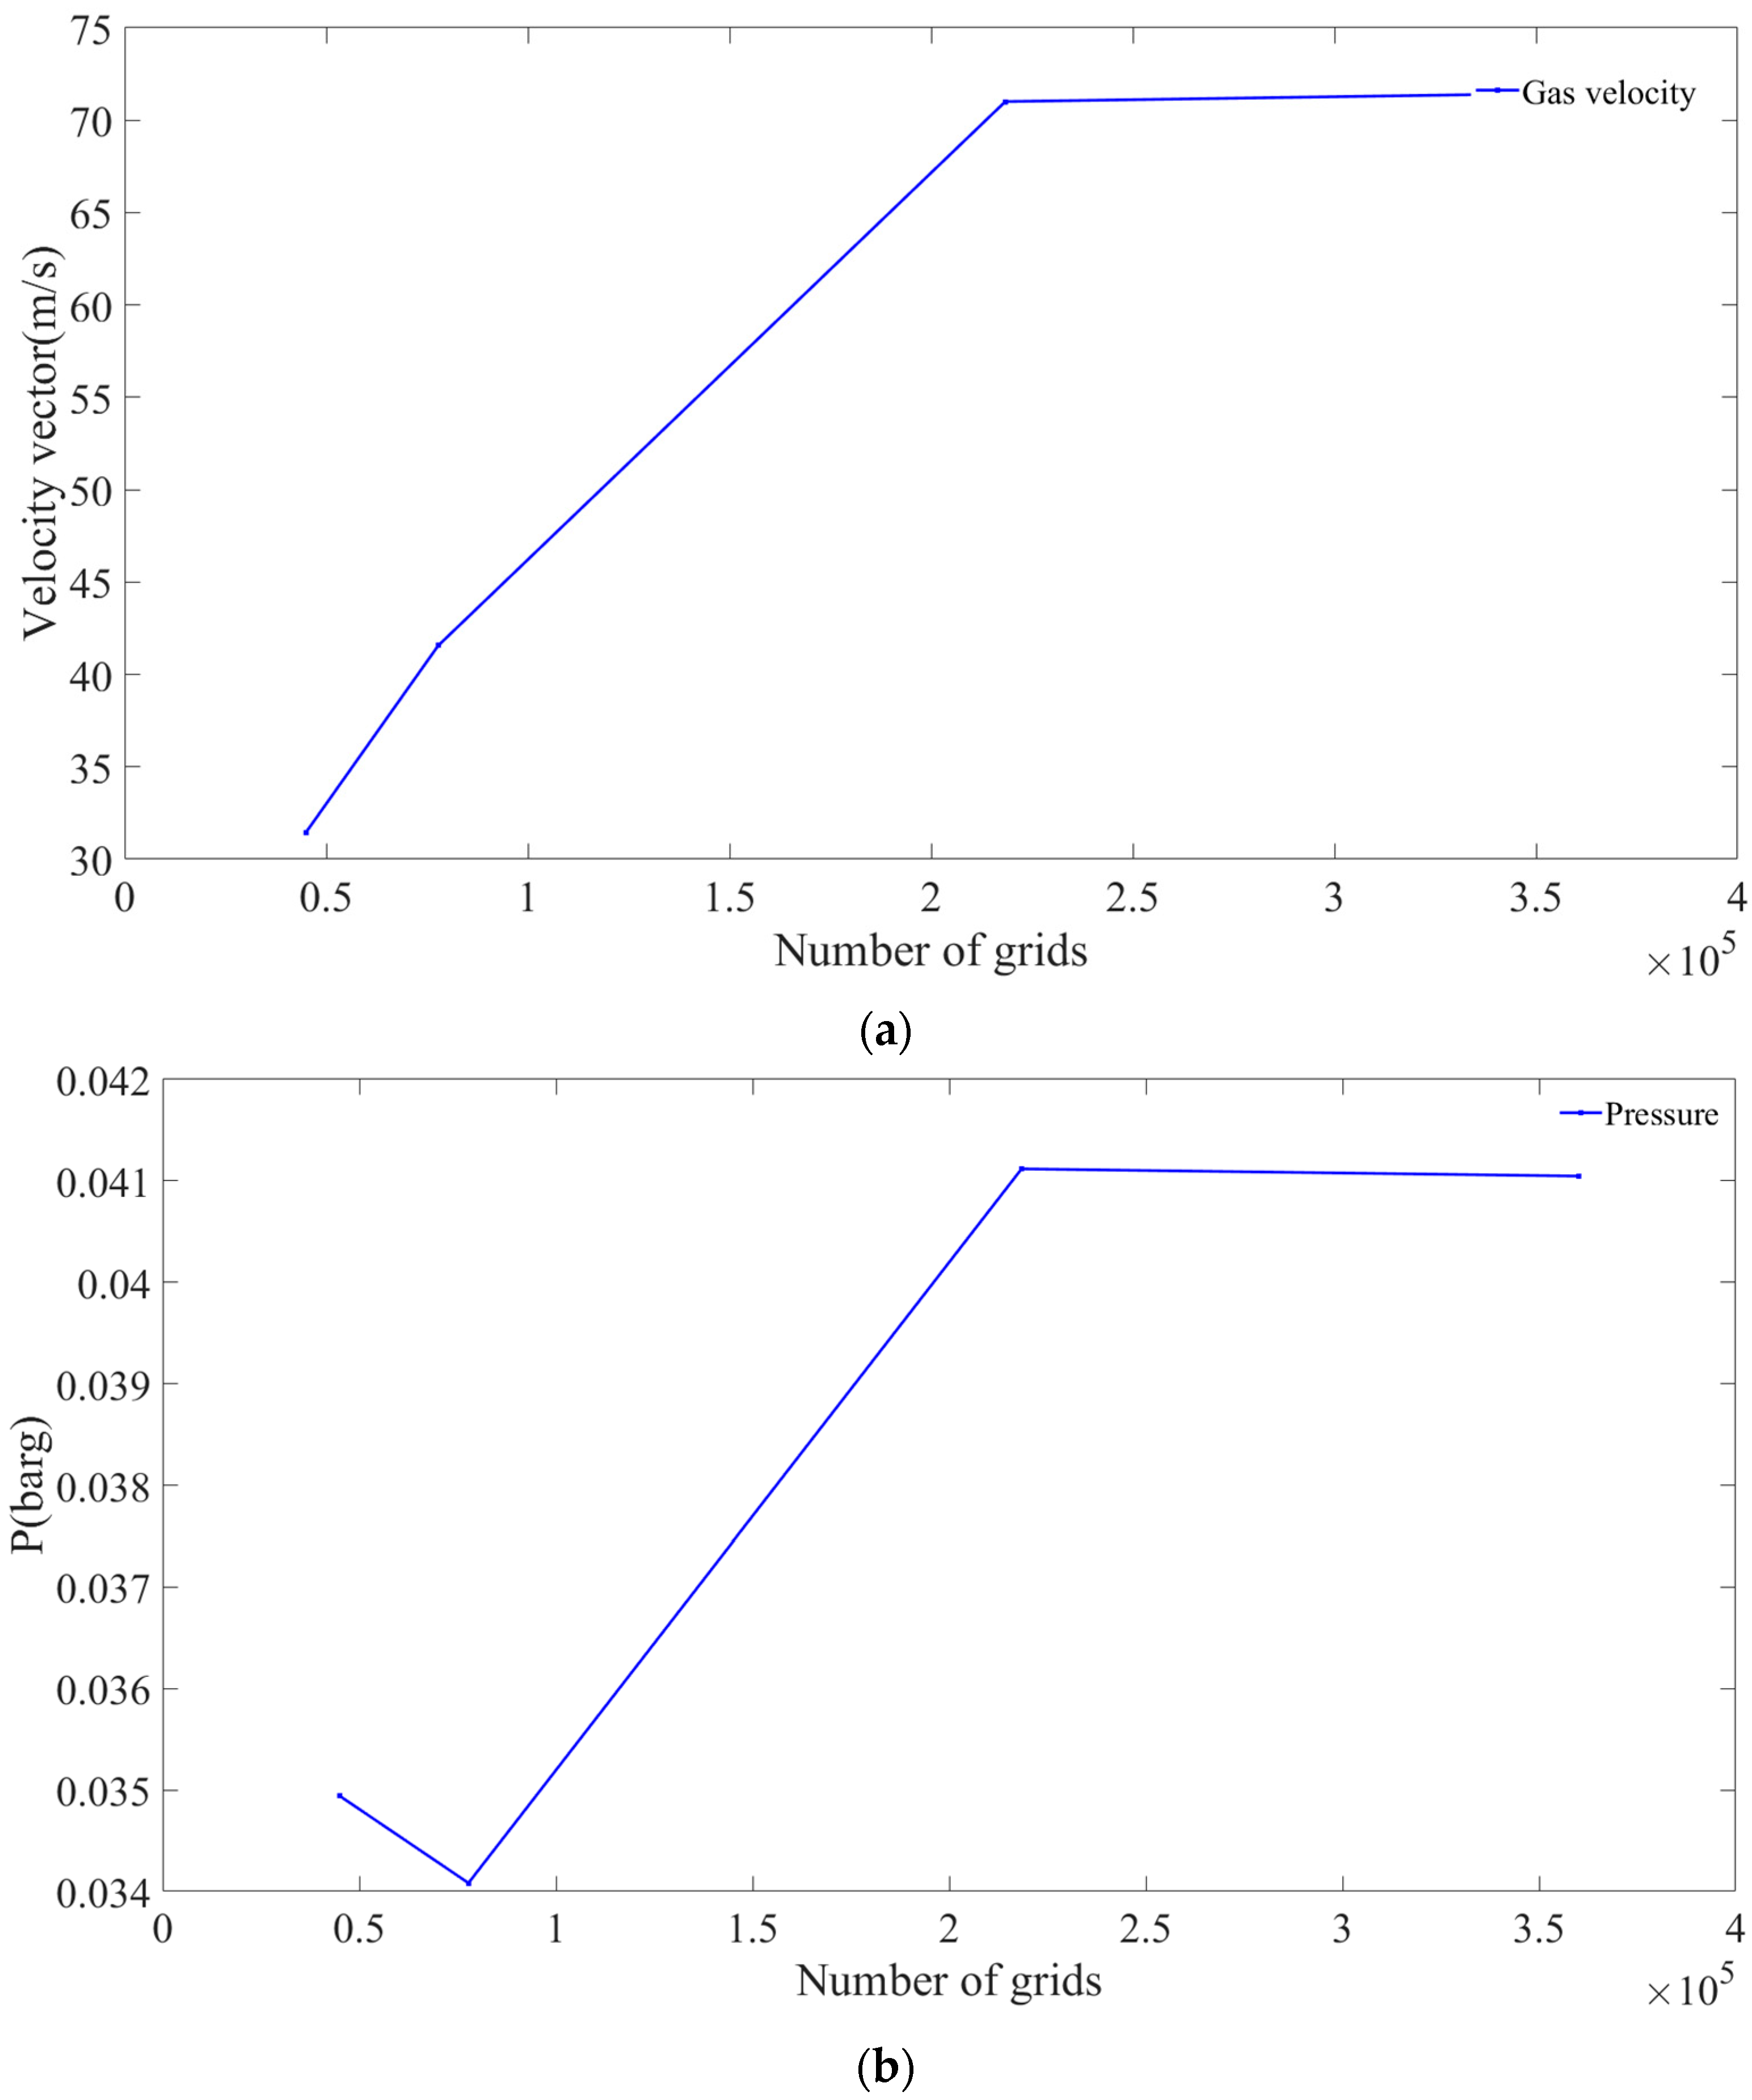
The innovation of this study is mainly reflected in the following aspects: In previous related studies, the simulation of LNG leakage and explosion was relatively scattered. This paper uses FLACS V9.0 software to numerically simulate the coupling process of gas leakage and explosion in the ship’s engine room, which is closer to the actual situation and provides a reference for the formulation of future ship design and personnel safety regulations; based on the numerical simulation results of a leakage explosion, this paper discusses the hazards of explosion to the human body from the perspectives of explosion overpressure, explosion temperature, and quality of post-explosion combustion products, puts forward suggestions for reducing the hazards of explosion, and obtains the optimal escape time for ship staff after an early leakage-induced explosion. At the same time, it analyzes the changing trend of the proportion of harmful gases after combustion, which has certain reference significance for rescue after the accident. This paper is organized as follows: the first part conducts a literature review and points out the innovations and key contributions of this paper; the second part explains the complete theoretical framework model of leakage diffusion, gives the geometric model and boundary conditions of the study, and performs a grid independence analysis; the third part shows and analyzes the numerical simulation results of leakage and explosion; the fourth part discusses the influence of different ignition sources on shock waves and the influence of various factors after the explosion on human body injuries; and the fifth part summarizes the whole paper and draws conclusions, pointing out the shortcomings of current research.

2. Materials and Methods

2.1. Basic Theory of Leakage Diffusion and Explosion

FLACS simulates the dispersion and leakage of LNG based on the continuity equation, momentum equation, energy conservation equation, and species conservation equation. During the leakage and explosion processes, natural gas undergoes density changes, classifying it as a variable-density fluid. Additionally, based on the Reynolds number of natural gas, it can be determined that the leakage process involves complex turbulent flow rather than laminar flow. To accurately describe the characteristics and patterns of gas leakage and dispersion, an appropriate turbulence model must be selected, specifically the k-ε turbulence model. This model is the most widely used in computational fluid dynamics (CFD). It characterizes turbulent flow through two equations: one for turbulent kinetic energy (k) and the other for turbulent dissipation (ε), which represents the dissipation rate of turbulent kinetic energy.
The continuity equation for the variable-density turbulent fluid in this study is expressed in Equation (4), where ρ represents the density of the mixed gas, and ui denotes the velocity components in the u, v, and w directions. The momentum conservation equation used in the leakage simulation is presented in Equation (5). Here, ρa represents the air density, P denotes the absolute pressure, g is the gravitational acceleration, and μ signifies the dynamic viscosity of the fluid. The energy conservation equation used in the leakage simulation is presented in Equation (6). Here, T denotes the temperature, Cp represents the specific heat capacity, k signifies the fluid heat transfer coefficient, and St refers to the viscous dissipation term, which encompasses the internal heat source of the mixed gas and the portion of fluid mechanical energy converted into thermal energy due to viscosity. The equation for turbulent kinetic energy k is presented in Equation (7), while the equation for the turbulent kinetic energy dissipation rate ε is given in Equation (8). Here, Gk represents the generation term of turbulent kinetic energy k due to the mean velocity gradient; Gb denotes the generation term of turbulent kinetic energy caused by buoyancy; YM signifies the contribution of fluctuating dilatation in compressible turbulence; and σk is the Prandtl number corresponding to turbulent kinetic energy k, which is set to 1.0. Here, σϵ is the Prandtl number corresponding to the dissipation rate, which is set to 1.3; C1ϵ, C2ϵ, and C3ϵ are empirical constants, assigned values of 1.44, 1.92, and 0.80, respectively; μ represents the laminar viscosity coefficient, and μt denotes the turbulent viscosity coefficient [28].
ρ t + ρ u i x j = 0
ρ u i t + x j ρ u i u j = P x i + x j μ u i x j + ρ ρ a g
ρ u j T x j + ρ T t = x j k C p T x j + S T
ρ k t + ρ k u i x i = x j μ t σ k + μ k x j + G k + G b ρ ε Y M + S k
ρ ε t + ρ ε u i x i = x j μ t σ ε + μ ε x j + C 1 ε ε k G k + G 3 ε G b C 2 ε ρ ε 2 k + S ε
To simulate the explosion of LNG following leakage in the ship’s engine room, not only must the three fundamental conservation equations mentioned above be satisfied, but FLACS software also employs the finite volume method to solve the combustion mass transport equation for natural gas, as shown in Equation (9) [29]. Here, Yf represents the mass fraction of fuel; σk is the turbulent Prandtl number, set to 0.7; μe denotes the effective viscosity; Rm signifies the fuel combustion coefficient; βj represents the diffusion coefficient; and h is the enthalpy.
t β v ρ m + x j β j ρ μ j m = x j β j μ e h σ k x j + R m

2.2. Geometric Model Establishment and Boundary Condition

The ship’s engine room, also referred to as the machinery space, is responsible for providing power and energy to the vessel. This area houses a variety of mechanical equipment and systems, including engines, boilers, fuel systems, exhaust systems, lubrication systems, cooling systems, and fire and safety equipment. The engine room structure of certain ships is highly complex, featuring multiple decks, densely arranged pipelines, and advanced automated control systems. Considering the resolution, computational capacity, and modeling efficiency of FLACS, the geometric model of the LNG ship engine room is appropriately simplified. Specific appearance details and materials of the engine room equipment are streamlined, retaining only the primary contours and essential materials. Additionally, small-volume equipment and components with negligible impact on LNG leakage and explosion are omitted [30]. The lower left corner of the ship’s engine room is designated as the origin of the modeling reference coordinate system, with the X, Y, and Z axes aligned with the length, width, and height of the engine room, respectively. Based on relevant specifications and engine room data, a 20 m long, 18 m wide, and 8 m high engine room model is constructed. Geometric models of ship equipment, including oil tanks, air bottles, oil–water separators, engines, sewage treatment devices, and gas pipelines, are sequentially established within the engine room. The real physical model of the ship’s engine room is shown in Figure 1. The simplified physical model of the ship’s engine room is illustrated in Figure 2.
Because the simulation is limited by the computing power of the computer, the simulation time will be extended with the gradual densification of the grid division, and the accuracy of the simulation will be distorted with the gradual sparseness of the grid division, which requires that the grid division not only meet the research needs, but also meet the computing power of the computer. Based on the principle that grid density affects recognition accuracy, the region spanning 5 m to 15 m on the X-axis, 4 m to 14 m on the Y-axis, and 0 m to 8 m on the Z-axis is divided into a grid with a resolution of 0.2 m to meet obstacle recognition requirements. The remaining areas are adaptively meshed by the software. Additionally, due to the significant discrepancy between the grid density of the adaptive mesh at the leakage point and the scale of the leakage point, the accuracy of LNG dispersion and leakage simulation may be compromised [31]. Therefore, the grid at the leakage point is refined, and the transition between the refined and unrefined regions is smoothed to ensure that the thickness difference between adjacent control volumes does not exceed 40%. This enhances the accuracy and realism of the simulation results. After multiple iterations of grid refinement, balancing computational accuracy and efficiency, the total number of grids is 218,400. The final grid configuration is illustrated in Figure 3, and detailed grid information is provided in Table 2.
The setting of no ventilation in this paper is an extreme case. Although ventilation has an impact on the concentration distribution of leaked gas, fresh air can dilute the explosive gas and thus reduce the explosion hazard, but the ventilation volume of the ship’s engine room is also different in actual situations. When a leakage-induced explosion accident actually occurs, it is often accompanied by poor ventilation. Therefore, this paper is set up without ventilation. The leakage simulation begins at 0 s and continues for 100 s. Based on the real research of the sea-level scenario where the ship is located, both the ambient and initial surface temperatures are set to 20 °C (293 K). The total simulation time is 100 s, with atmospheric pressure set to one atmosphere. The ground roughness is configured to 0.1 in accordance with the relevant standards of the reference software. The leakage flow rate is 2 kg/s, the leakage aperture area is 0.04 m2, and the relative turbulence intensity is set to 0.1. According to Pasquill–Turner stability classification, it is set here that the leakage explosion occurs in the windless night, so the atmospheric stability is classified as “F”. Pasquill–Turner stability classification is shown in Table 3. Given that over 90% of LNG components are methane, and to simplify the simulation complexity, LNG and air are treated as ideal gases, with LNG approximated as pure methane.

2.3. Analysis of Cabin Mesh Independence

In this study, the ship’s engine room is assumed to be a closed and confined environment without ventilation. First, the grid division from the previous section is selected as the reference grid. Subsequently, the grid is coarsened and refined accordingly. Grid independence is verified by comparing simulation results across grids of varying resolutions. The three grid resolutions for the engine room are detailed in Table 4.
Leakage simulation analysis is conducted on the cabin geometric models with four resolutions listed in the table under identical boundary conditions. To minimize data randomness, two parameters from the output data—VVEC (velocity vector) and P (pressure)—are selected as measurement indicators at the position (10.1, 1.5, 1.1). The velocity vector and pressure near the leakage source are compared across different grid resolutions, and the relative-change scatter plot is presented in Figure 4. By analyzing the data of the line chart in Figure 4, it can be seen that the number of 218,400 grids is significantly different from the number of 360,000 grids, and the simulation time is greatly different. However, by comparing the leakage velocity vector and pressure between the two grids, the error is low and within the allowable range, while the difference between the number of 77,760 grids and the number of 218,400 grids is huge. Through grid independence verification, it is confirmed that the selected grid resolution ensures both accuracy and computational efficiency in the simulation results.

2.4. Parameter Settings

Following an LNG leak and dispersion, a vapor cloud rapidly forms. When the concentration of the vapor cloud reaches the explosive limit, ignition may result in a deflagration or detonation. Upon ignition, the combustion process releases a significant amount of heat, causing the surrounding gas to expand. The surrounding air is disturbed by the impact, leading to sudden changes in pressure, density, and temperature. This disturbance propagates through the air, forming a shock wave. To further investigate the propagation characteristics of shock waves from LNG explosions in the ship’s engine room and assess their hazards, the simulated gas cloud from the leakage simulation is imported into the explosion model for comparative analysis.
Using the FLACS gas cloud dump module, the LNG vapor cloud under leakage conditions at different time intervals is imported into the explosion model. Spatial distribution diagrams of pressure, maximum overpressure, temperature, and mass fraction of combustion products from the LNG explosion are generated using the P, PMAX, T, and PROD parameters in the 3D output module. Six monitoring points are established within the cabin to track pressure and temperature changes before and after the explosion. The coordinates of the six monitoring points are P1 (1, 1, 2), P2 (10, 10, 3), P3 (9, 10, 1.7), P4 (10.1, 2, 1.1), P5 (9, 15, 6), P6 (10.1, 9, 3). The monitoring point P1 is located at the corner of the cabin, P4 is located near the leakage source, P3 is located near the ignition source, P6 is located above the ignition source, and P2 and P5 are located near the cabin equipment. Considering that there will be a large pressure gradient between the explosion center and the corner of the cabin, the monitoring point can detect both the leakage source and the data near the explosion source and the corner data of the cabin. At the same time, it can also monitor the explosion overpressure and temperature of each important equipment in the cabin during the explosion, so as to reduce the manual damage of the atlas equipment. The distribution of each monitoring point is illustrated in Figure 5a. During the LNG ship engine room explosion simulation, the boundary conditions are set to Euler, which is suitable for explosion simulations, as required by the software. Additionally, the grid is re-divided into a uniform grid with a resolution of 0.2 m, as shown in Figure 5b.

3. Results

3.1. Leakage Simulation Results Analysis

The simulated leakage source in this study is positioned at coordinates (10.1, 1.1, 1.1). Set the leakage hole to 0.04 m2, and set the shape to a standard circle to simplify the simulation. X = 10.1 m is about half of the 20 m length. Placing the leak near the center helps to see the symmetrical diffusion and understand how the leak propagates from the center location. Y = 1.1 m is close to the origin on the Y axis (width) and close to one of the side walls. The equipment here is the service tank, gas valve unit, and gas pipeline, which are common locations for leaks. Due to its proximity to the wall (Y = 1.1 m), the LNG leak is affected by boundary effects earlier than a leak located in the center. This causes gas to accumulate faster in corners or on walls, which affects the formation of explosive concentrations. Z = 1.1 m is close to the floor. Since natural gas is lighter than air, it rises, but starting near the floor results in different vertical diffusion dynamics than leaks at higher altitudes. This affects how quickly the gas reaches the ignition source located at a higher position. Proximity to walls and nearby equipment (as described in the engine room model) can cause turbulence, recirculation zones, or backflows early in the diffusion process. This can accelerate the mixing of gas with air or the formation of localized areas of high concentration, which are critical to explosion risk. Based on the predefined monitoring sections, the fundamental process of LNG dispersion and leakage can be analyzed. The three-dimensional (3D) cloud map of LNG fuel leakage is presented in Figure 6. The FUEL module in the FLACS monitoring data represents the mass fraction of fuel within the mixture of fuel, air, and combustion products. Since this paper uses FLACS software for simulation, the software models fluid dynamics based on conservation equations and k-ε turbulence model. In the early stages, the gas cloud will behave like a free jet. If there is no external influence such as wind or obstacles, the momentum of the leaking gas will dominate. Since the leak source is located at X = 10.1 (the middle length of the 20 m X axis), the diffusion along the X axis will naturally diffuse evenly in both directions to achieve symmetry. The initial momentum of the jet will push the gas forward (Y direction), but since there are no wind or obstacles yet, the diffusion in the X direction (left and right) will be uniform. Buoyancy also plays a role, because LNG is lighter than air, causing it to rise, but in the early stages, the vertical motion may not yet destroy the horizontal symmetry. Regarding the discussion of external wind, the simulations in this paper were conducted in an unventilated, confined space without initial wind. If external wind is introduced, a directional force will be added to the gas diffusion. Wind from a specific direction will push the gas cloud, thus destroying the symmetry [33]. For example, wind blowing in the +Y direction will bias diffusion more toward that direction while suppressing diffusion in the opposite direction. Turbulence caused by wind may also make the gas mixing more uneven, resulting in an asymmetric concentration distribution. Obstacles in the cabin may interact with the wind to produce vortices or change the direction of the airflow, further destroying the symmetry. However, this article assumes that the cabin is a confined space, so the initial wind is not introduced. As the gas cloud continues to propagate forward, it encounters obstacles such as the side walls and the intermediate interlayer within the cabin, leading to gradual accumulation at the far end of the cabin and forming a high-concentration zone, represented by the red region in the 3D visualization. As LNG leakage, accumulation, and buoyancy persist, the gas cloud progressively fills the space above the cabin, starting from the bottom and eventually dispersing into the central cabin space.
To analyze the leakage and dispersion characteristics of LNG in the horizontal direction, the XY cross-section at a height of 1.1 m (the elevation of the leakage source) was monitored to obtain the fuel distribution, as illustrated in Figure 7. From the XY cross-sectional visualization of the gas cloud dispersion process, it is evident that the frontal distribution of LNG dispersion is symmetric about the leakage source along the X-axis. This symmetry primarily arises because, at this stage, the gas cloud dispersion is largely unaffected by external wind speed and obstacles. By analyzing the gas cloud dispersion visualization 8 s after the leakage, low-concentration gas clouds are observed in certain areas of the engine aisle. This phenomenon occurs because, as the leaking gas cloud disperses along the X-axis, a portion of it encounters engine equipment, altering its propagation direction. This results in diversion and dispersion to both sides, with accumulation near the obstacles forming low-concentration gas clouds. Simultaneously, the majority of the gas cloud continues to disperse further along the Y-axis until it encounters the cabin wall. The gas cloud is influenced by obstacles and air resistance, causing the momentum of the jet gas at its front end to decrease sharply. As a result, the gas cloud primarily disperses along the X-axis, with its overall width increasing significantly. From the mid-term gas cloud dispersion distribution diagram, it is evident that the gas cloud disperses toward the corner of the cabin along the far wall of the Y-axis, where it accumulates continuously. It then begins to disperse and propagate along the wall back toward the leakage source, forming an olive-shaped boundary externally. Simultaneously, a reflux zone opposing the jet forms on the side wall of the cabin. This indicates that the LNG leakage in the ship’s engine room can be classified as a turbulent restricted jet. By analyzing the late-stage gas cloud dispersion distribution diagram, it is evident that the gas cloud gradually disperses and fills the entire cabin. At the conclusion of the dispersion simulation, the gas cloud concentration is highest near the far wall of the cabin along the Y-axis and the walls at the left and right ends of the X-axis. Conversely, the concentration near the engine equipment is generally lower, demonstrating that obstacles exert a hindering effect on the propagation of gas clouds.
Since the propagation characteristics of LNG explosion shock waves are to be investigated next, analyzing the explosion limit distribution of LNG is of significant importance. Three-dimensional explosion limit distribution of the LNG cloud at a height of 0 m to 1.1 m is illustrated in Figure 8. The explosion limit for the LNG vapor cloud ranges from 5% to 15%. The FMOLE module in the FLACS monitoring data represents the molar volume fraction of combustible gas in the air. By analyzing the distribution of the explosion limit of the LNG vapor cloud at different stages of leakage, it is evident that the distribution of the gas cloud explosion limit closely aligns with the fuel distribution of the gas cloud dispersion. During the initial phase of the leakage, the hazardous area for vapor cloud explosions is limited and primarily concentrated along the path of the leaking jet. In the later stages of the leakage, the explosion limit of the vapor cloud becomes widely distributed, resulting in a significantly larger hazardous range. The concentration at the center of the gas cloud along the jet path and near the far wall exceeds the explosion limit of LNG, resulting in the gradual emergence of a hollow region in the visualization. Overall, the volume of the gas cloud explosion expands over time, increasing the hazard level throughout the cabin. The area between the engine equipment becomes a critical location for gas cloud explosions.
Normally, the LNG supply system in the engine room is equipped with an emergency shutdown system (ESD). ESD is crucial to ship safety and its role is to safely and effectively prevent the leakage and spread of LNG. A monitoring system is installed at leak-prone locations such as LNG pipelines, and an ESD system is installed in the LNG supply system. The system will stop the supply of LNG in an emergency. Once the gas detection system detects that the LNG leaks to a dangerous concentration, the LNG supply will be cut off immediately [34]. Due to the complex layout of LNG pipelines, the location of the leakage point is not fixed, and it is not in line with the actual situation to arrange too many monitoring points inside the cabin. Considering that the density of LNG is less than that of air, LNG usually diffuses upward after leakage. In order to eliminate the influence of different leakage points and leakage directions on detection, this study sets the monitoring point P7 on the ceiling at the center of the cabin. The specific coordinates of the monitoring point P7 are (10, 9, 7.5). The explosion concentration range of LNG is 5.3% to 14.4% [2,3]. Taking into account the distance between the monitoring point and the leakage source, and analogous to the activation conditions of the ESD system in mining engineering, the ESD system is immediately activated when the monitoring point detects a 1% LNG concentration [35]. The gas concentration variation curve detected by the monitoring point P7 is shown in Figure 9. It can be observed in the figure that the LNG concentration detected at the monitoring point reaches 1% at about 20 s, so the ESD system activation time should be 20 s.

3.2. Numerical Simulation Analysis of Steam-Cloud Explosion

To investigate the explosion process of liquefied natural gas following leakage and dispersion in the ship’s engine room, as well as the propagation characteristics of shock waves, two LNG vapor clouds with varying sizes and concentrations at 30 s and 50 s post leakage were introduced into the explosion model for simulation. To ensure a fixed and effective ignition source position, the distribution of the explosion limit of the leaking gas cloud at a cabin height of 1.7 m was analyzed at 30 s and 50 s of leakage in the XY plane, as illustrated in Figure 10. The ignition source position for this round of explosion simulation is set at (10.1, 9, 1.7).
The PROD (mass fraction of combustion products) of the gas cloud ignition explosion at 30 s and 50 s post leakage is illustrated in Figure 11, accurately reflecting the flame morphology during the gas cloud explosion process. From the figure, it is evident that in the initial stage following the explosion, a fireball forms at the ignition source of the gas cloud, and the combustible gas cloud burns symmetrically in a spherical shape. Subsequently, the flame propagates rapidly outward. At this stage, the flame combustion is characterized as a flash fire. When the flame front encounters obstacles and turbulence, the flame surface becomes curved and wrinkled, leading to an increased burning rate. The intensified influence of turbulence causes the combustion to transition from the flash fire stage to the deflagration stage. At this stage, a precursor shock wave emerges. As the precursor shock wave propagates to the unburned vapor cloud, this portion of the vapor cloud absorbs the shock wave’s energy, causing its temperature to rise to its ignition point and initiating combustion. This process generates a more intense shock wave, transitioning the combustion from deflagration to detonation.
The temperature variation curves for each monitoring point during the ignition and explosion of the gas cloud at 30 s and 50 s post leakage are presented in Figure 12. An analysis of the data reveals that the peak temperatures at each monitoring point are consistent, indicating that the flammable gas cloud is widely distributed throughout the cabin, including its corners, upon ignition. Additionally, the maximum value of the lower curve exceeds that of the upper curve, demonstrating that the intensity of combustion and explosion varies due to differences in ignition time, gas cloud size, and gas cloud concentration. The AISI Type 304 austenitic stainless is generally used as the material for LNG transmission pipeline [36], with a melting point of about 1727 K. The temperature curves for each monitoring point in the table include regions exceeding 1727 K. The high-temperature zones significantly surpass the melting point of the pipeline material, indicating that the explosion will cause substantial damage to the pipeline.
The pressure distribution of the XY cross-section at an explosion height of 1.8 m, 30 s post leakage, is illustrated in Figure 13. The pressure variation curves for each monitoring point during the two explosions are presented in Figure 14. Analysis of the data reveals that 0.039 s after ignition, the explosion shock wave propagates outward from the ignition point, creating a high-pressure zone at its center. By 0.059 s post explosion, the pressure difference causes the shock wave to push the combustible gas and combustion products near the ignition source outward, resulting in a low-pressure zone at the center. With the formation of the low-pressure zone, the gas in the space undergoes remixing, triggering a secondary combustion explosion. Subsequently, the shock wave continues to propagate outward. As the walls continuously amplify the turbulence effect, the shock wave reaches the vicinity of the cabin walls, where it cannot dissipate and instead reflects back into the cabin, causing the pressure within the entire cabin to rise further. The pressure–time curves for each monitoring point converge approximately 0.115 s after the explosion. Following the stabilization of the two explosion simulations, the cabin pressure stabilized at 2.8 barg under the 30 s leakage explosion condition and at 6.5 barg under the 50 s leakage explosion condition.
The shock wave generated by the explosion significantly impacts the surrounding environment and the cabin crew. The effects of explosion overpressure on structures are detailed in Table 5. Table 6 shows the effect of lack of oxygen concentration on the human body. The data in Table 5 is sourced from Guidelines for Quantitative Risk Assessment of Chemical Enterprises, published by the State Administration of Work Safety. By comparing the data in the tables, it is evident that in a confined space, the maximum overpressure from the vapor cloud explosion in the cabin at 30 s and 50 s post leakage will have severe consequences for the cabin structure, internal equipment, and personnel.

4. Discussion

4.1. The Influence of Obstacles in the Cabin on the Direction of Gas Injection

This study selected different leakage points and leakage directions to study the impact of obstacles on leakage diffusion. As shown in Figure 15 below, the leakage points are (13, 1.1, 1.1), (6, 14.5, 1.1), and their leakage directions are +Y and −Y, respectively. It can be observed from the figure that when the ejected gas encounters an obstacle perpendicular to the ejection direction, it will immediately change direction and diffuse along the obstacle wall. As shown in Figure 15, when the jet gas encounters an obstacle, its main ejection direction changes to +Z; that is, it sprays and diffuses toward the upper space of the cabin. It can be concluded that the direction of gas leakage can be controlled by designing the placement of equipment inside the cabin to reduce the hazard.

4.2. Effects of Different Ignition Source Positions on Shock Waves

The ignition source is positioned at the center of the vapor cloud (10.1, 9, 1.7) and at the edge of the vapor cloud (2.4, 2.4, 1.7) to conduct two explosion simulations. The pressure distribution of the XY cross-section at a height of 1.8 m for the two explosion simulations is illustrated in Figure 16. When the center of the gas cloud ignites, the explosion shock wave propagates radially outward from the ignition source. Upon encountering obstacles such as cabin equipment, the shock wave accumulates near these obstacles, forming a high-pressure zone. Propagation in this direction is constrained, while the shock wave in other directions continues to push the gas cloud outward, increasing turbulence intensity. When the ignition position is at the edge of the gas cloud, the flame propagates into the unburned region due to the confined state of the gas cloud. Following a period of stable combustion, turbulence within the gas cloud intensifies, leading to an increase in flame propagation speed. Consequently, the unburned region is rapidly and completely ignited. The overpressure value also rises sharply; however, the shock wave energy begins to dissipate during propagation. Reference [30] introduces a uniform gas cloud for explosion simulation, and the pressure field obtained in the open space is a relatively regular shape. In this study, the gas cloud obtained by leakage simulation is used for explosion simulation. It can be observed from Figure 16 that the pressure field of the explosion in the non-uniform gas cloud is relatively irregular, and the pressure field on the obstacle side has an obvious accumulation shape.
The temperature distribution of the XY cross-section at a height of 1.8 m for the two explosion simulations is illustrated in Figure 17. When ignition occurs at the center or edge of the gas cloud, the temperature at the ignition source rises sharply due to intense chemical reactions and heat release. As the flame propagates into the unburned gas cloud, the temperature in that region gradually increases. Over time, the combustible gas cloud at the combustion center is depleted, and combustion and explosion can no longer be sustained. In these regions, the rate of heat dissipation exceeds the rate of heat generation, causing the temperature to gradually decrease. This results in a blue area within the red zone in the figure. Due to the presence of obstacles such as cabin equipment, heat accumulation is difficult to dissipate, leading to multiple high-temperature (red) zones between the equipment in Figure 17. Figure 18 shows the temperature detection data of six monitoring points under the conditions of center ignition and edge ignition. By observing Figure 18, it can be concluded that the peak temperatures in both cases are similar, both significantly exceeding the melting point of the pipeline steel, posing a great risk of damage to the pipeline. The location of the combustion source within the combustible vapor cloud mainly affects the temperature distribution, but has the least impact on the temperature amplitude.
Considering that the temperature inside the cabin will be extremely high after the explosion, this study compared the gas cloud that leaked for 6 s and the gas cloud that leaked for 8 s to study the temperature-change trend of the gas cloud after the explosion. As shown in Figure 19 below, the temperature-change curve after the explosion shows that at the beginning of the explosion, the temperature near the explosion source rises sharply. In about 4 s, the temperature near the corner of the cabin will begin to rise. Two seconds after the explosion, the temperature in various parts of the cabin has dropped by varying degrees but is still higher than 500 K, which is a temperature range that is harmful to the human body.
Compared with the temperature trend chart of the gas cloud explosion after 60 s of leakage in Figure 17, the longer the leakage time, the faster the temperature rises in the cabin. The farther away from the explosion source, the slower the temperature rise rate. In the case of a short-term leakage explosion, people near the corner of the cabin have about 5 s to escape. Based on this, the following cabin explosion safety recommendations can be summarized:
  • Arrange detection equipment next to equipment and pipelines that are prone to leakage, and take corresponding measures quickly once a leak is detected.
  • Add fire extinguishing equipment, alarm equipment and warning signs near equipment that is prone to explosion, and have personnel quickly leave the cabin once an explosion occurs.

4.3. The Impact of Various Factors on Human Injury After the Explosion

After the explosion in the cabin, combustion will occur. The combustion products of methane are mainly carbon dioxide, water, carbon monoxide, and a small amount of nitrogen oxides and other by-products. The Occupational Safety and Health Administration (OSHA) of the United States has stipulated in the shipyard employment module that 19.5% is the warning value of insufficient oxygen, and 19.5% to 15% is the hypoxia risk area. The Health and Safety Executive (HSE) of the United Kingdom has pointed out that an oxygen concentration below 8% can cause death. The Occupational Safety and Health Administration (OSHA) of the United States stipulates that the carbon dioxide content of 0.5% is the allowable exposure limit for 8 h working days. The National Institute of Occupational Safety and Health (NIOSH) of the United States warns that carbon dioxide content higher than 3% can lead to coma or death. Table 7 shows the effect of lack of oxygen concentration on the human body; Table 8 shows the effect of carbon dioxide on the human body; Figure 20 shows the change of oxygen concentration in the cabin after the explosion; and Figure 21 shows the change in combustion products in the cabin after the explosion. Observing Figure 20, it can be found that after the explosion, the oxygen concentration in the cabin quickly dropped to a dangerous level, while the concentration of combustion products increased. A lethal environment will be formed in the cabin within a short period of time after the explosion. The sudden drop in oxygen concentration will cause the cabin personnel to quickly lose their ability to move. The synergistic effect of carbon dioxide and carbon monoxide will cause the cabin personnel to be poisoned, which will deprive the cabin personnel of the best chance to escape.
By observing Figure 20 and Figure 21, it can be found that the oxygen decrease rate and the combustion product concentration increase rate at the monitoring point with less leakage gas concentration are slower than those at the monitoring point area with greater leakage gas concentration. Therefore, the harm of explosion to human body can be reduced by preventing gas accumulation and reducing the high gas concentration area. In the previous simulation, it can be found that gas accumulation mainly occurs between obstacles, so reducing the number of obstacles or redesigning their layout will help, but removing them is not feasible because ships need equipment. Here are some suggestions to reduce the harm of explosion to the human body:
  • Increase spacing between engines, piping, and other obstacles to reduce confined spaces where gas may accumulate. Use modular layouts that prioritize open gas diffusion channels and avoid “dead zones” of trapped gas. Avoid clustering critical equipment such as fuel lines and electrical systems in areas prone to gas stagnation. Install passive barriers such as perforated plates to divert gas away from high-risk areas while maintaining airflow.
  • Forced ventilation systems such as exhaust fans and ducts are deployed specifically in equipment room areas to actively dilute gas concentrations to below the explosion limit. Use CFD-guided vent placement to ensure optimal airflow through high-risk areas identified in simulation.
  • Methane detectors are installed in engine room areas to trigger alarms and automatic shutdowns before concentrations reach explosion thresholds. Use multi-point sensing networks to cover blind spots caused by equipment obstructions.

5. Conclusions

Based on reference [30], this study innovatively conducted a joint numerical simulation of natural gas leakage and explosion in the engine room of an LNG-powered ship, aiming to analyze the explosion hazards and propose risk mitigation strategies. The CFD-based risk analysis reveals critical insights into the coupled mechanisms of gas dispersion and explosion dynamics in confined ship cabins, addressing a key gap in LNG vessel safety assessment.
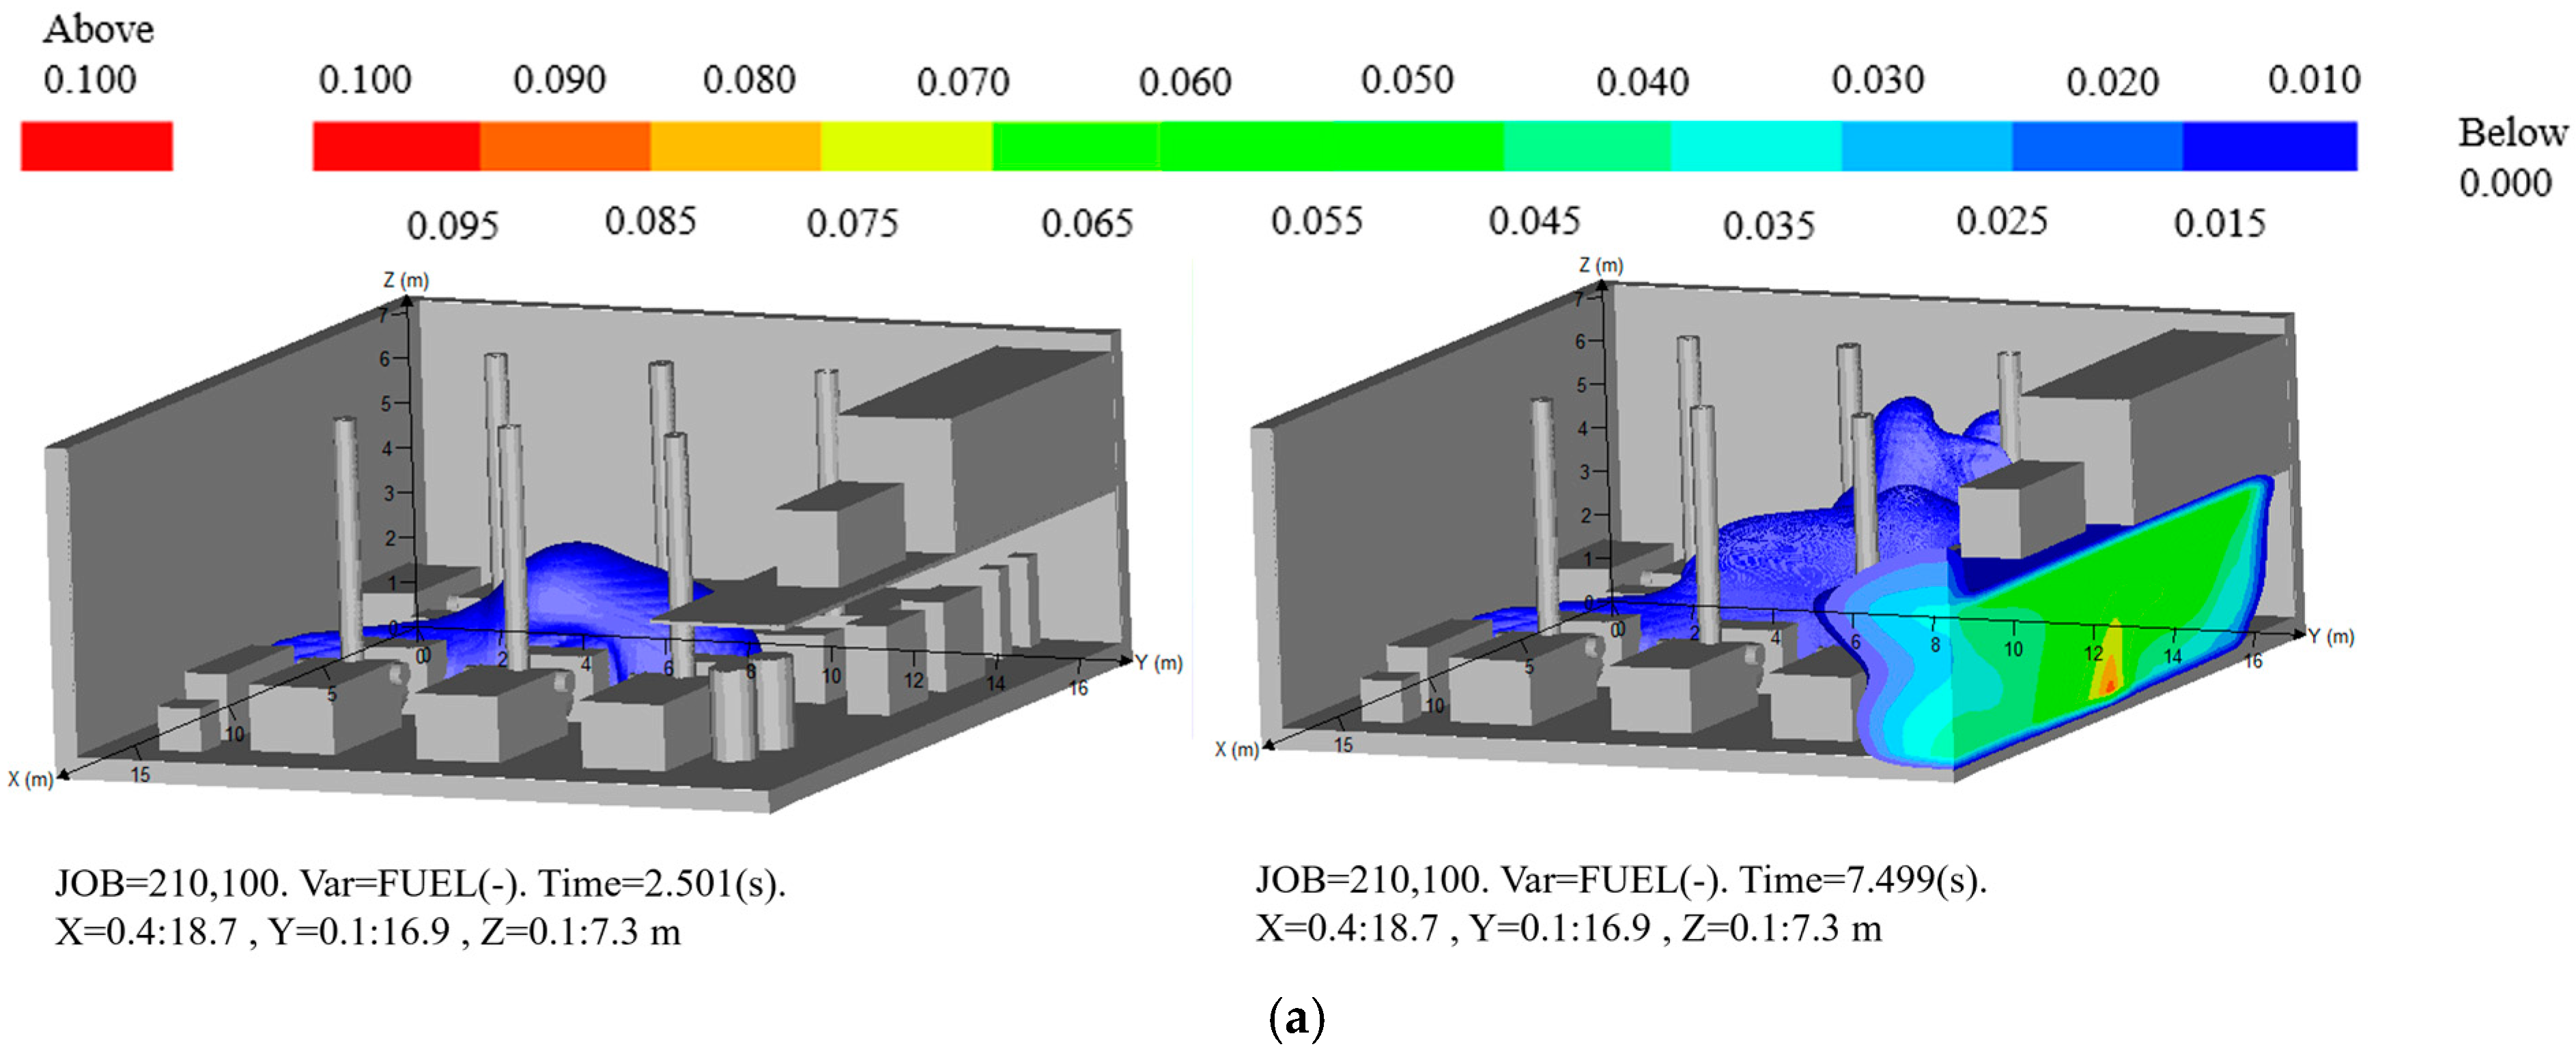
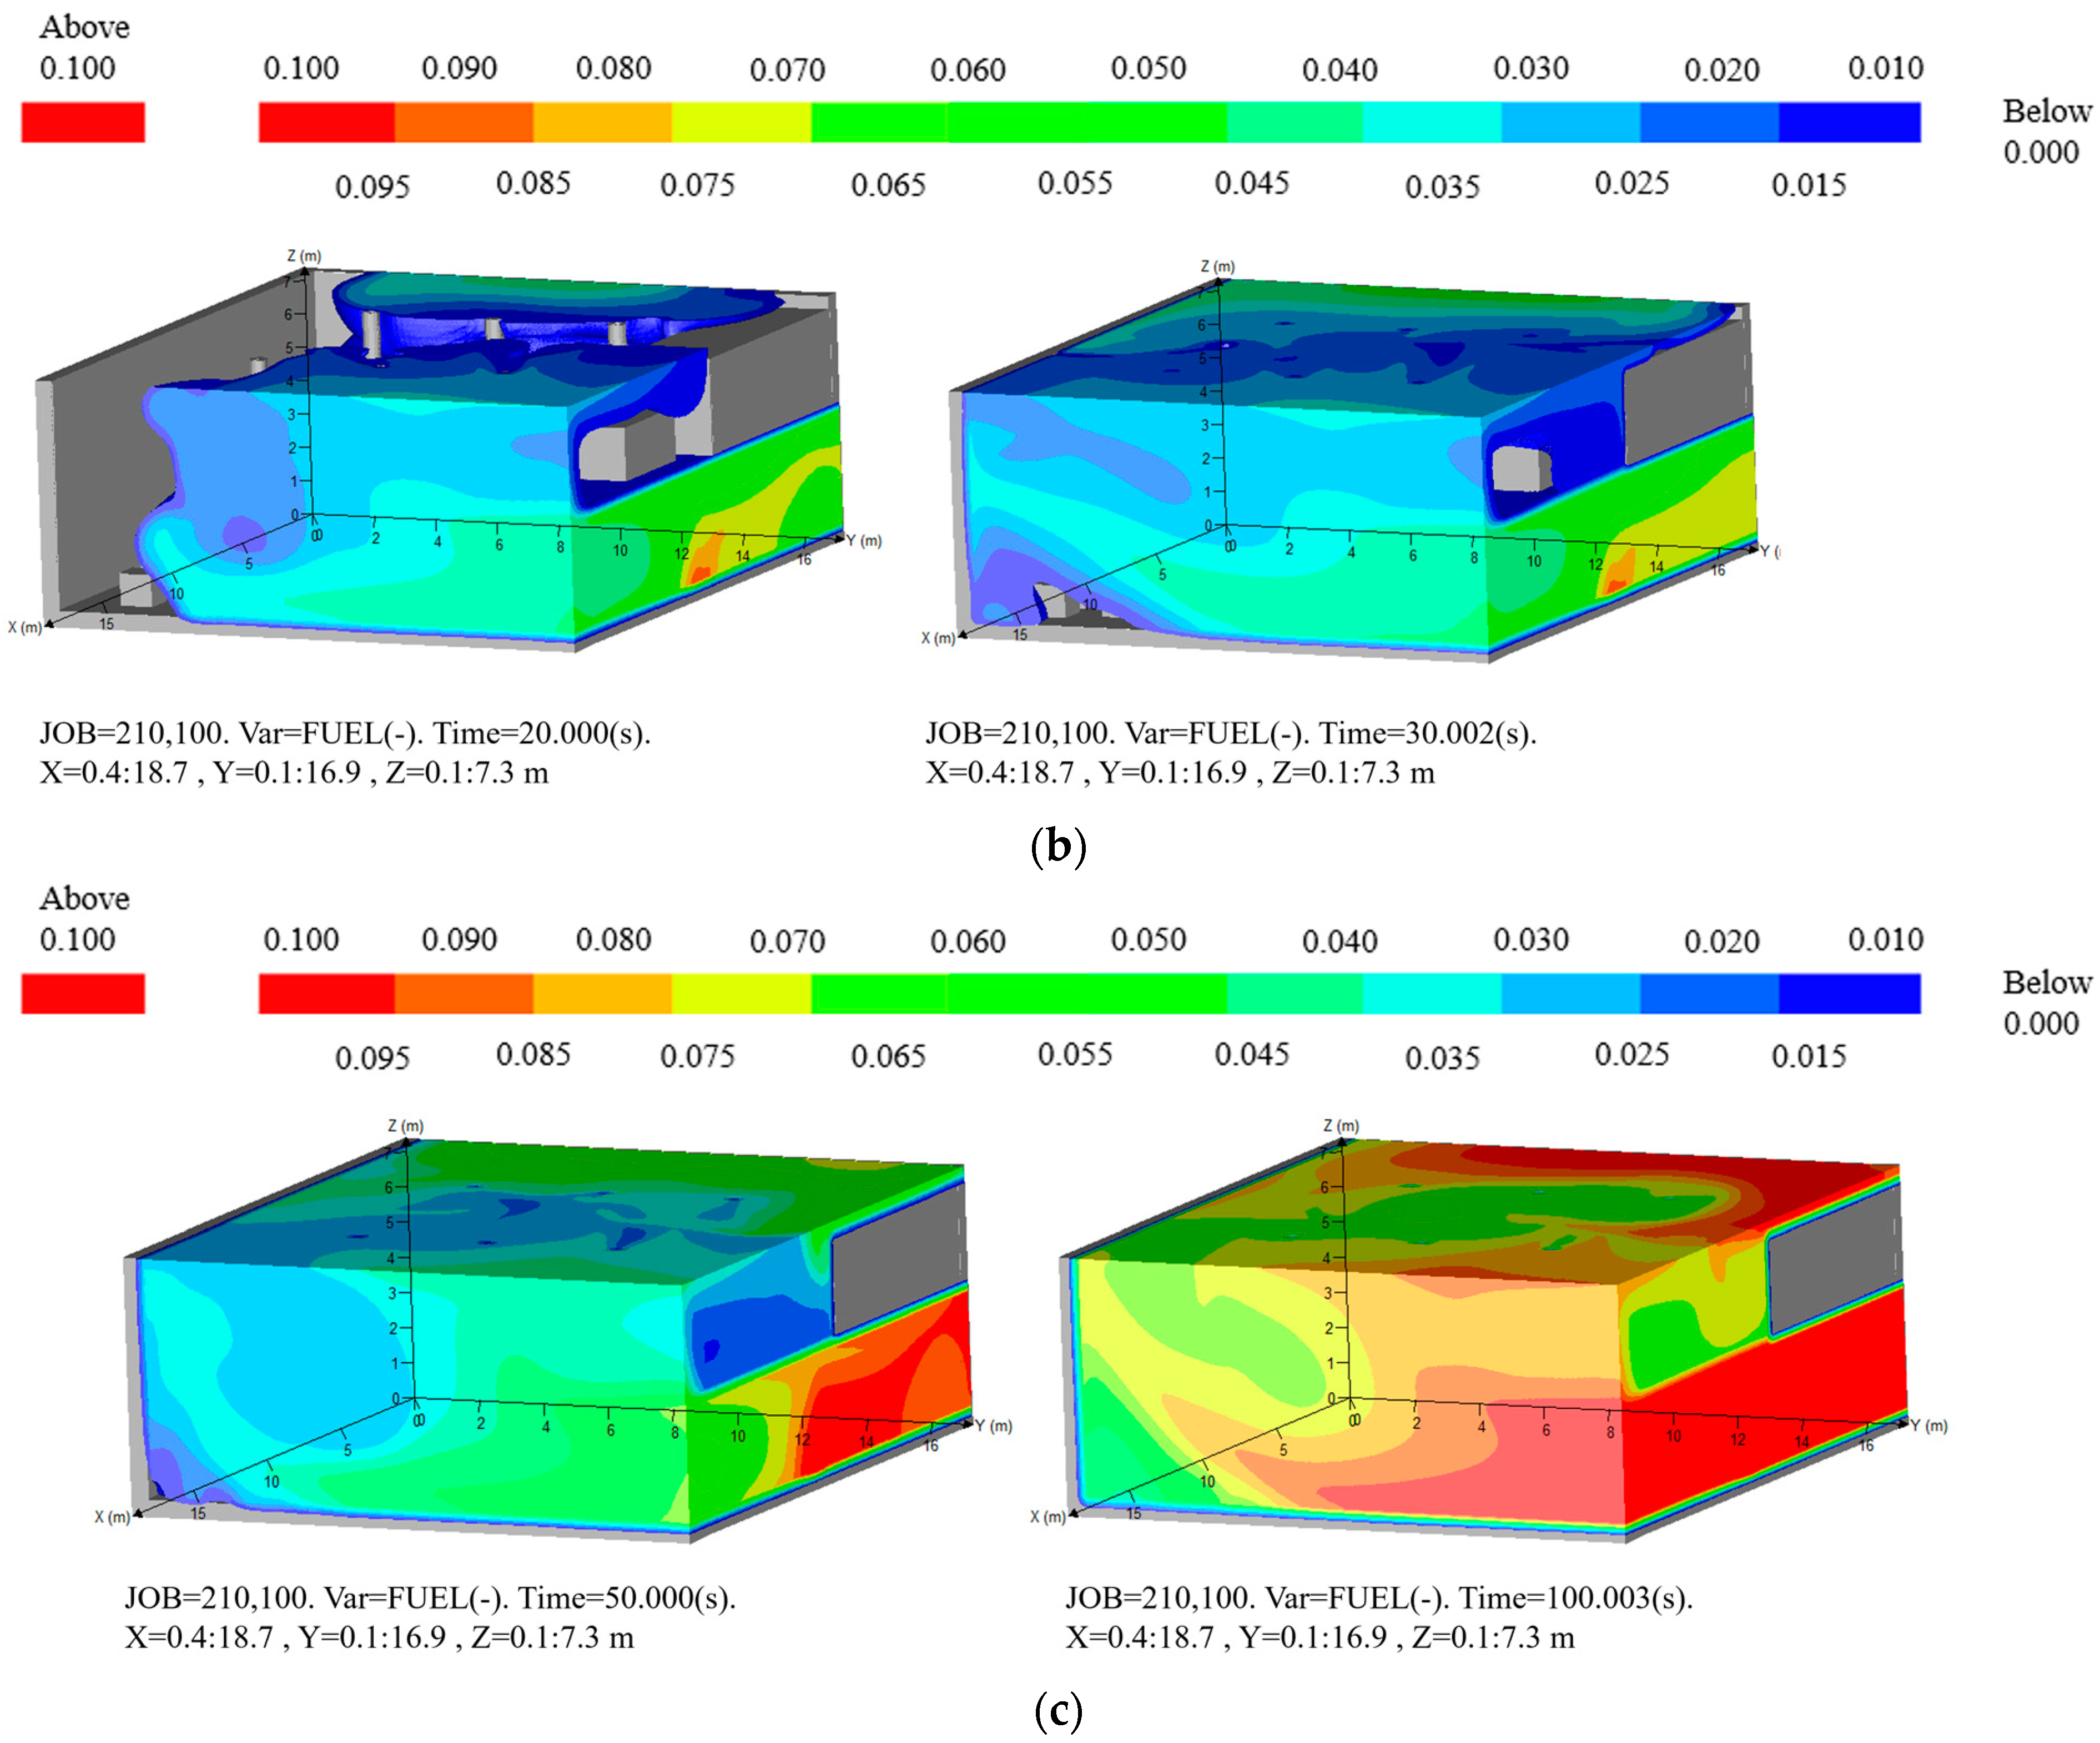
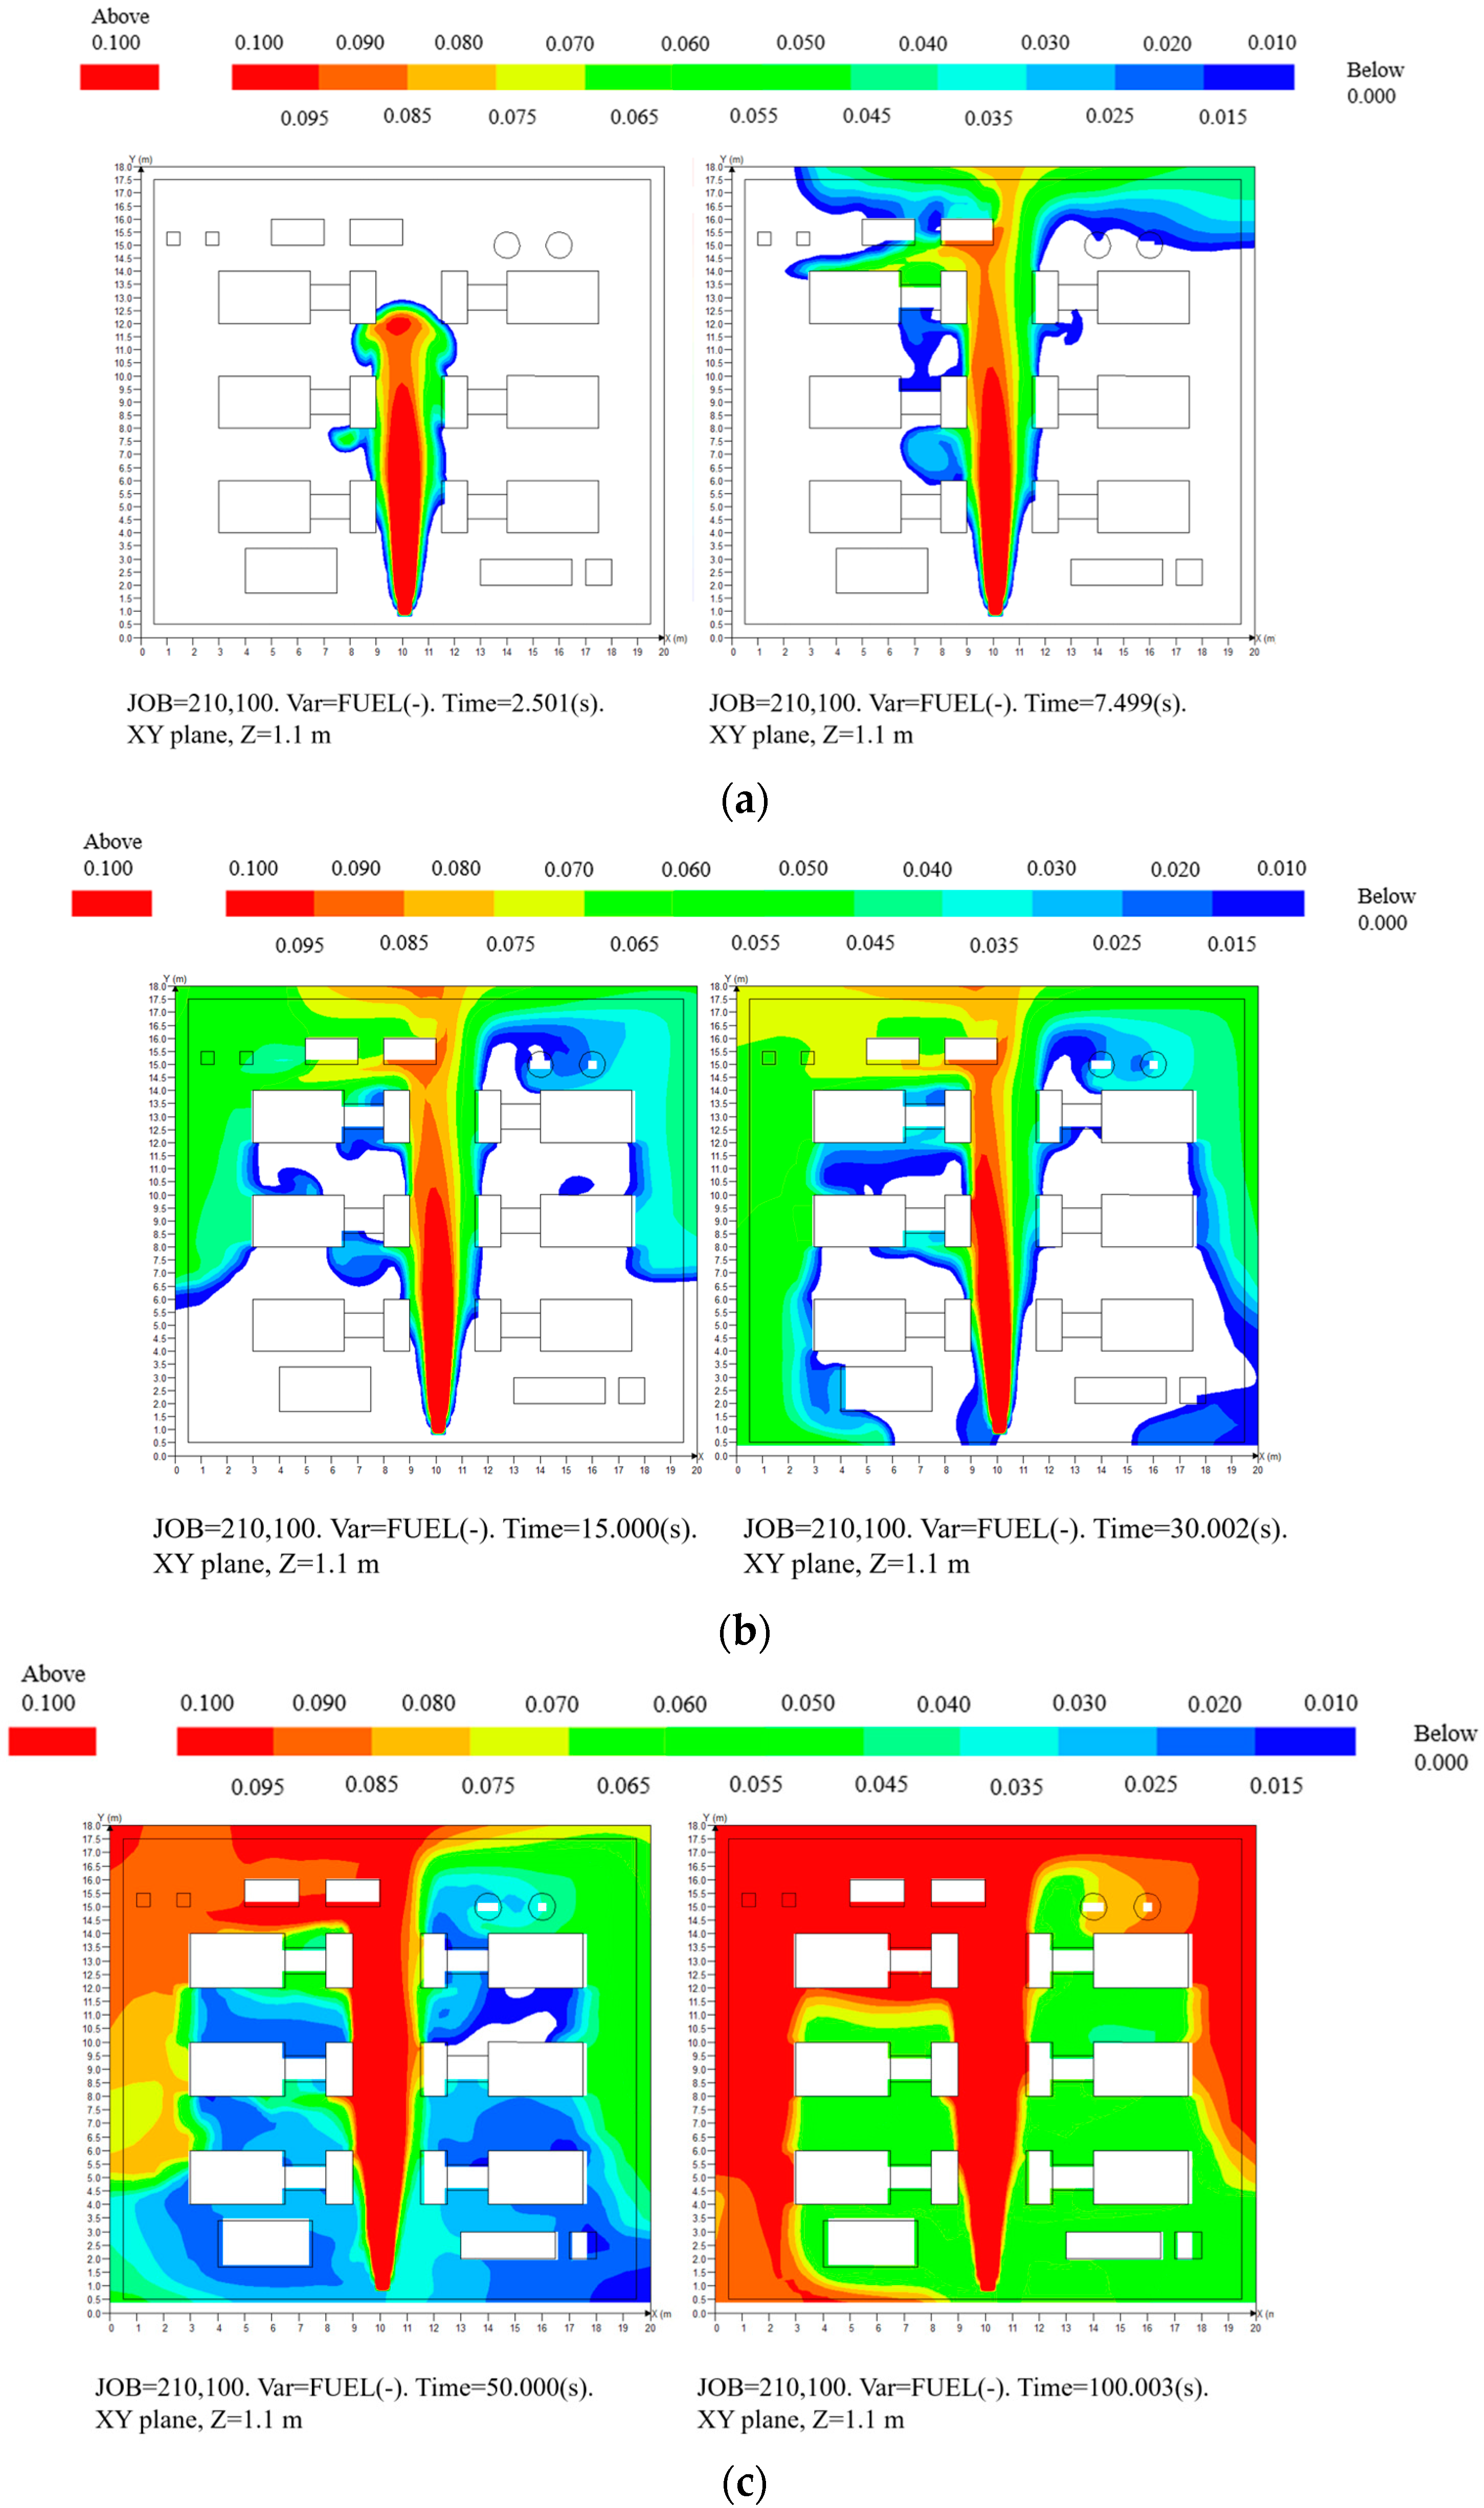
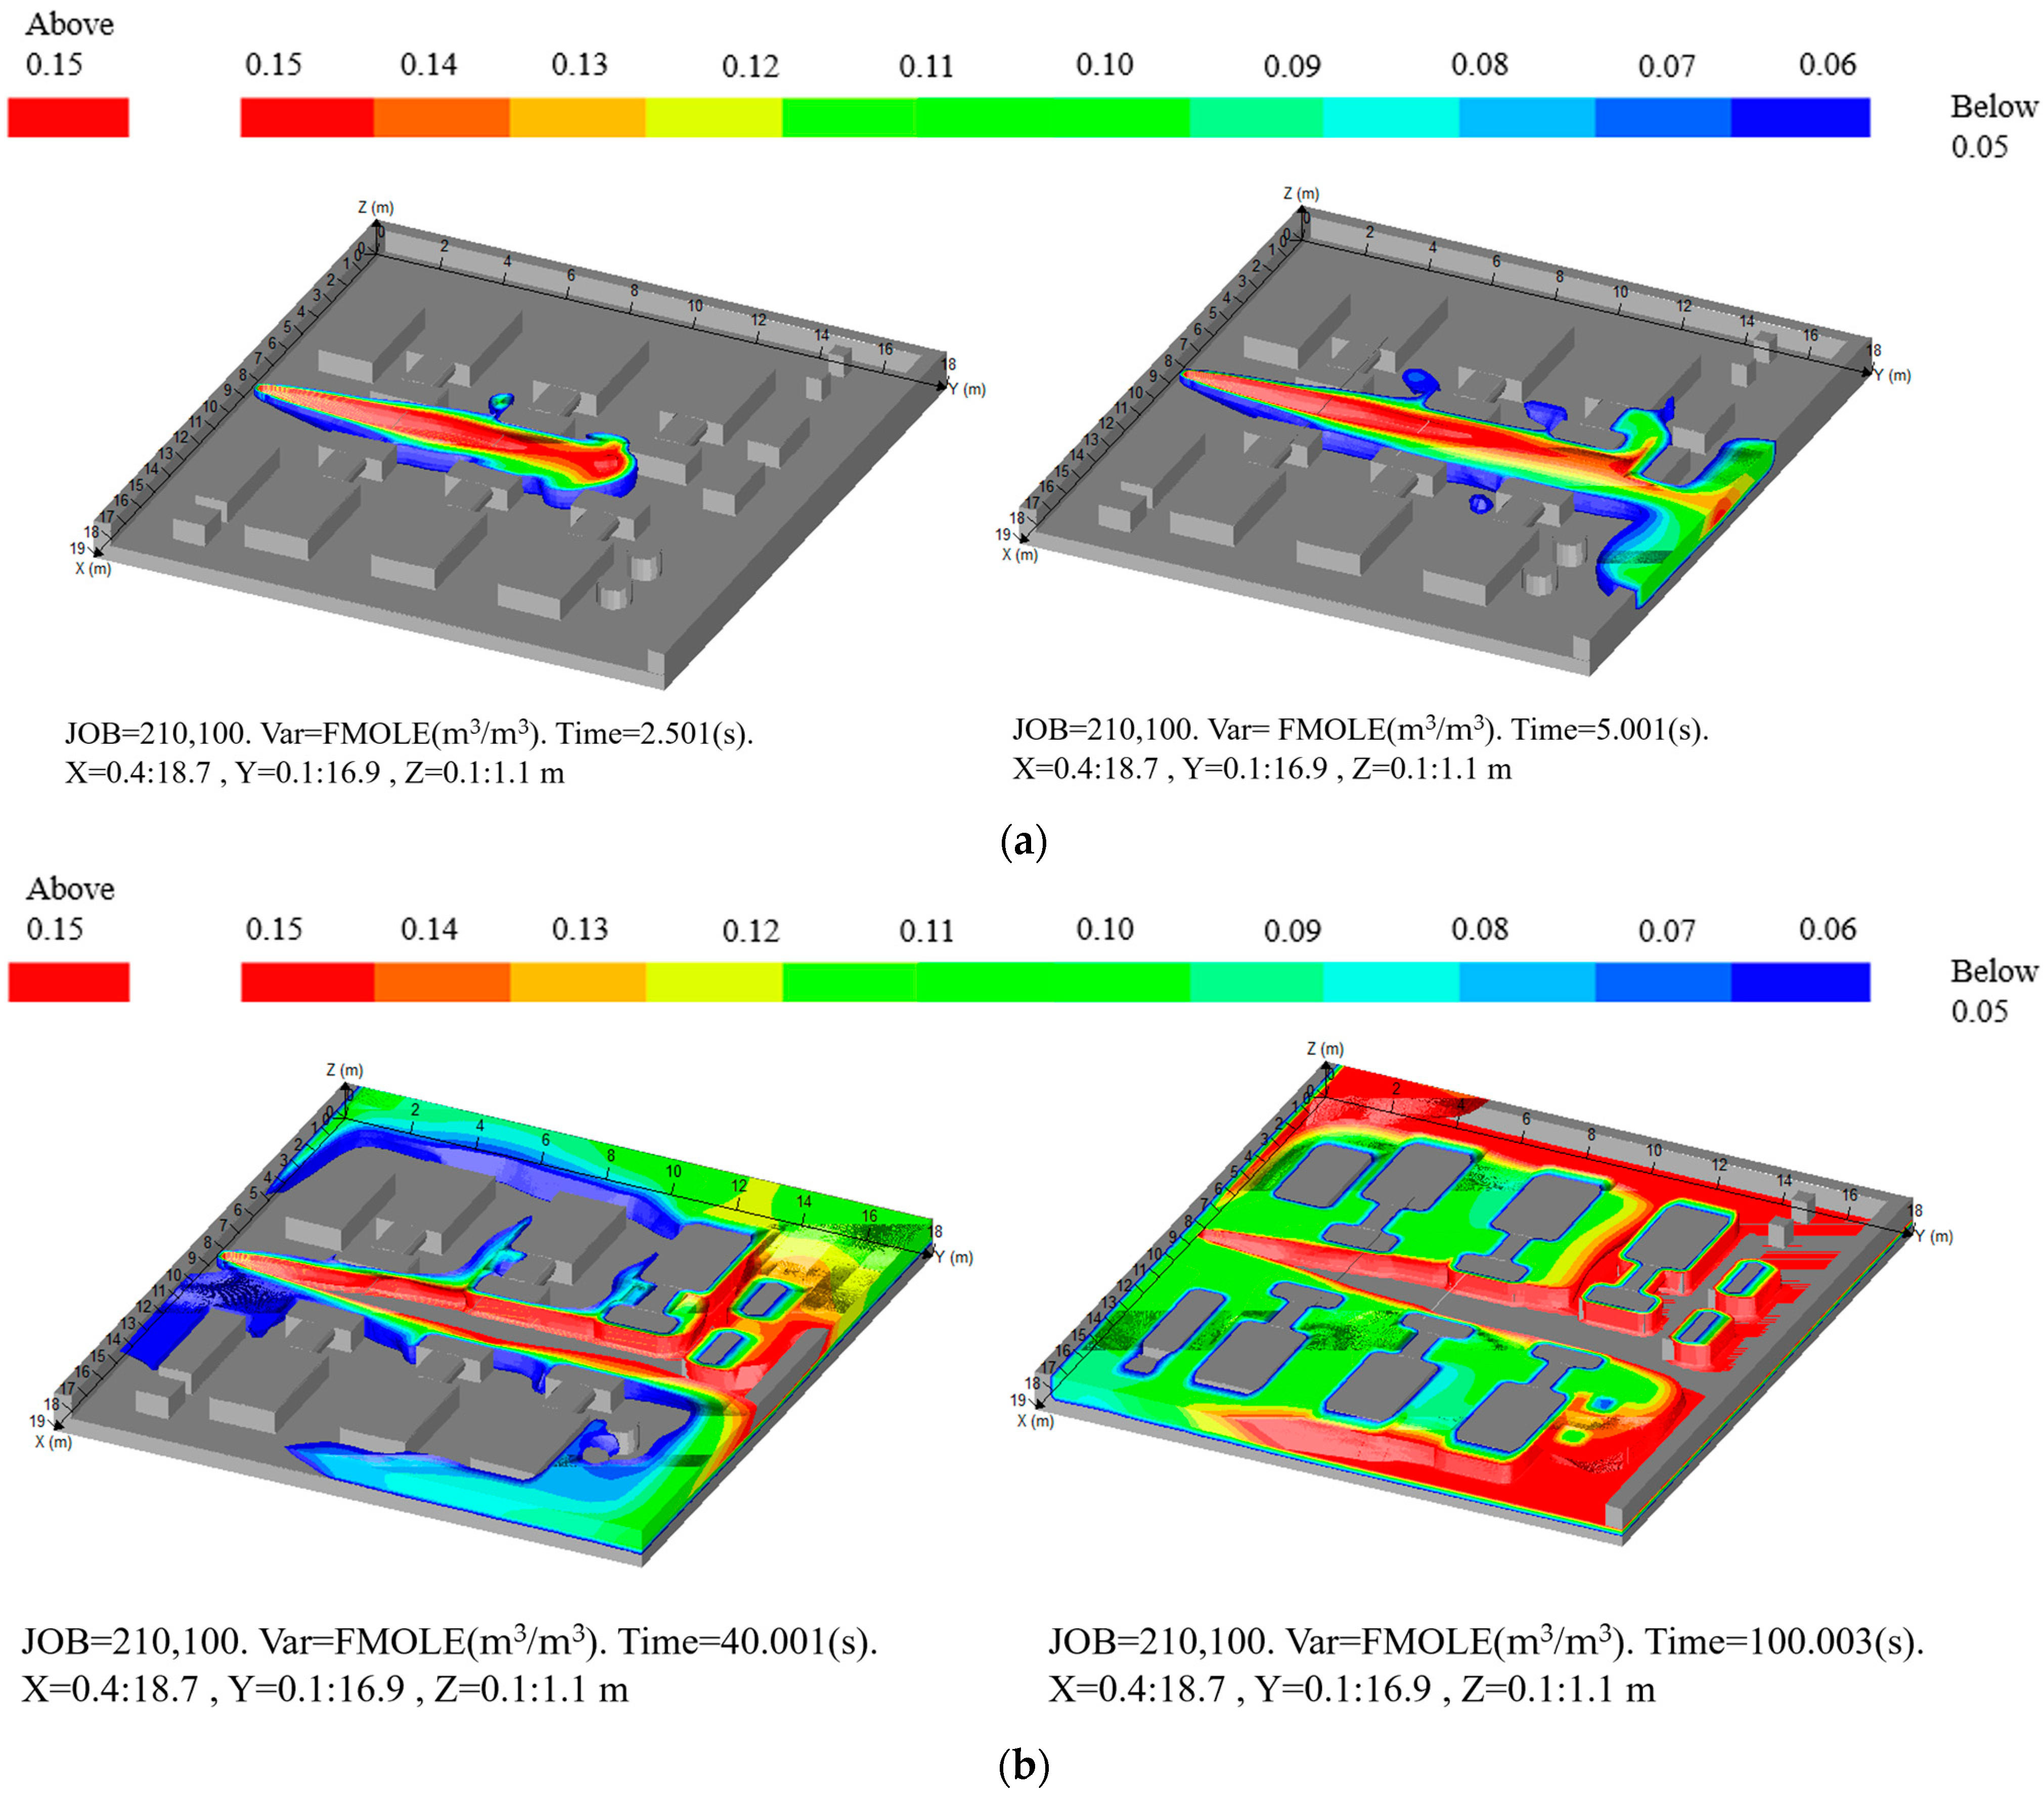
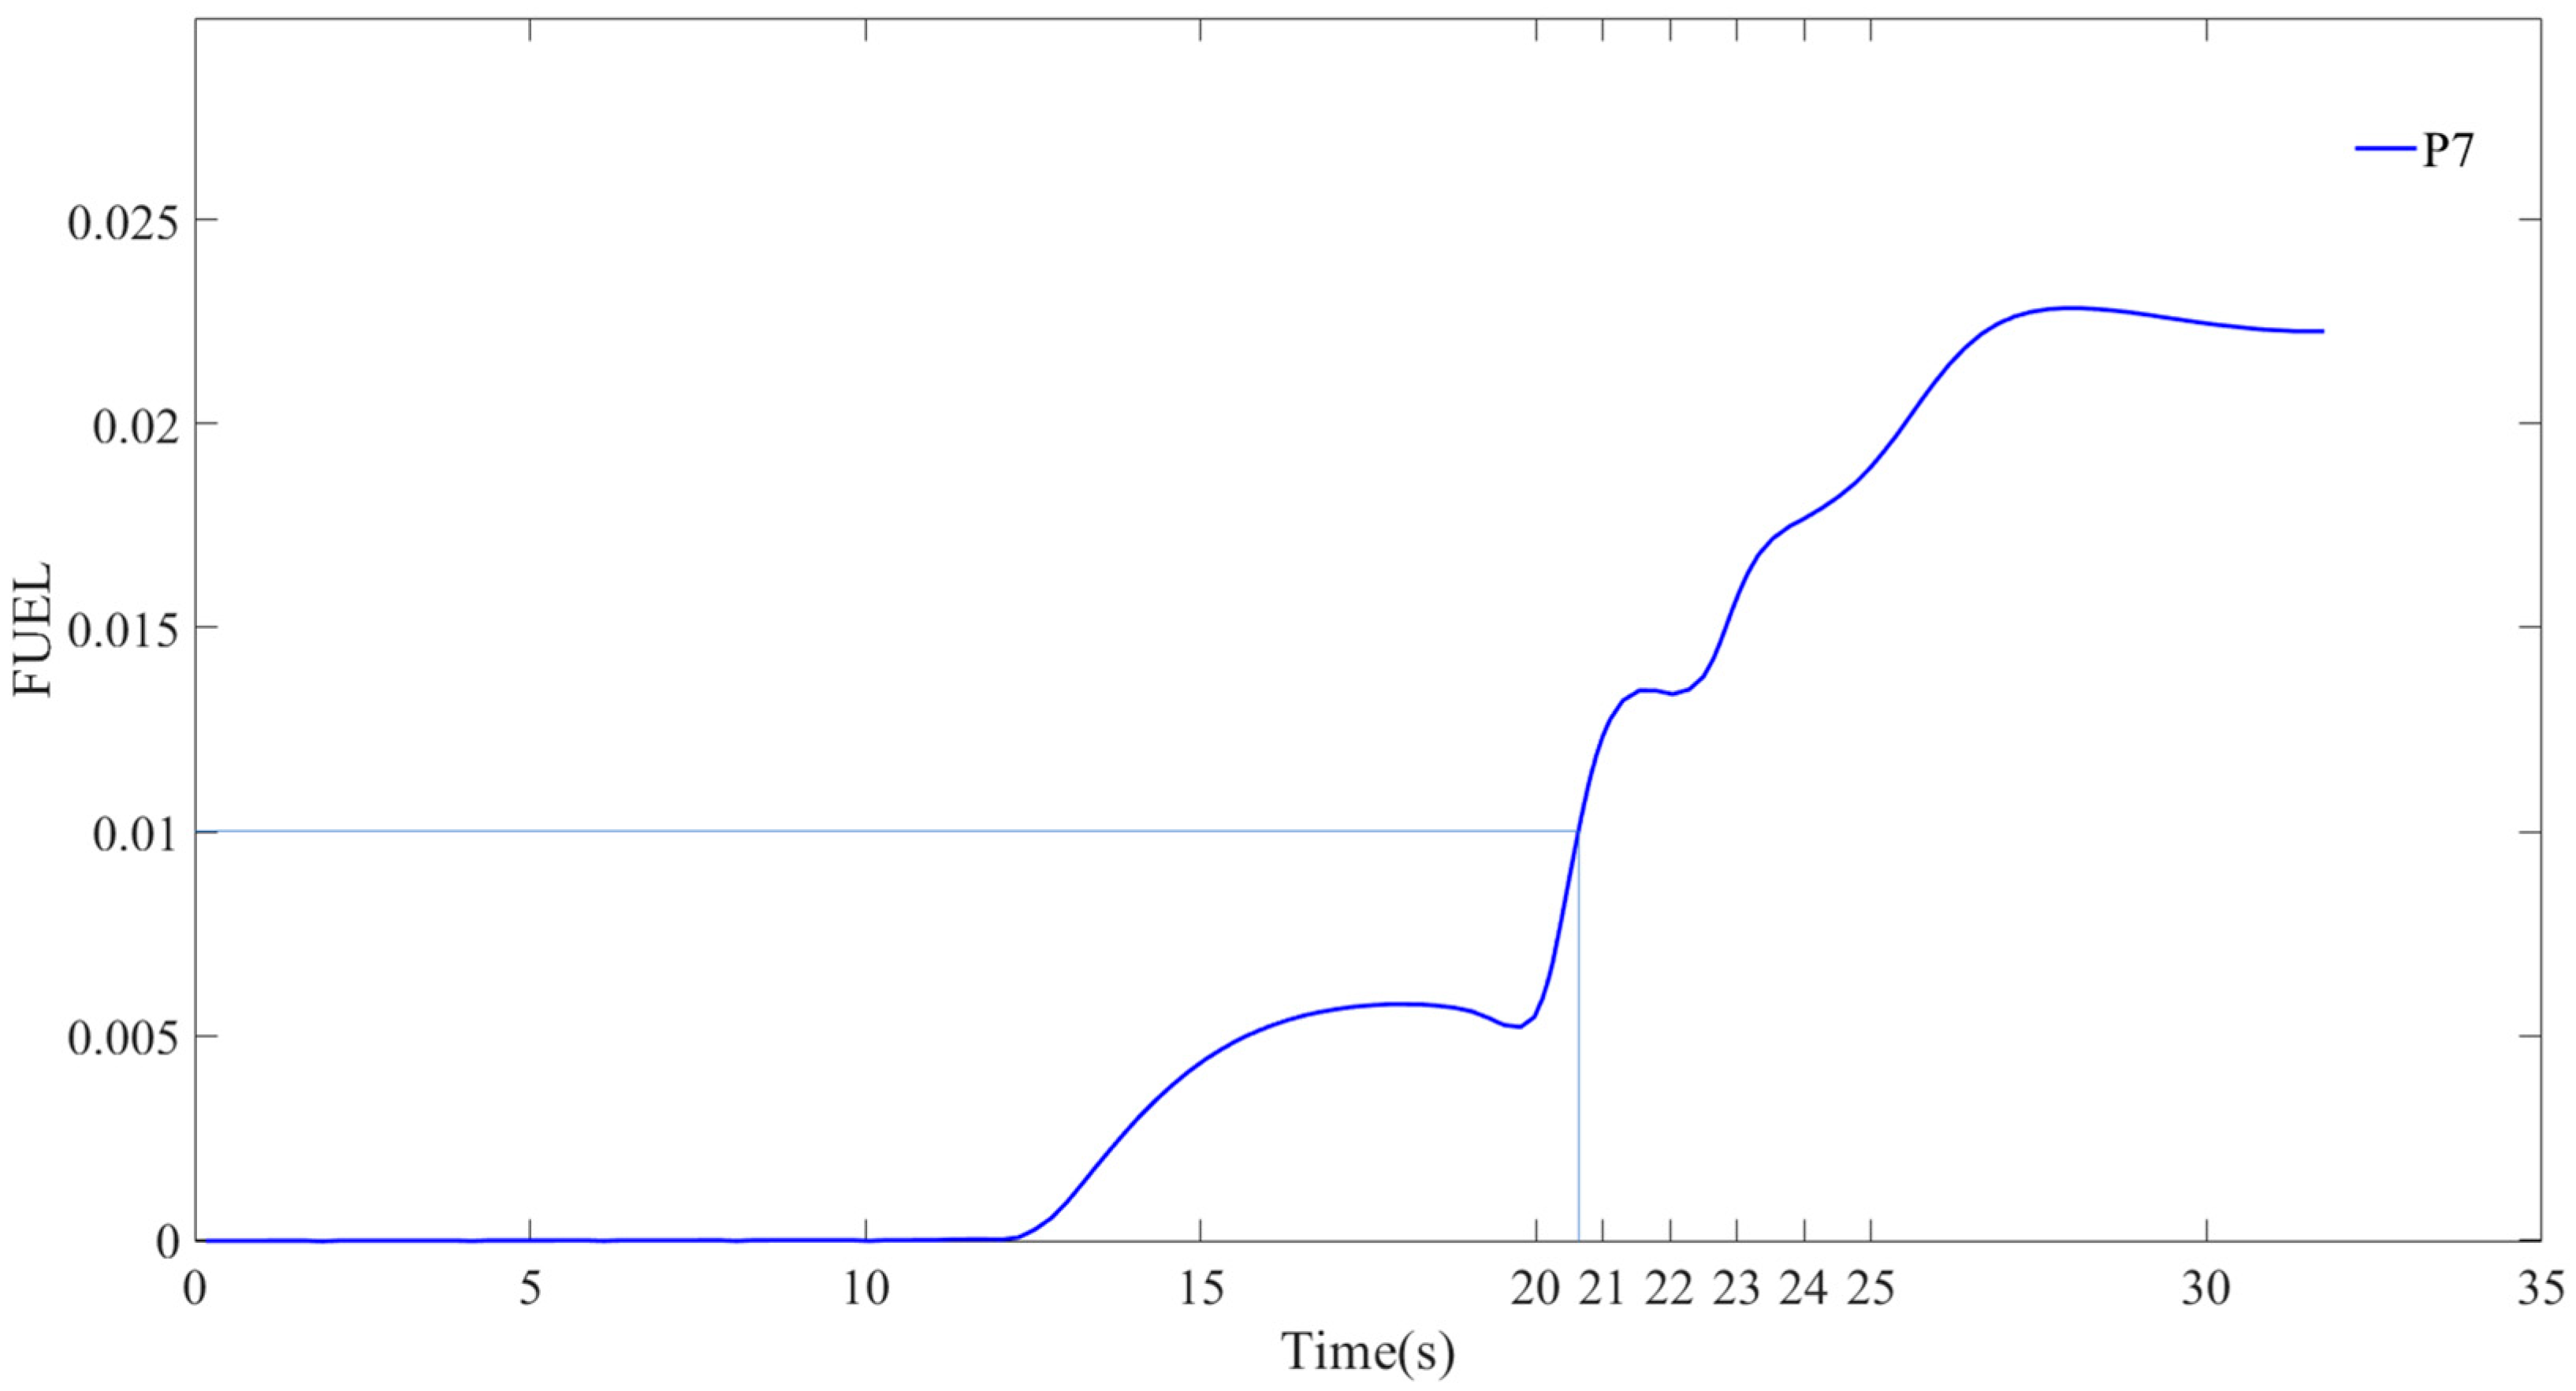
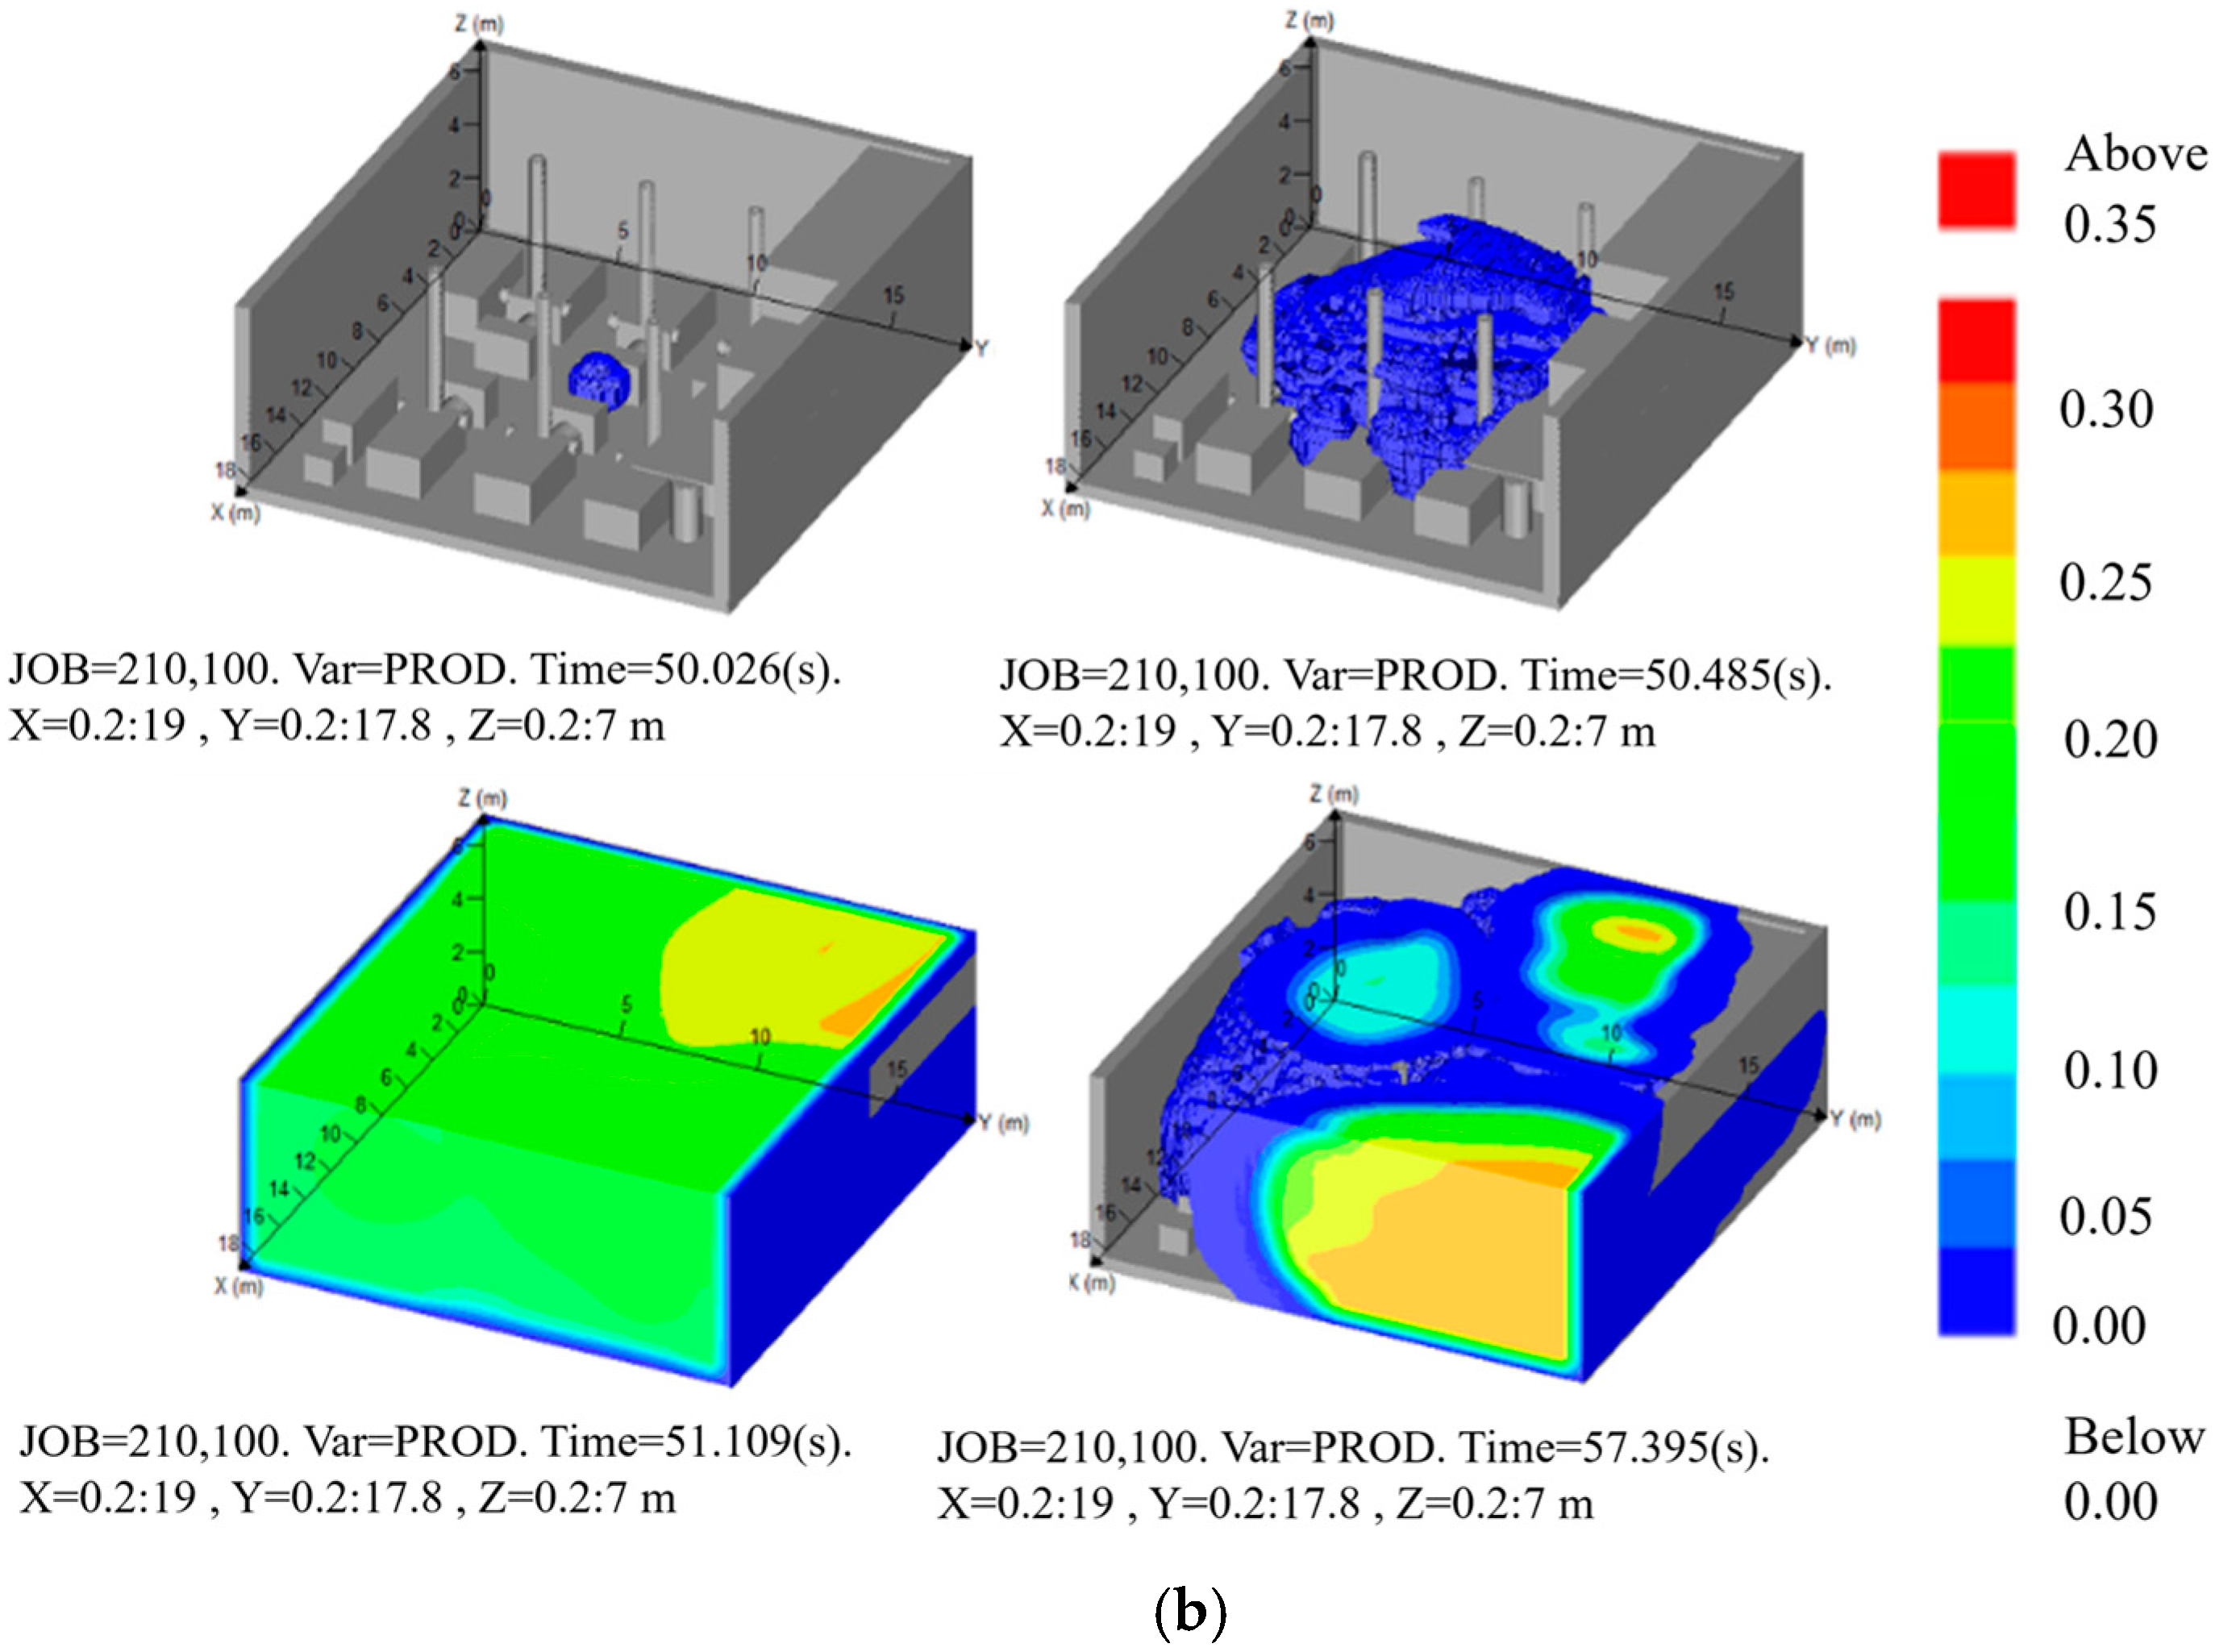
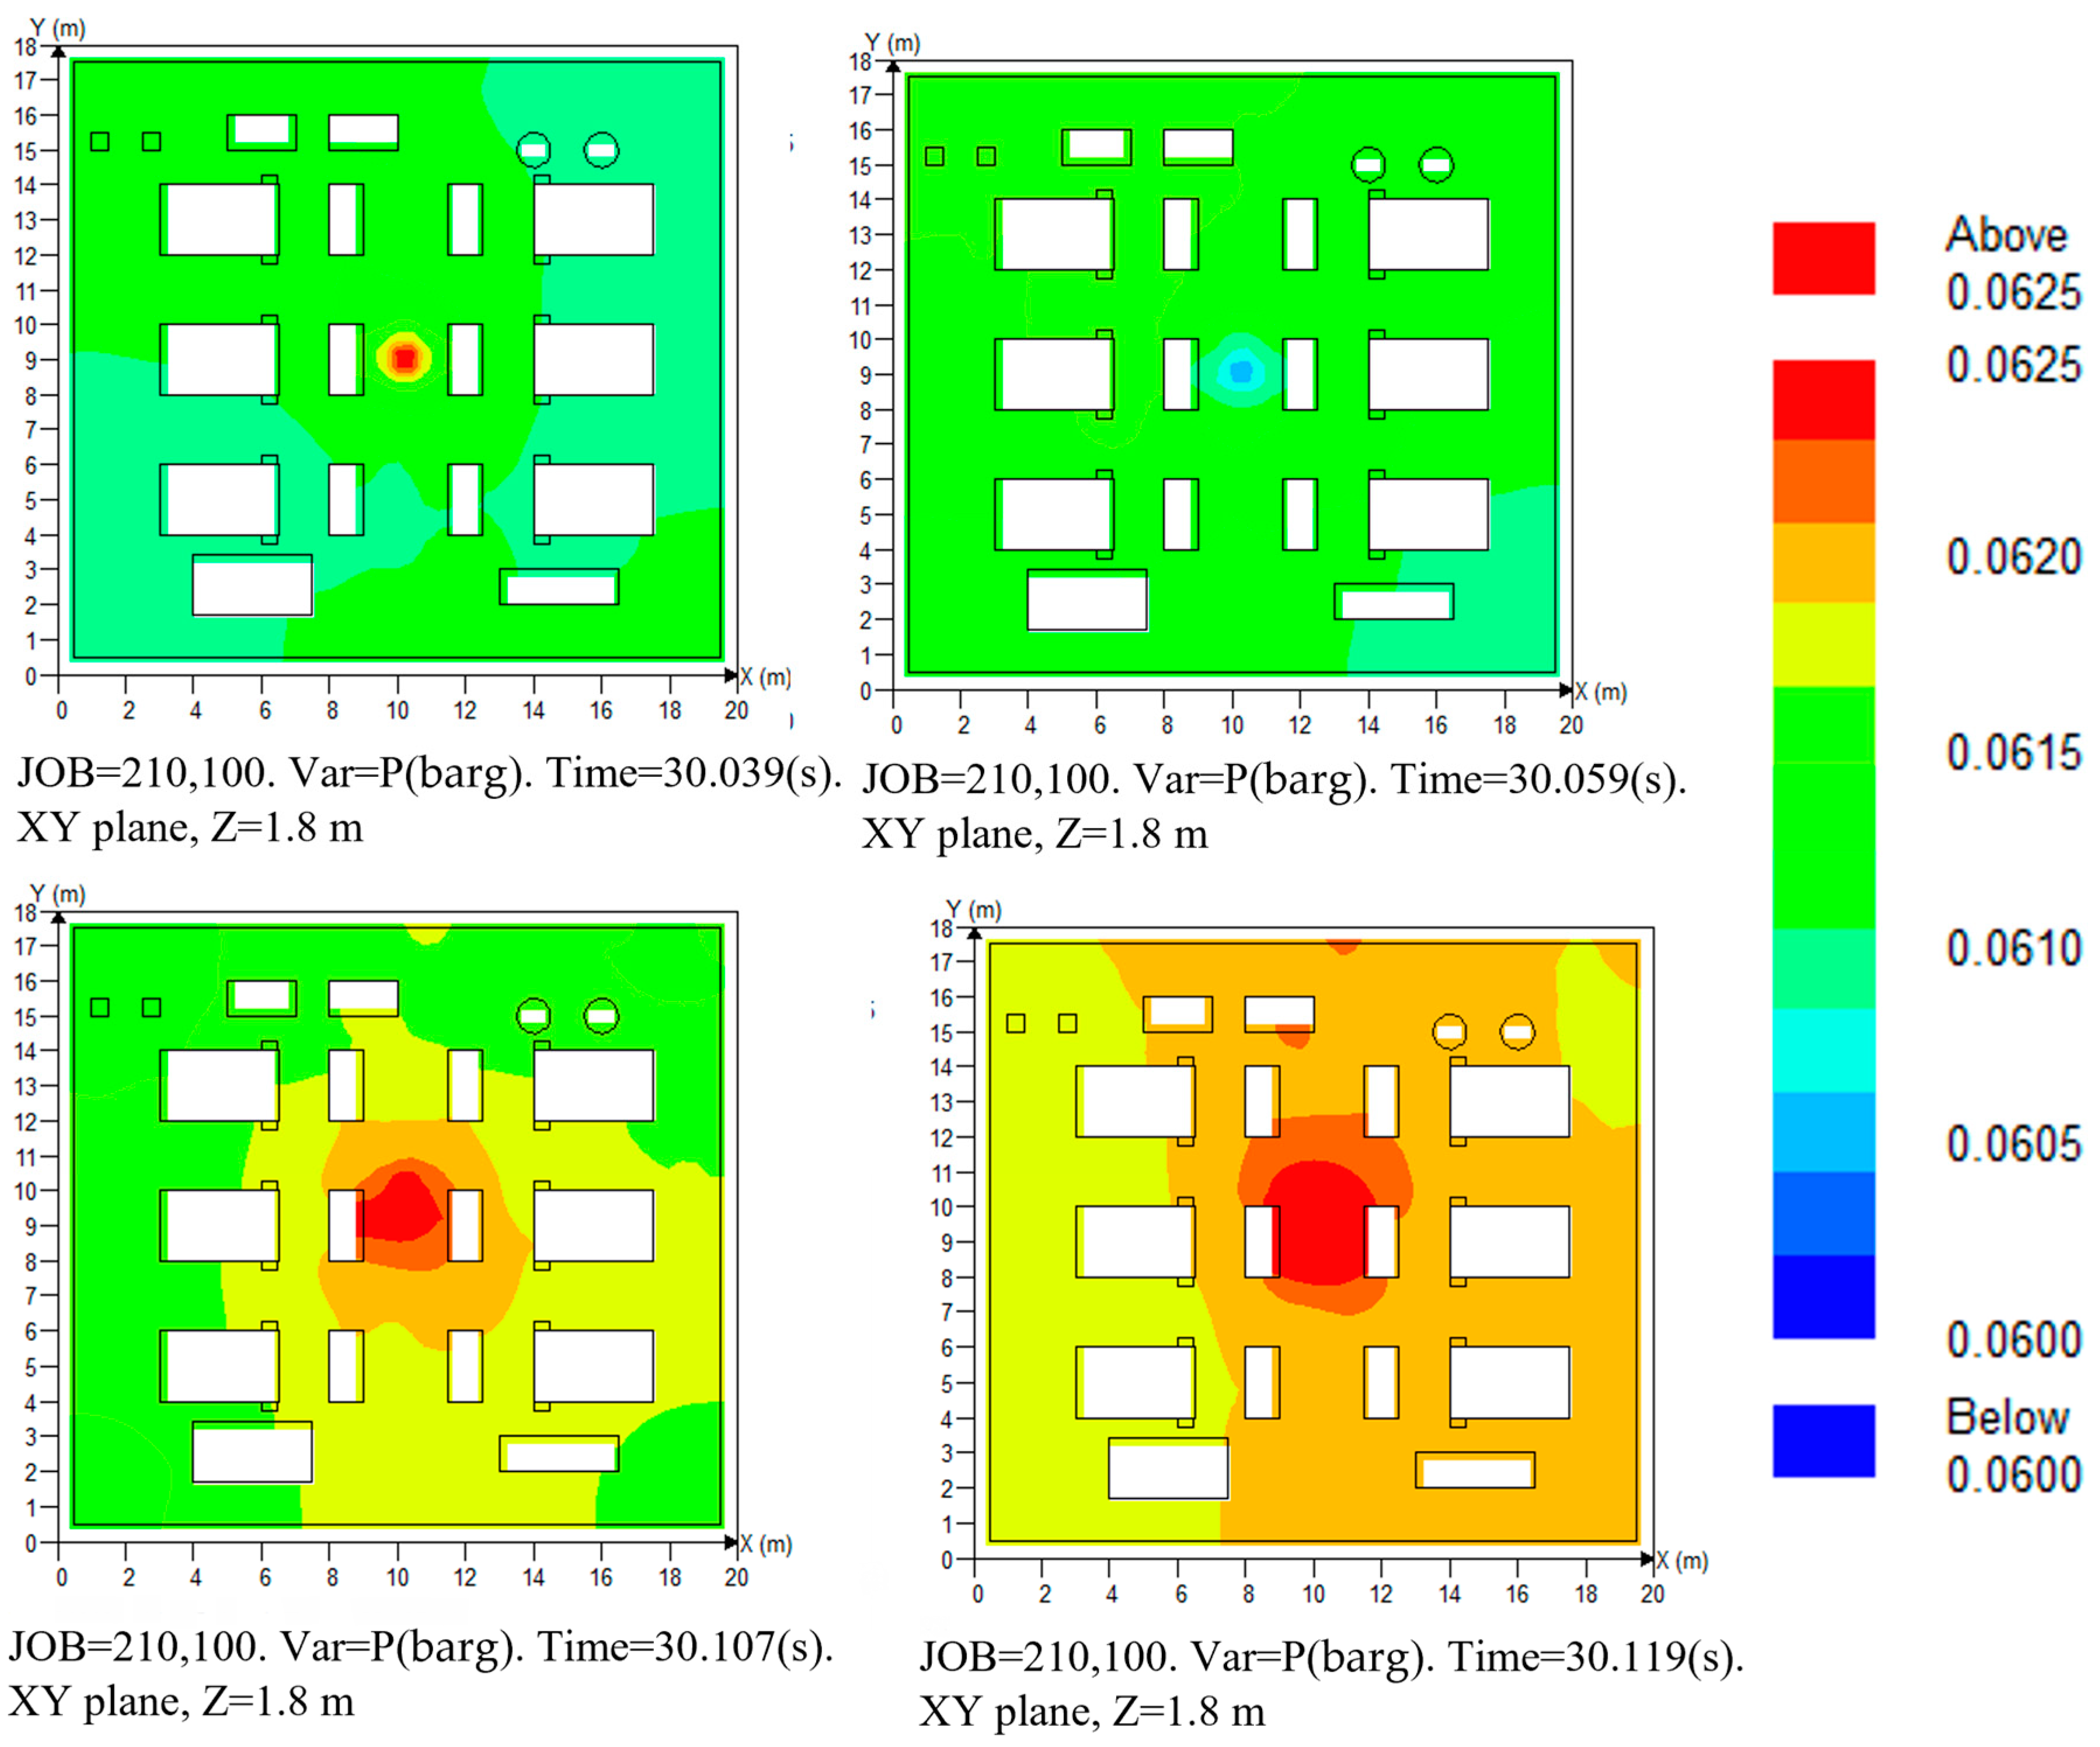
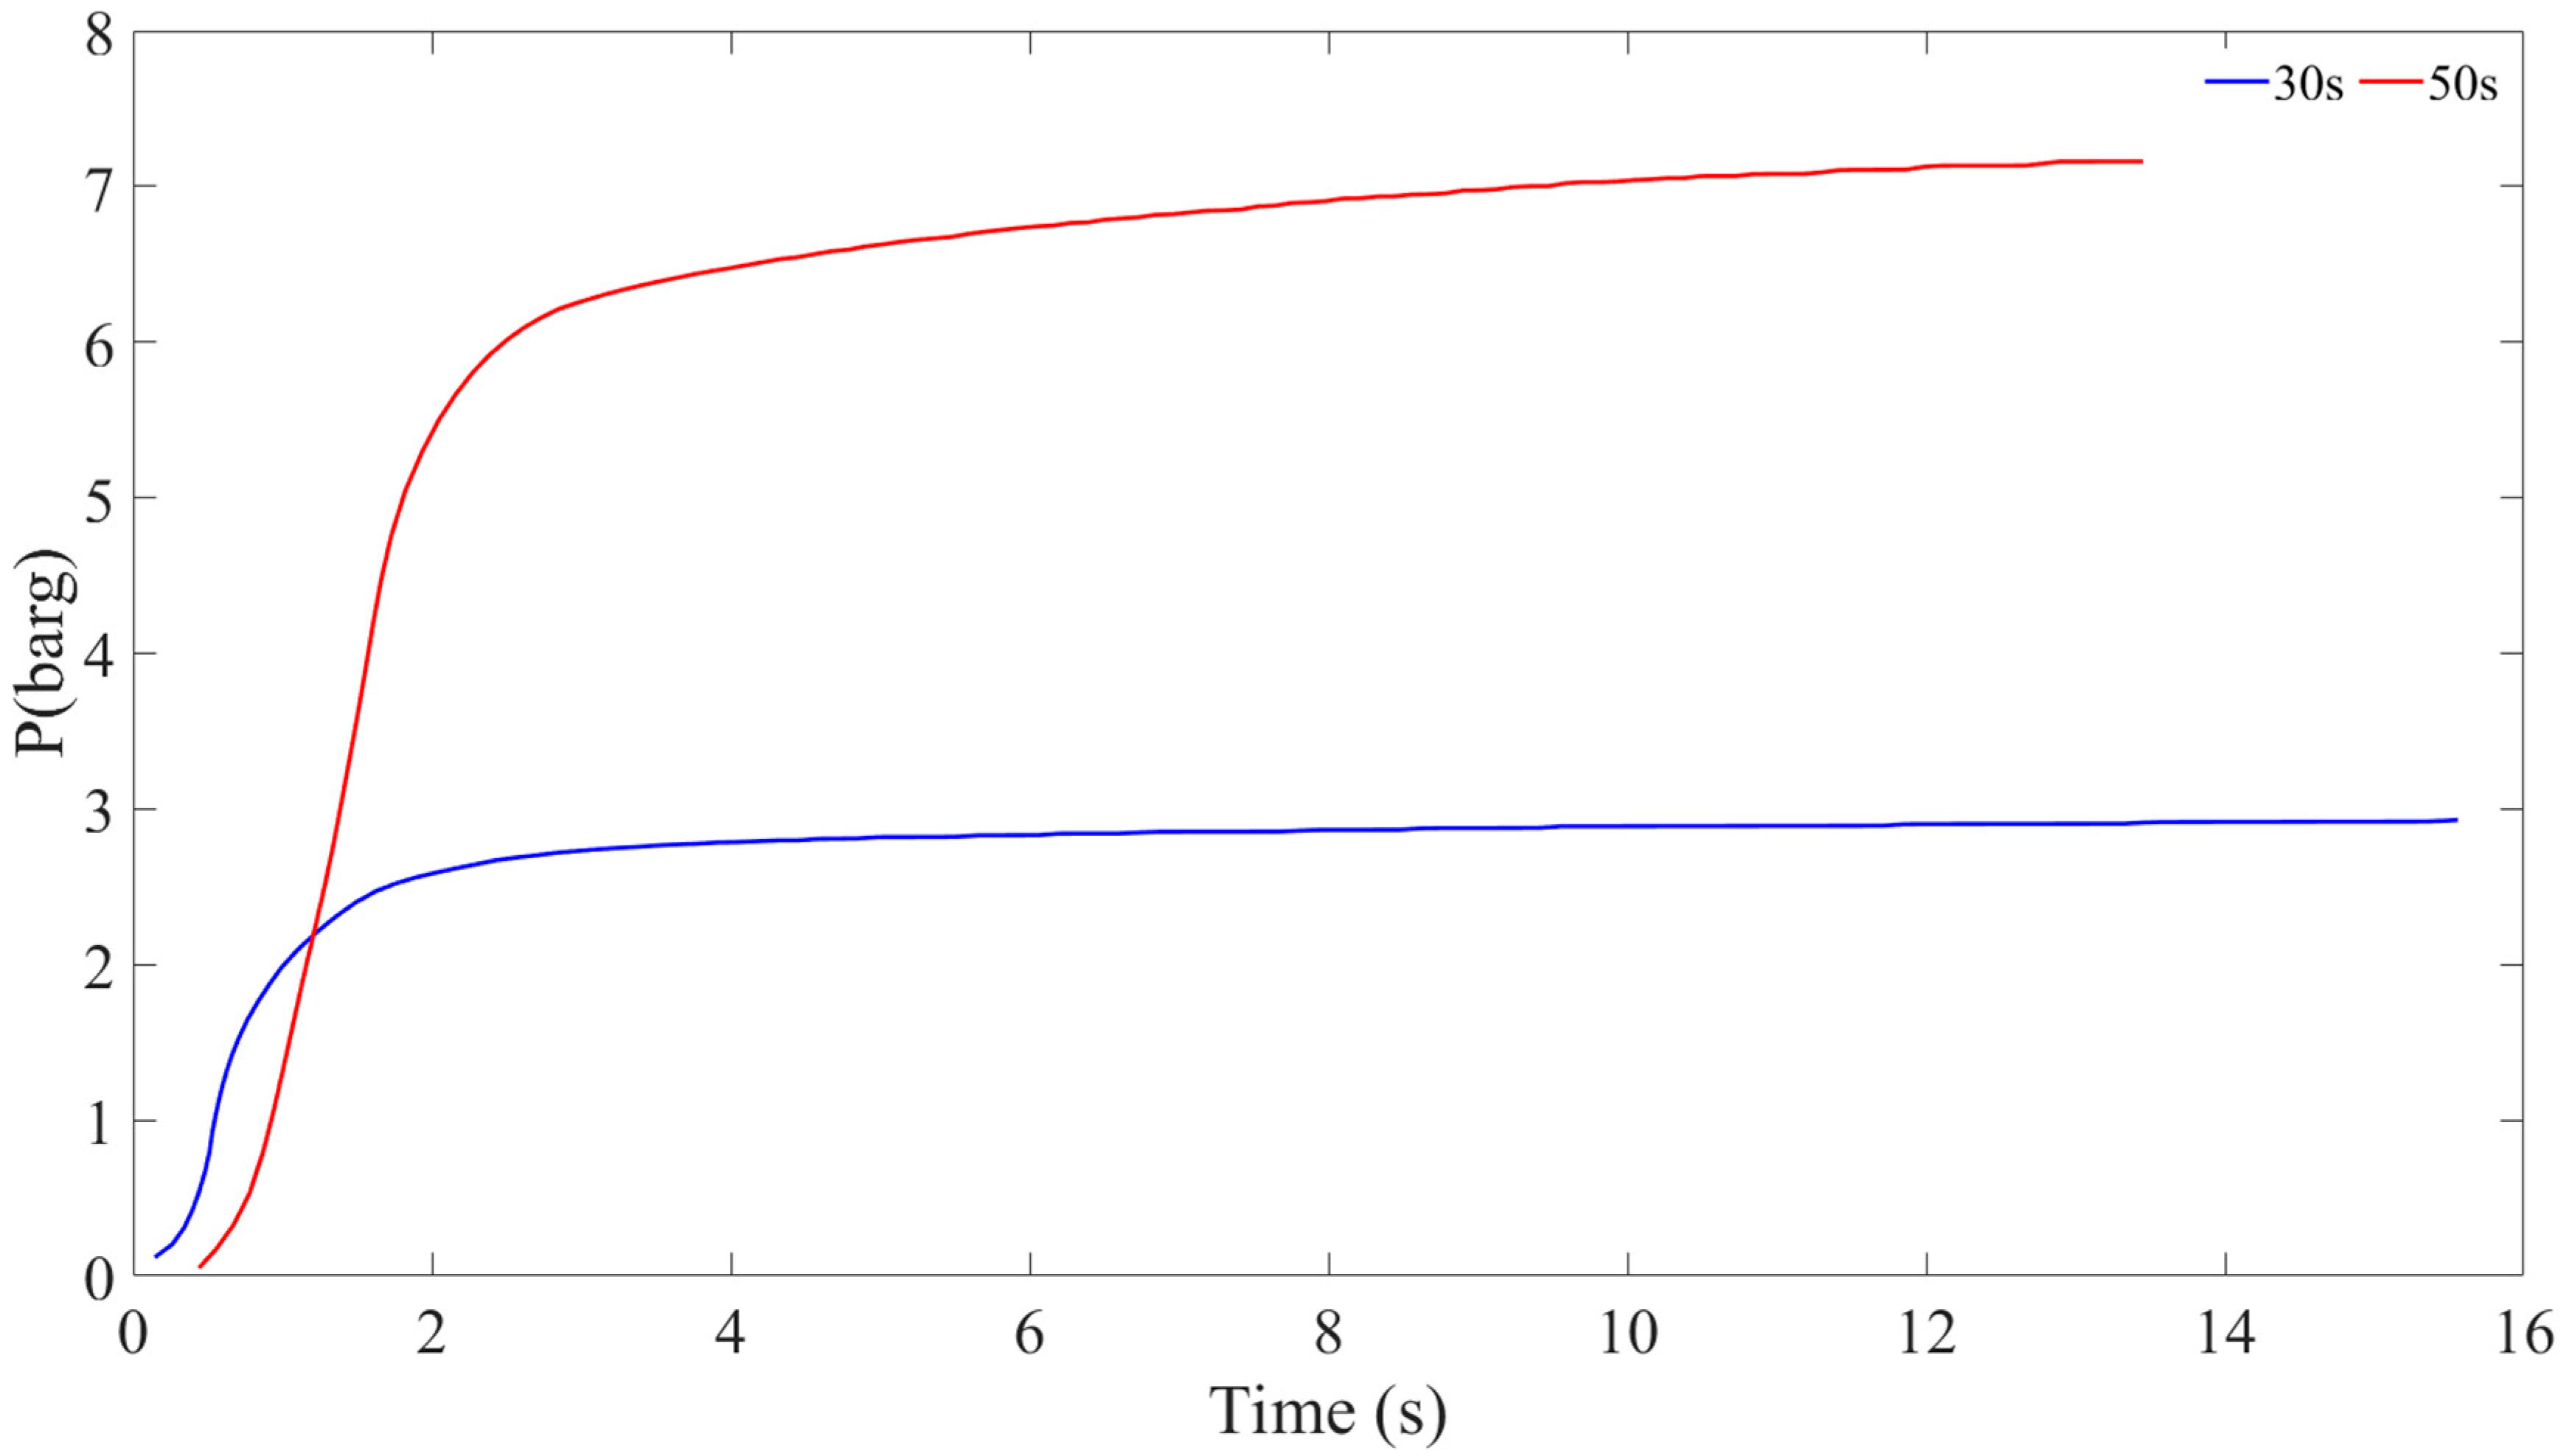
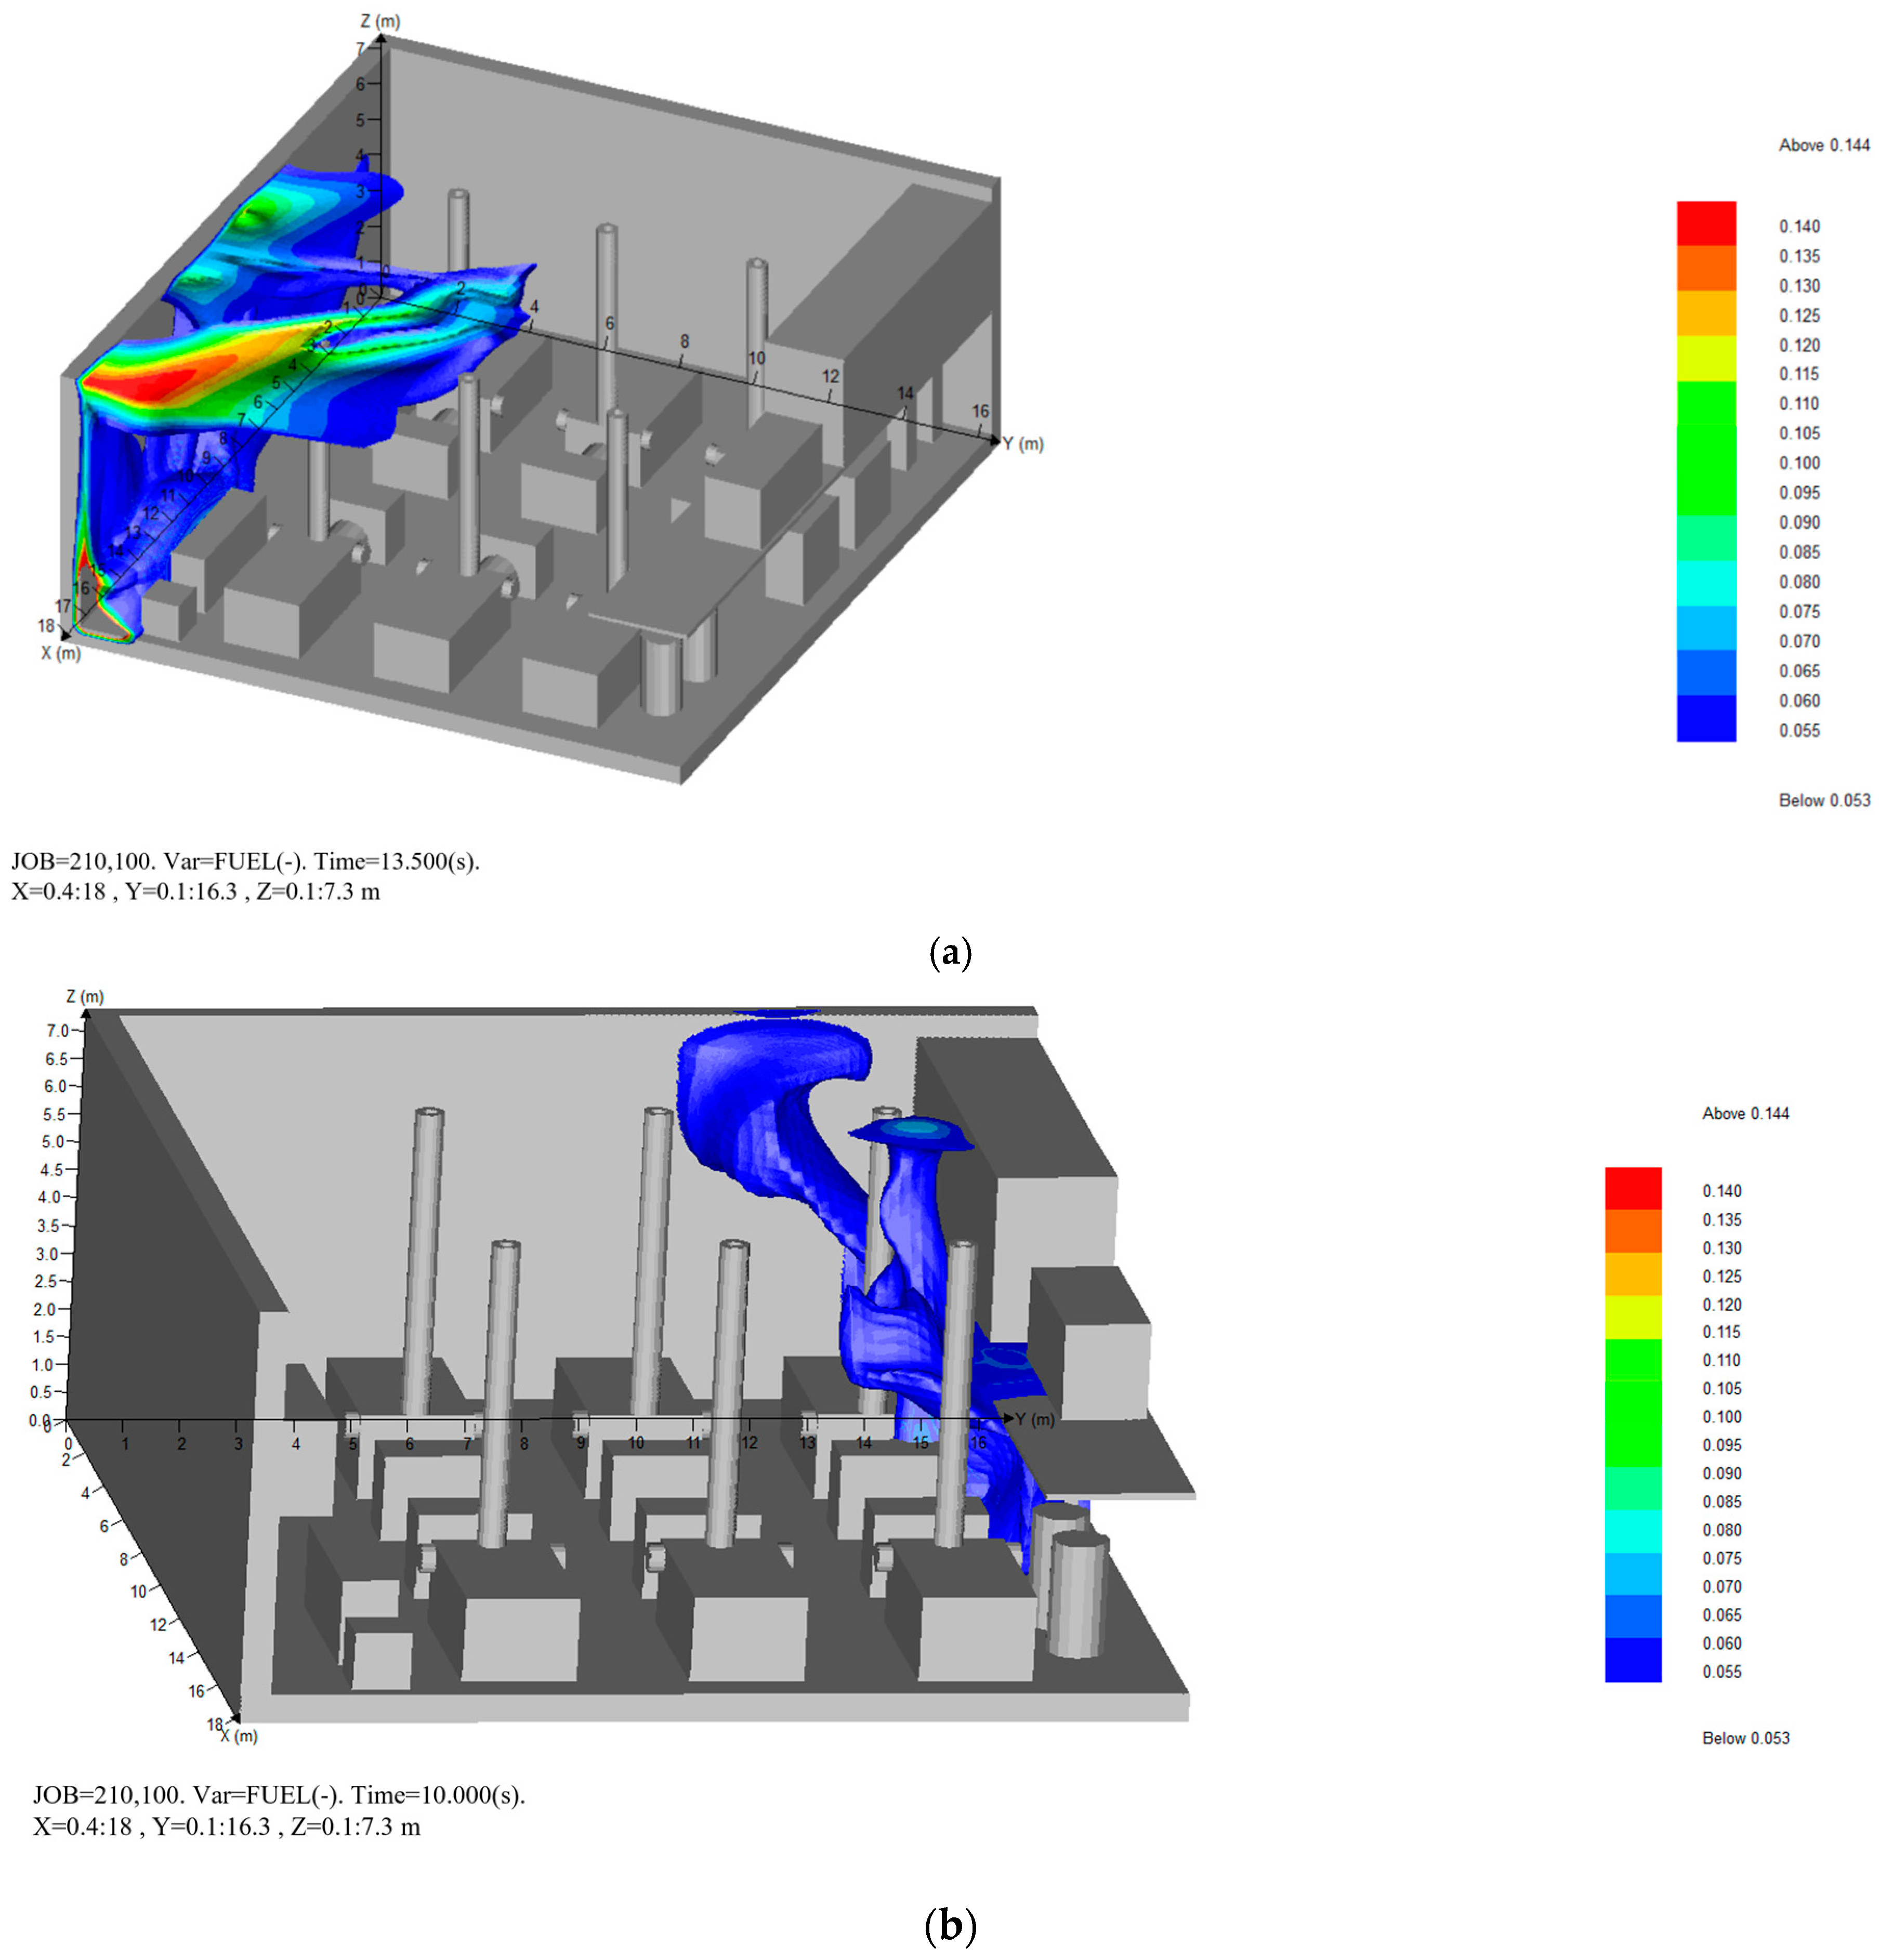
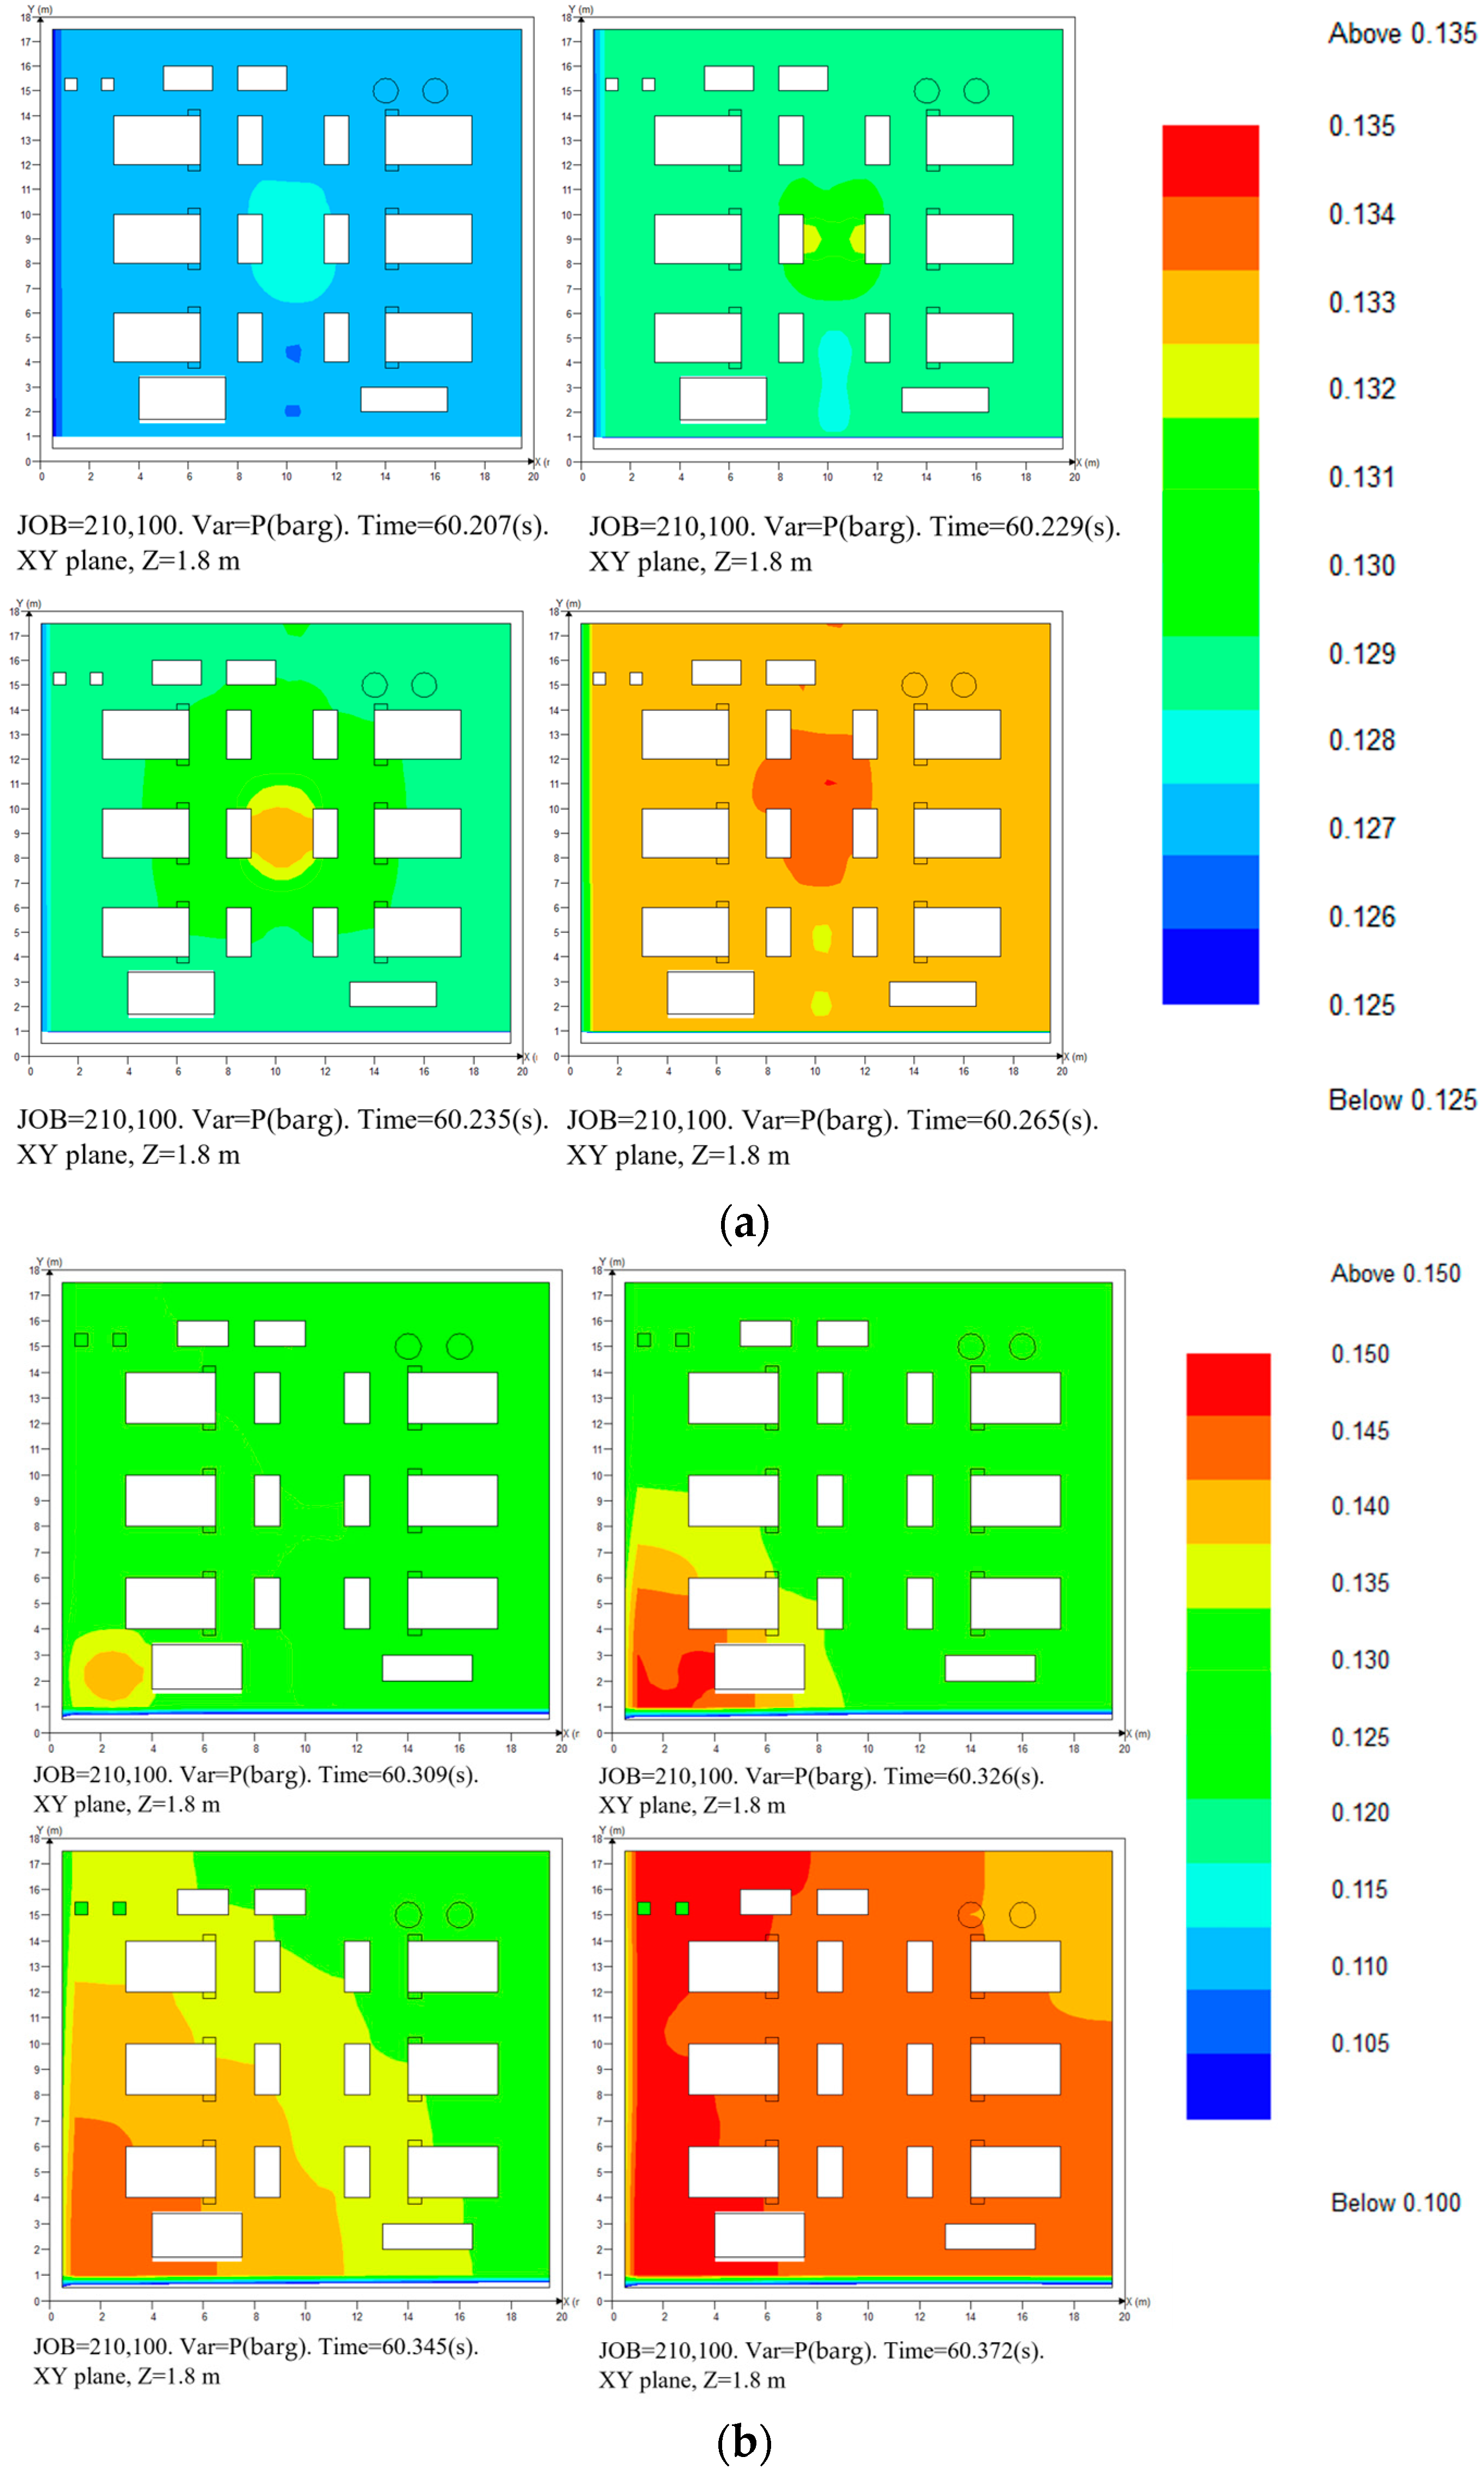
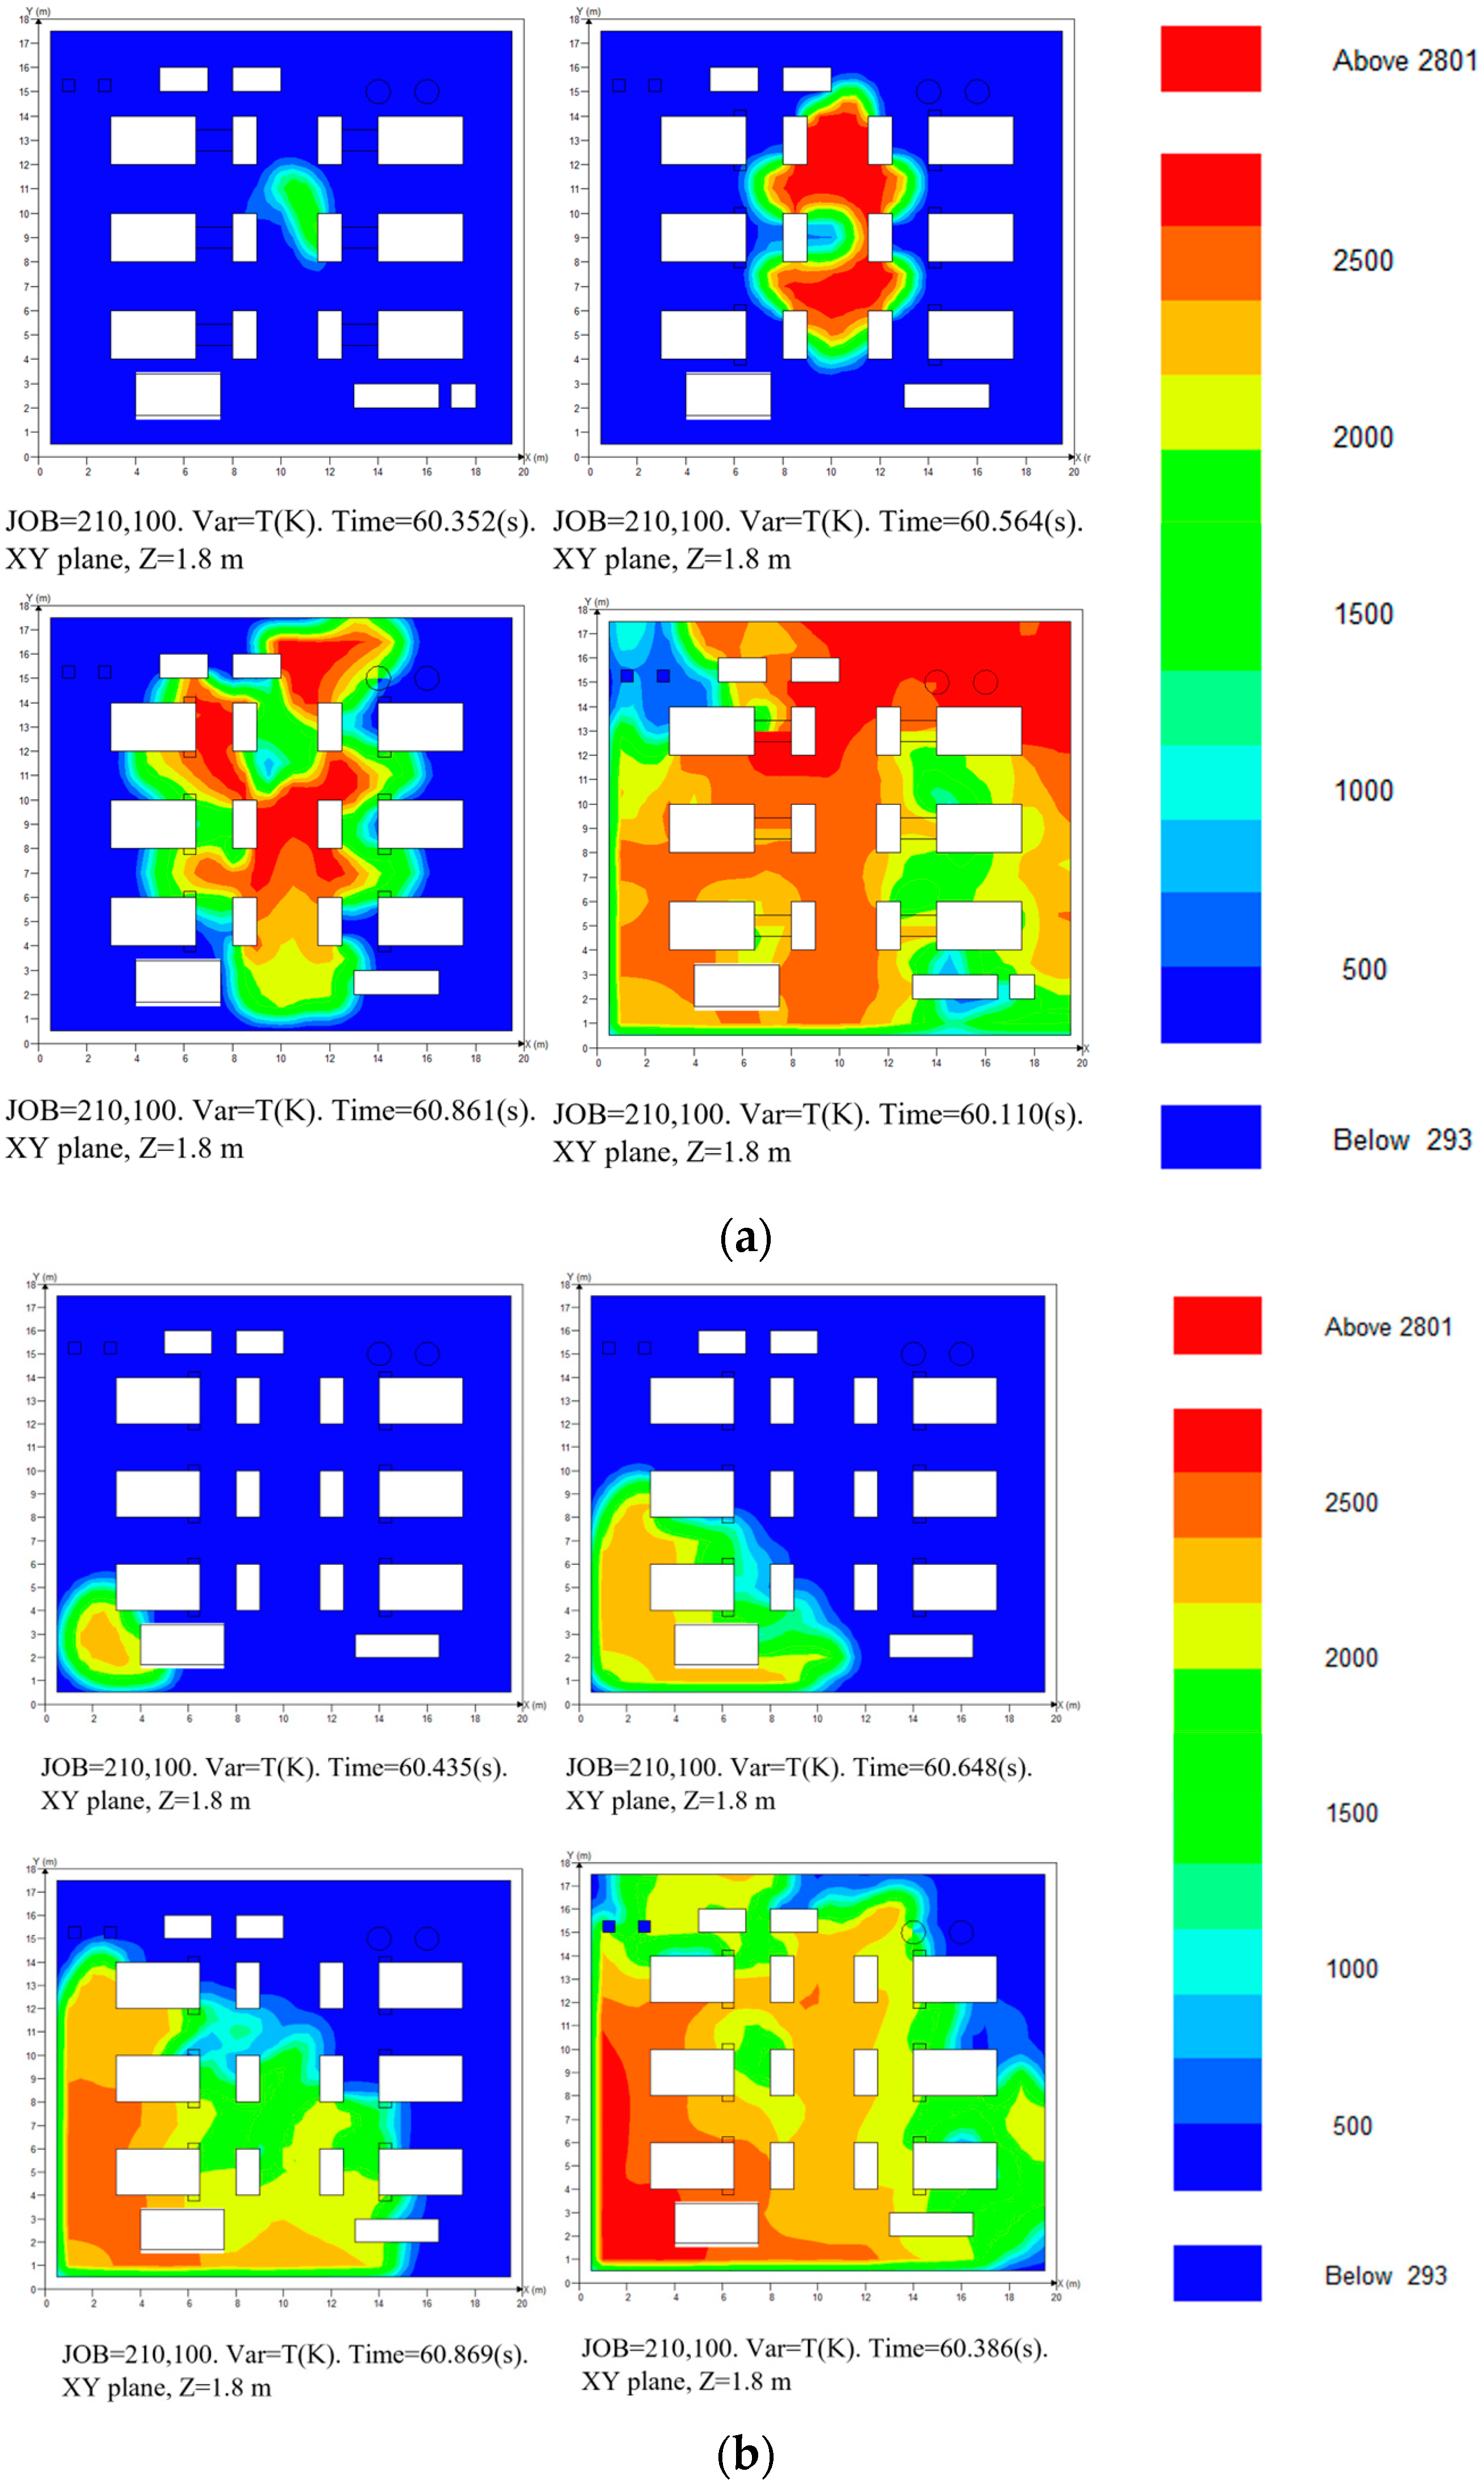
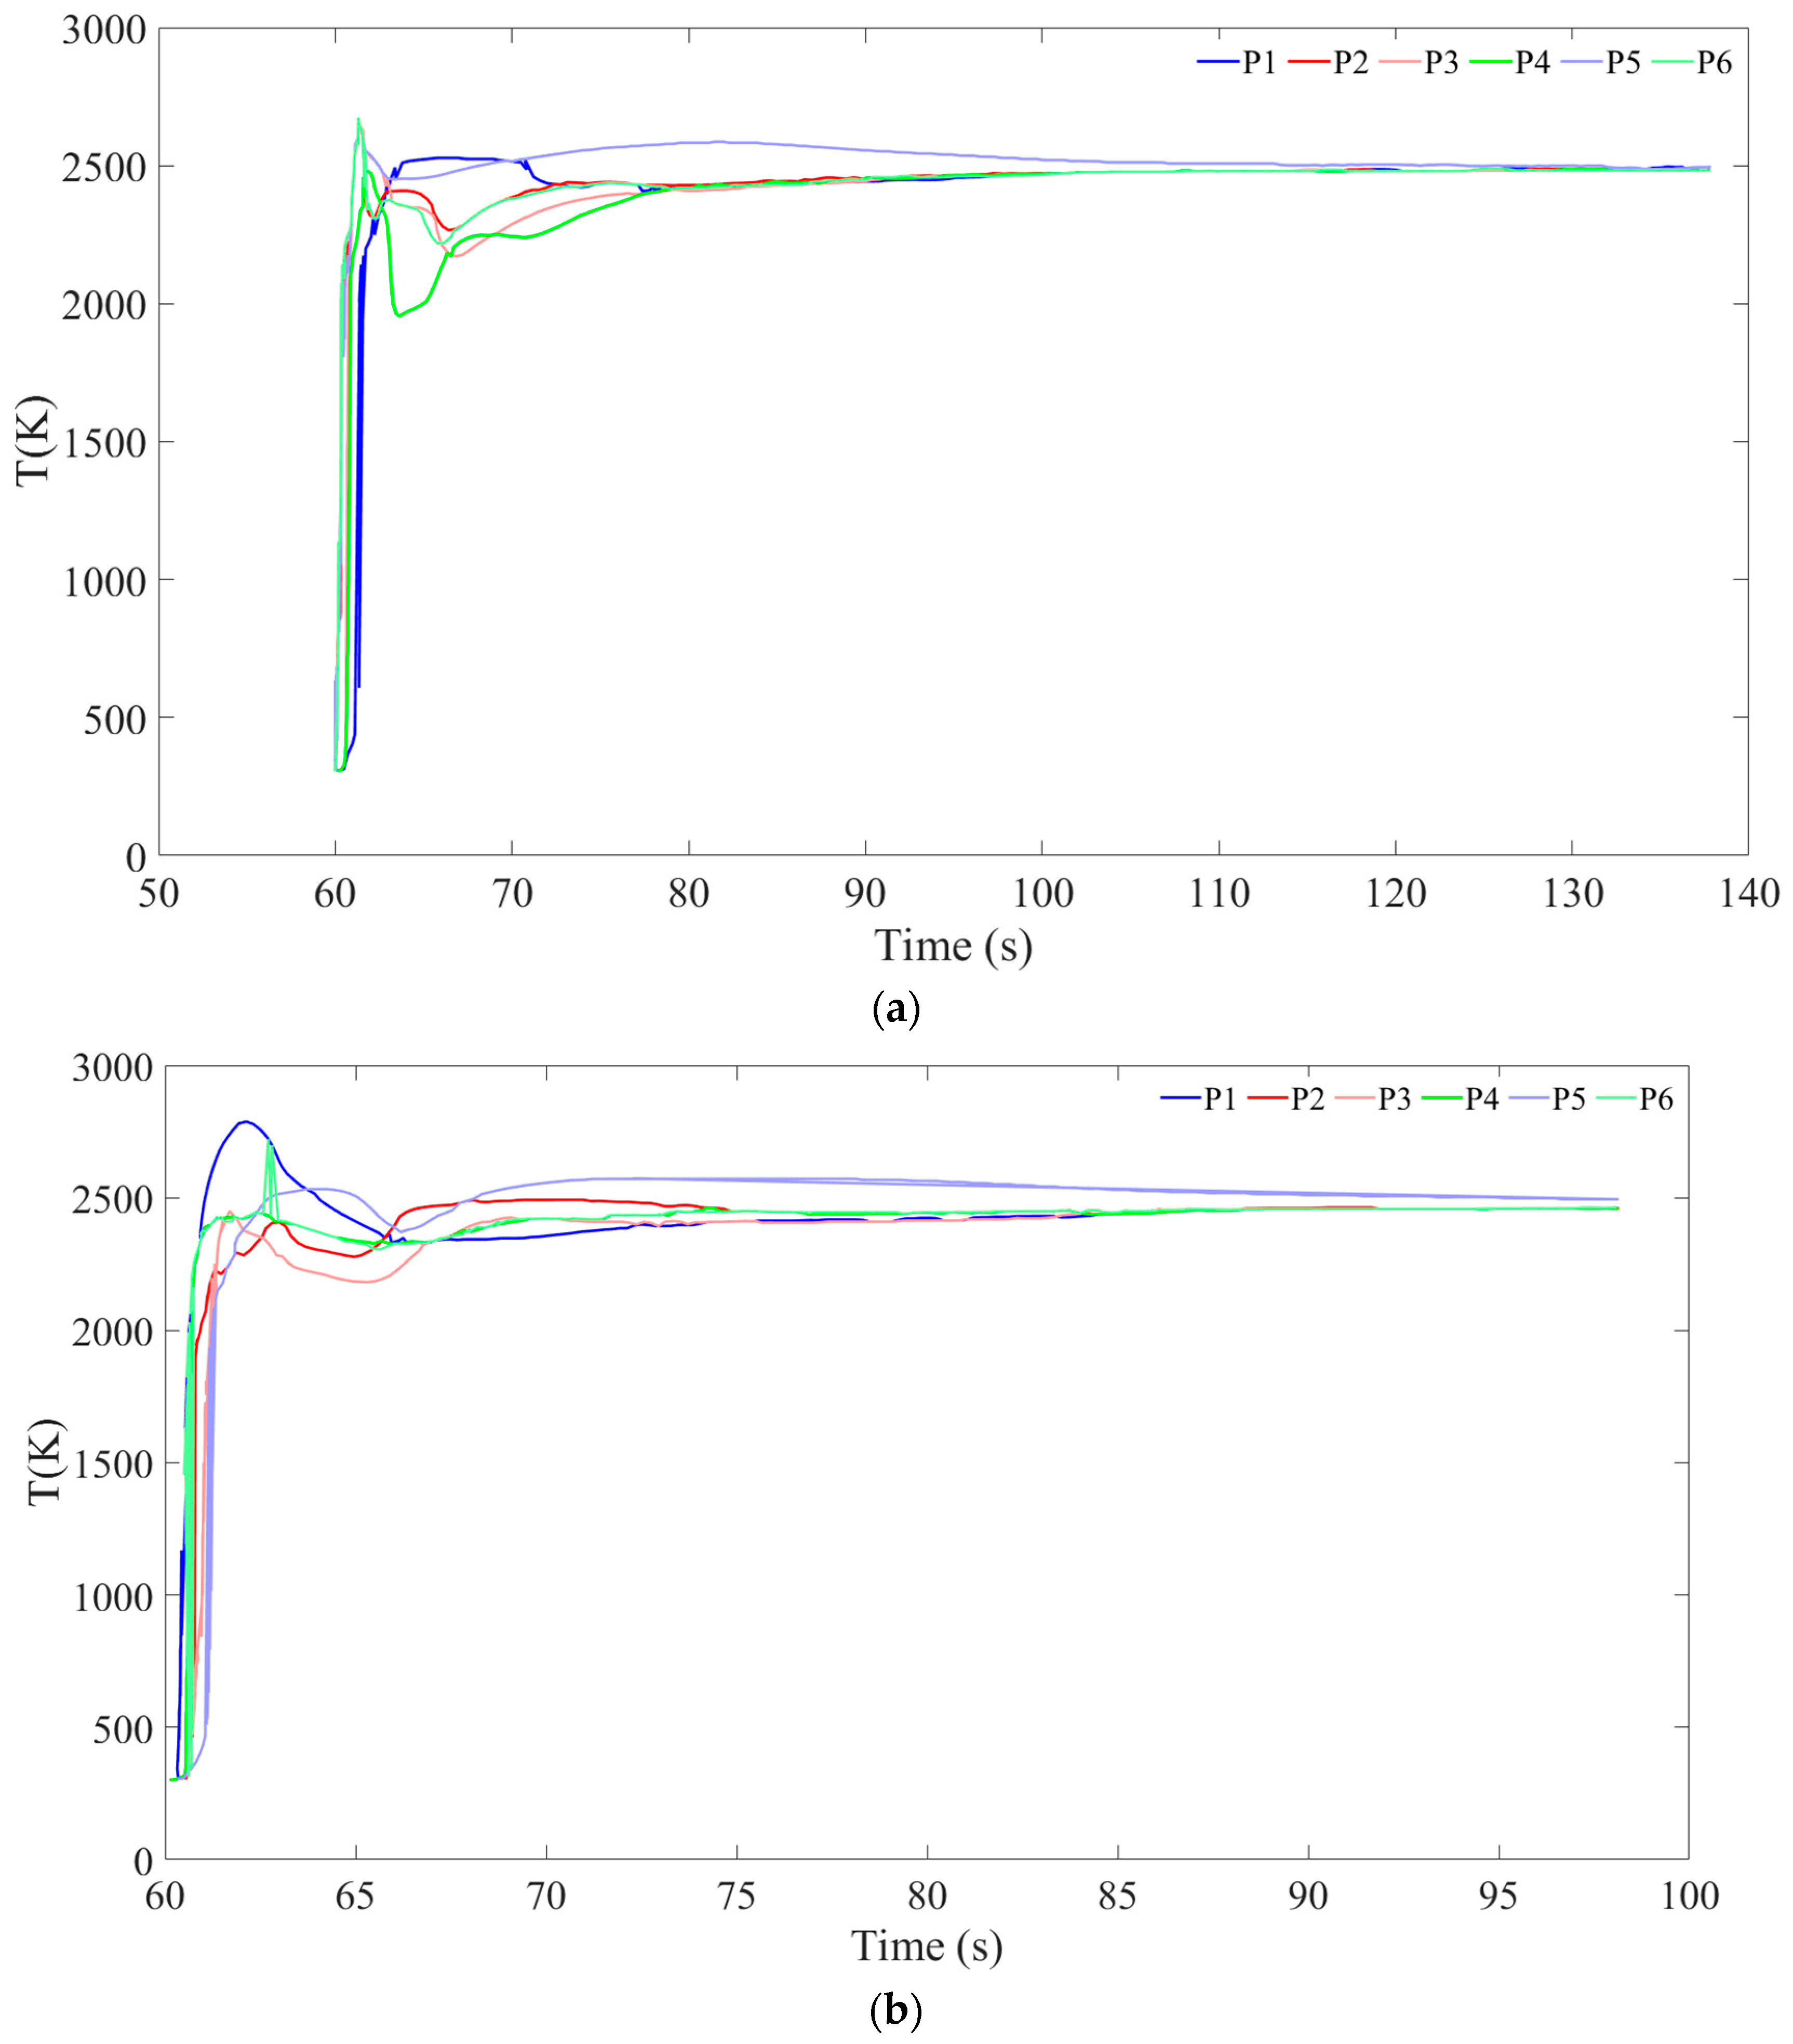
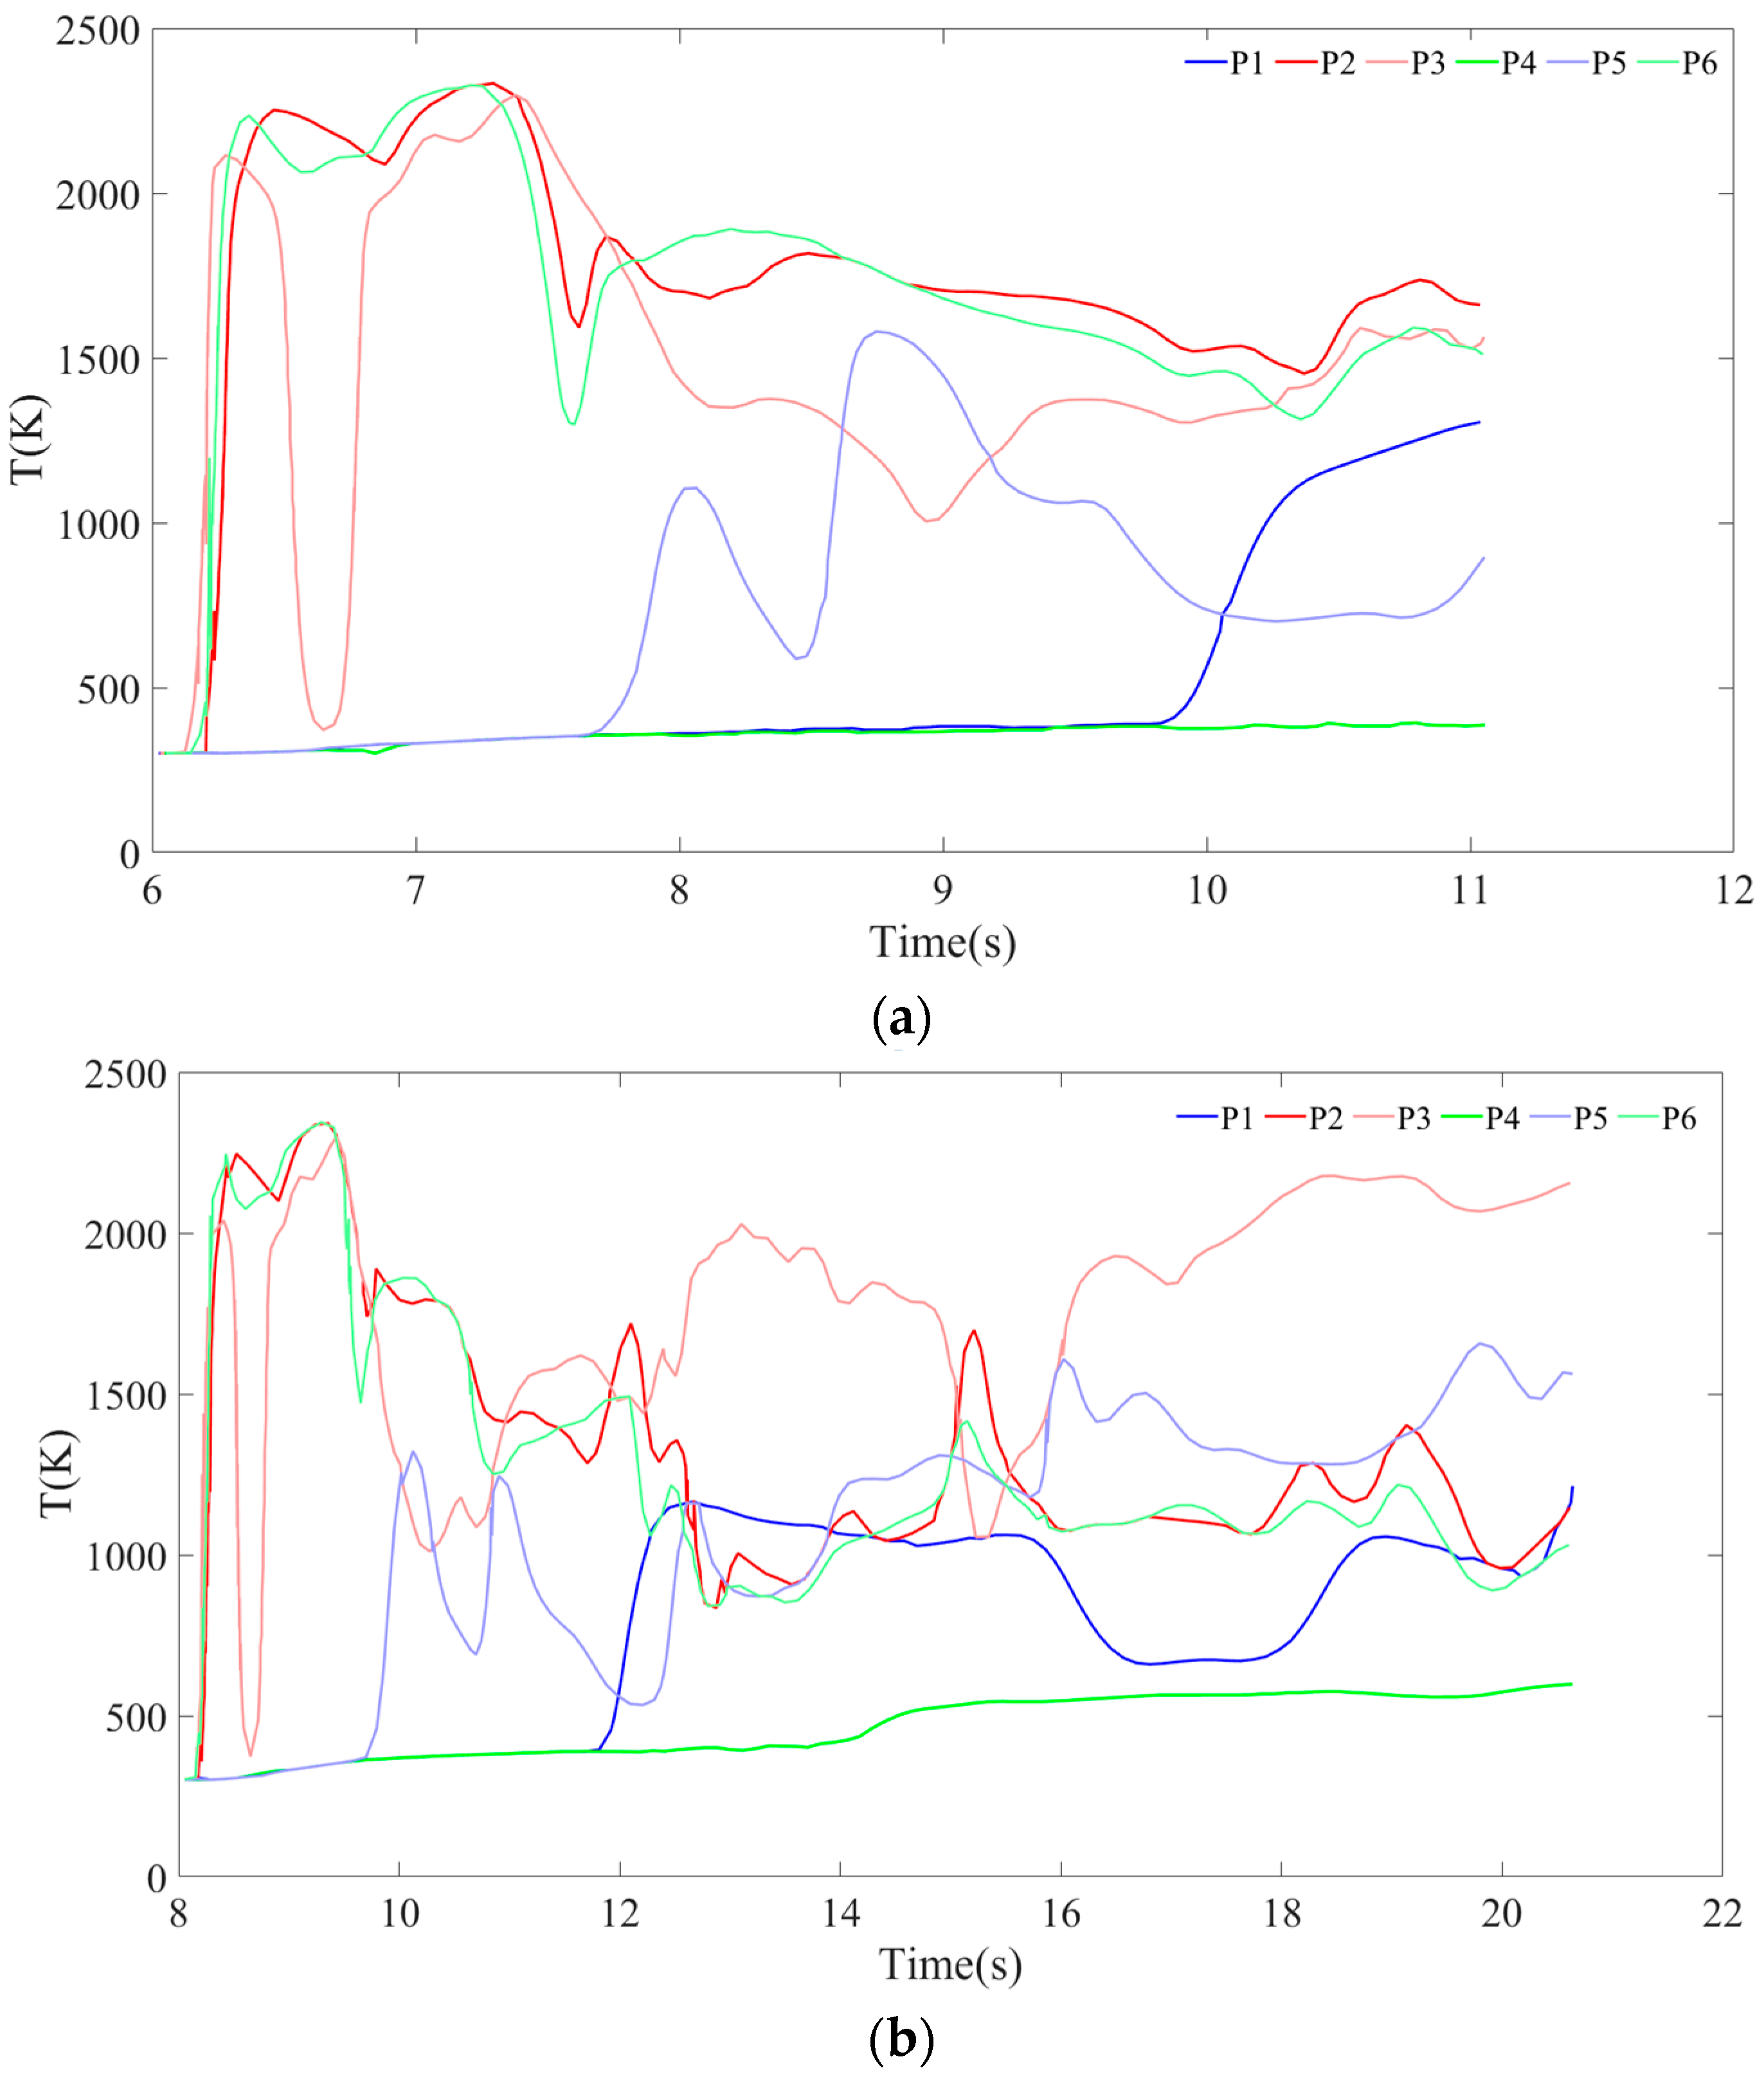
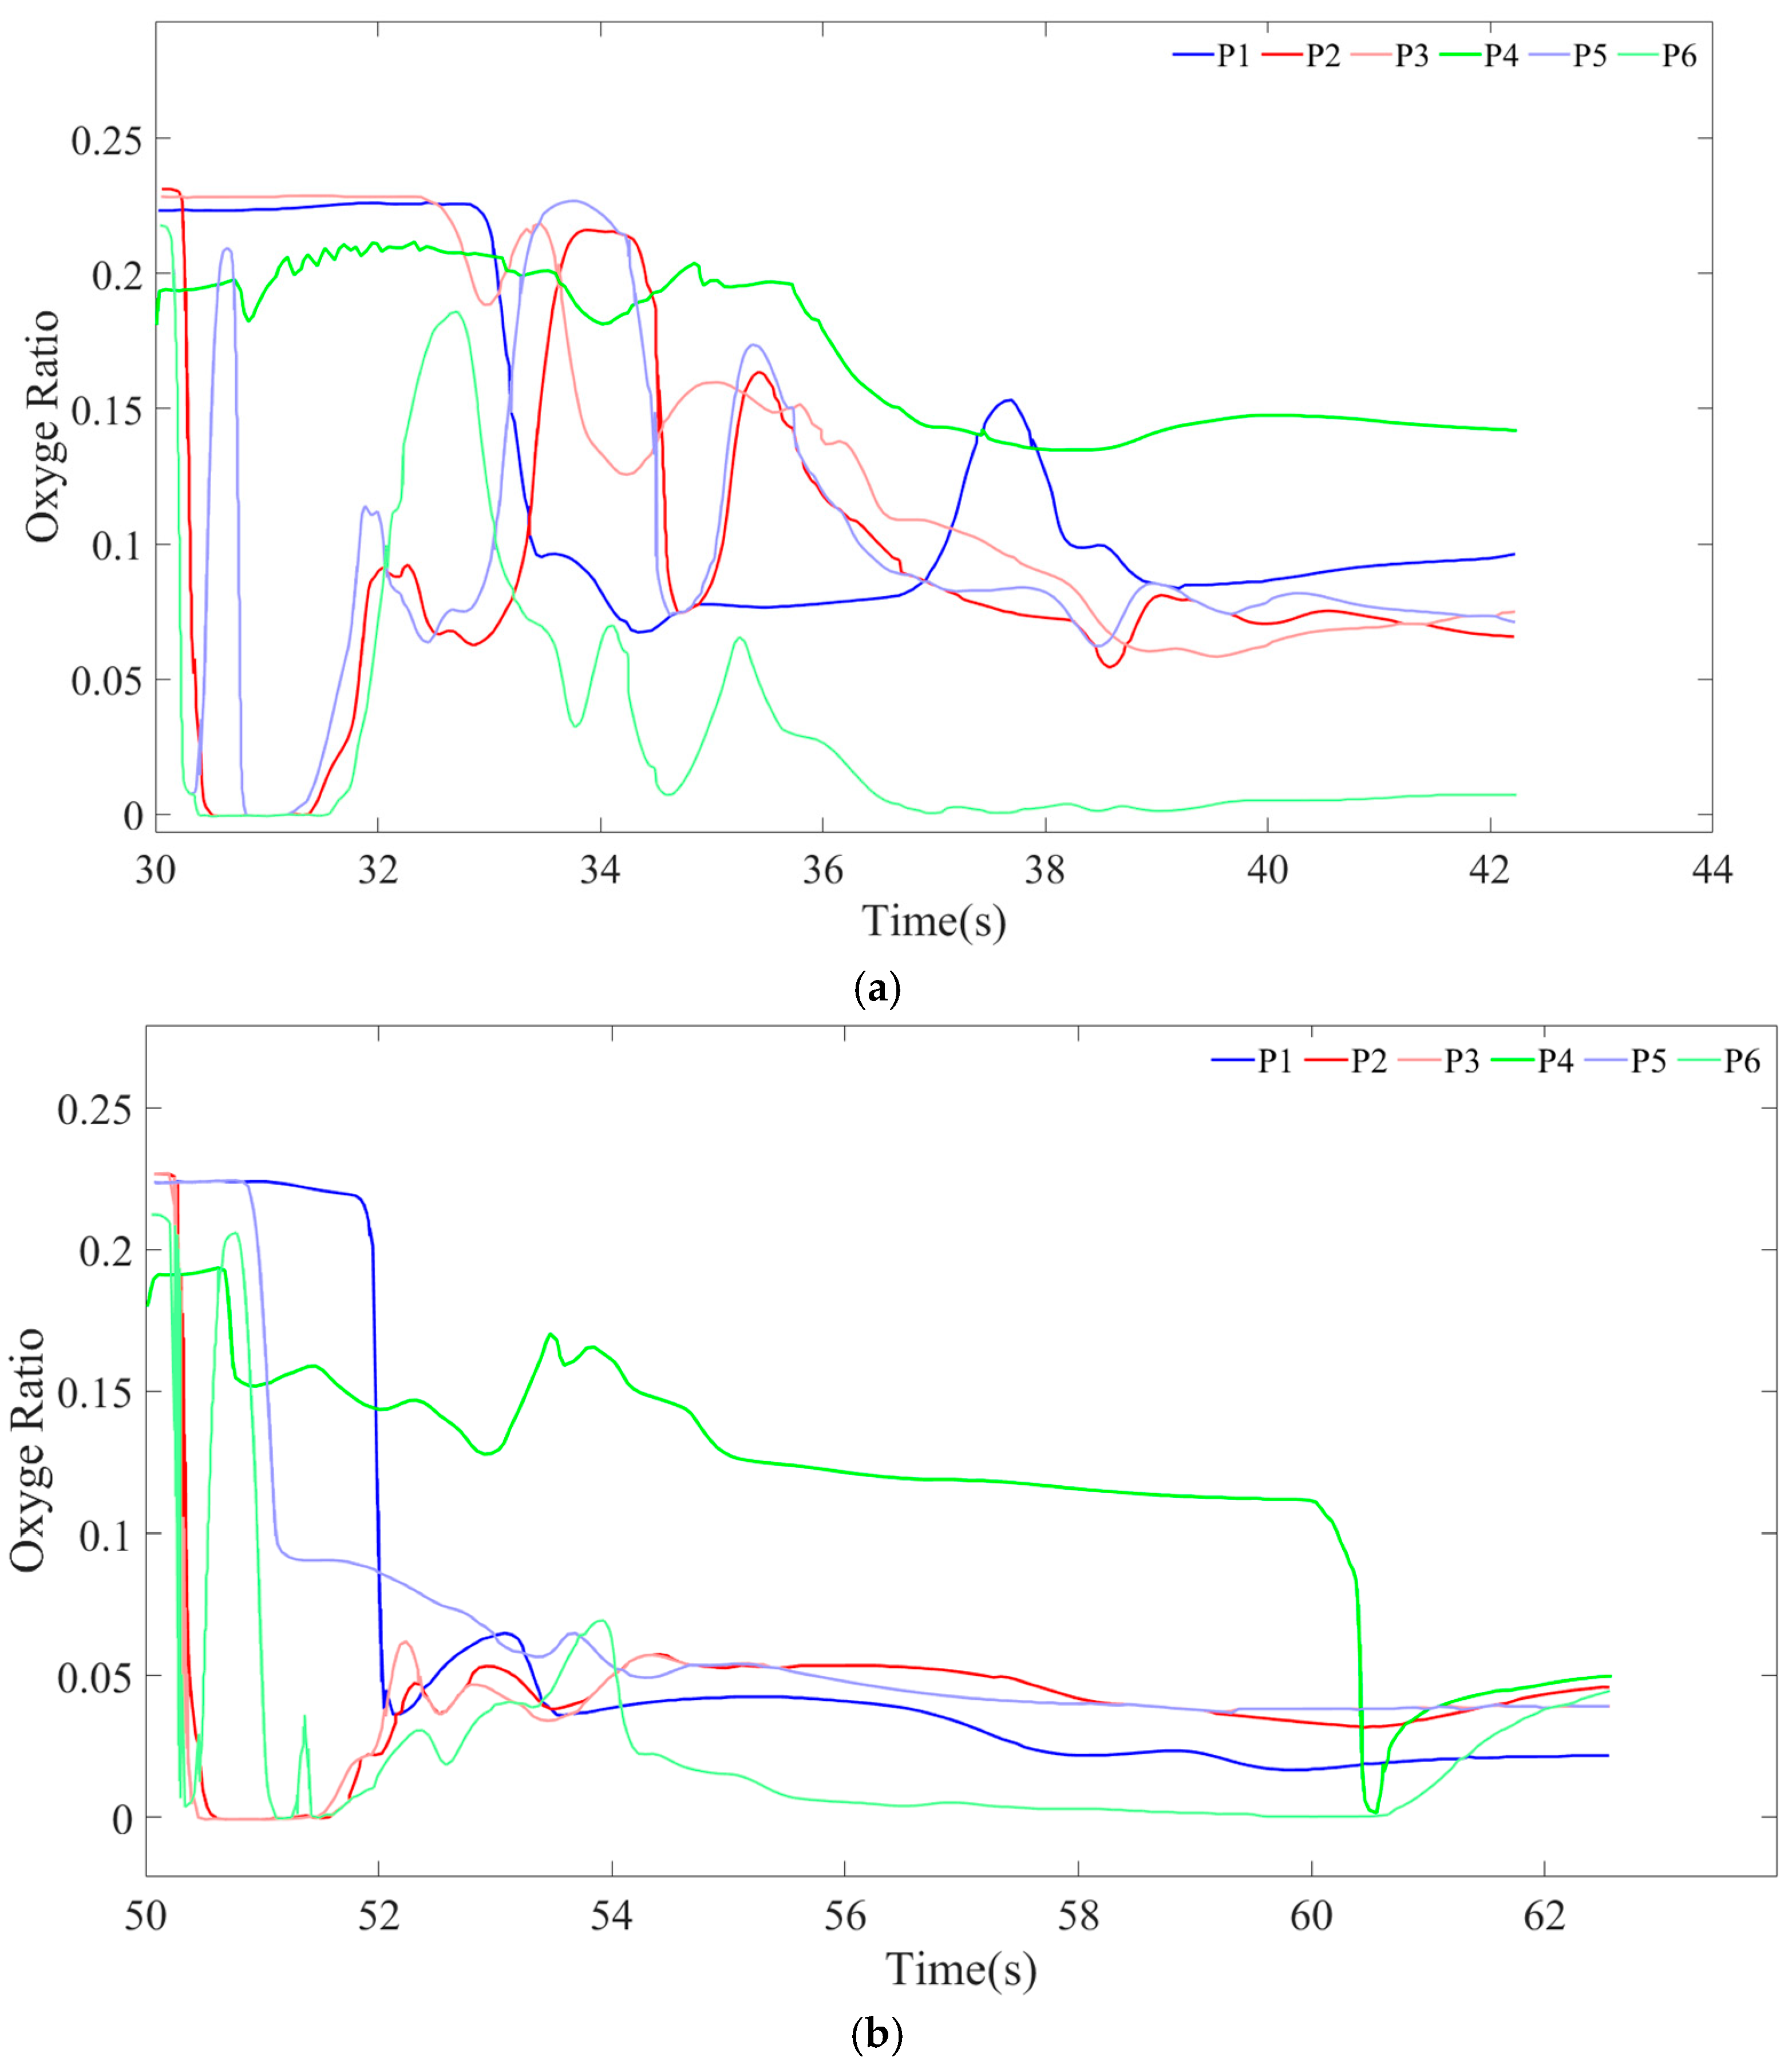
The results of numerical simulation analysis show that natural gas will reach the highest concentration along the injection direction. The obstacles formed by dense equipment in the cabin will significantly change the gas diffusion path. The obstacles have a certain hindering and cumulative effect on the diffusion of gas, which can accelerate the formation of local high-concentration areas. Based on this characteristic, the gas concentration can be controlled and the large-scale diffusion of gas can be prevented. In the scenario of a 50 s gas cloud explosion, the cabin pressure finally stabilized at 6.5 barg, which is much higher than the traditional open-space simulation results. The article compares gas cloud explosions caused by different leaks and at different times, and concludes that the initial time of a leak is very important, and gas leaks should be detected and handled as early as possible. In the early stages of a gas leak, cabin crew members have about 5 s to escape. The article compares gas cloud explosions caused by different leaks at different times and concludes that the danger of explosion will gradually increase with the extension of the leak time, so gas leaks should be detected and handled as early as possible. Finally, the article analyzes the oxygen content and combustion product ratio in the cabin after the explosion, and proposes a modular layout–directional ventilation–gas detection collaborative strategy to reduce harm to the human body. The results of this study have certain reference value for the design and safety management of LNG ship engine rooms, and also have certain significance and contribution to the coupling research of gas leakage and explosion. In practical applications, the simulation results and analysis of this study have certain reference significance and contributions in the design of ship engine rooms, the writing of safety codes for ship crews, and rescue and fire fighting after explosions.
This study demonstrates the value of CFD in quantifying and managing LNG leakage and explosion risks, providing a scientific foundation for safer LNG-powered ship design.

Author Contributions

Conceptualization, Y.Z. and W.L.; methodology, Y.L.; software, Y.L.; validation, Y.Z., Y.L. and D.A.; formal analysis, Y.L.; investigation, Q.W.; resources, Y.G.; data curation, Y.L.; writing—original draft preparation, Y.L.; writing—review and editing, Y.L.; visualization, Y.G.; supervision, Y.Z.; project administration, Y.Z.; funding acquisition, Y.G. All authors have read and agreed to the published version of the manuscript.

Funding

This research received no external funding.

Institutional Review Board Statement

Not applicable.

Informed Consent Statement

Not applicable.

Data Availability Statement

Data are provided in this article.

Conflicts of Interest

The authors declare no conflicts of interest.

References

  1. Zhu, J.; Pan, J.; Zhang, Y.; Li, Y.; Li, H.; Feng, H.; Chen, D.; Kou, Y.; Yang, R. Leakage and diffusion behavior of a buried pipeline of hydrogen-blended natural gas. Int. J. Hydrogen Energy 2023, 48, 11592–11610. [Google Scholar] [CrossRef]
  2. Ikealumba, W.C.; Wu, H. Some Recent Advances in Liquefied Natural Gas (LNG) Production, Spill, Dispersion, and Safety. Energy Fuels 2014, 28, 3556–3586. [Google Scholar] [CrossRef]
  3. Wang, S.; Wang, G.; Liu, D.; Liu, C. Application of the improved vapor cloud explosion model to leakage explosion evaluation of high-pressure natural gas pipelines. Pet. Sci. Technol. 2022, 41, 214–229. [Google Scholar] [CrossRef]
  4. Zhang, C. Research on the Impact of LNG Ship Explosion in the Lower Reaches of the Yangtze River Based on FLUENT Software, Wuhan University of Technology, 3000. Available online: https://d.wanfangdata.com.cn/Thesis/D03145205 (accessed on 20 April 2025).
  5. Gopalaswami, N.; Kakosimos, K.; Zhang, B.; Liu, Y.; Mentzer, R.; Mannan, M.S. Experimental and numerical study of liquefied natural gas (LNG) pool spreading and vaporization on water. J. Hazard. Mater. 2017, 334, 244–255. [Google Scholar] [CrossRef] [PubMed]
  6. Li, X.J.; Zhou, R.P.; Konovessis, D. CFD analysis of natural gas dispersion in engine room space based on multi-factor coupling. Ocean Eng. 2016, 111, 524–532. [Google Scholar] [CrossRef]
  7. Liu, A.; Xu, C.; Lu, X.; Zhou, X.; Xu, W. Coupling effect of multiple factors on the diffusion behavior of leaking natural gas in utility tunnels: A numerical study and PIV experimental validation. Gas Sci. Eng. 2023, 118, 205086. [Google Scholar] [CrossRef]
  8. Sun, Y. Investigation on underwater gas leakage and dispersion behaviors based on coupled Eulerian-Lagrangian CFD model. Process Saf. Environ. Prot. 2020, 136, 268–279. [Google Scholar] [CrossRef]
  9. Xinhong, L.; Guoming, C.; Renren, Z.; Hongwei, Z.; Jianmin, F. Simulation and assessment of underwater gas release and dispersion from subsea gas pipelines leak. Process Saf. Environ. Prot. 2018, 119, 46–57. [Google Scholar] [CrossRef]
  10. Mei, Y.; Shuai, J. Research on natural gas leakage and diffusion characteristics in enclosed building layout. Process Saf. Environ. Prot. 2022, 161, 247–262. [Google Scholar] [CrossRef]
  11. Wang, X.; Tan, Y.; Zhang, T.; Zhang, J.; Yu, K. Diffusion process simulation and ventilation strategy for small-hole natural gas leakage in utility tunnels. Tunn. Undergr. Space Technol. 2020, 97, 103276. [Google Scholar] [CrossRef]
  12. Geretto, C.; Chung Kim Yuen, S.; Nurick, G.N. An experimental study of the effects of degrees of confinement on the response of square mild steel plates subjected to blast loading. Int. J. Impact Eng. 2015, 79, 32–44. [Google Scholar] [CrossRef]
  13. Zhang, S.; Ma, H.; Huang, X.; Peng, S.; Du, J.; Zhao, W. Numerical simulation on natural gas explosion and prevention measures design under water–gas compartment in utility tunnel. Tunn. Undergr. Space Technol. 2022, 130, 104754. [Google Scholar] [CrossRef]
  14. Li, Z.; Wu, J.; Liu, M.; Li, Y.; Ma, Q. Numerical Analysis of the Characteristics of Gas Explosion Process in Natural Gas Compartment of Utility Tunnel Using FLACS. Sustainability 2020, 12, 153. [Google Scholar] [CrossRef]
  15. Cao, X.; Wang, Z.; Lu, Y.; Wang, Y. Numerical simulation of methane explosion suppression by ultrafine water mist in a confined space. Tunn. Undergr. Space Technol. 2021, 109, 103777. [Google Scholar] [CrossRef]
  16. Lee, I.; Lee, M.C. A study on the optimal design of a ventilation system to prevent explosion due to hydrogen gas leakage in a fuel cell power generation facility. Int. J. Hydrogen Energy 2016, 41, 18663–18686. [Google Scholar] [CrossRef]
  17. Lu, Y.; Fan, R.; Lu, H.; Wang, Z.; Cao, X.; Yang, Z. Influence of vent size on characteristics of hydrogen explosion venting: Experimental investigation and numerical simulation. Int. J. Hydrogen Energy 2024. [Google Scholar] [CrossRef]
  18. Zheng, K.; Song, Z.; Song, C.; Jia, Q.; Ren, J.; Chen, X. Investigation on the explosion of ammonia/hydrogen/air in a closed duct by experiments and numerical simulations. Int. J. Hydrogen Energy 2024, 79, 1267–1277. [Google Scholar] [CrossRef]
  19. Qiming, X.; Guohua, C.; Qiang, Z.; Shen, S. Numerical simulation study and dimensional analysis of hydrogen explosion characteristics in a closed rectangular duct with obstacles. Int. J. Hydrogen Energy 2022, 47, 39288–39301. [Google Scholar] [CrossRef]
  20. Das, S.K.; Ranjane, P.R.; Joshi, G.N.; Kulkarni, P.S. Mitigation of hydrogen dispersion and explosion characteristics using propane in storage facility. Int. J. Hydrogen Energy 2025, 105, 660–672. [Google Scholar] [CrossRef]
  21. Ma, Q.; Guo, Y.; Zhong, M.; Ya, H.; You, J.; Chen, J.; Zhang, Z. Numerical simulation of hydrogen explosion characteristics and disaster effects of hydrogen fueling station. Int. J. Hydrogen Energy 2024, 51, 861–879. [Google Scholar] [CrossRef]
  22. Nubli, H.; Fajri, A.; Prabowo, A.R.; Khaeroman; Sohn, J.M. CFD implementation to mitigate the LNG leakage consequences: A review of explosion accident calculation on LNG-fueled ships. Procedia Struct. Integr. 2022, 41, 343–350. [Google Scholar] [CrossRef]
  23. Okamoto, K.; Ichikawa, T.; Fujimoto, J.; Kashiwagi, N.; Nakagawa, M.; Hagiwara, T.; Honma, M. Prediction of evaporative diffusion behavior and explosion damage in gasoline leakage accidents. Process Saf. Environ. Prot. 2021, 148, 893–902. [Google Scholar] [CrossRef]
  24. Ren, J.; Bai, C.; Chang, C.; Peng, X.; Li, B.; Jing, Q. Experimental and numerical simulation study on the dispersion and explosion process of solid-liquid-air mixed three phase components. Combust. Flame 2024, 261, 113336. [Google Scholar] [CrossRef]
  25. Tan, S.; Xia, S.; Cheng, H.; Cheng, S. Numerical simulation of in-vessel steam explosion for China third-generation PWR. Nucl. Eng. Des. 2024, 424, 113258. [Google Scholar] [CrossRef]
  26. Wang, G.; Cao, A.; Wang, X.; Yu, R.; Huang, X.; Lin, J. Numerical simulation of the dynamic responses and damage of underground cavern under multiple explosion sources. Eng. Fail. Anal. 2021, 120, 105085. [Google Scholar] [CrossRef]
  27. Glingler, T.; Dongiovanni, D.N.; Caruso, G.; D’Onorio, M. Hydrogen explosion risk for EU-DEMO reactor considering tungsten dust reaction with steam. Fusion Eng. Des. 2025, 215, 114945. [Google Scholar] [CrossRef]
  28. Lu, H.; Guo, B.; Yao, J.; Yan, Y.; Chen, X.; Xu, Z.; Liu, B. CFD analysis on leakage and diffusion of hydrogen-blended natural gas pipeline in soil-brick gutter coupling space. Int. J. Hydrogen Energy 2025, 100, 33–48. [Google Scholar] [CrossRef]
  29. Wang, Y.; Wu, M.; Du, J.; Gong, K. Simulation of the Consequence of Gas Leakage and Explosion Accident in Canteen Based on FLACS. J. Liaoning Petrochem. Univ. 2022, 42, 35–40. [Google Scholar]
  30. Xie, Y.; Wang, H.; Xu, Z.; Jiang, X.; Liu, J.; Qin, J. Research on gas diffusion and explosion characteristics in a ship engine room. Int. J. Hydrogen Energy 2024, 59, 614–624. [Google Scholar] [CrossRef]
  31. Abg Shamsuddin, D.S.N.; Mohd Fekeri, A.F.; Muchtar, A.; Khan, F.; Khor, B.C.; Lim, B.H.; Rosli, M.I.; Takriff, M.S. Computational fluid dynamics modelling approaches of gas explosion in the chemical process industry: A review. Process Saf. Environ. Prot. 2023, 170, 112–138. [Google Scholar] [CrossRef]
  32. Nakajima, K.; Yamanaka, T.; Ooka, R.; Kikumoto, H.; Sugawara, H. Observational assessment of applicability of Pasquill stability class in urban areas for detection of neutrally stratified wind profiles. J. Wind Eng. Ind. Aerodyn. 2020, 206, 104337. [Google Scholar] [CrossRef]
  33. Cai, J.; Wu, J.; Wang, Y.; Fan, C.; Zhou, R. Experimental investigation of natural gas leakage and dispersion characteristics in utility tunnels under the effects of real facility layout and forced ventilation. Tunn. Undergr. Space Technol. 2025, 155, 106187. [Google Scholar] [CrossRef]
  34. Ahn, S.I.; Kurt, R.E.; Turan, O. The hybrid method combined STPA and SLIM to assess the reliability of the human interaction system to the emergency shutdown system of LNG ship-to-ship bunkering. Ocean Eng. 2022, 265, 112643. [Google Scholar] [CrossRef]
  35. Zhang, Y.; Wang, Y.-H.; Zhao, X.; Tong, R.-P. Dynamic probabilistic risk assessment of emergency response for intelligent coal mining face system, case study: Gas overrun scenario. Resour. Policy 2023, 85, 103995. [Google Scholar] [CrossRef]
  36. Baek, J.-H.; Kim, Y.-P.; Kim, W.-S.; Kho, Y.-T. Fracture toughness and fatigue crack growth properties of the base metal and weld metal of a type 304 stainless steel pipeline for LNG transmission. Int. J. Press. Vessel. Pip. 2001, 78, 351–357. [Google Scholar] [CrossRef]
  37. Sun, Y.; Wang, X. Analysis of Human Body Injury Due to Blast Wave and Protection Method. Chin. J. Explos. Propellants 2008, 31, 50–53. [Google Scholar]
Figure 1. A realistic physical model of the ship’s engine room [30].
Fire 08 00192 g001
Figure 2. Cabin pictures: (a) is the 3D geometric model; (b) is a top view; (c) is a front view [30].
Fire 08 00192 g002
Figure 3. Grid distribution diagram of ship engine room geometry model.
Fire 08 00192 g003
Figure 4. The relationship between parameters near the leak source and the number of grids: (a) is the relationship between gas flow rate and the number of grids; (b) is the relationship between pressure and the number of grids.
Fire 08 00192 g004
Figure 5. (a) is a data measurement point distribution diagram; (b) is a cabin explosion grid distribution map.
Fire 08 00192 g005
Figure 6. LNG fuel distribution: (a) early stage; (b) middle stage; (c) late stage.
Fire 08 00192 g006aFire 08 00192 g006b
Figure 7. XY section diagram of the gas cloud diffusion process: (a) early stage; (b) middle stage; (c) late stage.
Fire 08 00192 g007
Figure 8. Gas explosion limit distribution diagram: (a) early stage; (b) late stage.
Fire 08 00192 g008
Figure 9. The concentration change trend detected at the monitoring point.
Fire 08 00192 g009
Figure 10. XY plane distribution diagram of explosion limit of gas cloud at 1.7 m in height.
Fire 08 00192 g010
Figure 11. PROD image of gas cloud explosion: (a) leaks for 30 s; (b) leaks for 50 s.
Fire 08 00192 g011aFire 08 00192 g011b
Figure 12. Temperature-change curve of each monitoring point.
Fire 08 00192 g012
Figure 13. Pressure distribution diagram of XY section at explosion height 1.8 m.
Fire 08 00192 g013
Figure 14. Monitoring-point pressure change curve.
Fire 08 00192 g014
Figure 15. Leakage conditions at different leakage points and leakage directions: (a) leakage point (13, 1.1, 1.1), leakage direction +Y; (b) leakage point (6, 14.5, 1.1), leakage direction −Y.
Fire 08 00192 g015
Figure 16. Ignition pressure distribution diagram: (a) center ignition; (b) edge ignition.
Fire 08 00192 g016
Figure 17. Temperature distribution diagram: (a) center ignition; (b) edge ignition.
Fire 08 00192 g017
Figure 18. Temperature-change curves of six monitoring points: (a) center ignition temperature change; (b) edge ignition temperature change.
Fire 08 00192 g018
Figure 19. Temperature-change curves of six monitoring points: (a) 6 s leak time; (b) 8 s leak time.
Fire 08 00192 g019
Figure 20. The change of oxygen concentration in the cabin after the explosion: (a) oxygen concentration after the gas cloud exploded 30 s after the leak; (b) oxygen concentration after the gas cloud exploded 50 s after the leak.
Fire 08 00192 g020
Figure 21. The change in combustion products in the cabin after the explosion: (a) combustion product ratio after gas cloud explosion for 30 s after leakage; (b) combustion product ratio after gas cloud explosion for 50 s after leakage.
Fire 08 00192 g021
Table 1. LNG physical and chemical properties [4].
ParameterLNG (Gas Phase)LNG (Liquid Phase)
Density (kg·m−3)0.76430~470
Constant-pressure specific heat capacity (J·kg−1·K−1)F12205
Thermal conductivity (W·m−1·K−1)F20.21
Dynamic viscosity (kg·m−1·s −1)F30.0001183
Table 2. Ship engine room geometry model mesh data.
Grid ParameterXYZ
No. of control volumes707840
Min. contr. Vol. sizes0.200.190.20
Max. control. Vol. size0.880.750.20
Max. percentage diff.16.2517.670.00
Occurred at indices647840
Max aspect ratio4.59
Table 3. Pasquill–Turner stability classification [32].
Surface (10 m) Wind Speed (ms−1)Daytime InsolationNighttime Cloud Cover
StrongModerateSlightThinly Overcast or >4/8 Low Cloud<3/8 Cloud
<2AA–BBFF
2–3A–BBCEF
3–5BBCCDF
5–6CC–DDDD
>6CDDDD
Table 4. Relationship between grid accuracy and grid number.
Grid Accuracy in the Encrypted AreaNumber of Grids
0.2360,000
Encrypted area 0.2, the rest smoothed218,400
0.3377,760
0.445,000
Table 5. Standard for damage to cabin caused by explosion overpressure.
Explosion Overpressure (Barg)Influence
0.0103Typical pressures at which glass breaks
0.09Slight deformation of steel structure
0.75Severe damage to the steel structure
Table 6. The effect of lack of oxygen concentration on the human body [37].
Oxygen ConcentrationInfluence
0.2Safety
0.2~0.3Slight
0.3~0.5Medium
0.5~1Serious
1Very severe
Table 7. The impact of oxygen concentration on the human body.
Oxygen ConcentrationThe Impact on the Human Body
0.15–0.195Symptoms of hypoxia
0.08–0.15Confusion and loss of muscle coordination
0–0.08Coma, death
Table 8. The impact of carbon dioxide concentration on the human body.
Carbon Dioxide ConcentrationThe Impact on the Human Body
0.1–0.5%Increased breathing, headache
0.5–3%Severe hypoxia, coma
>3%Can cause death
Disclaimer/Publisher’s Note: The statements, opinions and data contained in all publications are solely those of the individual author(s) and contributor(s) and not of MDPI and/or the editor(s). MDPI and/or the editor(s) disclaim responsibility for any injury to people or property resulting from any ideas, methods, instructions or products referred to in the content.

