
Fire Test Study and FDS Verification of Spray Water Volume for Small-Sized Bookstores in the Revitalization of Historical Buildings


 ,
,
Abstract
1. Introduction
2. Investigation, Experimental Methods, and Materials
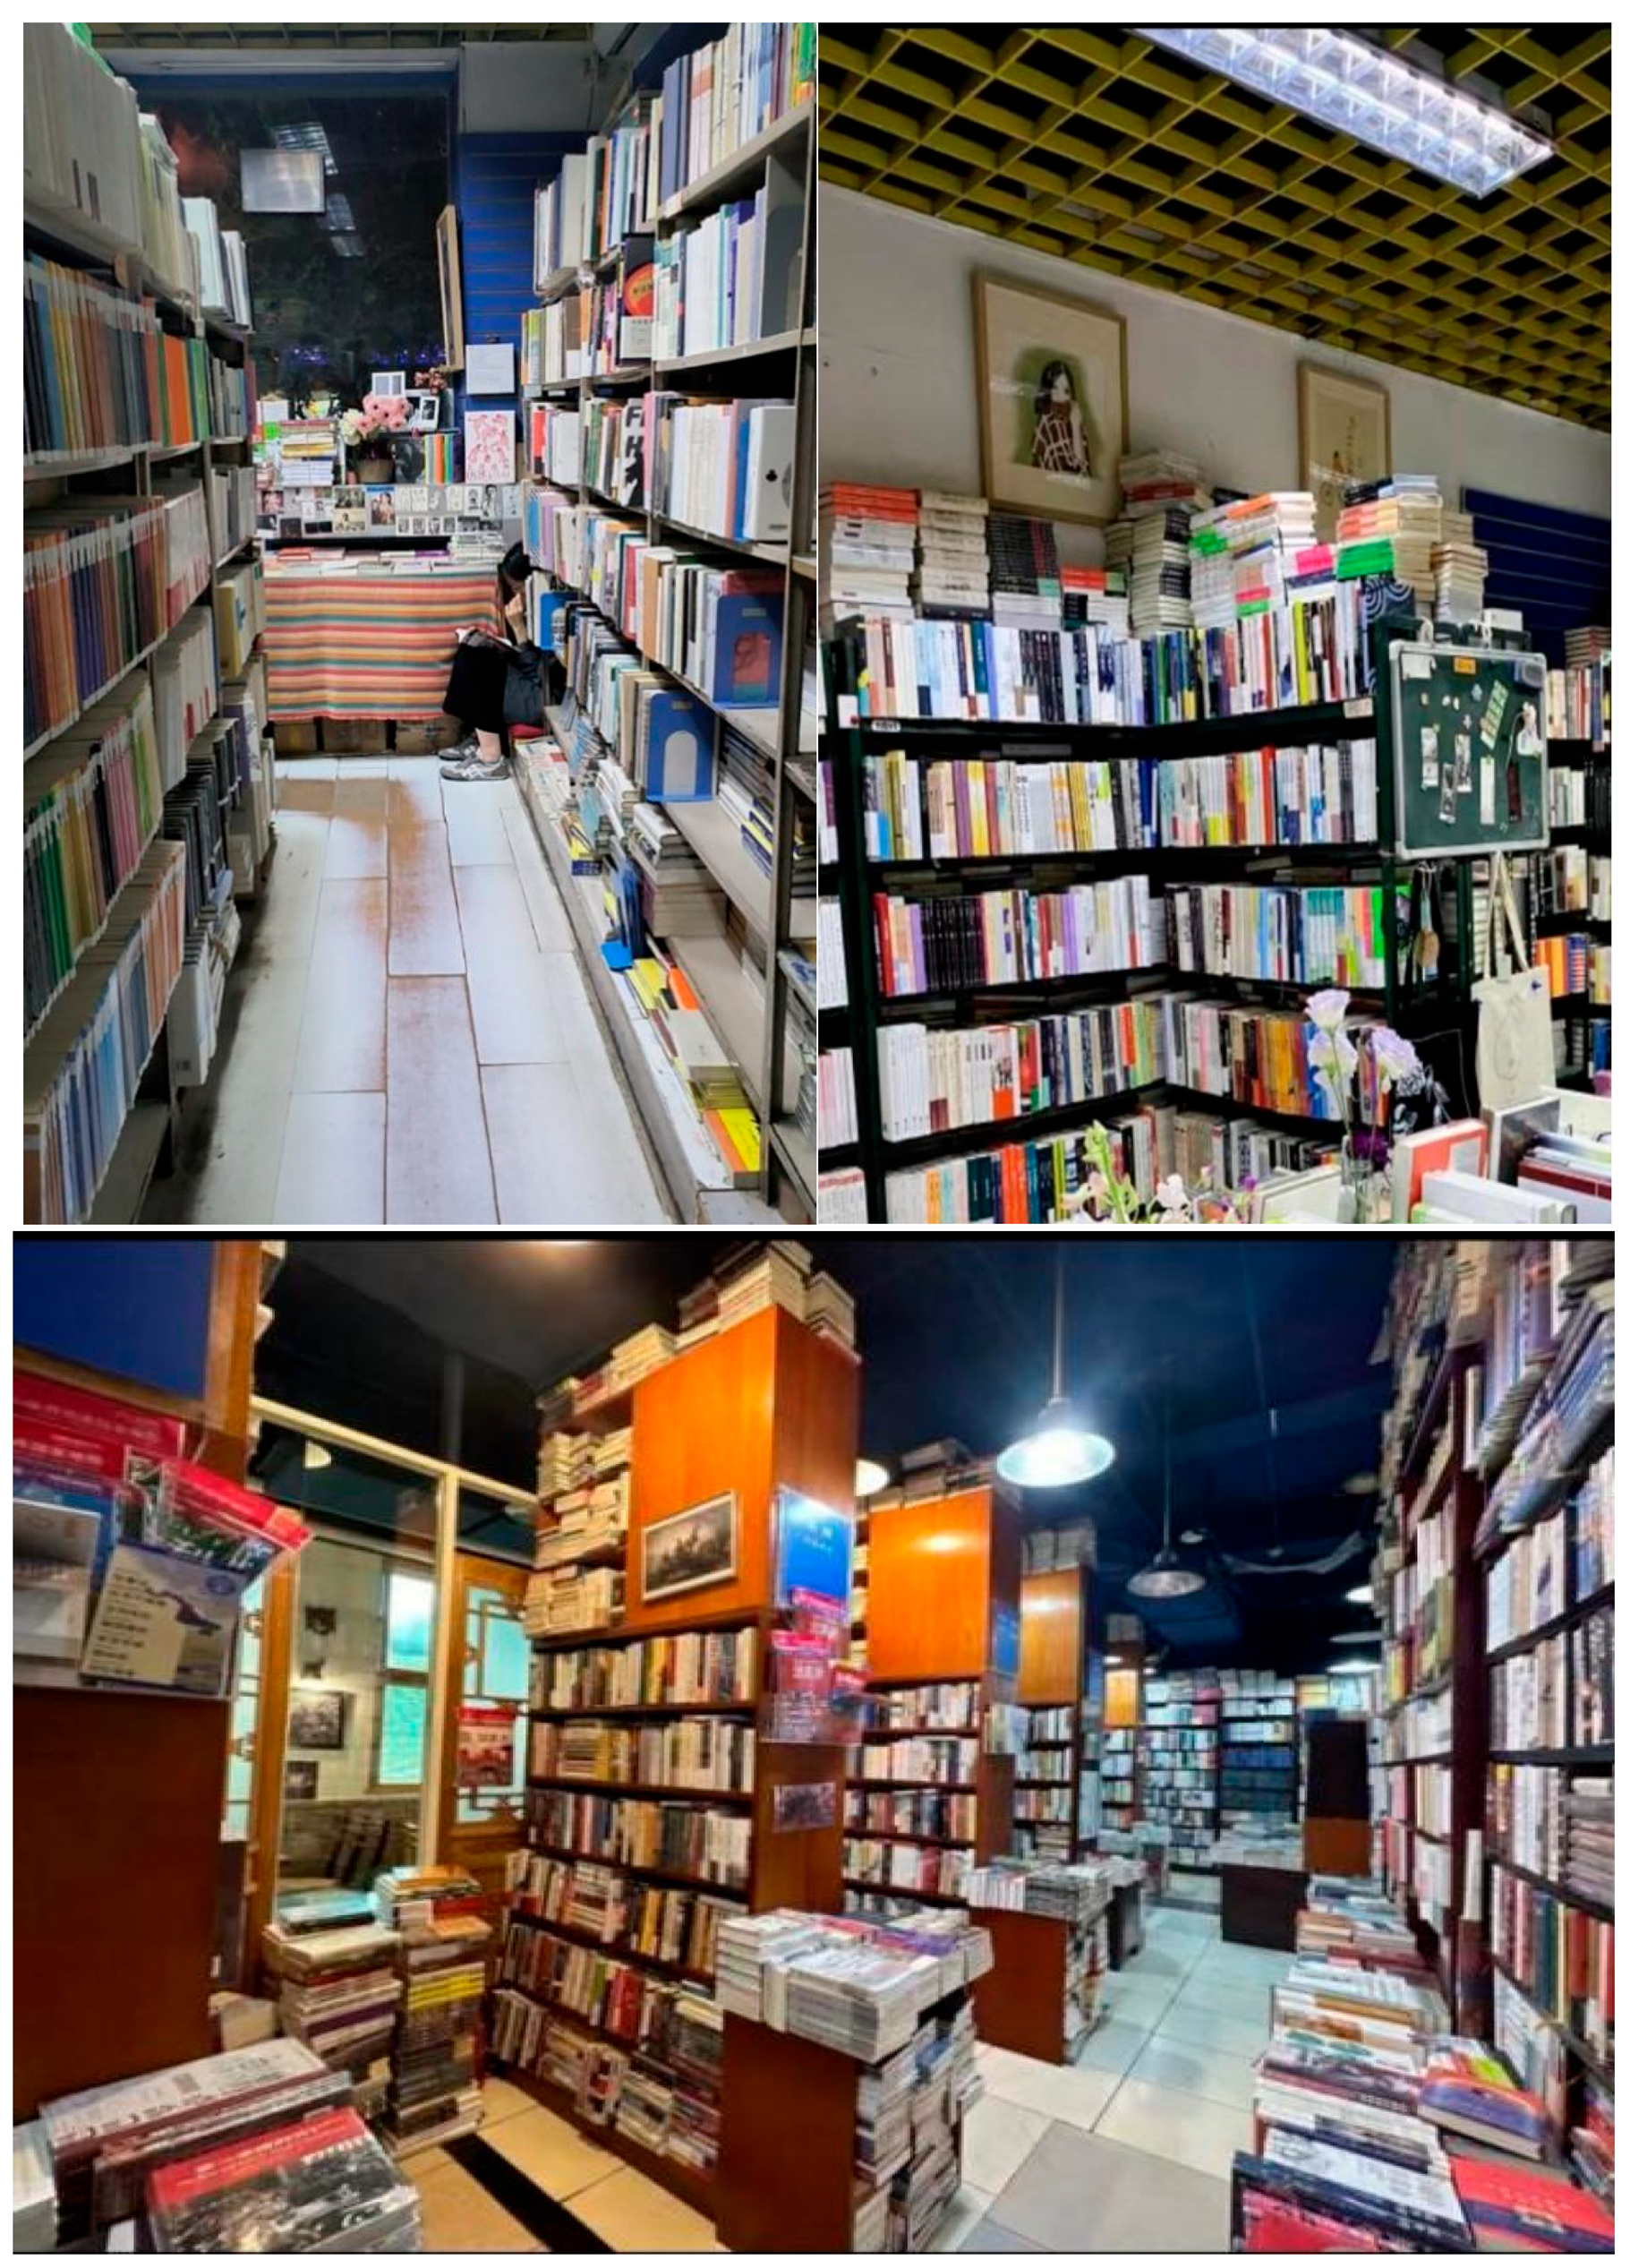
2.1. Method of On-Site Investigation
2.2. Experimental Methods
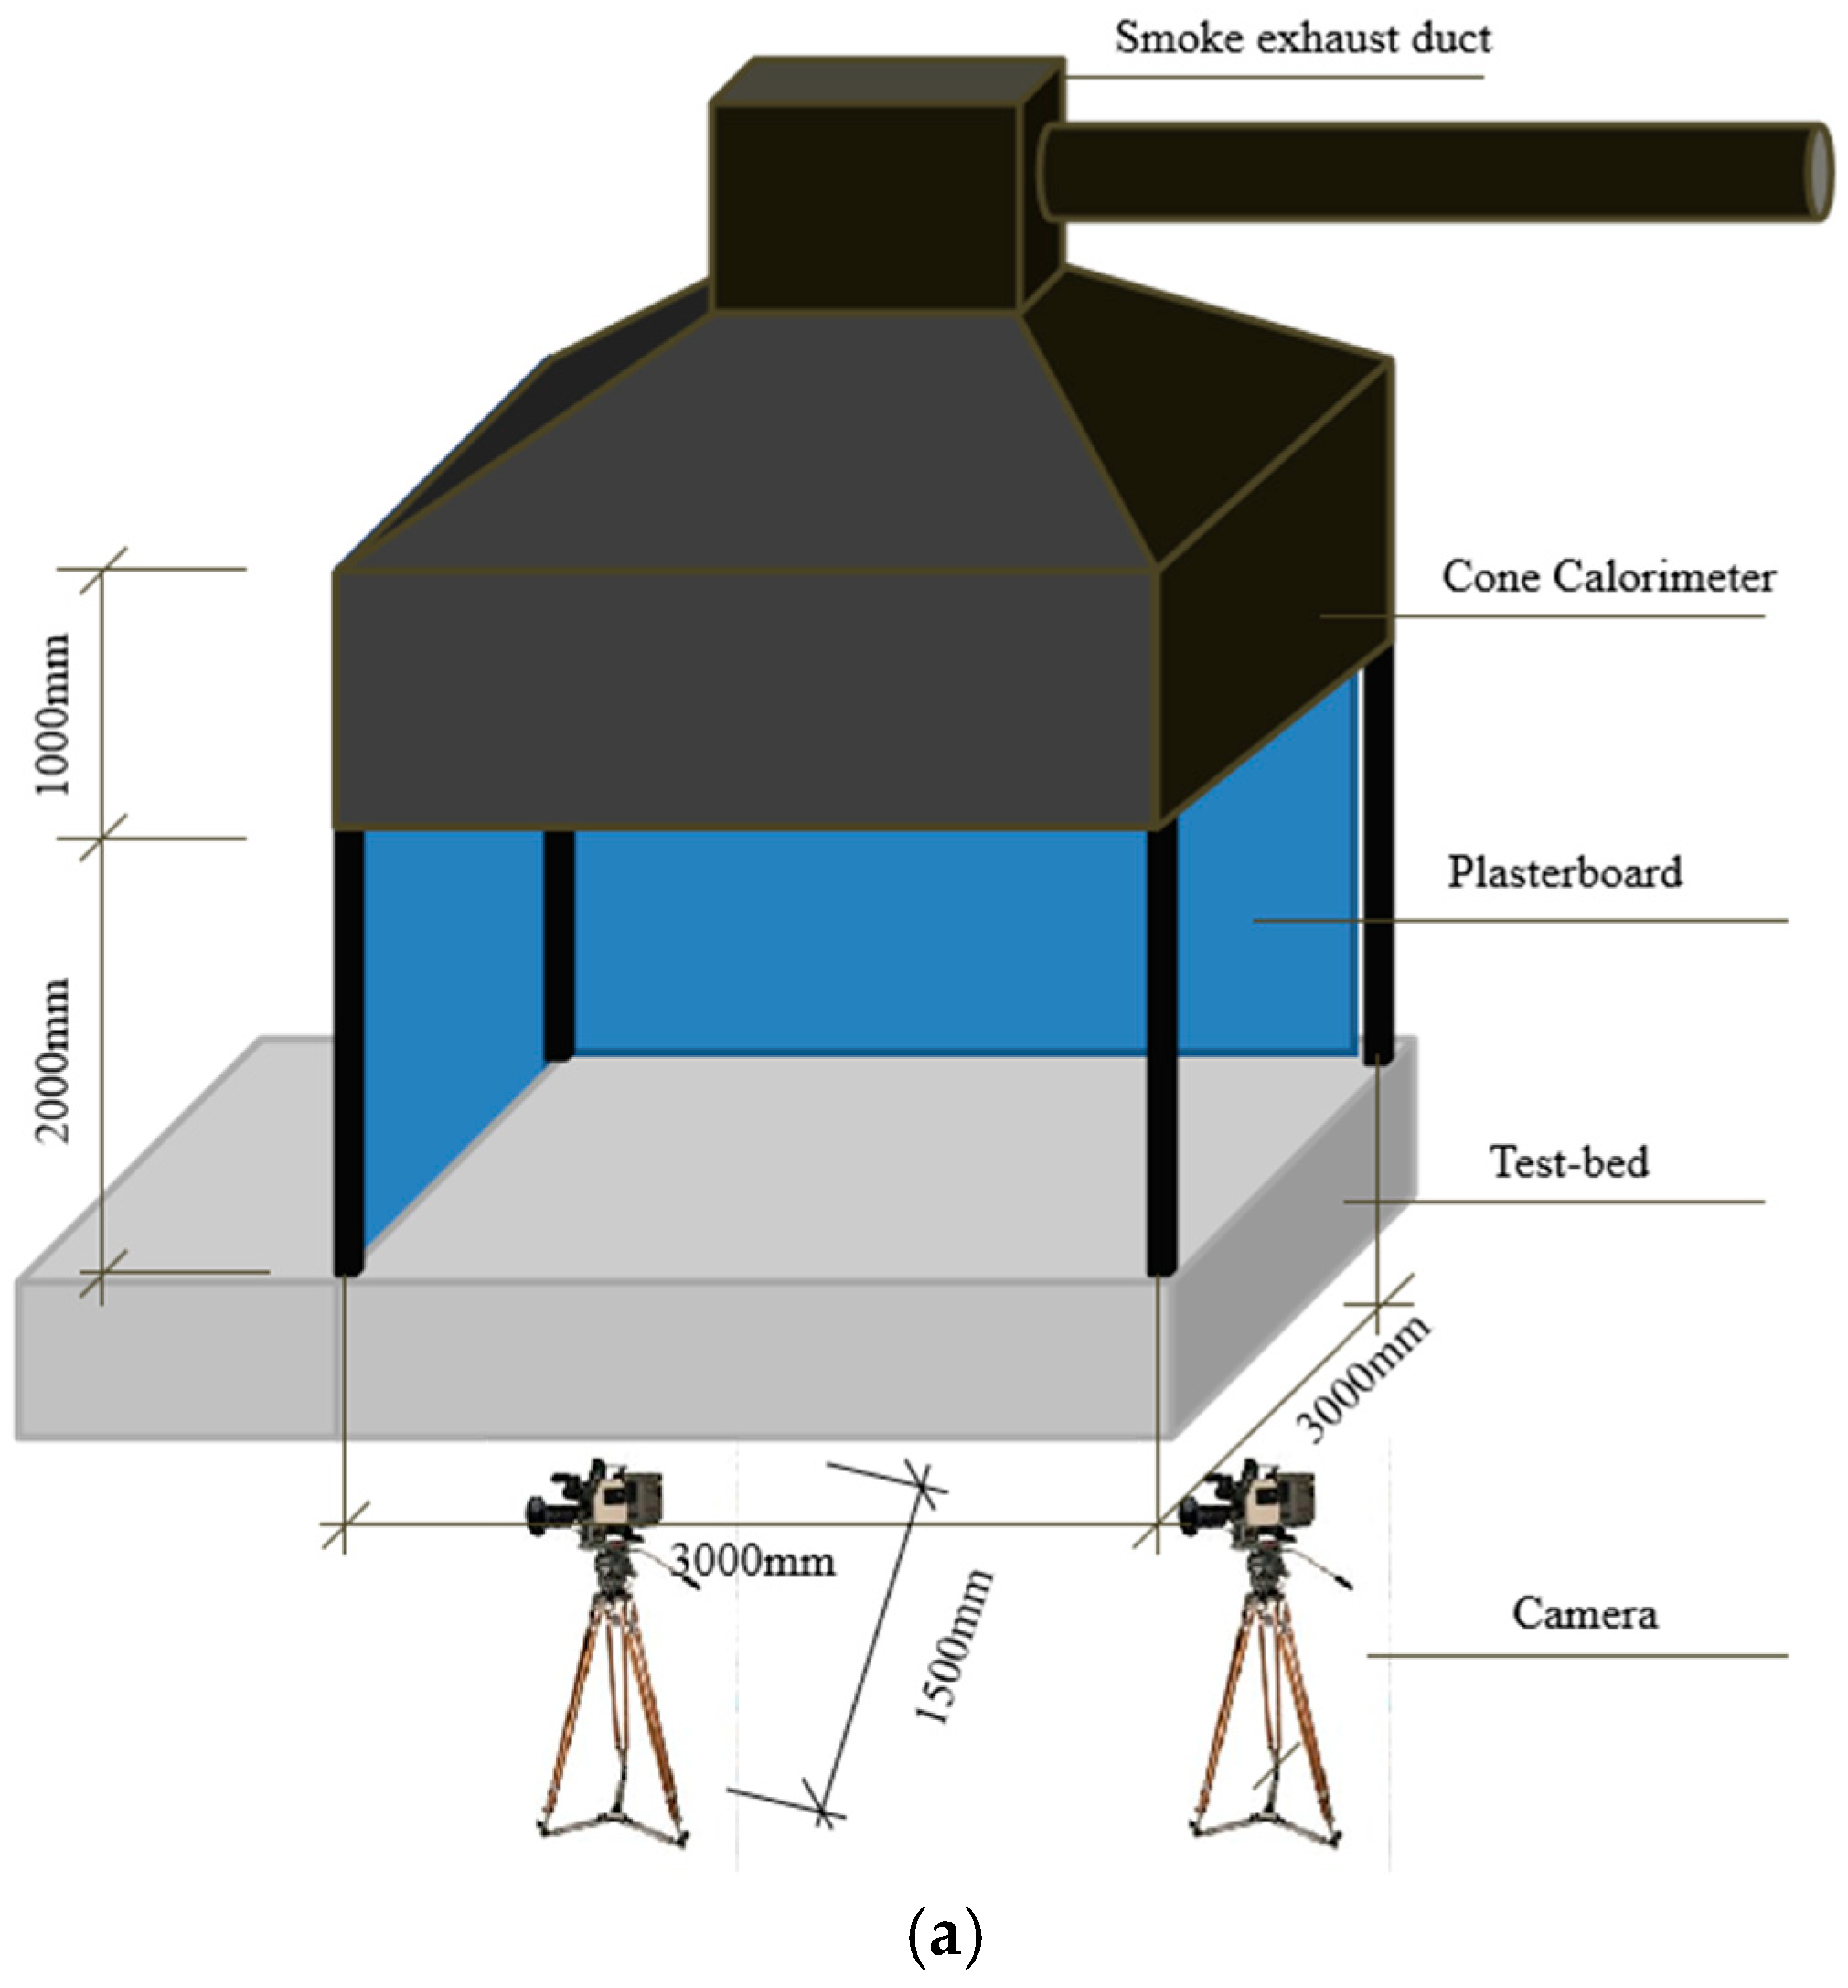
2.2.1. Cone Calorimeter Test Arrangement
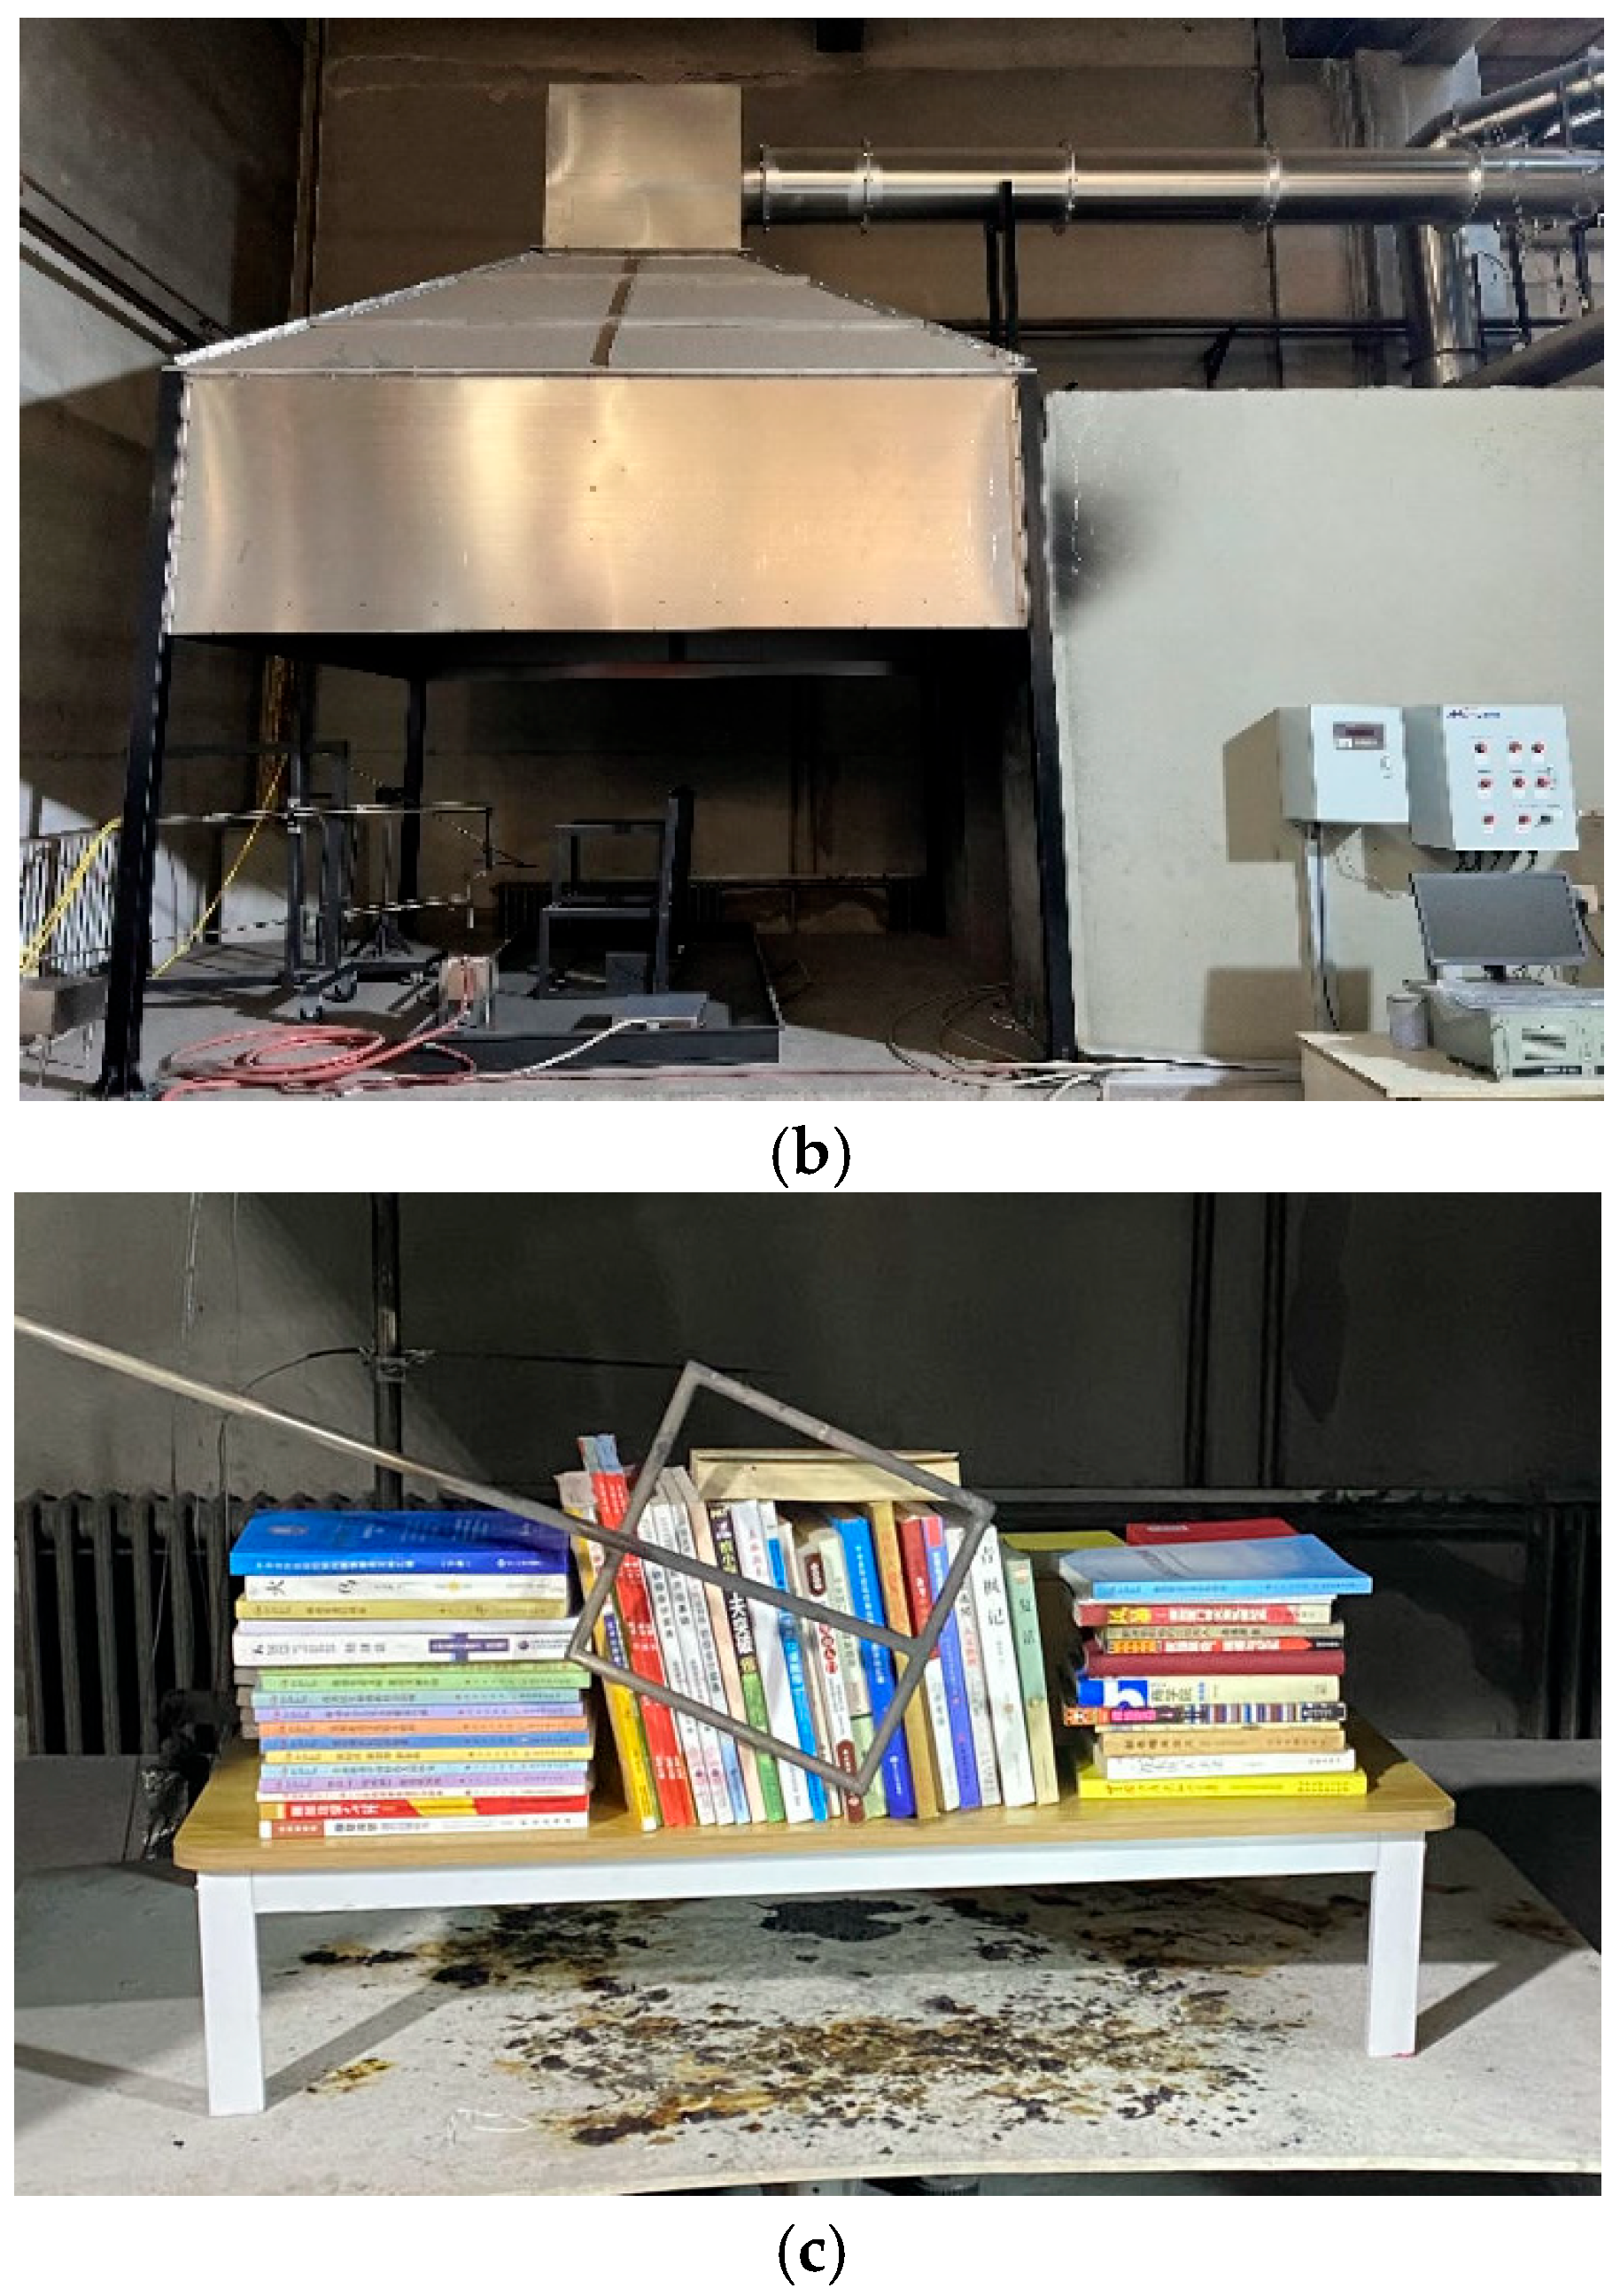
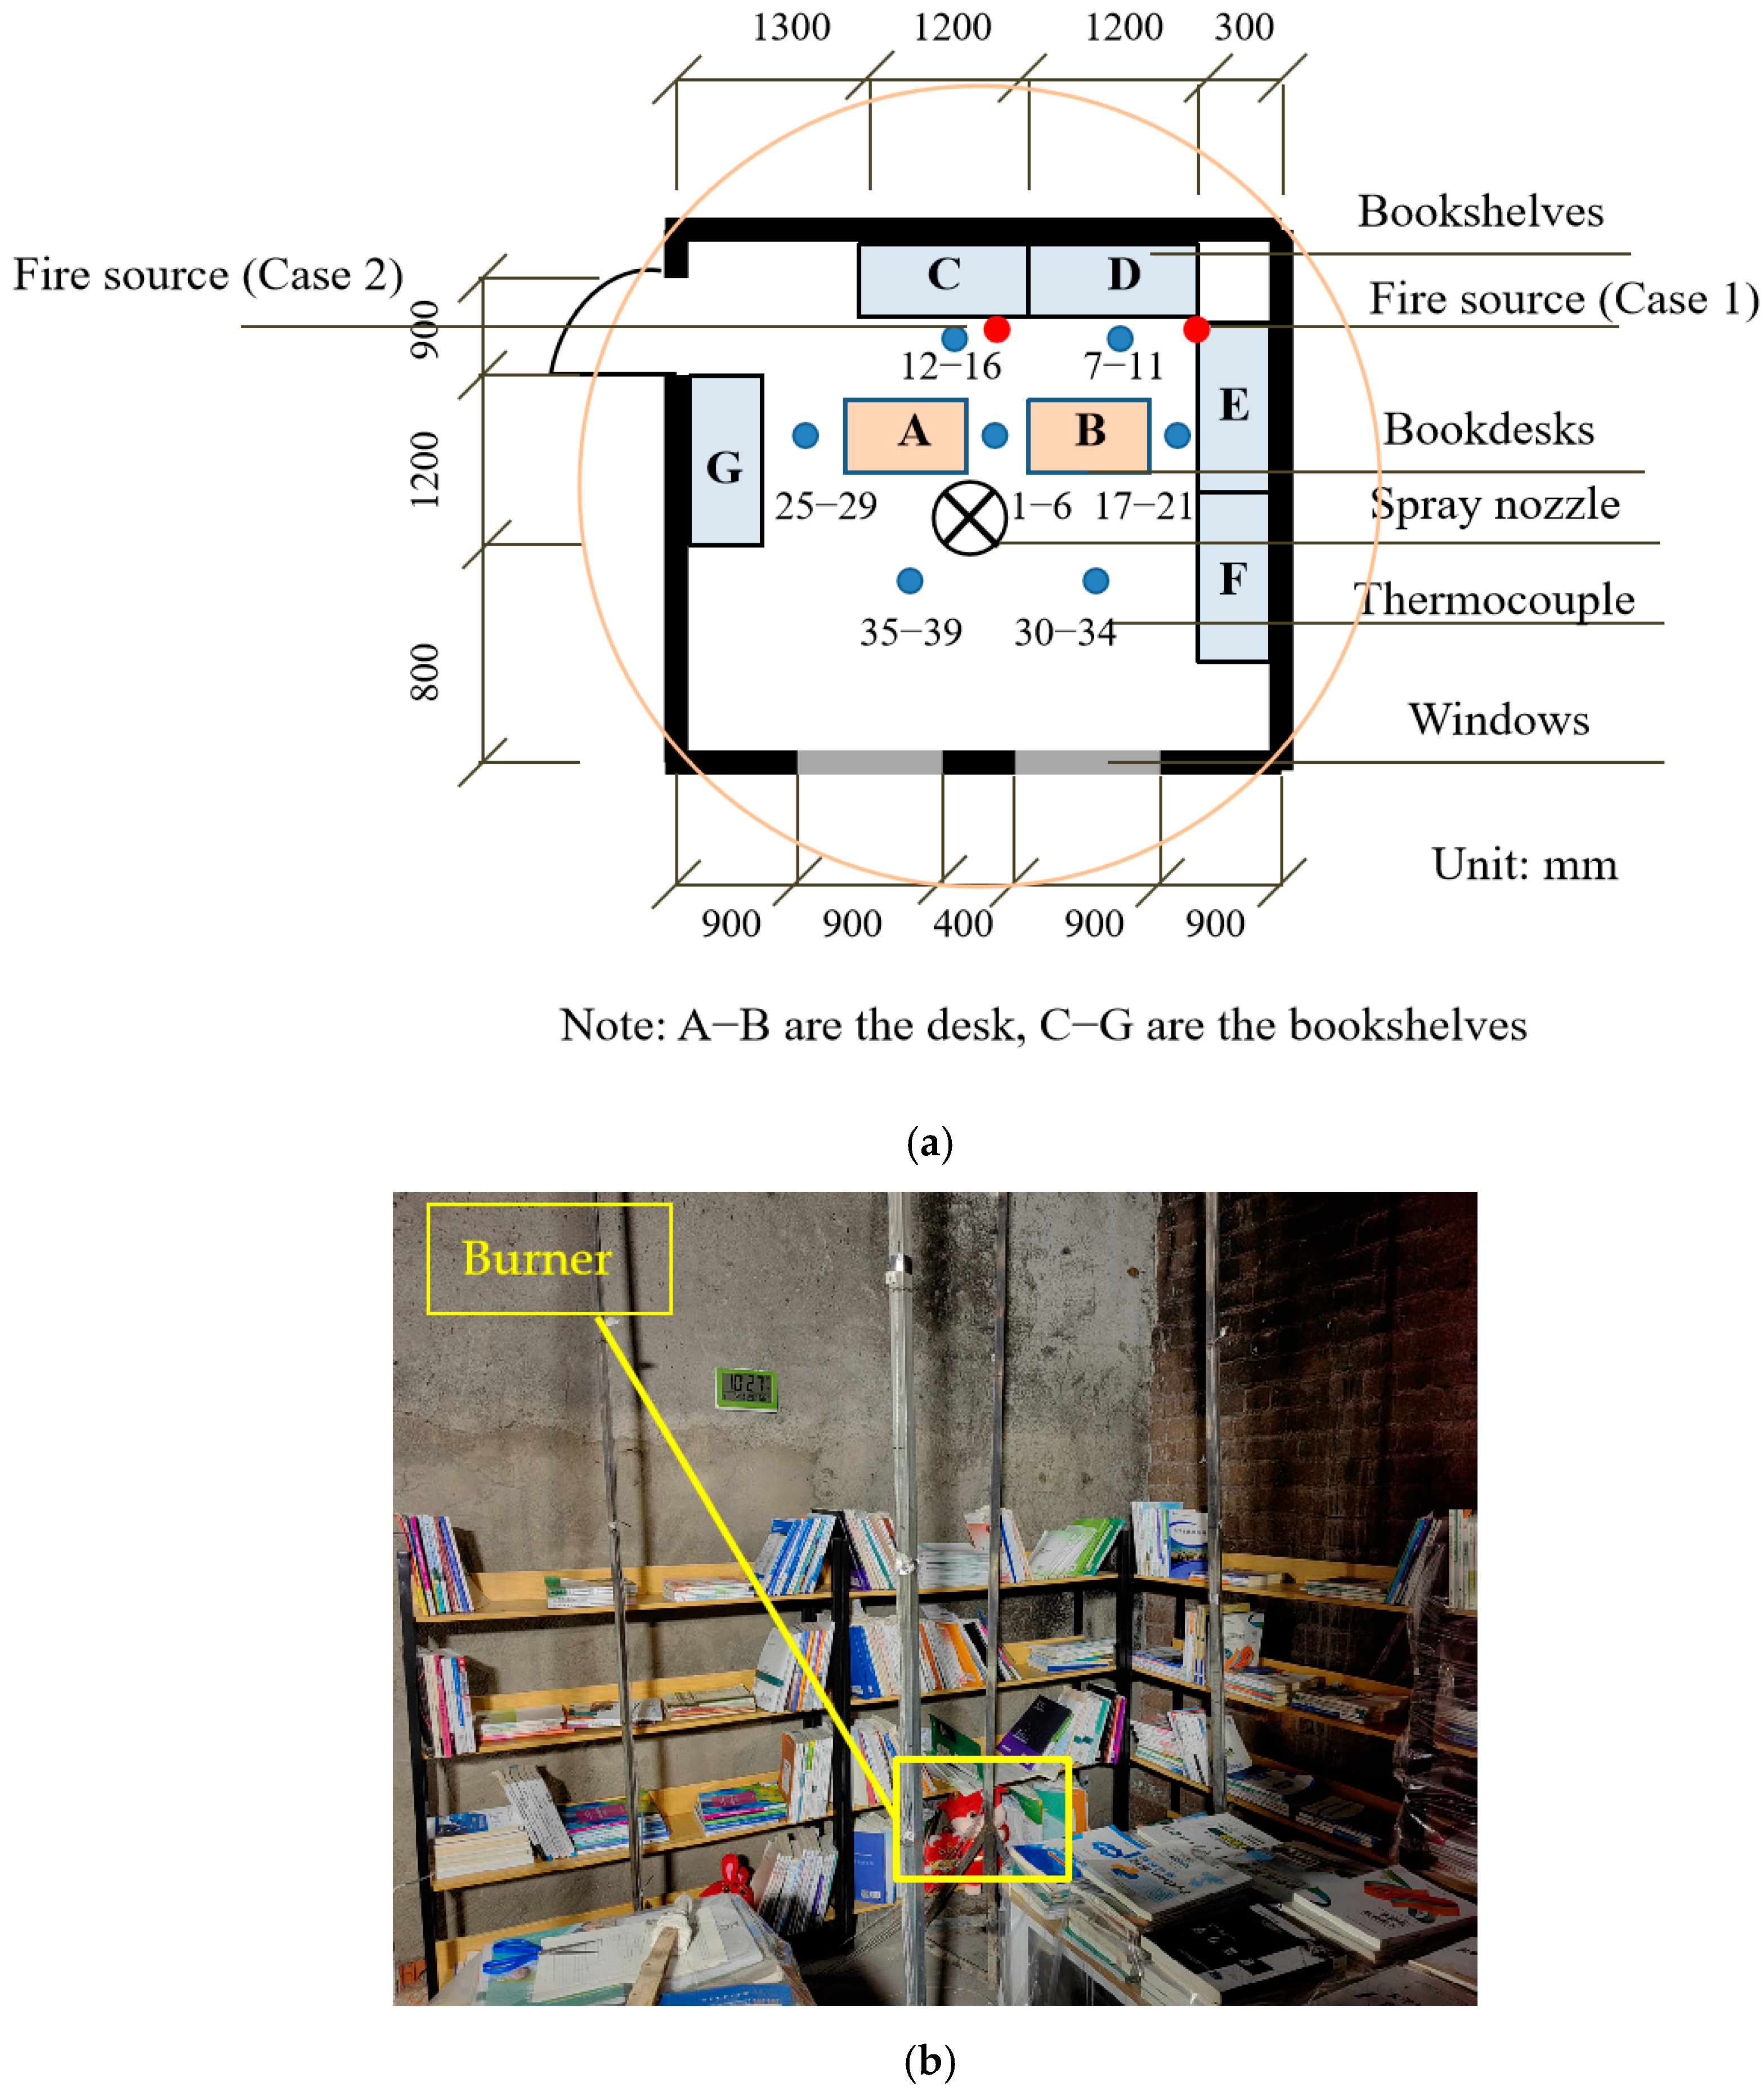
2.2.2. Physical Combustion Experiment Arrangement
2.3. Simulation Methods
2.3.1. FDS Model
2.3.2. Grid Size
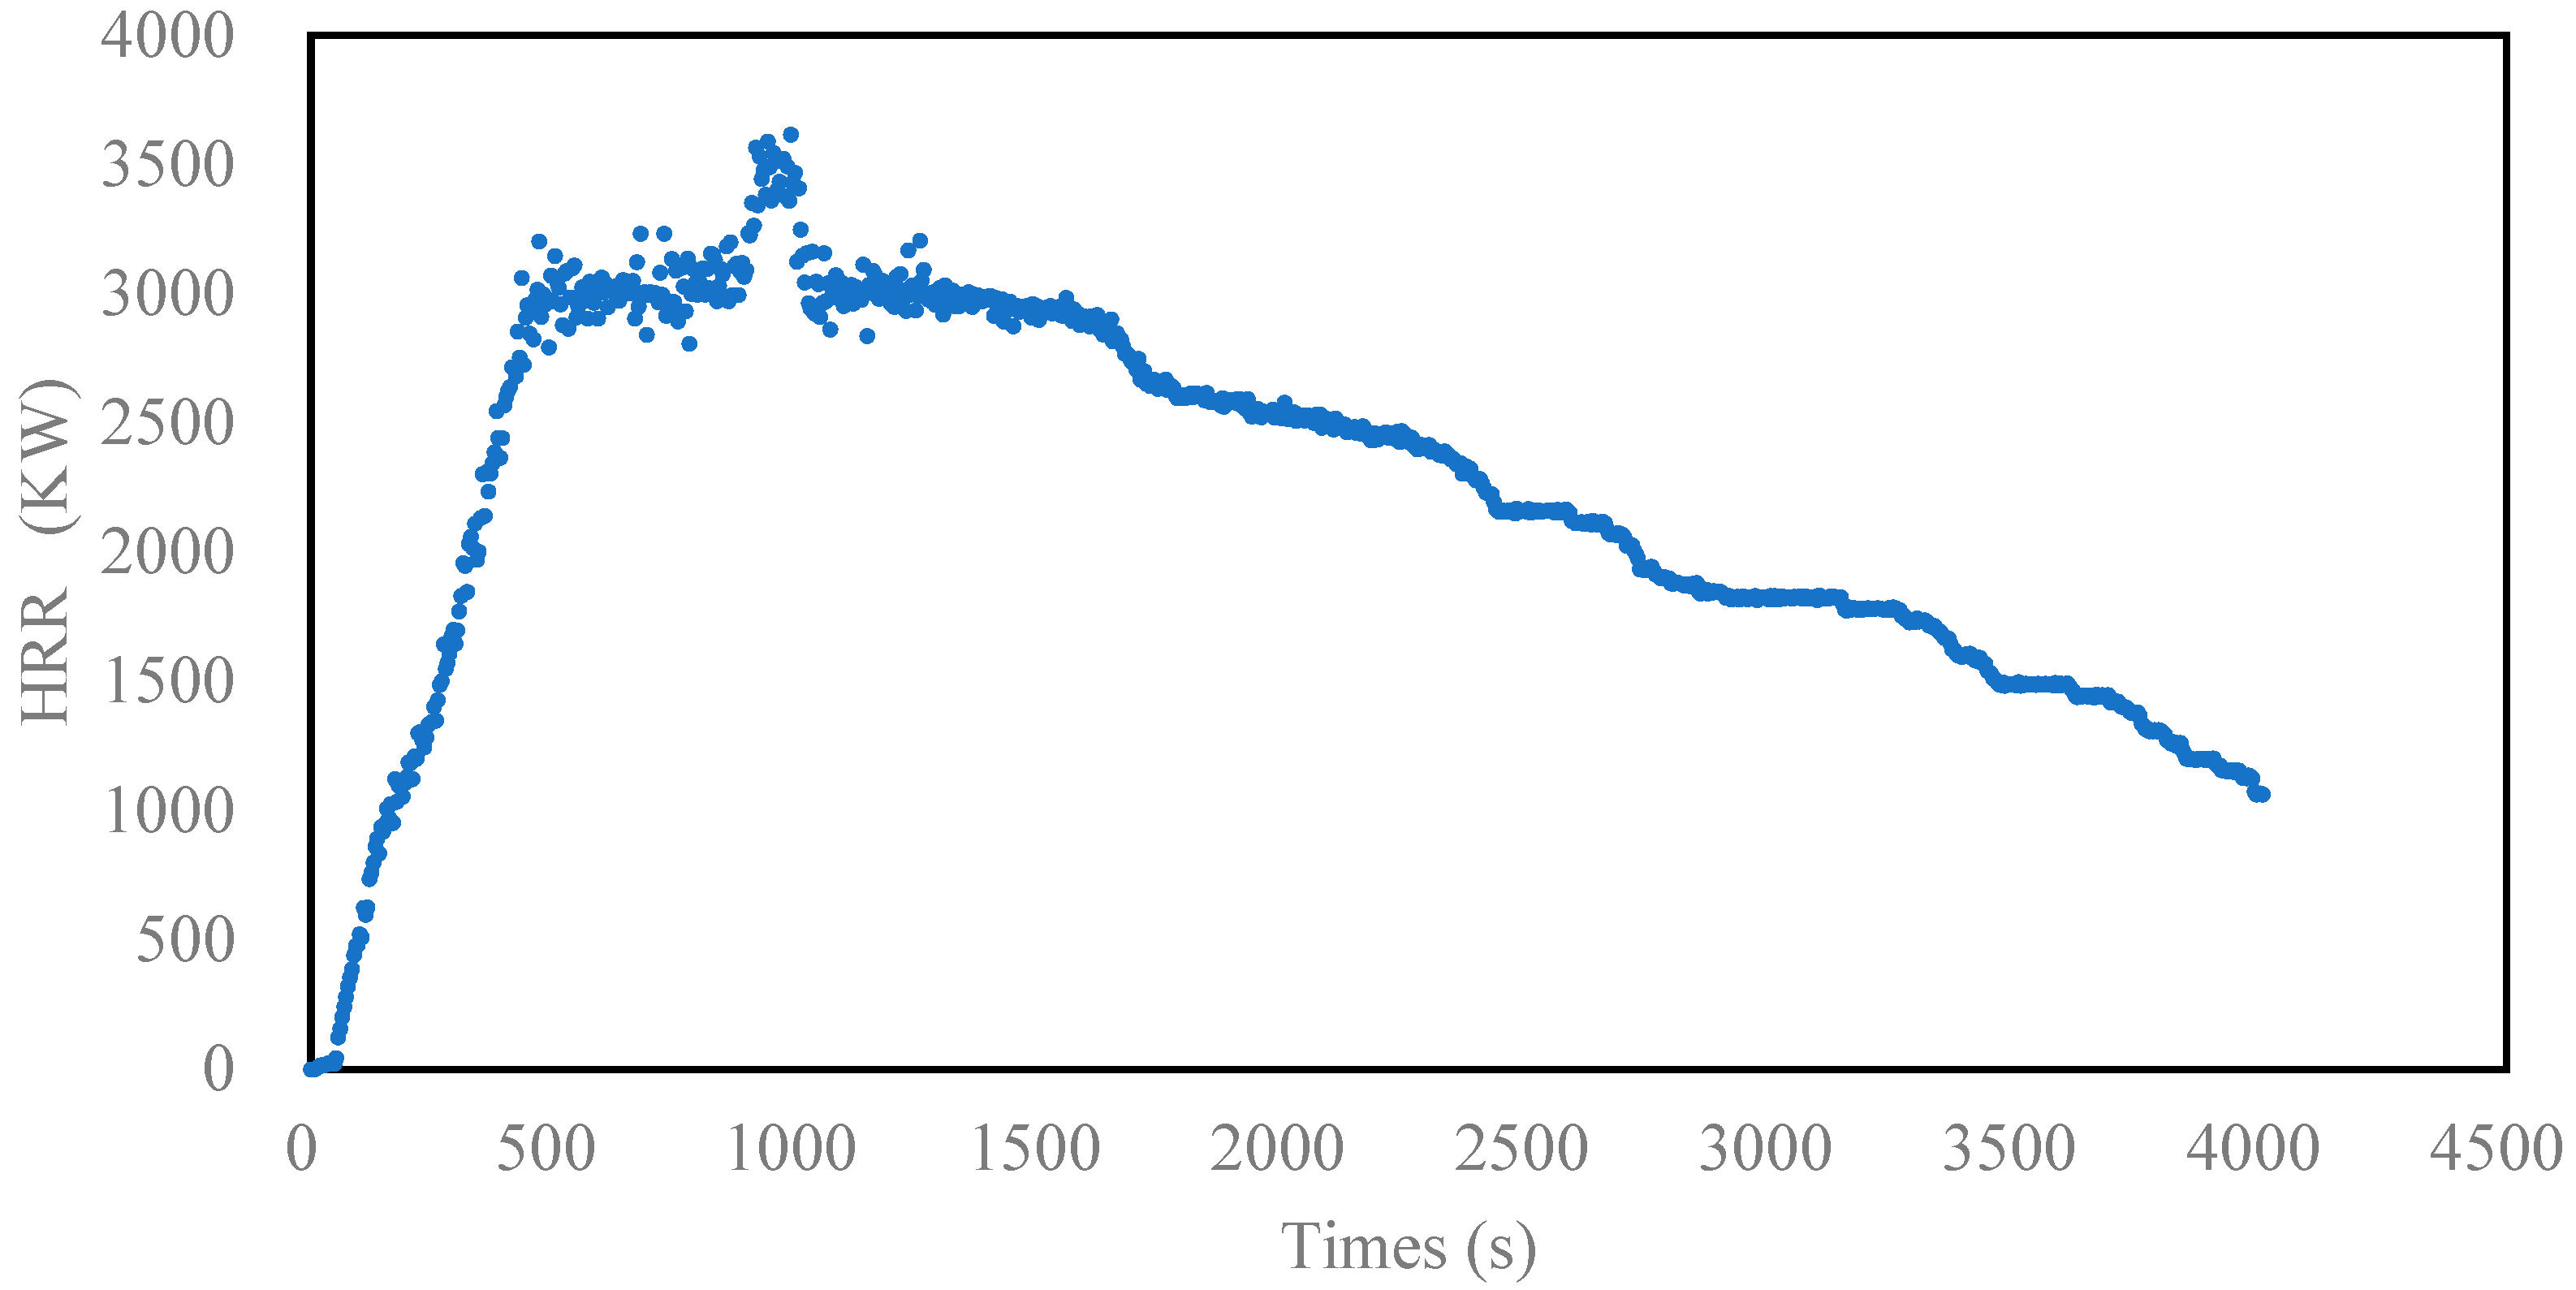
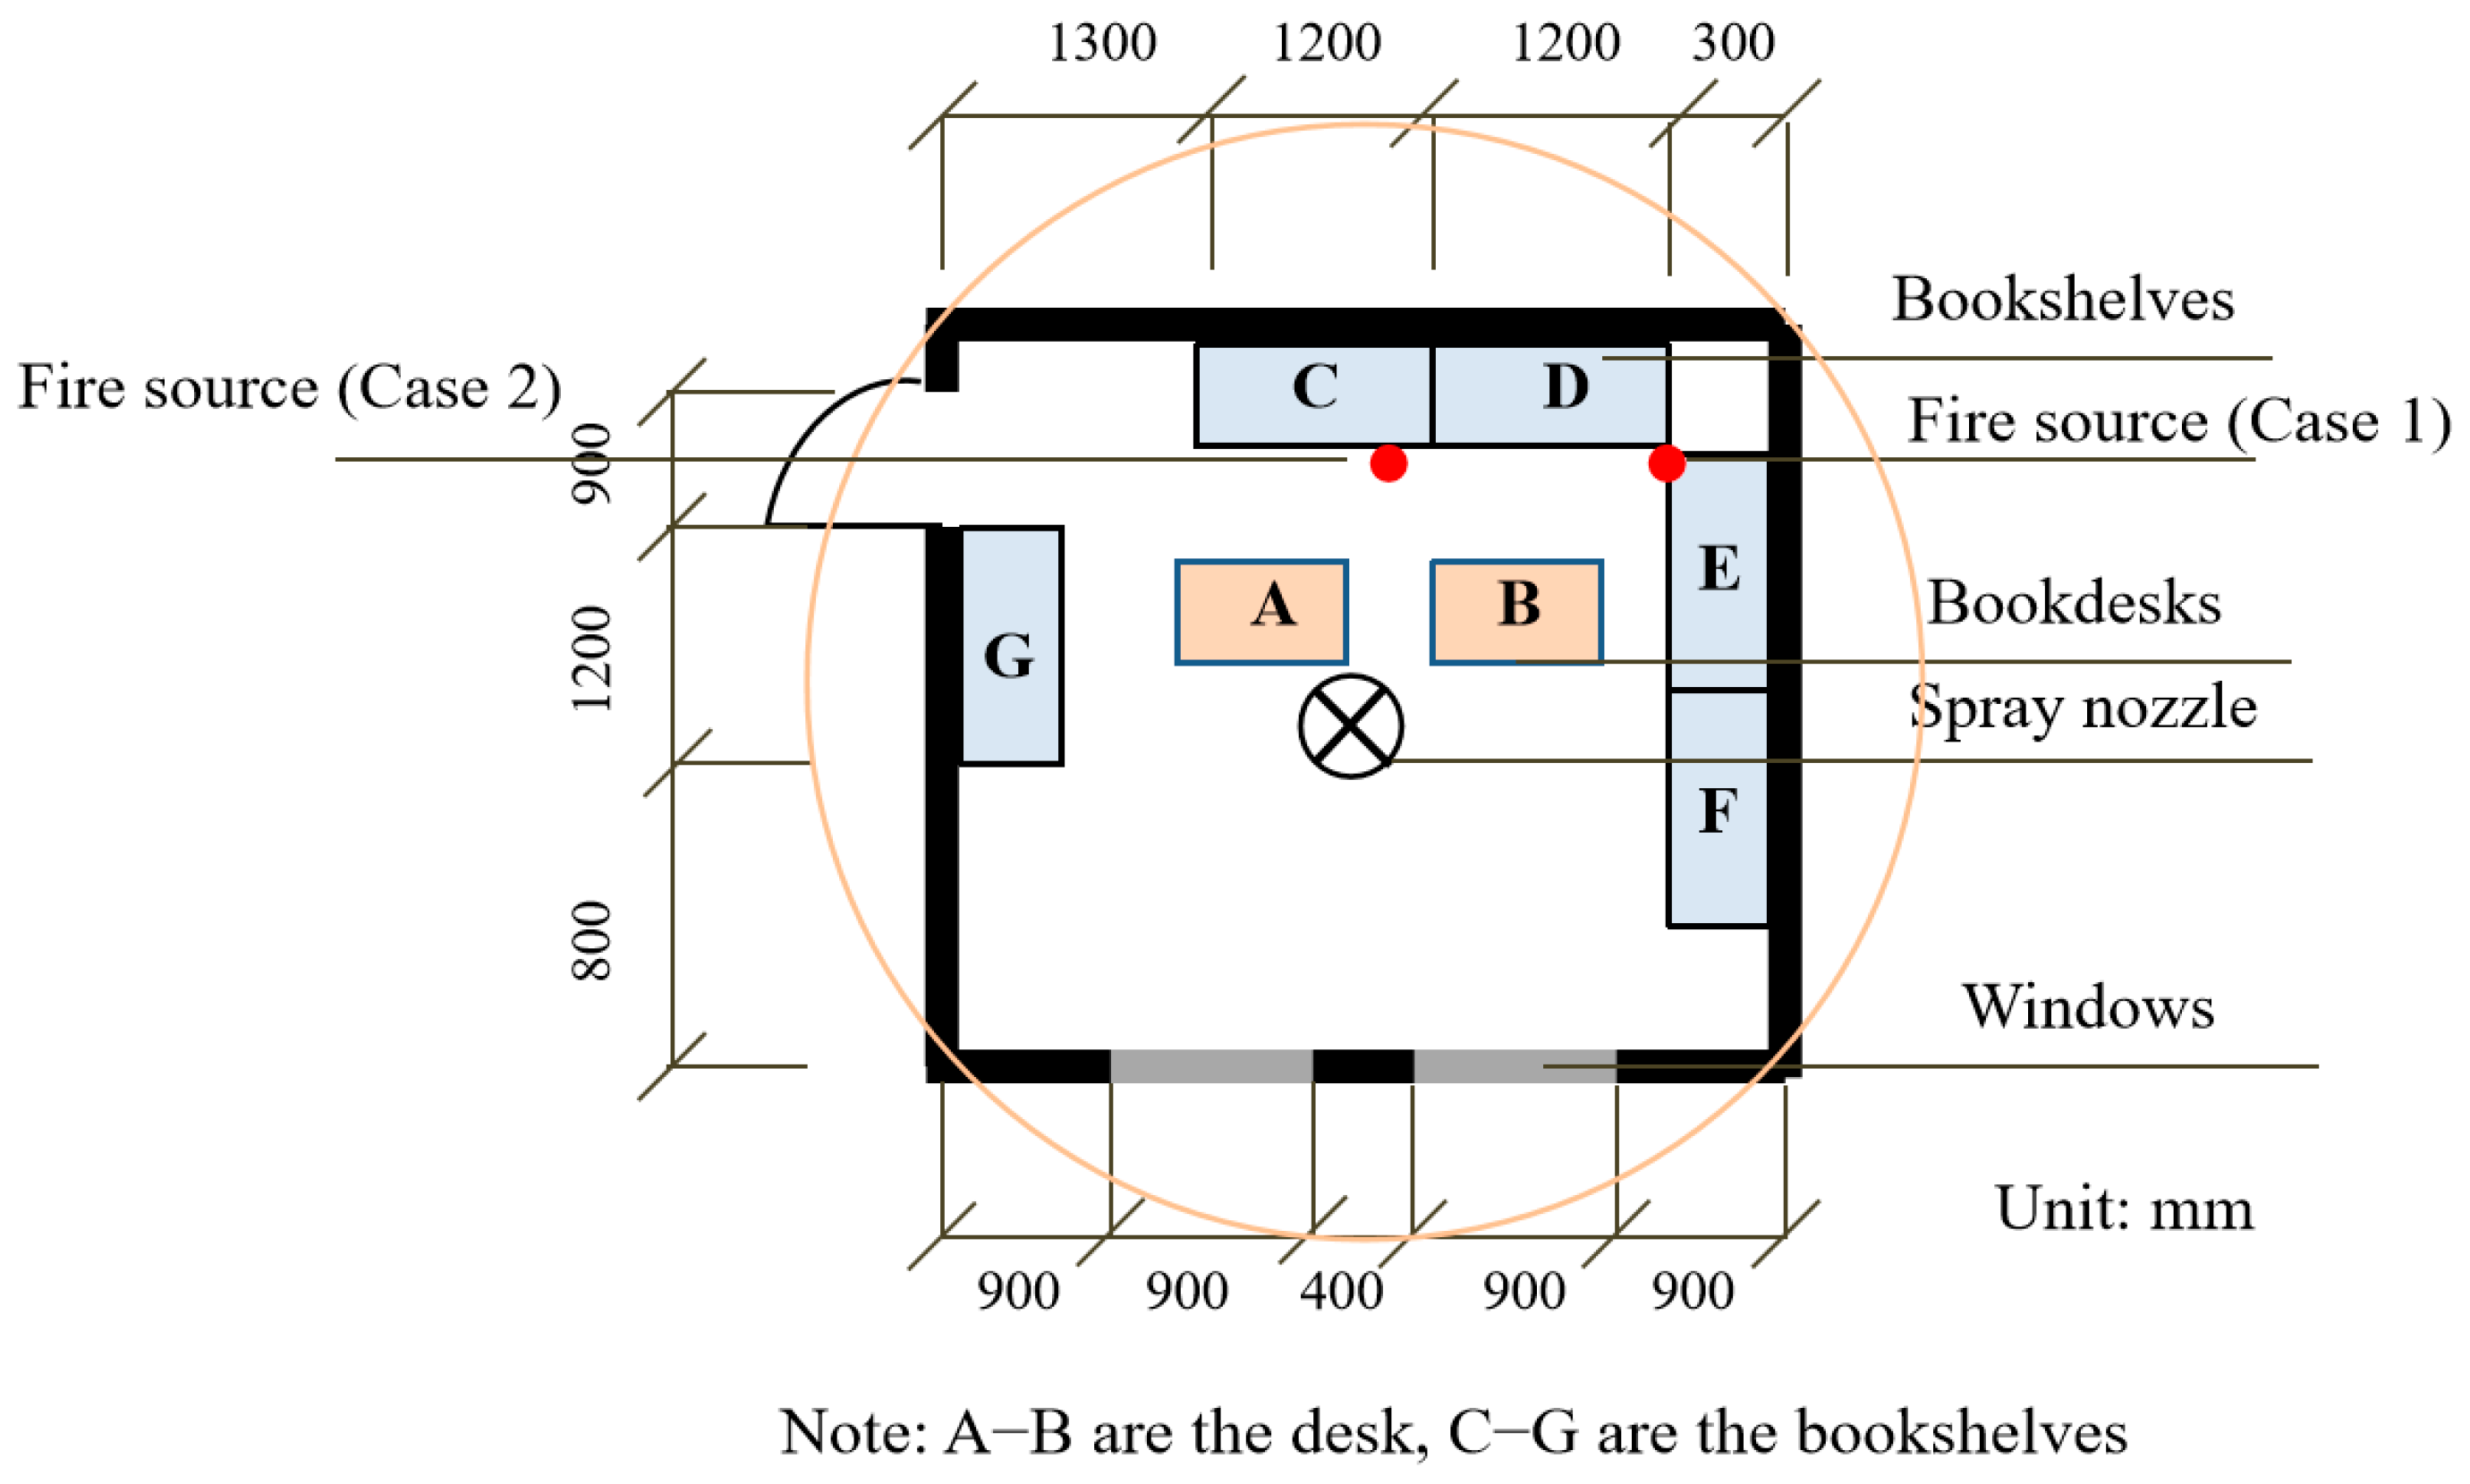
2.3.3. Fire Source Setup
2.3.4. Sprinkler System
2.3.5. Measurement Point Arrangement
3. Experiments and Simulations
3.1. Investigation Results
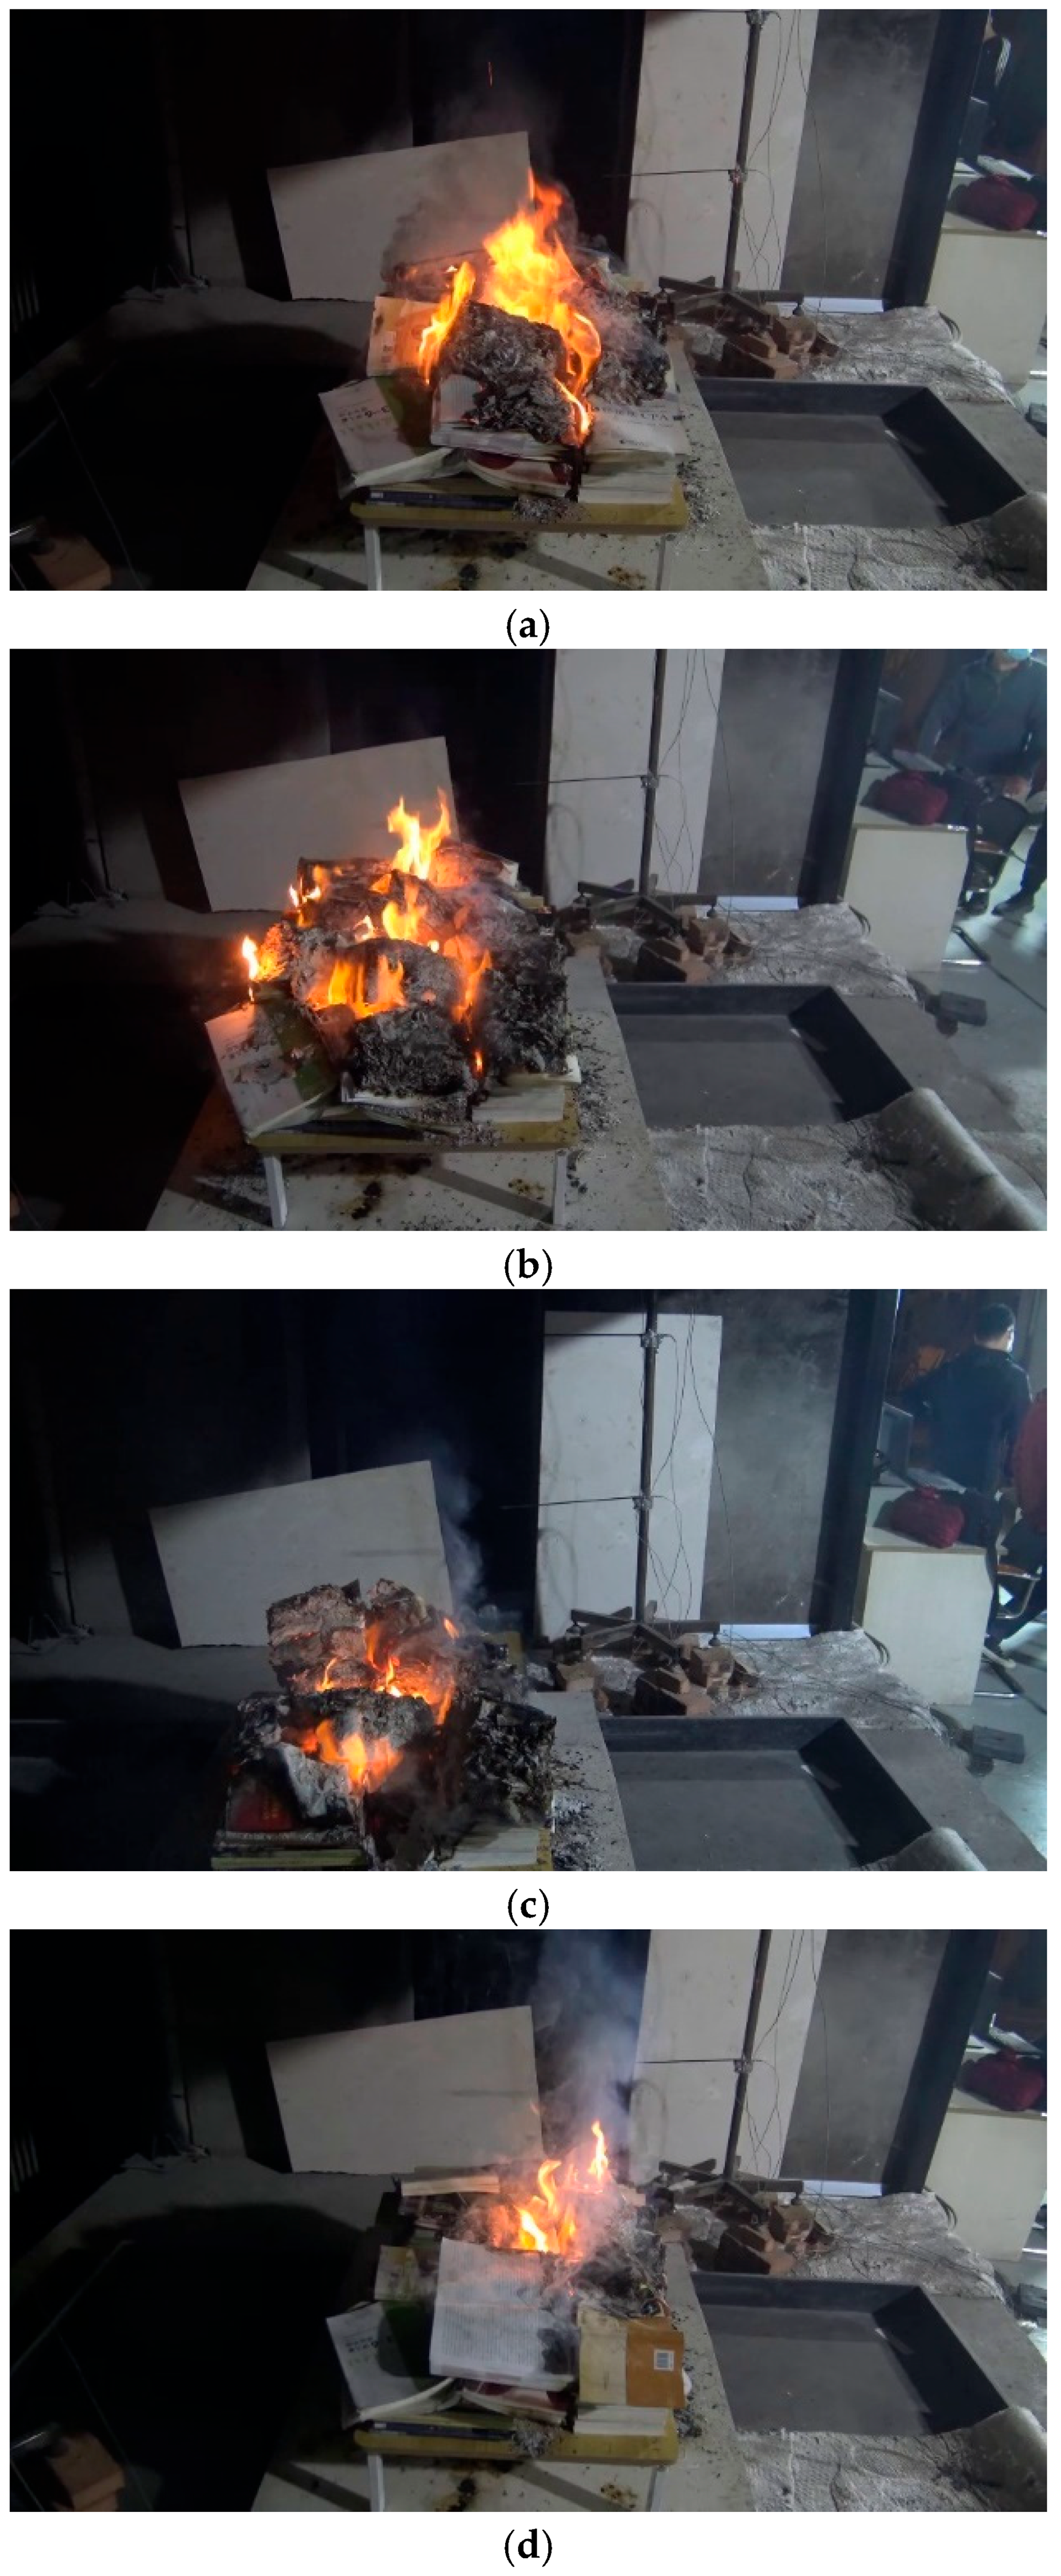
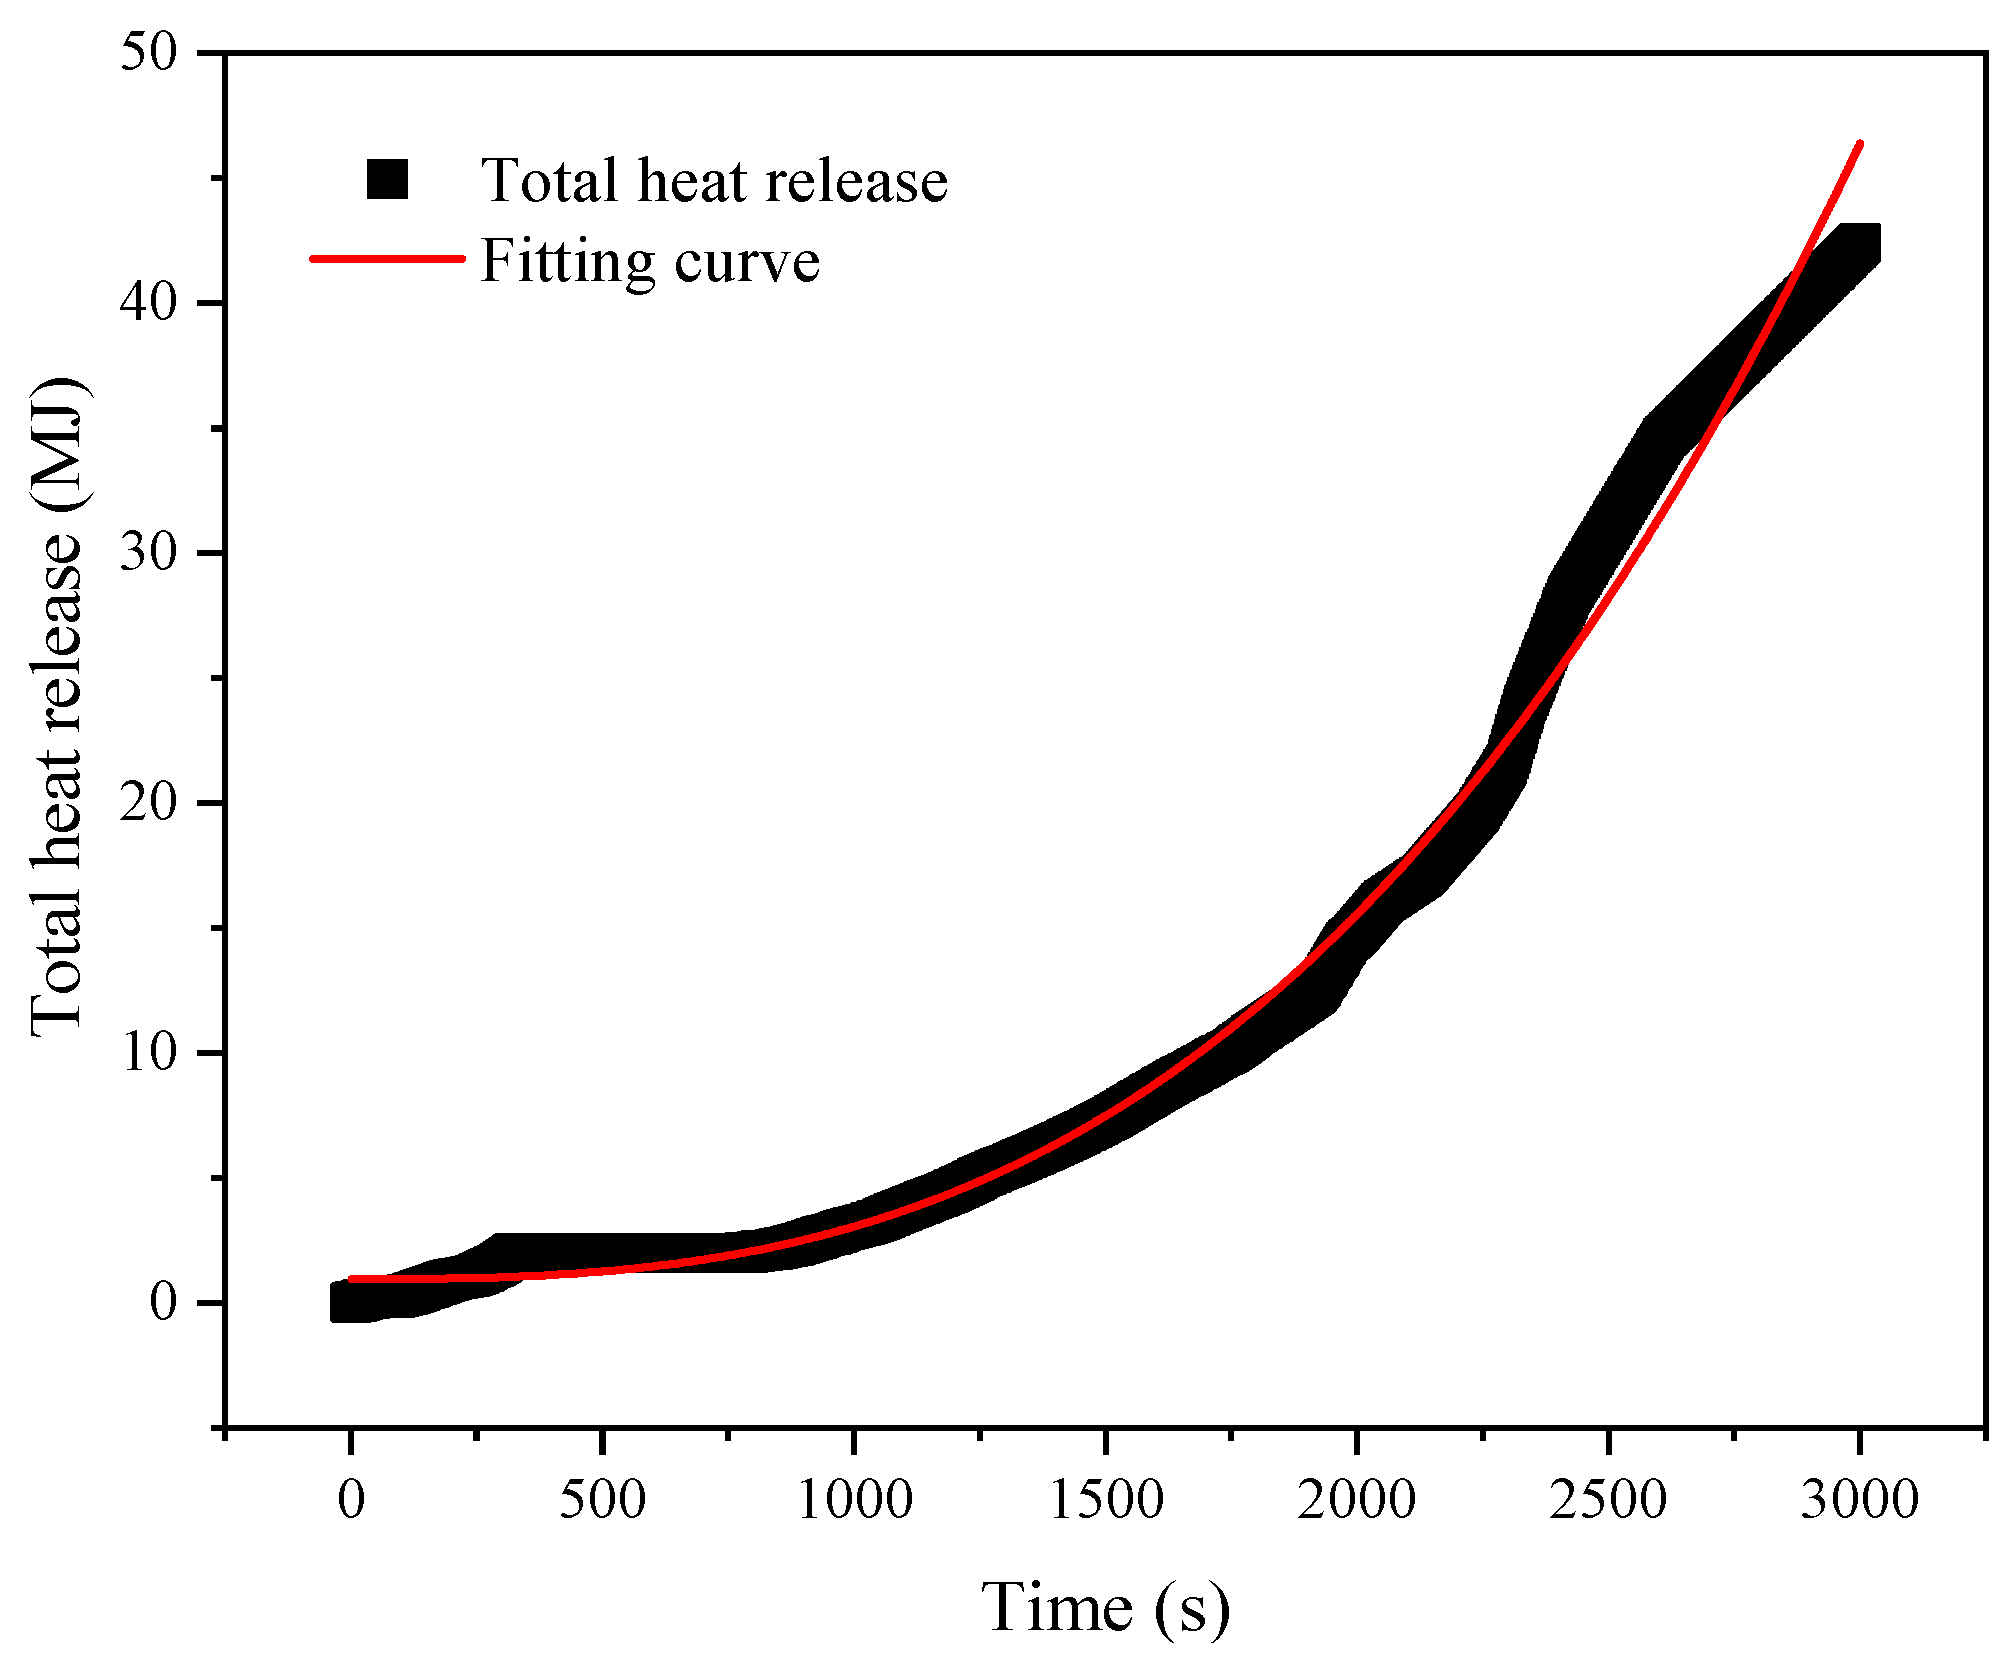
3.2. Book and Desk Combustion Test
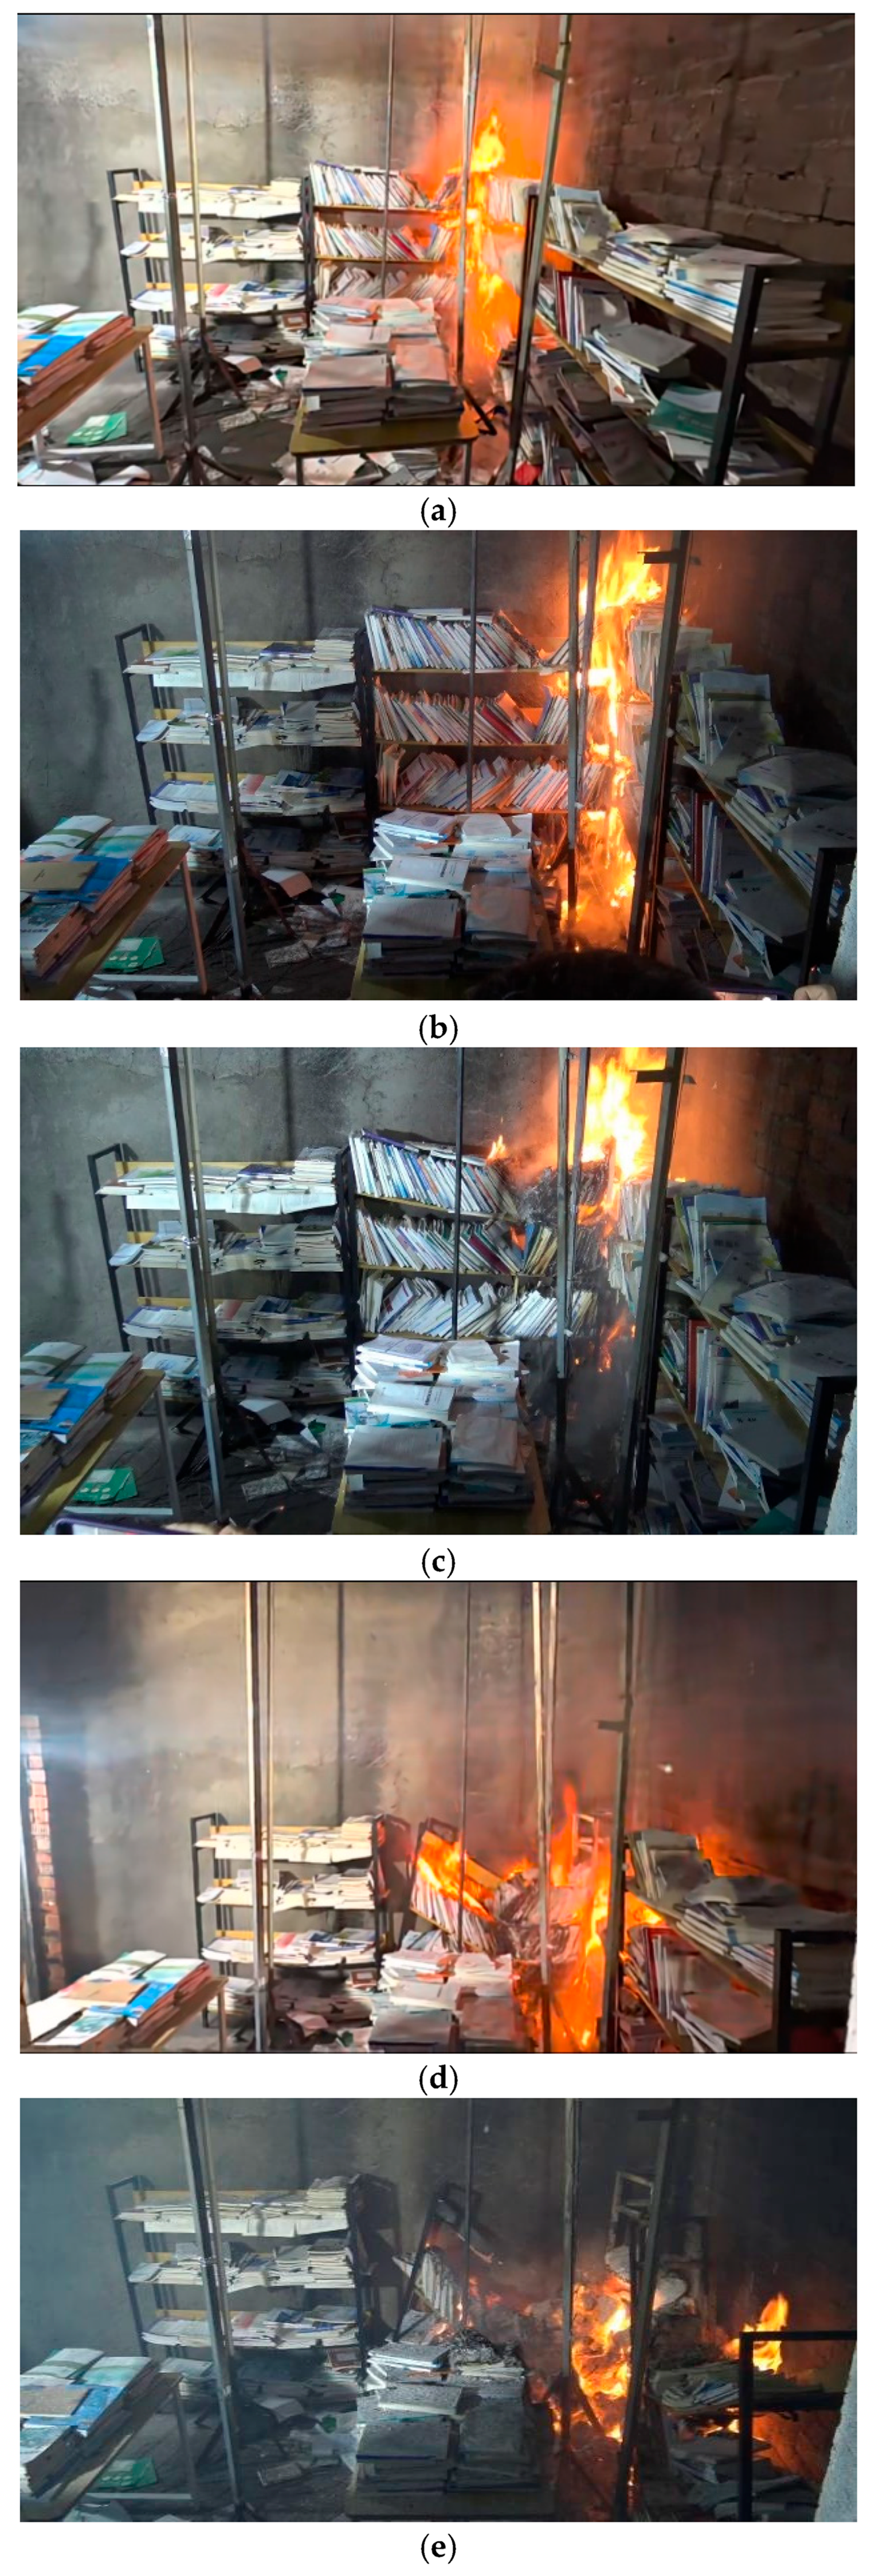
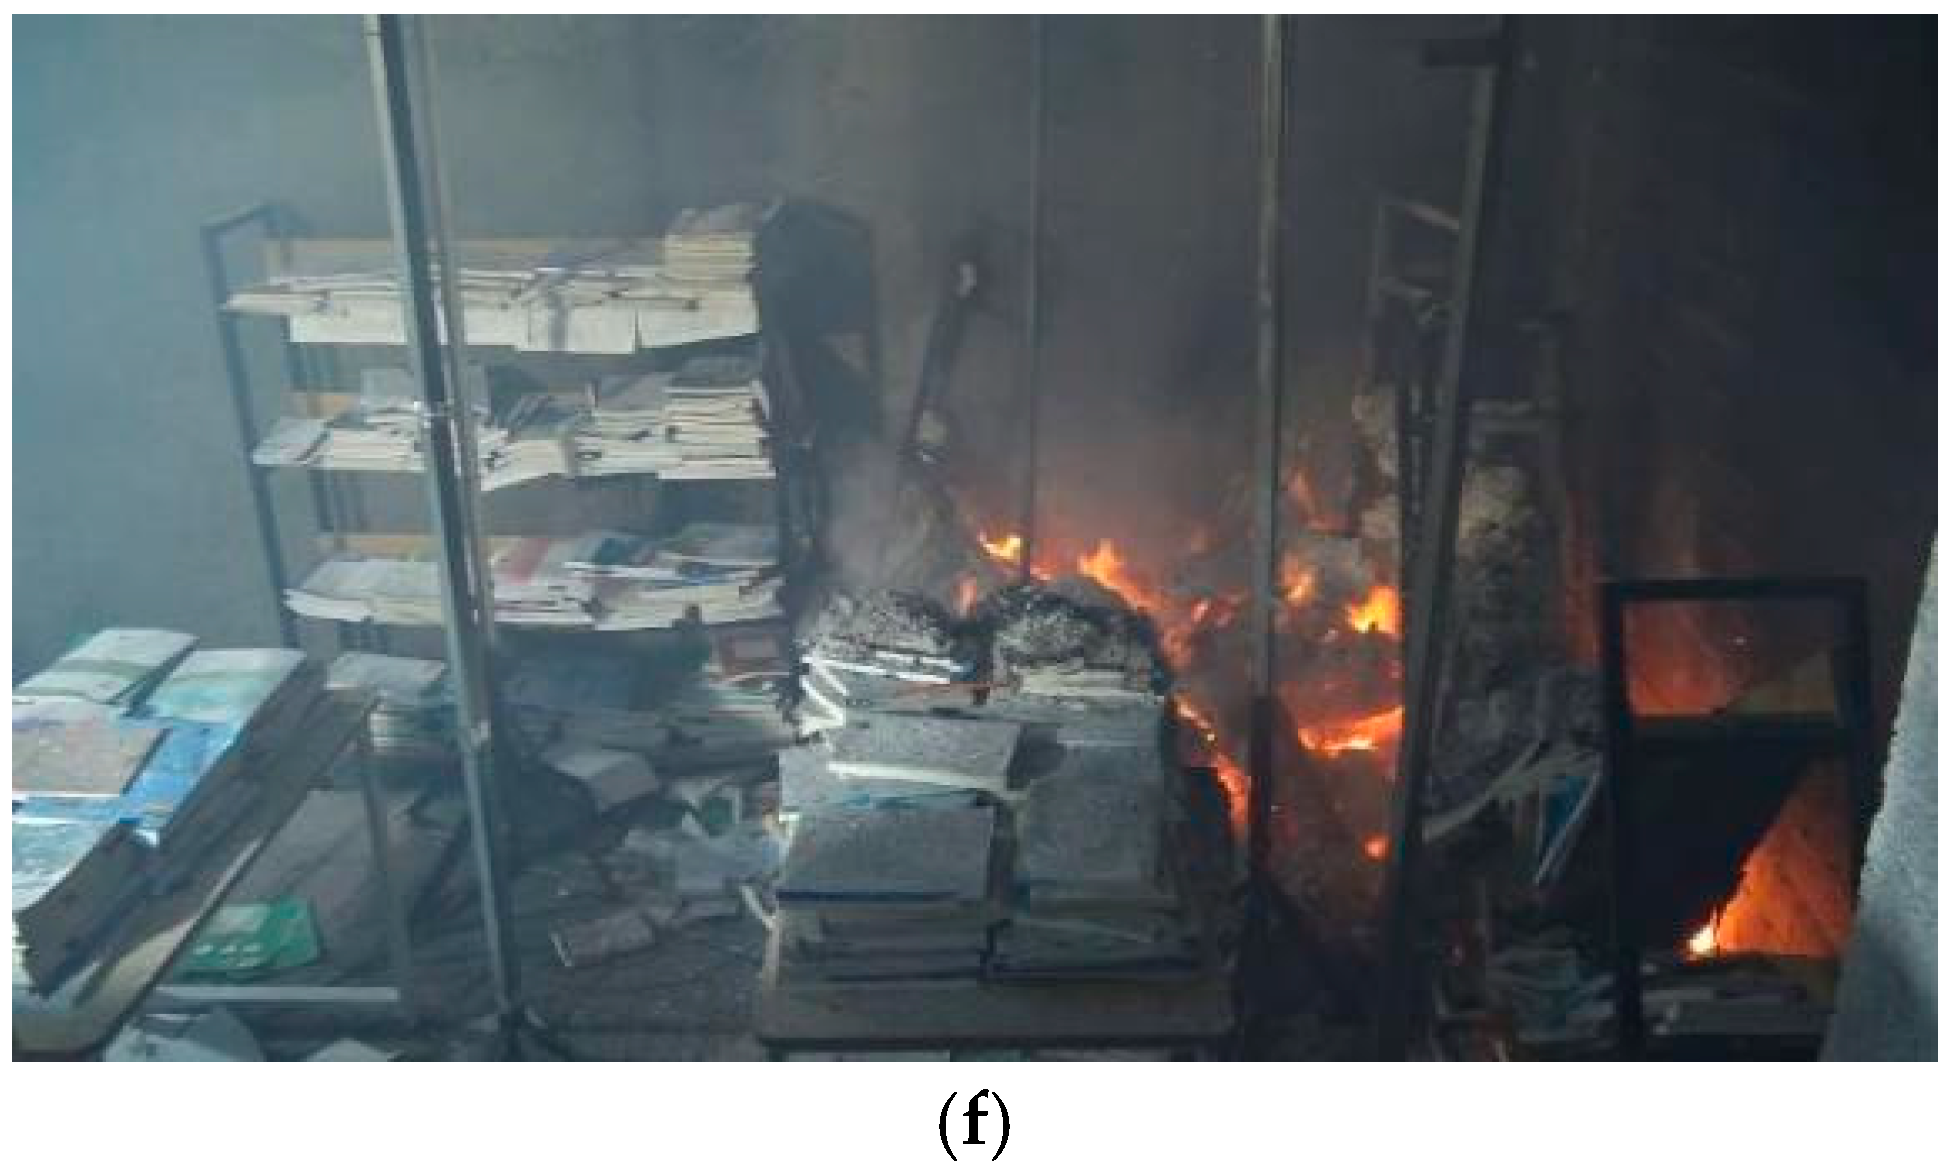
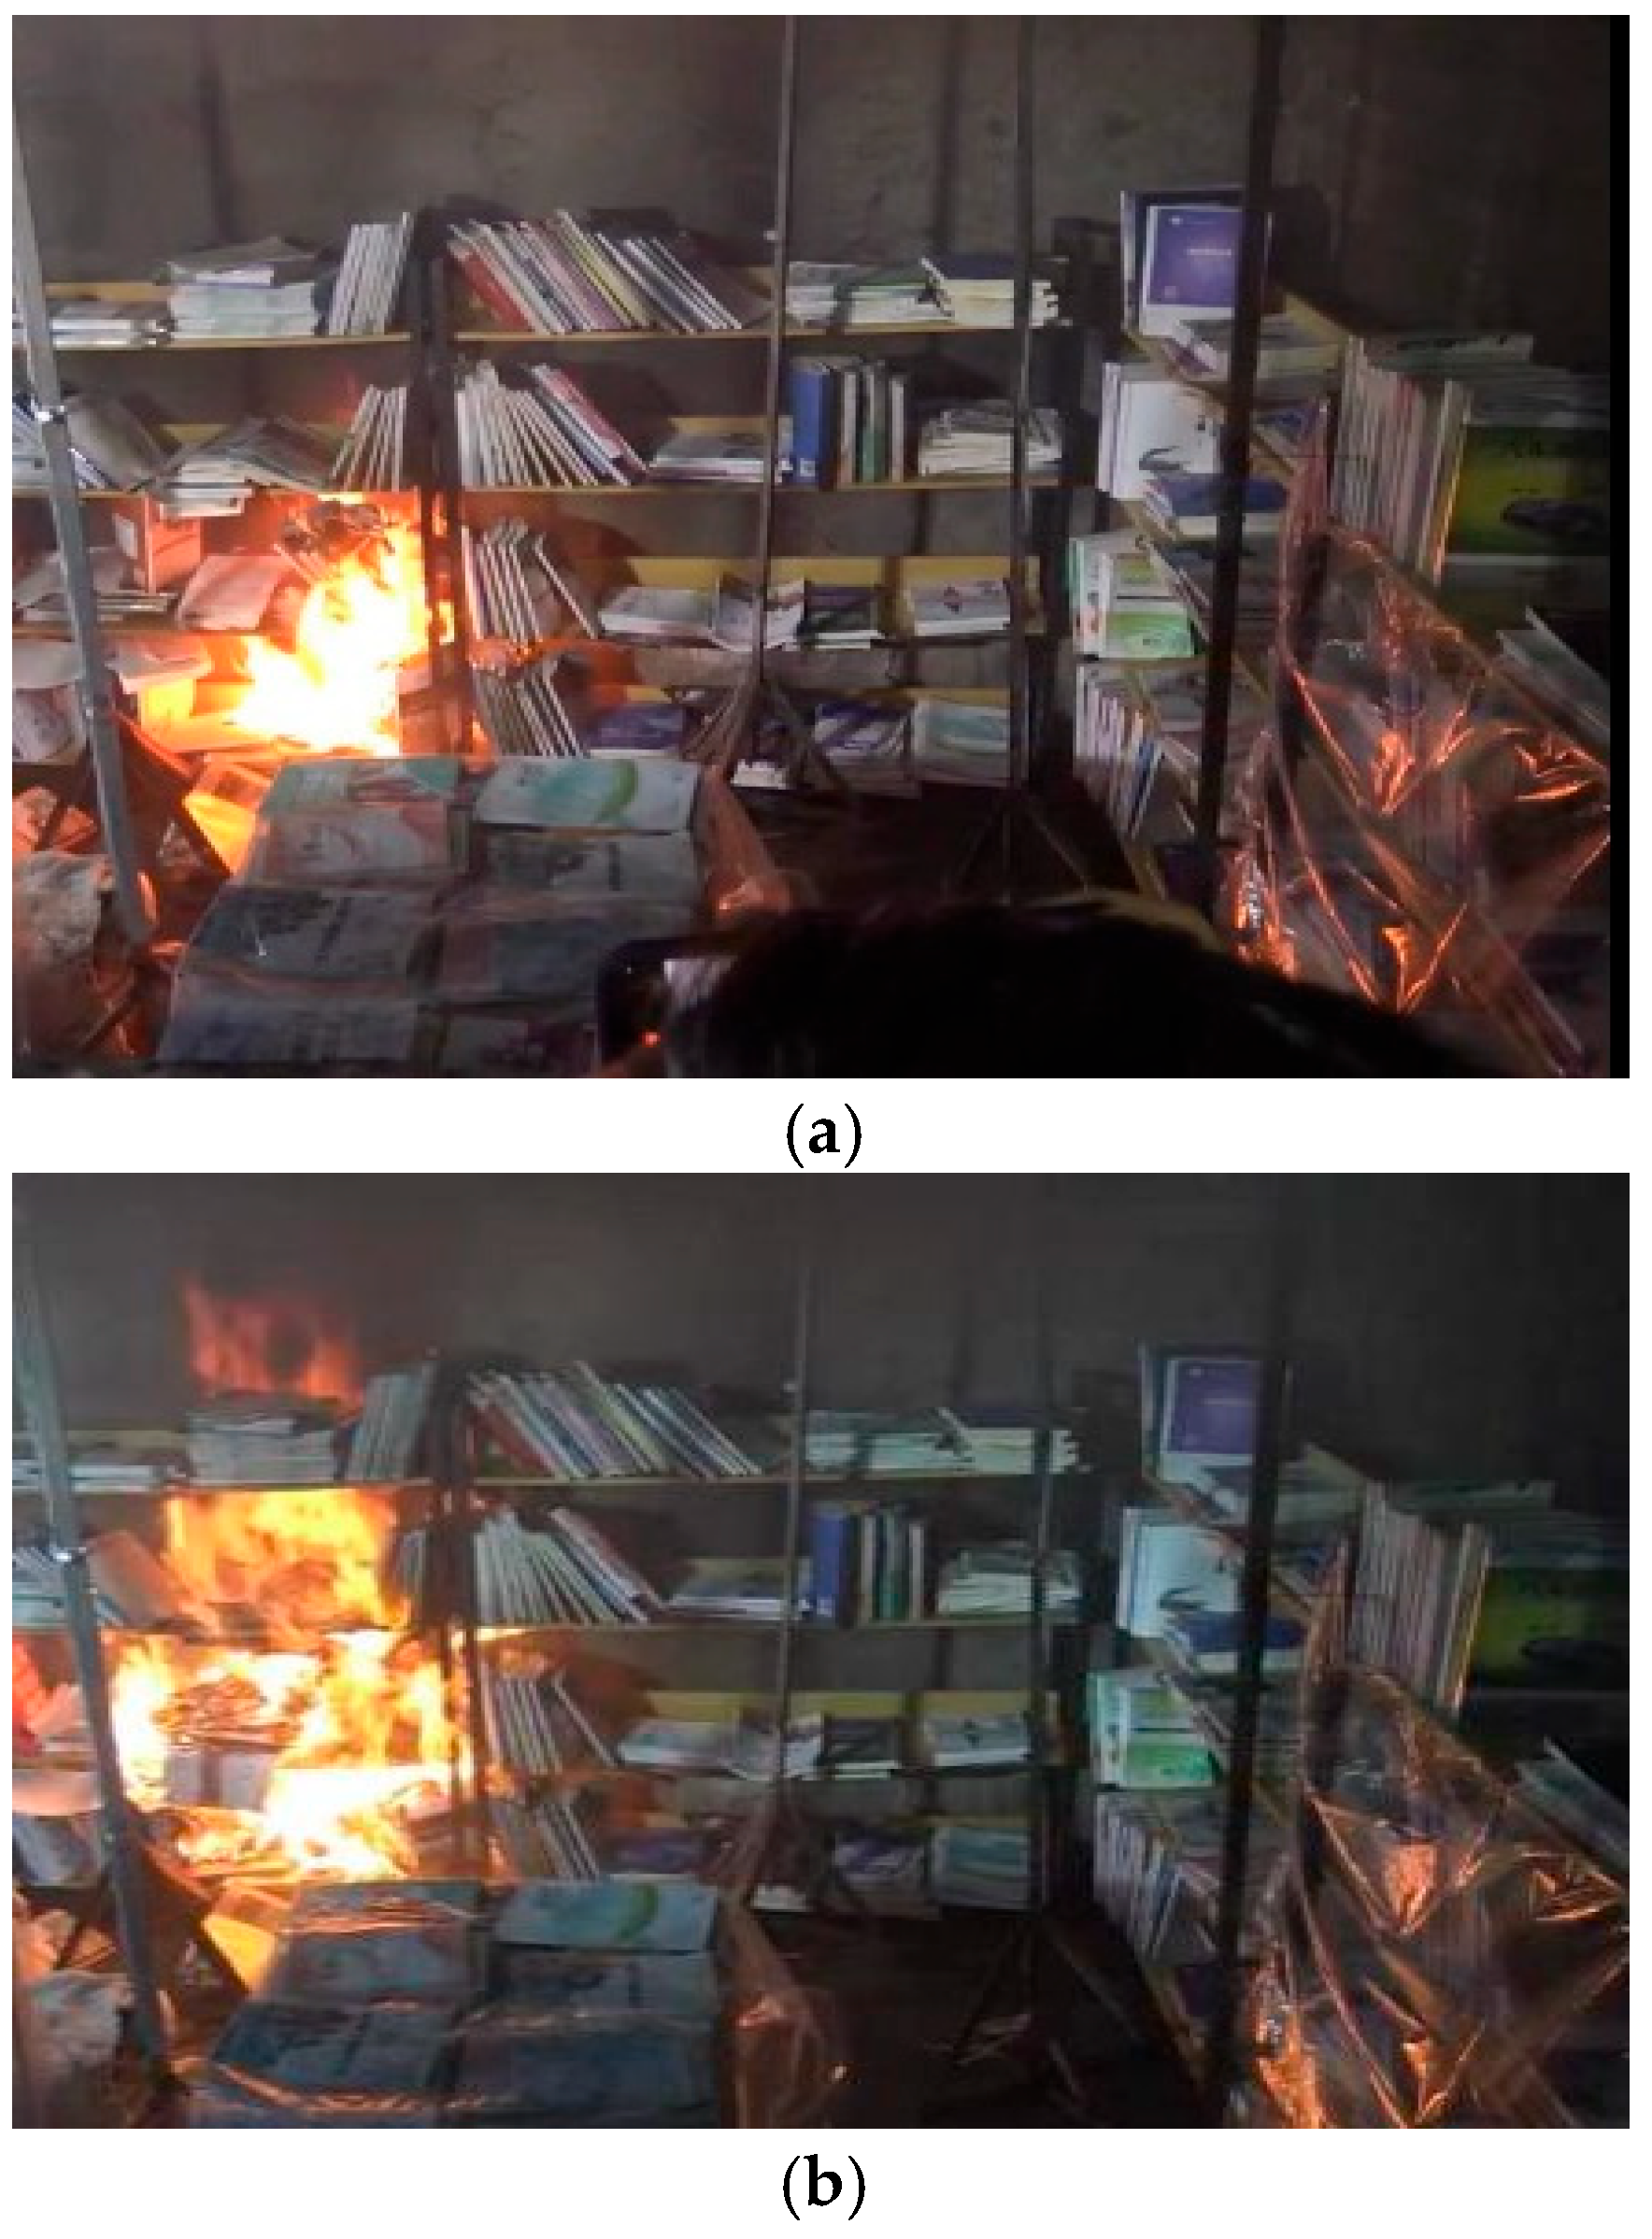
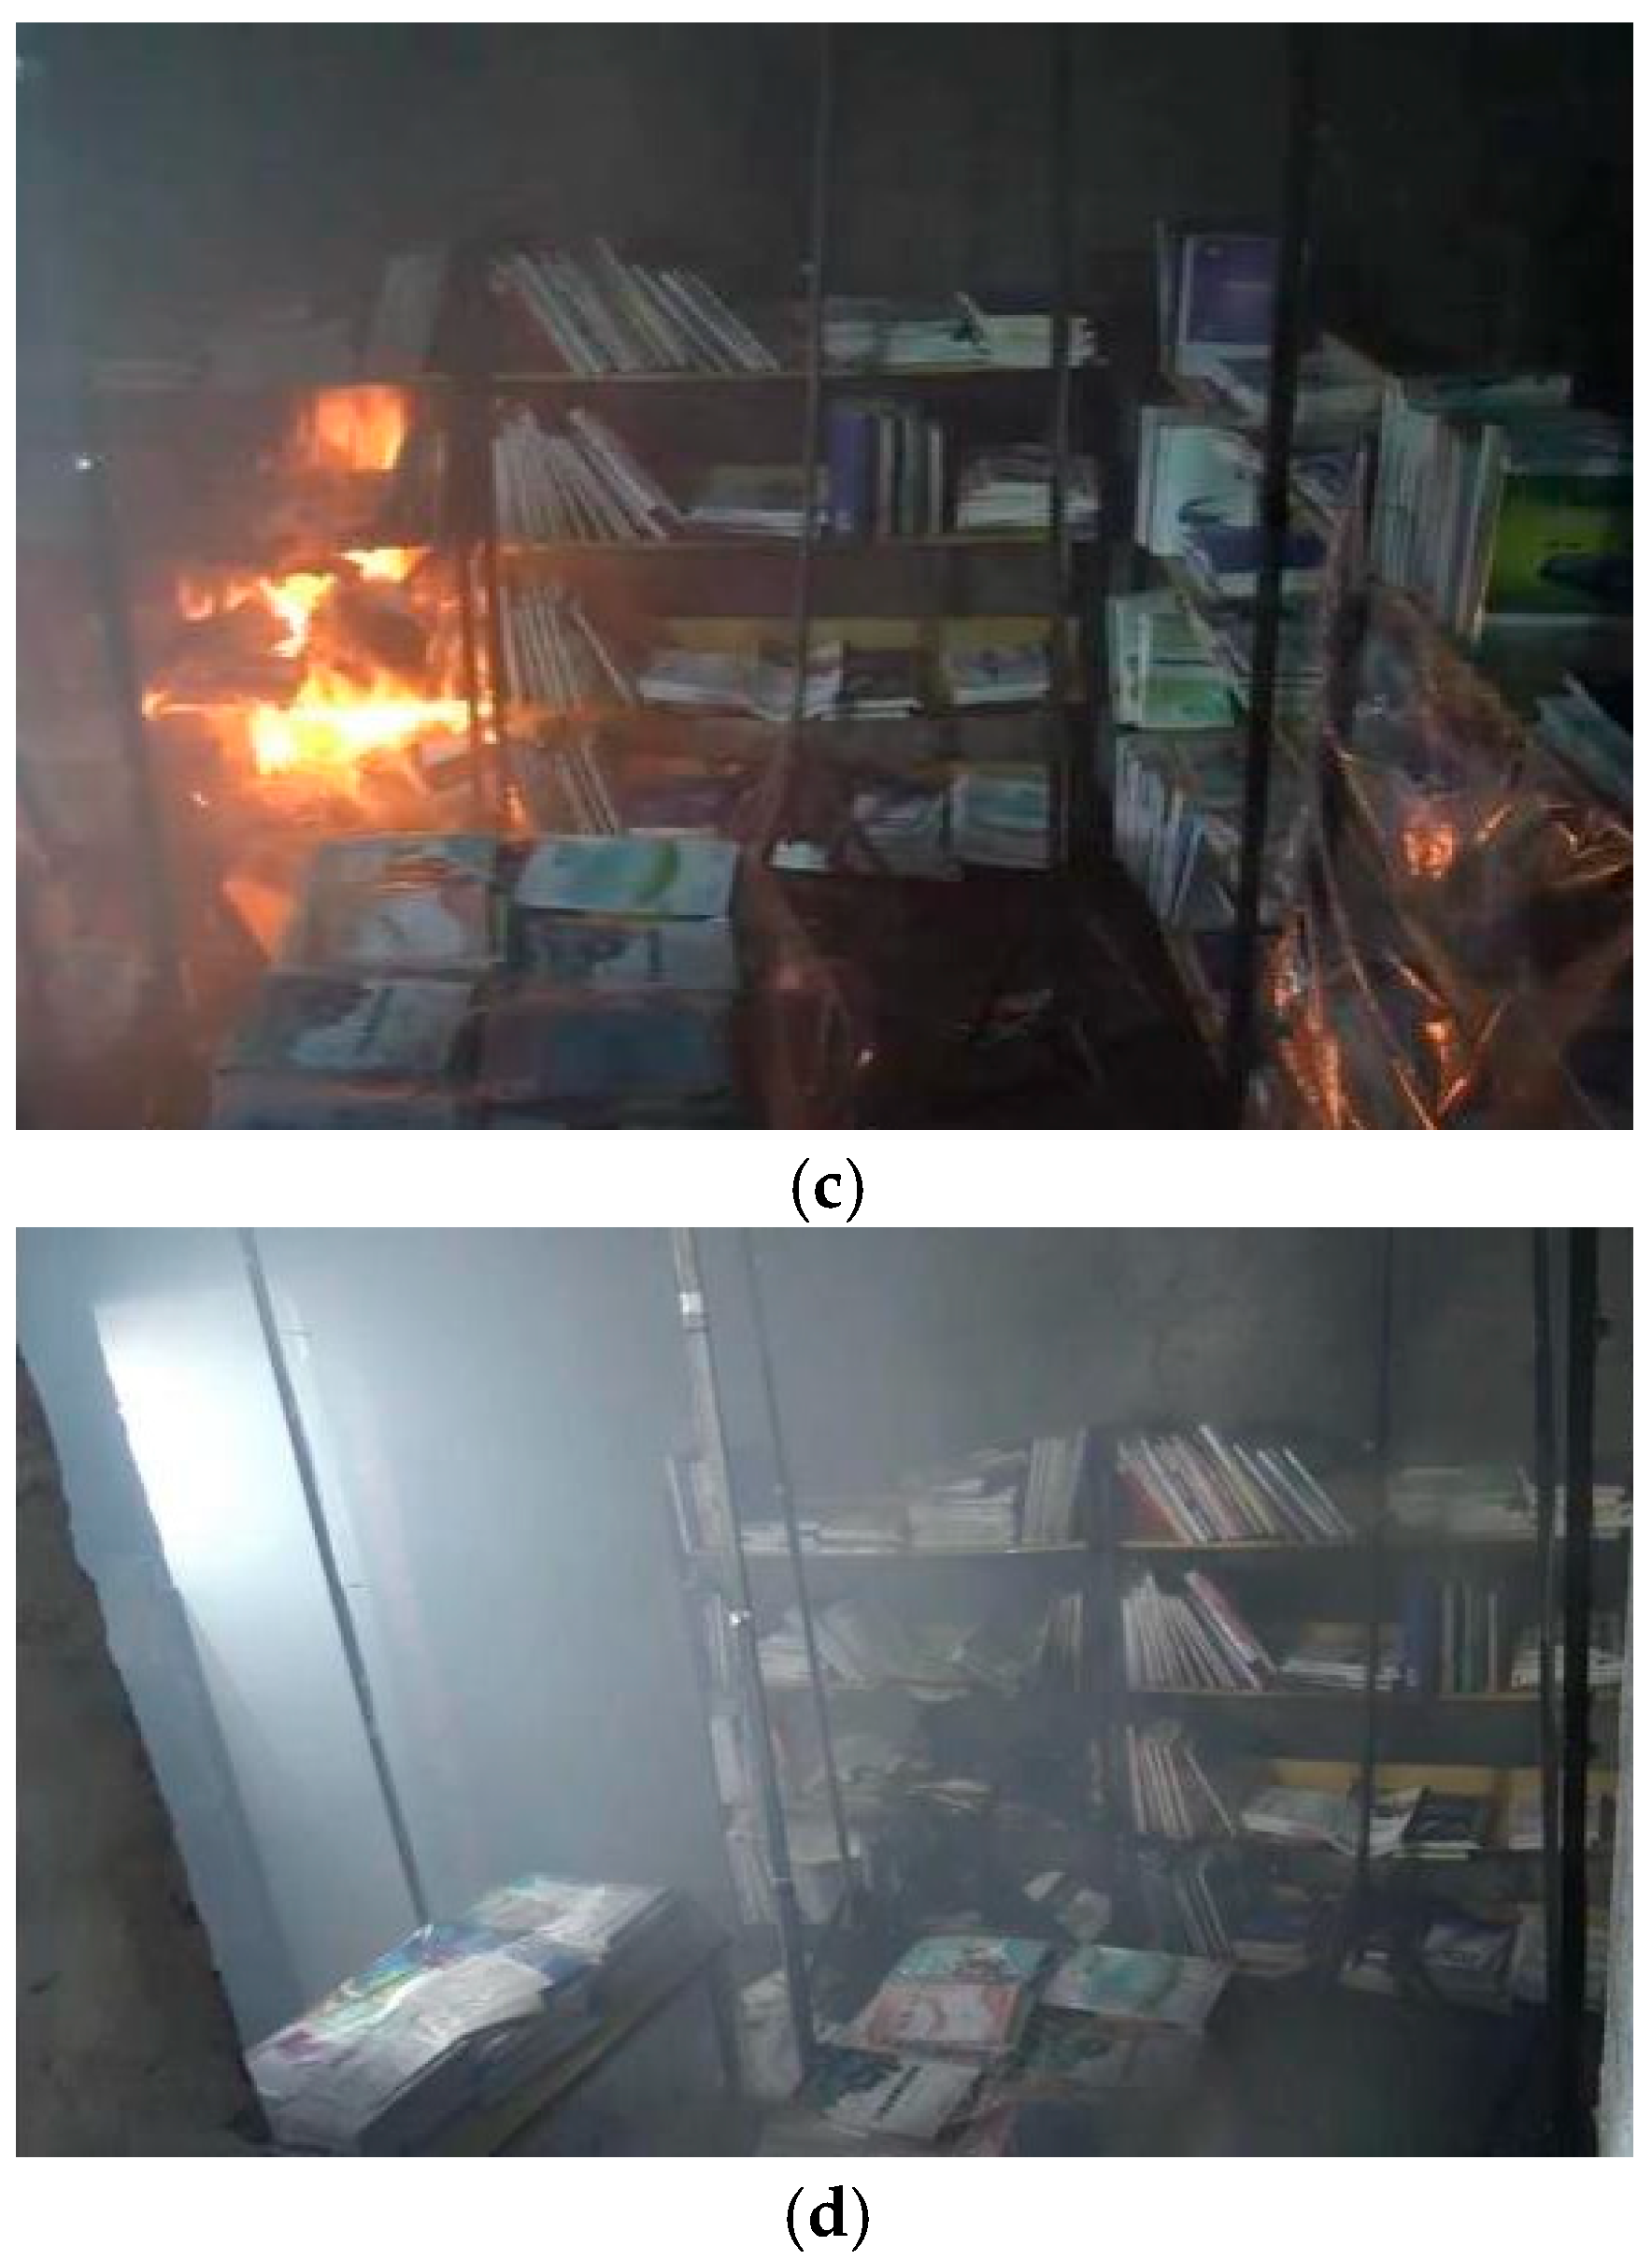
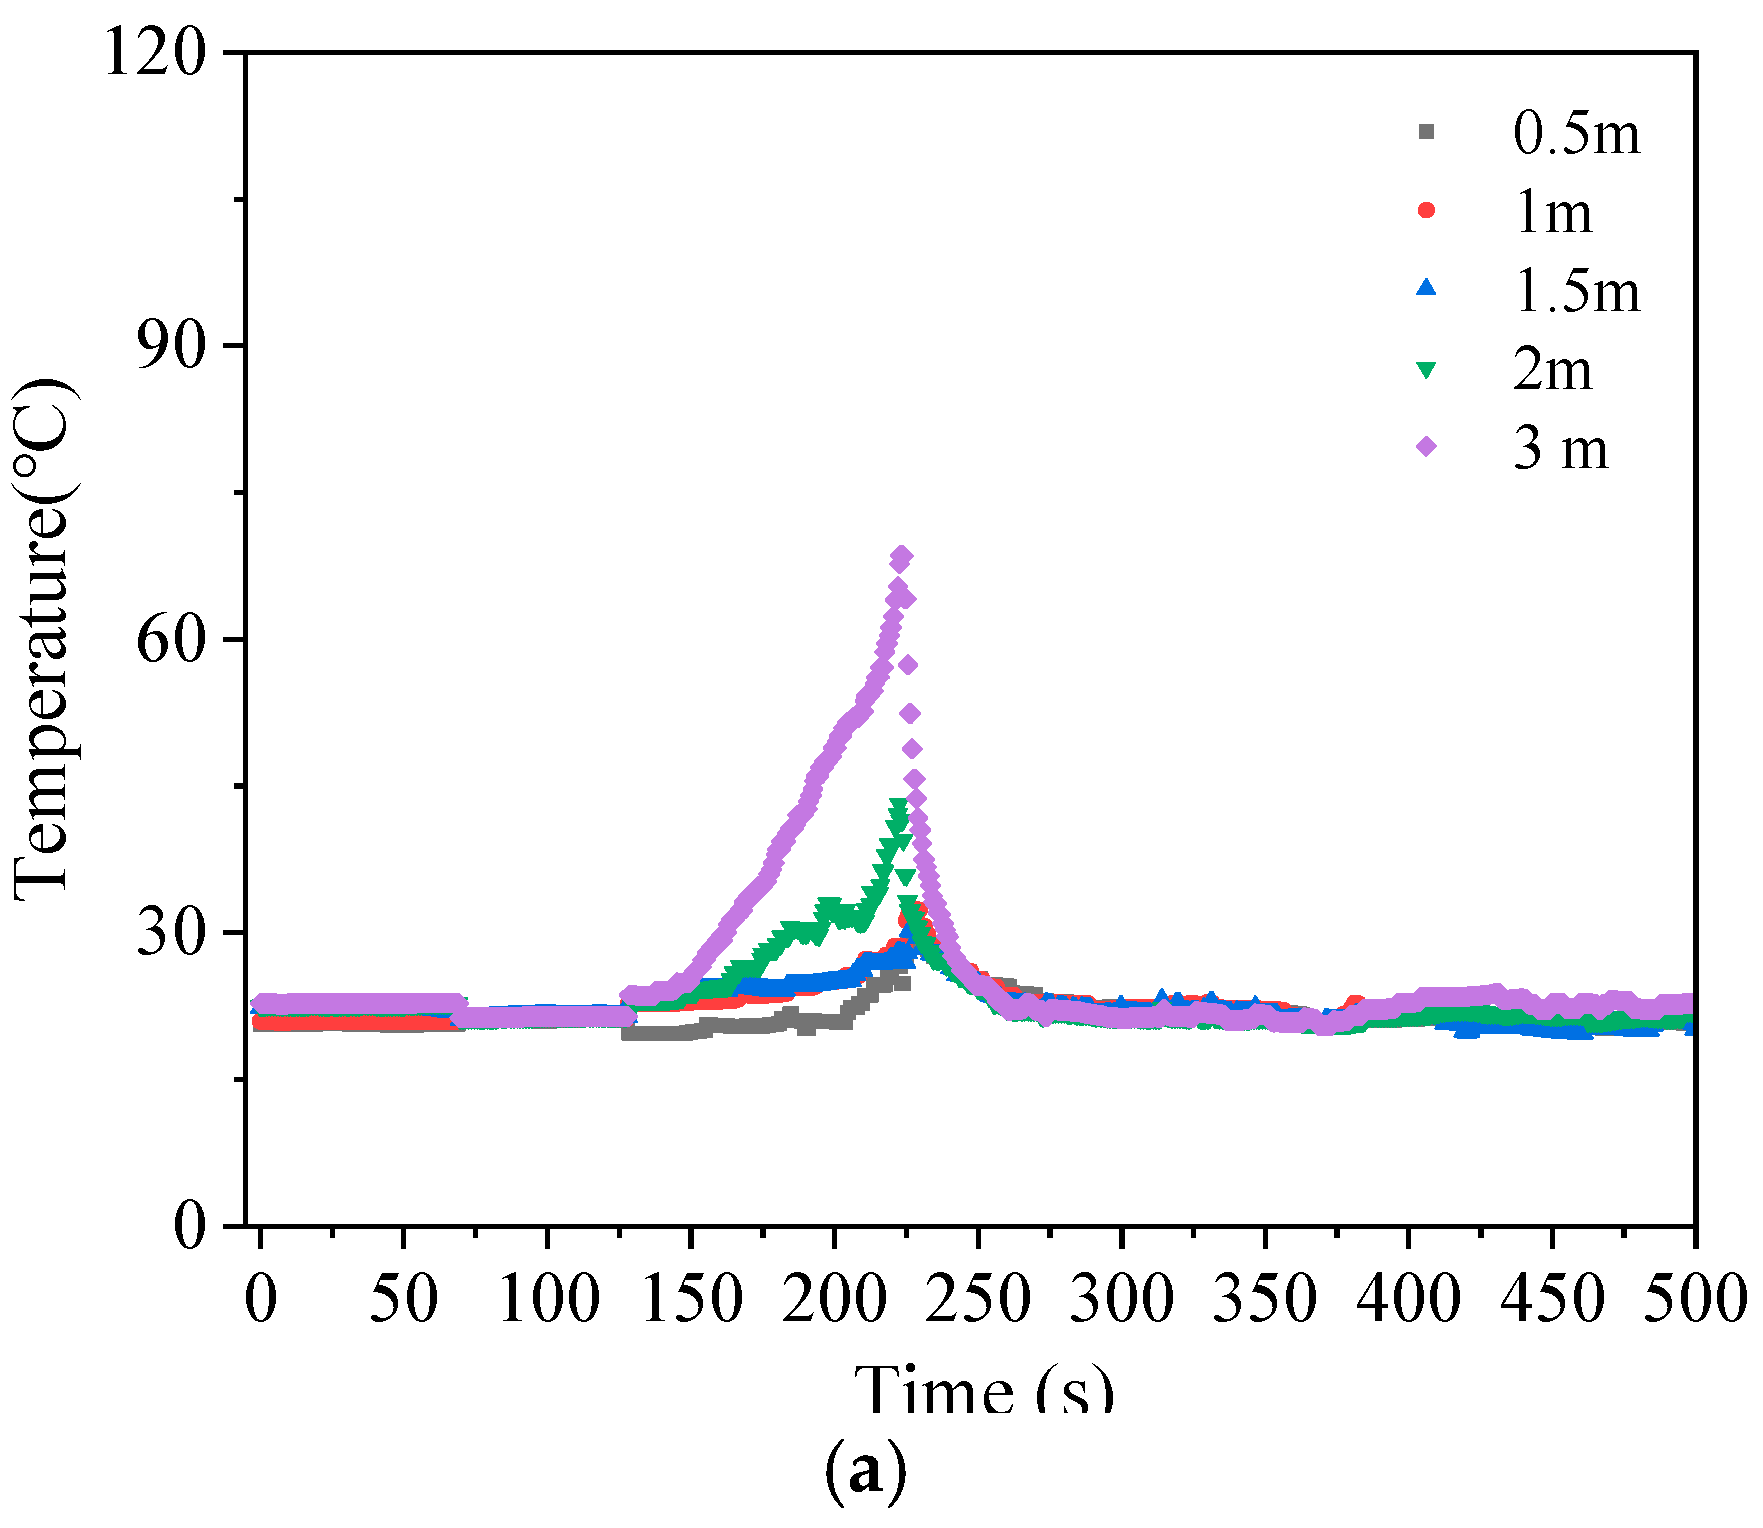
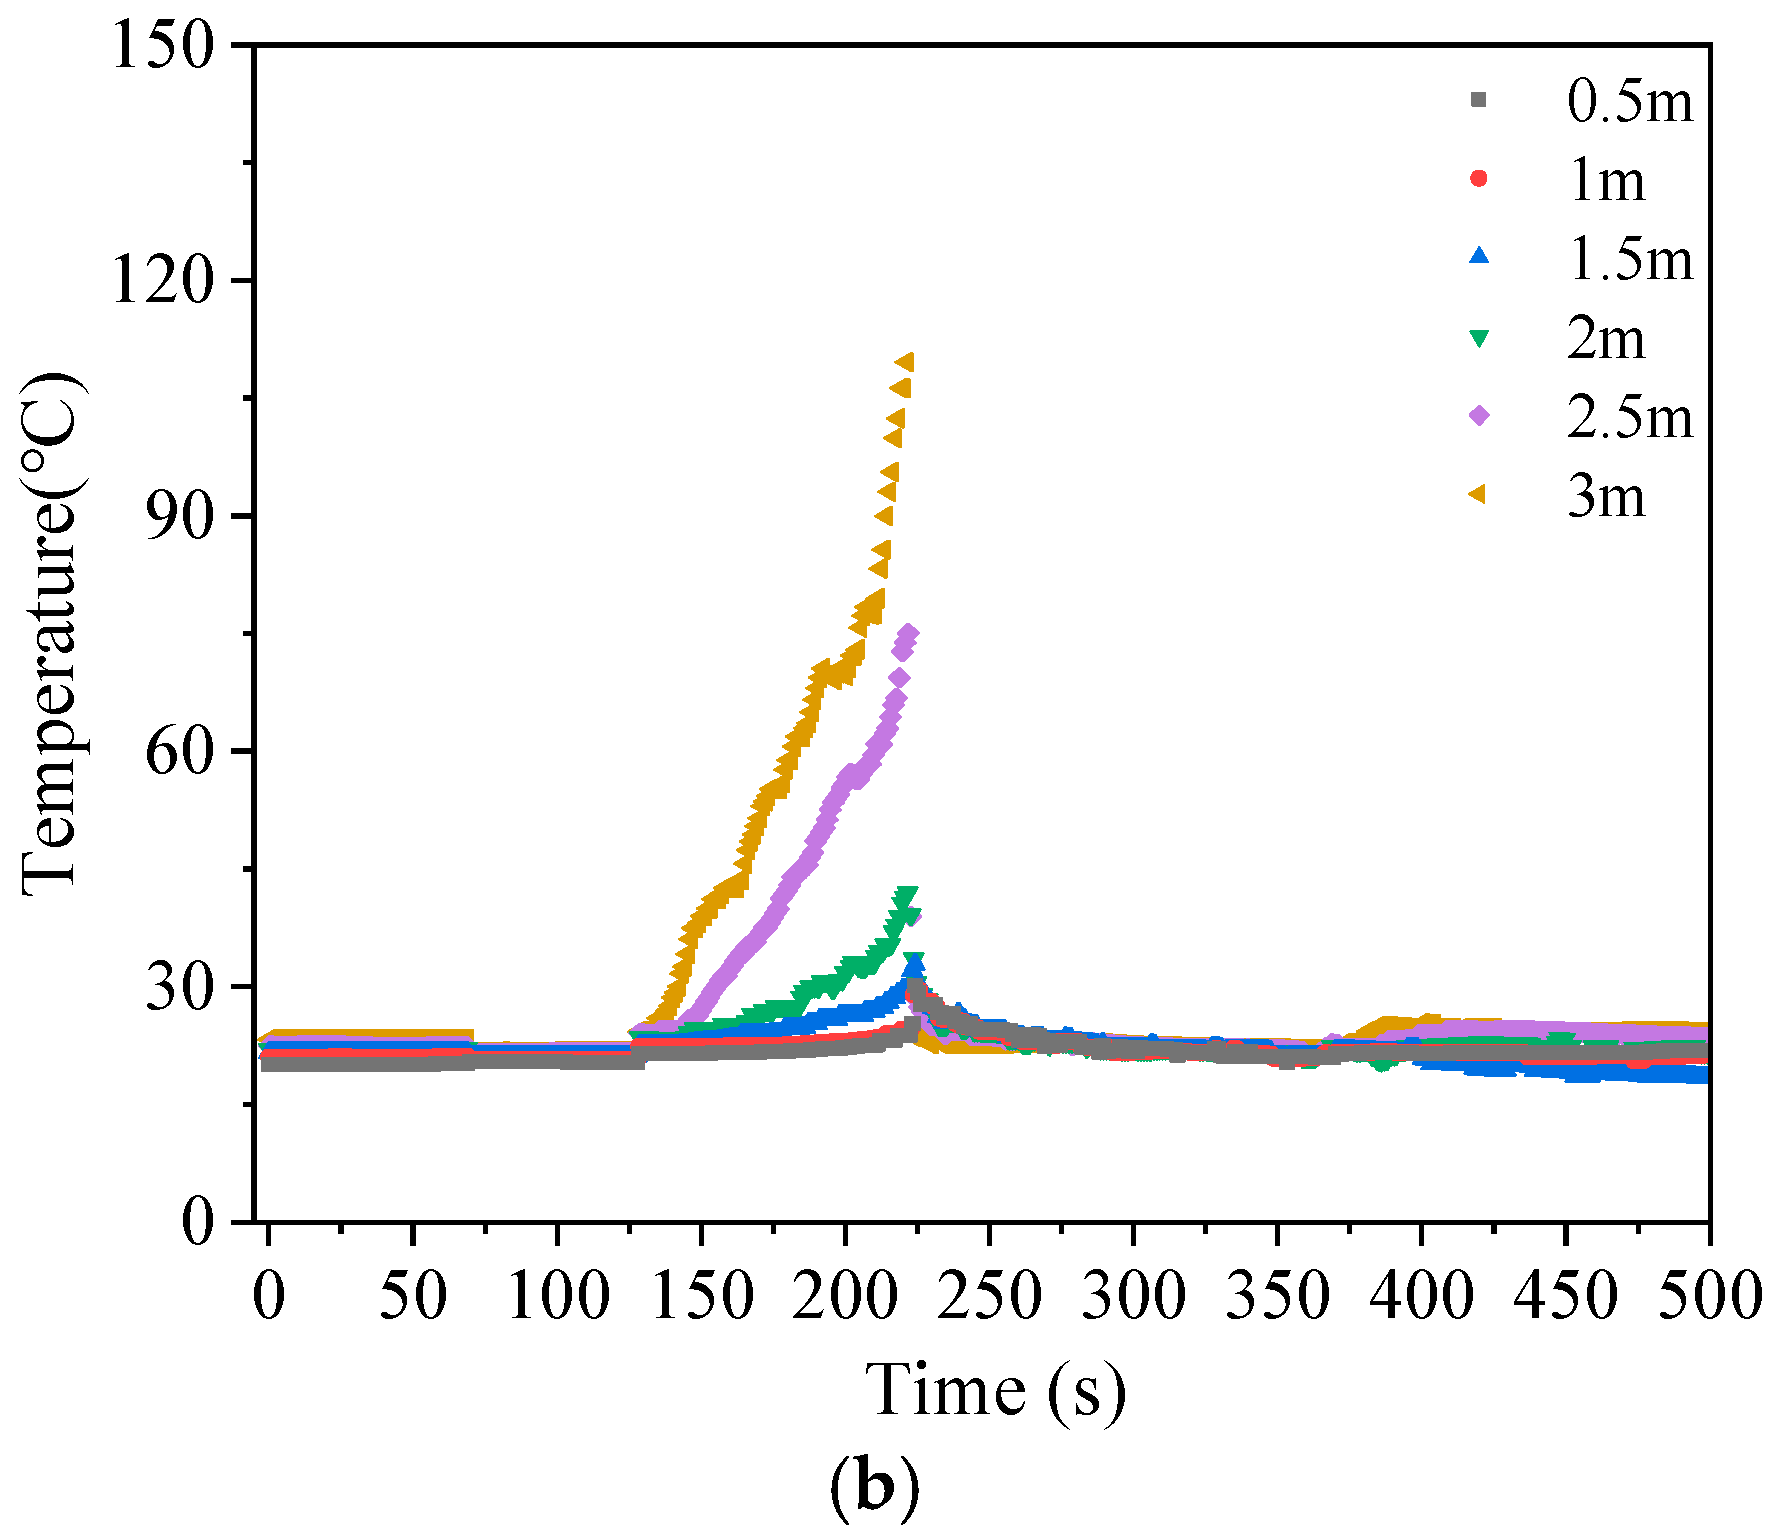
3.3. Physical Combustion Experiment
3.4. Simulation Combustion Experiment
3.4.1. Analysis of Simulation Combustion Results
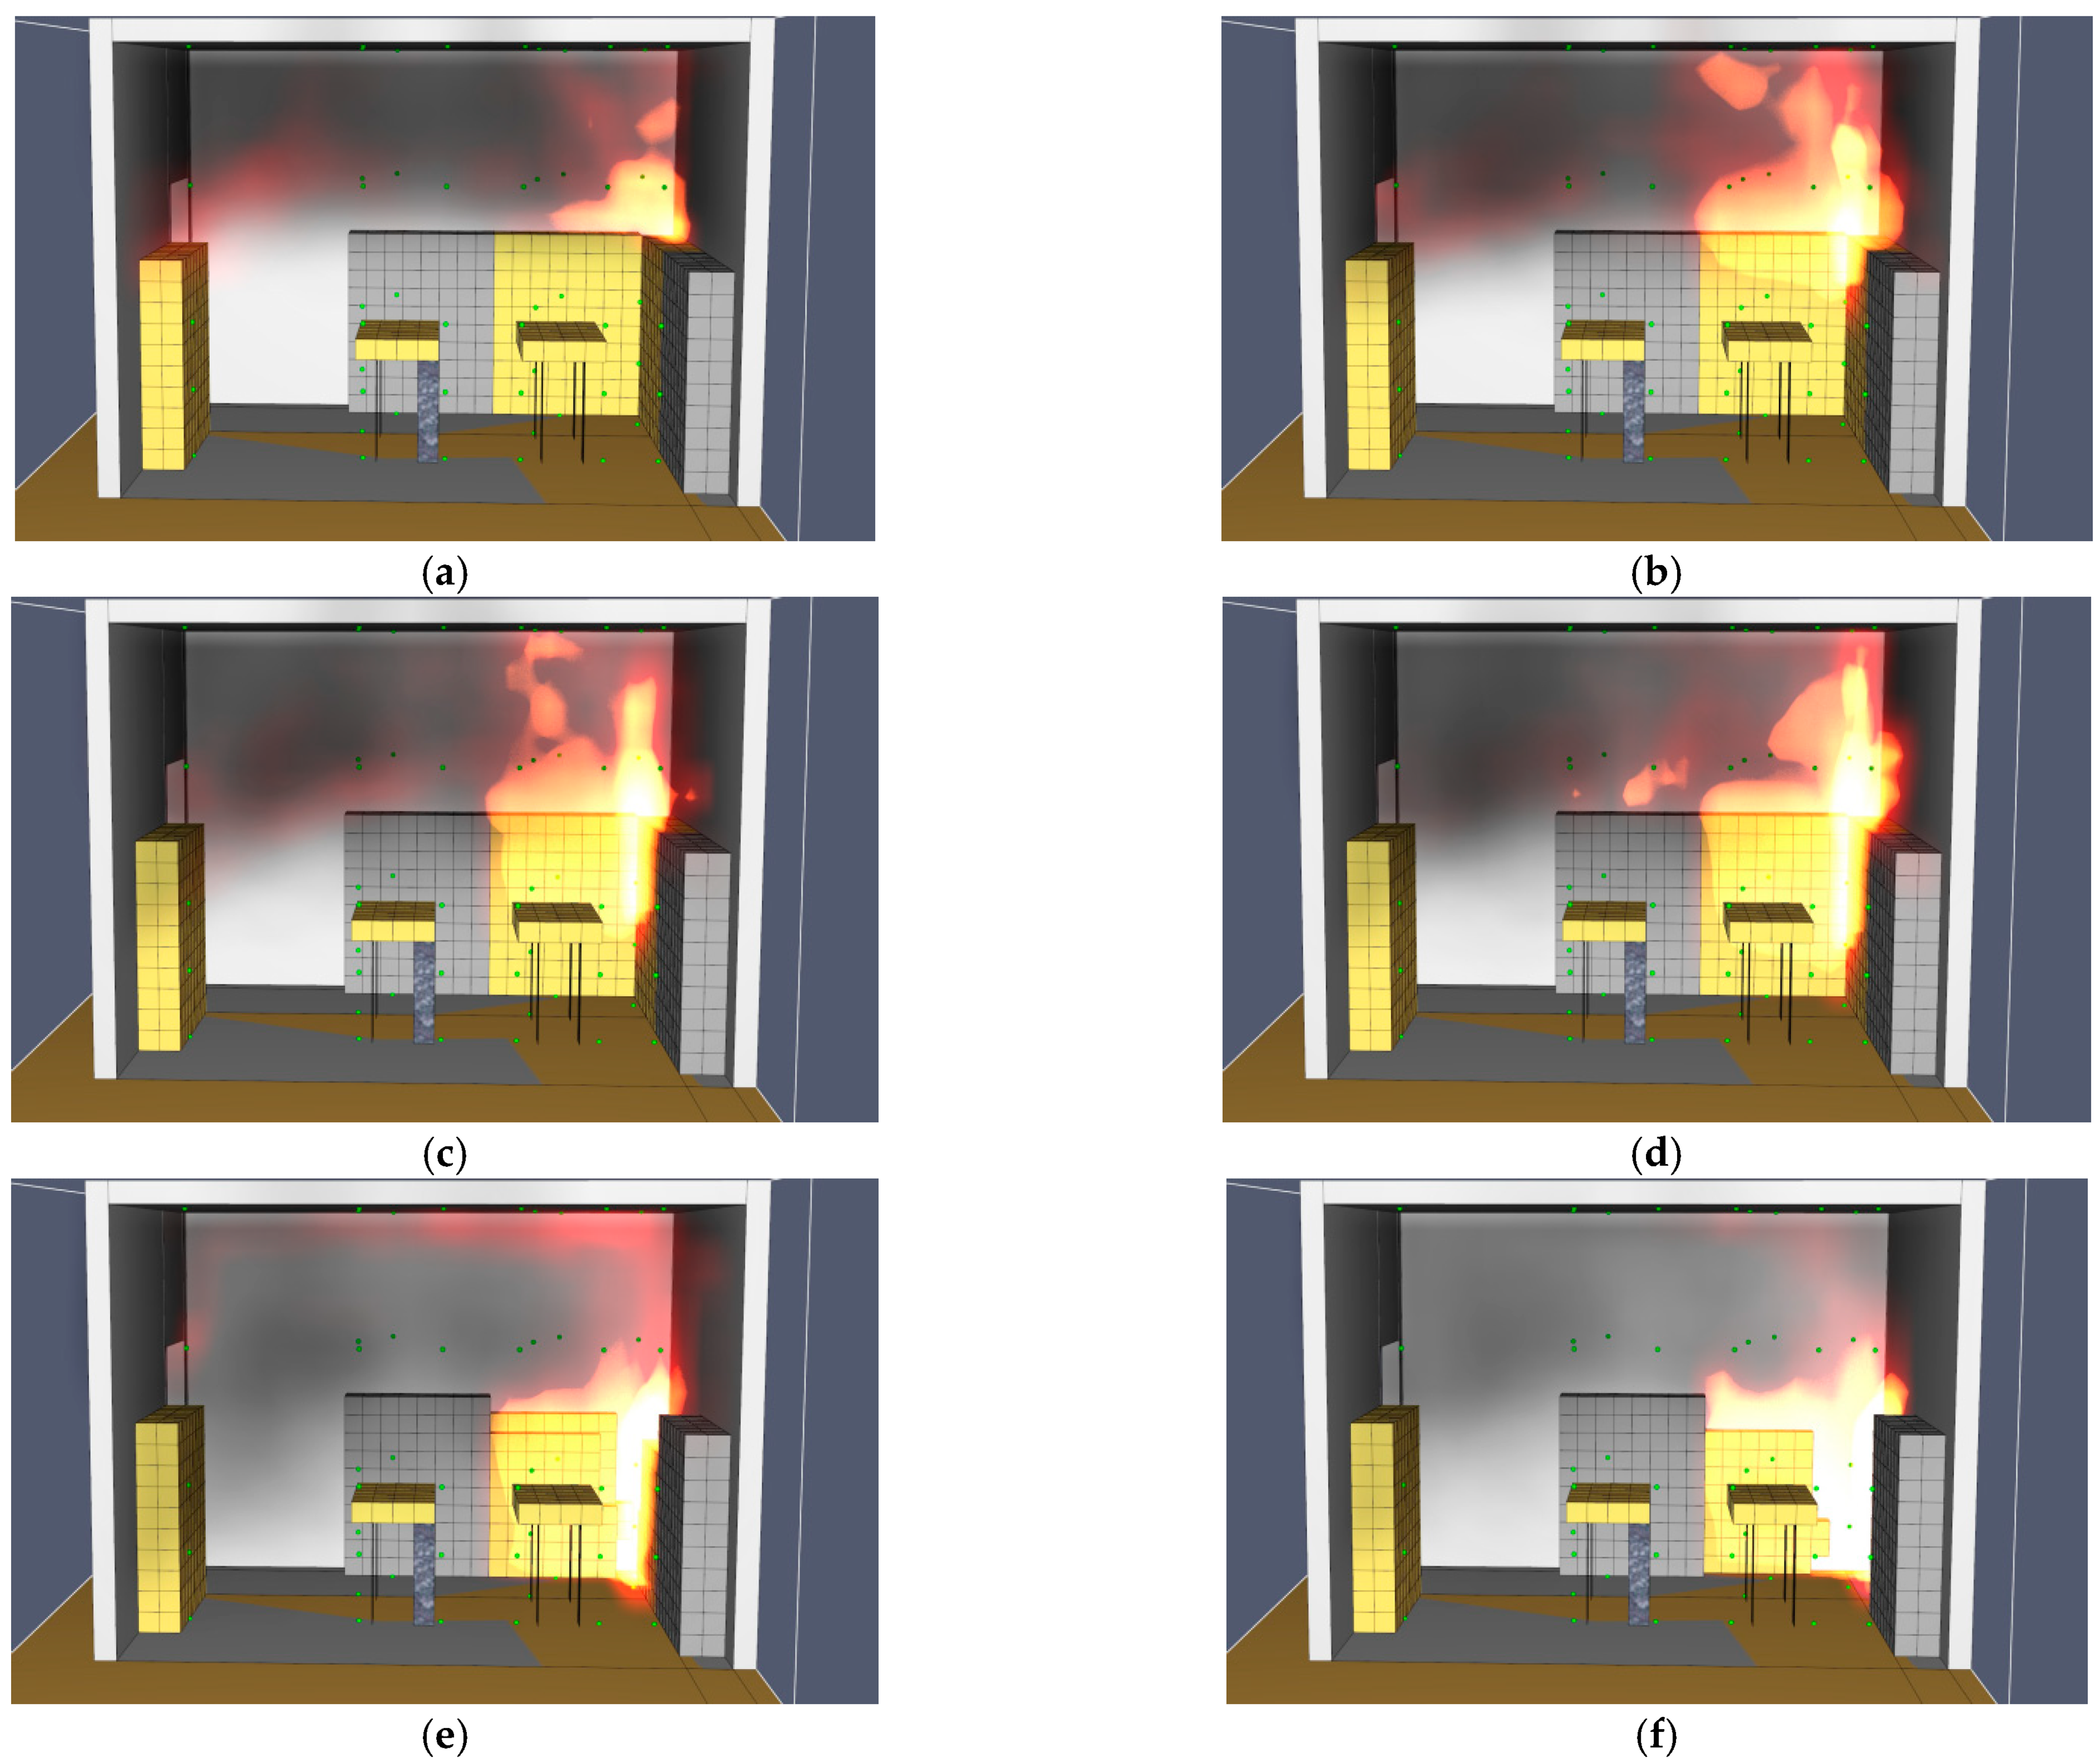
Without Sprinkler System
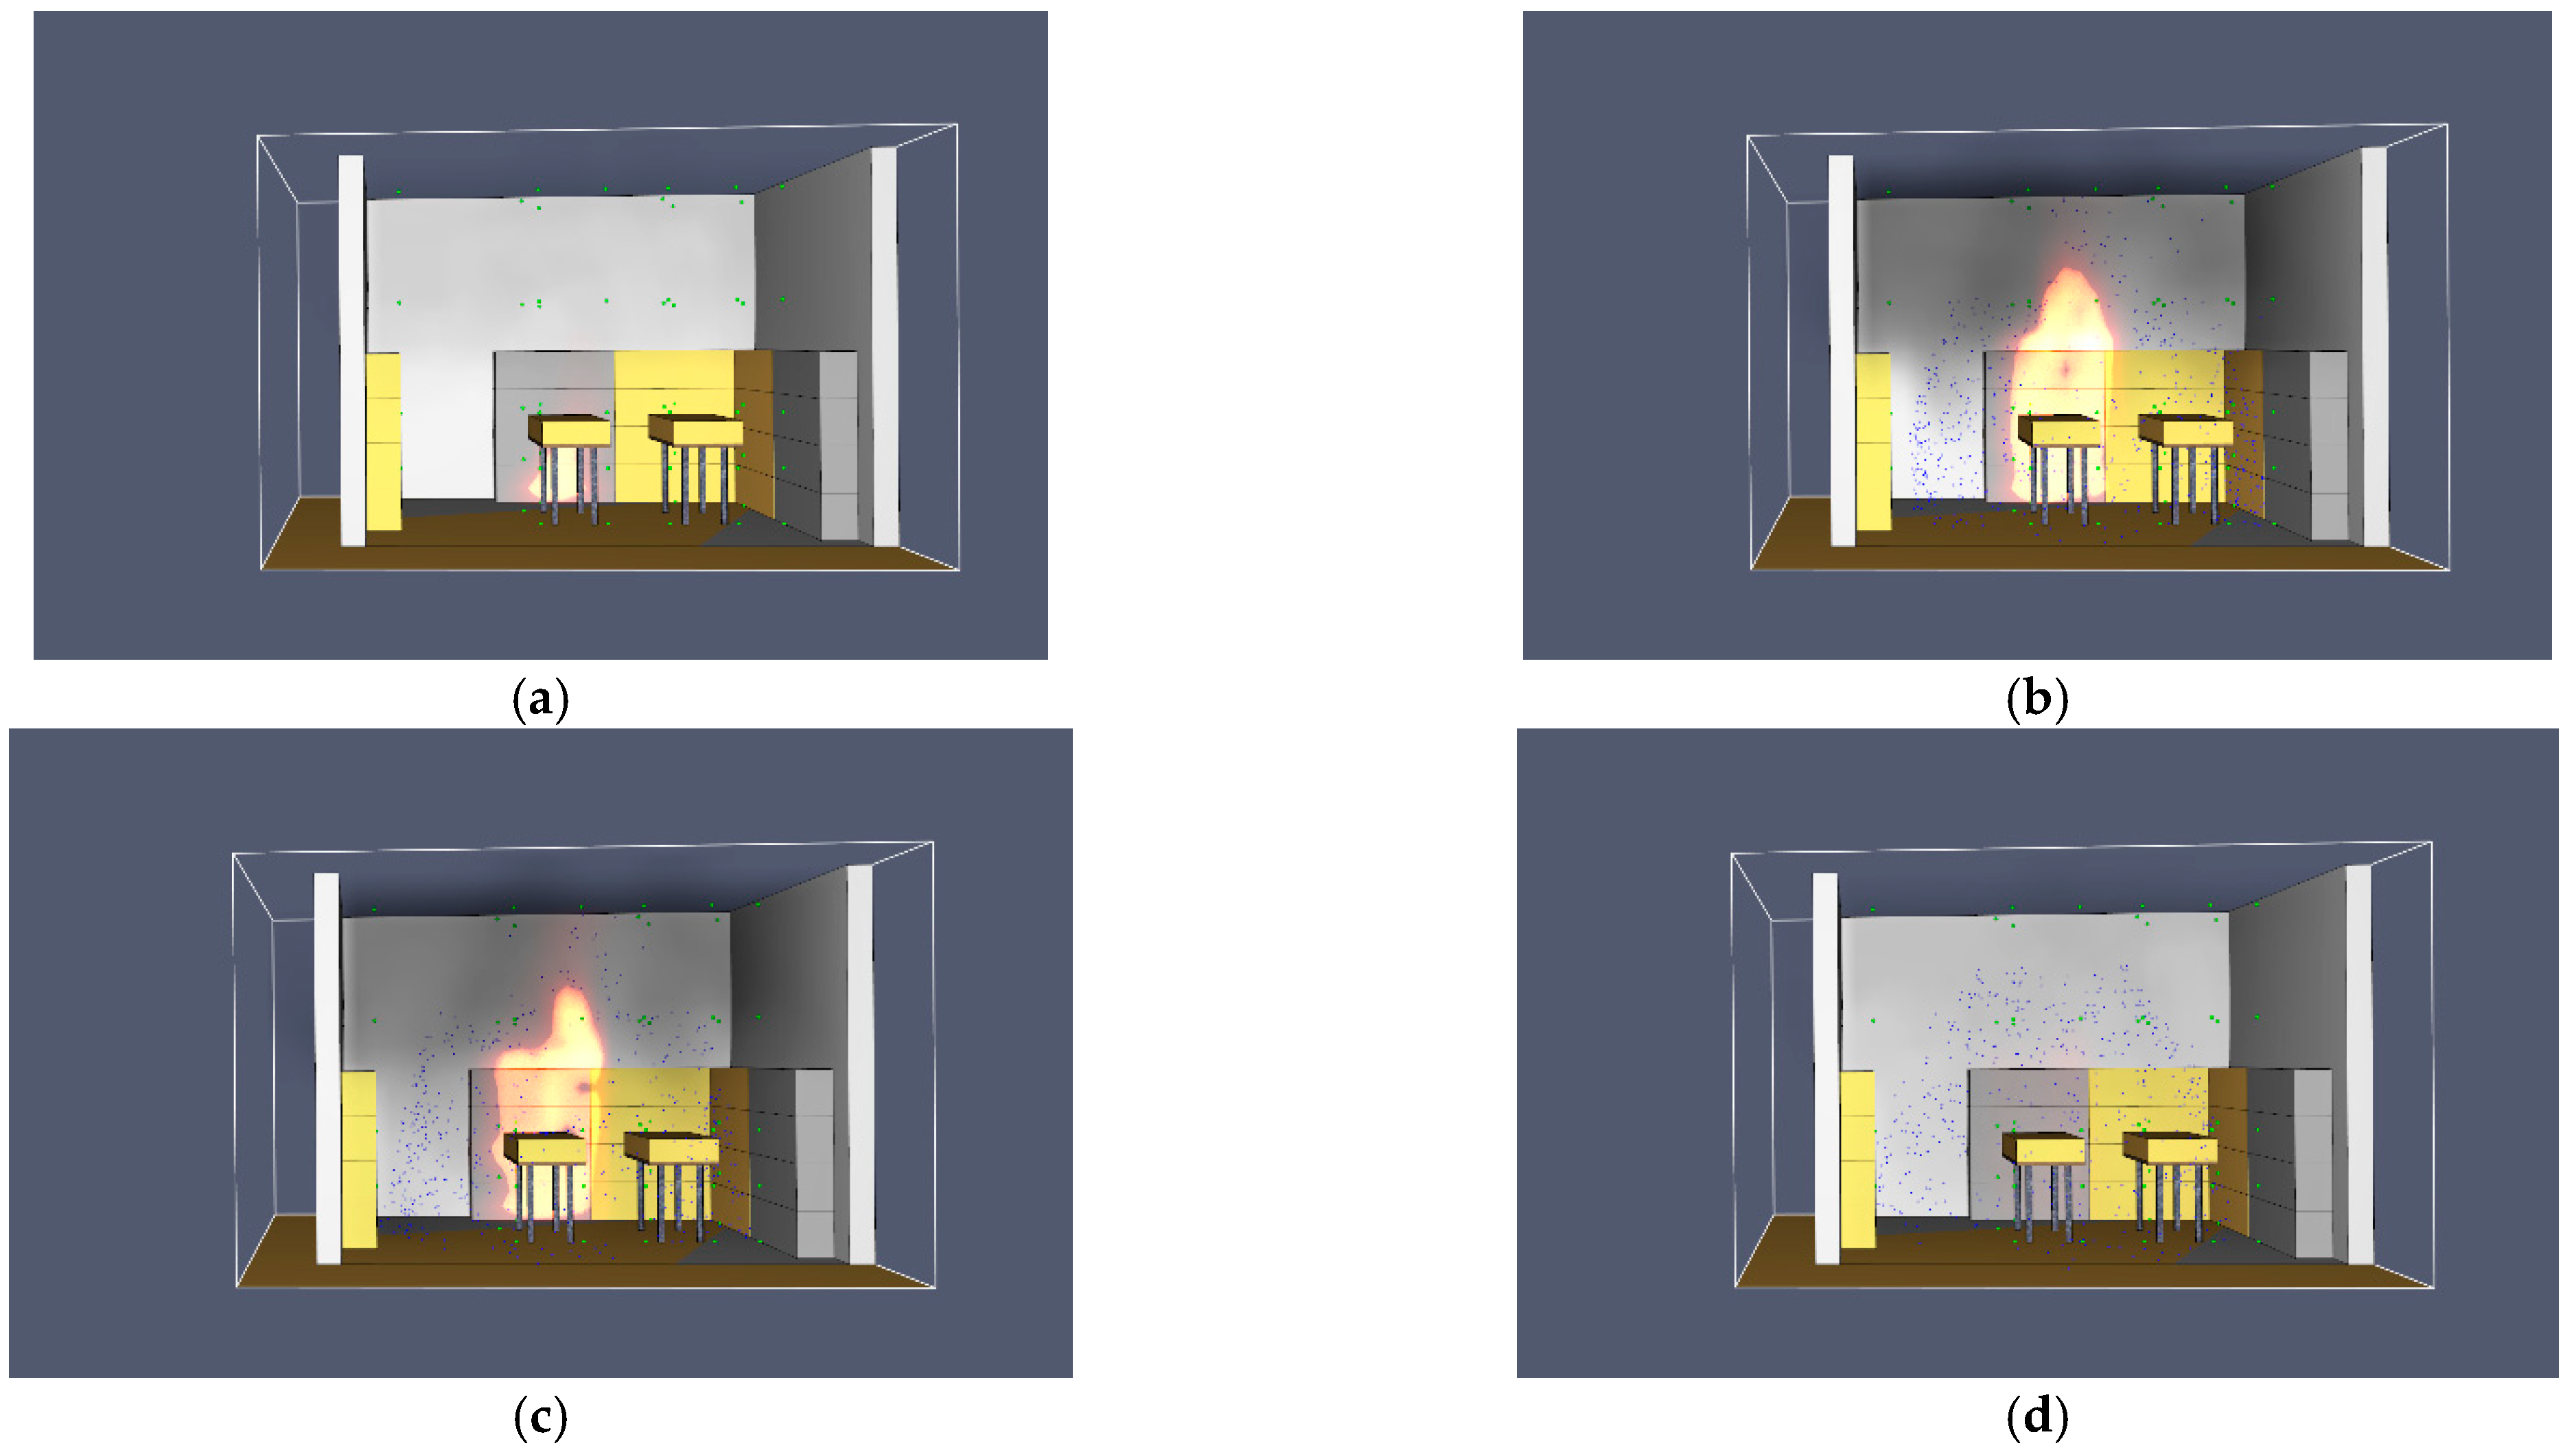
With Sprinkler System
3.4.2. Analysis of Simulated Combustion Results
Water Consumption
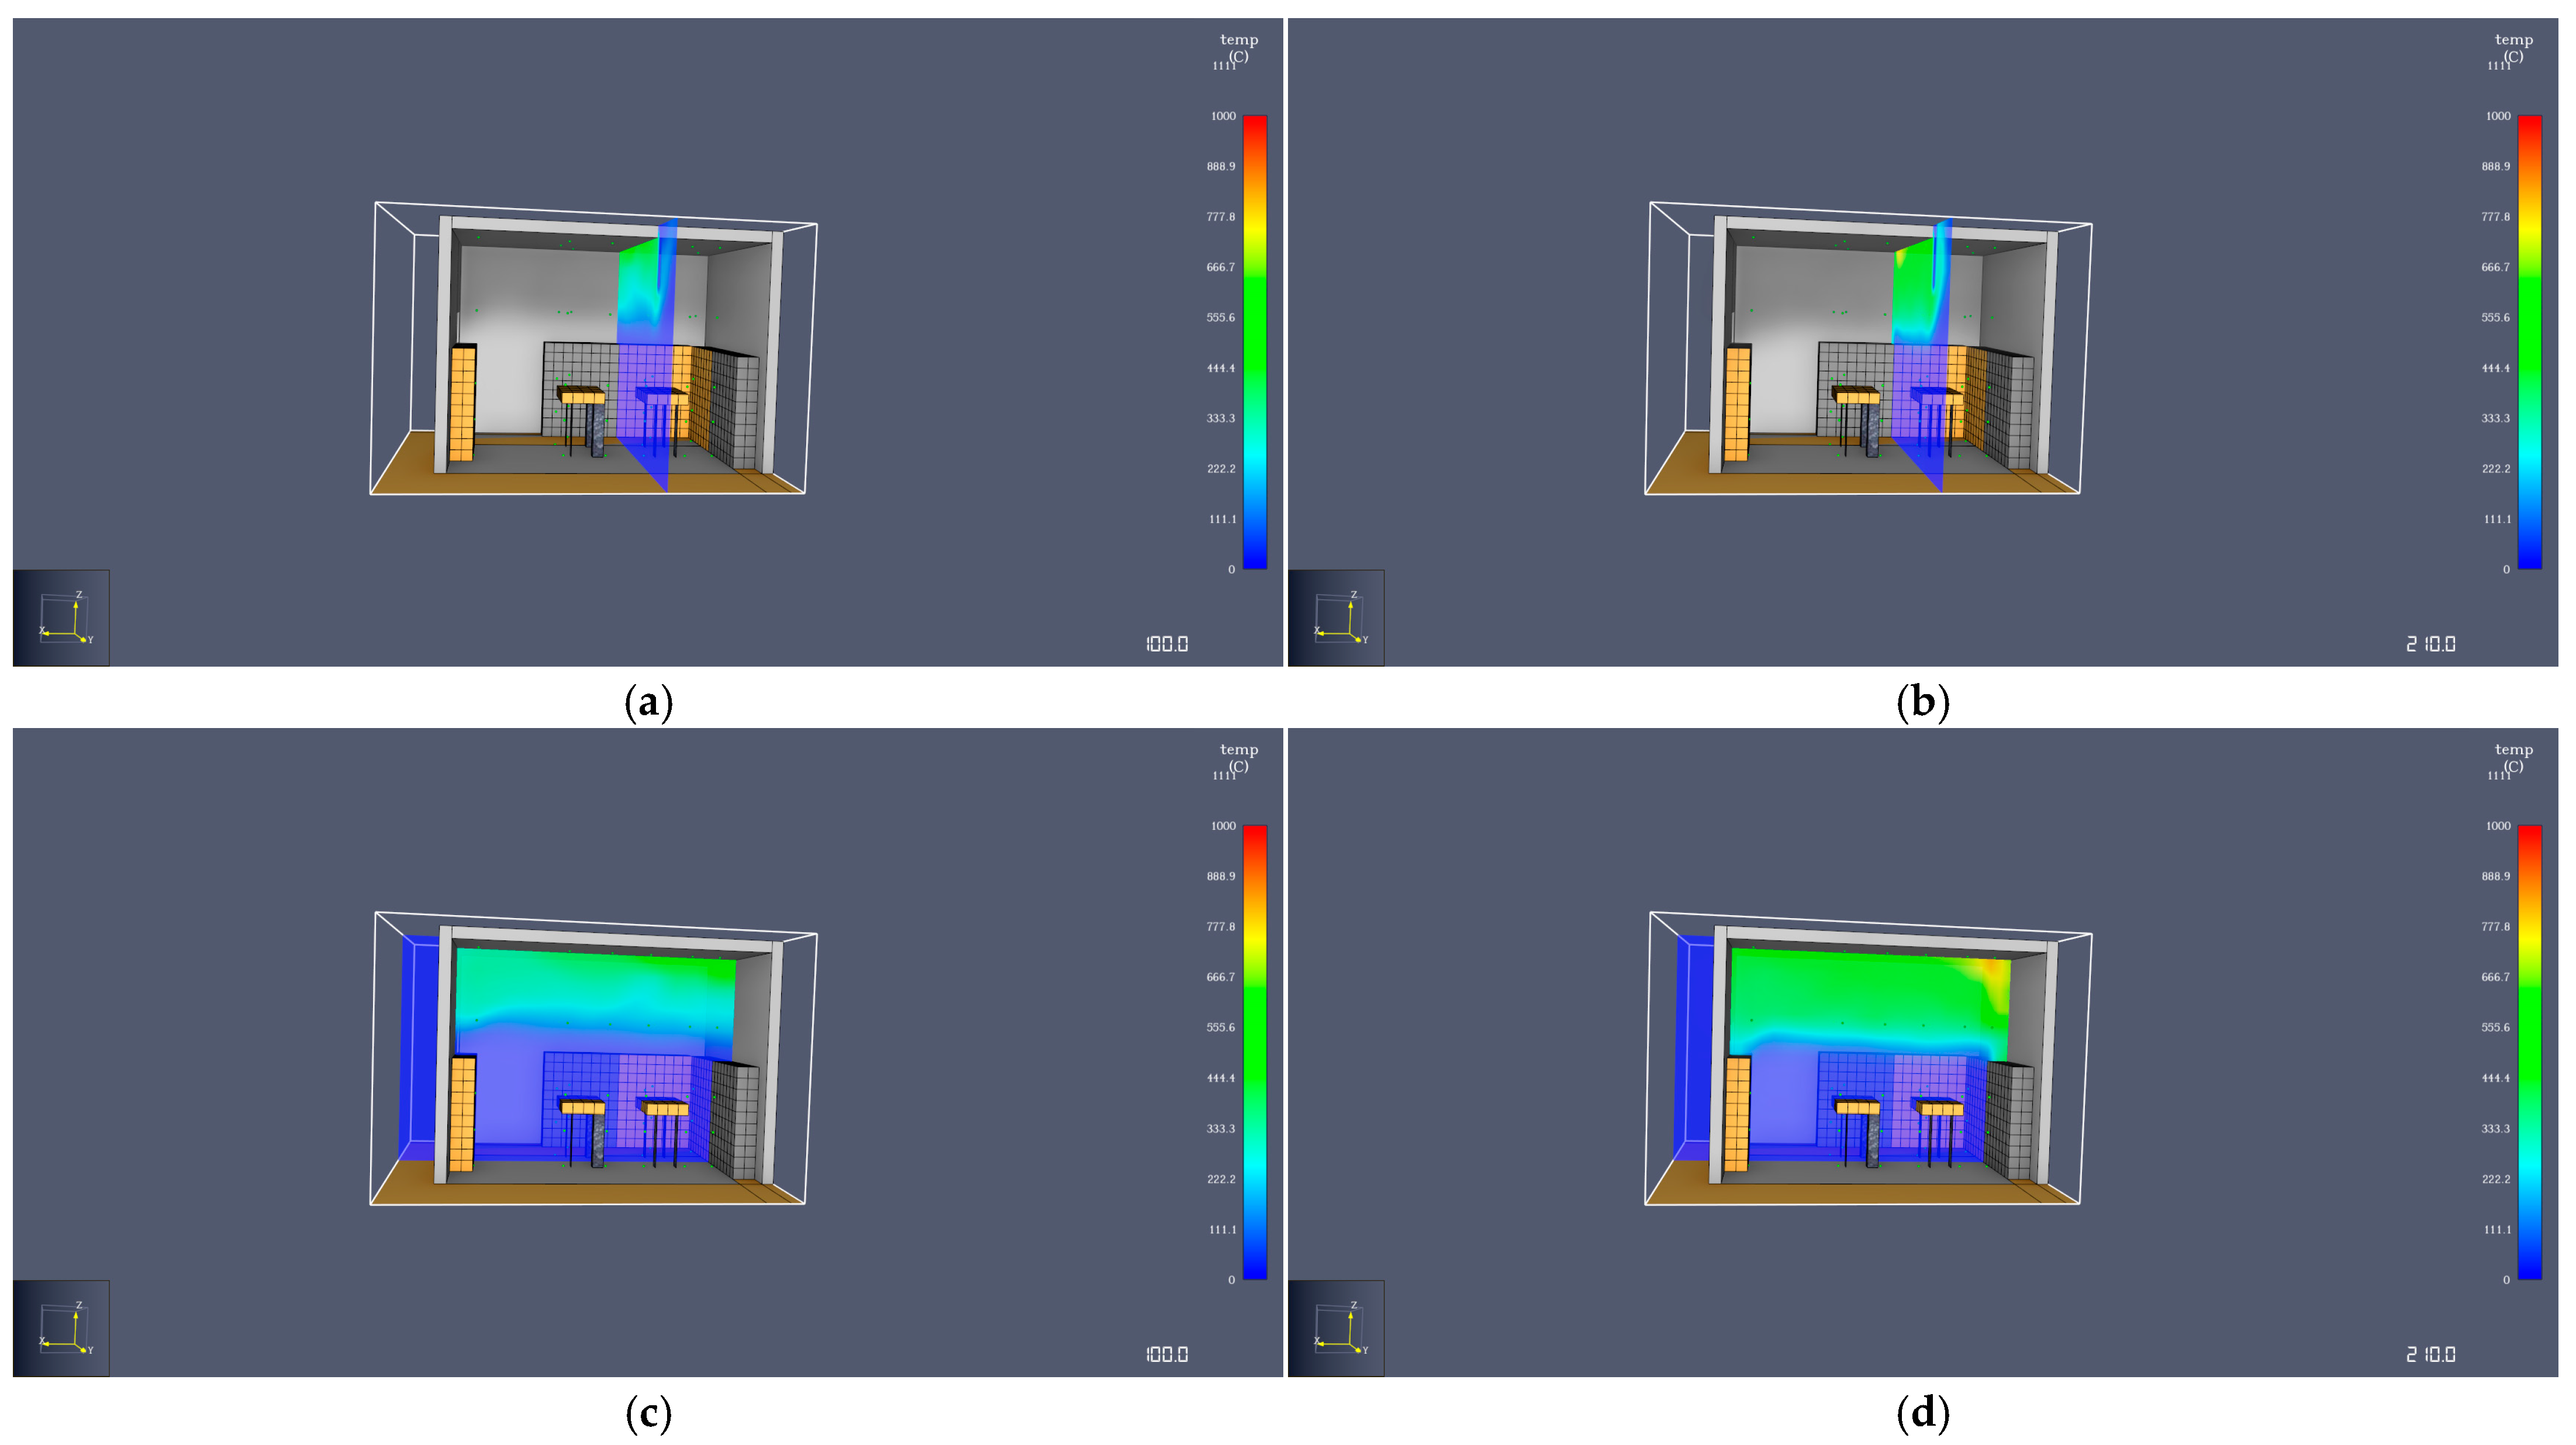
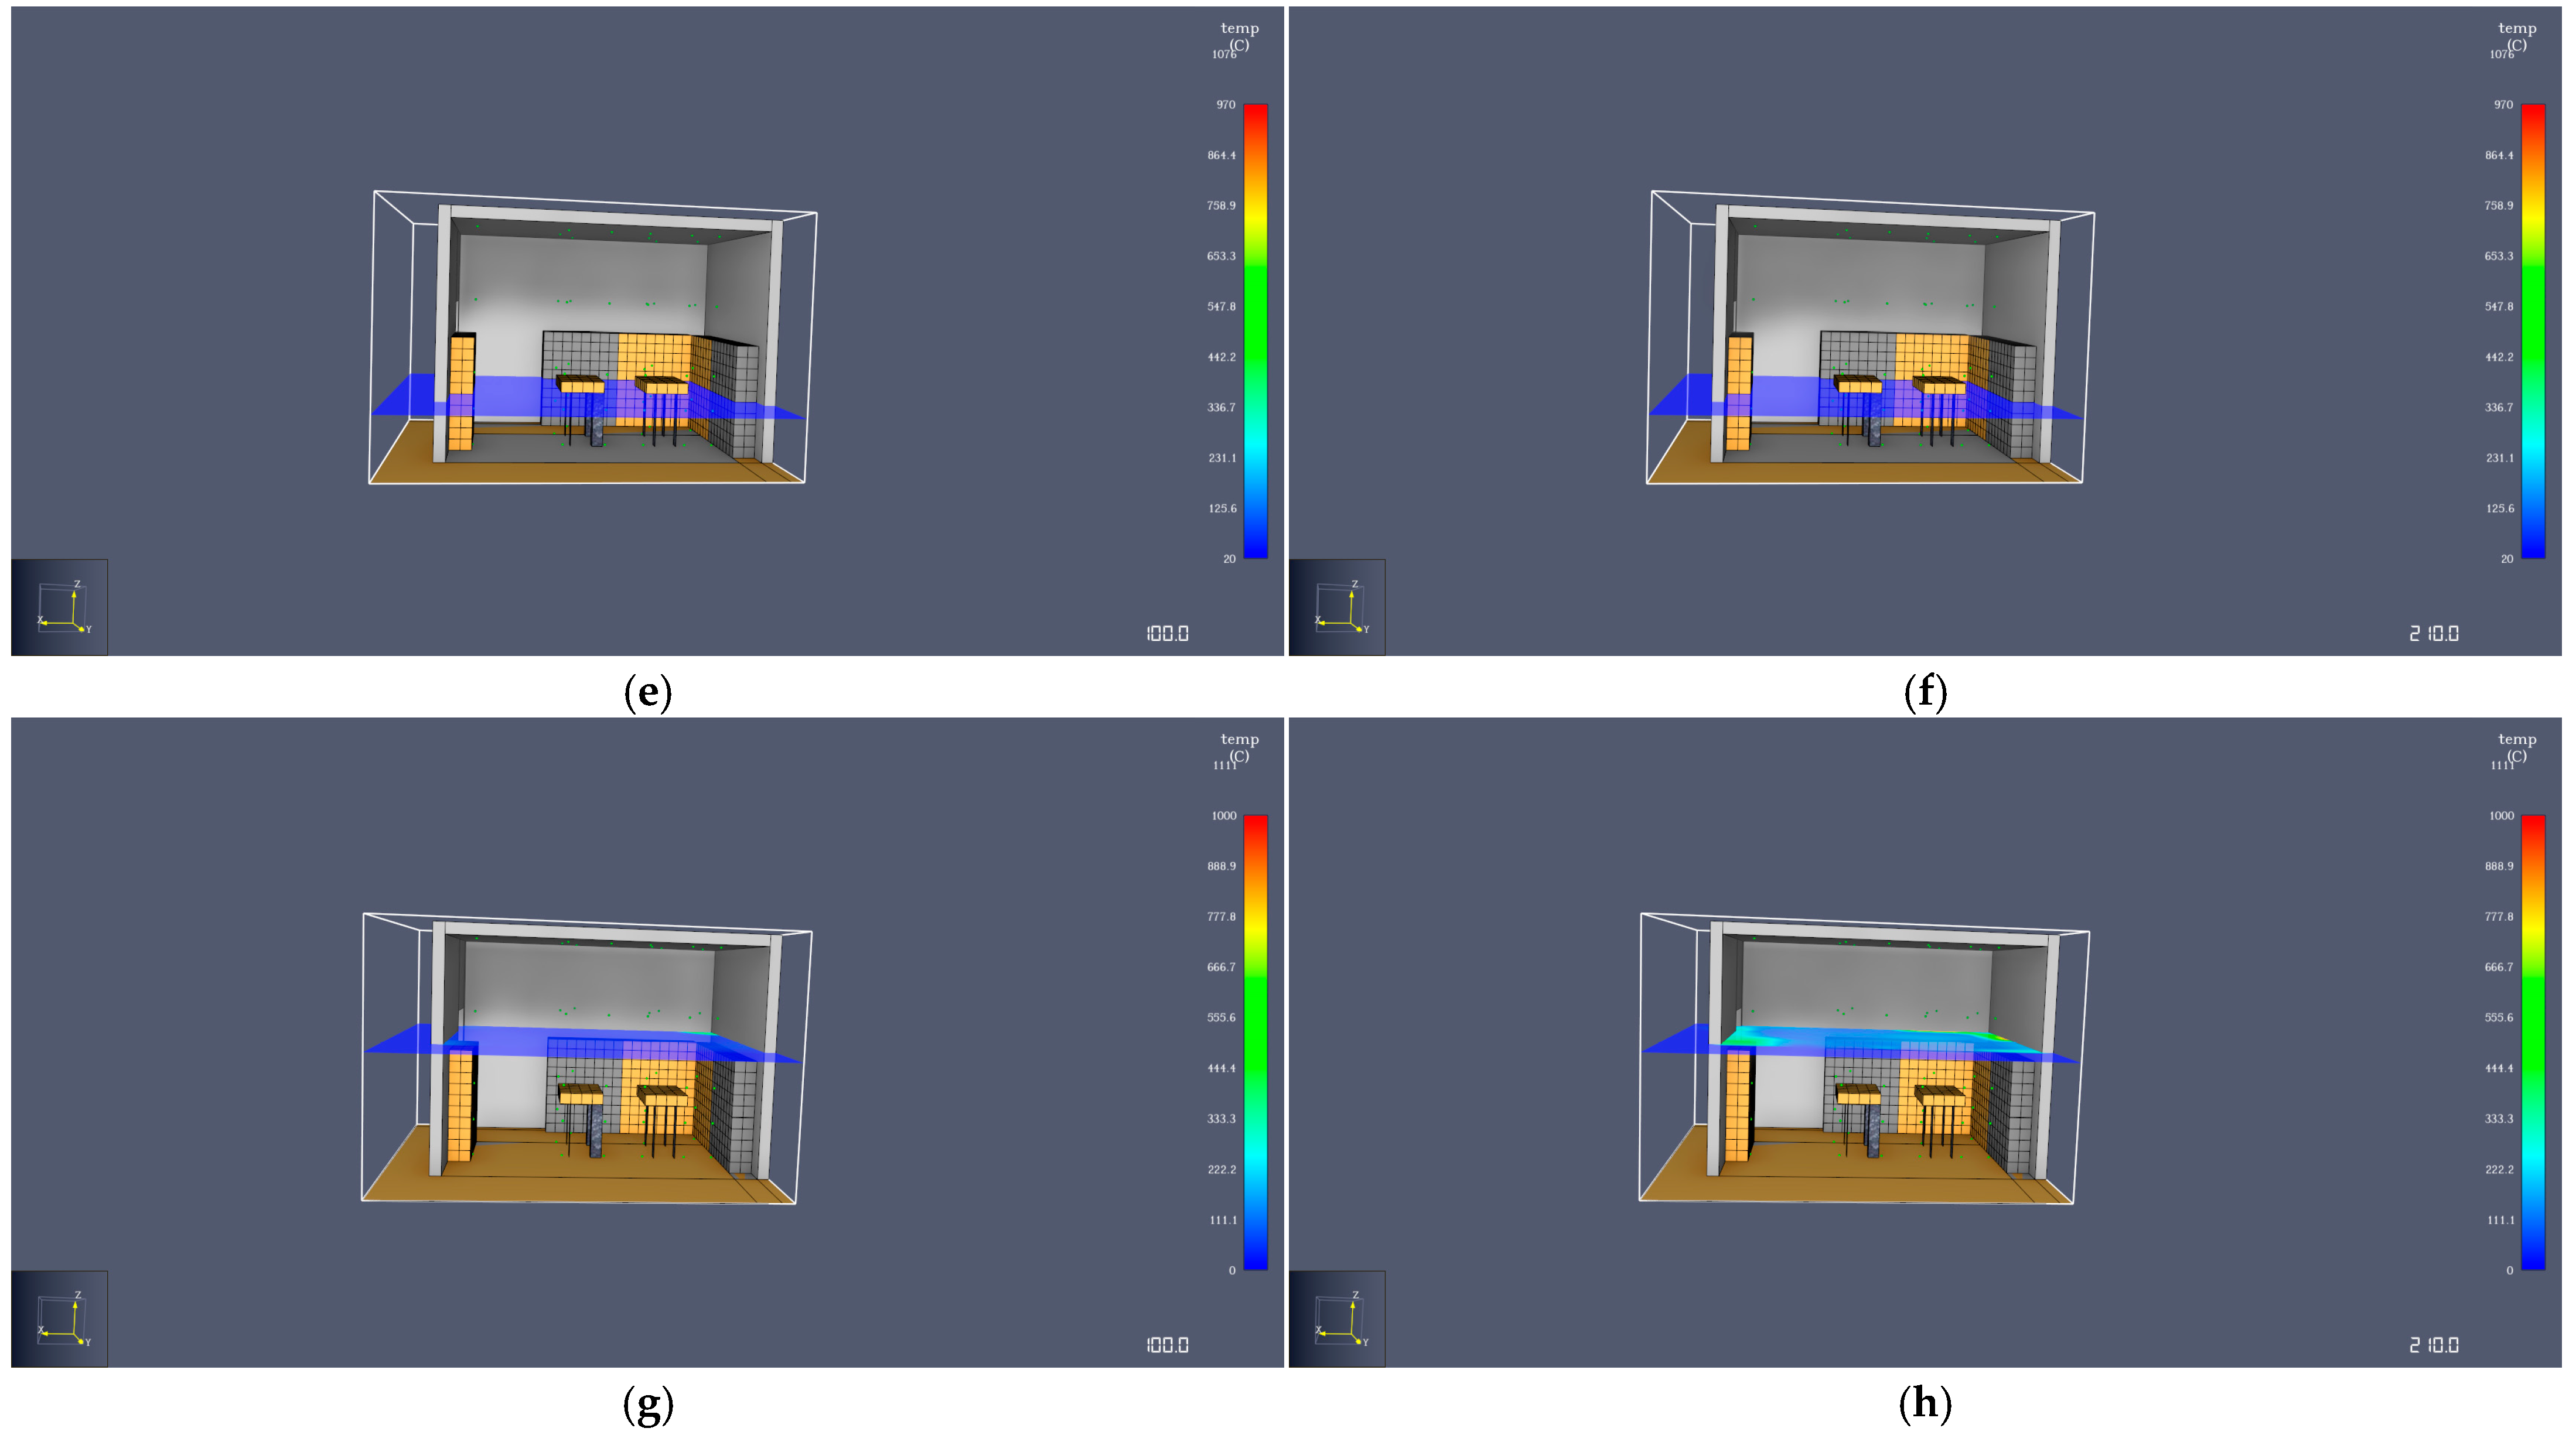
Temperature Slices
4. Conclusions
Author Contributions
Funding
Institutional Review Board Statement
Informed Consent Statement
Data Availability Statement
Conflicts of Interest
Appendix A
Appendix A.1. Model of Simulation
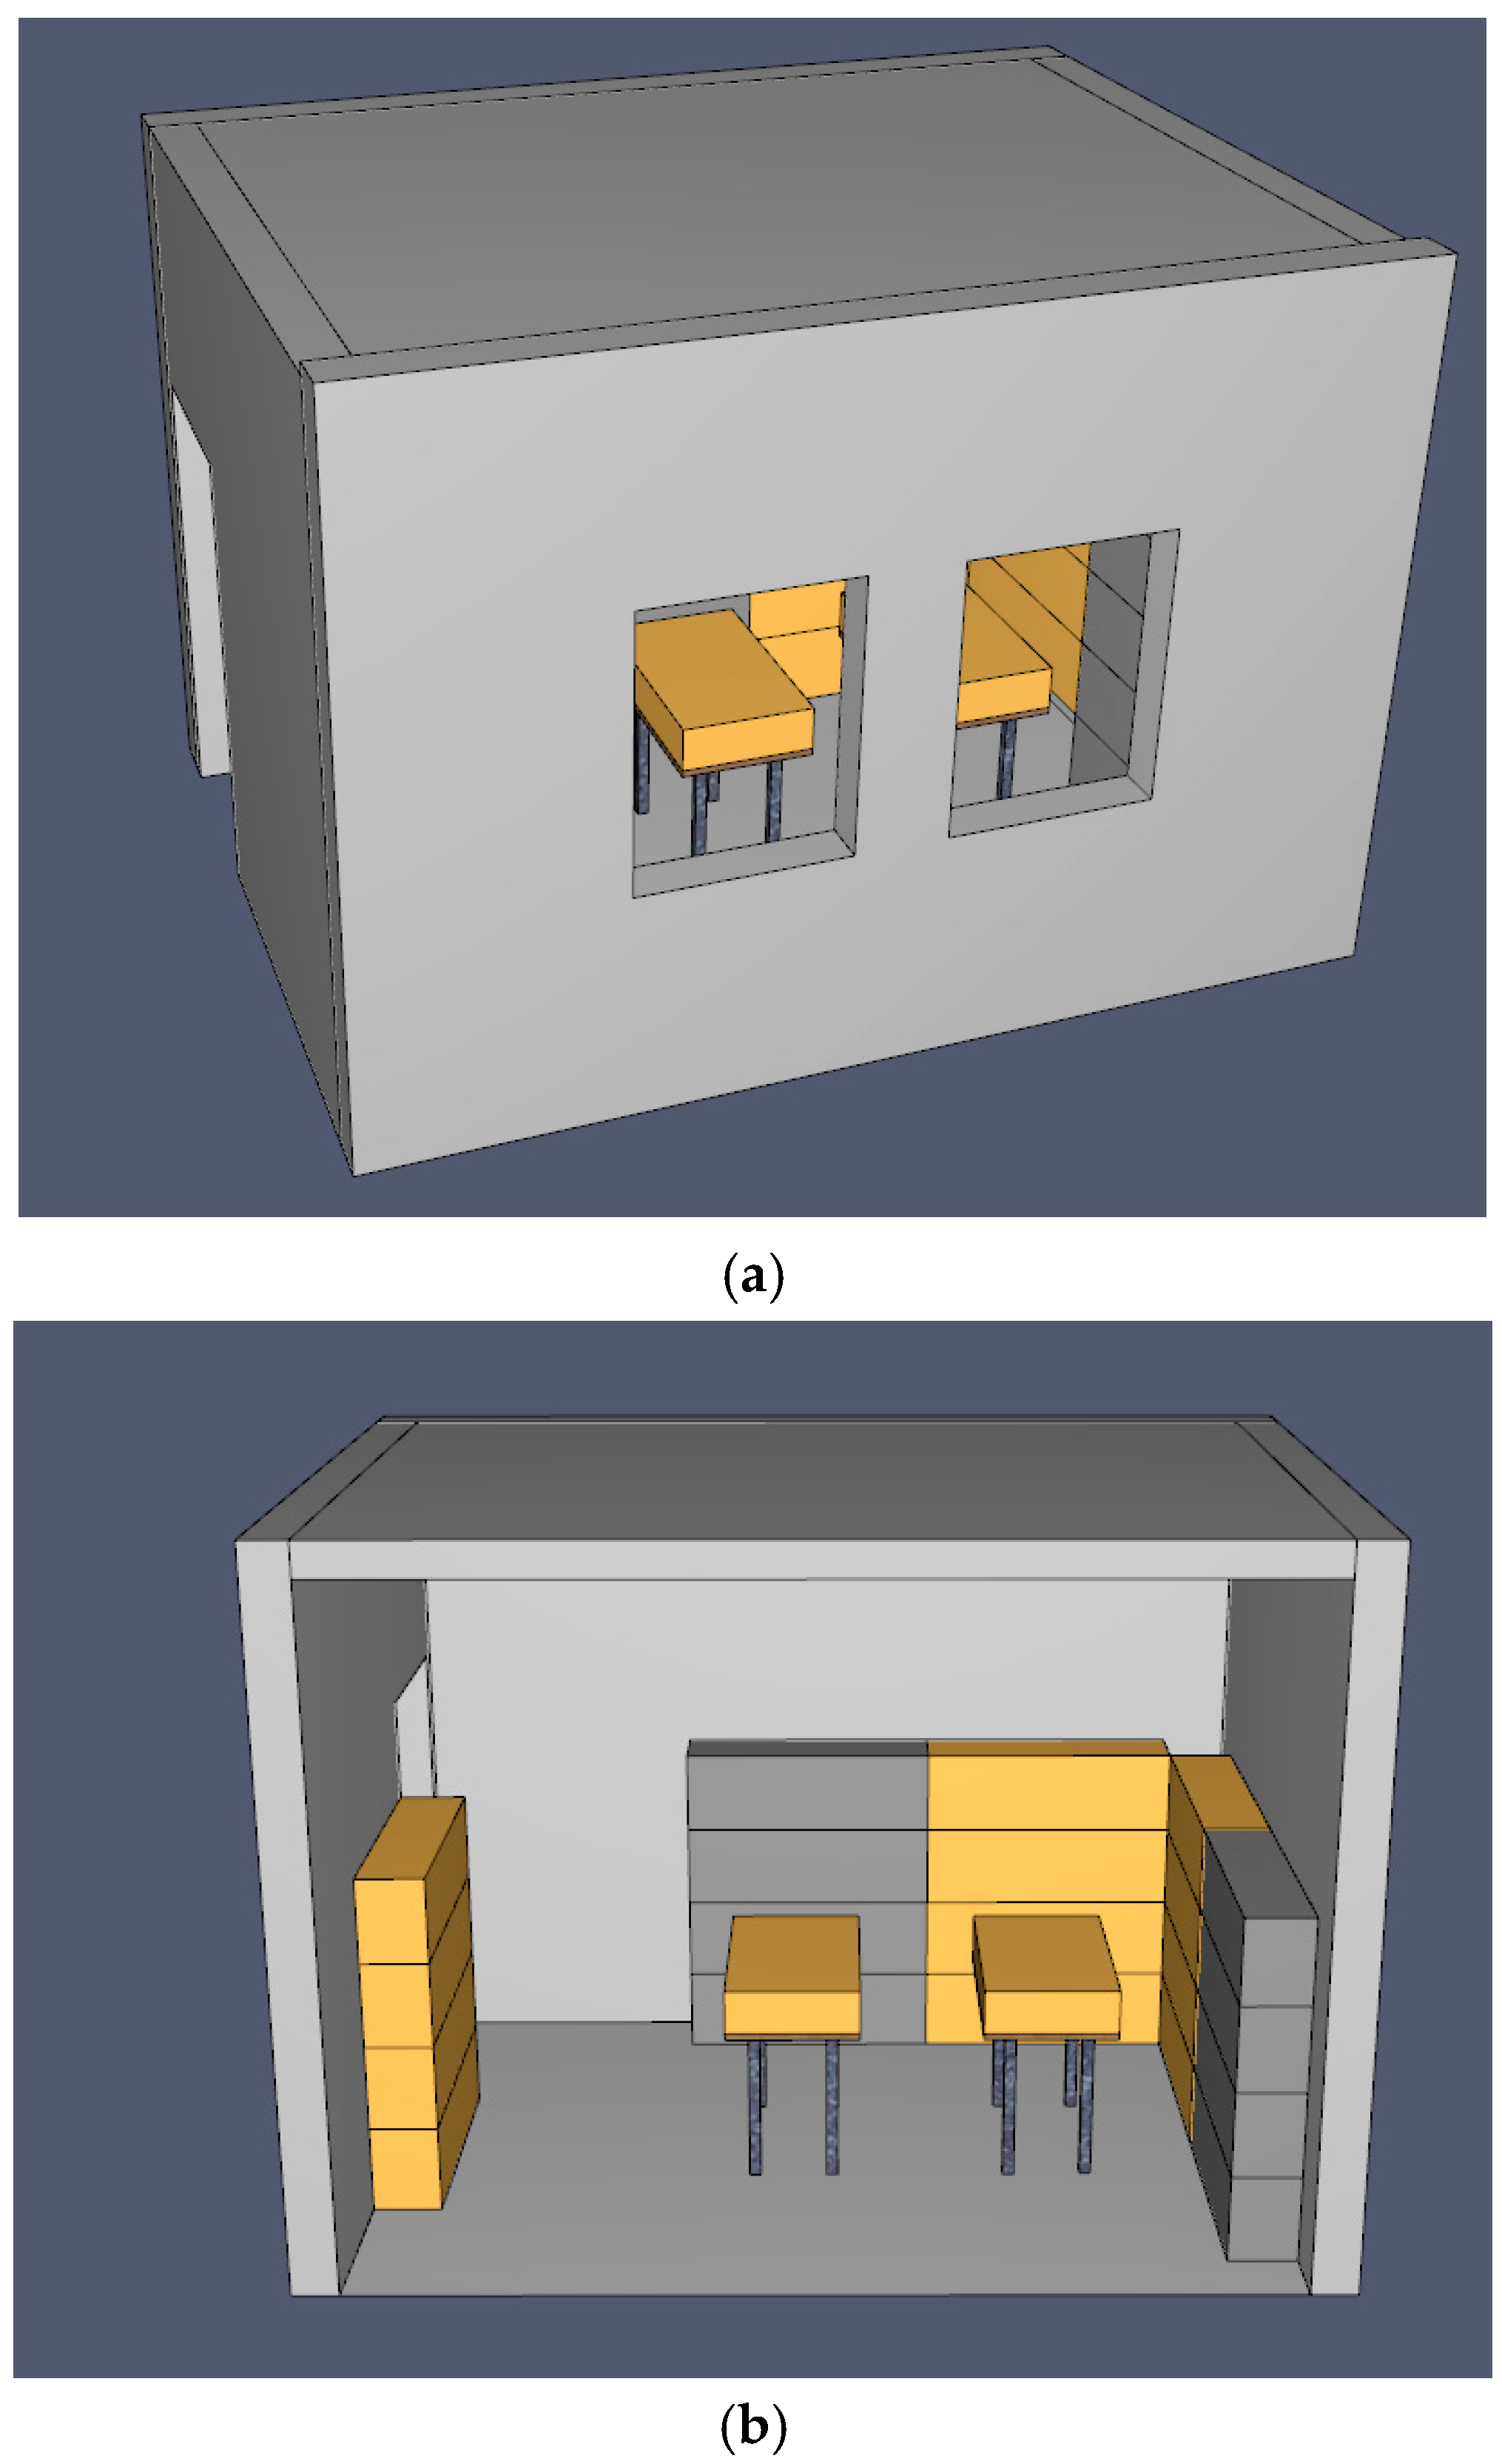
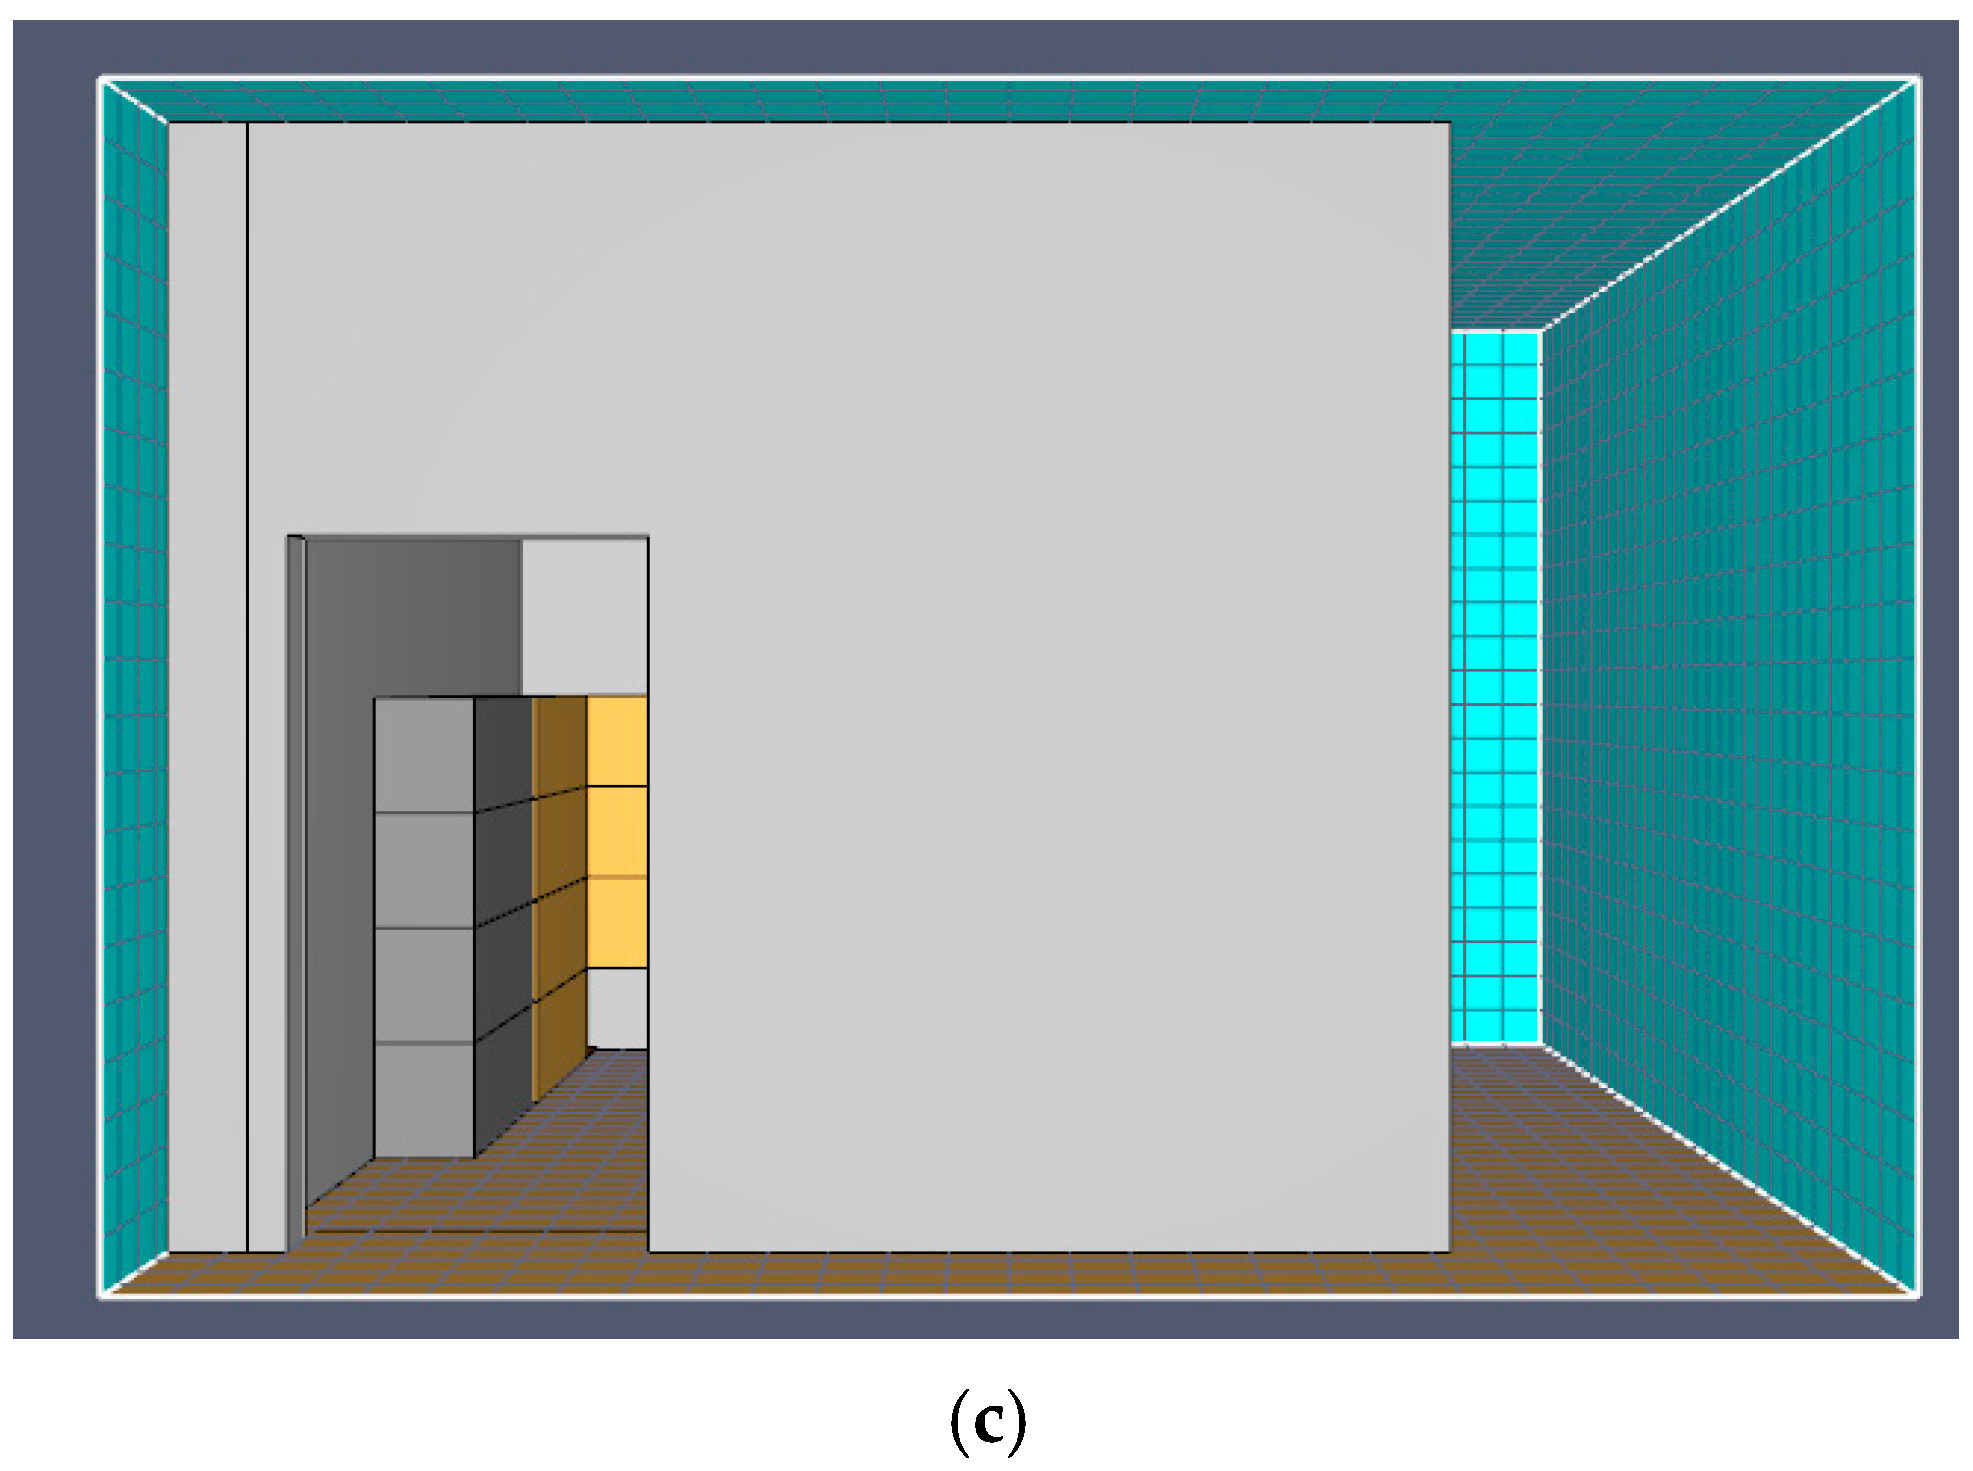
Appendix A.2. Model of Simulation

| Material Model | Heat Release Rate Per Area KW/m2 | Ramp-Up Time s | Extinguishing Coefficient |
|---|---|---|---|
| Burner | 5000 | 100 | 0 |
| Material Model | Calculated L/min | Operating Pressure Bar | K Factor L/(min·atm)2 | Median Diameter μm | Distribution |
|---|---|---|---|---|---|
| Spray model | 59.71 | 0.5 | 80 | 150 | Constant |
References
- Mohammad, A.H.; Nagib, A.A. An approach to assess fire safety requirements in library facilities. Facilities 2005, 23, 239–252. [Google Scholar]
- Ma, C.X.; Sun, B.T.; Sun, S.M.; Liu, H. Analysis of performance-based fire safety evacuation in a college library. Procedia Eng. 2012, 43, 399–406. [Google Scholar]
- Supat, P. Modeling fire evacuation of a library building based on the numerical simulation. Am. J. Appl. Sci. 2011, 8, 452–458. [Google Scholar]
- Ehab, Z.; George, H. Characterizing of design fires for clothing stores. In Proceedings of the 5th International Seminar on Fire and Explosion Hazards, Edinburgh, UK, 23–27 April 2007; pp. 328–337. [Google Scholar]
- George, H.; Ehab, Z. Development of design fires for performance-based fire safety designs. Fire Saf. Sci.-Proc. Mon. Int. Symp. 2008, 9, 63–78. [Google Scholar]
- Lee, J.; Kim, B.; Lee, S.; Shin, W.G. Validation of the fire dynamics simulator (FDS) model for fire scenarios with twoliquid pool fires in multiple compartments. Fire Saf. J. 2023, 141, 103892. [Google Scholar] [CrossRef]
- Zhao, X.L.; Wei, S.Y.; Chu, Y.Y.; Wang, N. Numerical Simulation of Fire Suppression in Stilted Wooden Buildings with Fine Water Mist Based on FDS. Building 2023, 13, 207. [Google Scholar] [CrossRef]
- Yuan, S.S.; Sun, X.; Liu, S.T.; Li, Y.Q.; Du, P. Effectiveness of cluster-based inductive ventilation system in railway tunnels: Case study using full-scale experiment and fire dynamic simulation. Case Stud. Therm. Eng. 2022, 34, 102045. [Google Scholar] [CrossRef]
- Malgorzata, K.; Aleksander, K. An experimental and numerical study on fire spread in a furnished room. Buildings 2022, 12, 2189. [Google Scholar] [CrossRef]
- Chiu, C.W.; Li, Y.H. Full-scale experimental and numerical analysis of water mist system for sheltered fire sources in wind generator compartment. Process Saf. Environ. Prot. 2015, 98, 40–49. [Google Scholar] [CrossRef]
- Yu, P.W.; Yang, W.Q.; Wu, J.K.; Zhang, F. Discussion on the application of high pressure water mist fire extinguishing system in the fire protection design of ancient buildings. Water Wastewater Eng. 2021, 47, 89–92, 101. [Google Scholar]
- Wang, Z.H. Application of high-pressure water mist fire extinguishing system in Shanghai Tower. Water Wastewater 2015, 05, 80–81. [Google Scholar]
- Xiong, W.R. Discussion on the application of water mist fire extinguishing system in cultural relics and ancient buildings. Chin. New Commun. 2017, 19, 90–91. [Google Scholar]
- Wan, X.B.; Wang, Y.Z.; Xu, G.D.; Yang, W.Y.; Li, S.; Kang, N.; Lin, J. Experimental study on fire extinguishing performance of typical large space fires on ships. Ships Offshore Struct. 2023, 1–7. [Google Scholar] [CrossRef]
- Wang, Y.; Zhu, G.; Chai, G.; Zhou, Y.; Chen, C.; Zhang, W. Experimental study on the effect of release pressure on the extinguishing efficiency of dry water. Case Stud. Therm. Eng. 2021, 26, 101177. [Google Scholar] [CrossRef]
- Wu, Z.; Chai, G.; Zhu, G. Experimental study on the effectiveness of dry water material to suppress oil pool fire and analysis of fire extinguishing mechanism. J. Therm. Anal. Calorim. 2024, 149, 10193–10212. [Google Scholar] [CrossRef]
- Yuan, S.; Chang, C.; Yan, S.; Zhou, P.; Qian, X.; Yuan, M.; Liu, K. A review of fire-extinguishing agent on suppressing lithium-ion batteries fire. J. Energy Chem. 2021, 62, 262–280. [Google Scholar] [CrossRef]
- Mahmud, H.M.I.; Moinuddin, K.A.M.; Thorpe, G.R. Experimental and numerical study of high-pressure water-mist nozzle sprays. Fire Saf. J. 2016, 81, 109–117. [Google Scholar] [CrossRef]
- Sikanen, T.; Vaari, J.; Hostikka, S.; Paajanen, A. Modeling and simulation of high pressure water mist systems. Fire Technol. 2014, 50, 483–504. [Google Scholar] [CrossRef]
- Hua, J.; Kumar, K.; Khoo, B.C.; Xue, H. A numerical study of the interaction of water spray with a fire plume. Fire Saf. J. 2002, 37, 631–657. [Google Scholar] [CrossRef]
- GB 50084-2017; Code for Design of Sprinkler Systems. Ministry of Housing and Urban-Rural Development of the People’s Republic of China: Beijing, China; General Administration of Quality Supervision, Inspection and Quarantine of the People’s Republic of China: Beijing, China, 2017.
- Liu, H.; Wang, C.; Cordeiro, I.M.D.C.; Yuen, A.C.Y.; Chen, Q.; Chan, Q.N.; Kook, S.; Yeoh, G.H. Critical assessment on operating water droplet sizes for fire sprinkler and water mist systems. J. Build. Eng. 2020, 28, 100999. [Google Scholar] [CrossRef]
- Ferng, Y.M.; Liu, C.H. Numerically investigating fire suppression mechanisms for the water mist with various droplet sizes through FDS code. Nucl. Eng. Des. 2011, 241, 3142–3148. [Google Scholar] [CrossRef]
- XF/T 1369-2016; Guidelines for Fire Safety Assessment of Crowded Places. The Standardization Administration of the People’s Republic of China: Beijing, China, 2016.
- Gupta, V.; Hidalgo, J.; Cowlard, A.; Abecassis-Empis, C.; Majdalani, H.A.; Maluk, C.; Torero, J.L. Ventilation effects on the thermal characteristics of fire spread modes in open-plan compartment fires. Fire Saf. J. 2021, 120, 103072. [Google Scholar] [CrossRef]
- GB 51251-2017; Technical Standard for Smoke Management Systems in Buildings. China Planning Press: Beijing, China, 2018.
- Cowlard, A.; Bittern, A.; Abecassis-Empis, C.; Torero, J.L. Some considerations for the fire Safe design of Tall Buildings. Int. J. High-Rise Build. 2013, 2, 63–77. [Google Scholar]
- Gann, R.G.; Hamins, A.; McGrattan, K.; Nelson, H.E.; Ohlemiller, T.J.; Prasad, K.R.; Pitts, W.M. Reconstruction of the fires and thermal environment in World trade center Buildings 1, 2, and 7. Fire Technol. 2013, 49, 679–707. [Google Scholar] [CrossRef]
- Ma, J.; Xiao, C.B. Large-scale fire spread model for traditional Chinese building communities. J. Build. Eng. 2023, 67, 105899. [Google Scholar] [CrossRef]


| Condition | HRR (MW) | Sprinkler System—Yes or No | Sprinkler Flow (L/min) |
|---|---|---|---|
| 1 | 2 | Yes | 60 |
| 2 | 2 | Yes | 80 |
| 3 | 2 | Yes | 100 |
| 4 | 2 | No | - |
| Condition | Flow Velocity (L/min) | Time (s) | Water Consumption (L) |
|---|---|---|---|
| 1 | 60 | 218 | 218 |
| 2 | 80 | 160 | 213 |
| 3 | 100 | 117 | 195 |
Disclaimer/Publisher’s Note: The statements, opinions and data contained in all publications are solely those of the individual author(s) and contributor(s) and not of MDPI and/or the editor(s). MDPI and/or the editor(s) disclaim responsibility for any injury to people or property resulting from any ideas, methods, instructions or products referred to in the content. |
© 2025 by the authors. Licensee MDPI, Basel, Switzerland. This article is an open access article distributed under the terms and conditions of the Creative Commons Attribution (CC BY) license (https://creativecommons.org/licenses/by/4.0/).
Share and Cite
Du, P.; Liu, J.; Zhang, C.; Zheng, Z.; Gu, G.; Zhao, J.; Yan, F.; Liu, S.; Li, R.; Zhang, J. Fire Test Study and FDS Verification of Spray Water Volume for Small-Sized Bookstores in the Revitalization of Historical Buildings. Fire 2025, 8, 224. https://doi.org/10.3390/fire8060224
Du P, Liu J, Zhang C, Zheng Z, Gu G, Zhao J, Yan F, Liu S, Li R, Zhang J. Fire Test Study and FDS Verification of Spray Water Volume for Small-Sized Bookstores in the Revitalization of Historical Buildings. Fire. 2025; 8(6):224. https://doi.org/10.3390/fire8060224
Chicago/Turabian StyleDu, Peng, Jing Liu, Cheng Zhang, Zhixin Zheng, Guangyue Gu, Jiaming Zhao, Feng Yan, Songtao Liu, Rutian Li, and Jun Zhang. 2025. "Fire Test Study and FDS Verification of Spray Water Volume for Small-Sized Bookstores in the Revitalization of Historical Buildings" Fire 8, no. 6: 224. https://doi.org/10.3390/fire8060224
APA StyleDu, P., Liu, J., Zhang, C., Zheng, Z., Gu, G., Zhao, J., Yan, F., Liu, S., Li, R., & Zhang, J. (2025). Fire Test Study and FDS Verification of Spray Water Volume for Small-Sized Bookstores in the Revitalization of Historical Buildings. Fire, 8(6), 224. https://doi.org/10.3390/fire8060224