Abstract
Current research on fires in high-speed train carriages mainly focuses on the temperature distribution of smoke, while the flow structure and dynamic evolution patterns of smoke have not been reviewed. This study employs numerical simulation to systematically investigate the fire ejection behavior from broken windows of a high-speed train carriage, and the influence of different broken window parameters was considered. The research results indicate that the asymmetric geometric configuration of seats on both sides of the fire source induces a lateral displacement of fire smoke toward the downstream direction due to the sidewall effect, resulting in an asymmetrical distribution of smoke flow velocity and temperature within the compartment. Compared to fire scenarios with one broken window, the presence of broken windows on both sides increases the number of smoke dispersion outlets, leading to a significant rise in smoke flow velocity around the fire source. In the aisle region far from the fire source, the smoke flow velocity decreases, consequently lowering the compartment temperature. Compared with the case of one broken window, the aisle temperature decreased by 83 K in the case of two broken windows. When the broken window is located farther from the fire source, smoke tends to accumulate extensively within the compartment before being discharged through the broken windows, which enhances the longitudinal smoke flow velocity and elevates the compartment temperature. When a window far from the fire source is breached, the temperature in the aisle increases by 270 K compared to when a window in the middle of the carriage is breached.
1. Introduction
High-speed trains have been widely acclaimed all over the world due to their speed, convenience, safety, reliability, and comfort [1]. However, with the development of high-speed trains, operation safety cannot be overlooked in the context of occurrences of fire accidents [2,3]. When a fire breaks out on a high-speed train, the safety of passengers is difficult to guarantee. In severe cases, it may damage the train, disrupt traffic, and even affect surrounding buildings, causing direct or indirect economic losses and triggering adverse social impacts [4]. It is reported that the primary cause of passenger casualties is the high-temperature smoke produced by the fire [5]. Therefore, the flow pattern and control strategies of smoke in high-speed train carriages have been of wide concern to scholars in recent decades. It is also a crucial component in ensuring the safe evacuation of passengers and the secure operation of trains in the event of fire [6].
A high-speed train carriage is a confined and narrow space. When a fire occurs inside the carriage, high-temperature smoke spreads rapidly and causes a sharp rise in temperature [7], which poses a significant threat to the evacuation of passengers [8,9]. Owing to the small distance between the carriage wall and the fire source, the air entrainment effect between the fire source and the side walls varies, thereby influencing the diffusion behavior of high-temperature smoke [10]. To address this issue, Fan et al. [11] established a small-scale experimental model to examine the influence of side walls on flame characteristics by varying the shape and position of the oil pool within a chamber. Ji et al. [12,13] conducted a series of oil pool combustion experiments, analyzing the impact of side walls on flame behavior and burning rates by adjusting the oil pool’s aspect ratio and its distance from the side walls. Furthermore, Enbaya et al. [14] employed numerical simulations to investigate fire dynamics in railway carriages, focusing on carbon dioxide concentration, temperature distribution, and airflow velocity within a compartment. Lonnermark et al. [15] carried out six fire tests using a 1/3-scale subway train model to observe fire propagation within a carriage. Zhou et al. [16] developed a numerical model for fire scenarios in high-speed train carriages, exploring the influence of vent areas, fire source power, and fire source location on the heat release rate of carriage fires.
In the event of a fire inside a high-speed train carriage, windows may break due to exposure to high-temperature flames or human intervention, establishing airflow connectivity between the interior and exterior. The high-temperature smoke generated by fire can escape through the broken windows [17], while fresh air from the outside enters the carriage, potentially intensifying fire spread and complicating fire suppression efforts [18,19]. Peng et al. [20,21,22] conducted scaled-down subway train fire experiments to investigate fire propagation characteristics, obtaining temperature contour distributions under the ceiling and near cabin doors and analyzing smoke temperature variations under different fire locations and door conditions. He et al. [23] experimentally examined temperature distribution patterns in a 1/8-scale tunnel carriage model, focusing on flame morphology and internal temperature profiles. Zhang et al. [24] performed a series of experiments using a 1/11-scale model to evaluate the impact of carriage fires on maximum temperature distribution, proposing dimensionless models for predicting maximum temperature rise under various fire scenarios. Chen et al. [25] developed fire models for intercity trains under different conditions, determining smoke distribution patterns and visibility levels following ignition. Xi et al. [26,27] introduced side openings in scaled carriage models to simulate window breakage during fires, analyzing the relationships between maximum temperature rise, fire source power, and opening size. Kong et al. [28] employed a Fire Dynamics Simulator (FDS) to simulate carriage fires, considering different ignition locations to optimize fire detection and alarm system design. Shi et al. [29] conducted full-scale fire tests in subway carriages, investigating fire development within the first three minutes and analyzing smoke temperature and toxic gas concentration dynamics.
The literature review indicates that existing research on fire overflow behavior in train carriages primarily focuses on the temperature distribution patterns within a carriage. However, the intricate internal structure of high-speed train carriages plays a crucial role in influencing the velocity and extent of smoke diffusion. Previous studies have not effectively integrated the analysis of smoke diffusion characteristics with flow field distribution patterns, particularly lacking an in-depth investigation into the velocity and direction of smoke flow at critical locations both inside and outside the carriage. When a fire occurs in a high-speed train carriage, the spatiotemporal evolution of smoke diffusion under the combined influence of multiple driving forces remains insufficiently understood. This research gap necessitates further investigation, with the goal of providing a scientific basis and technical support for fire prevention, suppression strategies, and passenger evacuation planning.
In this study, numerical simulations were employed to investigate fire overflow behavior in high-speed train carriages. Various fire scenarios were established by altering the number and locations of broken windows. This study examined the flow field structure both inside and outside a carriage following a fire incident and analyzed the longitudinal and transverse temperature distribution patterns along the carriage ceiling. Furthermore, by comparing the smoke mass flow rates at different broken windows, the dynamics of smoke escape from the carriage were evaluated. In addition, temperature variations on the outer surface of the train were analyzed to assess the thermal impact of fire-induced smoke dispersion.
2. Numerical Simulation
2.1. Numerical Method
This study employed numerical simulation methods to analyze the smoke diffusion and fire ejection behavior from broken windows of a high-speed train carriage under the coupled interaction of internal and external flow fields. The commercial software Siemens Star CCM+ 1706 was utilized for simulating various fire scenarios. To better capture the influence of flow fields on smoke dispersion, the improved delayed detached eddy simulation turbulence model (based on the SST k-ω) was adopted for numerical computations. This model has been extensively validated in studies of flow fields around high-speed trains [30,31]. A second-order upwind scheme was used for the turbulent quantities. A second-order implicit scheme was used for time integration. The time step in numerical simulations was determined based on the Courant–Friedrichs–Lewy (CFL) condition to ensure the accuracy of the simulation results.
2.2. Combustion Model
There are three primary methods for simulating combustion processes: the finite-rate chemistry model, the fast chemical reaction model, and the volume heat source (VHS) model. Since this study focused on smoke diffusion and fire ejection behavior from the broken windows of a high-speed train carriage, specifically analyzing smoke diffusion patterns under different fire scenarios and their thermal interaction with indoor/outdoor flow fields, the volumetric heat source model, commonly used in engineering studies of smoke dispersion, was adopted to simplify combustion processes. Previous studies indicate that the fire source power can be well approximated by a quadratic function [28], as shown in Equation (1):
where represents HRR (kW); represents the fire growth coefficient (kW/s2); represents the time after ignition (s); and is the time required for effective combustion to begin (s). Considering a relatively severe fire development scenario, the fire growth type was simulated as an ultra-fast t² fire (α = 0.1876). The heat release rate (HRR) of the carriage fire reached its peak value of 2.0 MW at 103.3 s. The temporal variation of the HRR during the numerical simulation is illustrated in Figure 1.
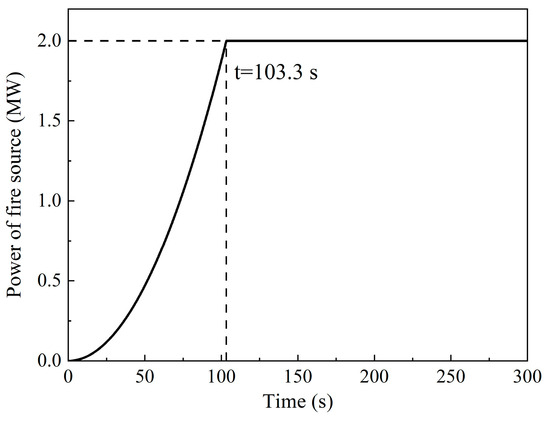
Figure 1.
The law of change of heat release rate with time.
In the heat transfer analysis of compartment fires, it is crucial to accurately consider radiation heat transfer as it significantly impacts the precision of simulation results. During fire incidents, there typically exists a substantial temperature difference between the fire source and the surrounding environment, making radiation heat transfer the dominant mechanism. Therefore, when investigating heat transfer behavior in compartment fires, it is imperative to comprehensively account for the role of thermal radiation. Depending on the specific characteristics of the studied problem, certain radiation models may demonstrate superior applicability compared to others. The selection of an appropriate radiation model is influenced by multiple factors. In simulations involving participating media capable of absorbing, emitting, or scattering thermal radiation, the Discrete-Ordinates Method (DOM) is generally employed to accurately capture radiation transfer effects.
2.3. Model Description and Boundary Conditions
As illustrated in Figure 2, the combined length of the trainset is 79.88 m, with a width of 3.36 m and a height of 4.05 m. In this study, the fire source was strategically placed at the center of the middle carriage to represent various fire scenarios. The internal configuration of the carriage, including seats, luggage racks, and windows, was preserved to accurately capture the influence of structural components on the propagation of high-temperature smoke during a fire event. The middle carriage is equipped with 18 windows symmetrically distributed on both sides. Each window measures 1.45 m in length and 0.7 m in height, with an interval spacing of 1.92 m between adjacent windows. The bottom edge of each window is positioned 0.7 m above the carriage floor.

Figure 2.
High-speed train carriage model: (a) overall layout; (b) window arrangements.
The boundary conditions are set as shown in Figure 3. The computational domain has dimensions of 29.72 H in length, 20 H in width, and 10 H in height, where H represents the height of the high-speed train model. This study investigates the smoke transport and fire spillage behavior following a fire outbreak inside the train compartment. By opening windows at different positions to establish connectivity between the internal and external flow fields, the fire smoke freely passes through the ruptured windows, achieving coupled flow field interactions between the compartment interior and exterior. According to the literature [32], the perimeter of the computational domain is defined as a pressure outlet with a gauge pressure of 0 Pa. The train body and all internal components within the carriage are treated as walls. The external surface of the train is specified as a no-slip wall, with the wall material defined as aluminum alloy. The material properties of the aluminum alloy were set as follows: density of 7850 kg/m3, thermal conductivity of 3 W/(m·K), and specific heat capacity of 500 J/(kg·K). The ambient temperature inside and outside the compartment was maintained at 300 K, with an atmospheric pressure of 101 kPa.

Figure 3.
Computational domain: (a) size of domain; (b) interior and exterior structure of the carriage.
2.4. Mesh Description and Sensitivity Test
Figure 4 illustrates the grid division method employed in this study. After a fire occurs in a carriage, it is crucial to accurately capture the smoke transport patterns and simulate temperature distributions both inside and outside the carriage. In numerical simulations of smoke diffusion and fire ejection behavior by thermal buoyancy, the non-dimensional expression is typically used to determine grid size, where represents the grid dimension, and represents the characteristic fire diameter, which can be calculated using Equation (2):
where represents the specific heat capacity of air, Q represents the maximum power of the fire source, represents the air density of the simulated scenario, represents the ambient temperature, and represents the gravitational acceleration. The characteristic fire diameter calculated in this study is 1.26 m, with a recommended range of 4–16 for .

Figure 4.
Mesh description: (a) side view; (b) front view.
For this paper, a hybrid Cartesian grid and prism layer mesh method was adopted to effectively capture the flow field structure after a fire occurs in the train compartment. To accurately resolve near-wall flow dynamics, 12 prism layers were applied to simulate the boundary layer on the train walls, with a mesh growth rate of 1.15. Cartesian grids were used in other regions. Since the fire source was located at the compartment’s midpoint, the smoke flow velocity and temperature variations near the middle car were more significant throughout the fire development. To address this, progressive local refinement was implemented, and the mesh size around the middle car was set to 0.05 , and the mesh size around the head and tail car regions was set to 0.1 . This hybrid meshing approach ensures a balance between computational accuracy and efficiency. The total number of computational cells in the domain is approximately 40.7 million.
To analyze the influence of mesh sizes on numerical simulation results, three sets of meshes (coarse, medium, and fine) were employed to verify the influence of the computational domain mesh size on numerical calculation outcomes. The detailed mesh generation methods are provided in Table 1.

Table 1.
Three different density mesh details.
Figure 5 shows the temperature variation along the longitudinal direction of the train at a height of 2.0 m above the carriage aisle under different mesh sizes. It is indicated that the maximum temperature difference calculated by coarse and fine mesh sizes is 8.87%, while the difference between medium and fine mesh sizes is 2.19%. Considering both computational accuracy and efficiency, this study adopted a medium grid size for simulation.
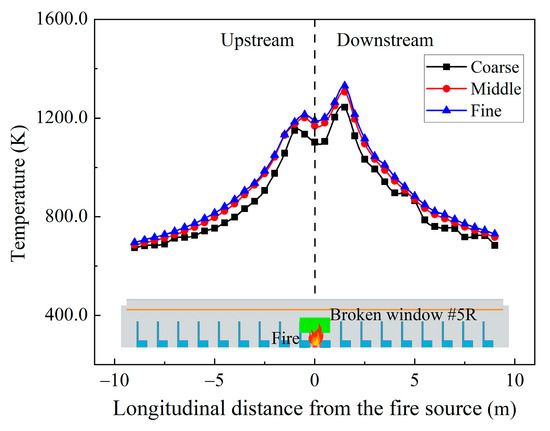
Figure 5.
Temperature distribution at 2.0 m height inside a carriage under different mesh sizes.
2.5. Model Validation
A full-scale fire combustion test was conducted on the high-speed train compartment fire smoke transport full-scale test platform at the Key Laboratory of Traffic Safety on Track (Central South University, Changsha, China), as shown in Figure 6. An oil pool was employed to simulate the combustion conditions of an actual fire source. The fuel in the pool was anhydrous ethanol with a combustion heat value of 26.9 kJ/g. During the experiment, the fire source was positioned at the center of the aisle, with the oil pool measuring 0.25 × 0.25 m in area. An electronic balance was utilized to monitor the remaining fuel mass in the pool in real time, and thermocouples were arranged at a height of 2.0 m inside the compartment to measure temperature variations throughout the fire development process.
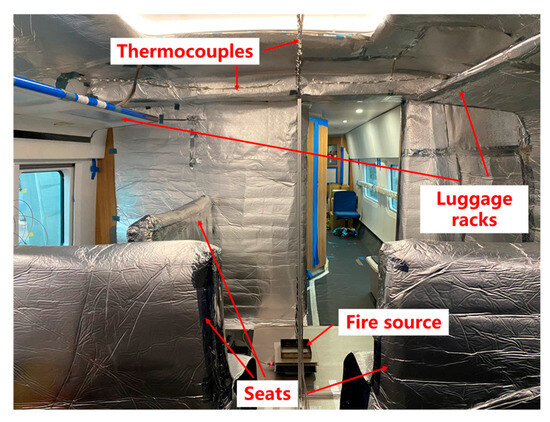
Figure 6.
Full-scale test platform for fire smoke diffusion in high-speed train carriages.
When processing experimental data, the temporal variation of the heat release rate (HRR) during fire development can be calculated based on the consumed fuel mass. Figure 7 illustrates the HRR variation calculated from the experimentally measured residual fuel mass. To better simulate the smoke transport patterns following a fire inside the train compartment, a geometric model with identical dimensions to the experimental train compartment was established. During the validation of numerical simulations, the variation pattern of the HRR was kept identical to that obtained from the experimental measurements.
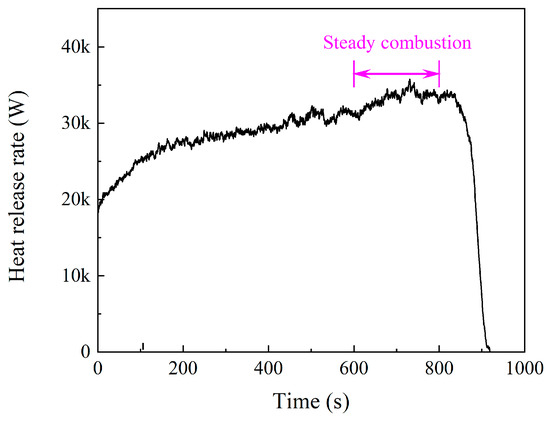
Figure 7.
Temporal variation pattern of heat release rate (HRR) from fire source during real vehicle tests.
Figure 8 shows the time-varying temperature curves recorded at different measurement points on the compartment roof throughout the entire experimental process. As illustrated, the ceiling temperature exhibited a rapid upward trend during the initial stage of the fire. As the fire continued to develop, the temperature rise beneath the compartment roof gradually slowed and eventually stabilized between 600 s and 800 s. The numerical simulation results closely reflect the patterns of temperature variation within the compartment. During the early fire stage, slightly larger temperature discrepancies were observed between the numerical simulations and experimental results at measurement points near the fire source. This can be attributed to significant fluctuations in the flow field during the initial fire development phase, which affected the temperature distribution within the compartment.
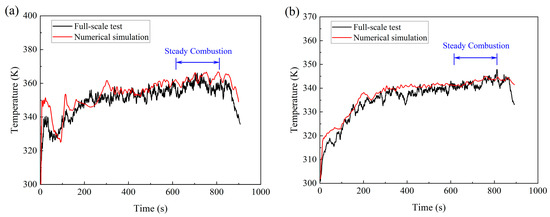
Figure 8.
Real-time temperature of measuring points at different positions under carriage ceiling: (a) a measuring point directly right above the fire source; (b) a measuring point with a longitudinal distance of 0.7 m from the fire source.
Figure 9 depicts the longitudinal and transverse temperature distribution during the stable combustion phase of the carriage ceiling. The temperature distribution patterns derived from numerical simulations closely match the full-scale experimental results, with relatively minor discrepancies observed at most measurement points. The numerical simulations accurately reproduce the longitudinal and transverse distribution patterns of the carriage ceiling.
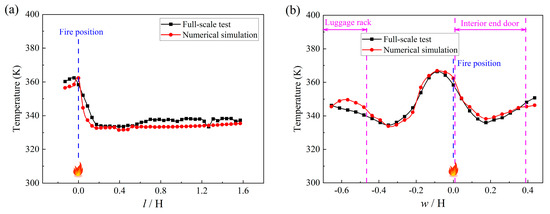
Figure 9.
Temperature distribution at the carriage ceiling in the stable combustion stage: (a) longitudinal temperature distribution; (b) transversal temperature distribution.
3. Results and Discussion
In the event of a fire within a high-speed train carriage, the glass windows are subjected to high-temperature smoke, resulting in a significant temperature gradient between the two sides of the glass. In emergency situations, passengers may break the windows to facilitate escape. Once the window glass breaks, a connection is established between the internal and external flow fields of the carriage. High-temperature smoke generated by the fire then diffuses toward both ends of the carriage and escapes outward through the broken window. Initially, the distribution pattern of the smoke flow velocity both inside and outside the carriage following a fire is presented. Building upon this, a comprehensive investigation was conducted into the characteristics of smoke dispersion and fire overflow behavior within the carriage. The longitudinal and lateral temperature distributions along the carriage ceiling were analyzed, and by comparing the mass flow rate of smoke through the broken window, the escape of smoke to the exterior was examined. Additionally, a comparative study was performed to assess the temperature differences on the outer surface of the train’s walls.
3.1. Fire Ejection Behavior with Different Numbers of Broken Windows
This section investigates the fire overflow behavior following window breakage in high-speed train carriages under varying conditions of the number of broken windows. In all scenarios, the position and power of the fire source remain constant. Horizontally, the fire source is positioned on one side of the double seats, adjacent to broken window #5R, with a lateral distance of 0.80 m from the centerline of the aisle. Vertically, the fire source is located at the midpoint of the carriage, 9.34 m from both ends. The maximum power of the fire source is 2.0 MW. Two types of window breakage are considered: one broken window refers to the rupture of window #5R, while two broken windows involve the simultaneous breakage of windows #5R and #5L, as illustrated in Figure 10.
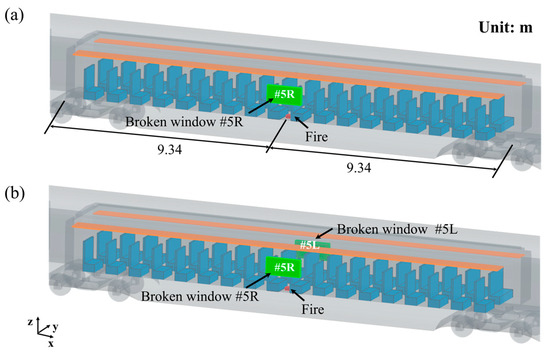
Figure 10.
Numerical model of carriage fire with different numbers of broken windows: (a) one broken window; (b) two broken windows.
Figure 11 illustrates the variation patterns of flow velocity and temperature at different positions inside and outside the carriage during the entire fire development process under the condition of one broken window. As shown in the figure, both velocity and temperature values rapidly increase during the initial fire stage. At 103.3 s, the heat release rate (HRR) reaches a maximum, after which the variation in the velocity and temperature within the carriage begins to decelerate. From 250 s onward, the velocity and temperature at various positions gradually attain a dynamic equilibrium state. To better define the stable phase of fire development, a comparative analysis was conducted between the average velocity and temperature values over the intervals of 250–300 s and 250–600 s. The results indicate minimal differences between these two intervals, and the average values from the steady-state interval of 250–300 s were adopted in subsequent studies.
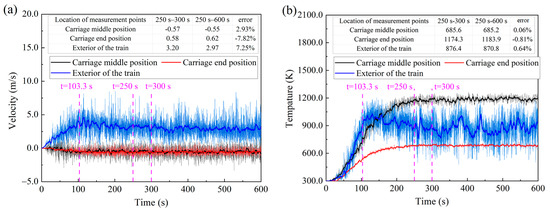
Figure 11.
Temporal variation patterns of velocity and temperature at different positions inside and outside the carriage: (a) velocity; (b) temperature.
3.1.1. Flow Field Structure
Figure 12 presents the longitudinal velocity distribution contour along the longitudinal section of the aisle in a high-speed train carriage under different numbers of broken windows. In the carriage, smoke generated by the fire primarily diffuses vertically due to thermal buoyancy. Upon encountering obstacles such as the luggage rack or the ceiling above the fire source, the smoke undergoes a transition into radial motion. When the smoke encounters the side walls of the carriage, it ultimately shifts to longitudinal diffusion, propagating along the length of the train and filling the entire compartment. As shown in the figure, the distribution pattern within the carriage remains relatively consistent under varying conditions. Near the carriage roof, smoke diffuses from the fire source toward both sides of the carriage. Conversely, on the carriage floor, the airflow direction is toward the fire source.

Figure 12.
Longitudinal velocity distribution of longitudinal section in the center of high-speed train carriages aisle: (a) one broken window; (b) two broken windows.
The rate at which smoke propagates through the carriage aisle and luggage rack areas is a critical factor that influences the fire hazard level within the compartment. To more effectively analyze the variation patterns of longitudinal airflow velocity during a fire, a quantitative comparison of the distribution at a height of 2.0 m was conducted at both the center of the aisle and the luggage rack areas on either side of the carriage, as shown in Figure 13. As the longitudinal distance from the fire source increases, the velocity first increases and then decreases. When two windows are broken, the smoke diffuses more from the broken windows toward the outside of the carriage, resulting in lower smoke velocities at the luggage racks above the double seats and the central aisle. However, in the luggage rack area above the triple seats, the smoke velocity is higher when the two windows are broken. This occurs because the lateral diffusion of smoke exerts a greater impact on the carriage walls, amplifying the pressure difference between the middle and both ends of the carriage, thereby increasing the smoke velocity.

Figure 13.
variation law at the height of 2.0 m in the carriage along the length of the train under different numbers of broken windows: (a) luggage rack above the double seats; (b) center of the aisle; (c) luggage rack above the triple seats.
Figure 14 compares the transversal velocities at different heights above the fire source within a high-speed train carriage. As shown in the figure, at a height of 1.2 m, when two windows are broken, the ventilation opening area of the carriage increases, allowing smoke to disperse through window #5L to the outside. Consequently, the transverse flow velocity of smoke is lower in the near-fire source area, while higher in regions far from the fire source. At a height of 1.6 m, with only one window broken, the smoke flow velocity near the fire source remains relatively low. In areas far from the fire source, the direction of smoke flow differs between the two fire scenarios. At 2.0 m height, when two windows are broken, smoke preferentially diffuses toward window #5L with greater velocity, driven by enhanced airflow pathways and pressure differentials.

Figure 14.
Transversal velocity variation law at different heights in the carriage above the fire source: (a) 1.2 m; (b) 1.6 m; (c) 2.0 m.
Figure 15 illustrates the distribution pattern of airflow velocity along the height direction at different longitudinal distances from the fire source outside the carriage ( represents resultant velocity). Inside the train carriage, the asymmetry of the seat structure surrounding the fire source causes smoke to deflect toward the downstream of the fire. Simultaneously, high-temperature smoke escapes through the broken windows, resulting in a greater downstream velocity of the smoke outside the carriage on the side closer to the fire source (near the #5R window). In the fire source and upstream regions (X = 0 m, and X = −0.4 m), the airflow velocity outside the carriage is highest at the position between the window and the ceiling when one window is broken and lowest on the side opposite the fire source when two windows are broken. In the upstream region of the fire source (X = 0.4 m), the airflow velocity is greater on the side closer to the fire source. A comparison of the two broken window scenarios reveals that in regions of greater height, the smoke flow velocity is higher when two windows are broken, which can be attributed to the smoke deflection effect.
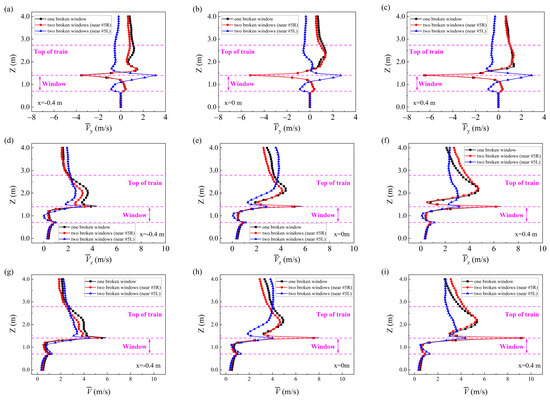
Figure 15.
Velocity distribution outside the carriage of different longitudinal distances from the fire source along the height direction under different numbers of broken windows: (a–c) at different longitudinal distances from the fire source; (d–f) at different longitudinal distances from the fire source; (g–i) at different longitudinal distances from the fire source.
3.1.2. Smoke Movement Characteristics
Figure 16 illustrates the distribution patterns of fire smoke inside and outside a high-speed train carriage under different window breach scenarios. Following a fire inside the carriage, a portion of the high-temperature smoke accumulates within the vehicle and spreads along the length of the carriage toward both ends, while another portion escapes through the broken windows to the outside. The high-temperature zones are concentrated near the fire source inside the carriage. A comparison of the temperature distribution of high-temperature smoke inside and outside the carriage under different window breach conditions reveals that when windows on both sides are shattered, the smoke generated by the fire disperses more easily through the breaches on both sides, leading to lower temperatures and a reduced spread range of high-temperature smoke.
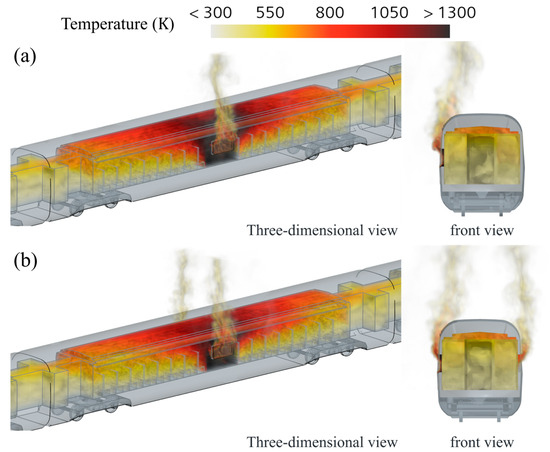
Figure 16.
Smoke movement inside and outside the carriage: (a) one broken window; (b) two broken windows.
Figure 17 presents a cloud diagram of the temperature distribution of smoke at the center of the aisle. During a fire inside the carriage, the air above the fire source is propelled by thermal buoyancy and impacts the carriage ceiling. The fire smoke, obstructed by the luggage racks, transitions from vertical to radial movement and rapidly spreads along the length of the carriage. Due to the asymmetry of the seat structures on both sides of the fire source, the fire smoke diffuses toward the downstream side of the fire source, thereby affecting the temperature distribution pattern at the center of the aisle. As depicted in the figure, the high-temperature zone shifts toward the downstream side of the fire source, with the temperature inside the carriage being notably higher in the case of one window broken compared to when two windows are broken.

Figure 17.
Temperature distribution in the center of high-speed train carriages aisle: (a) one broken window; (b) two broken windows.
Figure 18 illustrates the variation pattern of the average temperature along the length of the carriage at a height of 2.0 m in different areas. The peak temperature points inside the carriage for various fire source locations are found downstream of the fire source, a result influenced by the carriage seat structure and the position of the window breaches. The highest peak smoke temperature occurs at the center of the aisle, while the lowest is observed above the triple seats, attributable to the temperature barrier effect of the luggage racks and the increased distance from the fire source. In both the center of the aisle and above the triple seats, a temperature trough appears near the fire source, which is caused by the “hydraulic jump” phenomenon when the fire smoke impacts the carriage ceiling and side walls. When windows on both sides are breached, the area available for smoke to disperse outside the carriage increases, leading to greater energy loss from the fire source to the outside and, consequently, lower temperatures inside the carriage. Specifically, the temperature decreases by 100 K, 83 K, and 27 K in the areas above the luggage racks of the double seats, the center of the aisle, and the luggage racks above the triple seats, respectively, when windows on both sides are breached.

Figure 18.
Temperature distribution at the height of 2.0 m in the carriage along the length of the train under different numbers of broken windows: (a) luggage rack above the double seat; (b) center of the aisle; (c) luggage rack above the triple seat.
3.1.3. Fire Ejection Behavior
To analyze the mass flow rate in the broken window regions in detail, the window was evenly divided into 16 zones, and real-time monitoring was performed during the numerical simulation process. A positive value of mass flow rate indicates flow direction toward the carriage interior, while a negative value denotes flow direction toward the carriage exterior. Figure 19 illustrates the mass flow distribution across the broken window regions. From Figure 19a, when one window is broken, the maximum outward mass flow rate (negative) occurs in the (Nx, Nz) = (4, 4) zone, while the maximum inward flow (positive) is observed in the (Nx, Nz) = (1, 2) zone. This is attributed to the smoke tilting downstream of the fire source. In Figure 19b, when two windows are broken, the mass flow distribution pattern in the #5R window area remains consistent with the one broken window scenario, albeit with slight numerical differences. In the #5L window area, there is a significant difference in the mass flow rate distribution pattern. Specifically, the smoke mass flow rate within the #5L window exhibits a symmetrical distribution along the upstream and downstream directions relative to the fire source.
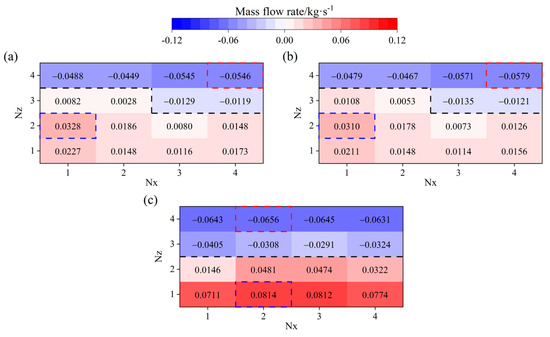
Figure 19.
Mass flow distribution at broken windows: (a) #5R window of one broken window; (b) #5R window of two broken windows; (c) #5L window of two broken windows.
Figure 20 presents a comparison of the mass flow rates through the entire broken window under different fire scenarios. When two windows are broken, the mass flow rate from broken window #5R to the exterior of the carriage increases, while the mass flow rate of air entering the carriage decreases. For the entire window, the total mass flow rate exhibits an increasing trend. In the broken window #5L area, the mass flow rates in both directions exhibit higher values. For the entire carriage, when two windows are ruptured, the gas exchange between the interior and exterior of the carriage intensifies, which may enhance the transfer of heat to the exterior of the carriage.
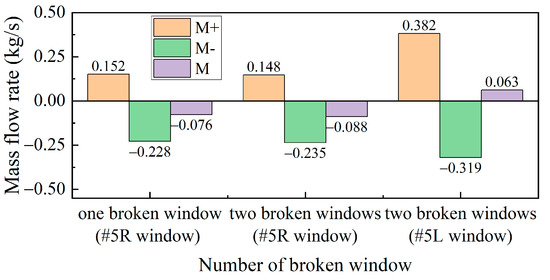
Figure 20.
Mass flow rate of each broken window under different number of broken windows.
Figure 21 illustrates the temperature distribution patterns on the exterior wall of the train carriage under different numbers of window breaches. The fire smoke escapes through the breached windows, dispersing outside the carriage. Due to the sidewall effect caused by the seats adjacent to the fire source, the smoke drifts toward the downstream side of the fire source as it exits the carriage, resulting in higher smoke temperatures on the exterior wall in the downstream region. As the number of broken windows increases, the temperature on the exterior surface of the train’s outer wall above the fractured windows demonstrates a decreasing trend.

Figure 21.
Temperature distribution at the outside surface of the train at different longitudinal distances from the fire source under different numbers of broken windows: (a) X = −0.4 m; (b) X = 0 m; (c) X = 0.4 m.
3.2. Fire Ejection Behavior with Different Positions of Broken Window
This section examines the behavior of the fire spill plume following window breaches in a high-speed train carriage under different breach locations. The maximum power of the fire source is 2.0 MW. In the transverse direction, the fire source was positioned on one side of the double seats adjacent to the breached window #5R. In the longitudinal direction, the fire source was located at the midpoint of the train. Two breach scenarios were considered: one with window #5R breached and the other with window #9R breached, as illustrated in Figure 22.
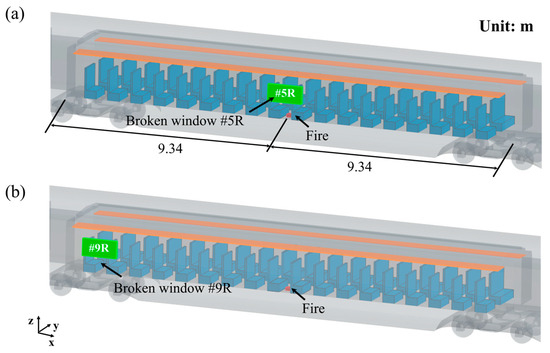
Figure 22.
Numerical simulation model of carriage fire with different locations of broken windows: (a) #5R window breakage; (b) #9R window breakage.
3.2.1. Flow Field Structure
Figure 23 illustrates the distribution pattern of along the length of the carriage at a height of 2.0 m in different areas. The distribution patterns of smoke flow velocity within the carriage exhibit consistency across different areas. When the #9R window is broken, due to the significant longitudinal distance between the fractured window and the fire source, the smoke first diffuses toward both ends of the carriage. It only begins to spread outward through the broken window after reaching the carriage ends. During this diffusion process, the smoke fully transforms into a longitudinal one-dimensional flow, resulting in a greater longitudinal flow velocity. Comparing different areas within the carriage, the difference in smoke flow velocity is more pronounced in the baggage rack area.

Figure 23.
variation law at the height of 2.0 m in the carriage along the length of the train under different locations of broken windows: (a) luggage rack above the double seat; (b) center of the aisle; (c) luggage rack above the triple seat.
Figure 24 presents a comparison of at different heights within a high-speed train carriage for various window breach locations. As shown in Figure 24a, at the height of 1.2 m, when window #5R ruptured, the smoke flow direction was outward from the carriage in areas near the ruptured window, while it flowed inward in regions farther from the ruptured window. However, when window #9R ruptured, the smoke flow direction was primarily outward from the carriage. In the vicinity of the ruptured window, the smoke flow velocity was greater during the #5R window rupture scenario. From Figure 19b, at 1.6 m height, due to the interference of the fire plume, the smoke flow velocity near the ruptured window area was significantly higher when window #5R was ruptured. In regions farther from the ruptured window, both fire scenarios exhibited relatively low smoke flow velocities. Figure 19c demonstrates that at 2.0 m height, the smoke velocity during the #5R window rupture was markedly higher than that during the #9R window rupture. Overall, the lateral smoke flow velocity inside the carriage decreases as the distance between the ruptured window and the fire source increases.

Figure 24.
variation law at different heights in the carriage above the fire source: (a) 1.2 m; (b) 1.6 m; (c) 2.0 m.
Figure 25 illustrates the distribution pattern of airflow velocity along the height direction at different longitudinal distances from the fire source outside the carriage. Near the top of the broken window, the transversal velocity of the smoke is directed outward from the carriage, while in higher regions, the horizontal flow velocity of smoke is closer to the train, and the flow velocity at broken window #5R shows significantly higher values, as shown in Figure 25a–c. In the area between the broken window and the train roof, the vertical velocity of smoke at broken window #5R is greater, as illustrated in Figure 25d–f. A comprehensive comparative analysis reveals that compared to the scenario with broken window #9R, the smoke flow velocity outside the train is higher when window #5R is broken. Additionally, the distance between the smoke and the train’s outer wall is smaller, resulting in a more pronounced impact on heat transfer to the outer wall surface.
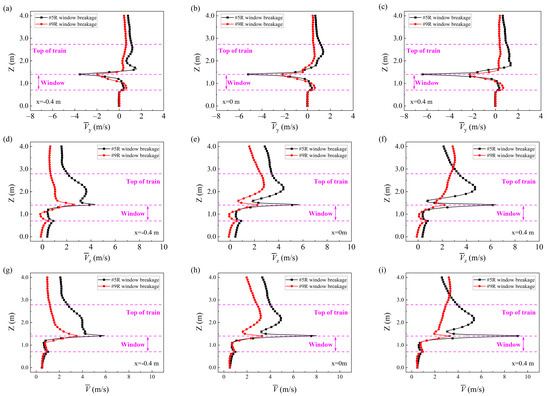
Figure 25.
Velocity distribution outside the carriage of different longitudinal distances from the fire source along the height direction under different locations of broken windows: (a–c) at different longitudinal distances from the fire source; (d–f) at different longitudinal distances from the fire source; (g–i) at different longitudinal distances from the fire source.
3.2.2. Smoke Movement Characteristics
Figure 26 illustrates the distribution patterns of fire smoke both inside and outside a high-speed train carriage under different window breach locations. It can be observed from the figure that the position of the window breach significantly influences the distribution of smoke inside and outside the carriage. When window #5R is broken, due to its proximity to the fire source, the smoke generated by the fire quickly disperses outside the carriage through the breached window, resulting in a smaller temperature increase inside the carriage. In contrast, when window #9R is breached, being farther from the fire source, the smoke fully diffuses within the carriage before reaching the breached window and spreading outside, leading to a greater temperature rise inside the carriage and an expanded high-temperature zone.
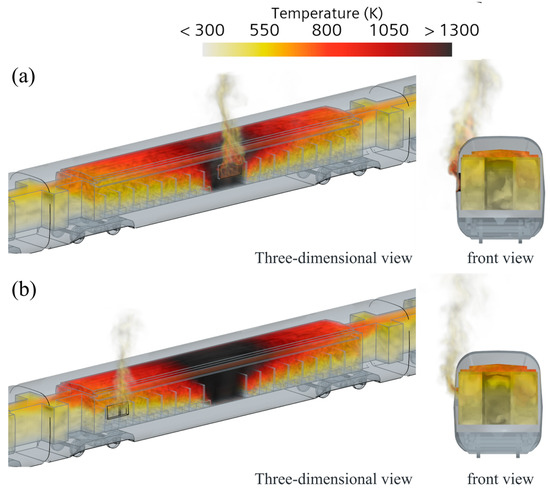
Figure 26.
Smoke movement inside and outside the carriage: (a) #5R window breakage; (b) #9R window breakage.
Figure 27 shows the contour map of smoke temperature distribution along the longitudinal cross-section at the center of the aisle. As can be observed from the figure, the temperature distribution pattern inside the carriage remains consistent across different fire scenarios, with high-temperature regions concentrated near the fire source and skewed toward its downwind direction. When Window #9R is shattered, the heat generated by the fire source is not promptly dissipated outside the carriage through the broken window. Consequently, the extent of smoke dispersion within the carriage increases significantly.

Figure 27.
Temperature distribution in the center of high-speed train carriages aisle: (a) #5R window breakage; (b) #9R window breakage.
Figure 28 illustrates the variation pattern of the average temperature along the length of the carriage at a height of 2.0 m in different areas. As shown in the figure, the temperature variation patterns along the length of the carriage are consistent across different window breach locations, with the temperature extremes occurring downstream of the fire source. When window #9R is breached, the temperature inside the carriage is significantly higher compared to the scenario where window #5R is breached. Specifically, for the luggage racks above the double seats, the center of the aisle, and the luggage racks above the triple seats, the temperature increases by 333 K, 270 K, and 180 K, respectively, when window #9R is breached.

Figure 28.
Temperature distribution at the height of 2.0 m in the carriage along the length of the train under different locations of broken windows: (a) luggage rack above the double seat; (b) center of the aisle; (c) luggage rack above the triple seat.
3.2.3. Fire Ejection Behavior
Figure 29 illustrates the distribution pattern of mass flow in the fractured window area. As shown in Figure 29a, when the #5R window is fractured, the smoke in the upper right area of the fractured window diffuses outward from the carriage, while the fluid flow direction in the lower left area is toward the interior of the carriage. From Figure 29b, it can be observed that the mass flow distribution pattern at the #9R fractured window location undergoes significant changes. When the longitudinal distance between the fractured window location and the fire source is large, the smoke diffusion at the carriage fracture location exhibits a longitudinal one-dimensional flow. As the fire continues to develop, the thickness of the smoke layer at the fractured window gradually increases. Upon reaching the top of the fractured window, the smoke begins to diffuse outward from the carriage. Under these conditions, the flow direction above the fractured window is outward from the carriage, while the flow direction below is inward. Across different regions of the fractured window, the mass flow rate values generally exhibit an increasing trend.
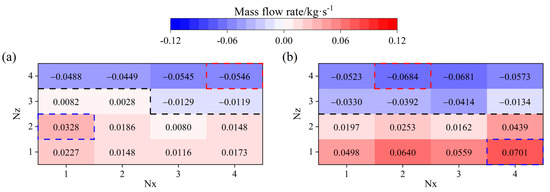
Figure 29.
Distribution of mass flow rate at broken windows: (a) #5R window breakage; (b) #9R window breakage.
Figure 30 compares the total mass flow rates across the entire breached window under different positions of broken windows. As the distance between the breached window and the fire source increases, the mass flow rates in different directions at the breached window show an increasing trend. This is due to the significant decrease in the smoke temperature at the breached window area when window #9R is breached, resulting in an increase in smoke density, which consequently leads to a higher mass flow rate. For the entire breached window, the total mass flow rate tends to decrease as the distance between the breached window and the fire source increases.
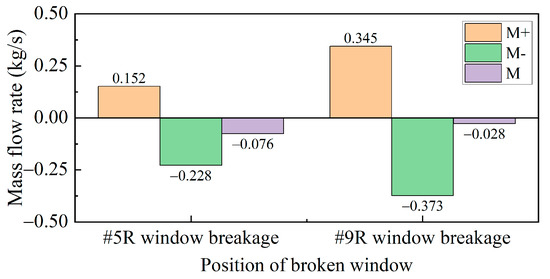
Figure 30.
Mass flow rate of each broken window with different positions.
Figure 31 illustrates the temperature distribution patterns on the external wall surface of the train under varying broken window locations. When the #9R window is fractured, smoke initially undergoes full diffusion within the carriage before propagating outward through the broken window. During this intra-carriage dispersion phase, the smoke interacts thermally with ambient cabin air through convective heat exchange mechanisms, leading to progressive temperature attenuation. Consequently, a monotonic decreasing trend in external wall surface temperature is observed above the fractured window as the longitudinal distance between the rupture location and the fire source increases.

Figure 31.
Temperature distribution at the outside surface of the train at different longitudinal distances from the fire source under different locations of broken windows: (a) X = −0.4 m; (b) X = 0 m; (c) X = 0.4 m.
4. Conclusions
Window-ejected fire behavior in high-speed train carriages is a common phenomenon during train fires, where window glass may be broken due to passenger evacuation. This study analyzed smoke transport patterns and temperature distribution characteristics inside and outside a carriage under different broken window parameters, providing references for the fire-resistant design of high-speed trains and guiding the safe evacuation of passengers. The main conclusions are as follows:
- (1)
- When a fire occurs inside the carriage, smoke rises and spreads upward under the influence of thermal buoyancy. Due to the structural asymmetry of seats upstream and downstream of the fire source, the flow field distribution becomes uneven on both sides during upward smoke dispersion. This causes the smoke to tilt toward the downstream side of the fire source, resulting in the highest temperature within the carriage also being observed downstream of the fire source. Therefore, passengers should evacuate to cooler areas further from the fire source as much as possible to minimize harm;
- (2)
- Compared to one window breakage, two window breakage facilitates more efficient outward dispersion of high-temperature smoke. This configuration reduces the longitudinal flow velocity at the center of the aisle and decreases the temperature by 83 K at 2.0 m height in the carriage aisle;
- (3)
- Compared to window rupture in the middle section of the carriage, when windows rupture at the end sections, high-temperature smoke has difficulty diffusing promptly to the exterior of the carriage. After impacting the ceiling, the smoke primarily flows toward both ends of the carriage, resulting in a significantly higher longitudinal flow velocity. The temperature at a height of 2.0 m in the carriage aisle increased by 270 K.
Author Contributions
S.M.: conceptualization, formal analysis, methodology, investigation, visualization, writing—original draft, writing—review and editing. D.Z.: conceptualization, investigation, project administration, funding acquisition, supervision. T.C.: resources, project administration, funding acquisition, supervision. All authors have read and agreed to the published version of the manuscript.
Funding
The Fundamental Research Funds for the National Natural Science Foundation of China under (Grant No. U2468220) and the Post-graduate Scientific Research Innovation Project of Hunan Province (No. CX20220111).
Data Availability Statement
The raw data supporting the conclusions of this article will be made available by the authors on request.
Conflicts of Interest
The authors declare no conflict of interest.
References
- Tian, H. Review of Research on High-Speed Railway Aerodynamics in China. Transp. Saf. Environ. 2019, 1, 1–21. [Google Scholar] [CrossRef]
- Li, Y.Z.; Ingason, H. Overview of Research on Fire Safety in Underground Road and Railway Tunnels. Tunn. Undergr. Space Technol. 2018, 81, 568–589. [Google Scholar] [CrossRef]
- Lattimer, B.Y.; McKinnon, M. A Review of Fire Growth and Fully Developed Fires in Railcars. Fire Mater. 2018, 42, 603–619. [Google Scholar] [CrossRef]
- Capote, J.A.; Jimenez, J.A.; Alvear, D.; Alvarez, J.; Abreu, O.; Lazaro, M. Assessment of Fire Behaviour of High-Speed Trains’ Interior Materials: Small-Scale and Full-Scale Fire Tests. Fire Mater. 2014, 38, 725–743. [Google Scholar] [CrossRef]
- Bi, H.; Zhou, Y.; Wang, H.; Gou, Q.; Liu, X. Characteristics of Fire in High-Speed Train Carriages. J. Fire Sci. 2020, 38, 75–95. [Google Scholar] [CrossRef]
- Zhu, J.; Li, X.J.; Mie, C.F. Combustion Performance of Flame-Ignited High-Speed Train Seats via Full-Scale Tests. Case Stud. Fire Saf. 2015, 4, 39–48. [Google Scholar] [CrossRef][Green Version]
- Ying, Z.L.; Ingason, H.; Lönnermark, A. Correlations between Different Scales of Metro Carriage Fire Tests. Sch. Bus. Soc. Eng. 2013. [Google Scholar] [CrossRef]
- Zhang, B.; Zhang, J.; Wang, X.; Lu, S.; Li, C.; Chen, R. Effects of Air Inlet Configuration on Forced-Ventilation Enclosure Fires on a Naval Ship. Fire Technol. 2016, 52, 547–562. [Google Scholar] [CrossRef]
- Ingason, H. Model Scale Railcar Fire Tests. Fire Saf. J. 2007, 42, 271–282. [Google Scholar] [CrossRef]
- He, Q.; Li, C.; Lu, S.; Wang, C.; Zhang, J. Pool Fires in a Corner Ceiling Vented Cabin: Ghosting Flame and Corresponding Fire Parameters. Fire Technol. 2015, 51, 537–552. [Google Scholar] [CrossRef]
- Fan, C.G.; Ji, J.; Li, Y.Z.; Ingason, H.; Sun, J.H. Experimental Study of Sidewall Effect on Flame Characteristics of Heptane Pool Fires with Different Aspect Ratios and Orientations in a Channel. Proc. Combust. Inst. 2017, 36, 3121–3129. [Google Scholar] [CrossRef]
- Ji, J.; Tan, T.; Gao, Z.; Wan, H. Influence of Sidewall and Aspect Ratio on Burning Behaviors of Rectangular Ethanol and Heptane Pool Fires. Fuel 2019, 238, 166–172. [Google Scholar]
- Ji, J.; Fan, C.G.; Li, Y.Z.; Ingason, H.; Sun, J.H. Experimental Study of Non-Monotonous Sidewall Effect on Flame Characteristics and Burning Rate of n-Heptane Pool Fires. Fuel 2015, 145, 228–233. [Google Scholar]
- Enbaya, A.; Asim, T.; Mishra, R.; Rao, R.B.K.N. Fire Safety Analysis of a Railway Compartment Using Computational Fluid Dynamics. Int. J. COMADEM 2015, 18, 37–44. [Google Scholar]
- Lonnermark, A.; Ingason, H.; Li, Y.Z.; Kumm, M. Fire Development in a 1/3 Train Carriage Mock-Up. Fire Saf. J. 2017, 91, 432–440. [Google Scholar]
- Zhou, Y.; Wang, H.; Bi, H.; Liu, X.; Gou, Q. Heat Release Rate of High-Speed Train Fire in Railway Tunnels. Tunn. Undergr. Space Technol. 2020, 105, 103563. [Google Scholar]
- Zhang, S.; Yao, Y.; Zhu, K.; Li, K.; Zhang, R.; Lu, S.; Cheng, X. Prediction of Smoke Back-Layering Length under Different Longitudinal Ventilations in the Subway Tunnel with Metro Train. Tunn. Undergr. Space Technol. 2016, 53, 13–21. [Google Scholar]
- Tang, F.; Zhao, Z.; Zhao, K. Experimental Investigation on Carriage Fires Hazards in the Longitudinal Ventilated Tunnels: Assessment of the Smoke Stratification Features. Saf. Sci. 2020, 130, 104901. [Google Scholar]
- Tang, F.; He, Q.; Sun, X.; Jiang, L.; Hu, P.; Hu, L. Experimental Study of Carriage Fire in a Tunnel: Evolution of Flame Geometry Characteristics under Relative Strong Crosswinds. Proc. Combust. Inst. 2021, 38, 4963–4970. [Google Scholar]
- Peng, M.; Cheng, X.; Cong, W.; Yuen, R. Experimental Investigation on Temperature Profiles at Ceiling and Door of Subway Carriage Fire. Fire Technol. 2021, 57, 439–459. [Google Scholar]
- Peng, M.; Cheng, X.; He, K.; Cong, W.; Shi, L.; Yuen, R. Experimental Study on Ceiling Smoke Temperature Distributions in near Field of Pool Fires in the Subway Train. J. Wind Eng. Ind. Aerodyn. 2020, 199, 104135. [Google Scholar] [CrossRef]
- Peng, M.; He, K.; Yang, H.; Cong, W.; Cheng, X.; Shi, L.; Richard, Y. Experimental Study on Fire Plume Characteristics in a Subway Carriage with Doors. Fire Technol. 2020, 56, 401–423. [Google Scholar] [CrossRef]
- He, Q.; Cao, Z.; Tang, F.; Gu, M.; Zhang, T. Experimental Analysis and Machine Learning Research on Tunnel Carriage Fire Spread and Temperature Evolution. Tunn. Undergr. Space Technol. 2023, 133, 104940. [Google Scholar] [CrossRef]
- Zhang, H.; Sun, J.; Zhang, G.; Zhou, X.; Pan, Y. Experimental Study on the Tunnel Temperature Distribution under the Coupling Effect of Train Blocking and Fire inside the Carriage. Tunn. Undergr. Space Technol. 2021, 112, 103915. [Google Scholar] [CrossRef]
- Chen, Z.; Guo, C.; Zhao, W.; Zhang, K. Fire Characteristics of High-Speed Intercity Train with Different Door Opening in Tunnel. J. Phys. Conf. Ser. 2022, 2202, 012038. [Google Scholar] [CrossRef]
- Xi, Y.; Zhou, Z.; Mao, J.; Chow, W.; Tang, F. Maximum Ceiling Temperature and Longitudinal Distribution in a Corridor-like Enclosure with Opening. Tunn. Undergr. Space Technol. 2023, 134, 104994. [Google Scholar] [CrossRef]
- Xi, Y.; Zhou, Z.; Lian, H.; Mao, J.; Chow, W.; Tang, F. Temperature Variation inside a Corridor-like Enclosure under Limited Ventilation. Tunn. Undergr. Space Technol. 2022, 126, 104539. [Google Scholar] [CrossRef]
- Kong, J.; You, W.; Xu, Z.; Liu, H. Mechanism Characteristics of Carriage Fire under Coupling Effect of Ignition Position and Windows Breakage. J. Cent. South Univ. 2023, 30, 654–664. [Google Scholar] [CrossRef]
- Shi, C.; Zhong, M.; Chen, C.; Jiao, W.; Li, J.; Zhang, Y.; Zhang, L.; Li, Y.; He, L. Metro Train Carriage Combustion Behaviors—Full-Scale Experiment Study. Tunn. Undergr. Space Technol. 2020, 104, 103544. [Google Scholar] [CrossRef]
- Radziszewska-Wolińska, J.M. Influence of the Ignition Source on Passenger Seat Burning. Probl. Kolejnictwa 2016, 171, 67–77. [Google Scholar]
- Li, L.; Wei, L.; Liu, Y.; Li, C.; Ding, Y.; Lu, S. Pyrolysis Characteristic Study on Seat Hard Materials of China’s High-Speed Train. J. Therm. Anal. Calorim. 2018, 134, 2107–2113. [Google Scholar]
- Zhou, D.; Li, J.; Hu, T.; Chen, T. Influence of Subway Train Fire Locations on the Characteristics of Smoke Movement in a Curved Tunnel. PLoS ONE 2023, 18, e0279818. [Google Scholar]
Disclaimer/Publisher’s Note: The statements, opinions and data contained in all publications are solely those of the individual author(s) and contributor(s) and not of MDPI and/or the editor(s). MDPI and/or the editor(s) disclaim responsibility for any injury to people or property resulting from any ideas, methods, instructions or products referred to in the content. |
© 2025 by the authors. Licensee MDPI, Basel, Switzerland. This article is an open access article distributed under the terms and conditions of the Creative Commons Attribution (CC BY) license (https://creativecommons.org/licenses/by/4.0/).