Figure 1.
Schematic overview of the experimental engine setup.
Figure 1.
Schematic overview of the experimental engine setup.
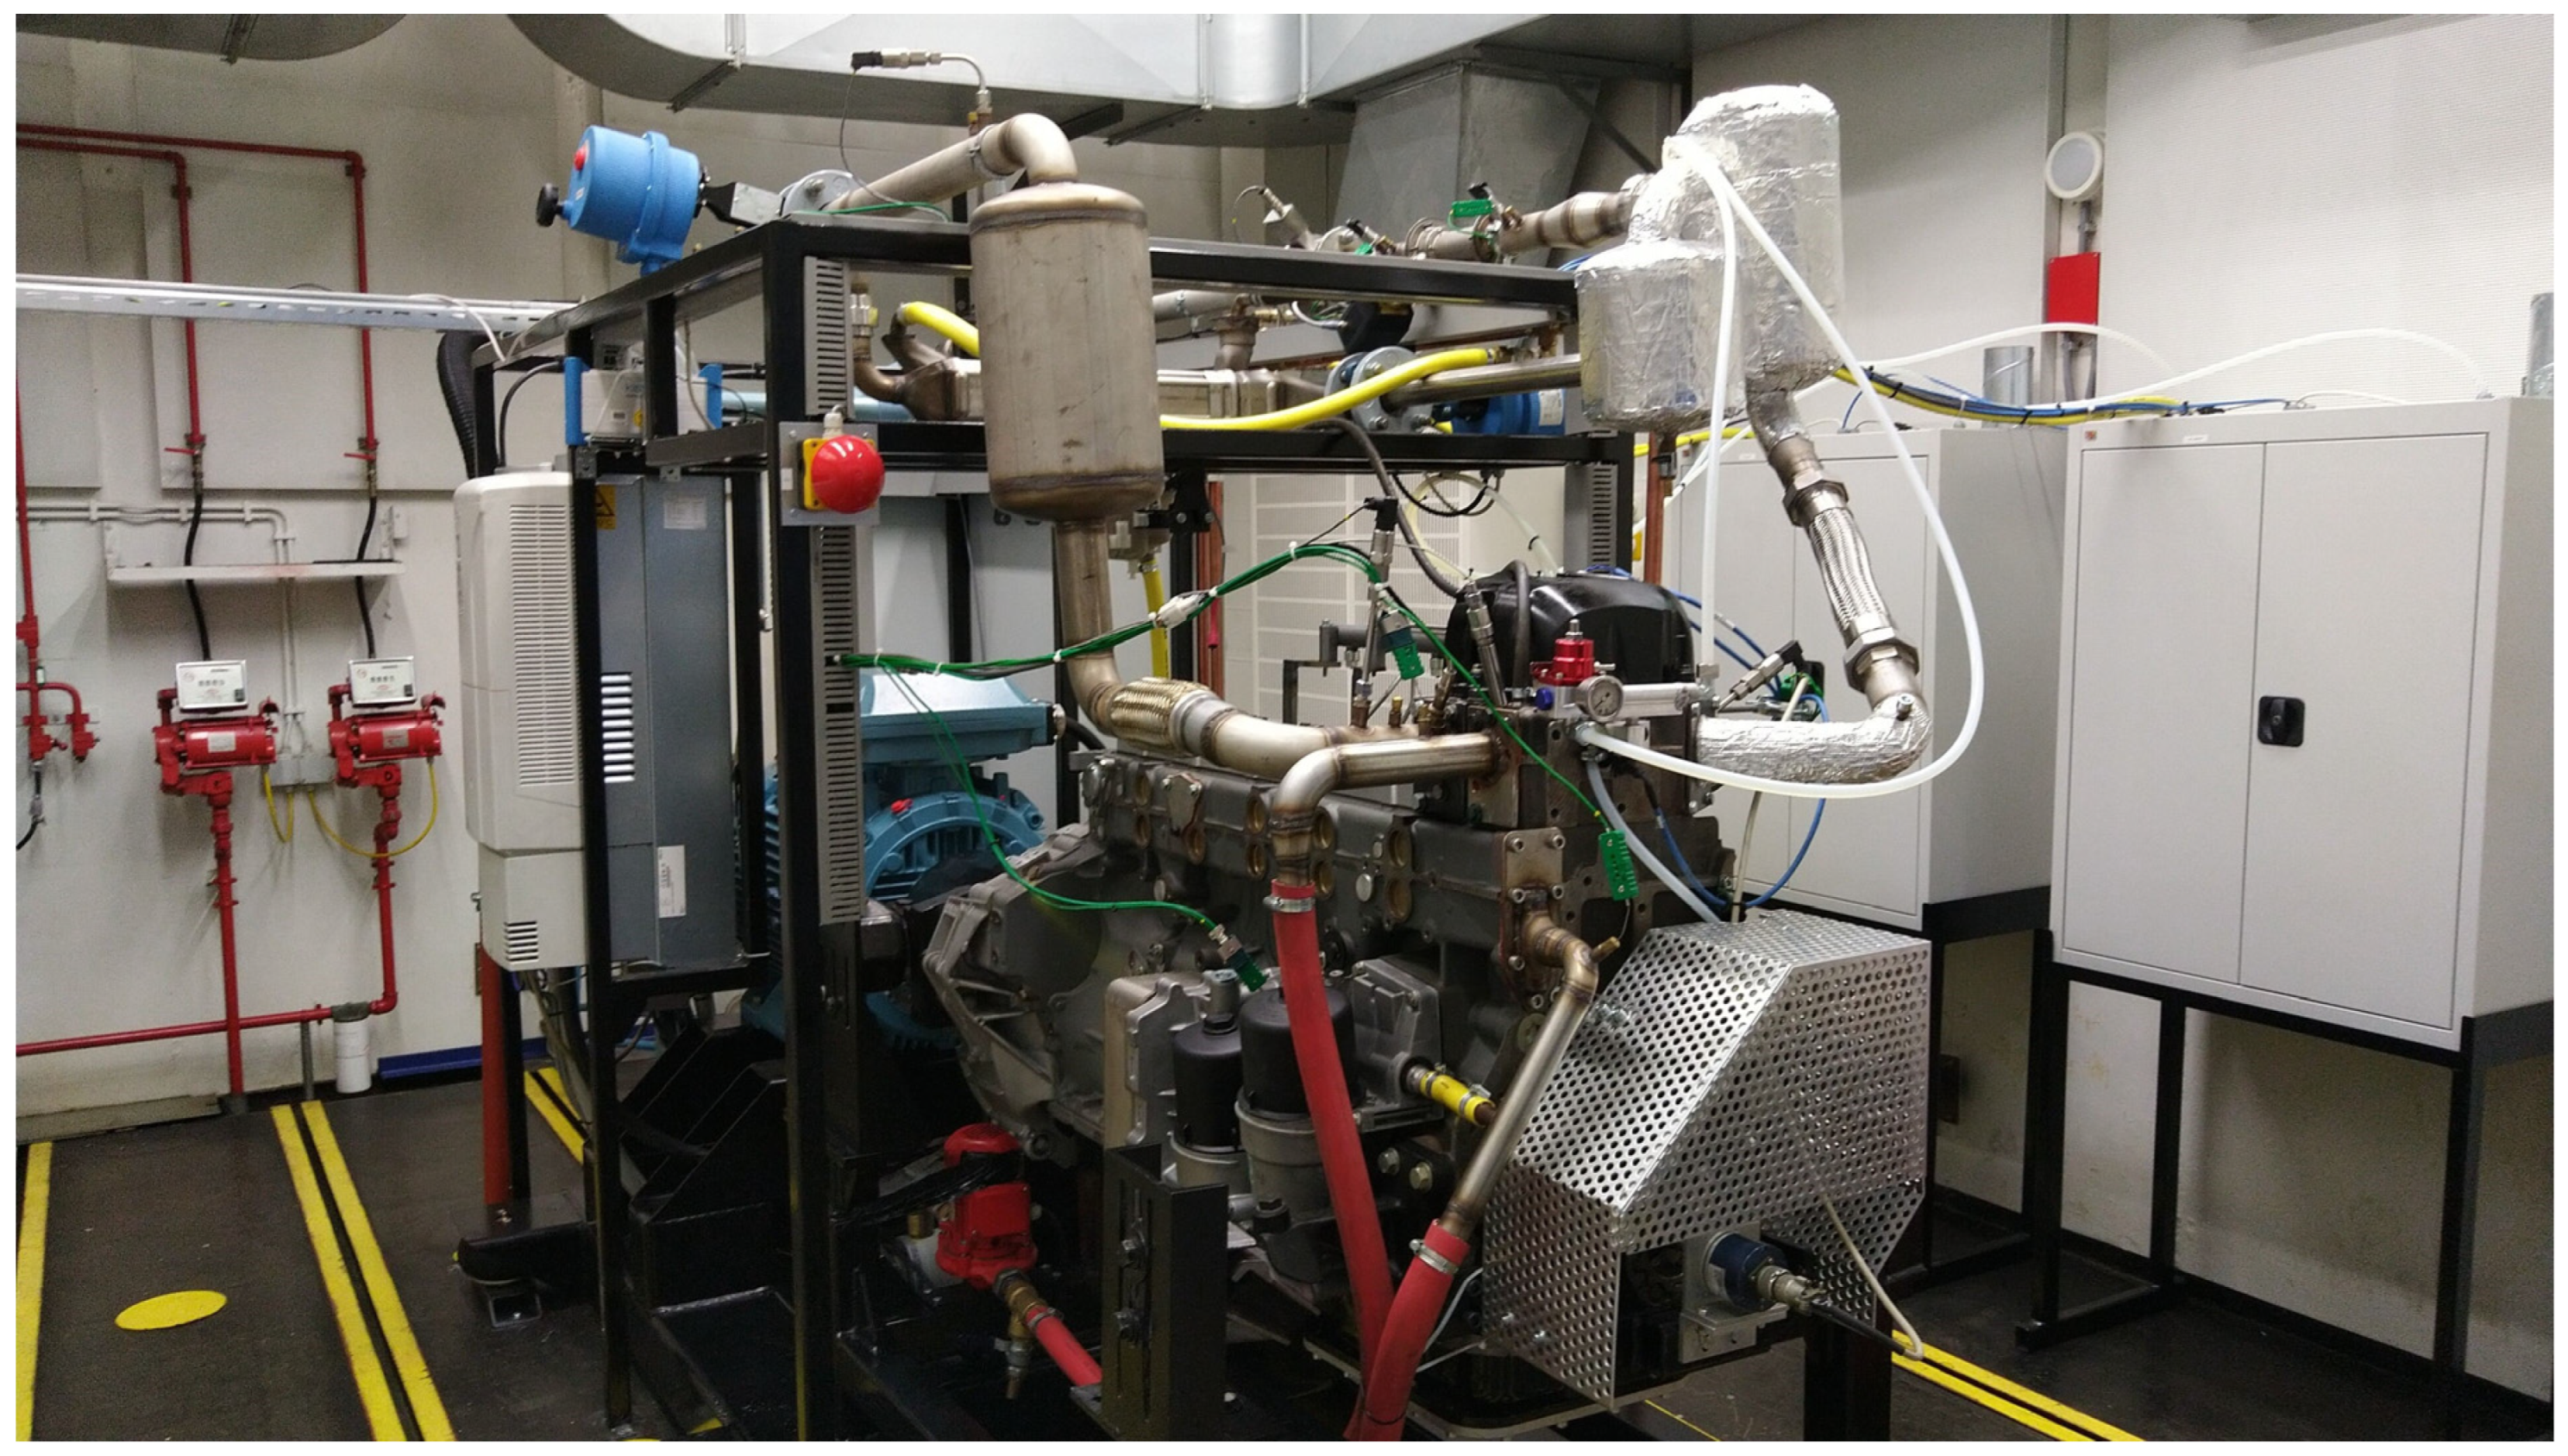
Figure 2.
Engine setup in the engine test cell.
Figure 2.
Engine setup in the engine test cell.
Figure 3.
Schematic flowchart of the steps taken during this work.
Figure 3.
Schematic flowchart of the steps taken during this work.
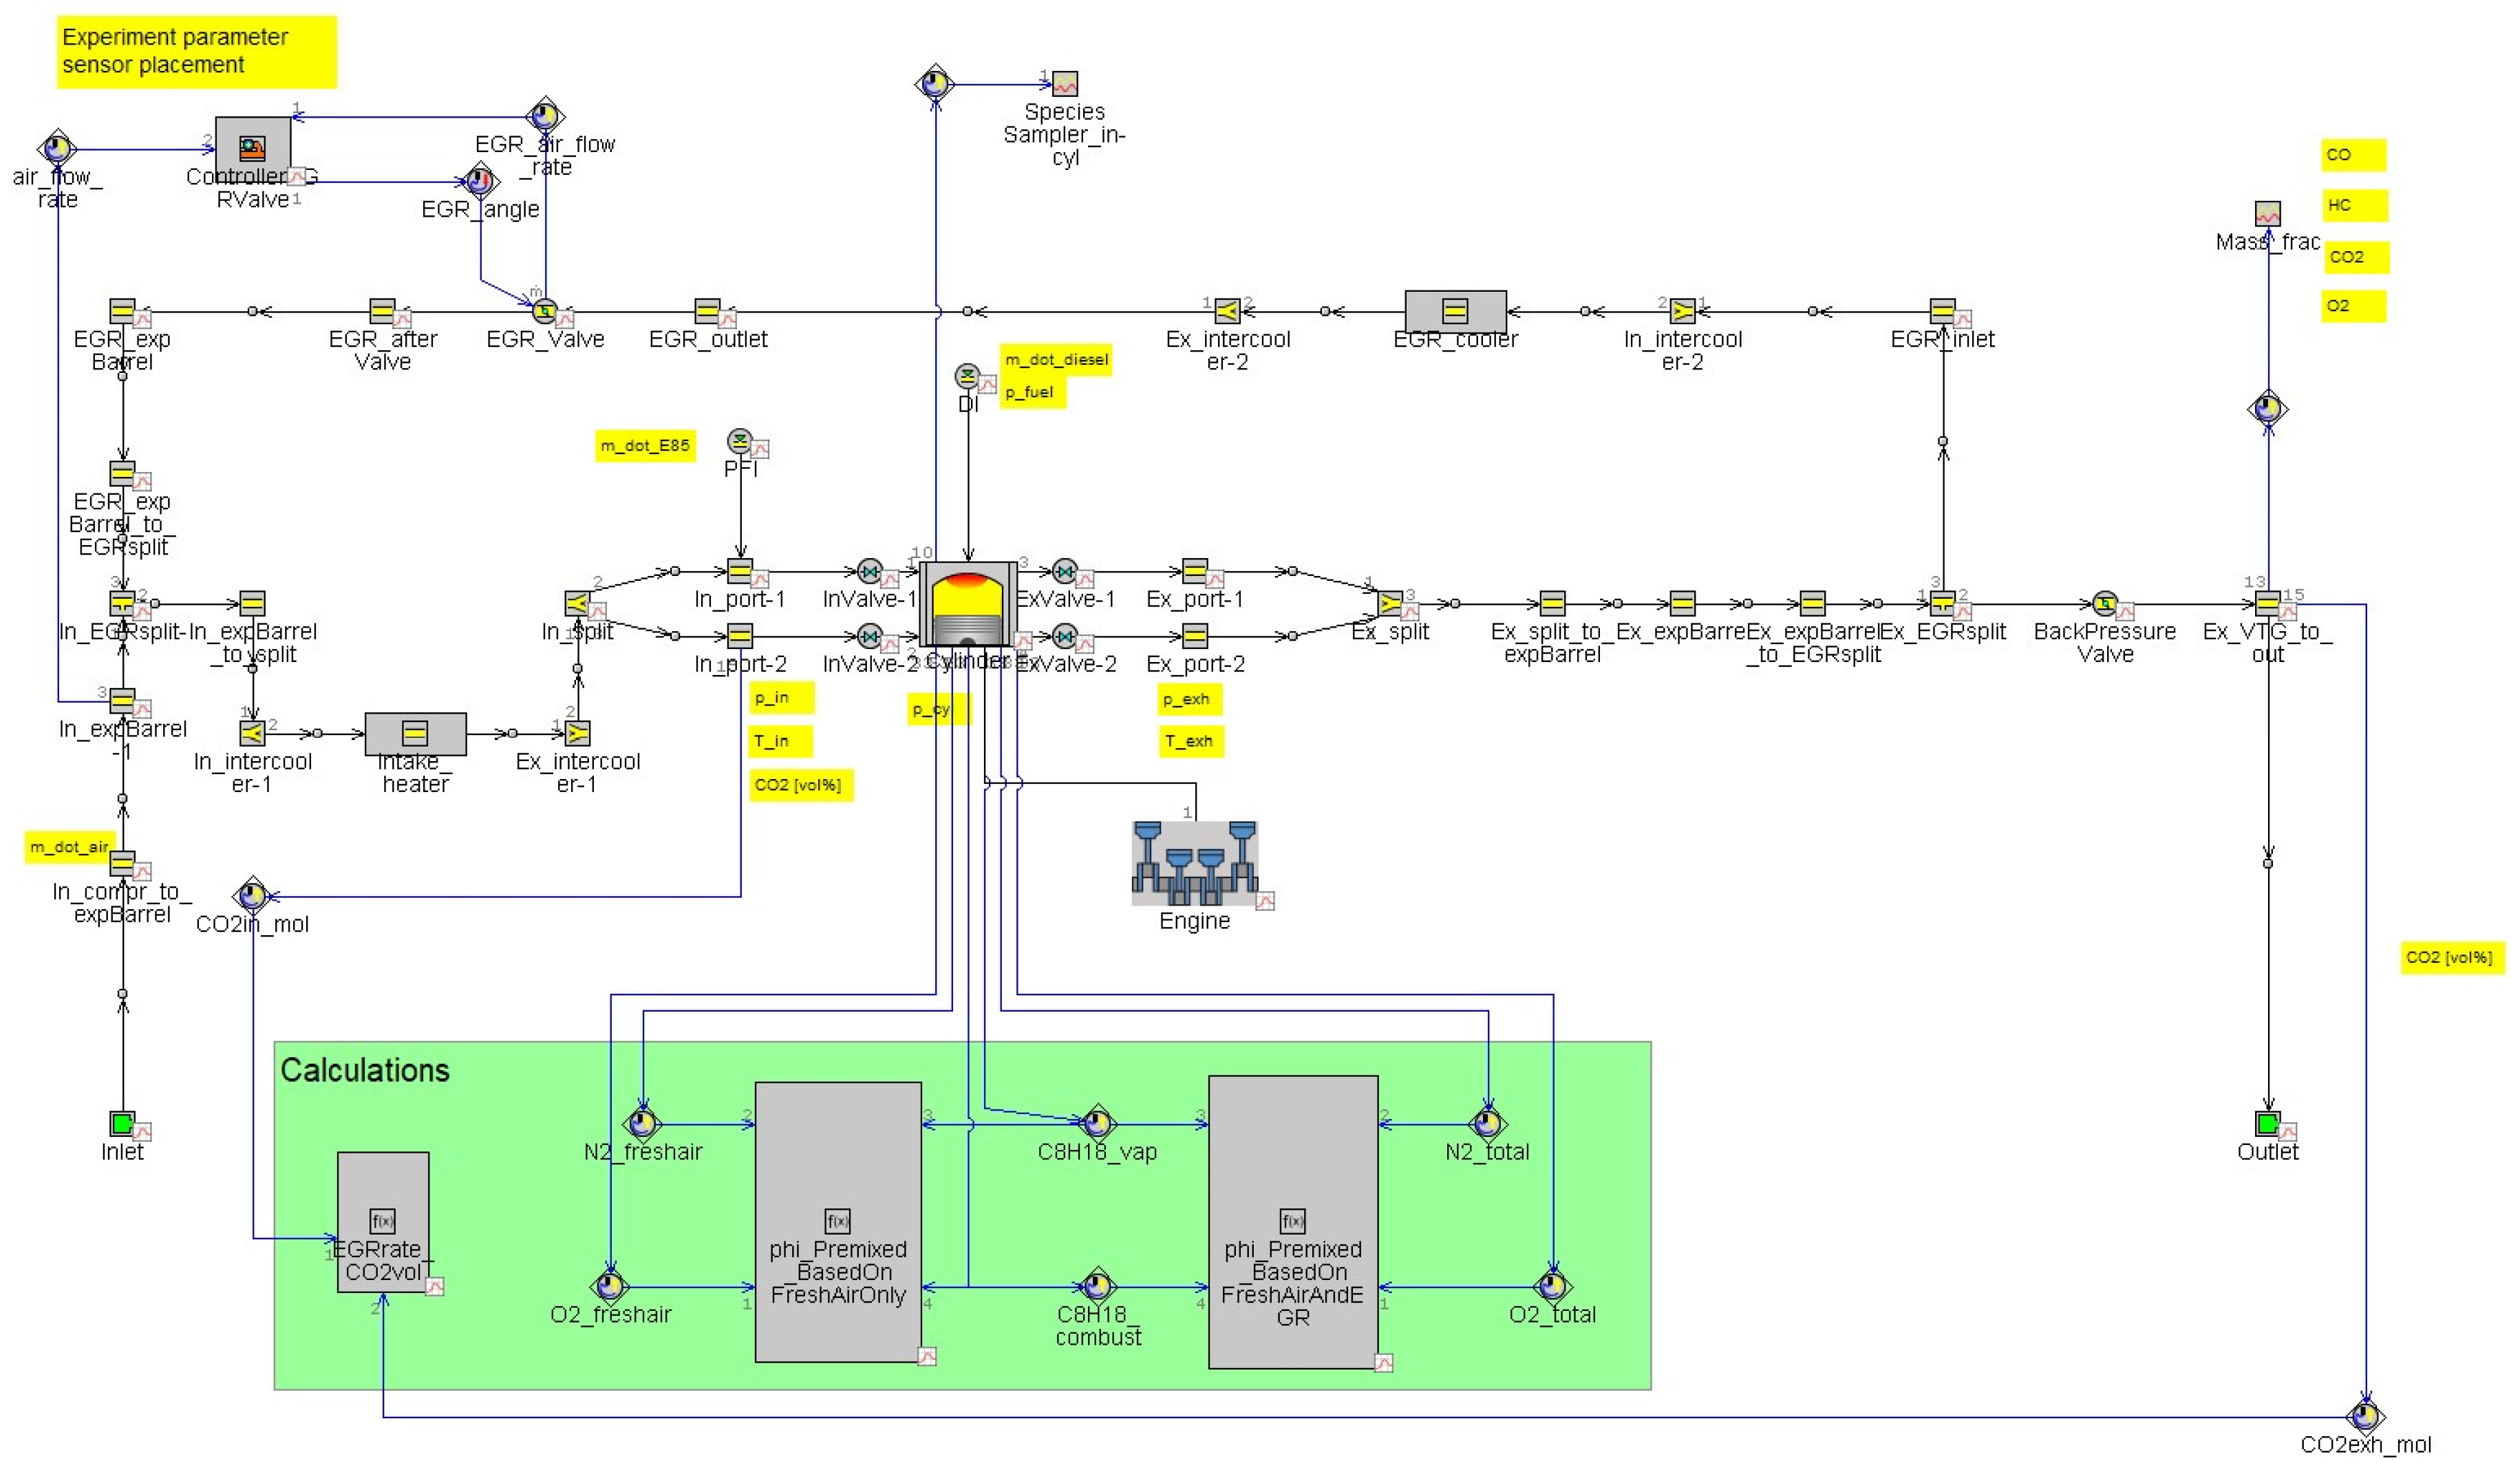
Figure 4.
Schematic overview of the GT-Power model.
Figure 4.
Schematic overview of the GT-Power model.
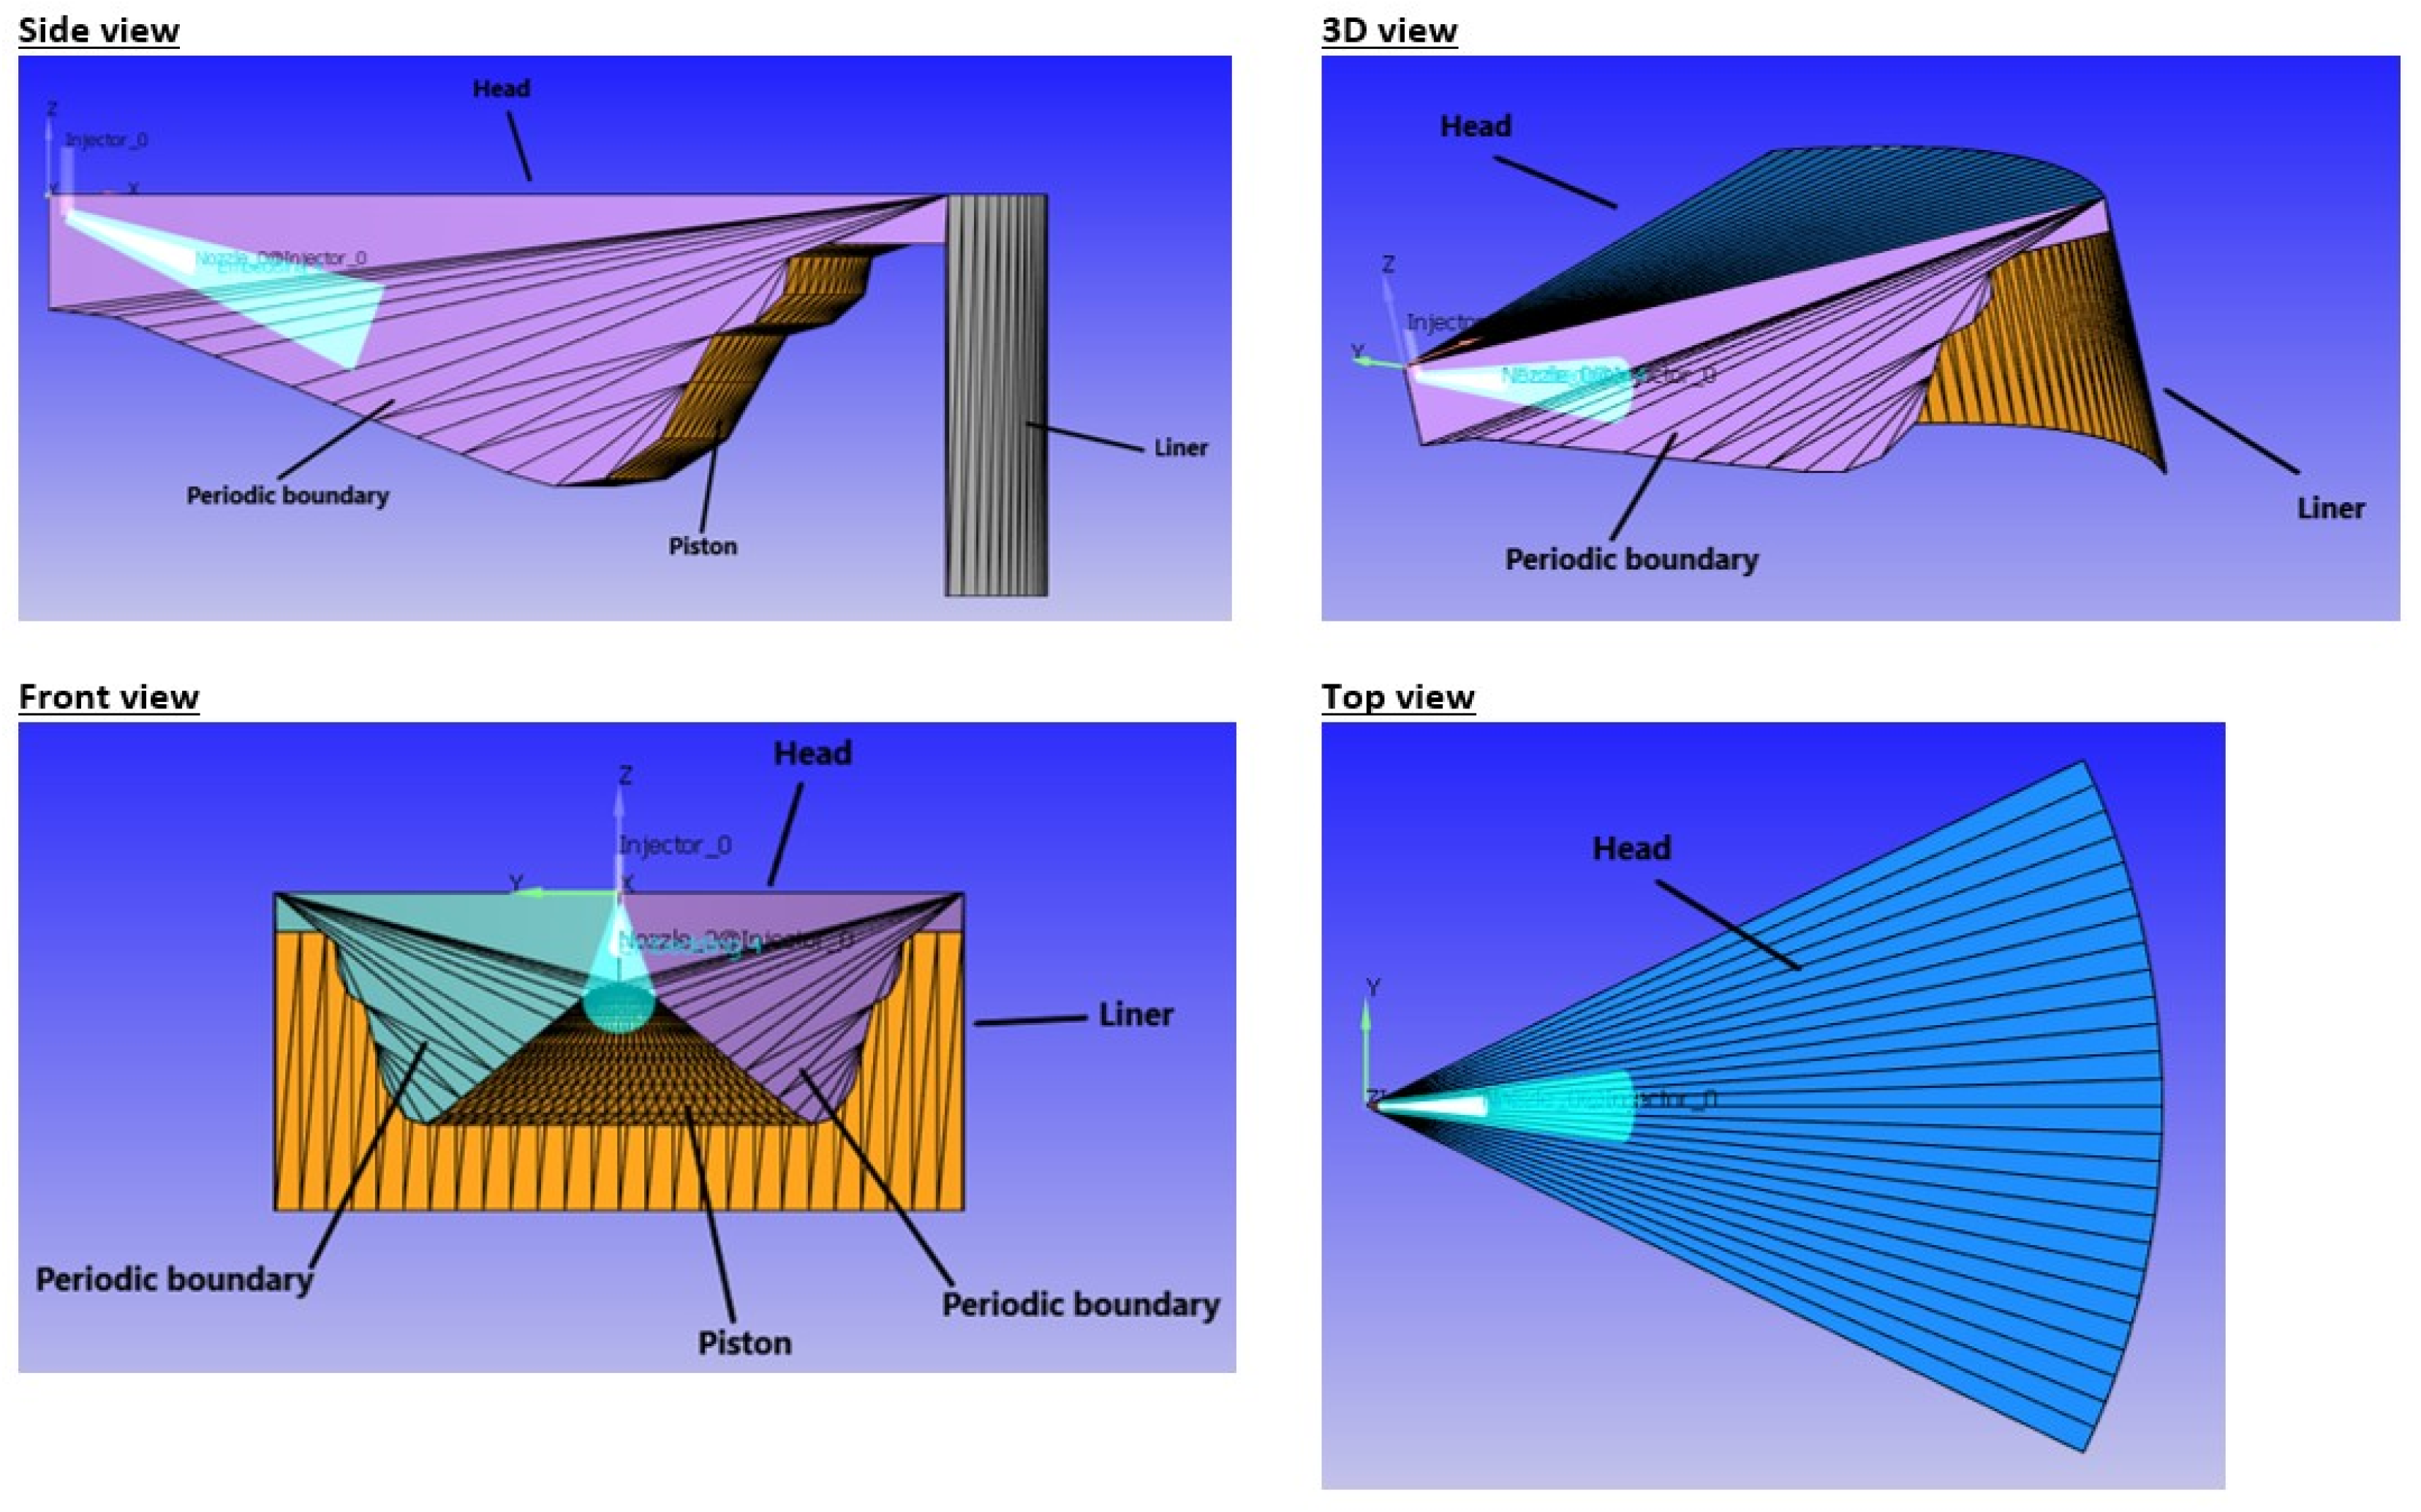
Figure 5.
Simulated engine sector surface at TDC position in four different view perspectives.
Figure 5.
Simulated engine sector surface at TDC position in four different view perspectives.
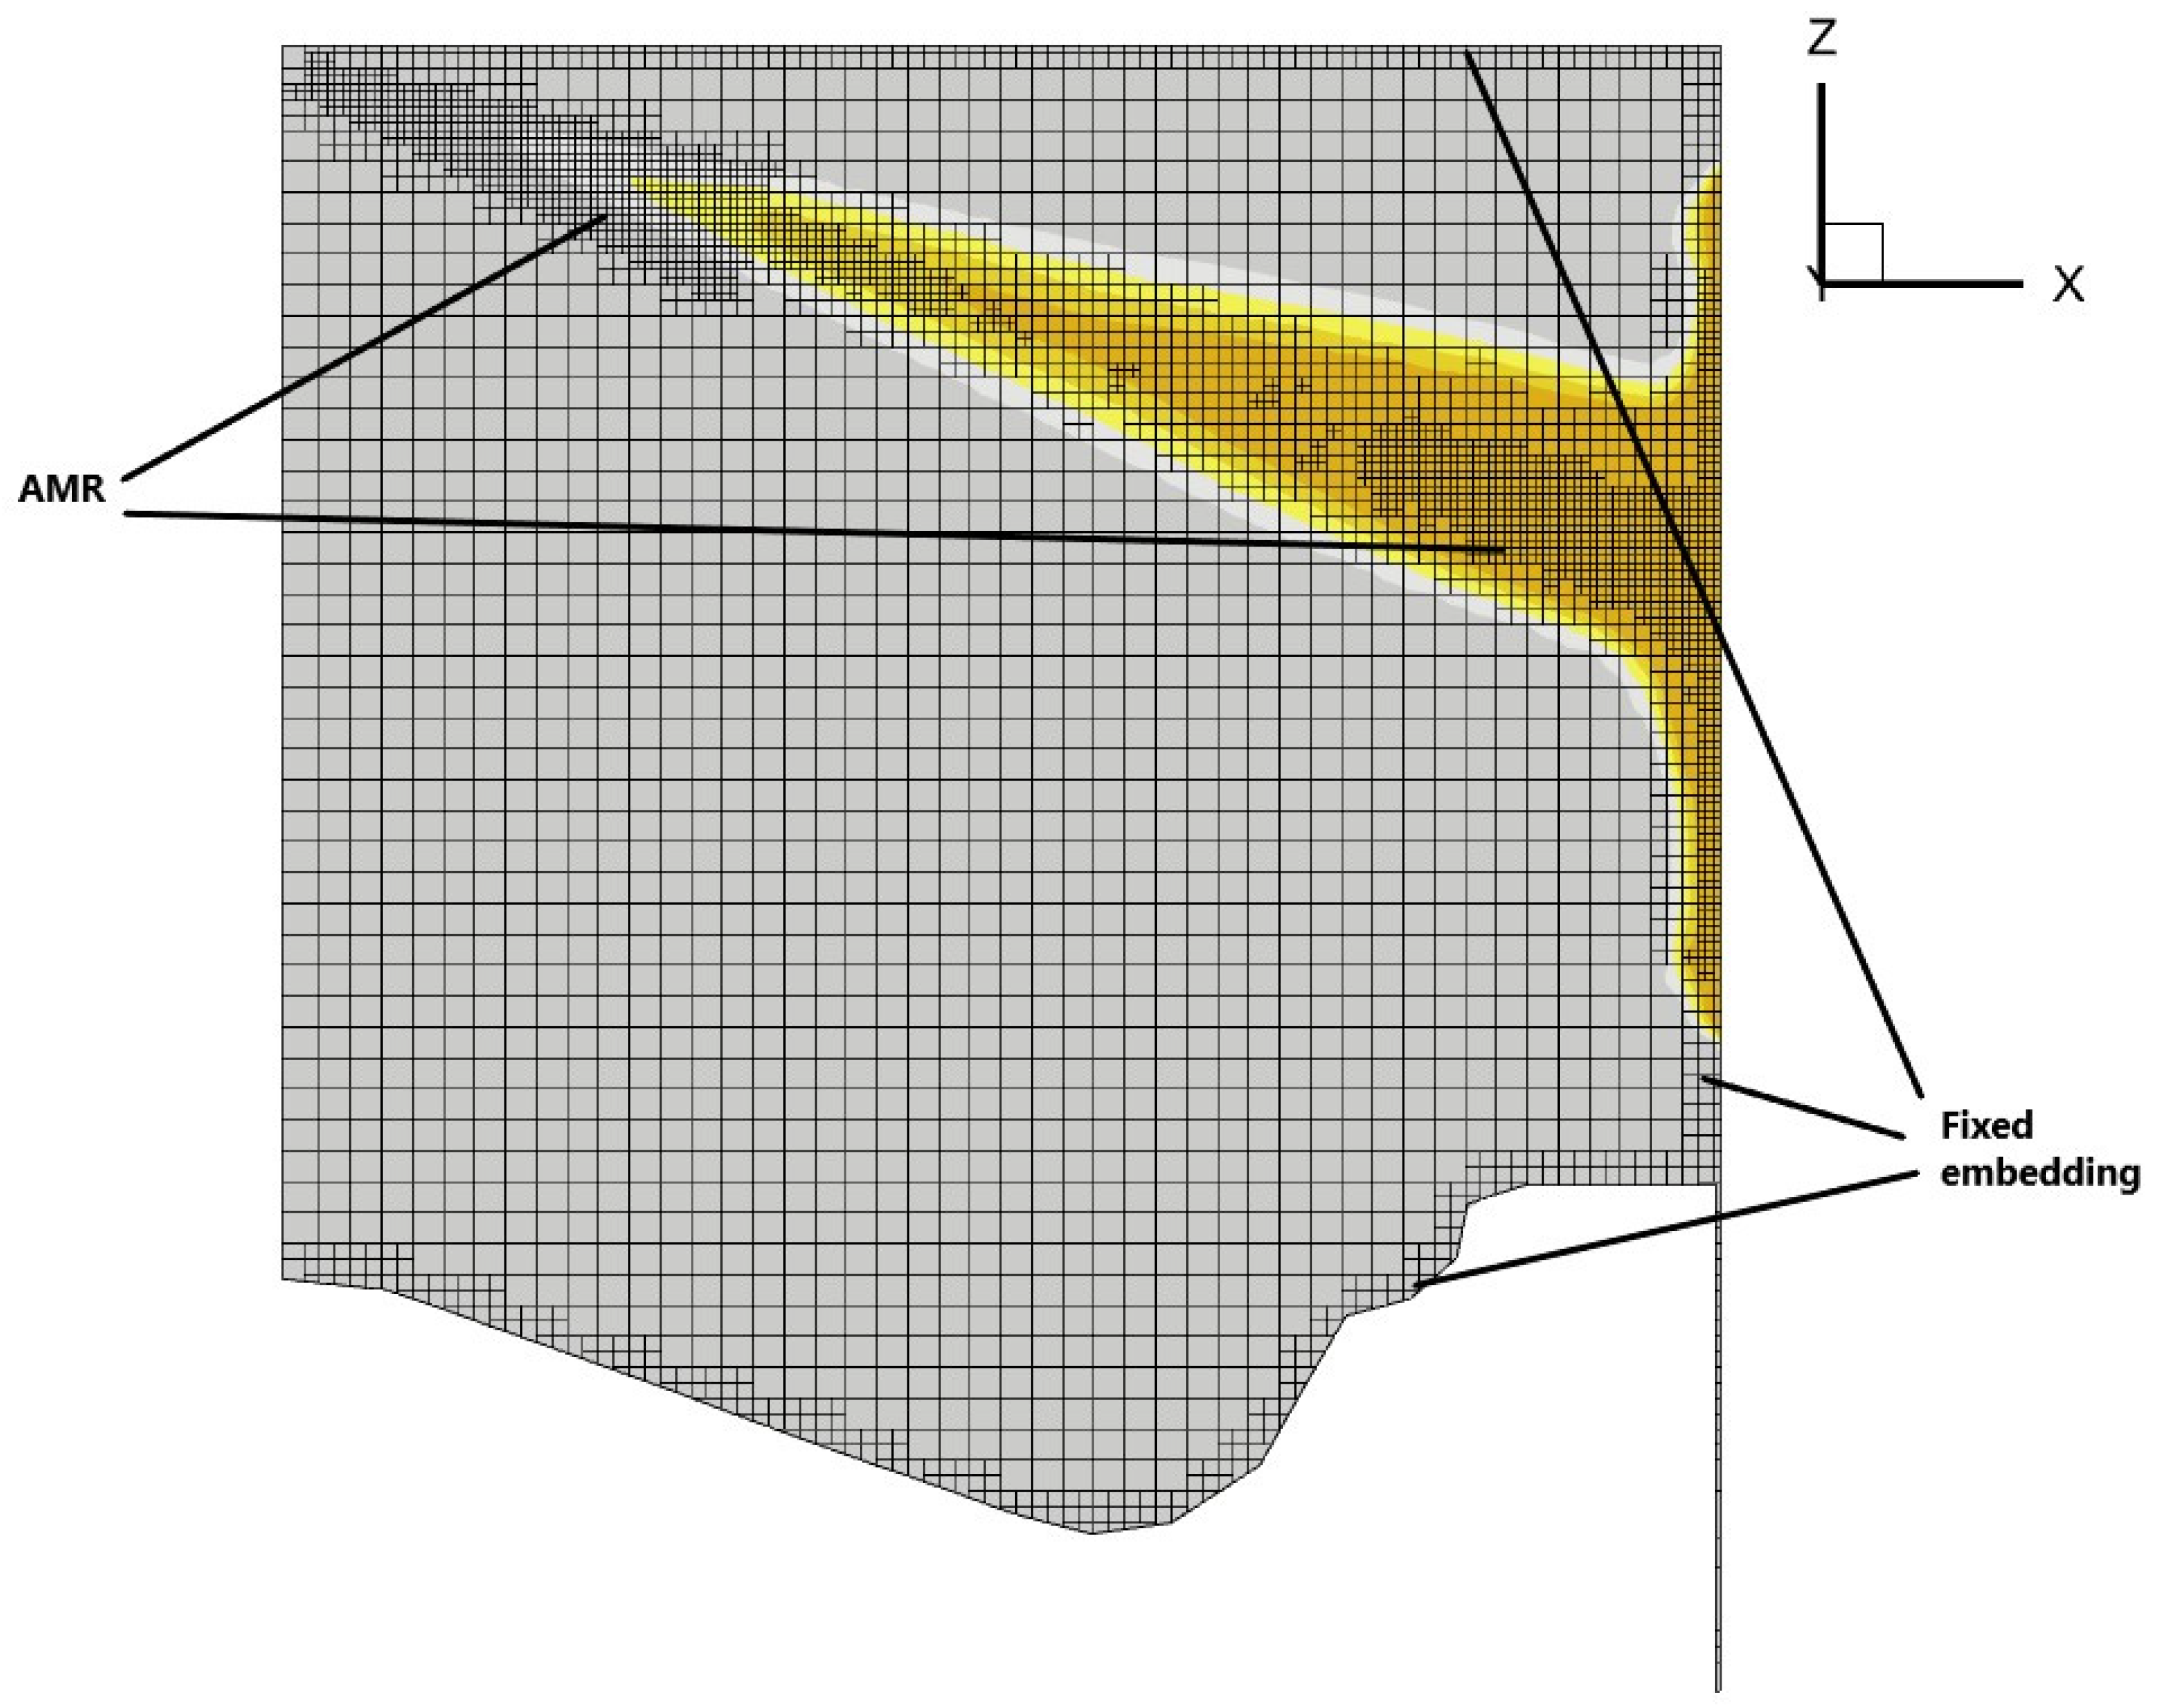
Figure 6.
Slice view in the Y-plane of the engine sector mesh after DI SOI. Yellow area shows the fuel vapor distribution.
Figure 6.
Slice view in the Y-plane of the engine sector mesh after DI SOI. Yellow area shows the fuel vapor distribution.
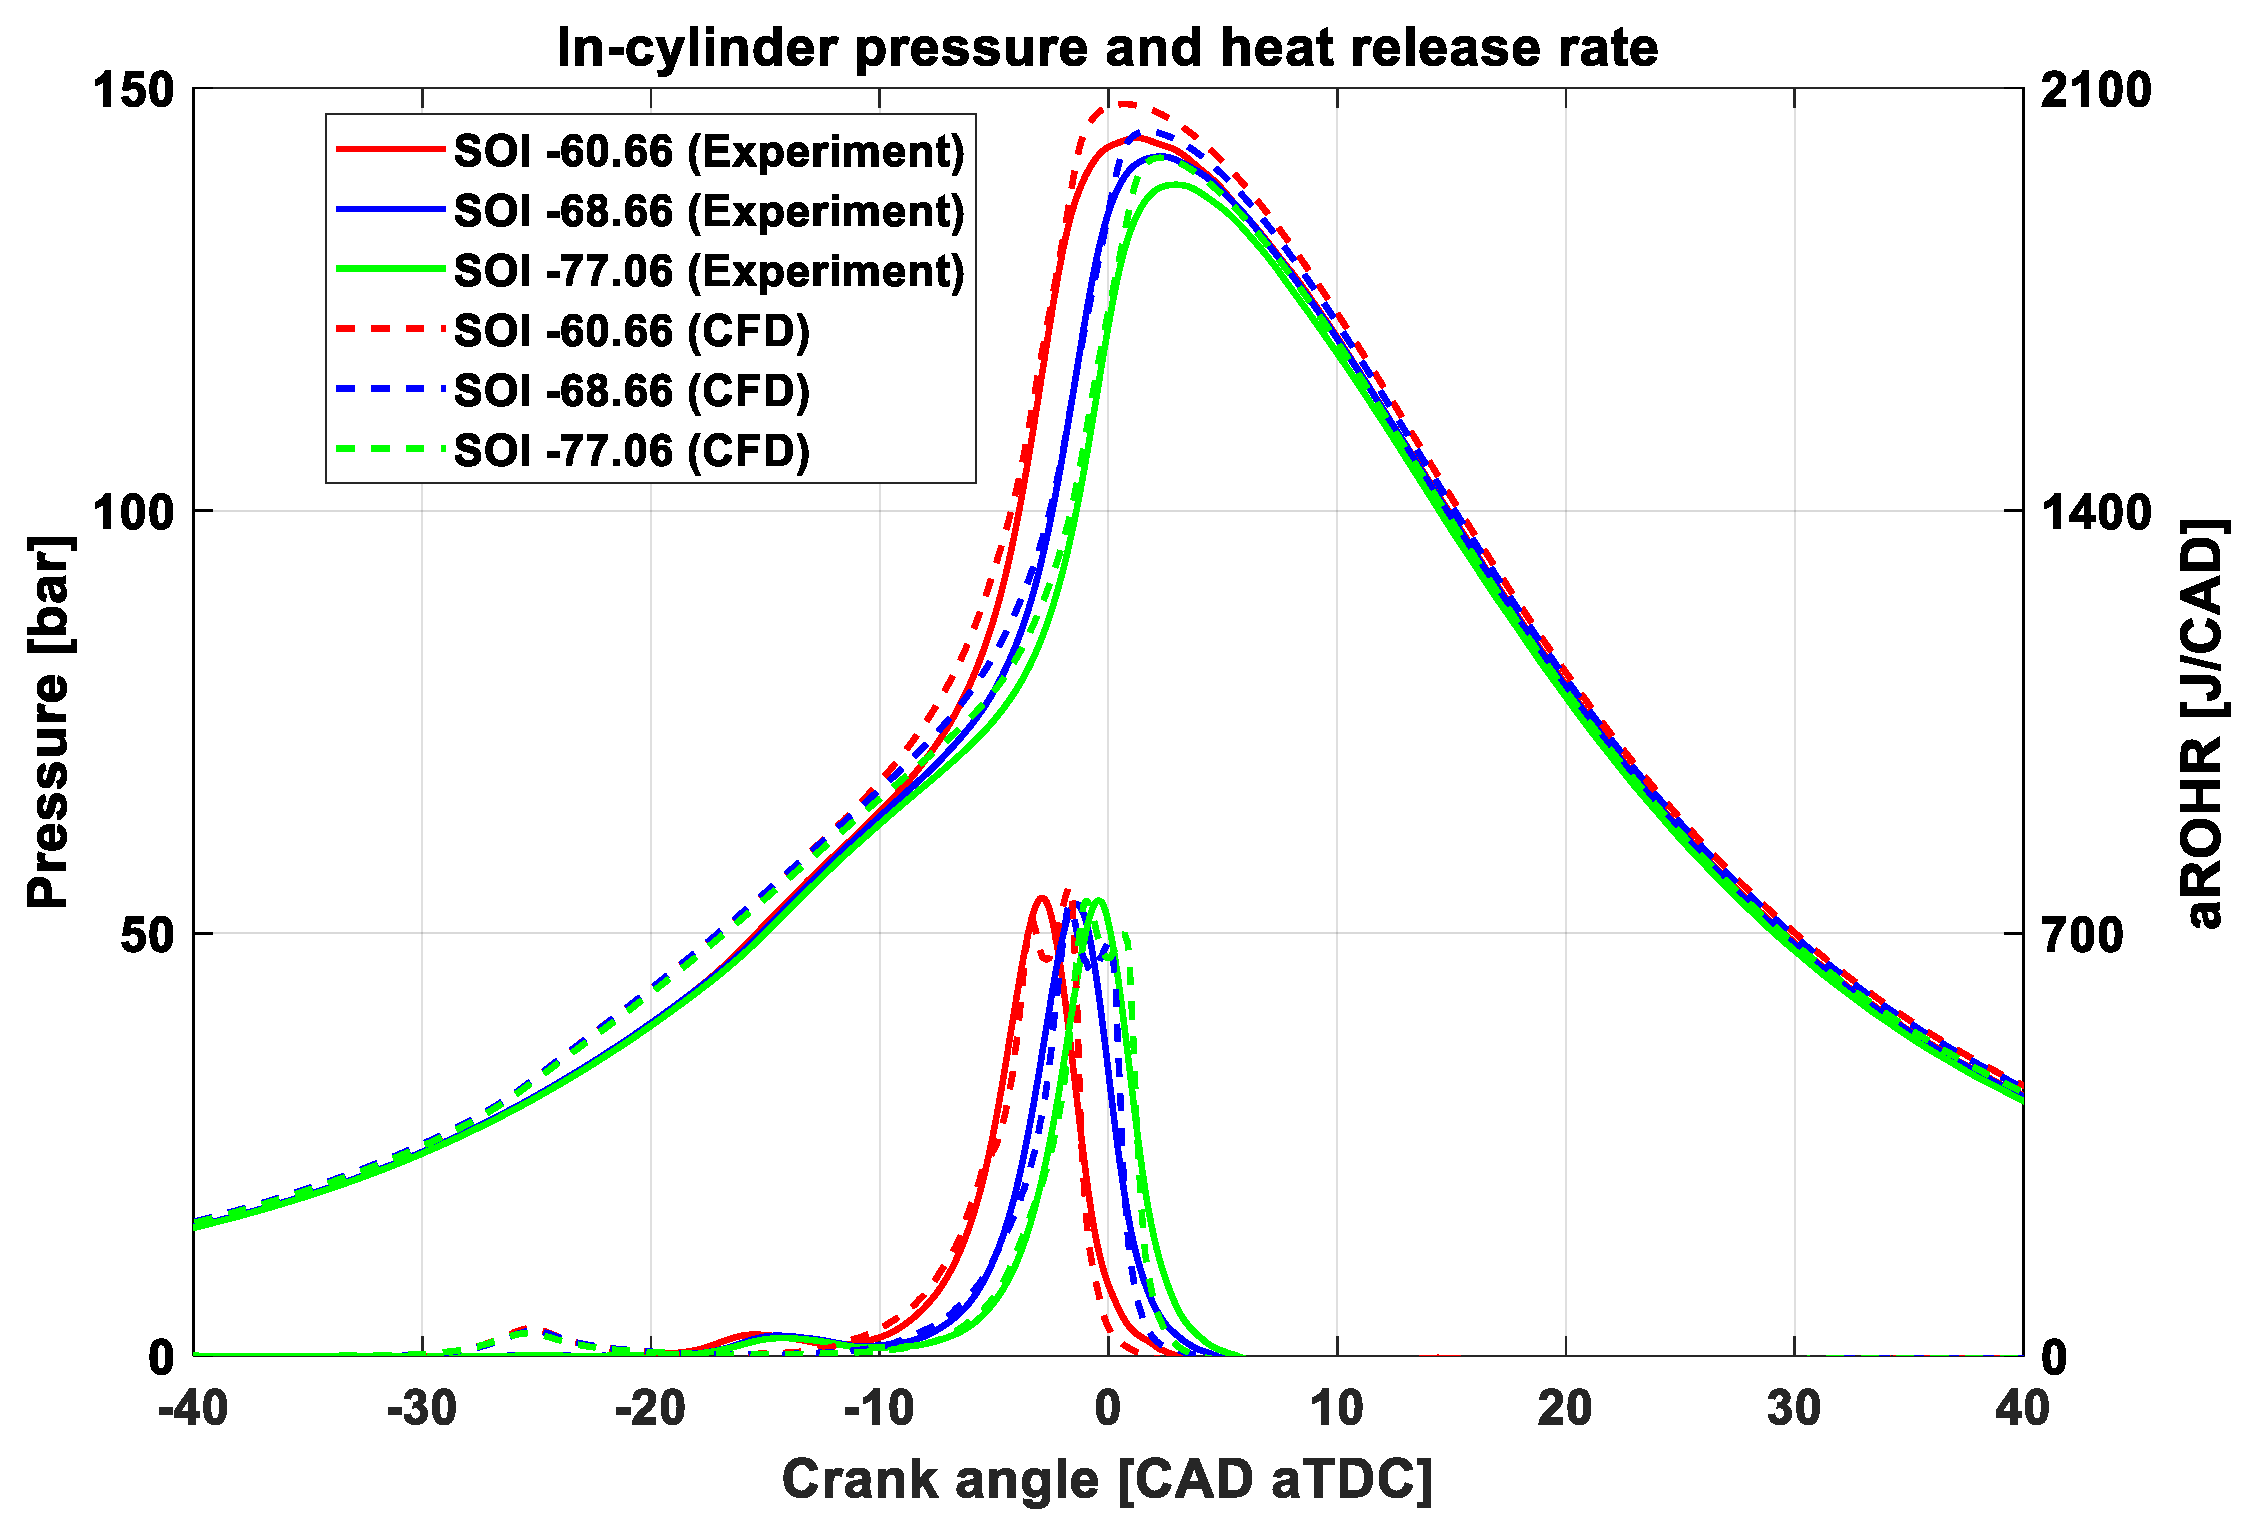
Figure 7.
Validation of in-cylinder pressure trace and aROHR during direct injection start of actuation sweep.
Figure 7.
Validation of in-cylinder pressure trace and aROHR during direct injection start of actuation sweep.
Figure 8.
(a) Validation of emissions during direct injection start of actuation sweep. (b) Scaled emission comparison between CFD and experiment results.
Figure 8.
(a) Validation of emissions during direct injection start of actuation sweep. (b) Scaled emission comparison between CFD and experiment results.
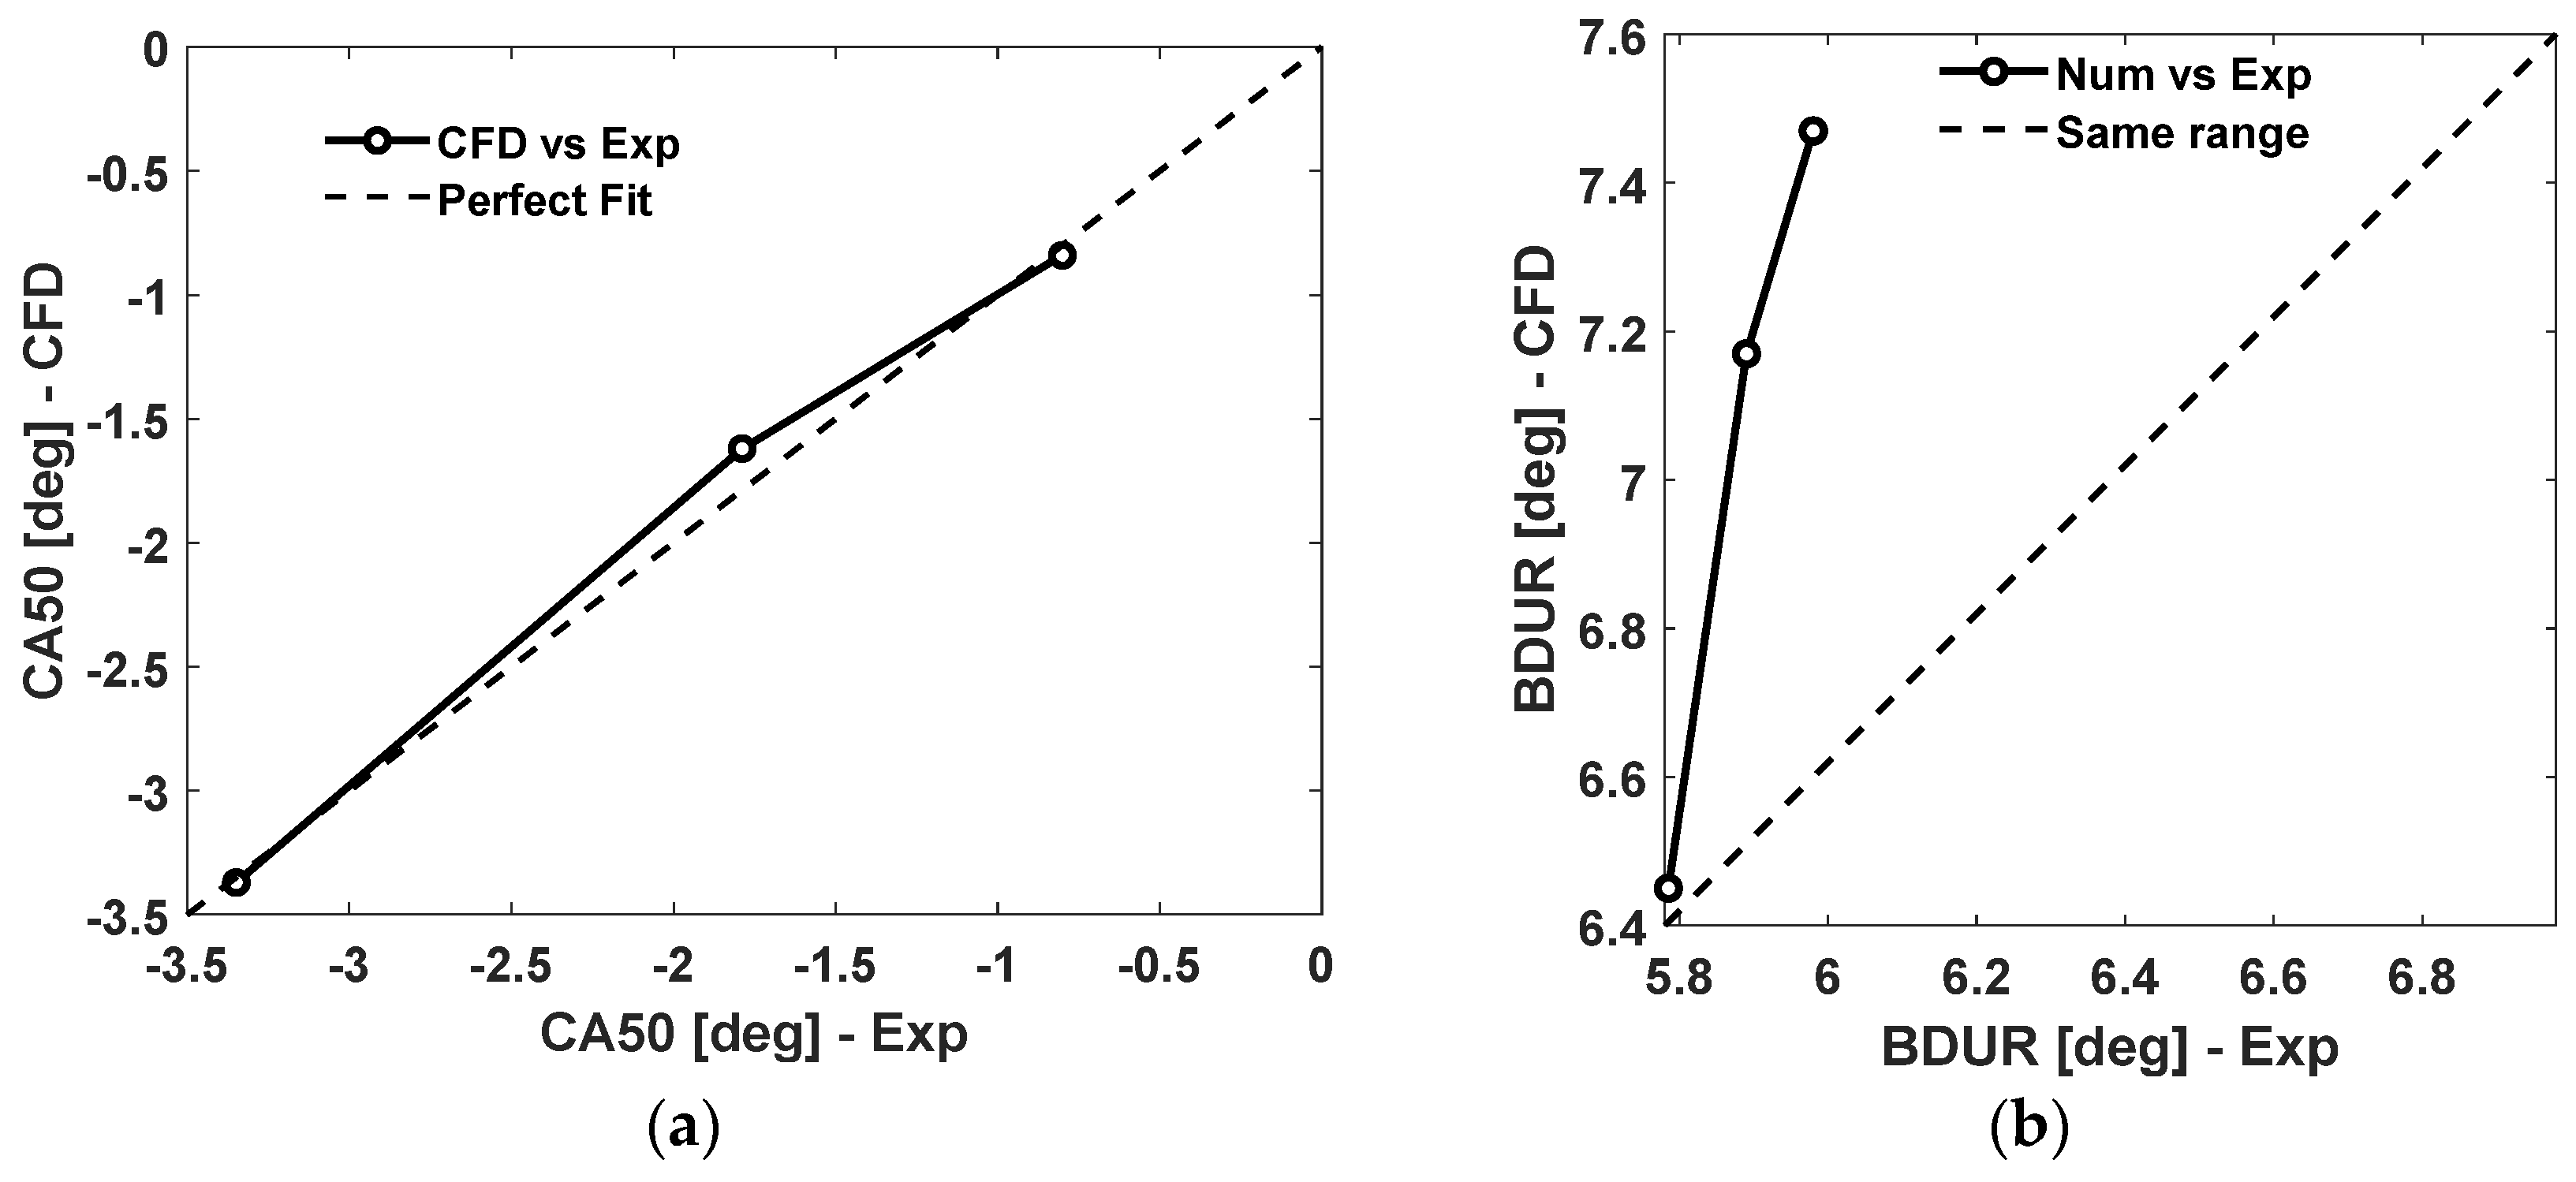
Figure 9.
Comparison between CFD and experiment results for (a) CA50 and (b) burn duration.
Figure 9.
Comparison between CFD and experiment results for (a) CA50 and (b) burn duration.
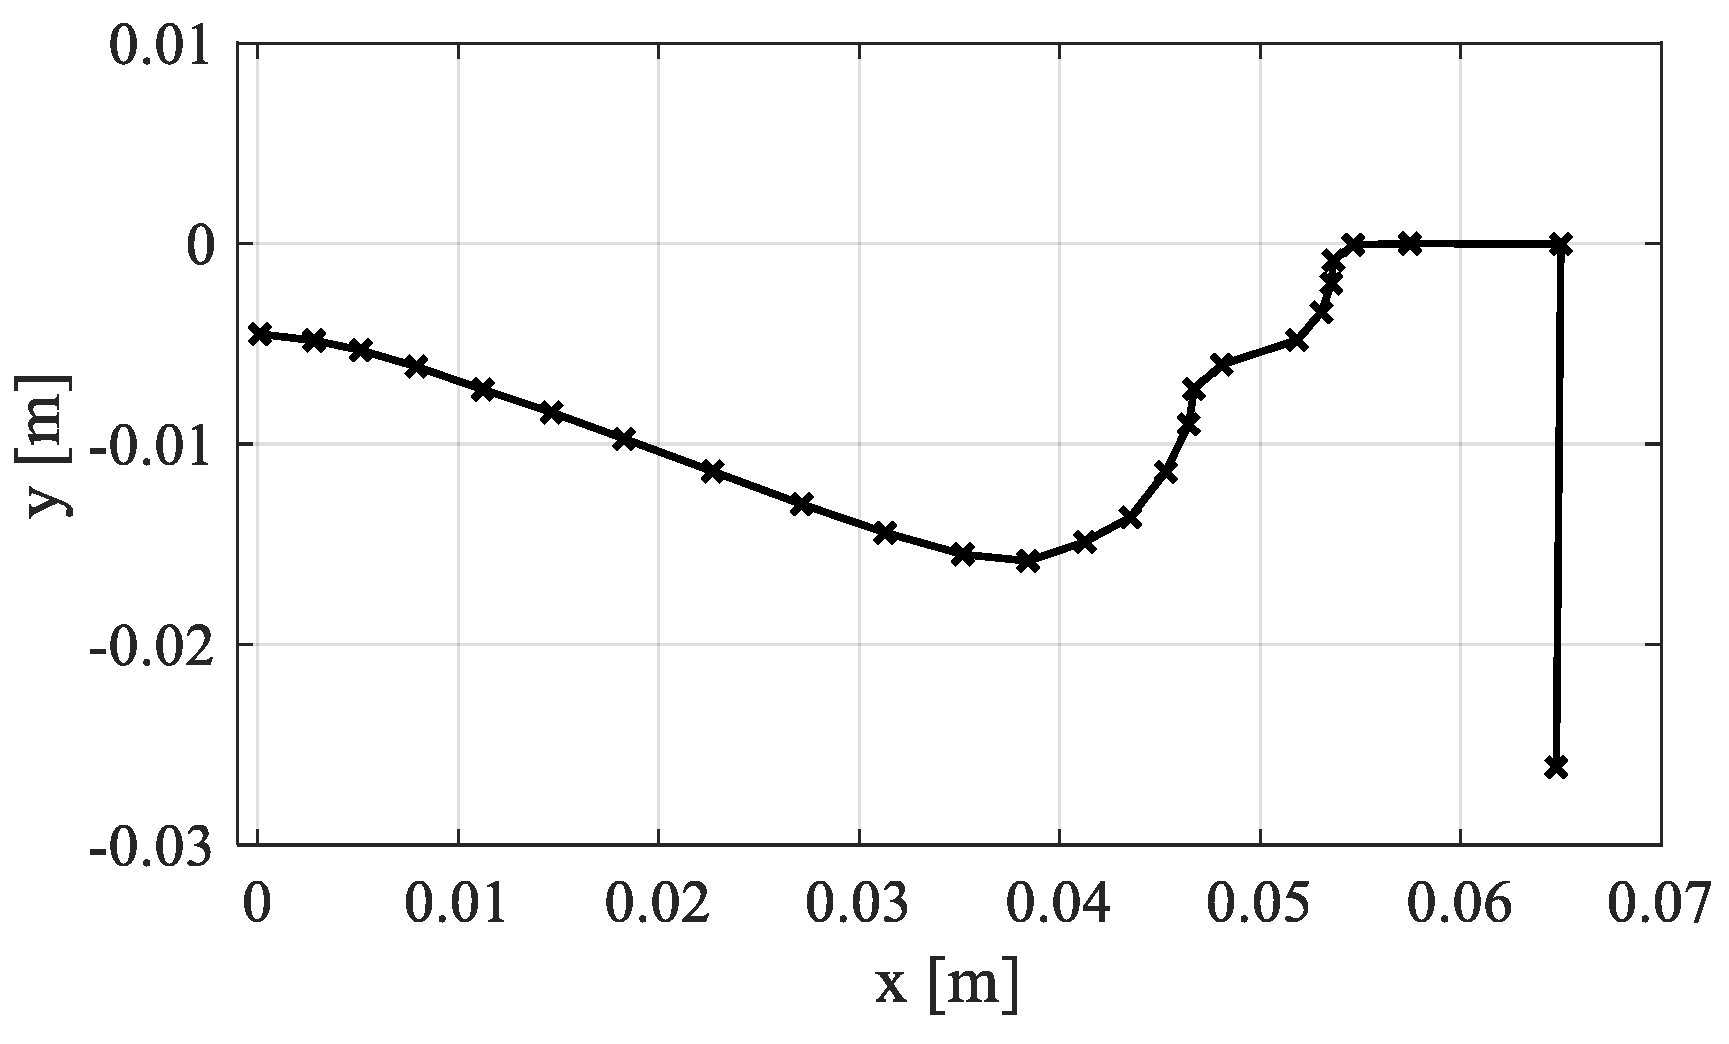
Figure 10.
Double-cup piston bowl profile.
Figure 10.
Double-cup piston bowl profile.
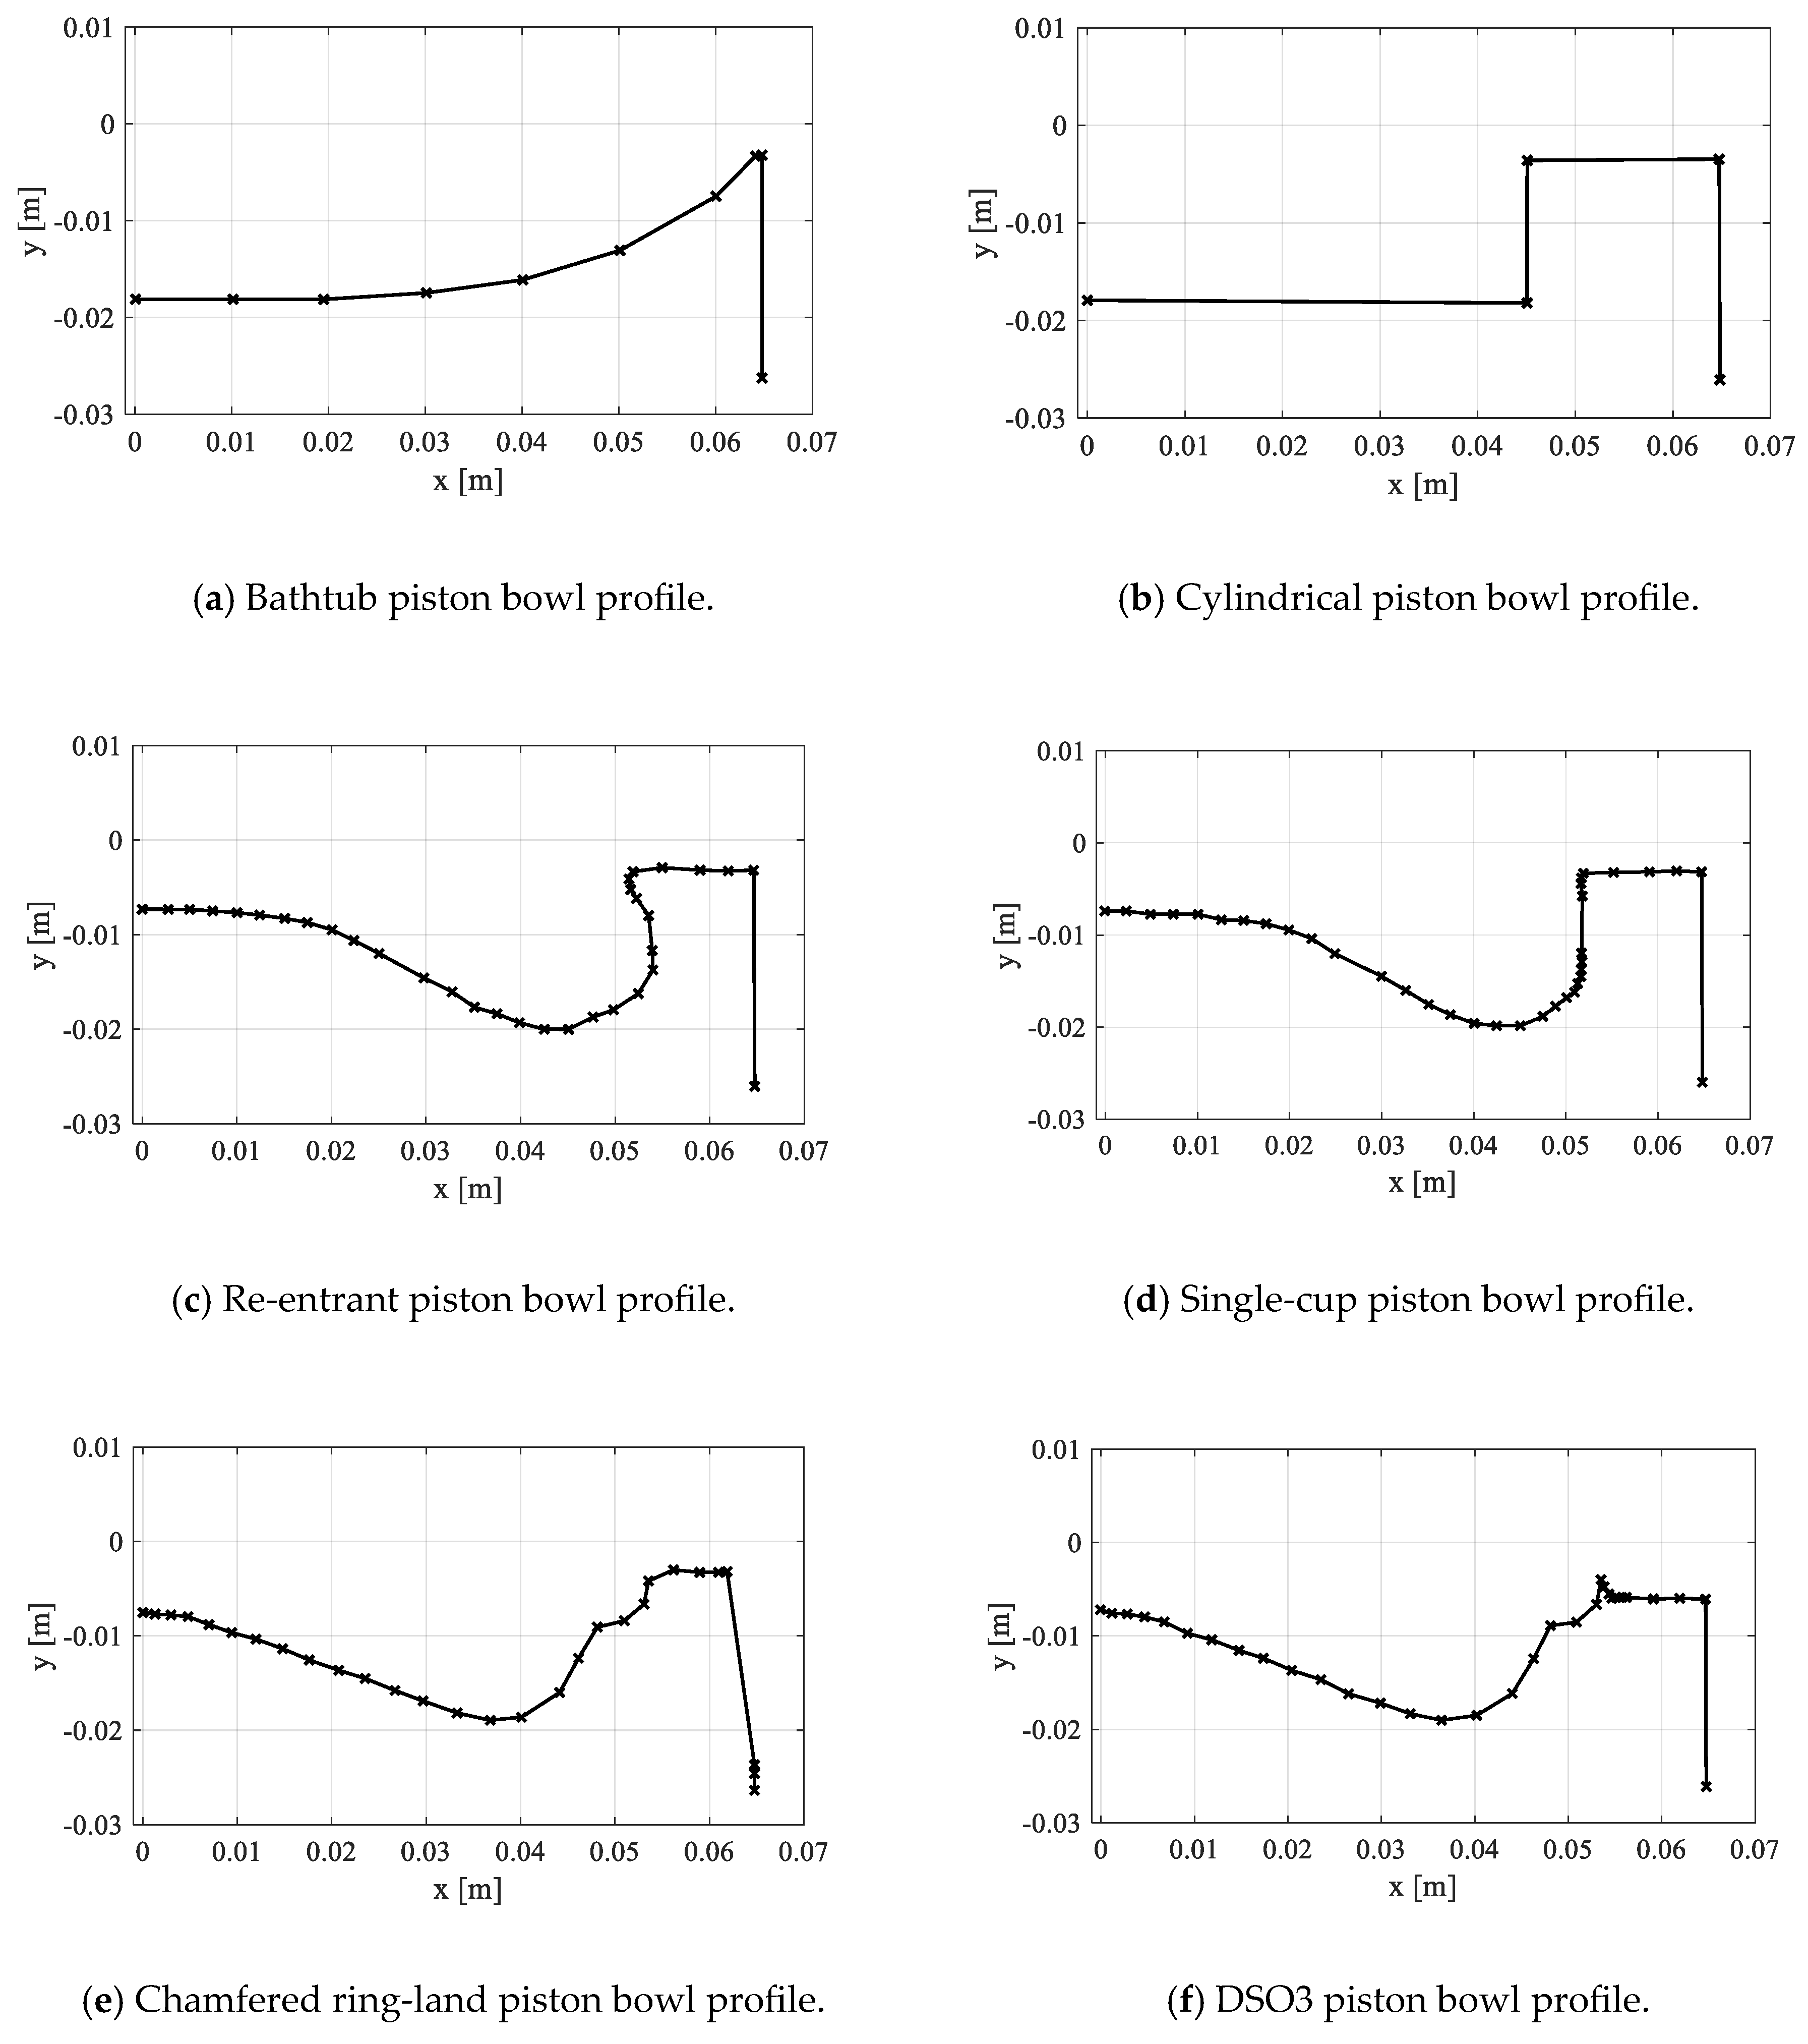
Figure 11.
Different piston bowl profiles.
Figure 11.
Different piston bowl profiles.
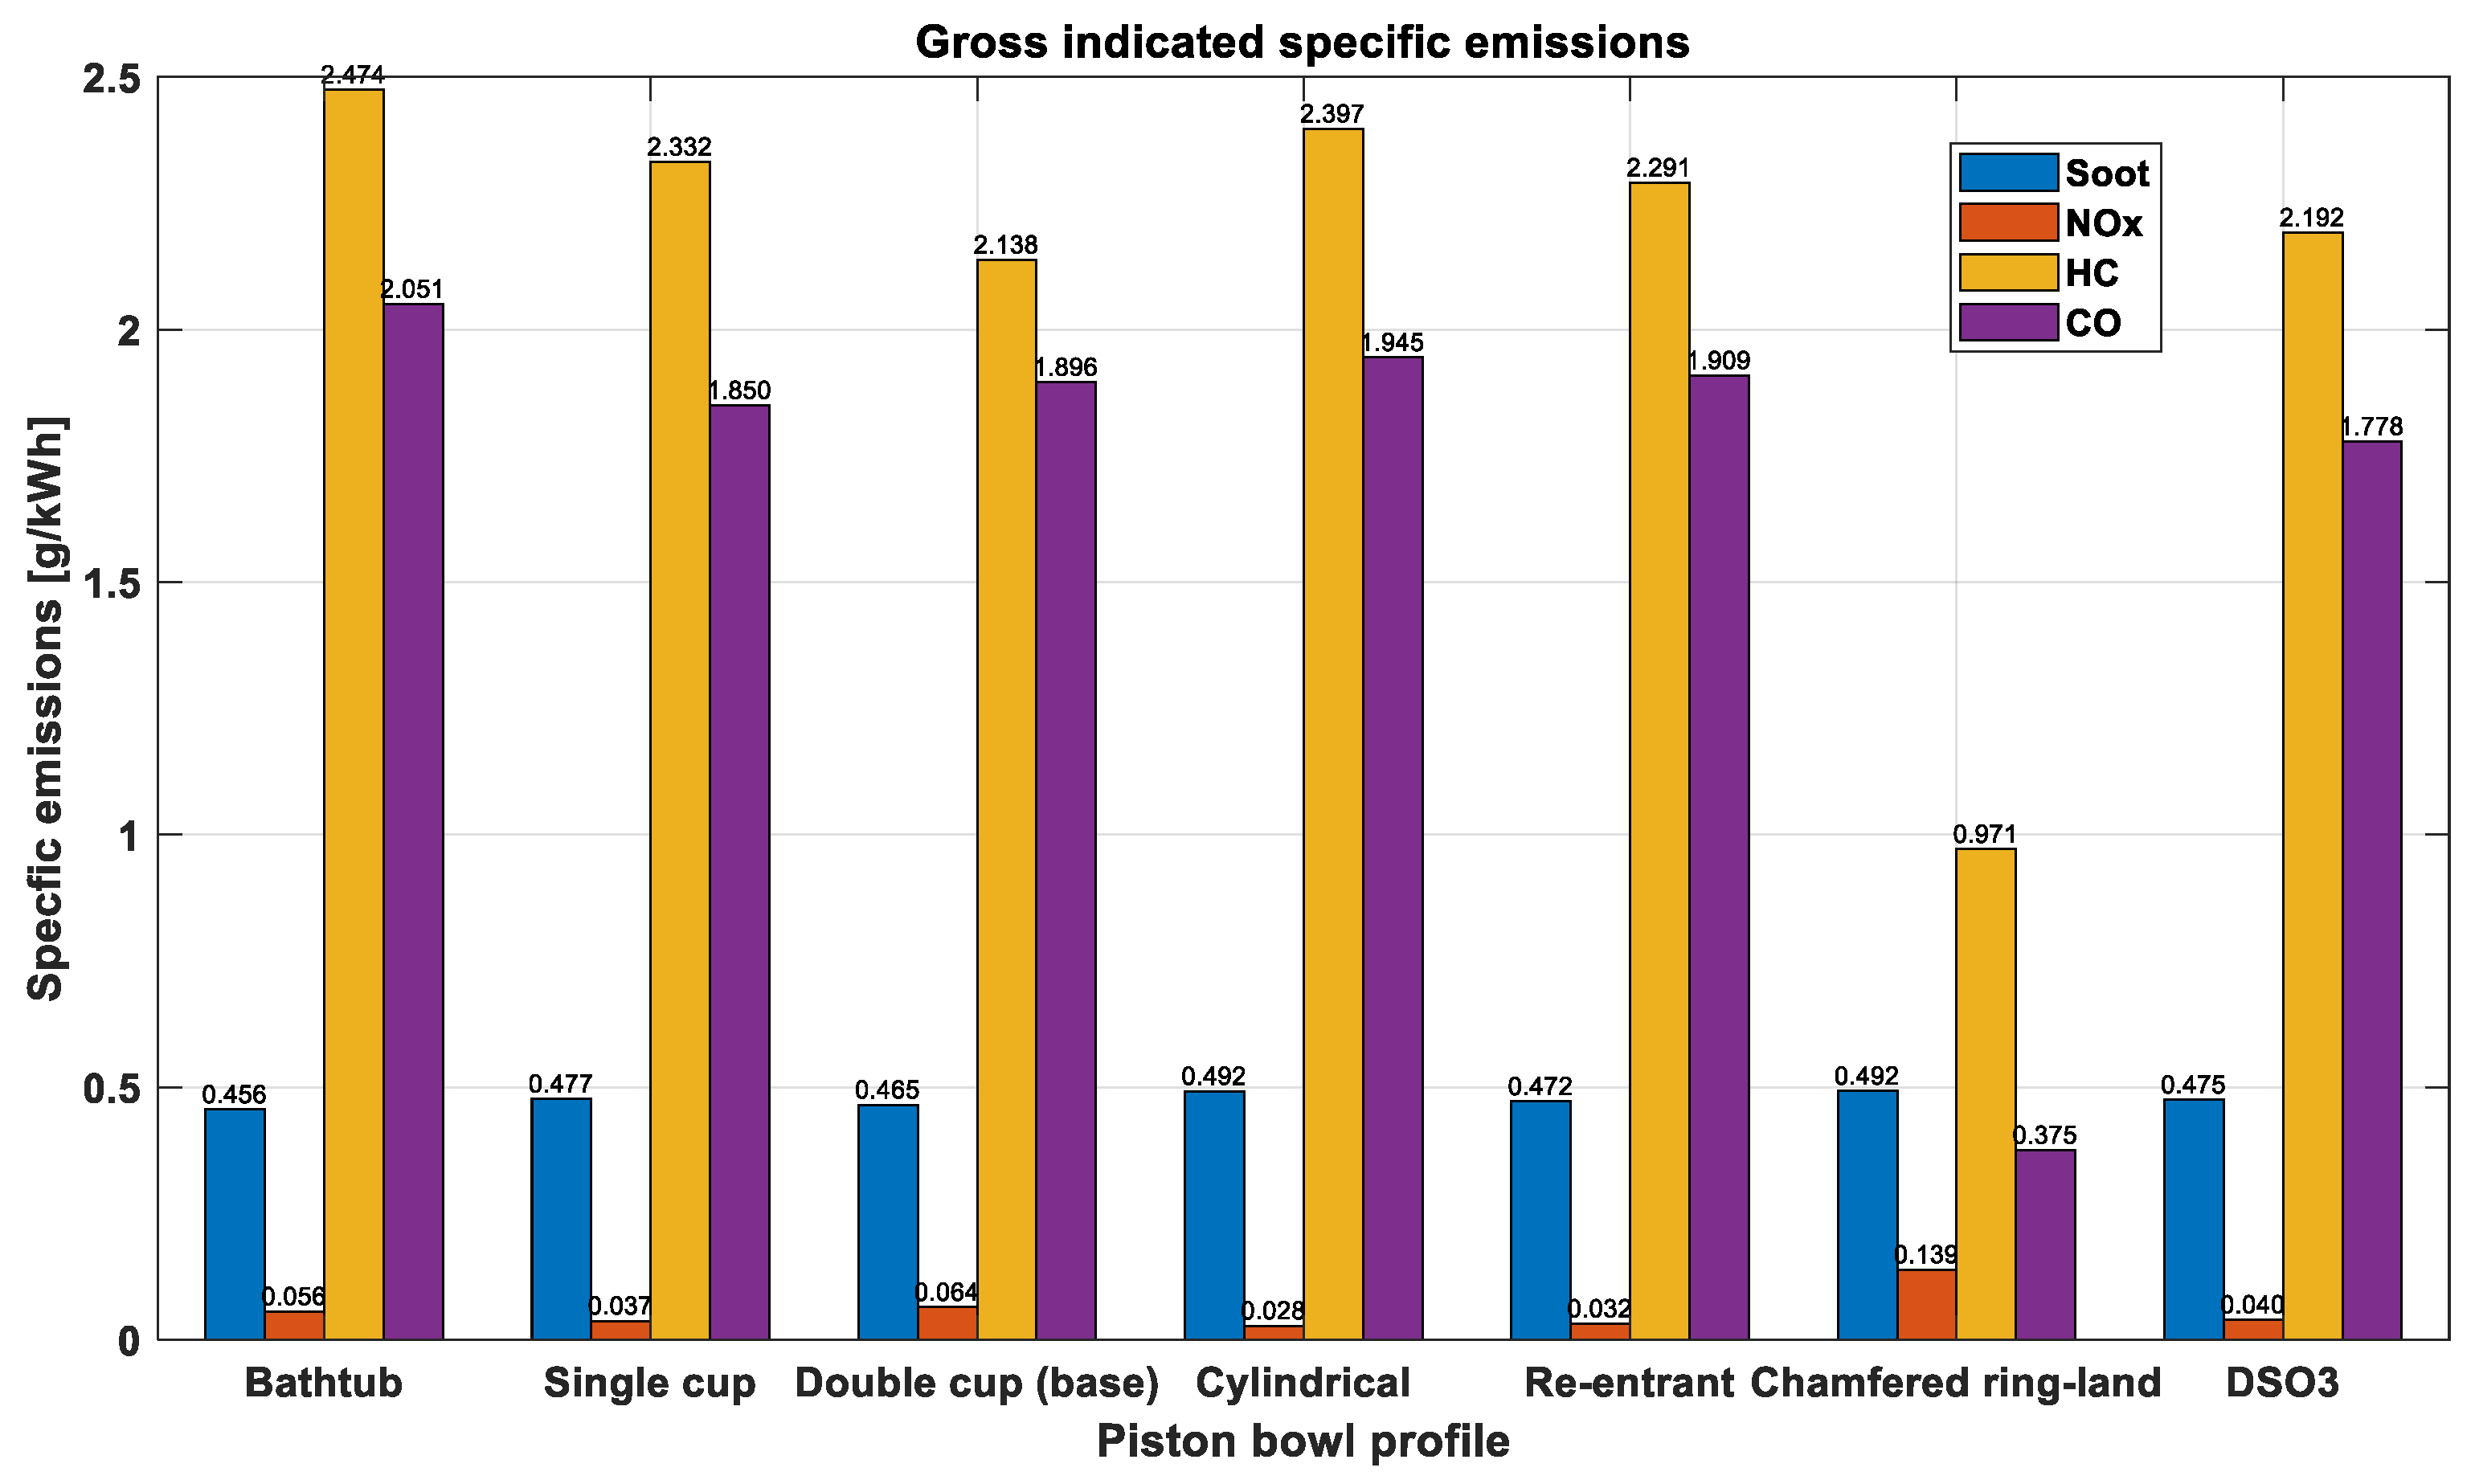
Figure 12.
Emissions trend while varying piston bowl profile at the base case operating conditions.
Figure 12.
Emissions trend while varying piston bowl profile at the base case operating conditions.
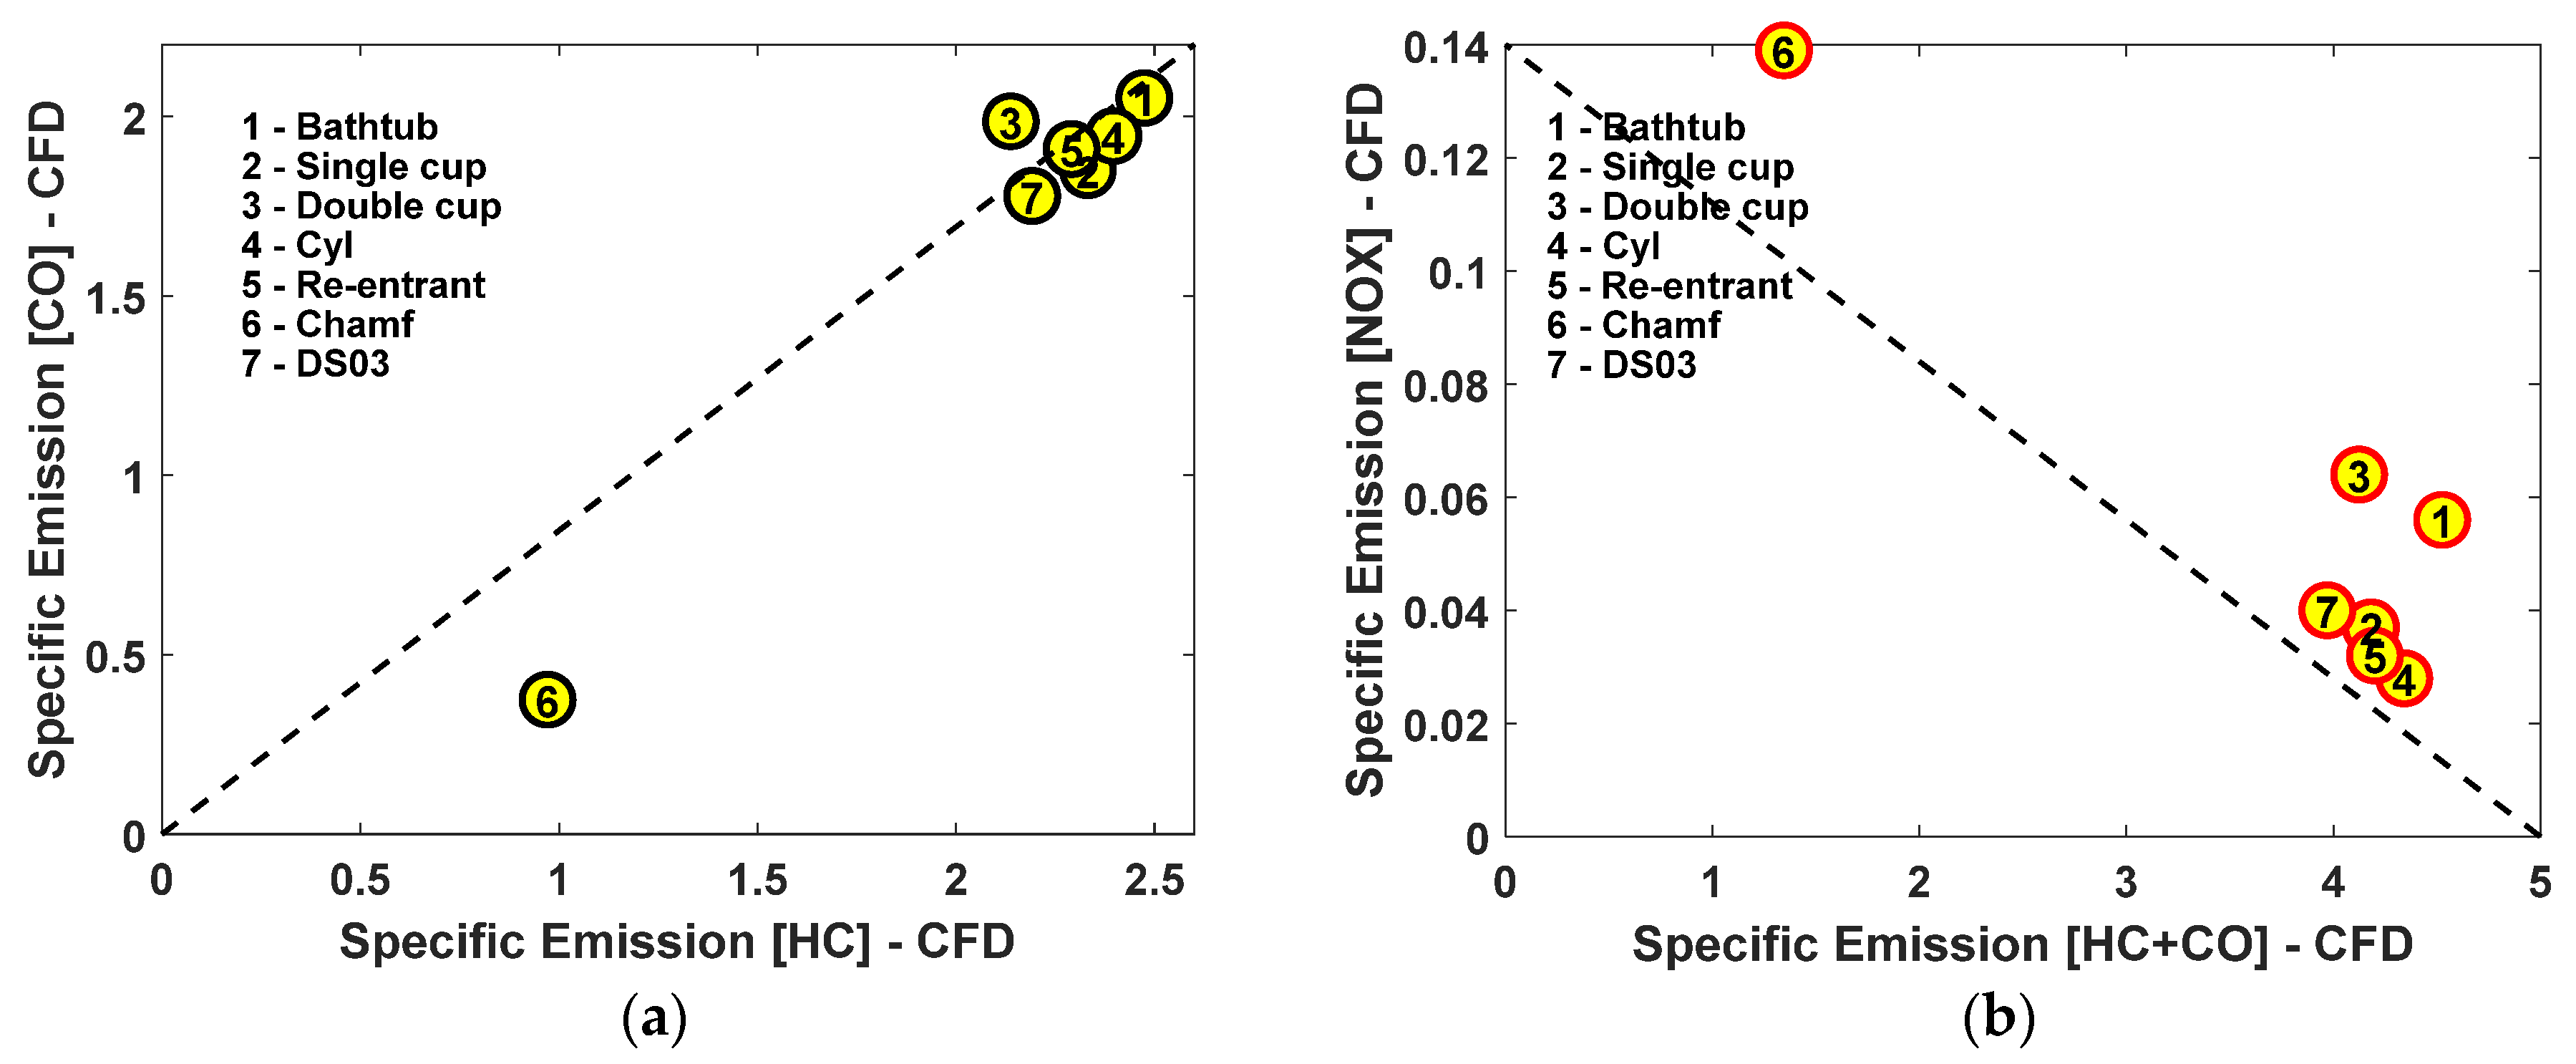
Figure 13.
Correlation graph between HC and CO (a) and between NOx and HC + CO (b).
Figure 13.
Correlation graph between HC and CO (a) and between NOx and HC + CO (b).
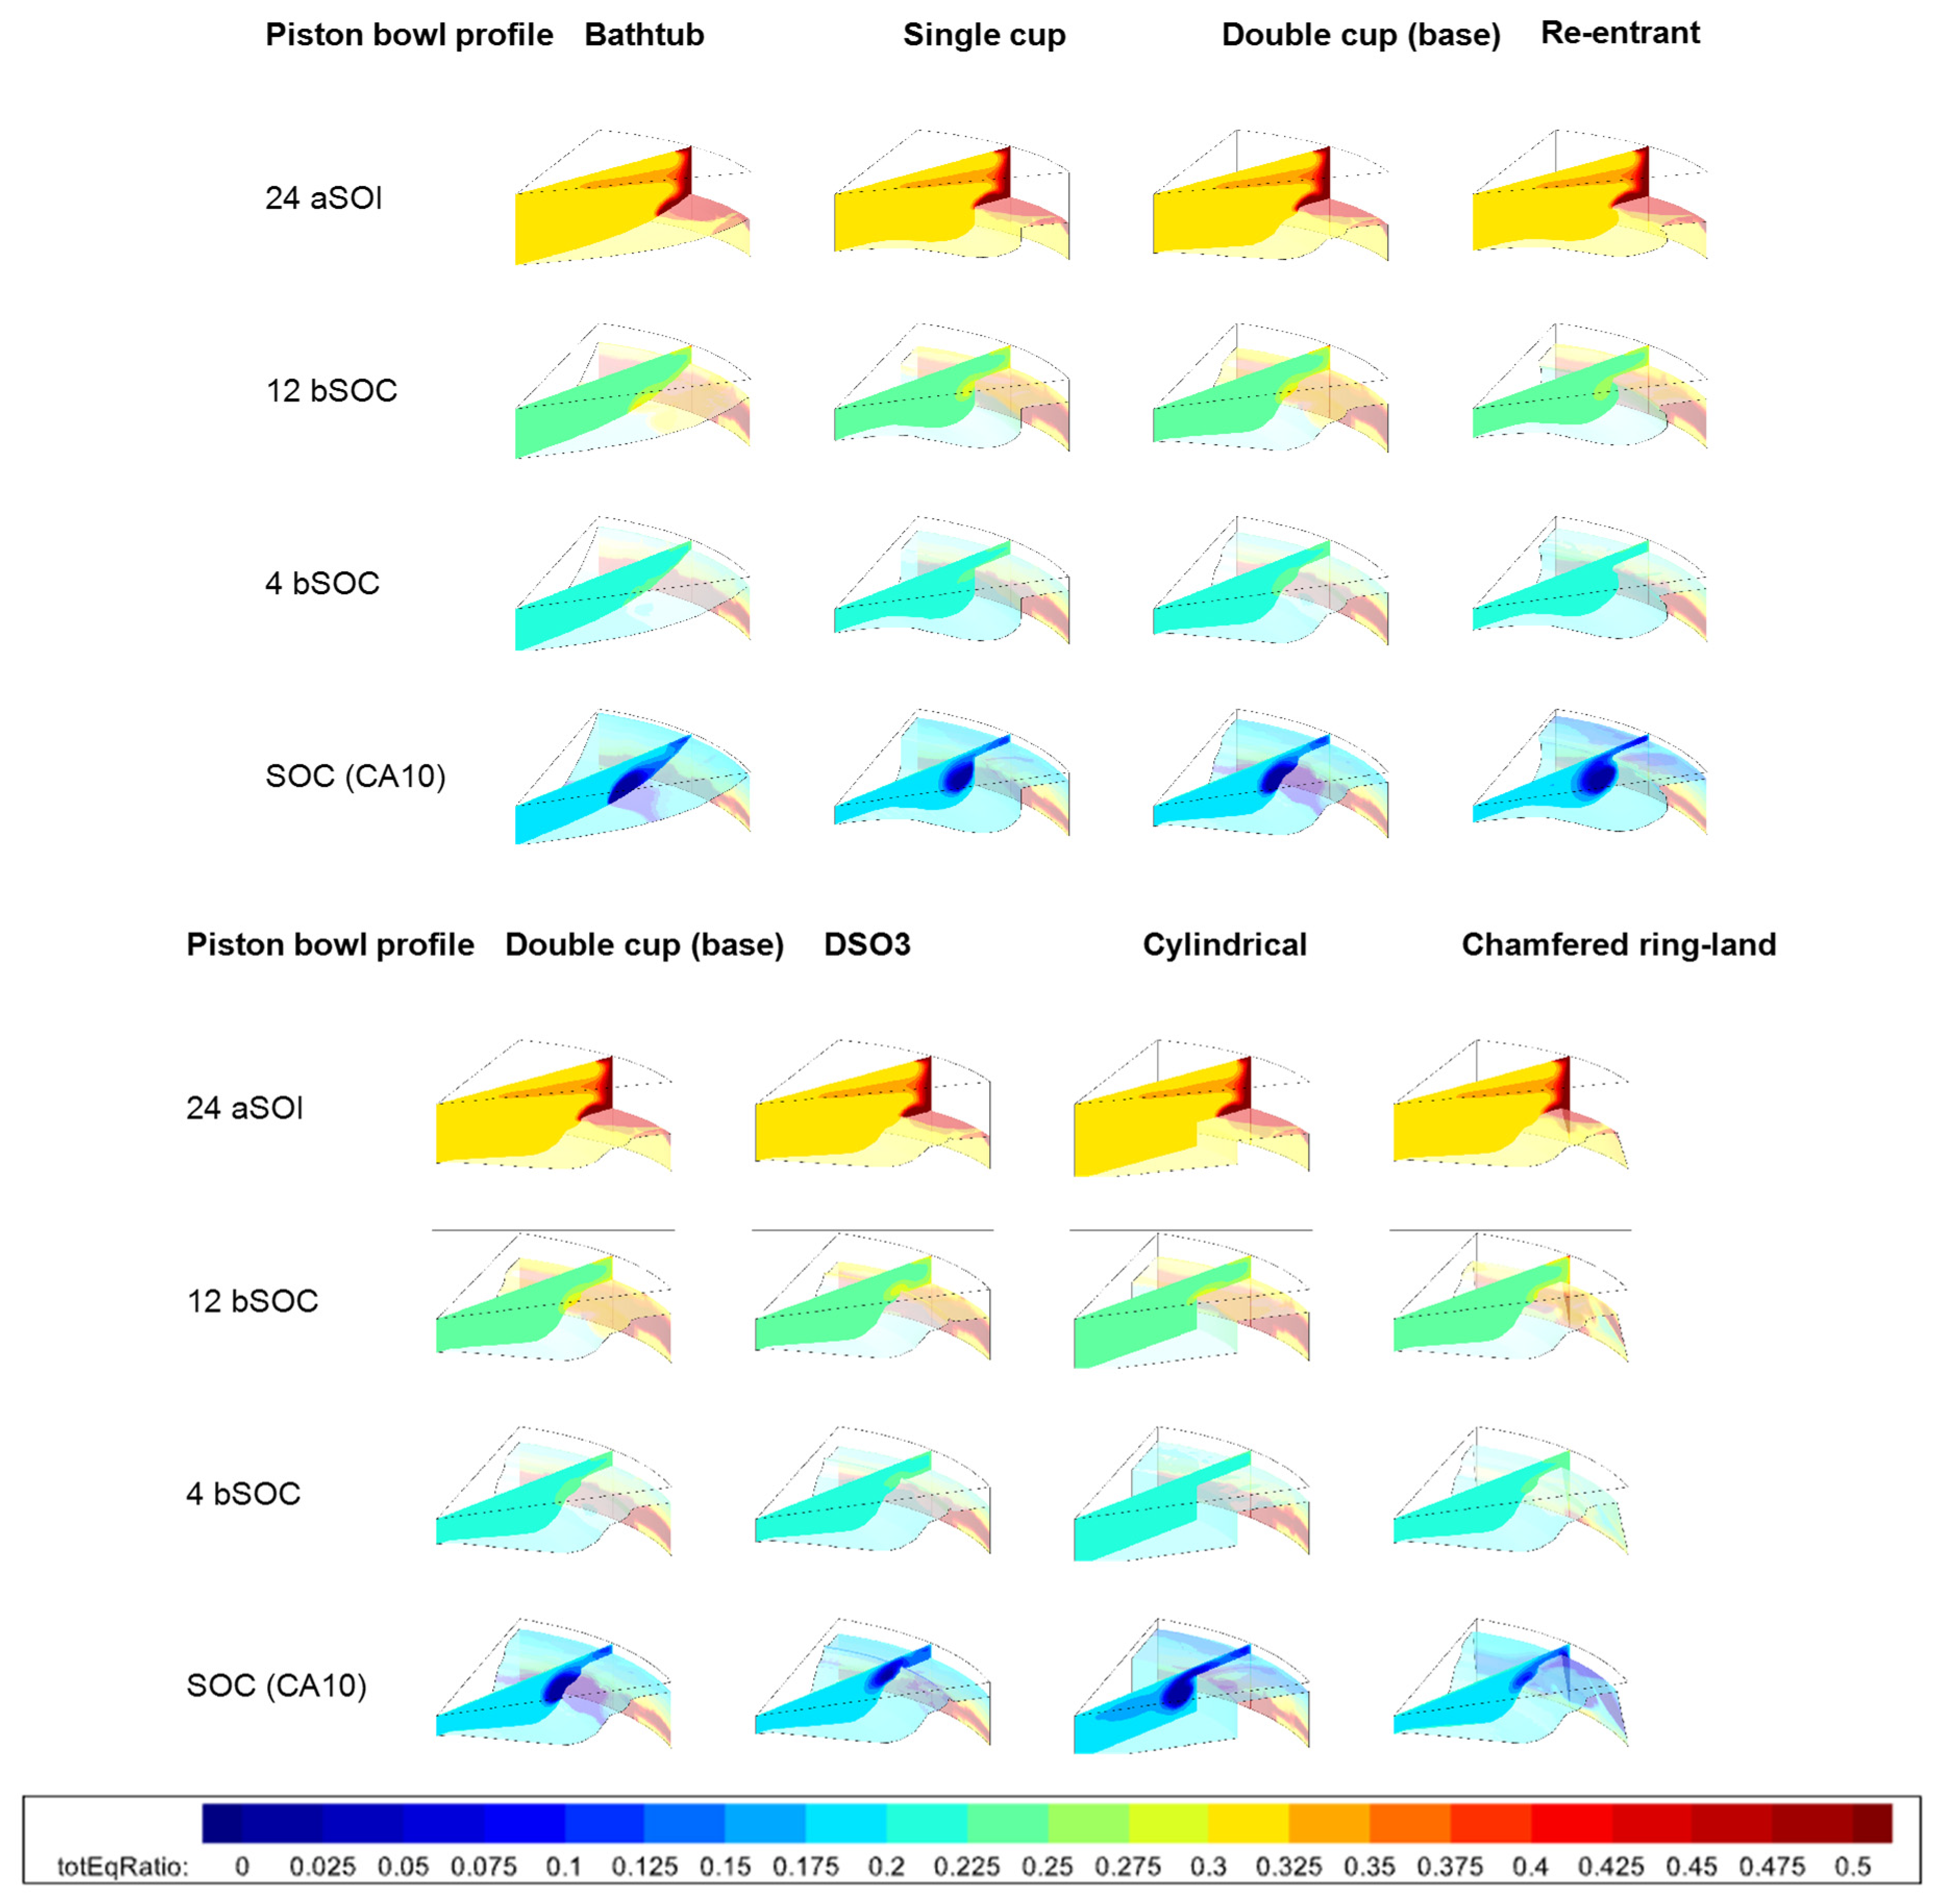
Figure 14.
Equivalence ratio [−] contour images for piston bowl profiles for four different characteristic crank angles (unit in degrees) (24 deg. aSOI, 12 deg. bSOC,4 deg. bSOC, and at SOC). aSOI: after SOI; bSOC: before SOC. SOC is defined as CA10, i.e., crank angle at 10% heat released.
Figure 14.
Equivalence ratio [−] contour images for piston bowl profiles for four different characteristic crank angles (unit in degrees) (24 deg. aSOI, 12 deg. bSOC,4 deg. bSOC, and at SOC). aSOI: after SOI; bSOC: before SOC. SOC is defined as CA10, i.e., crank angle at 10% heat released.
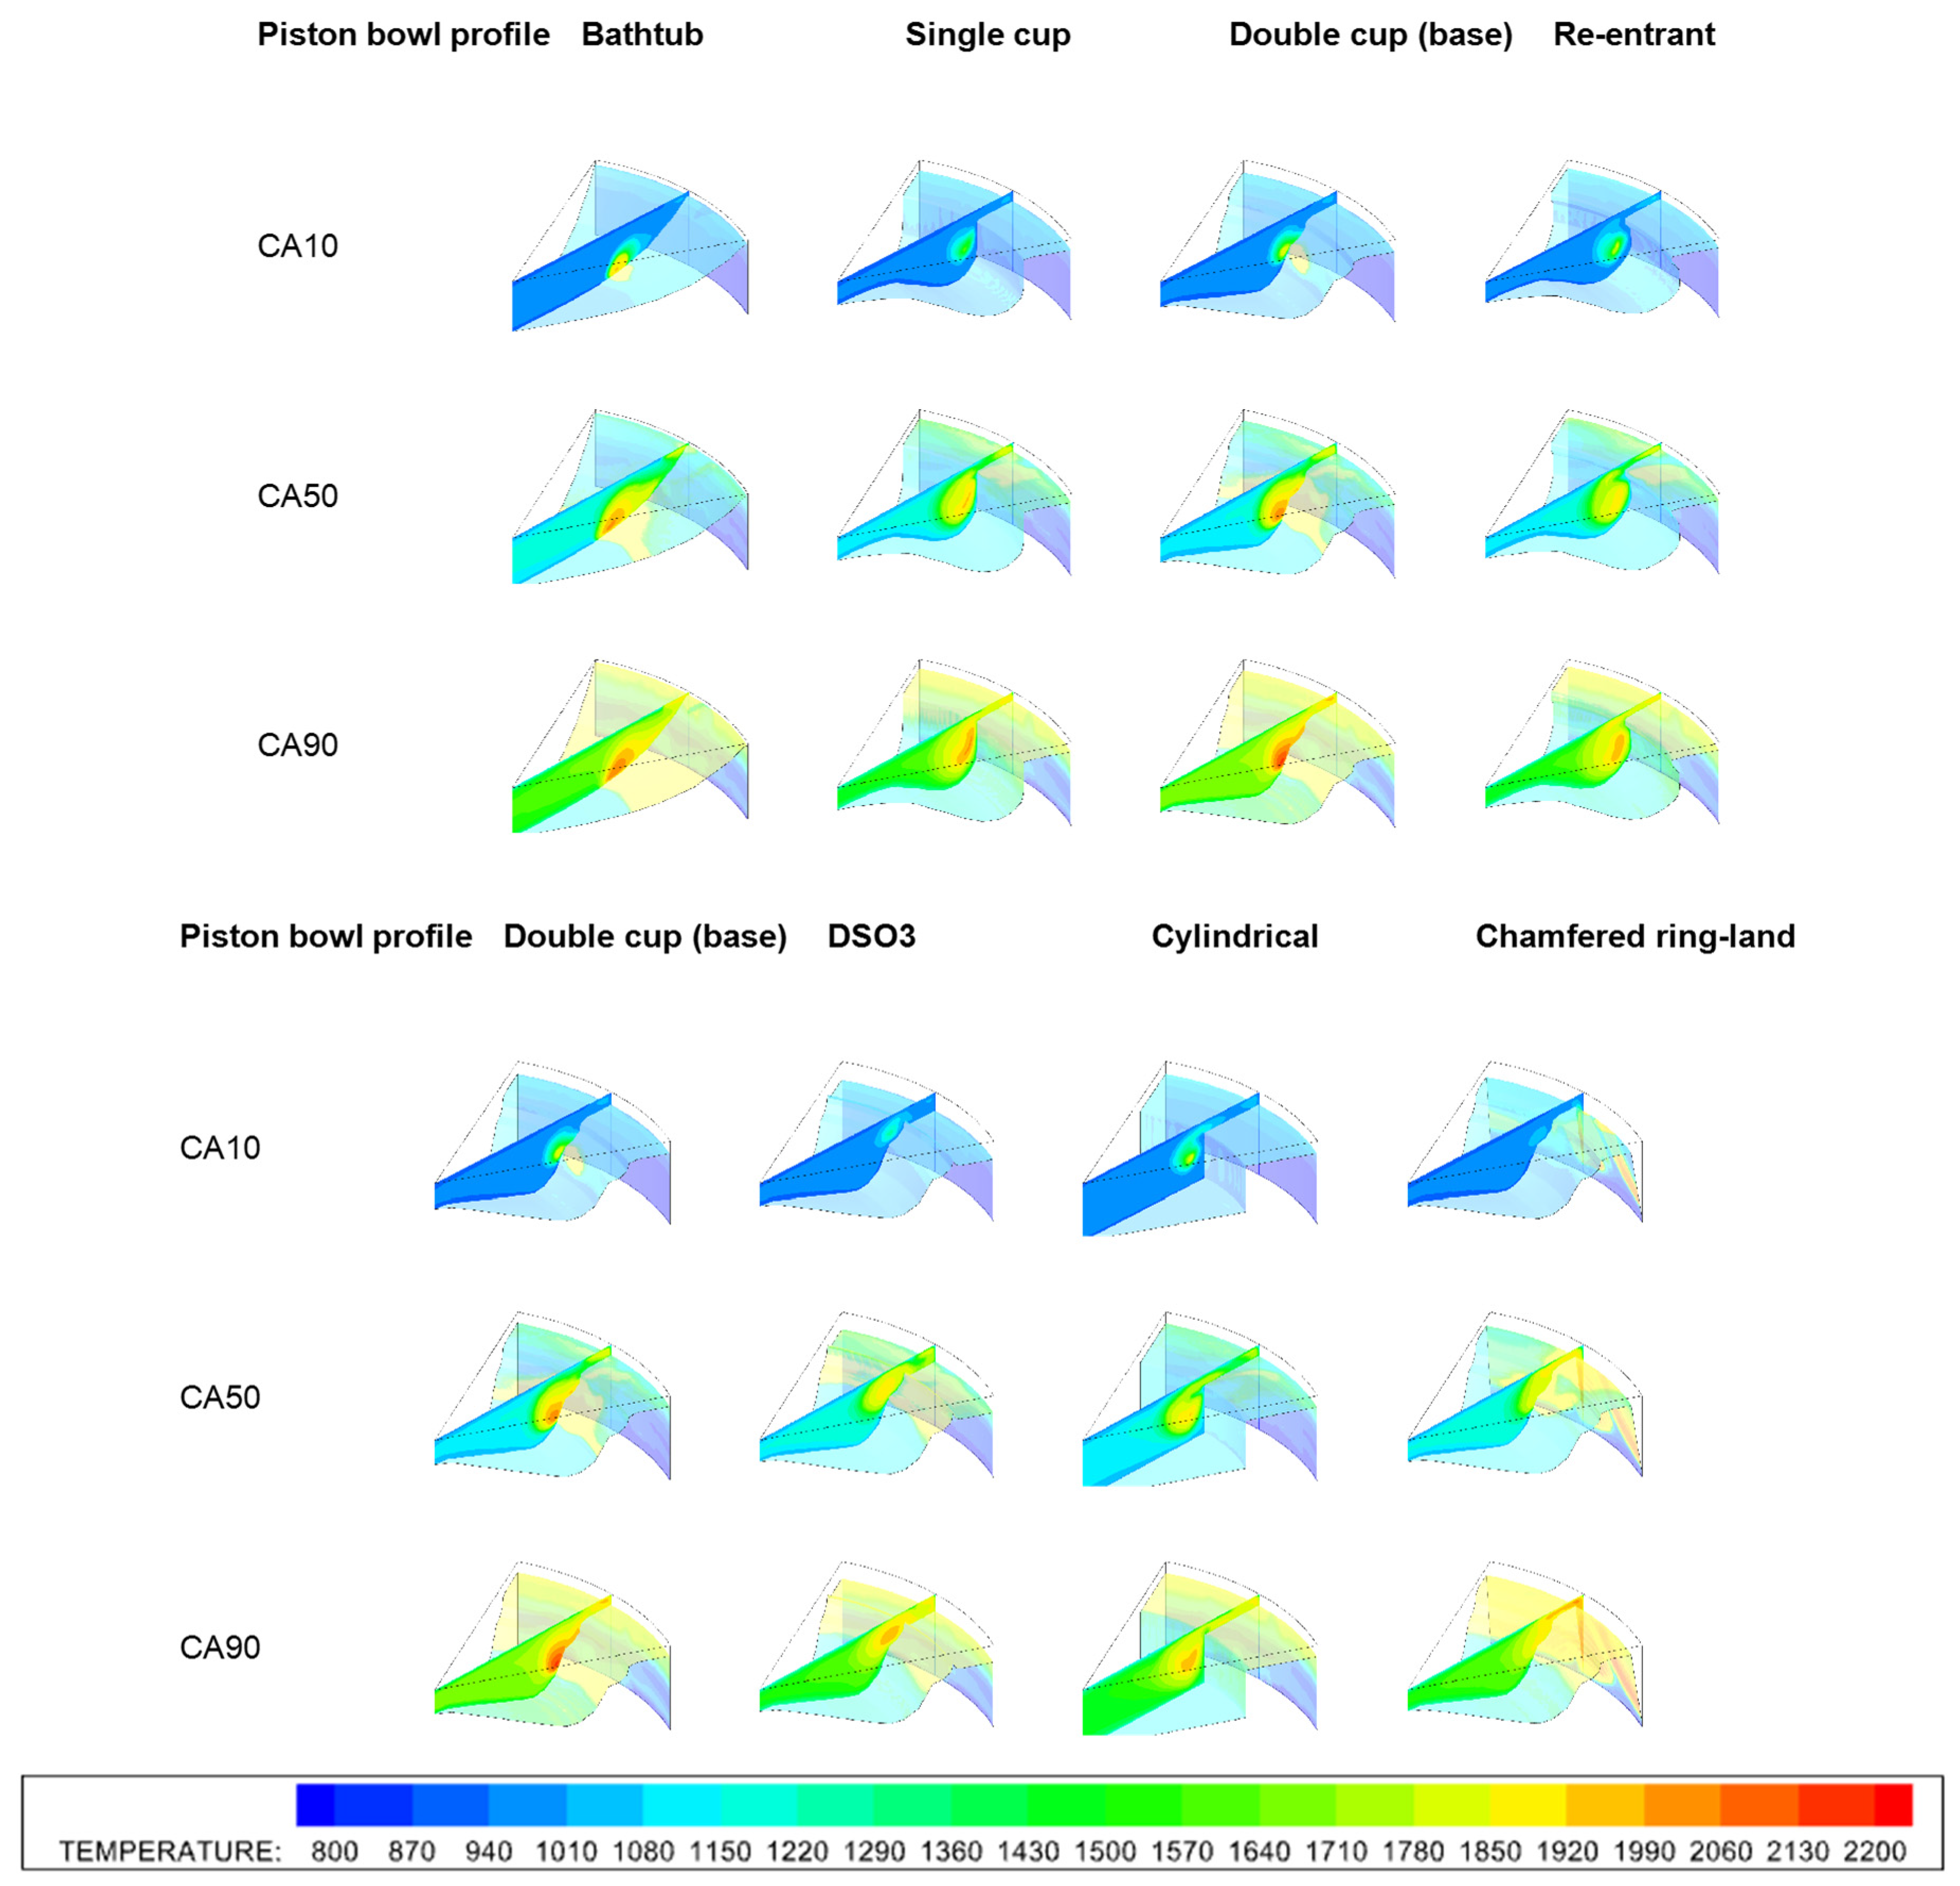
Figure 15.
Temperature [K] contour images during combustion for less common piston bowl profiles.
Figure 15.
Temperature [K] contour images during combustion for less common piston bowl profiles.
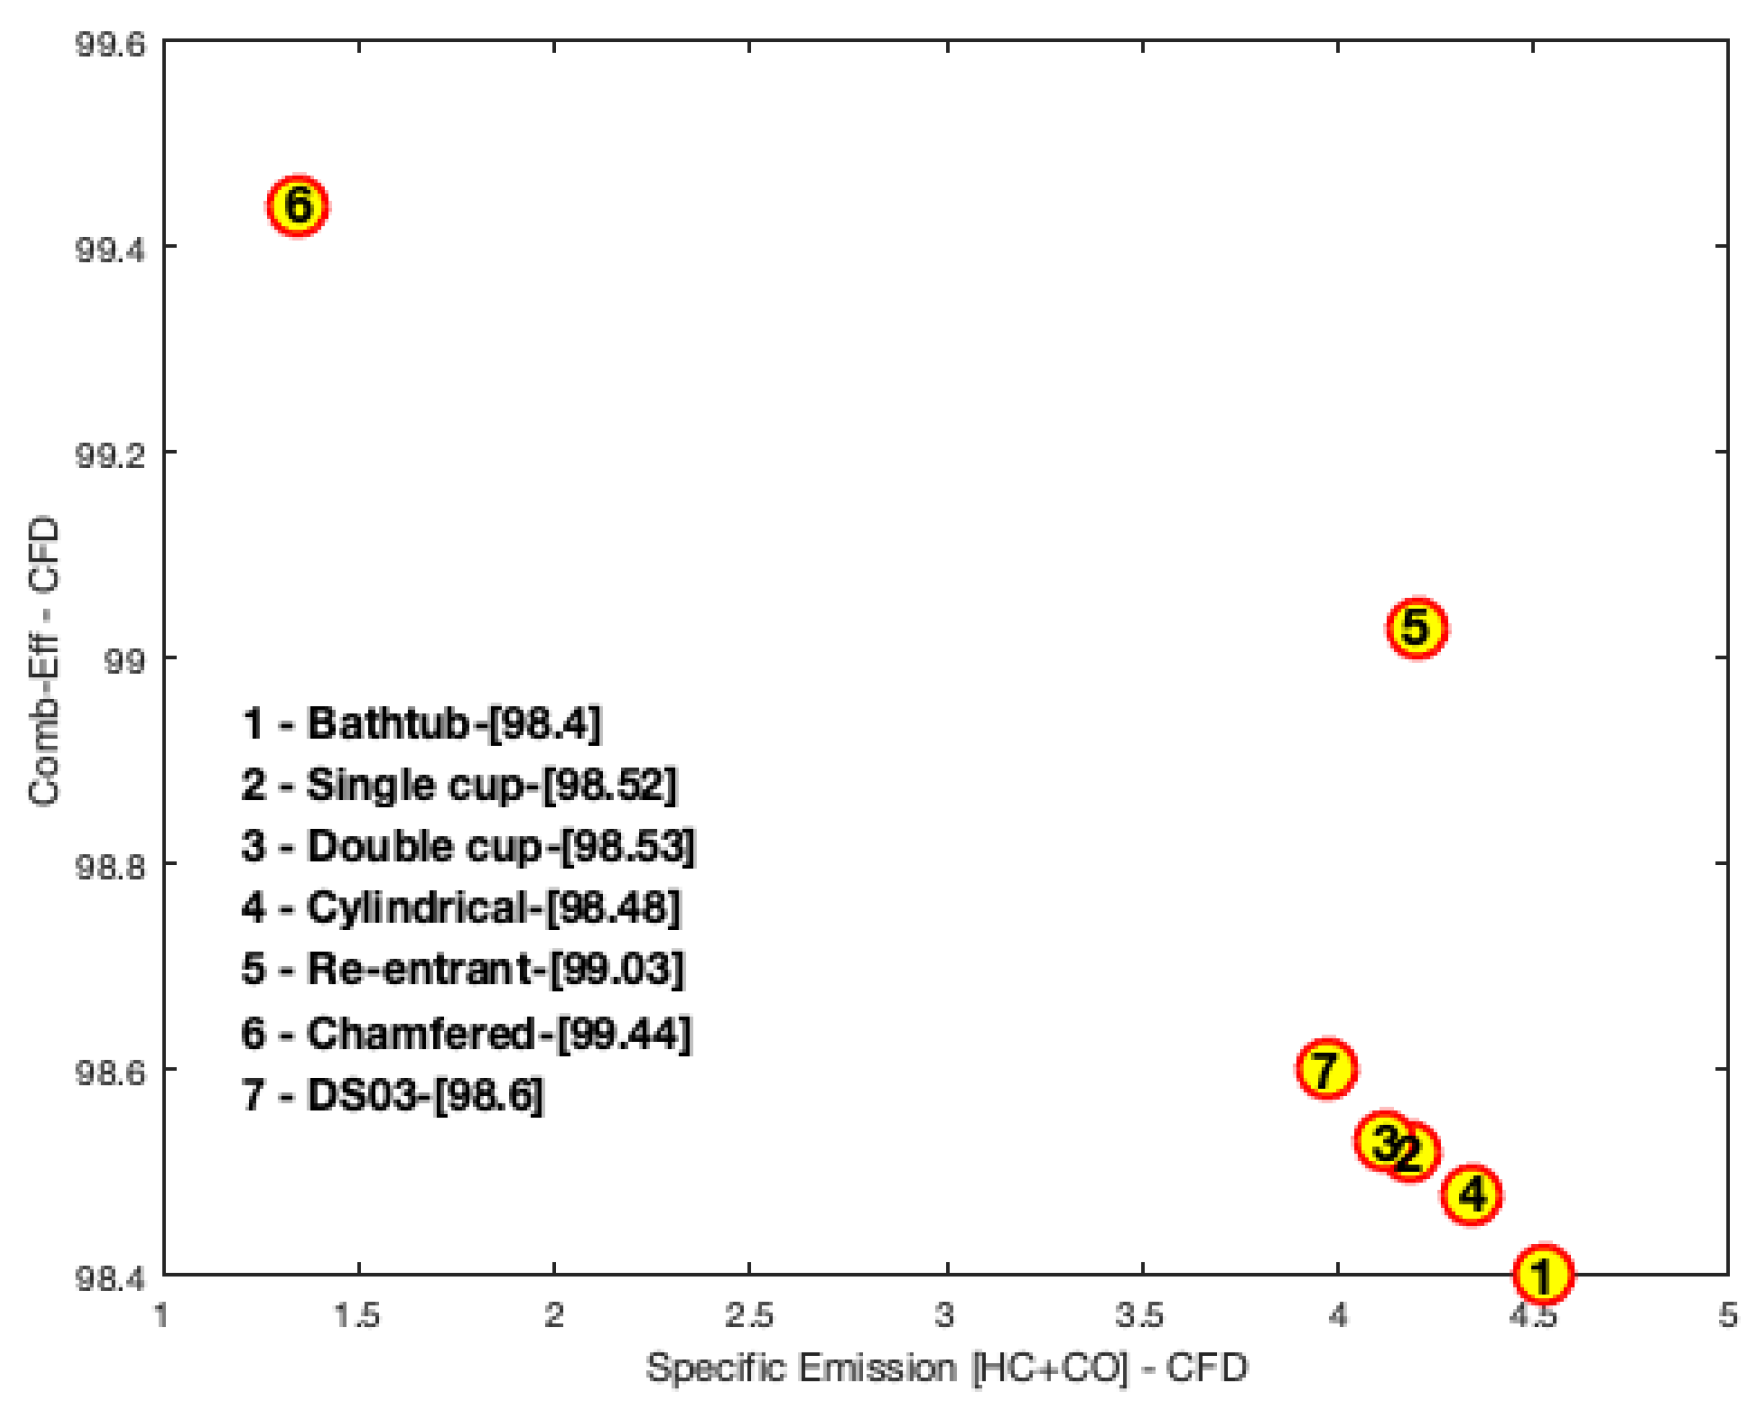
Figure 16.
Correlation graph between HC + CO and combustion efficiency.
Figure 16.
Correlation graph between HC + CO and combustion efficiency.
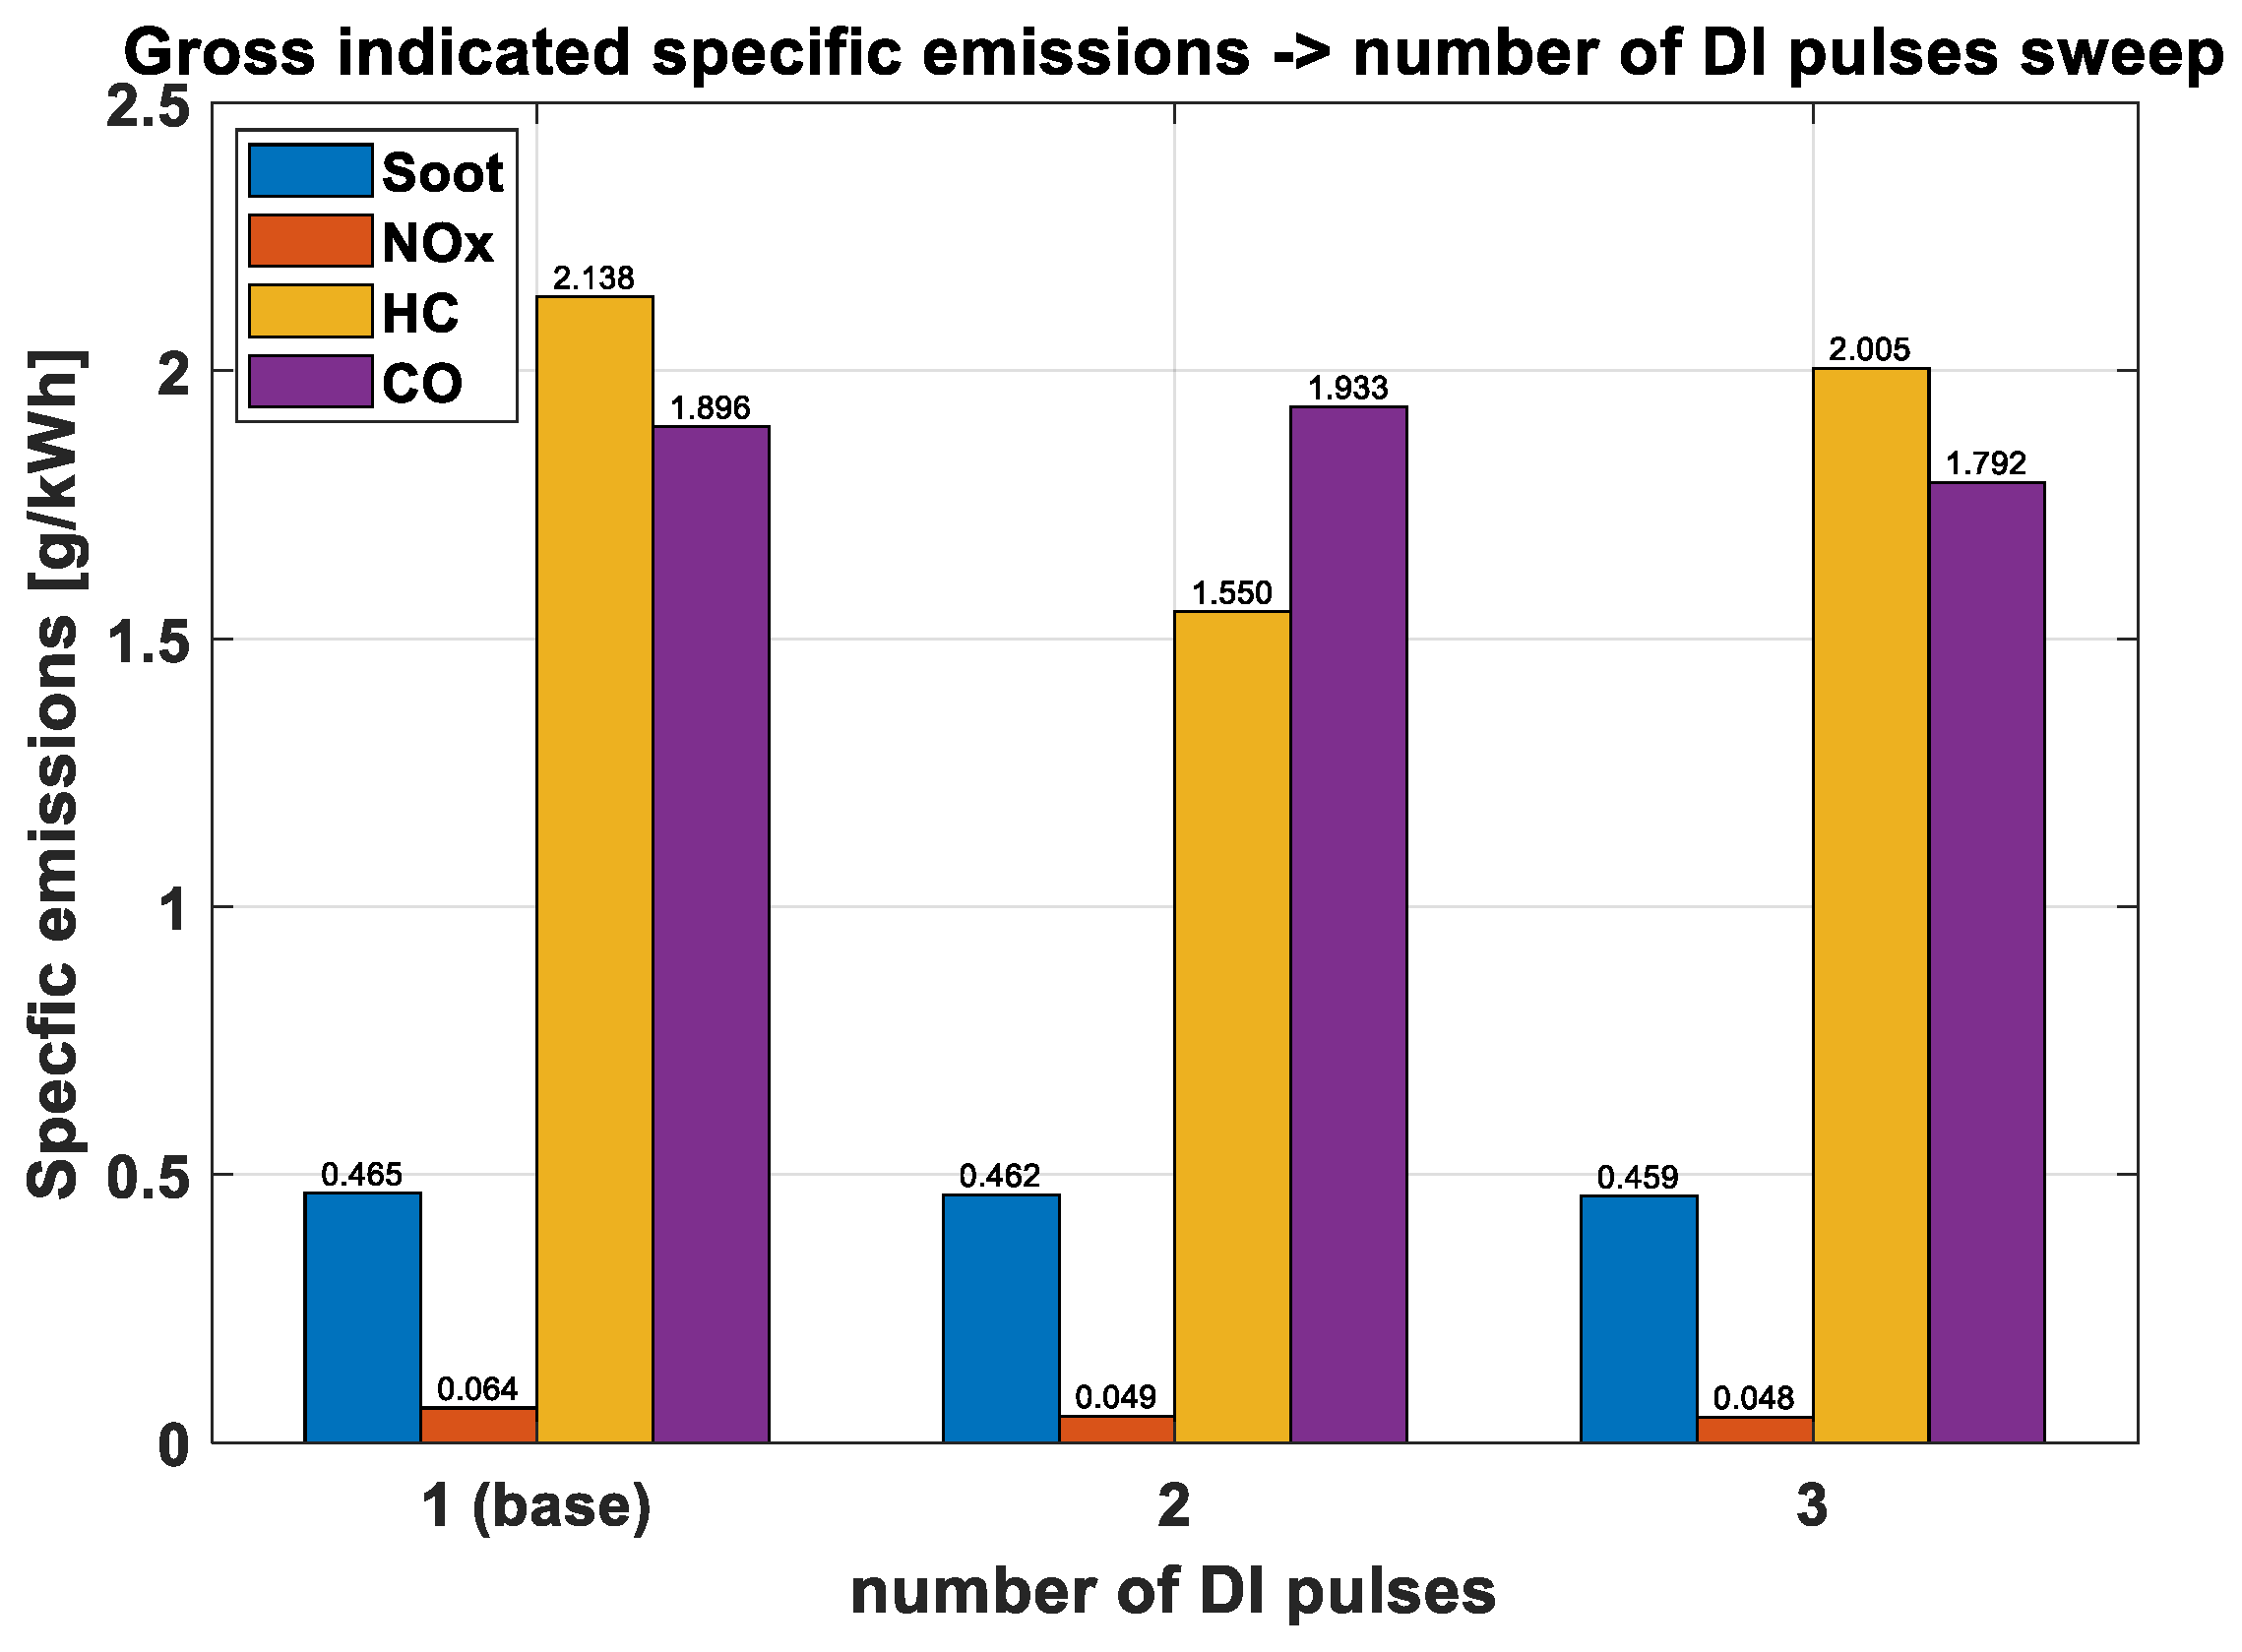
Figure 17.
The influence of the number of injection pulses on the emissions variations at the base case operating conditions.
Figure 17.
The influence of the number of injection pulses on the emissions variations at the base case operating conditions.
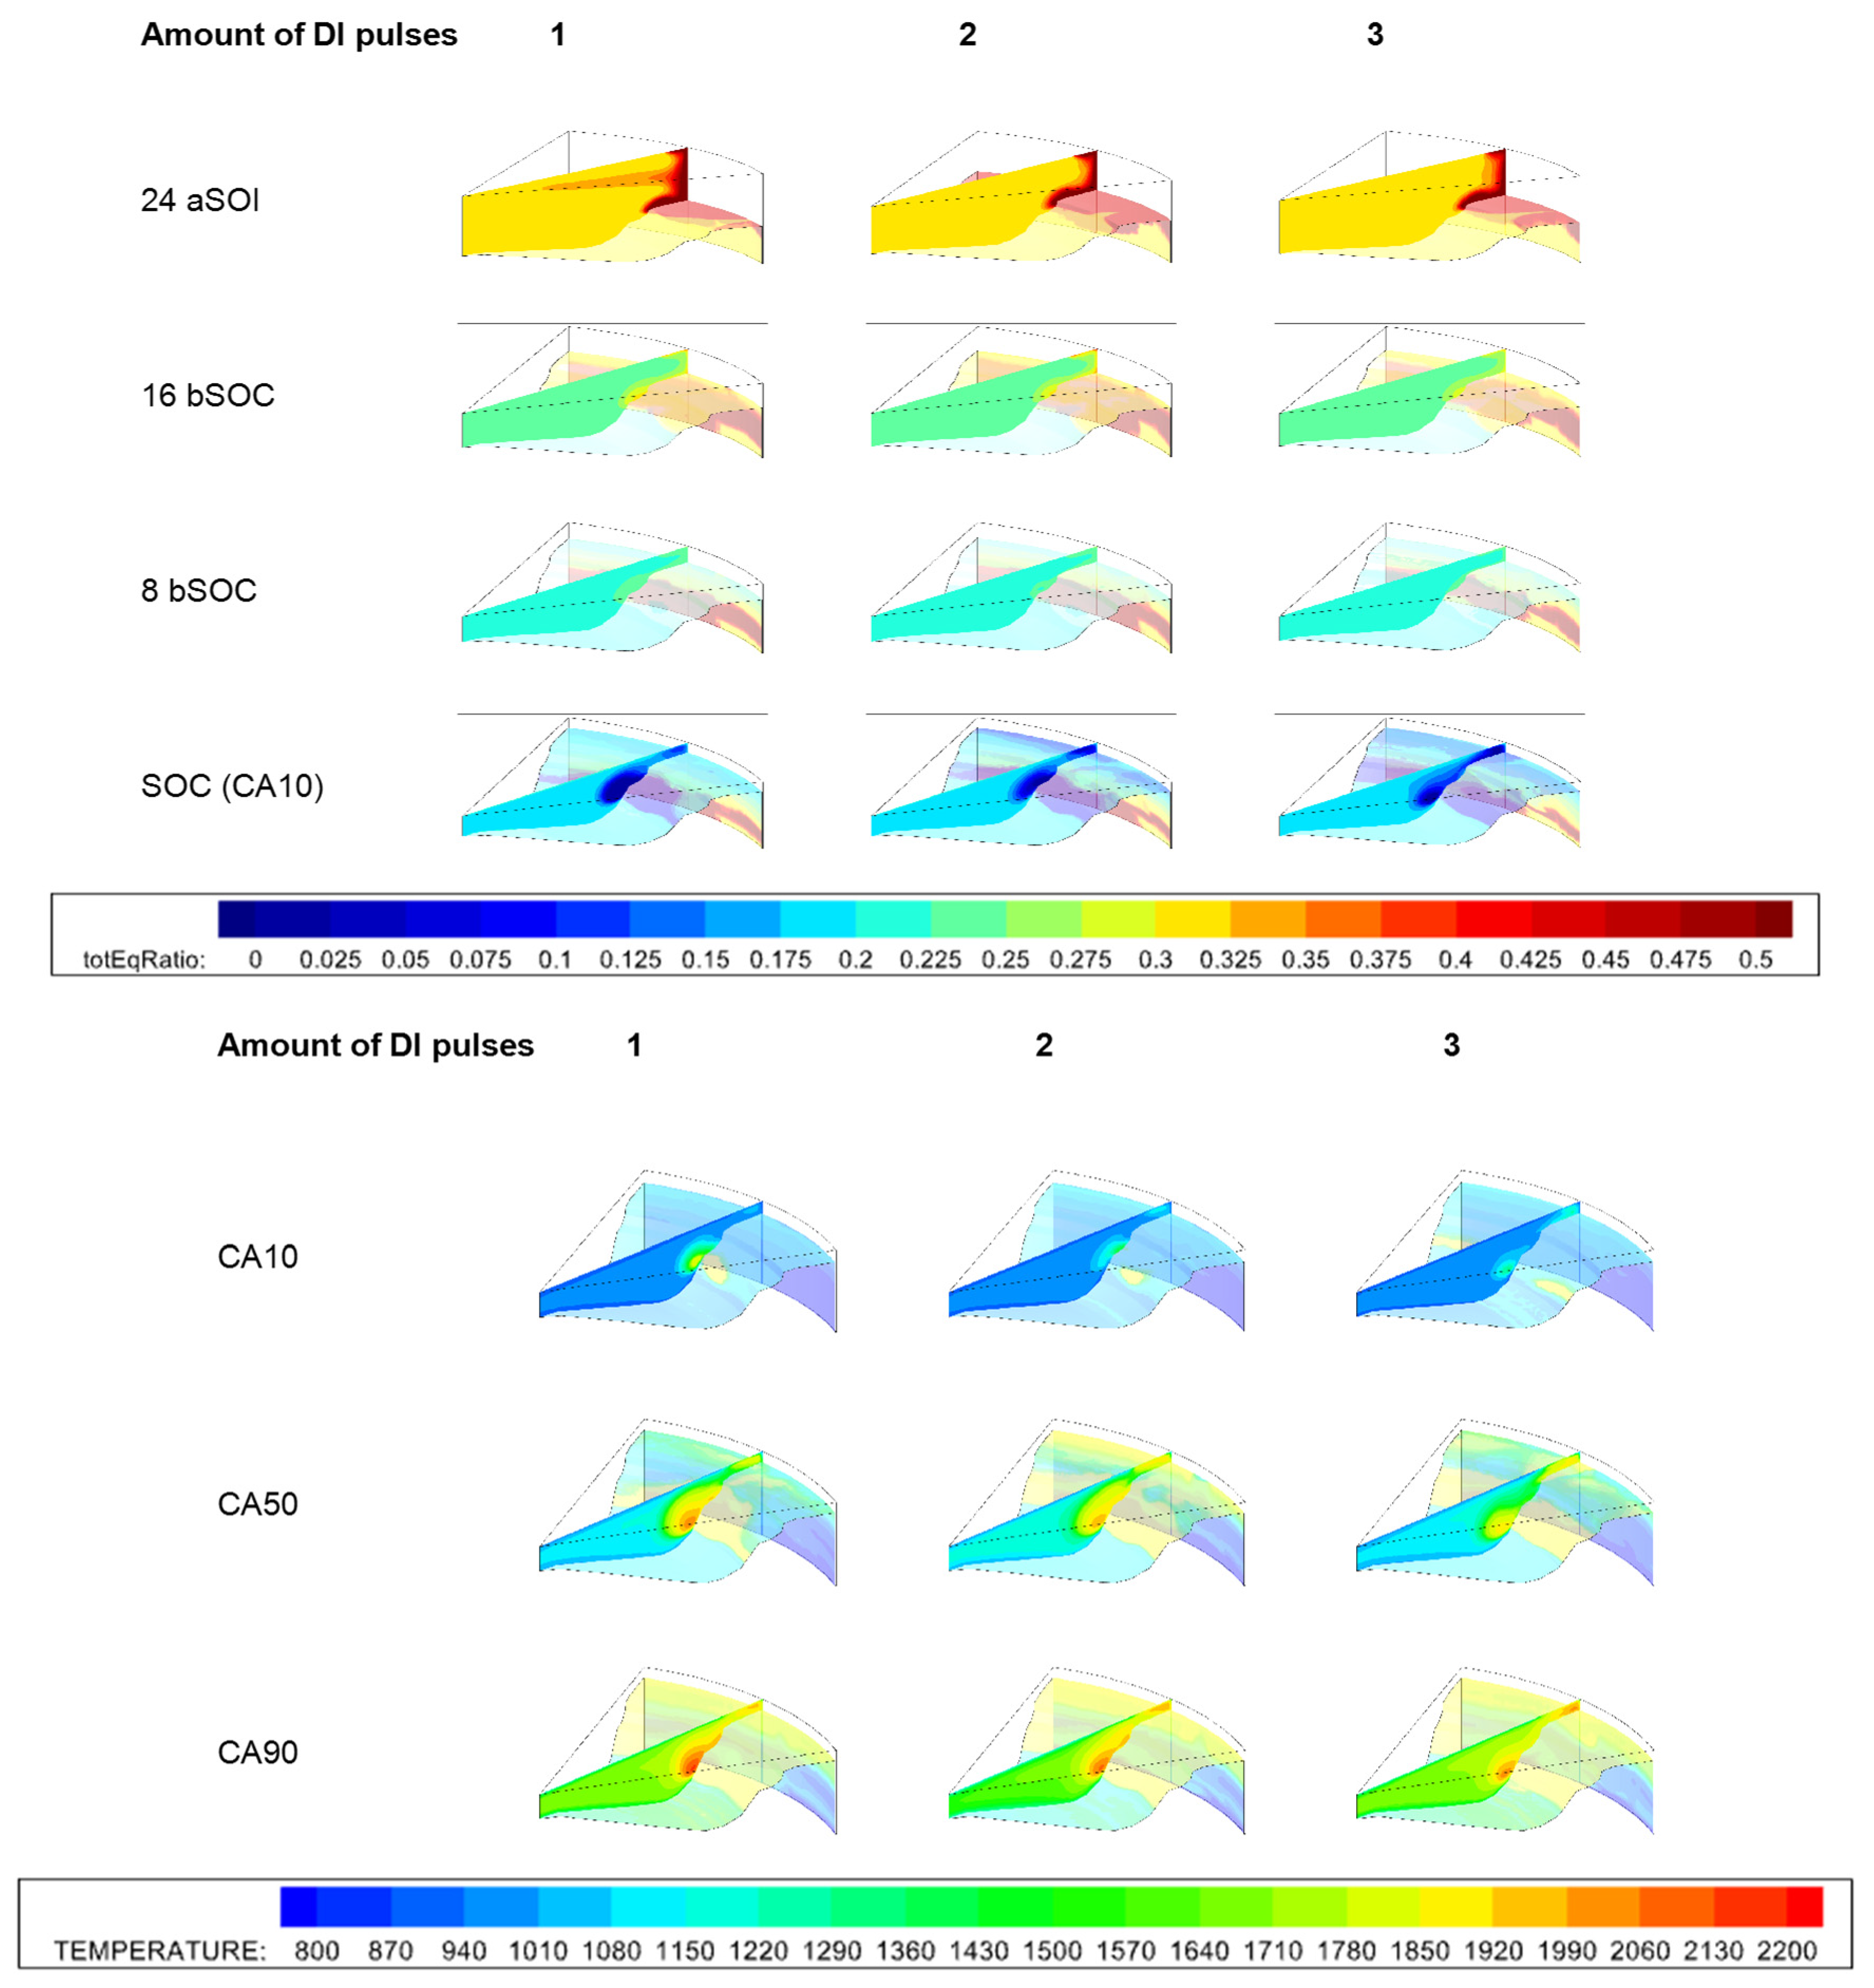
Figure 18.
Equivalence ratio [−] contours after injection and temperature contours during combustion for different number of DI pulses.
Figure 18.
Equivalence ratio [−] contours after injection and temperature contours during combustion for different number of DI pulses.
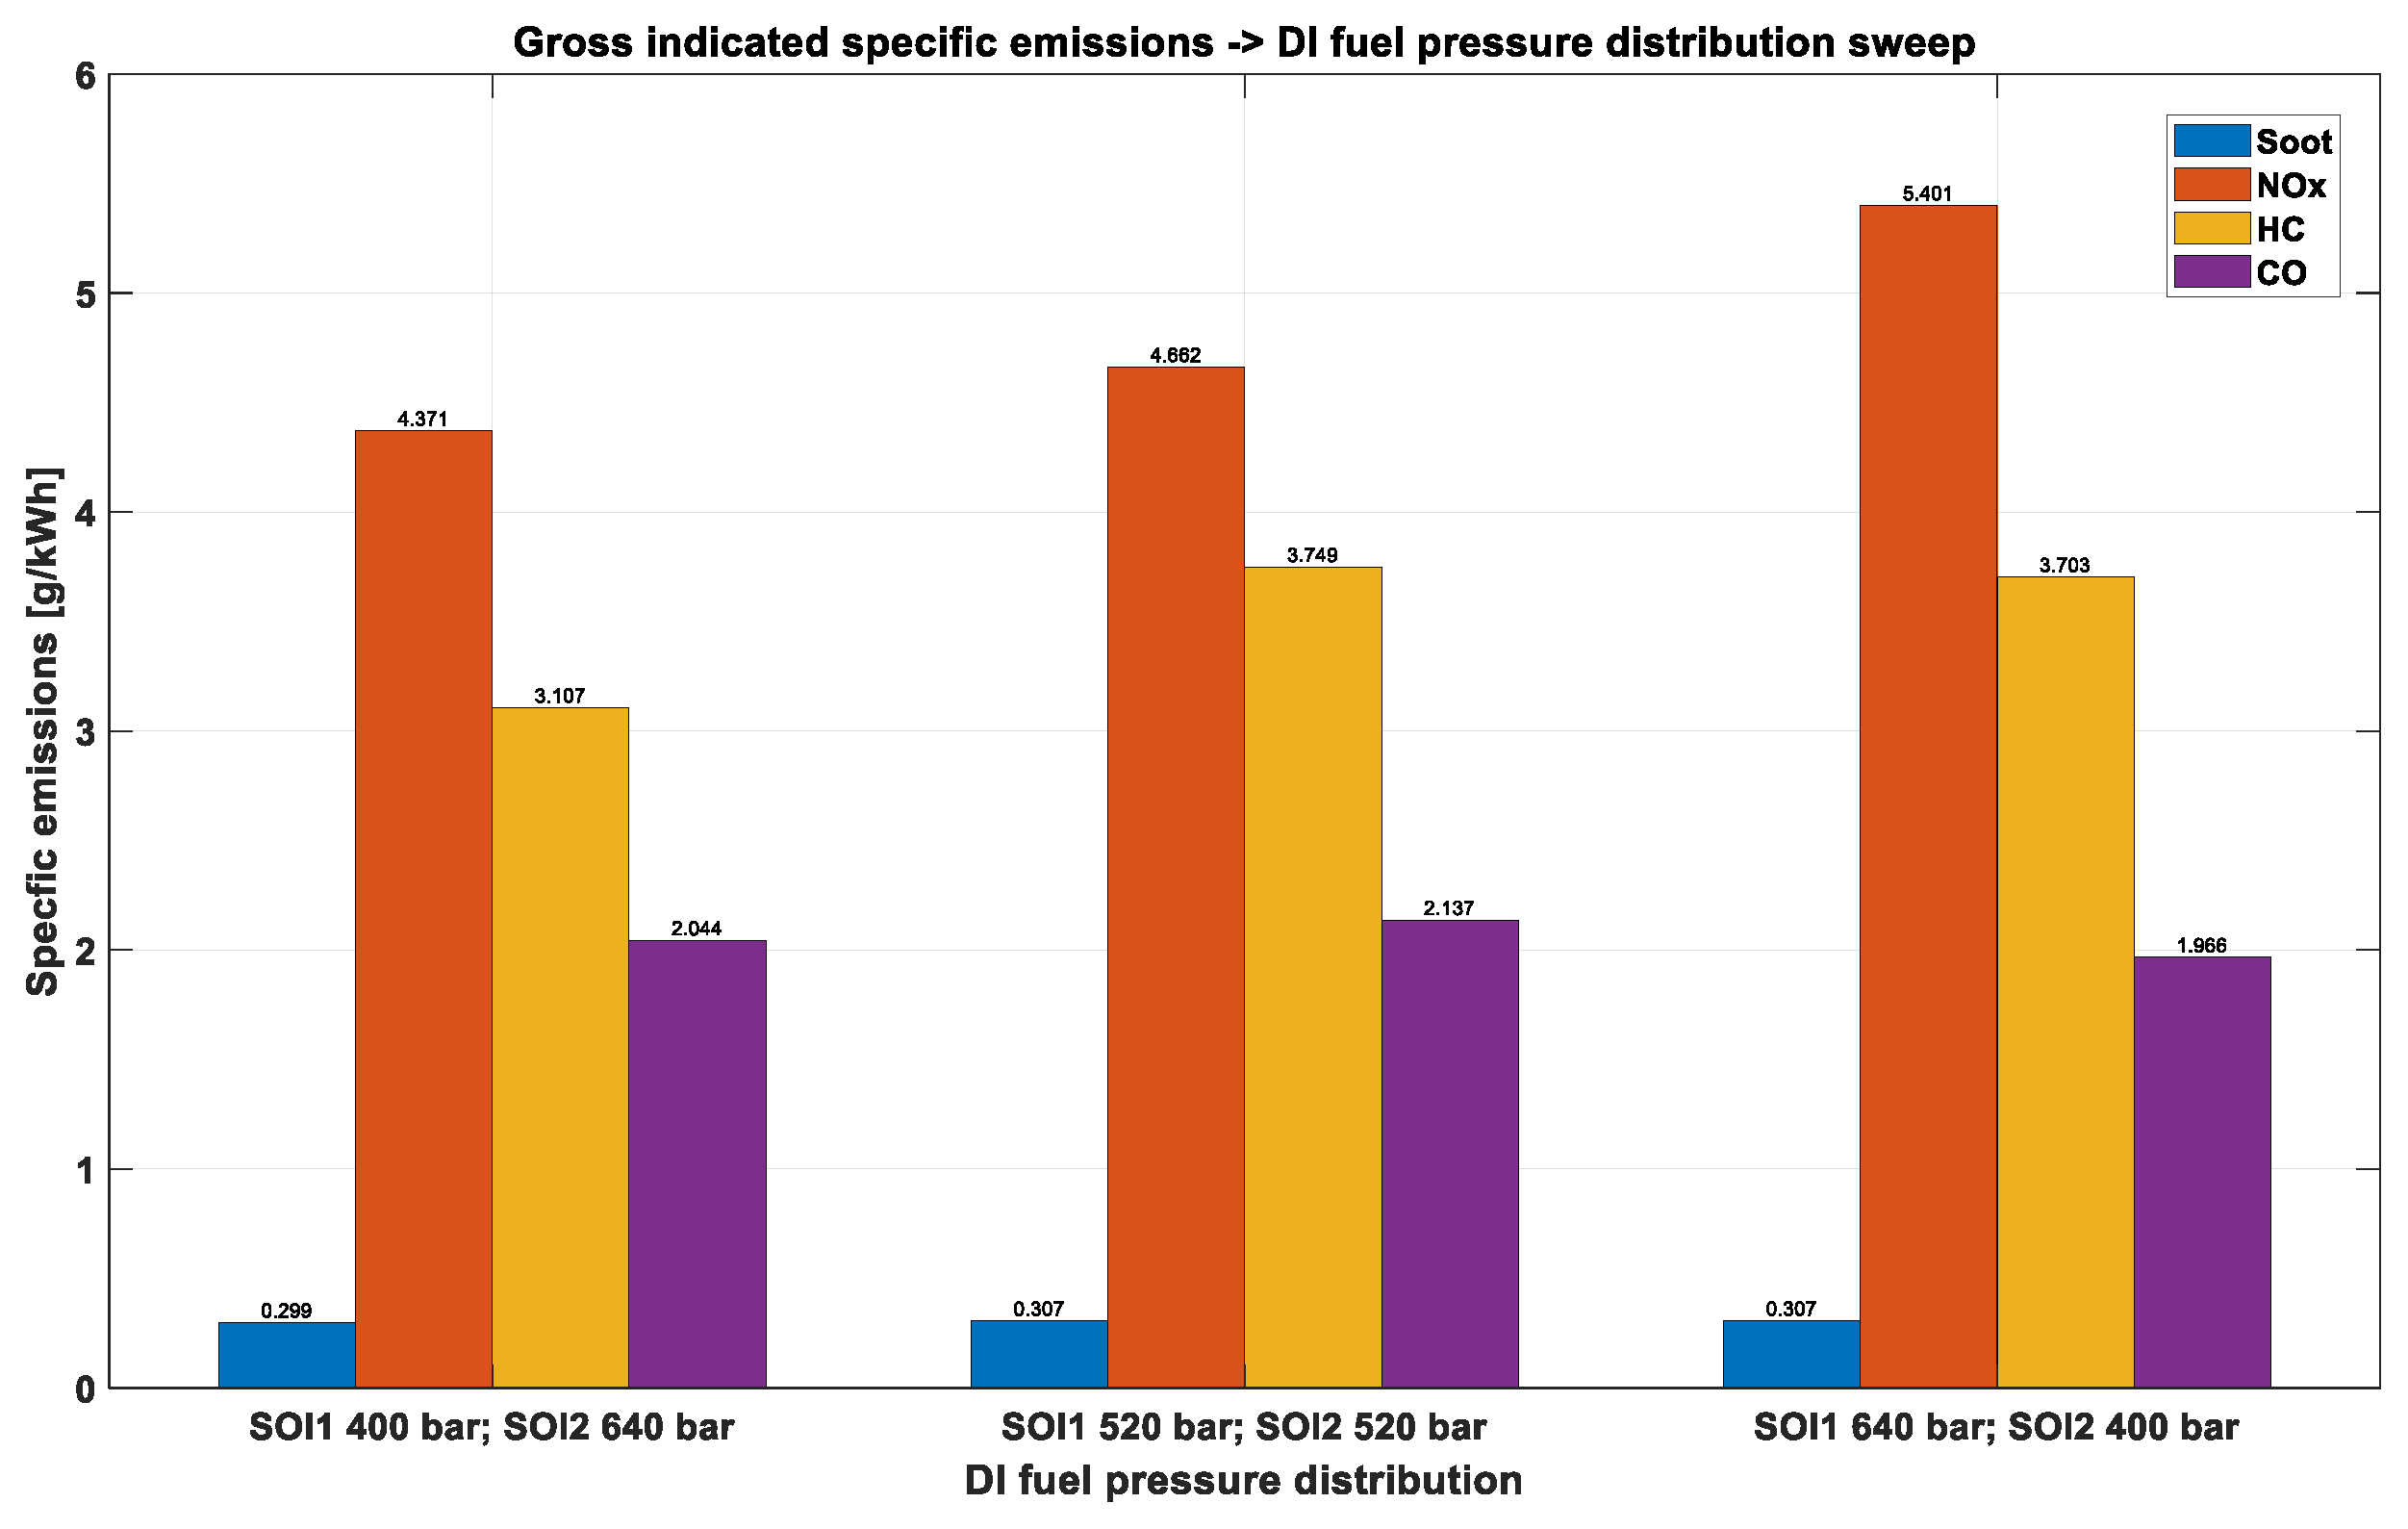
Figure 19.
The influence of injection pressure distribution between the two pulses on emissions variations.
Figure 19.
The influence of injection pressure distribution between the two pulses on emissions variations.
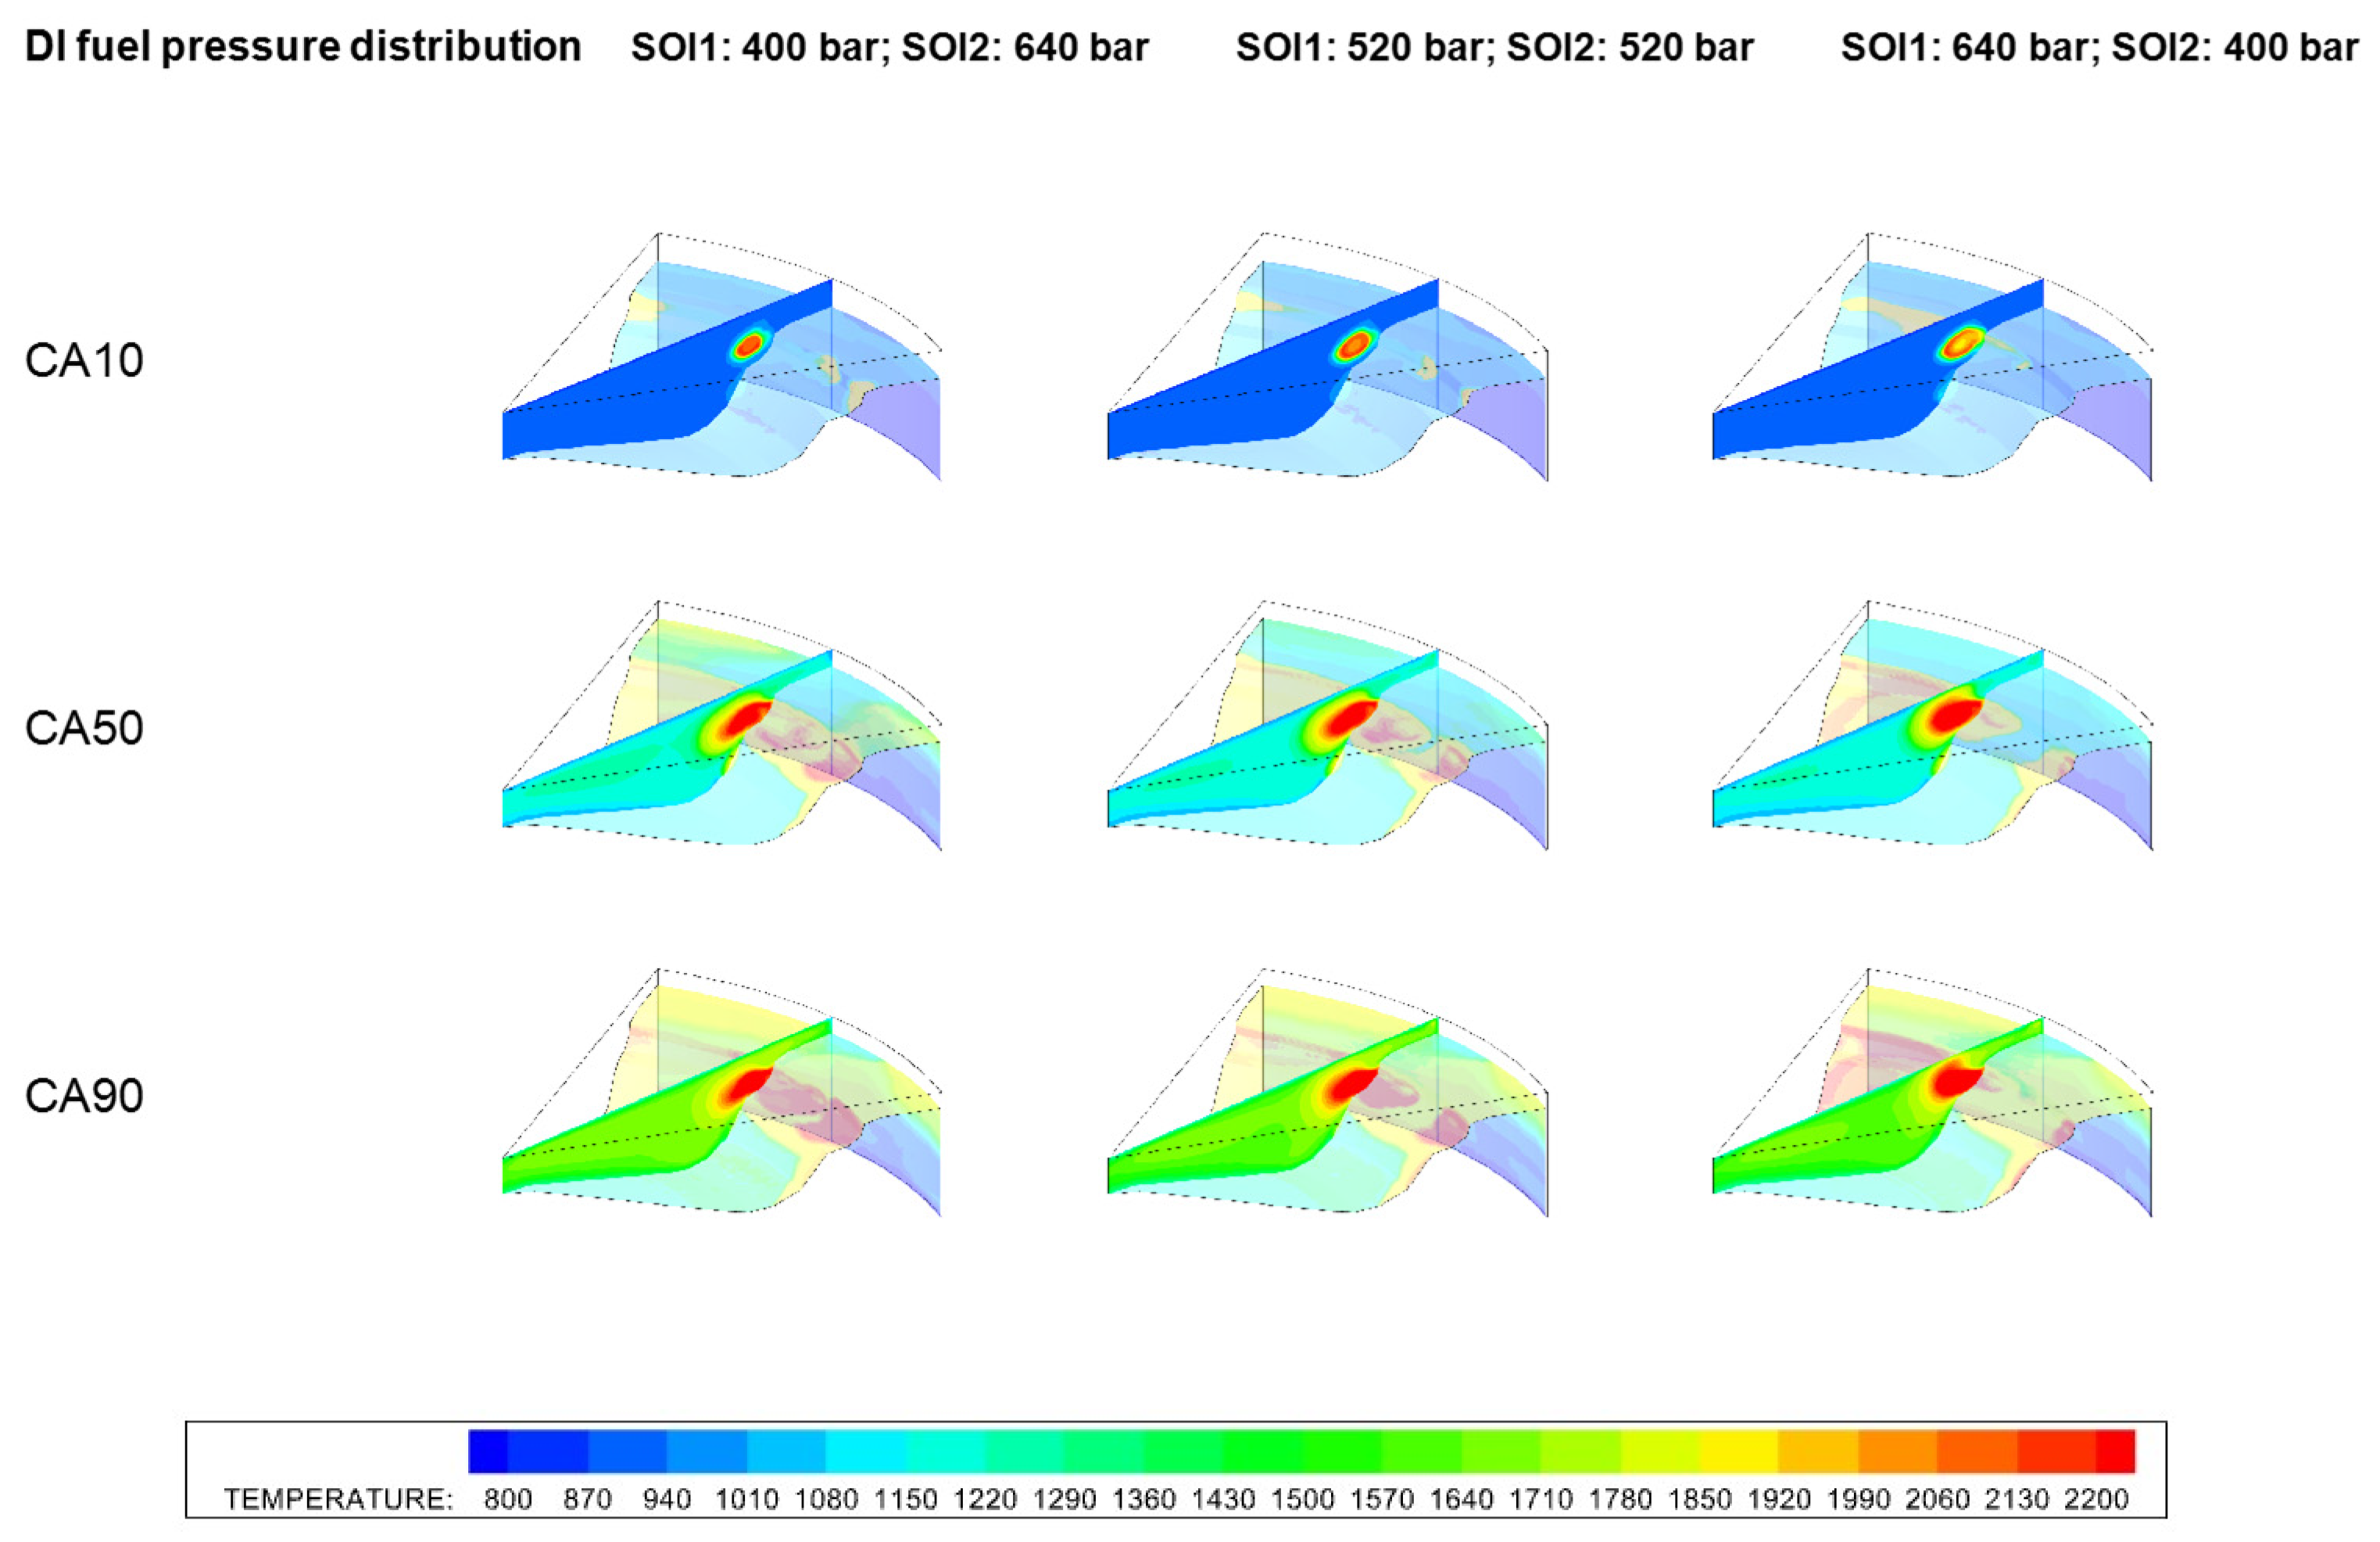
Figure 20.
Temperature [K] contour images during combustion for the DI fuel pressure distribution. Piston = double-cup.
Figure 20.
Temperature [K] contour images during combustion for the DI fuel pressure distribution. Piston = double-cup.
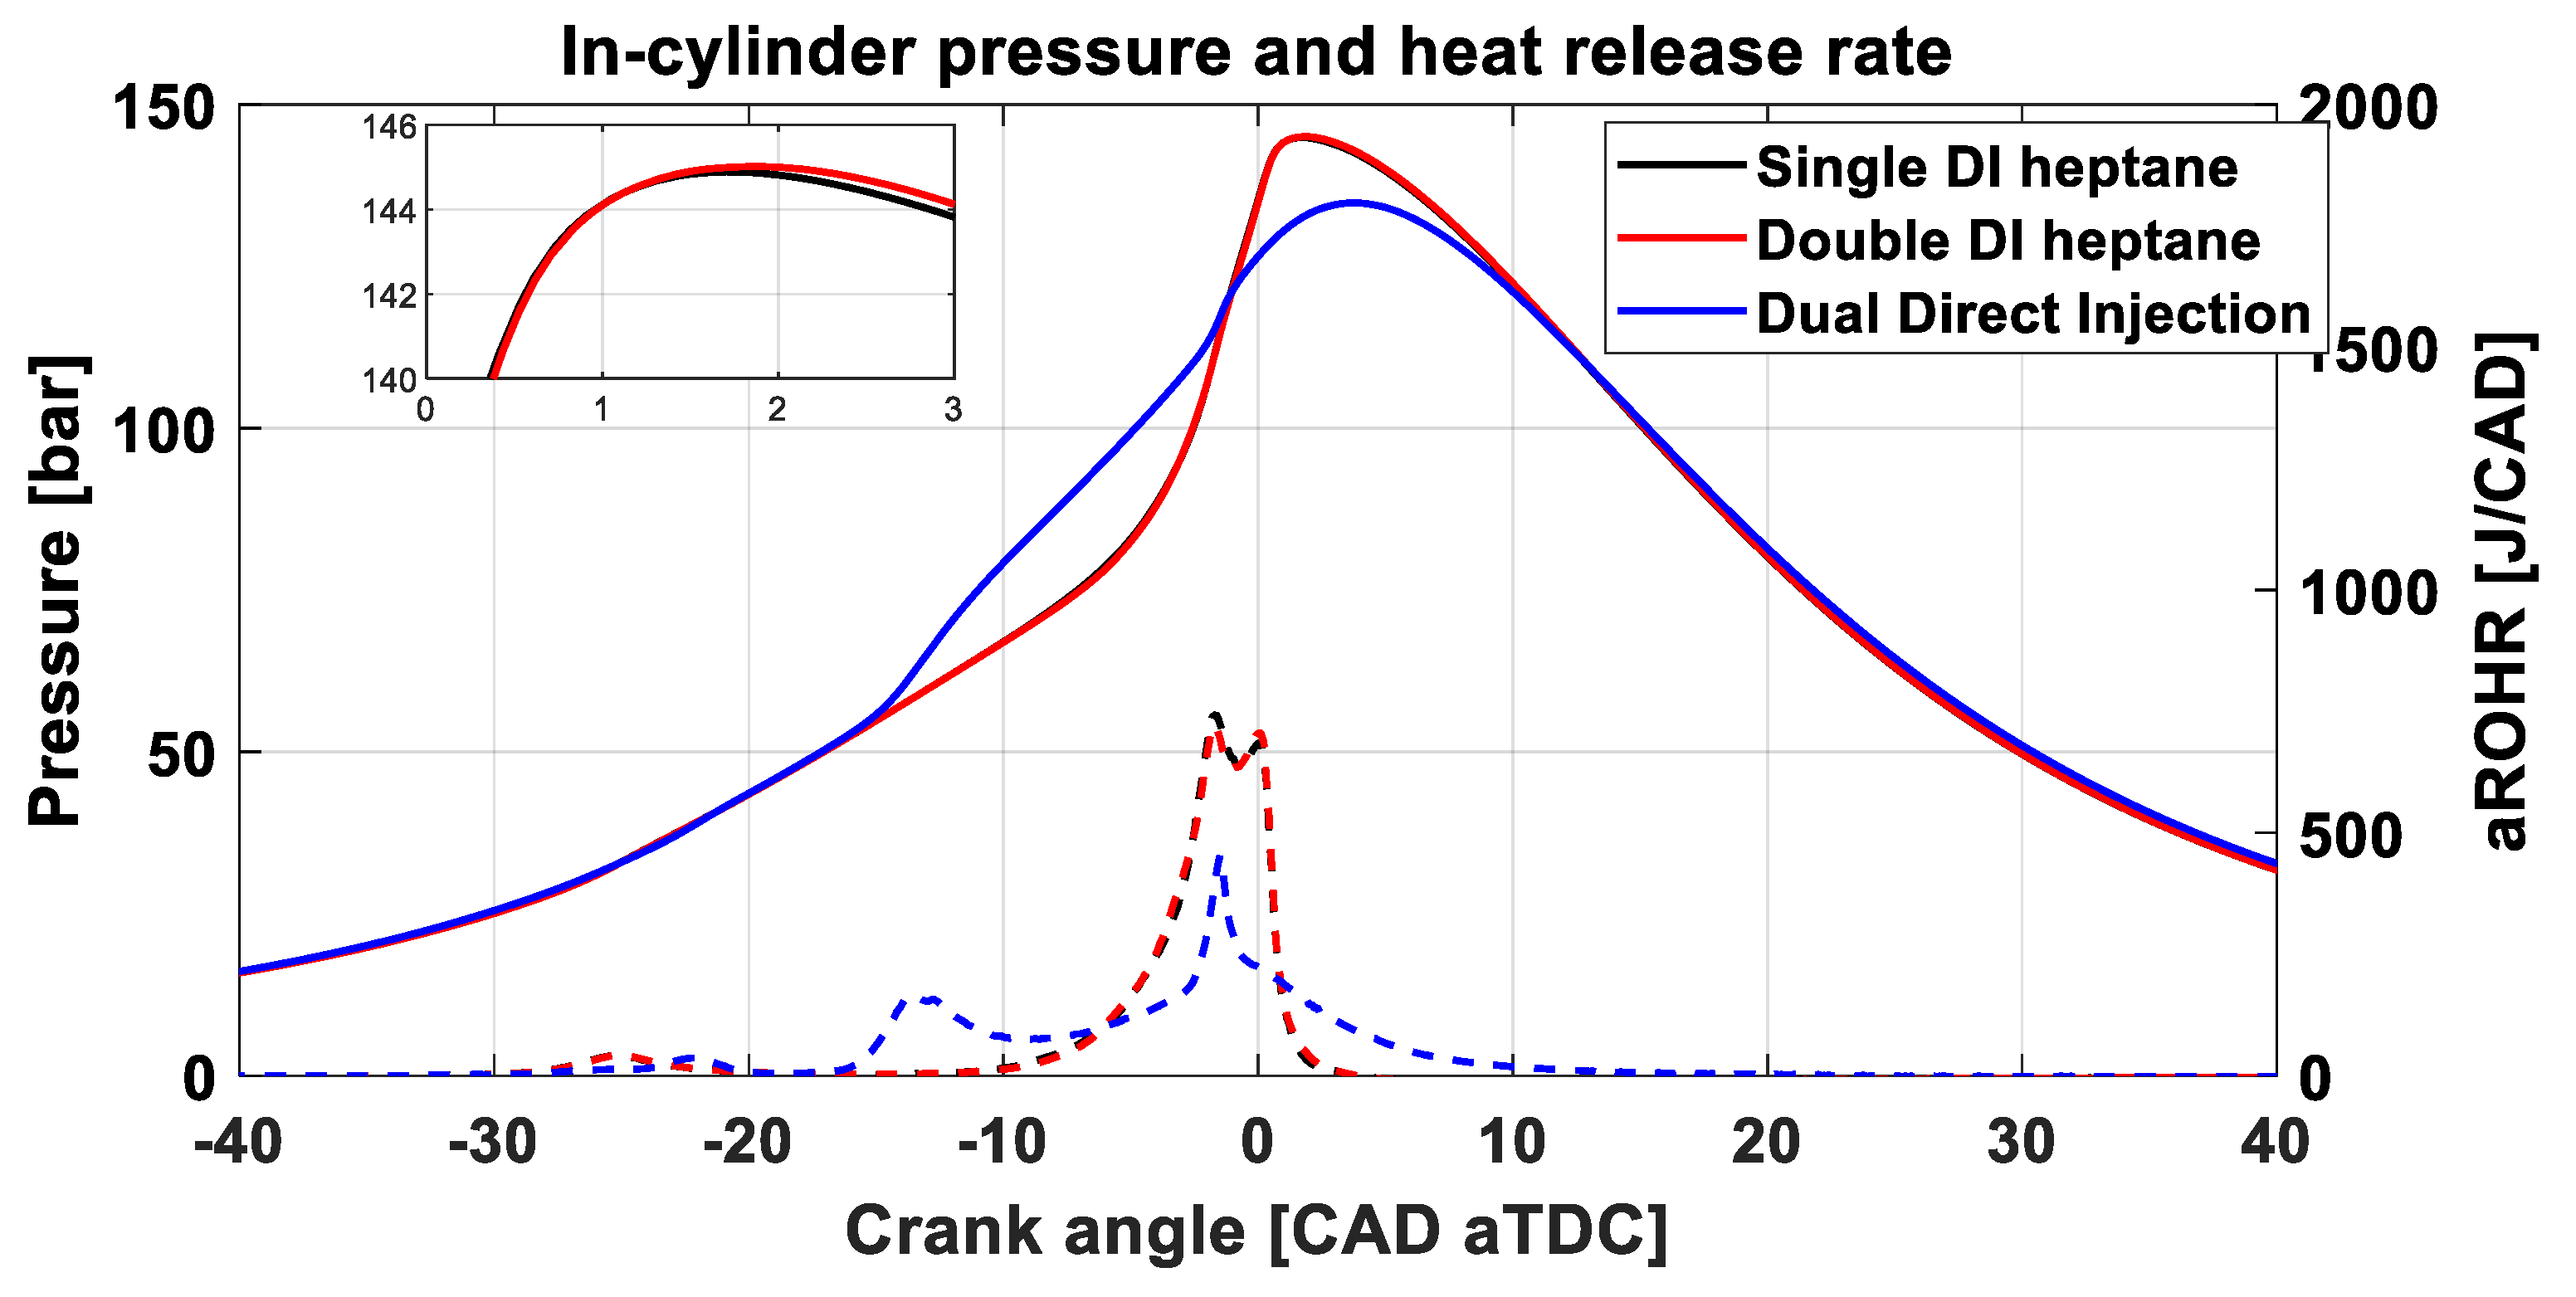
Figure 21.
Pressure and aROHR traces effected by varying injection strategy. Solid lines are average pressure and dash lines are heat release rate.
Figure 21.
Pressure and aROHR traces effected by varying injection strategy. Solid lines are average pressure and dash lines are heat release rate.
Figure 22.
Influence of changing injection strategy on combustion characteristics and engine efficiency.
Figure 22.
Influence of changing injection strategy on combustion characteristics and engine efficiency.
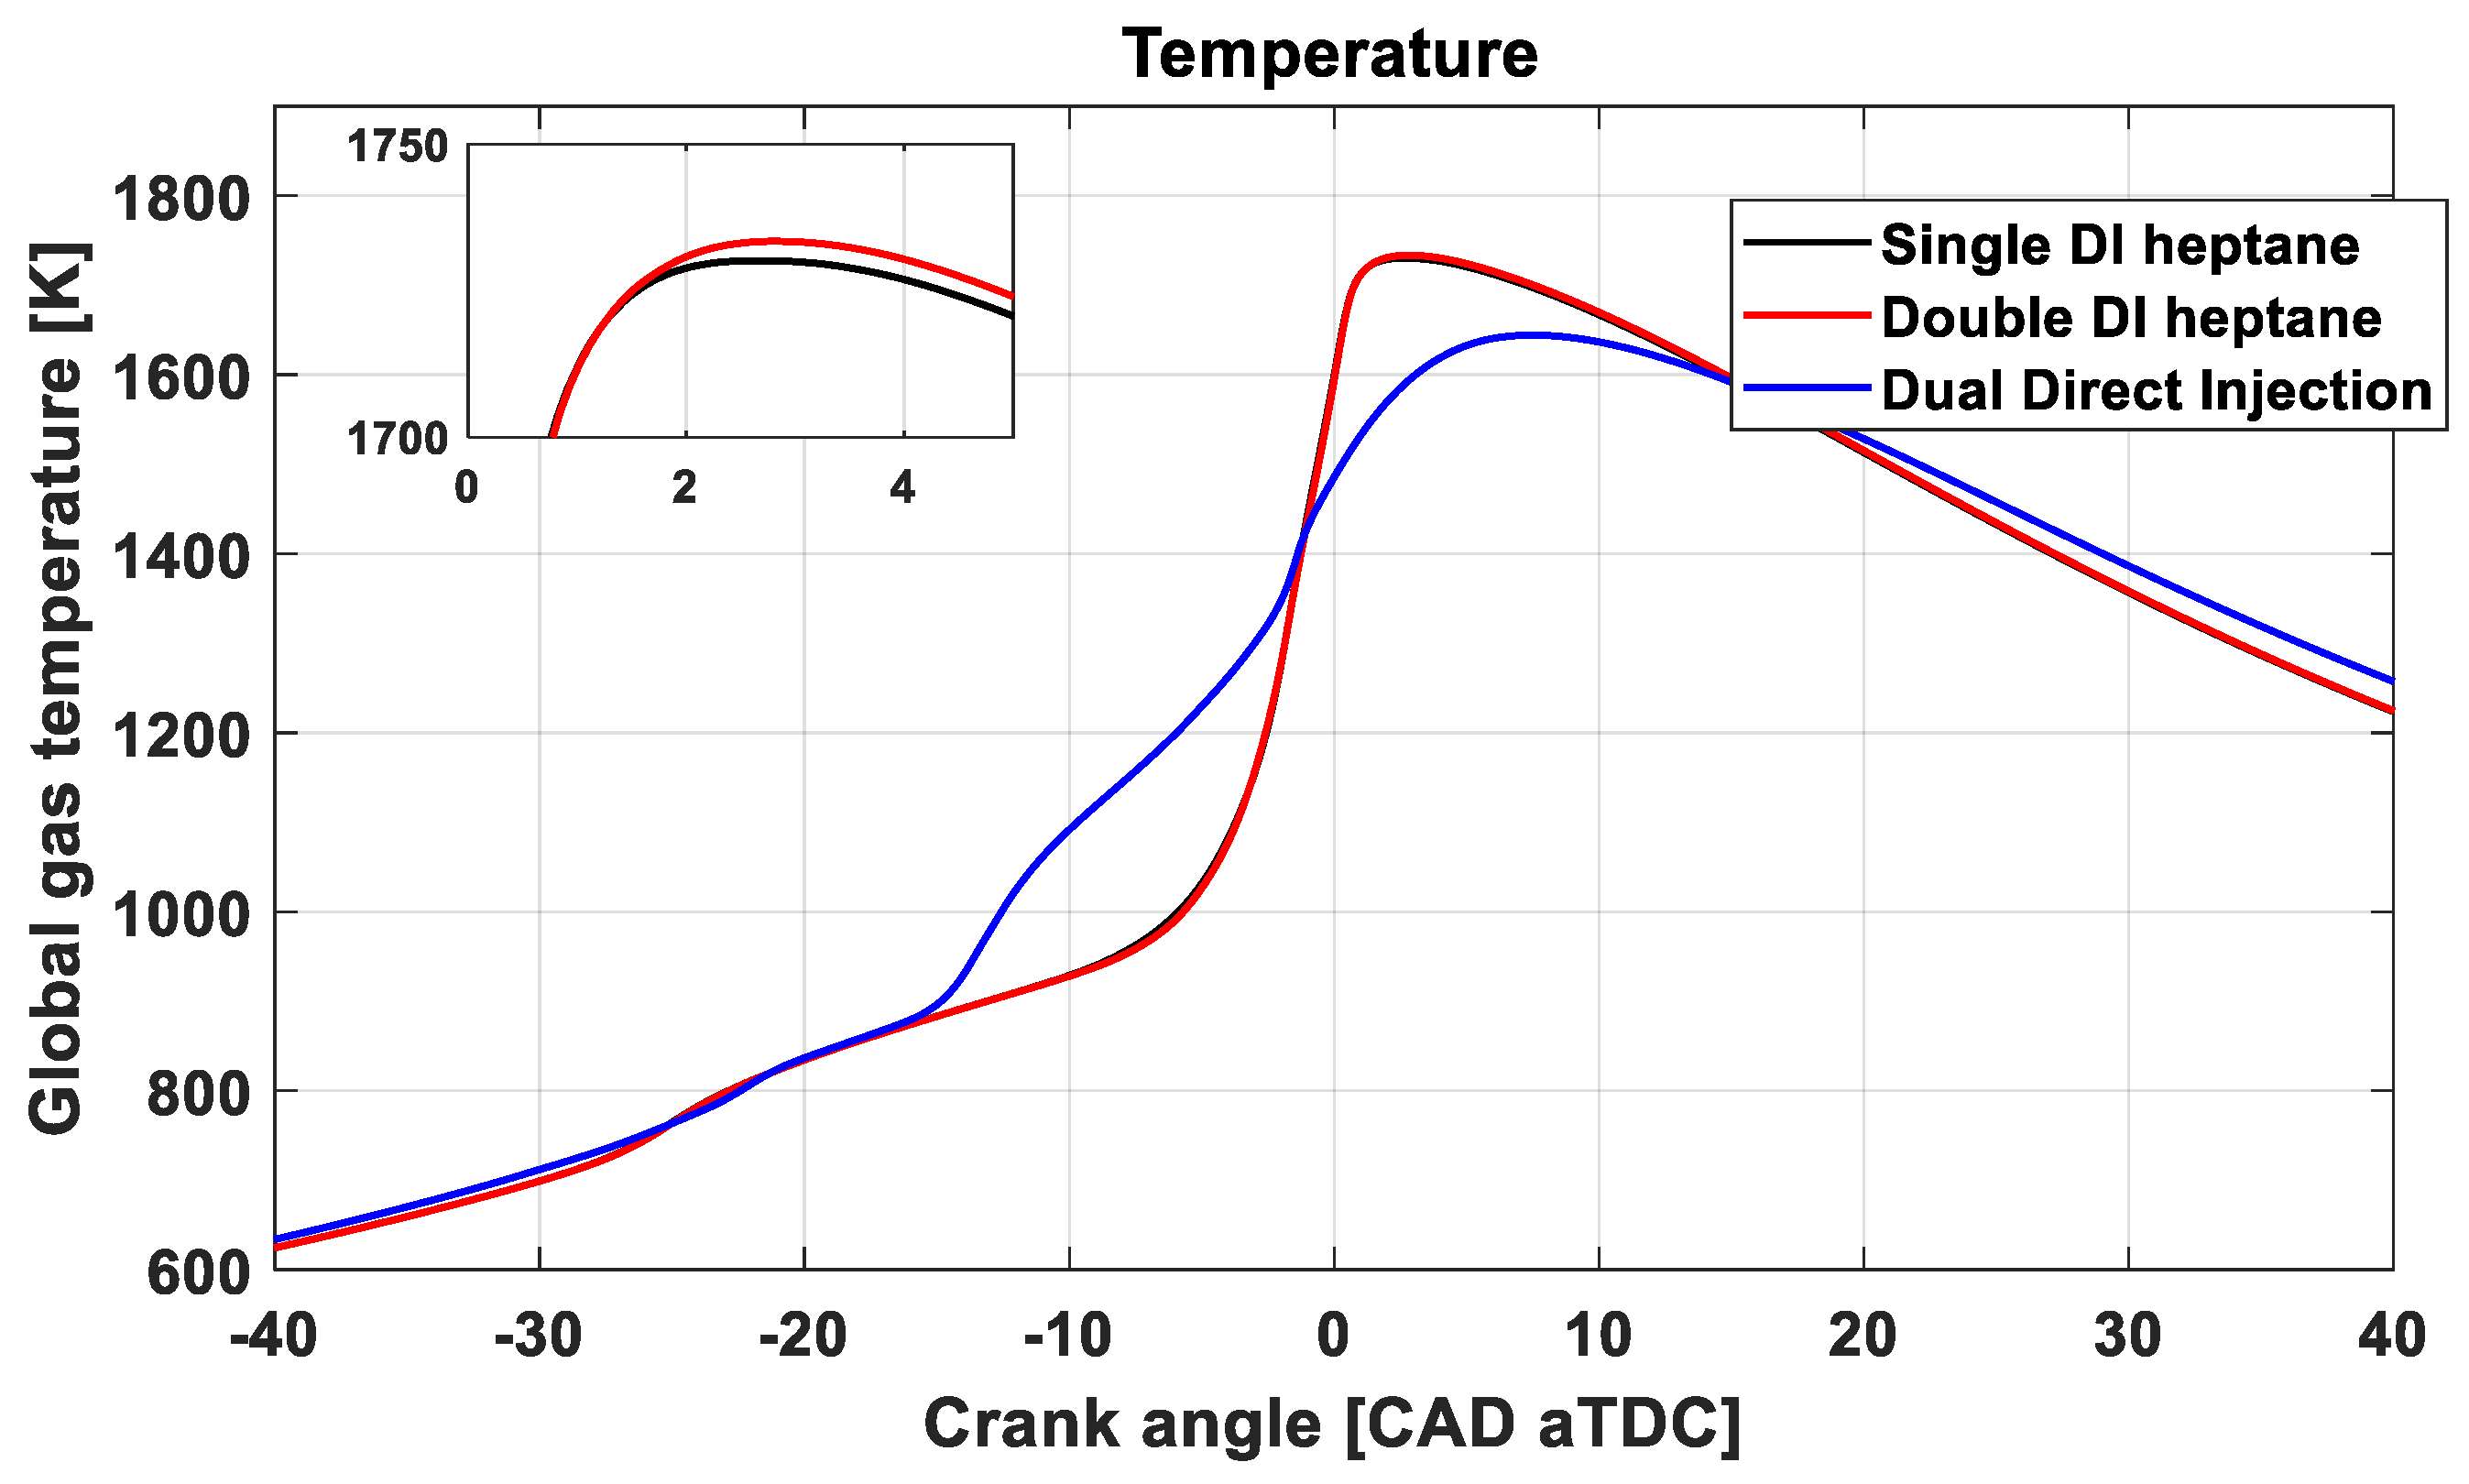
Figure 23.
Influence of changing injection strategy on in-cylinder average temperature.
Figure 23.
Influence of changing injection strategy on in-cylinder average temperature.
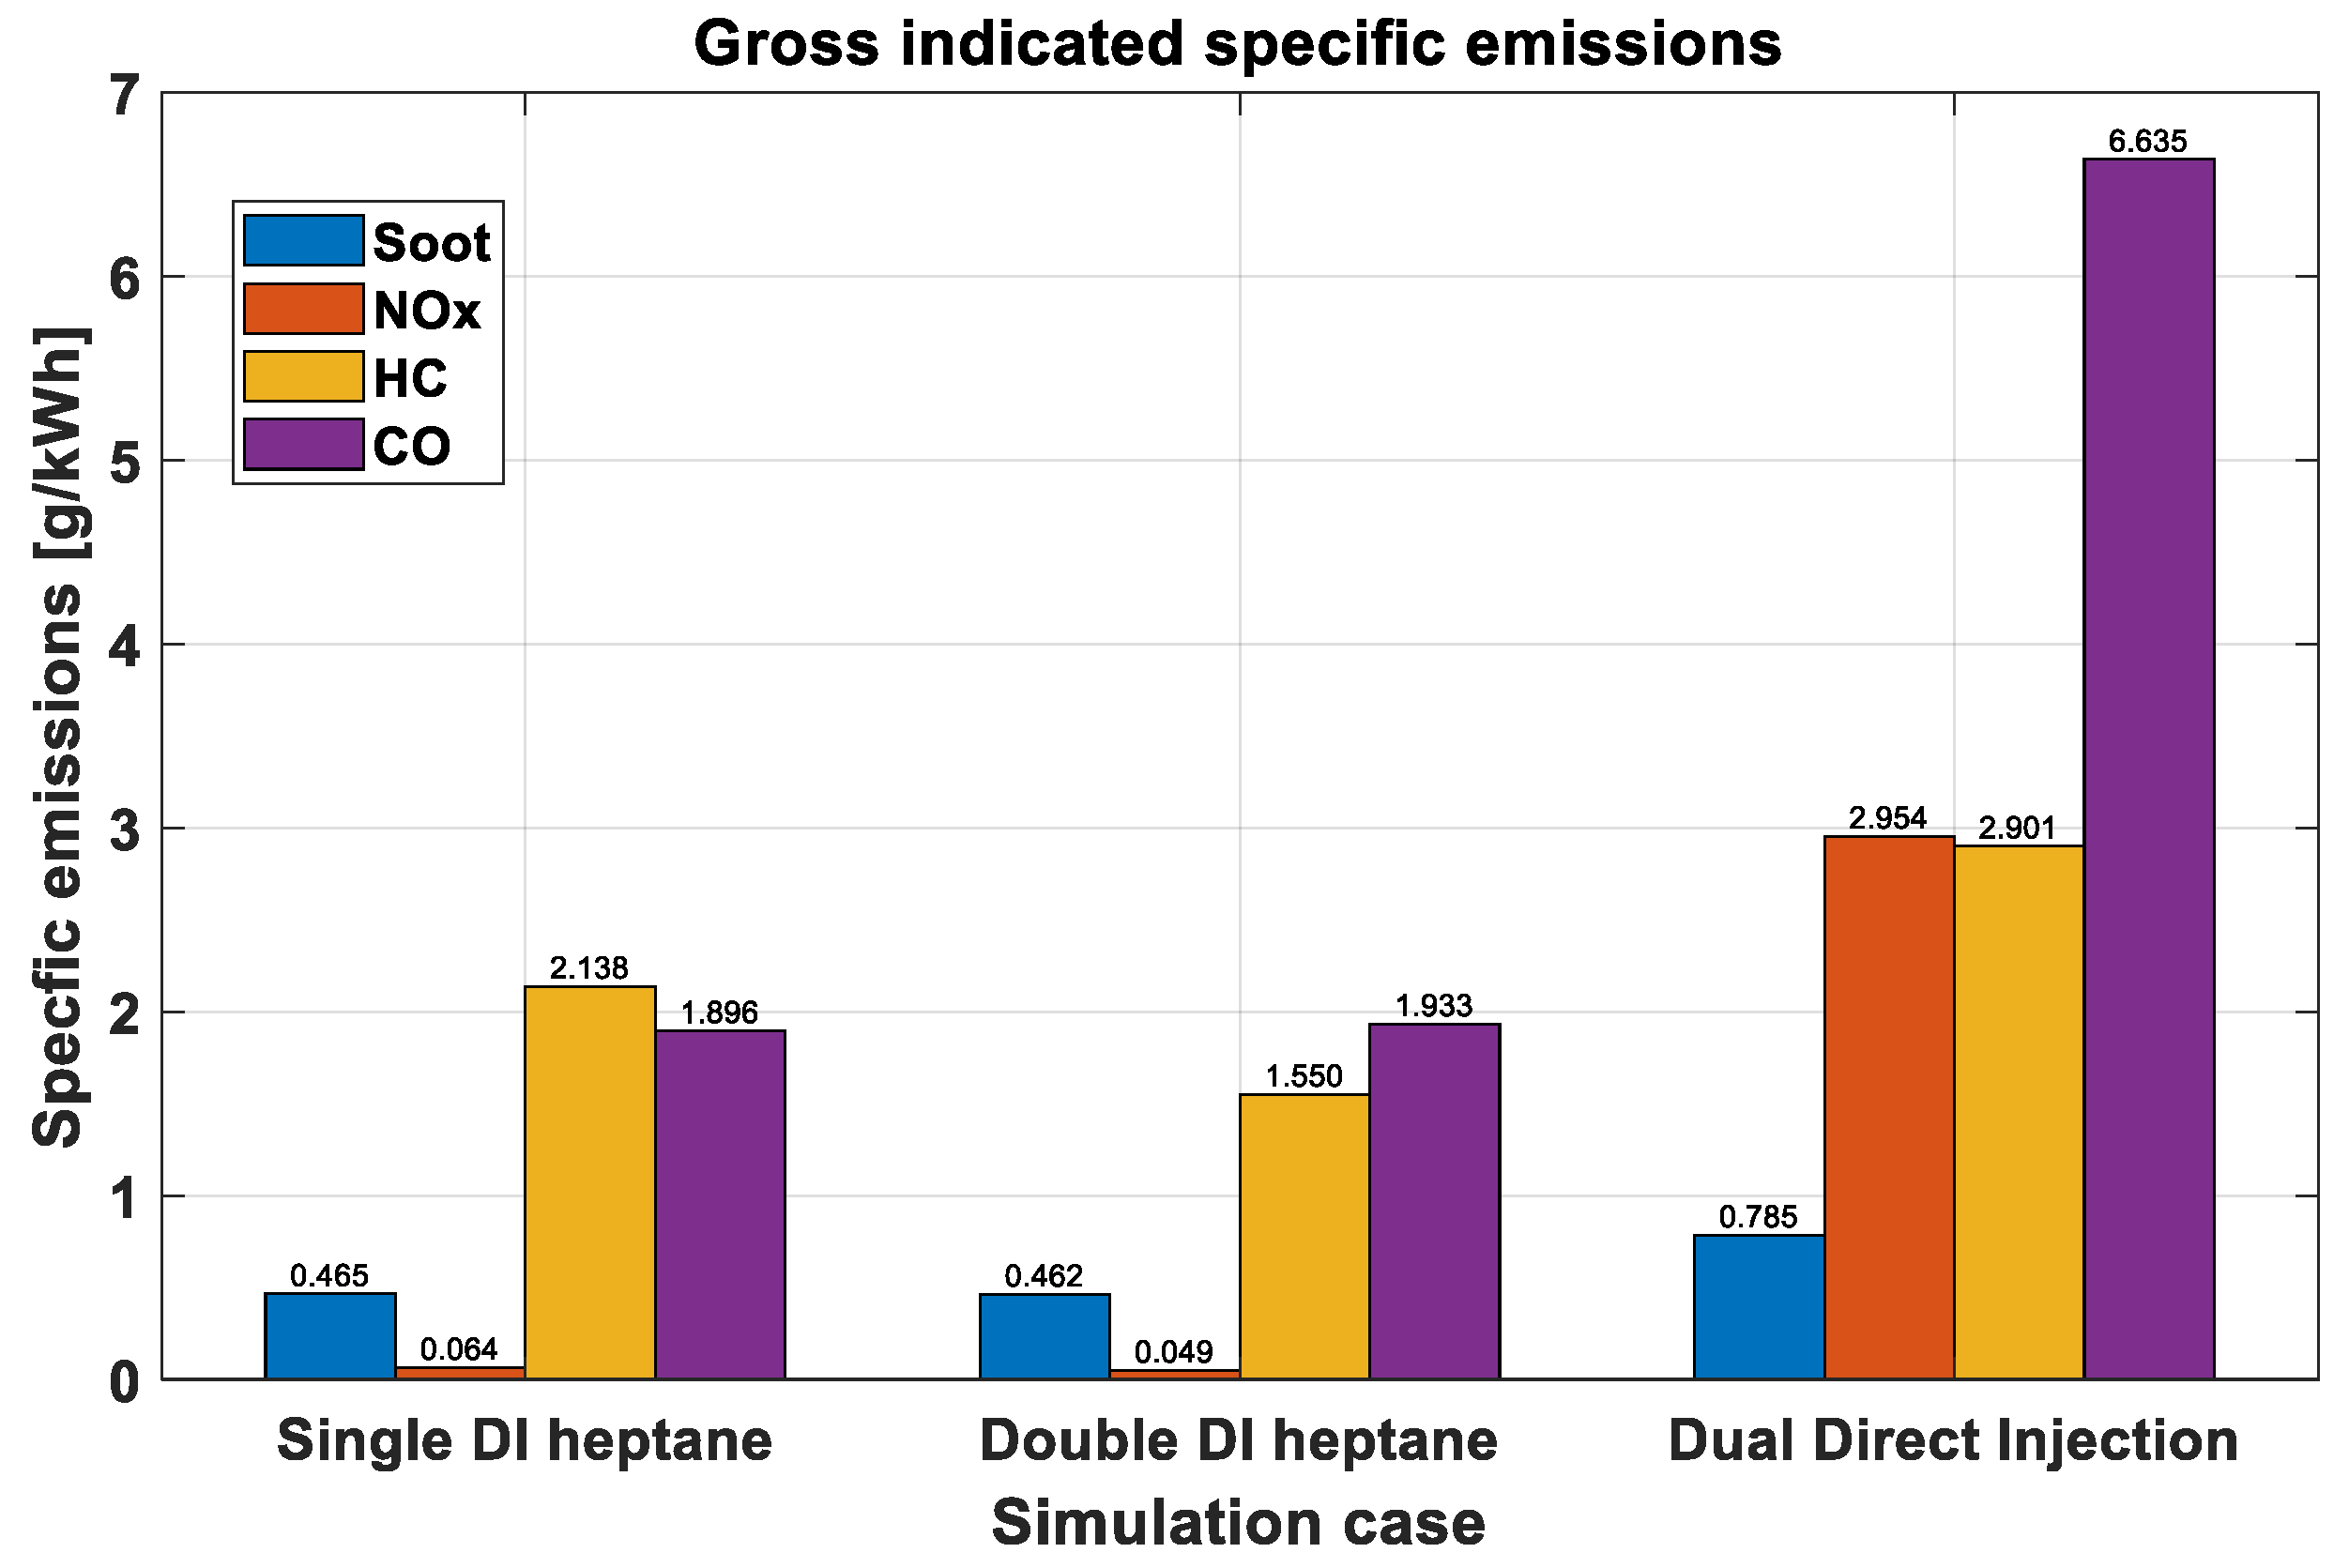
Figure 24.
Influence of changing injection strategy on emission characteristics.
Figure 24.
Influence of changing injection strategy on emission characteristics.
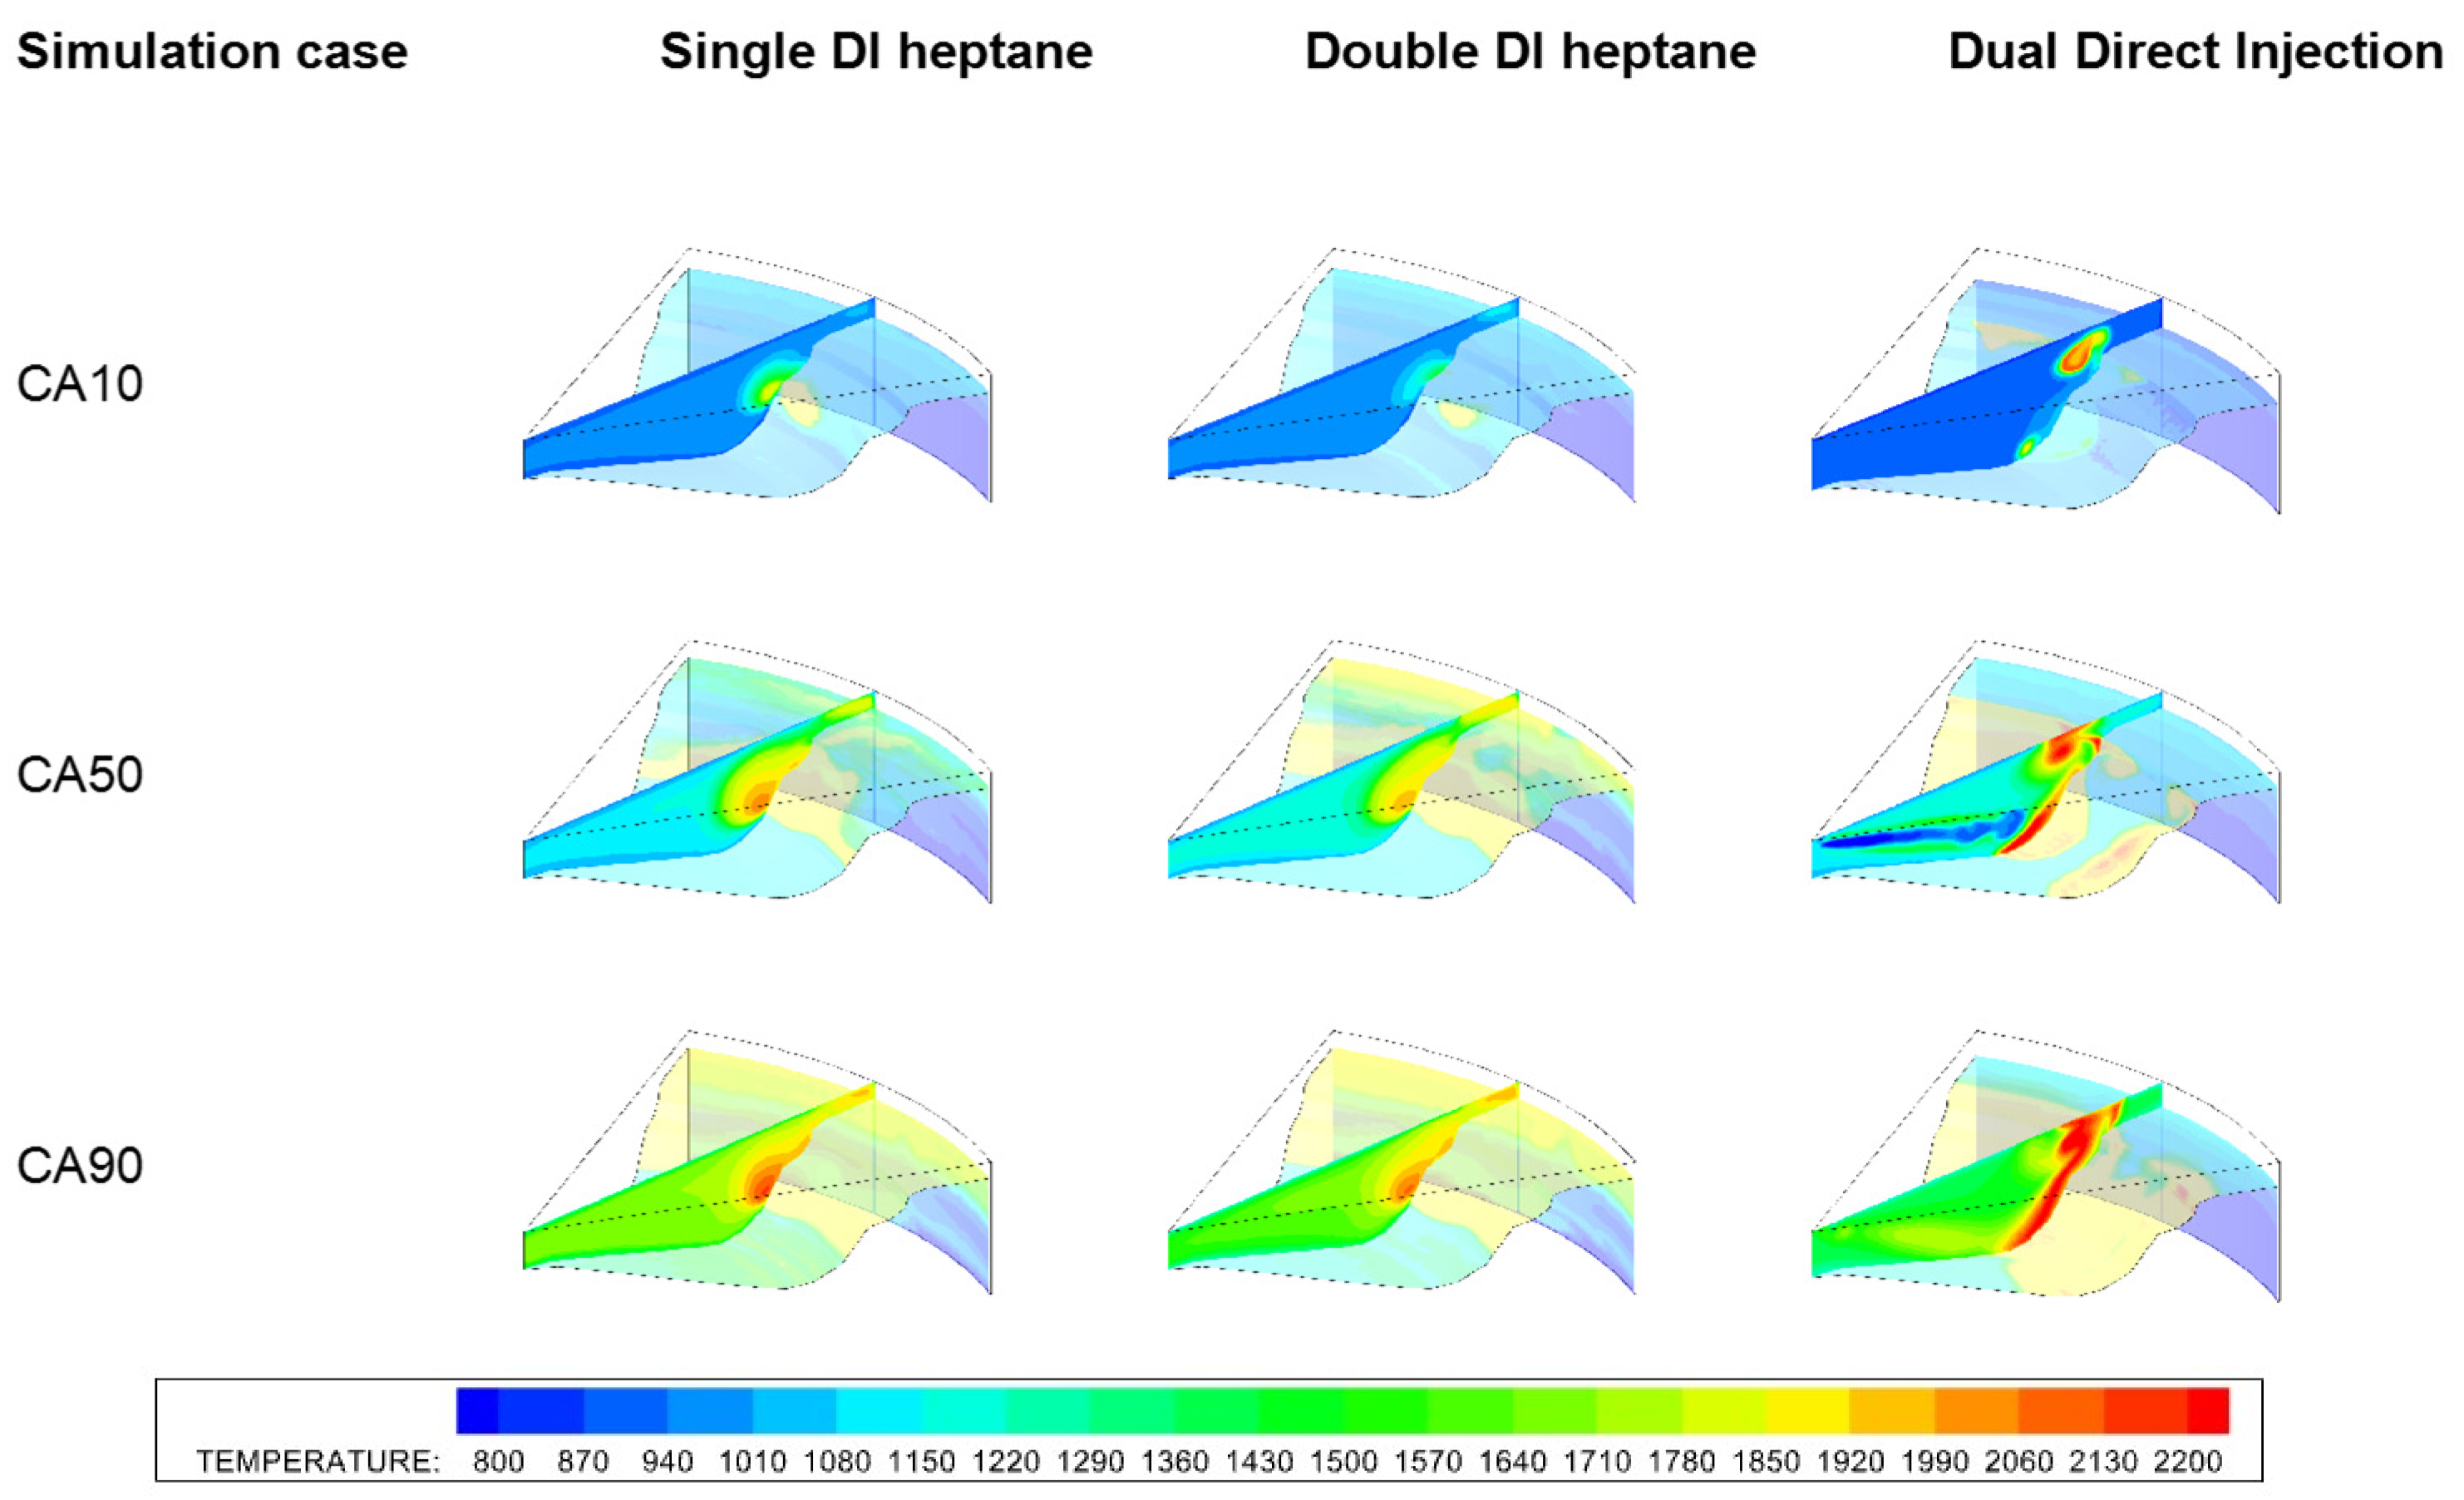
Figure 25.
The effect of the injection strategy on the temperature [K] distribution. Piston bowl profile = double-cup.
Figure 25.
The effect of the injection strategy on the temperature [K] distribution. Piston bowl profile = double-cup.
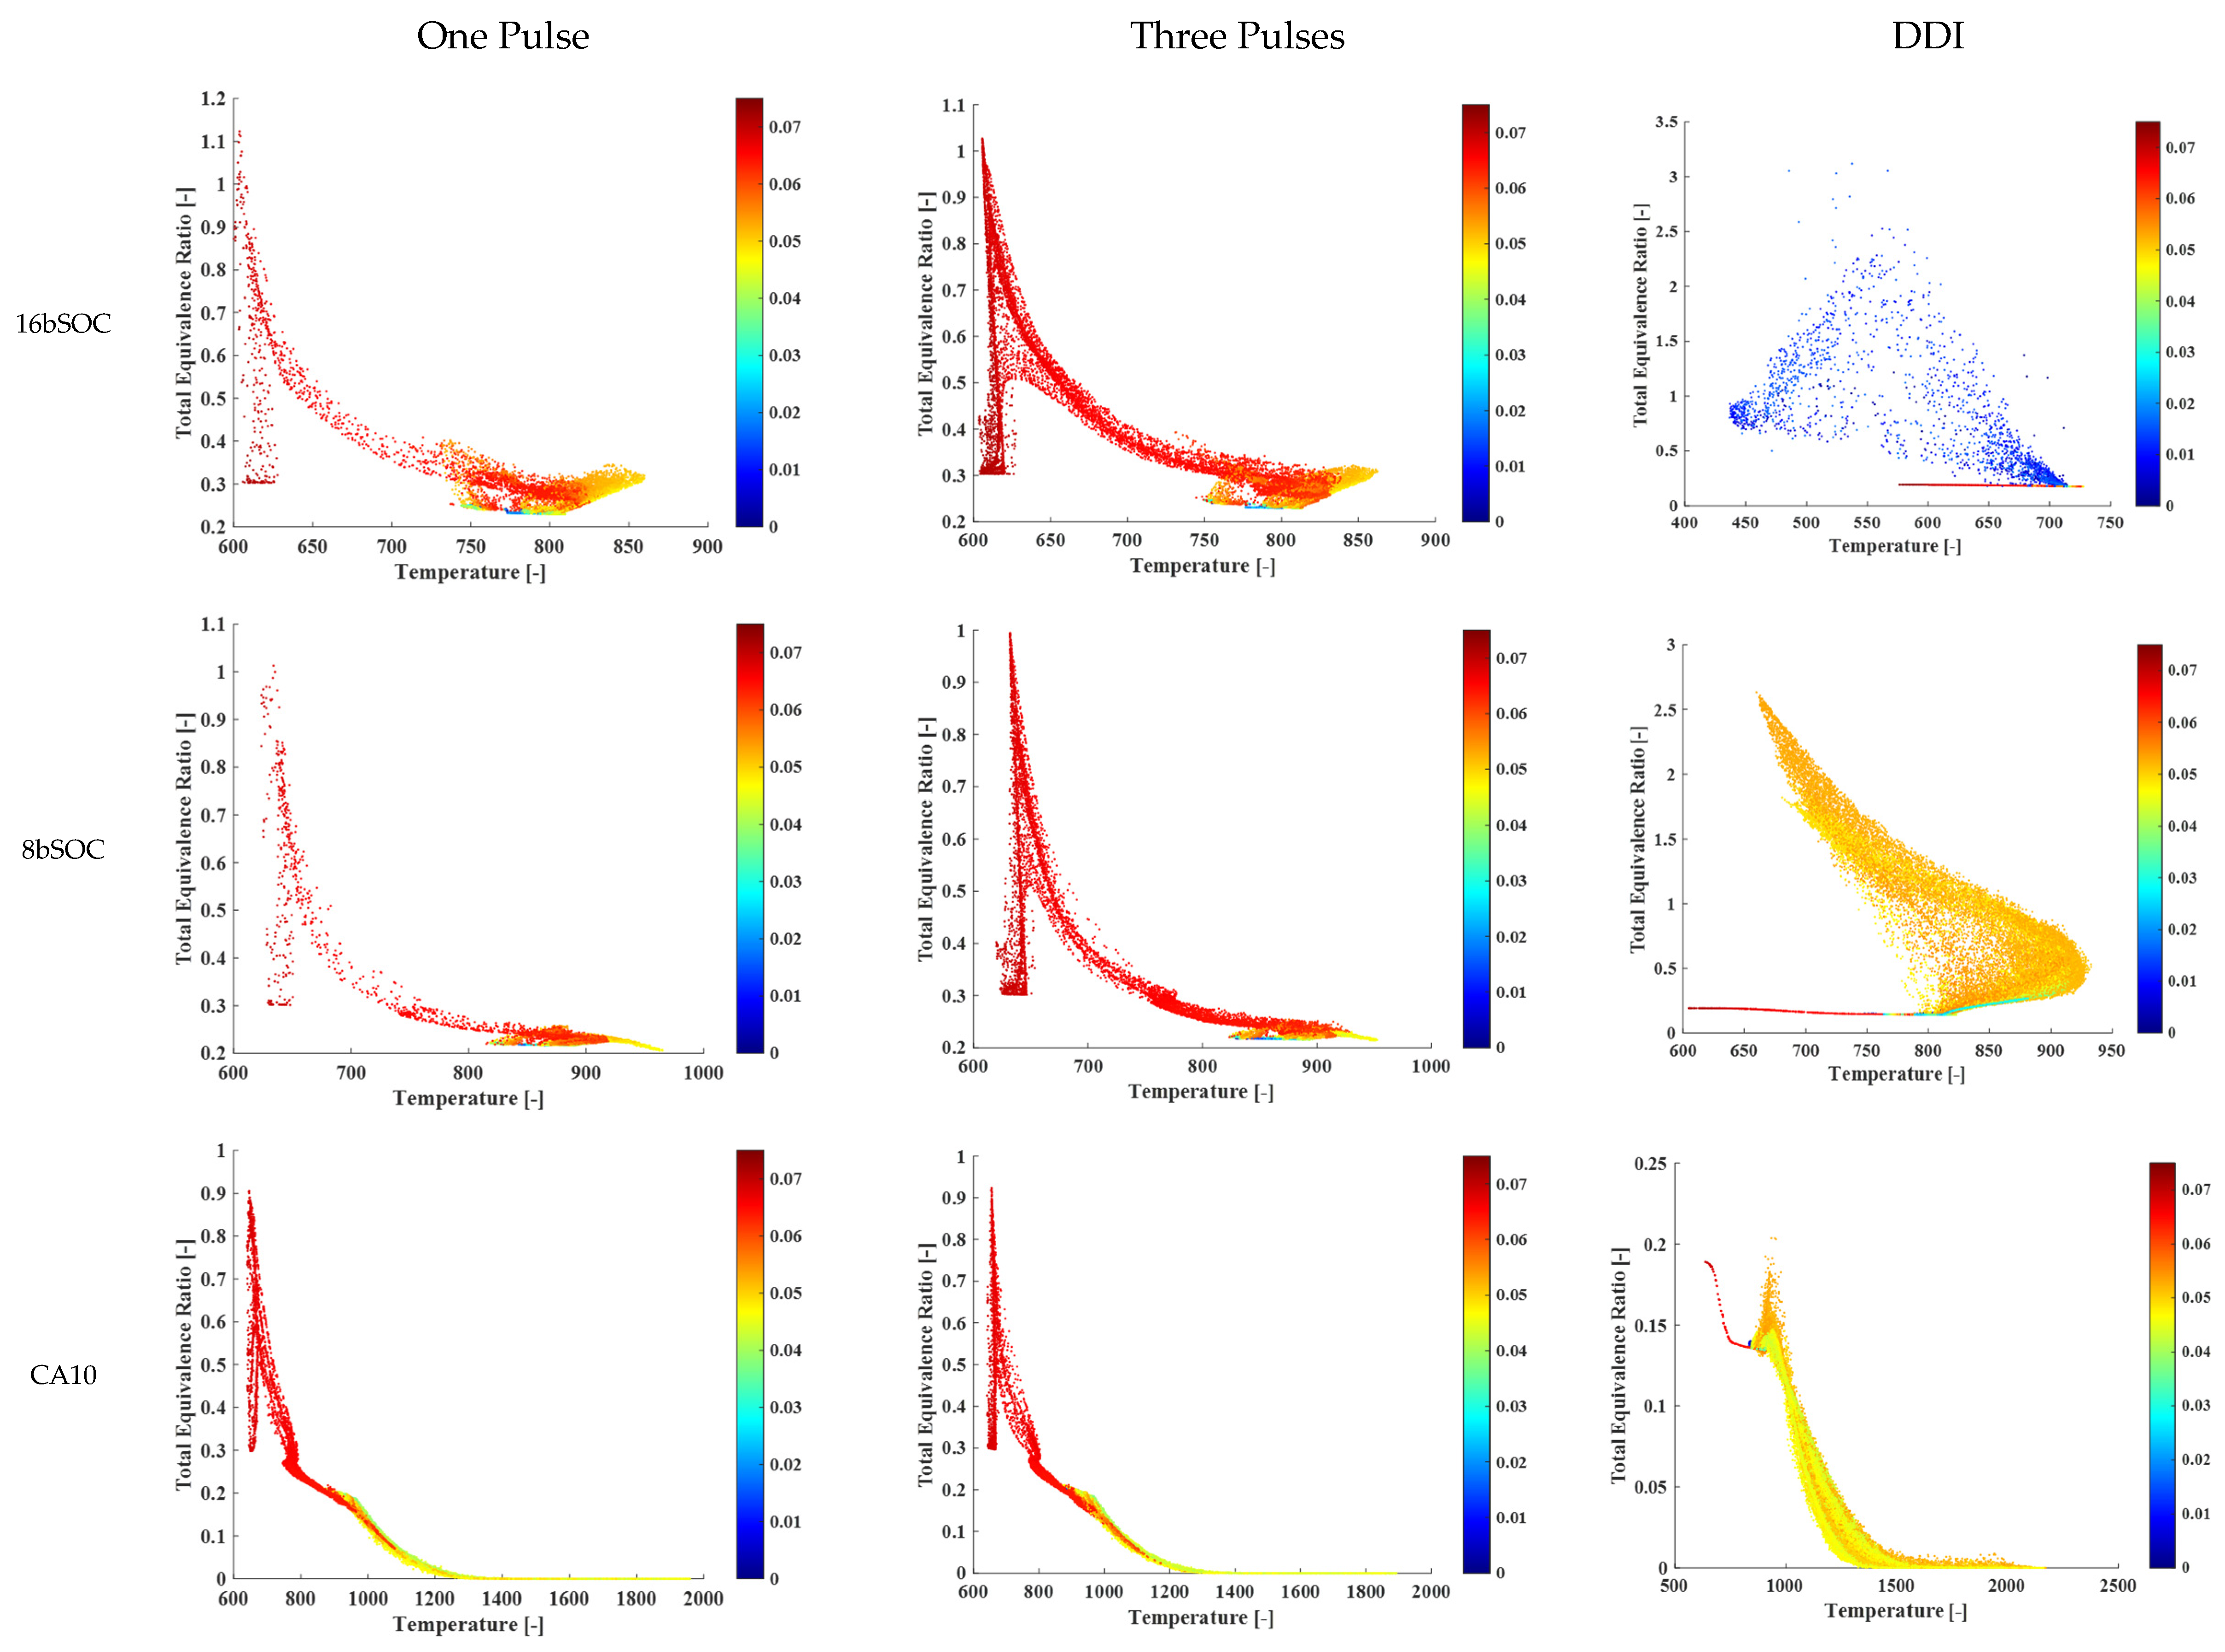
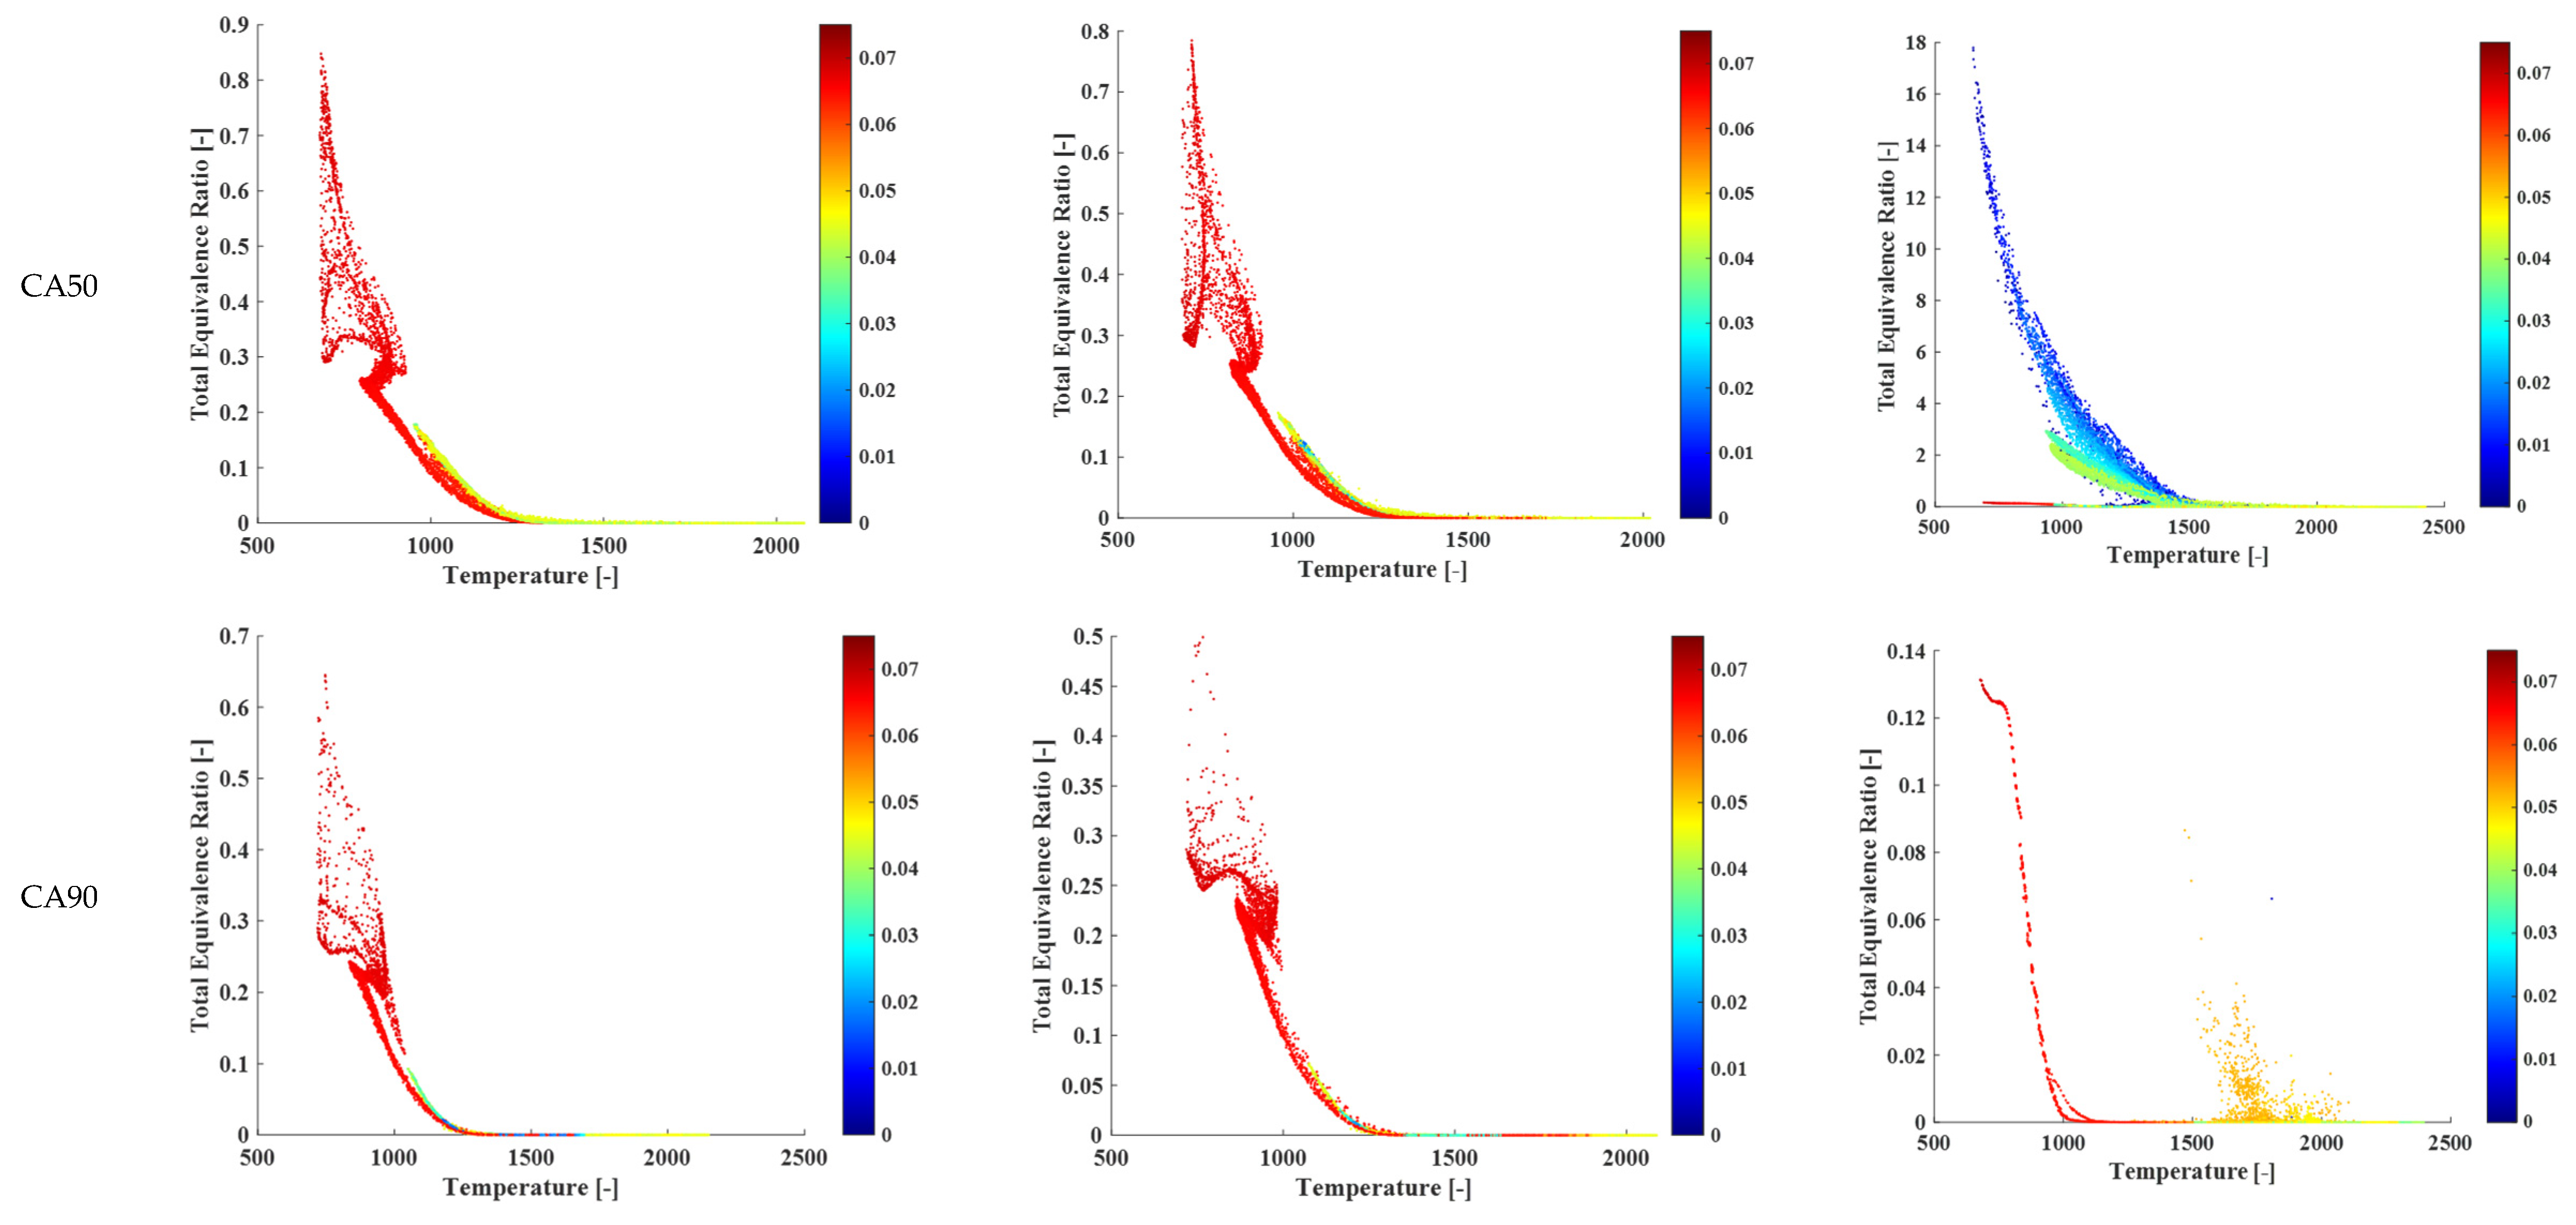
Figure 26.
The distribution of total equivalence ratio and temperature inside the cylinder colored by the distance from the injector.
Figure 26.
The distribution of total equivalence ratio and temperature inside the cylinder colored by the distance from the injector.
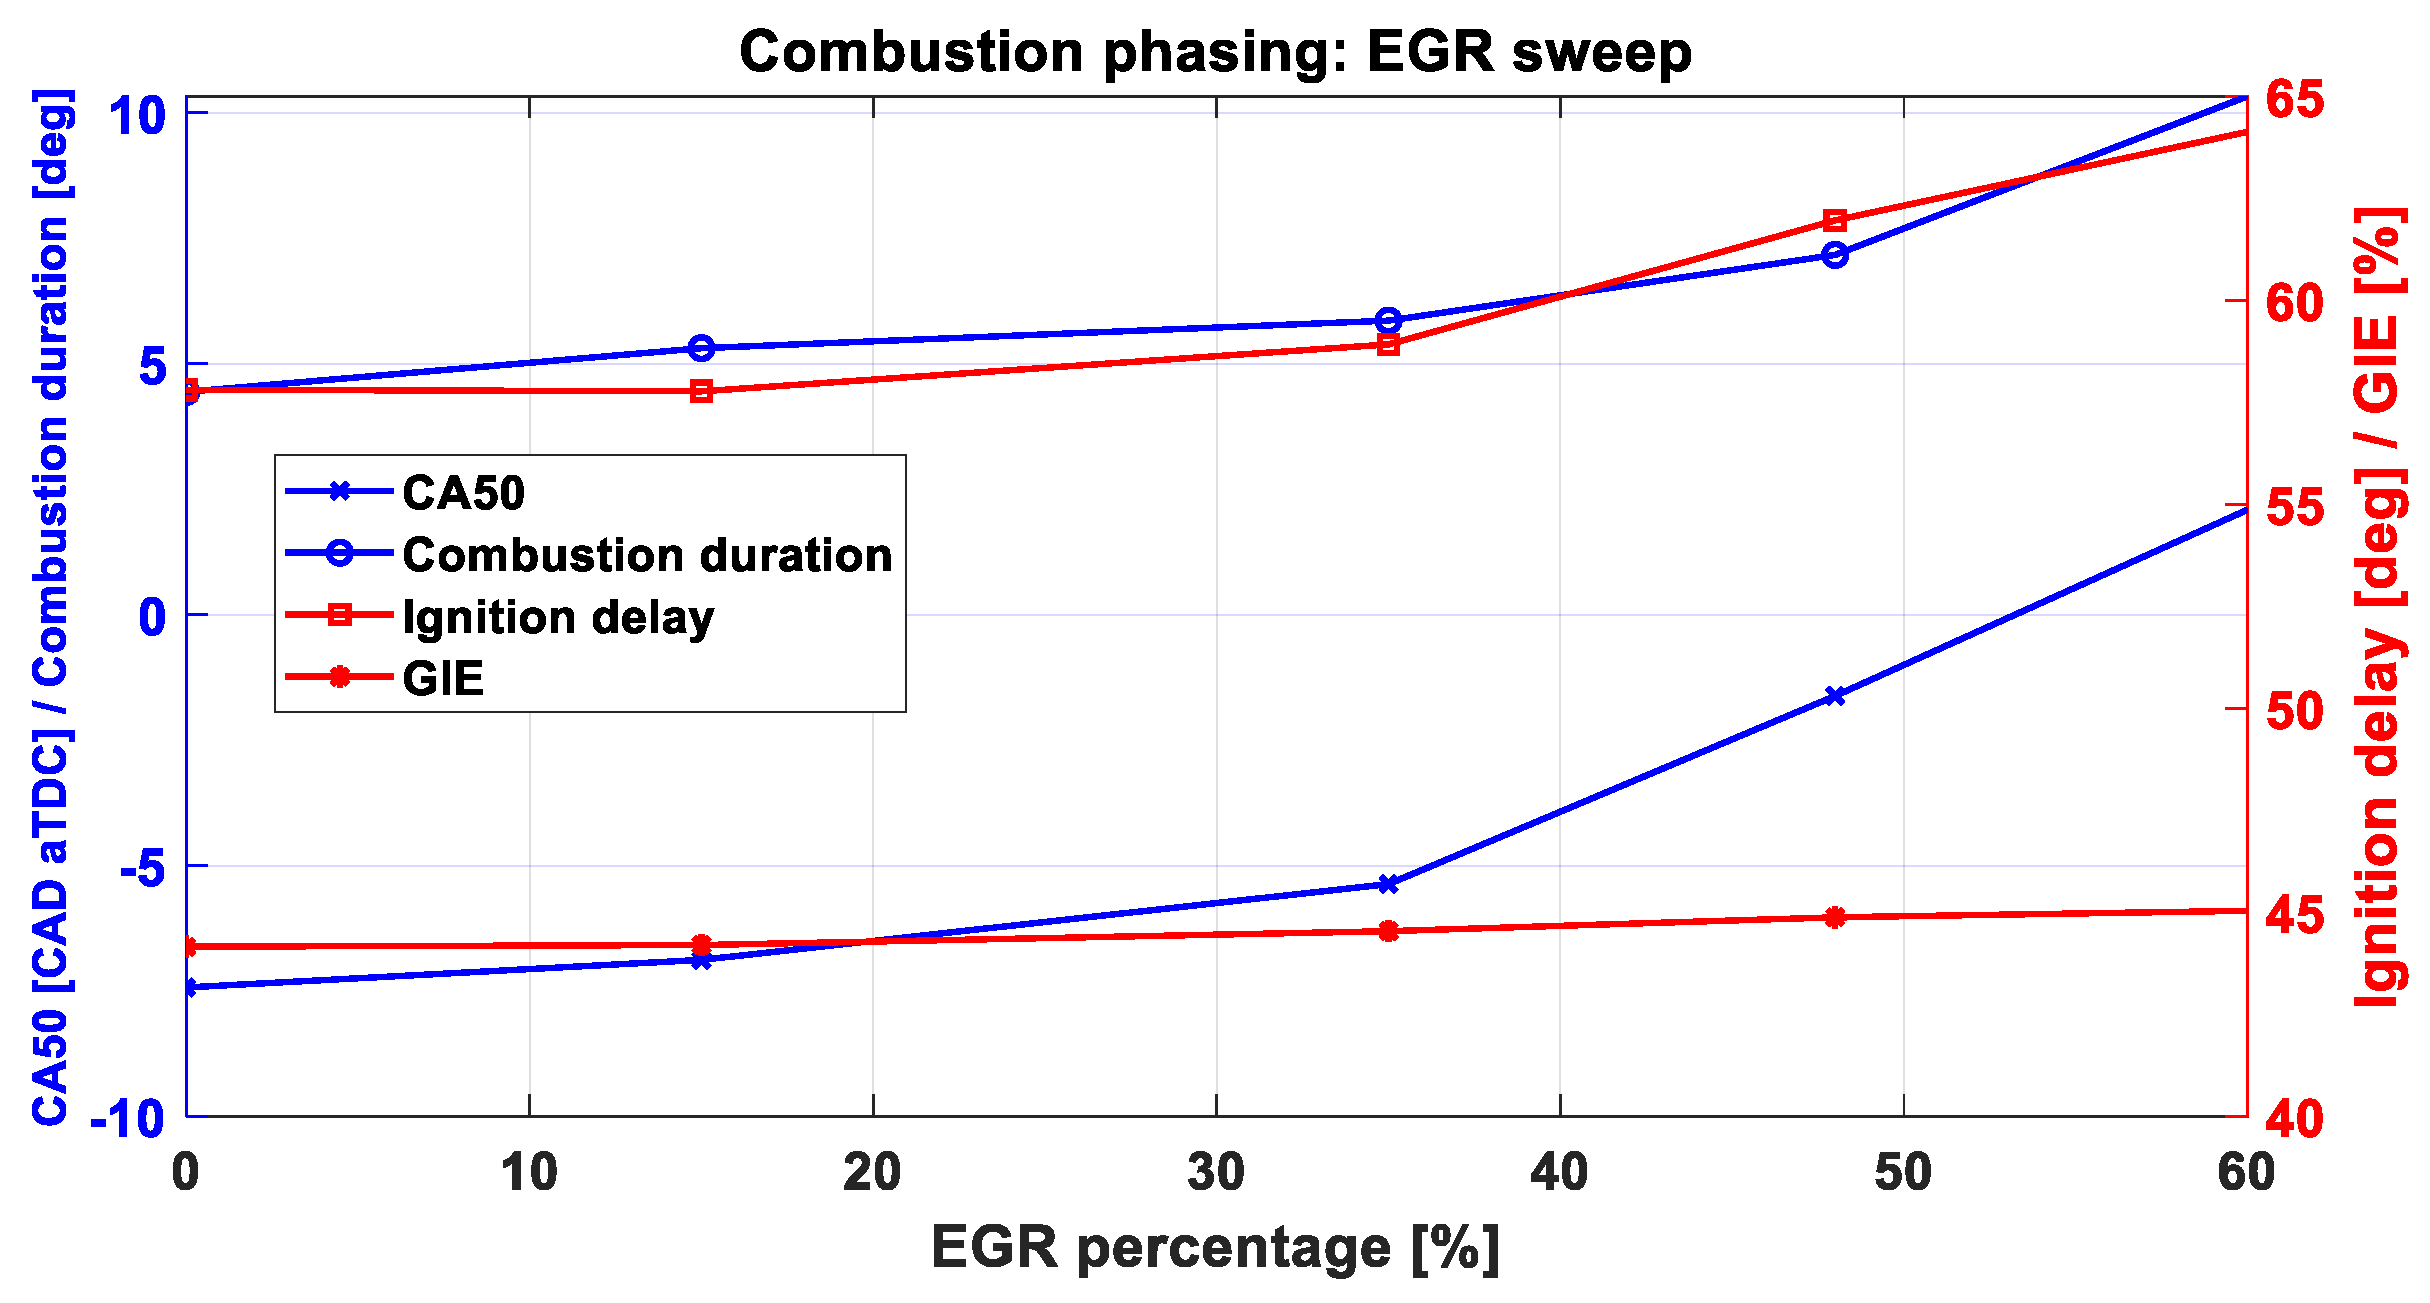
Figure 27.
Combustion characteristics trend while varying EGR.
Figure 27.
Combustion characteristics trend while varying EGR.
Figure 28.
Influence of EGR percentage on emissions characteristics.
Figure 28.
Influence of EGR percentage on emissions characteristics.
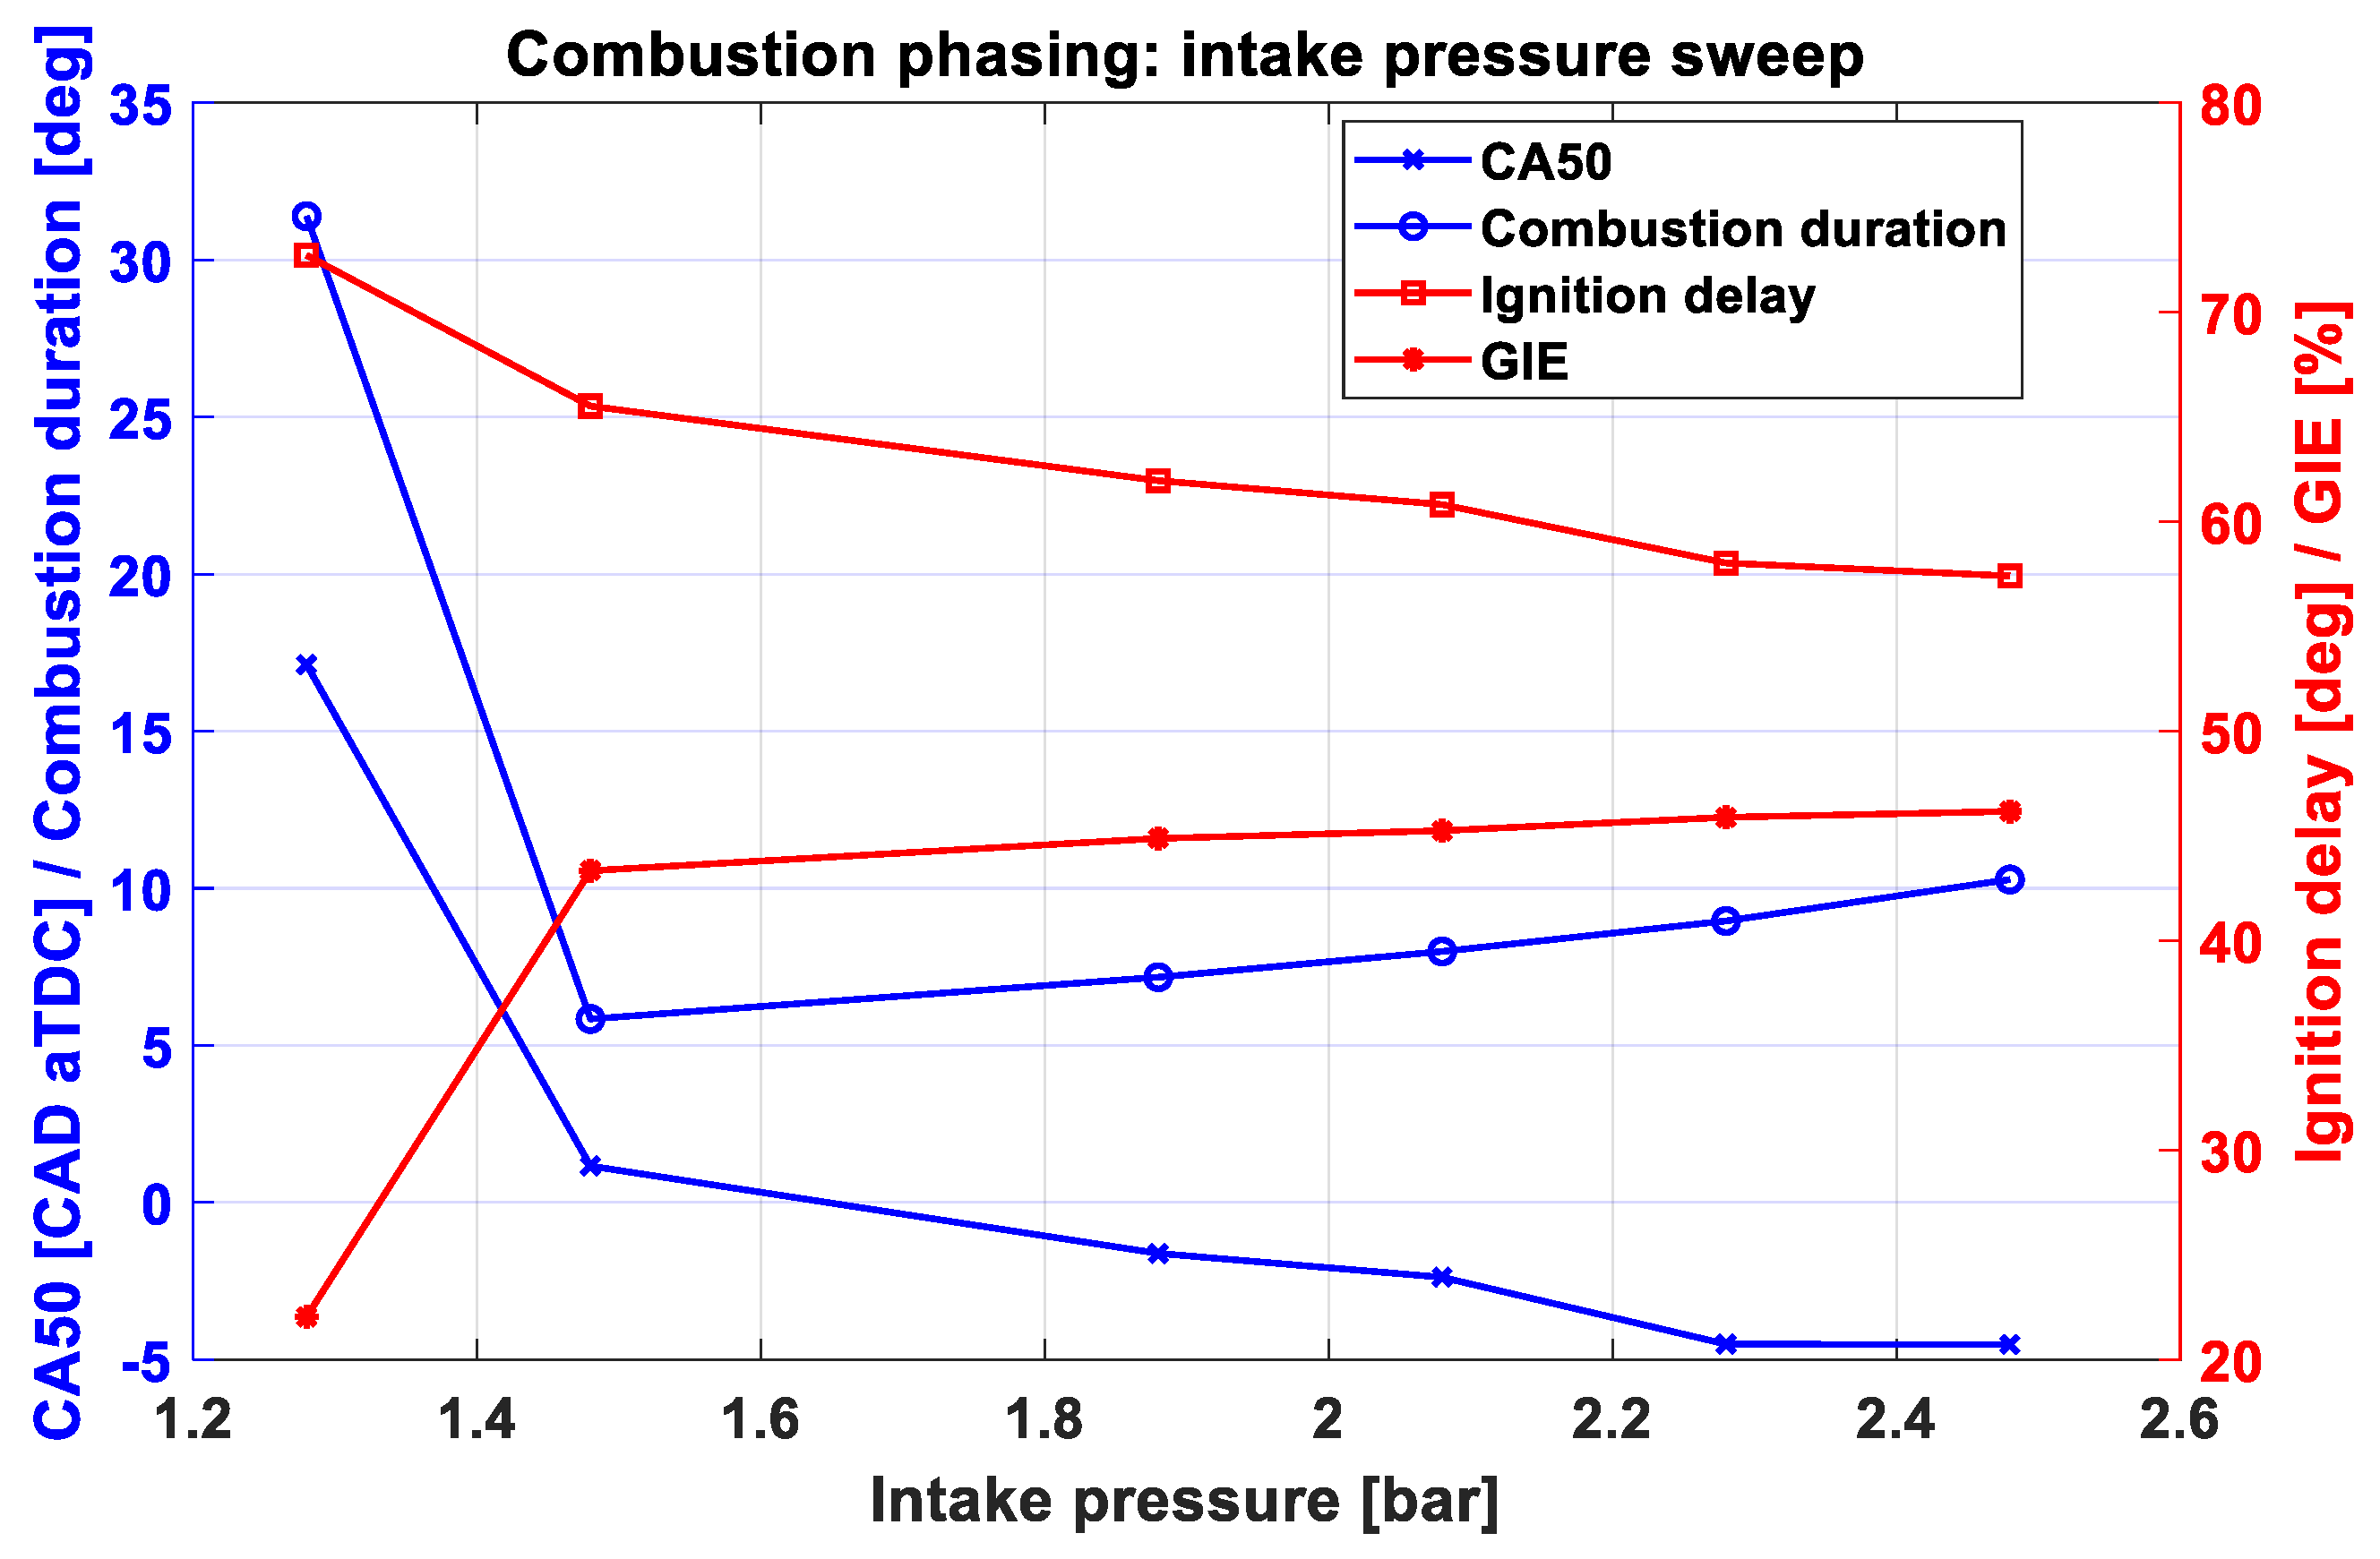
Figure 29.
Combustion phasing trend while varying intake pressure.
Figure 29.
Combustion phasing trend while varying intake pressure.
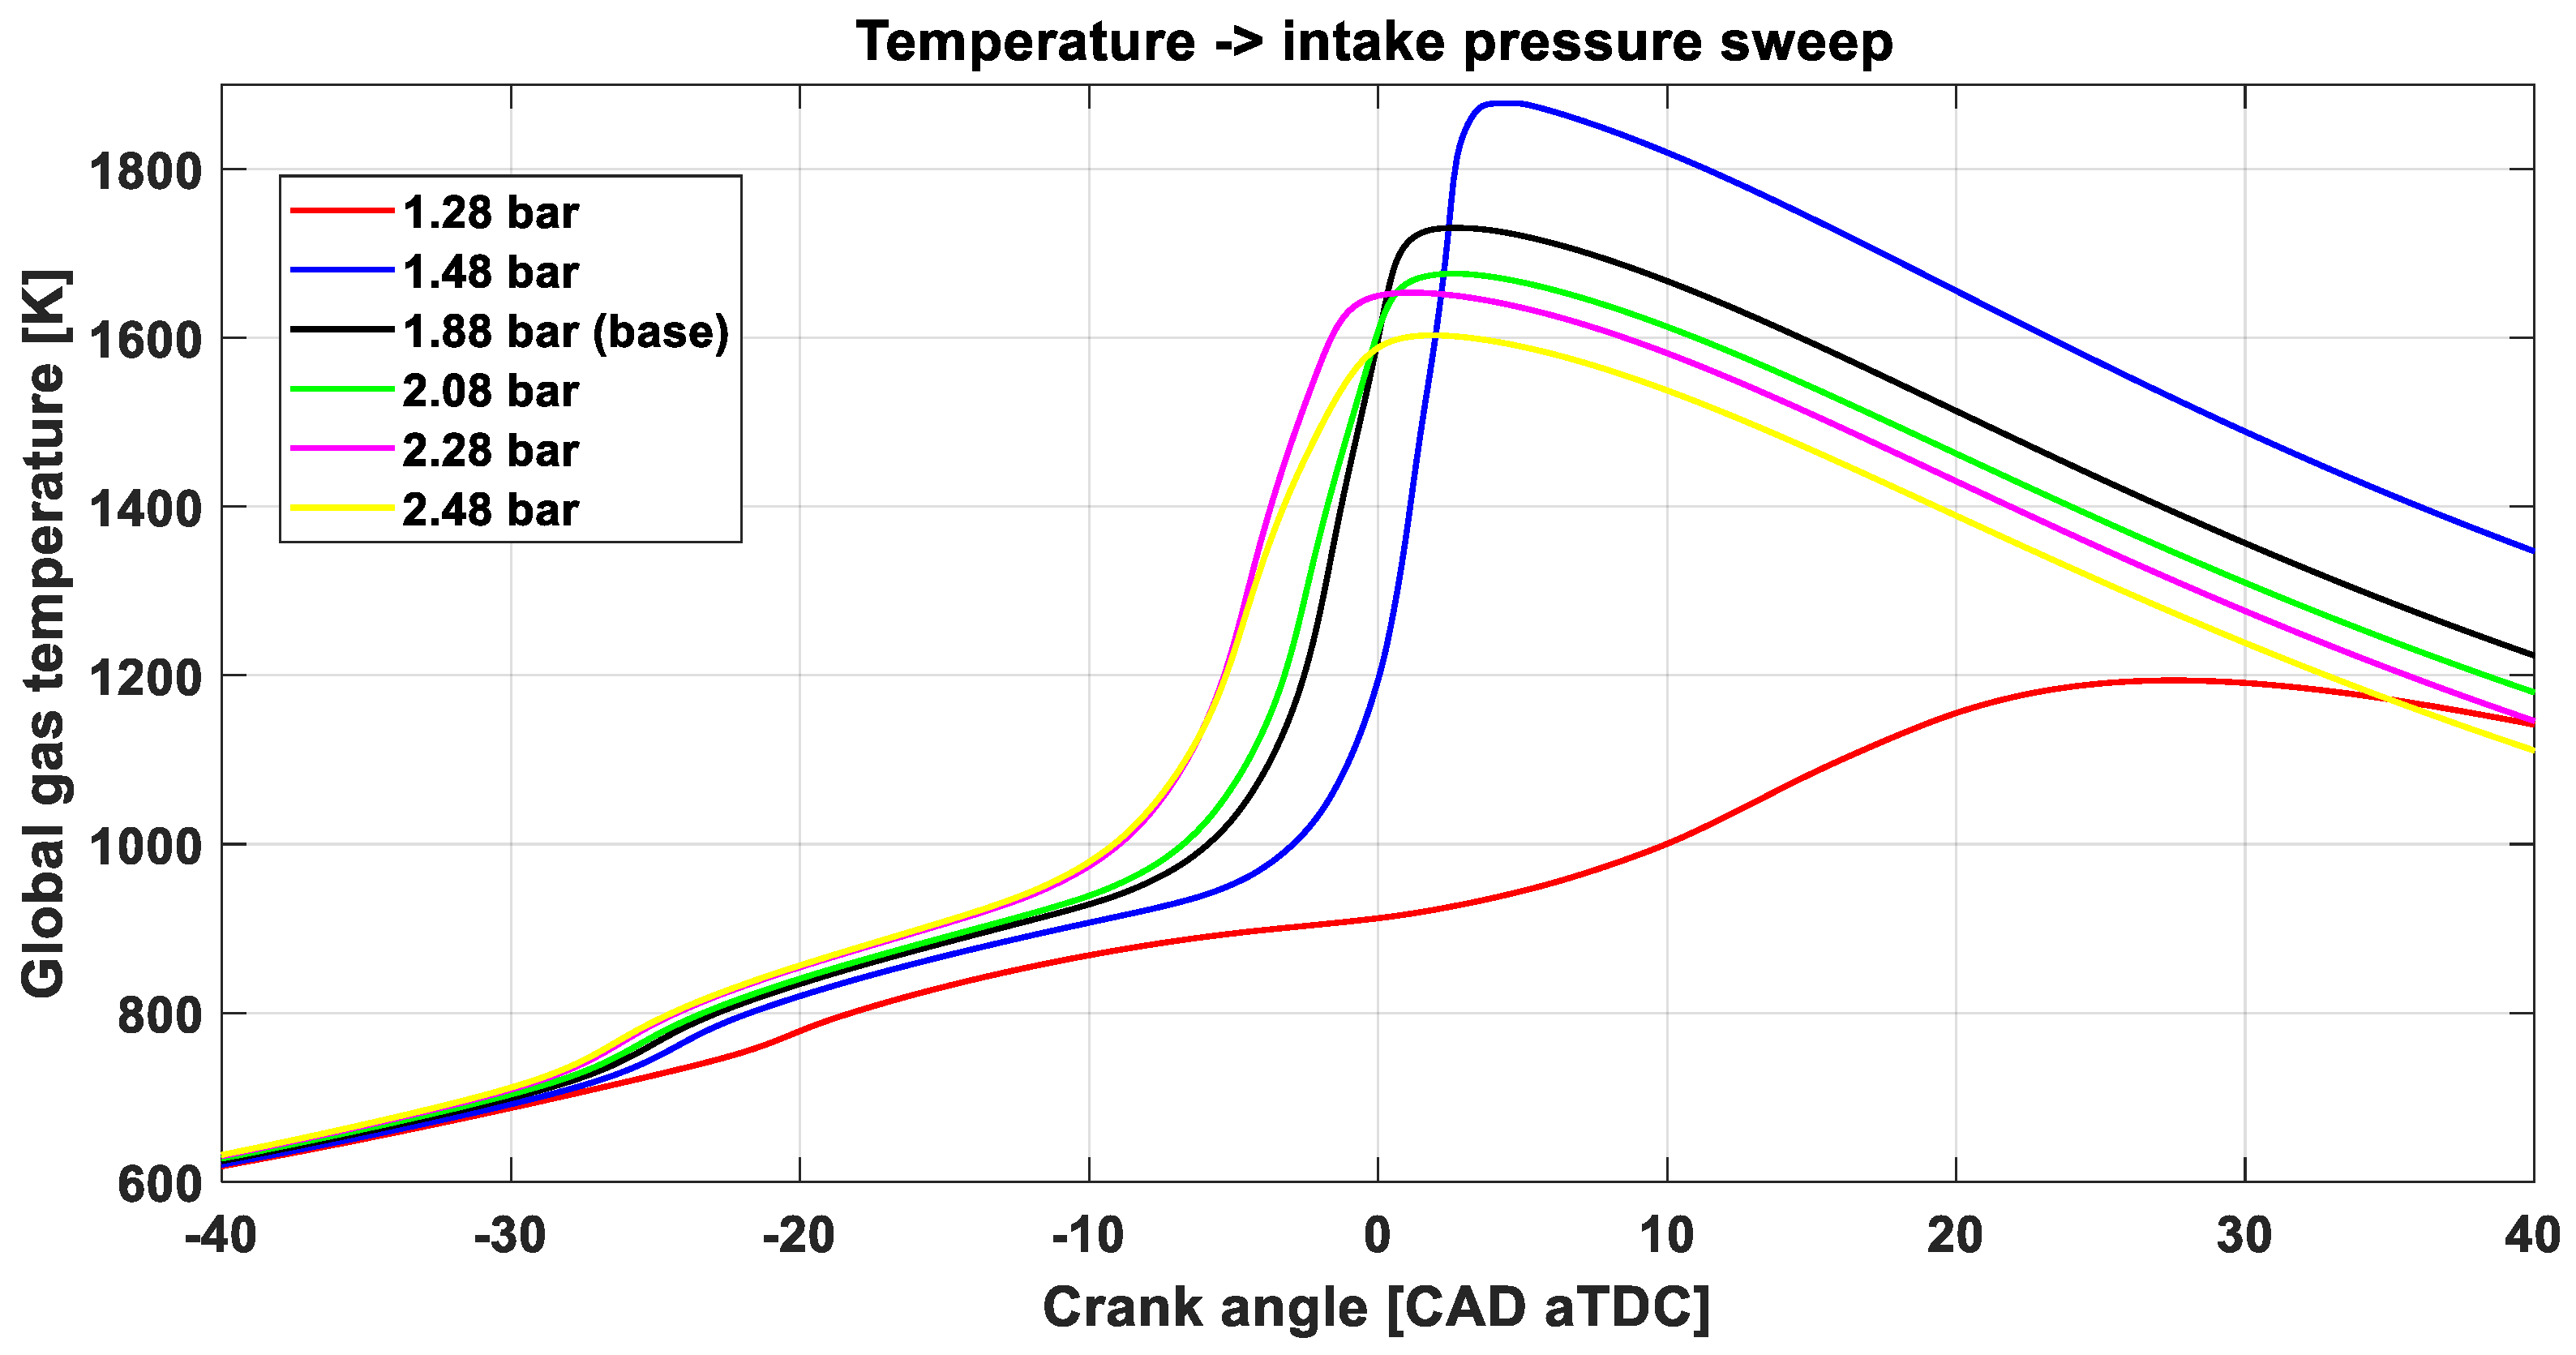
Figure 30.
Global gas temperature trace effected by varying intake pressure.
Figure 30.
Global gas temperature trace effected by varying intake pressure.
Figure 31.
Emissions trend while varying intake pressure.
Figure 31.
Emissions trend while varying intake pressure.
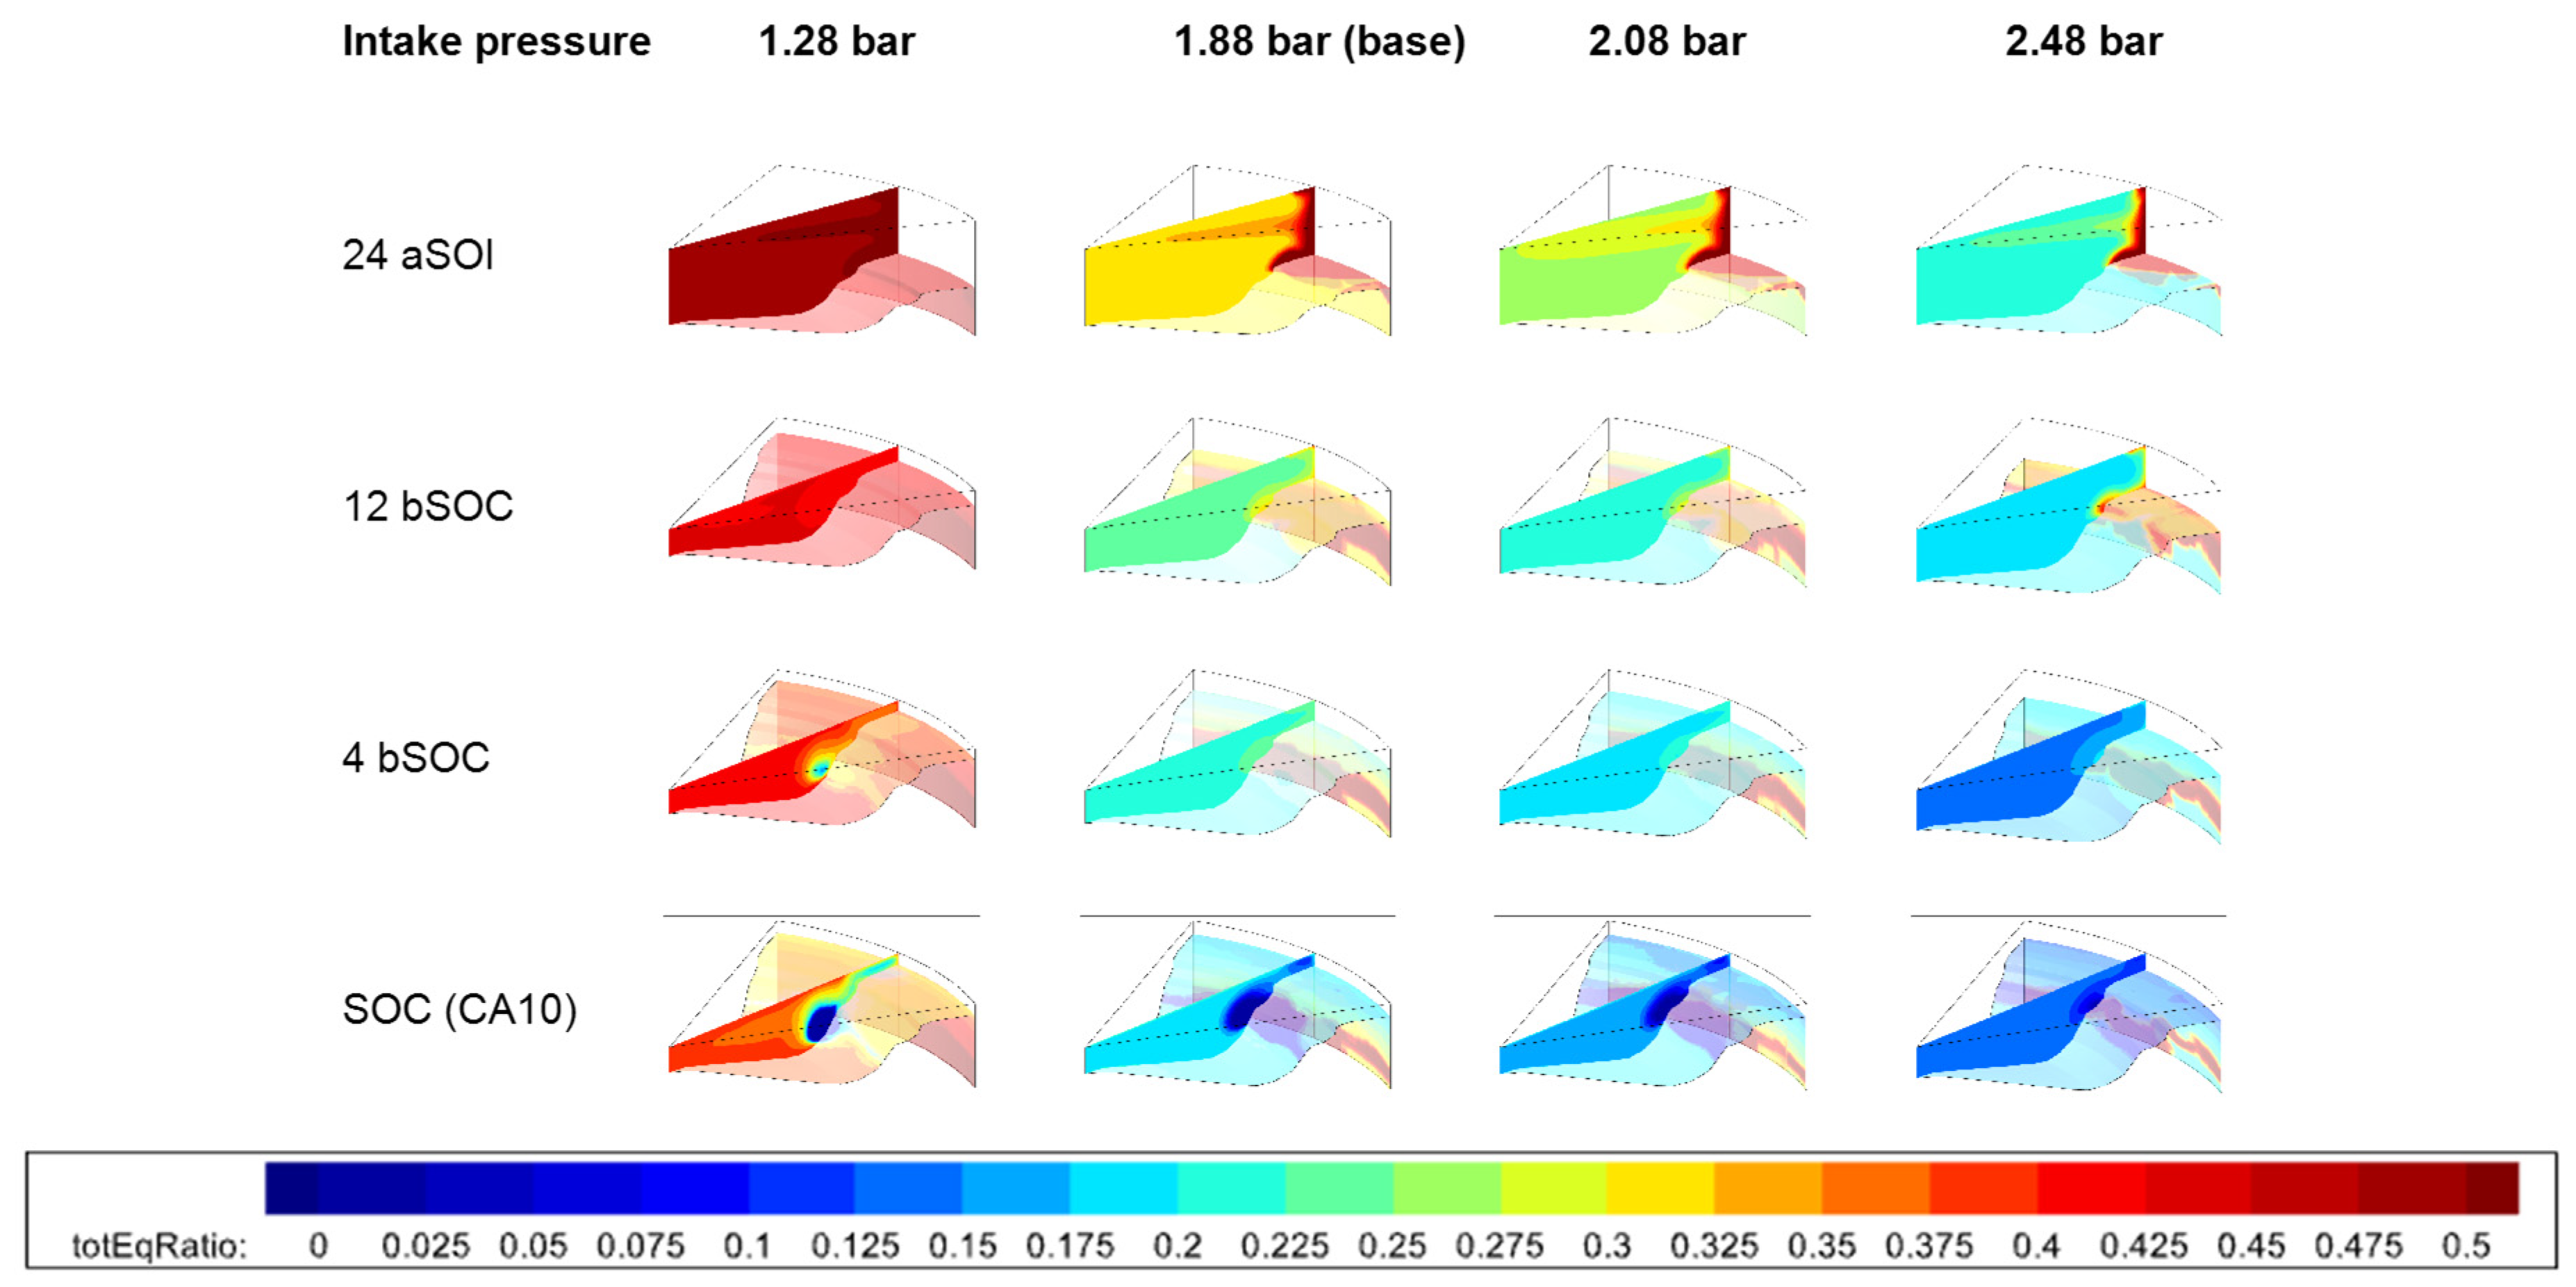
Figure 32.
The effect of boost pressure [bar] on the distribution of total equivalence ratio [−].
Figure 32.
The effect of boost pressure [bar] on the distribution of total equivalence ratio [−].
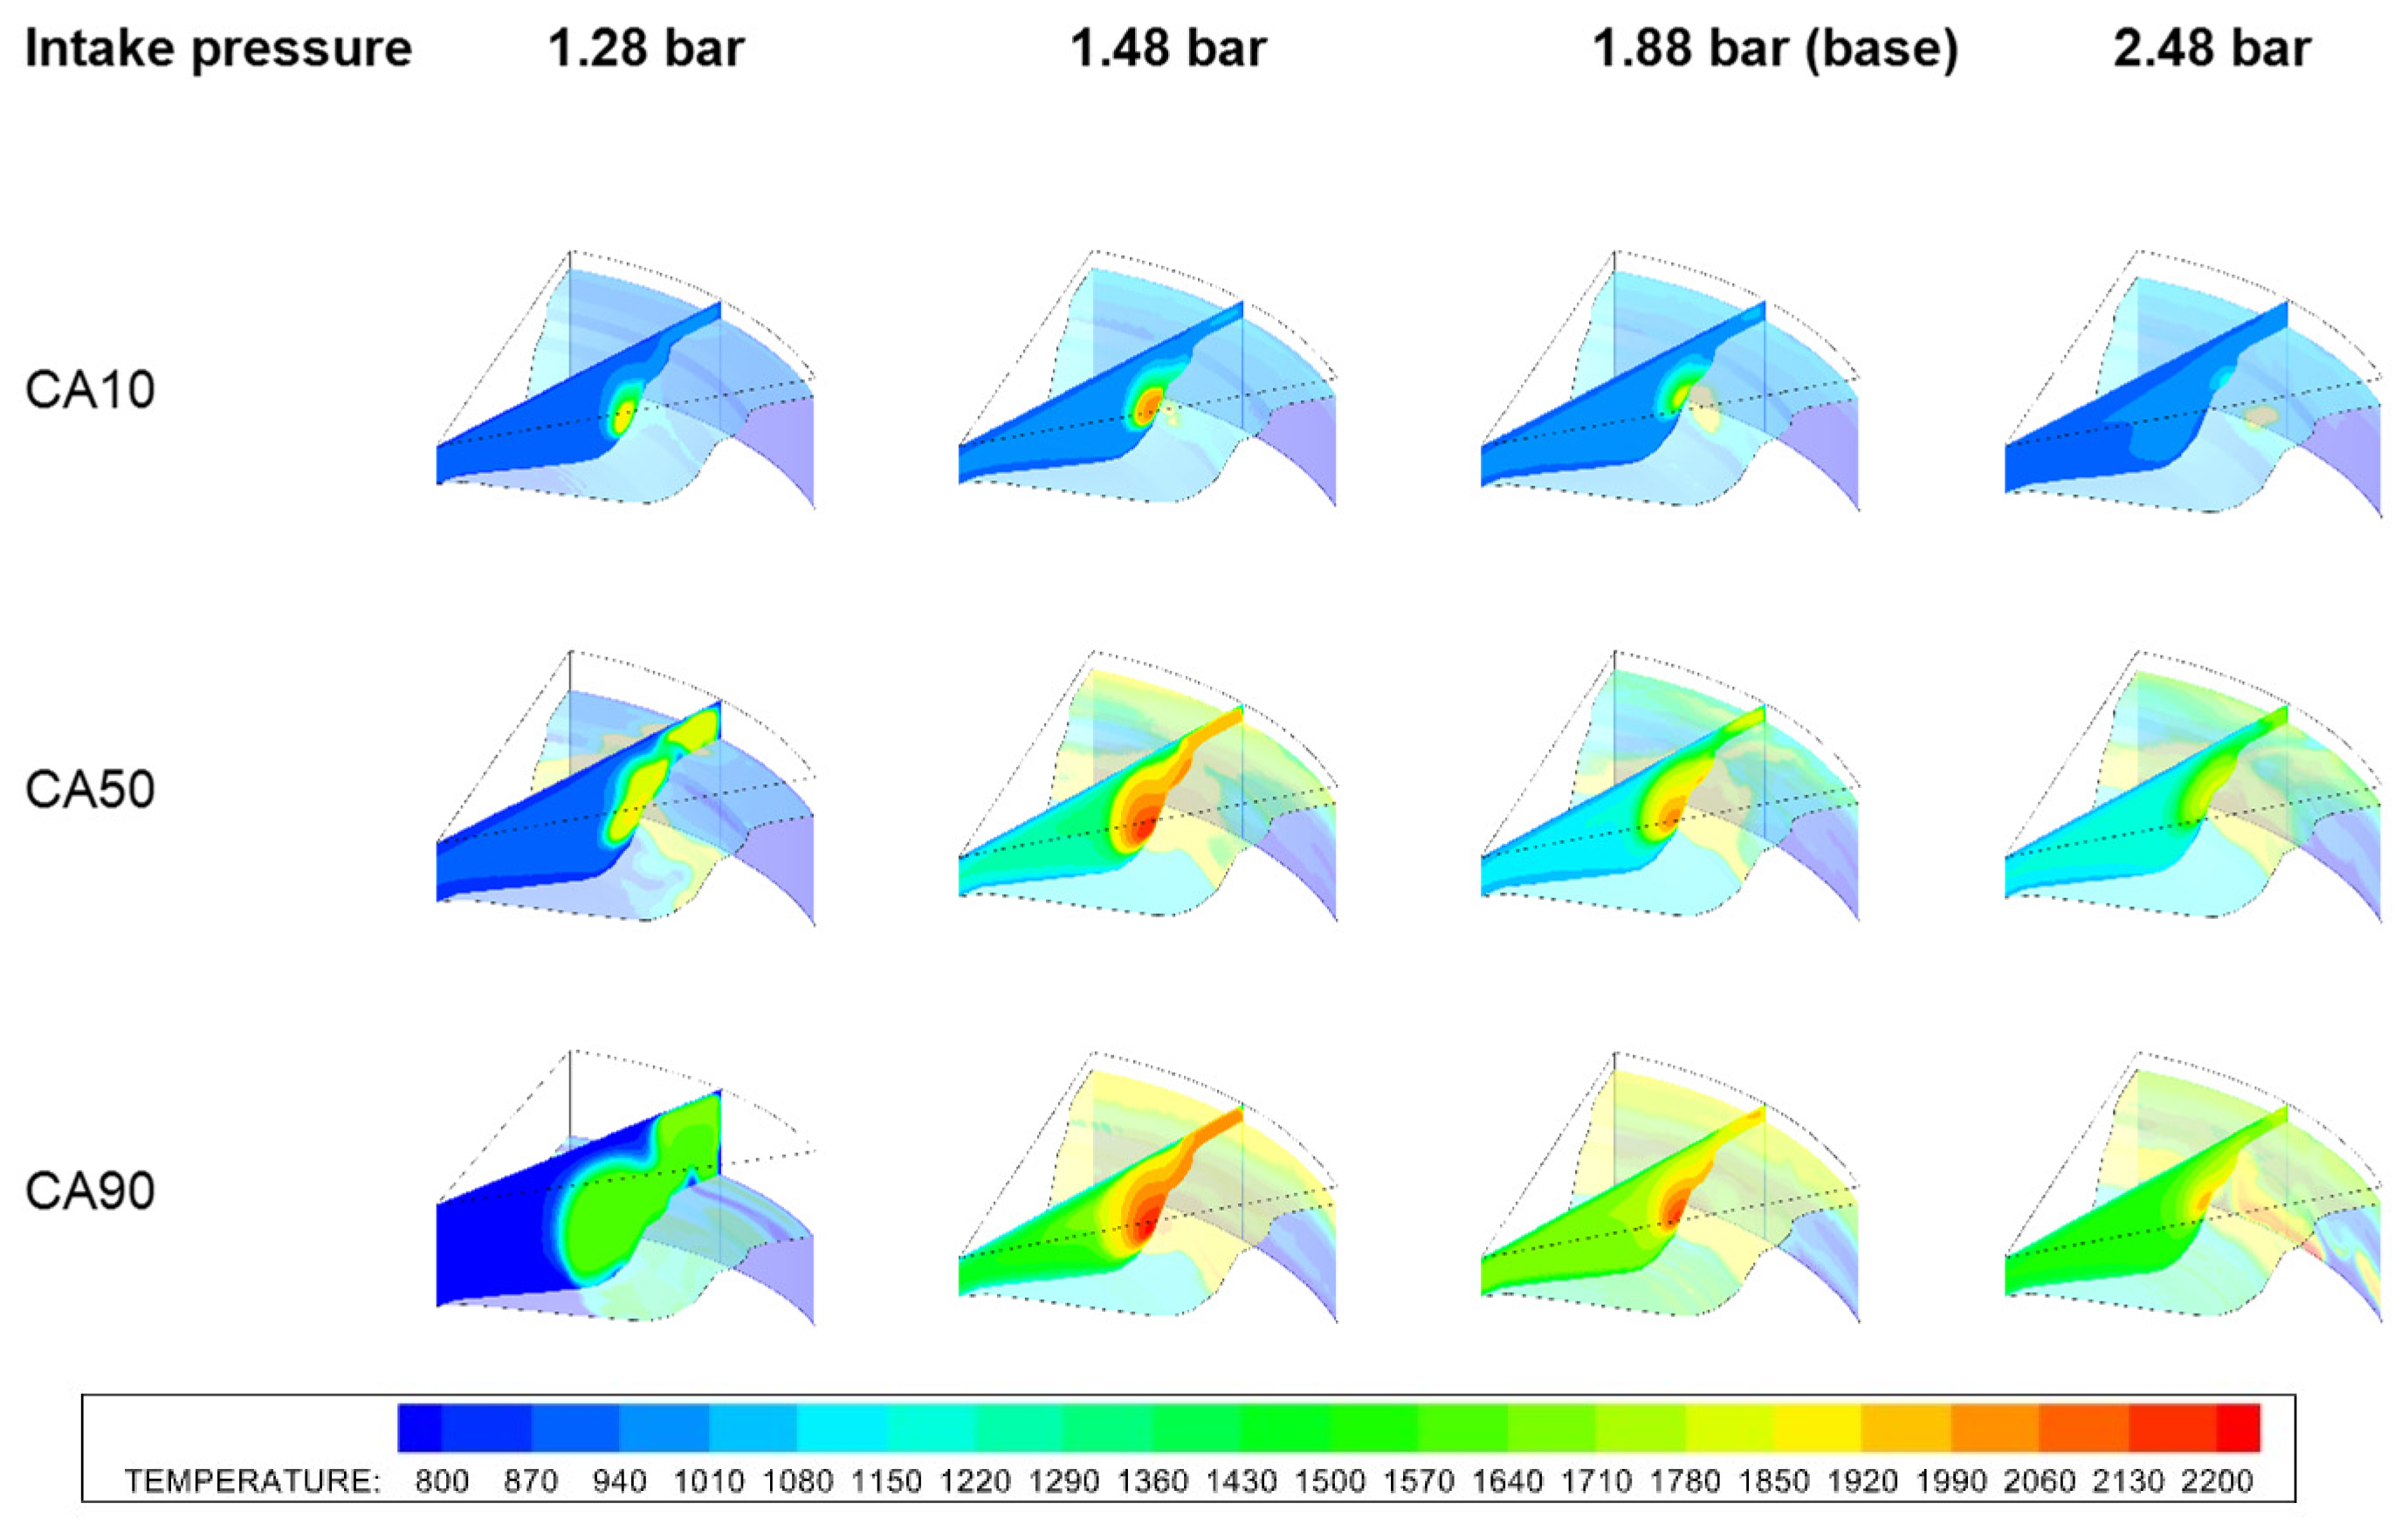
Figure 33.
The effect of boost pressure [bar] on the temperature [K] distribution.
Figure 33.
The effect of boost pressure [bar] on the temperature [K] distribution.
Table 1.
MX-13 engine and injectors specifications.
Table 1.
MX-13 engine and injectors specifications.
| Parameter | Value |
|---|
| Engine Specifications |
| Displaced volume | 2.097 L |
| Bore | 130 mm |
| Stroke | 158 mm |
| Connecting rod length | 266.7 mm |
| Compression ratio | 15.85 |
| Wrist pin to crank offset | 0 mm |
| Cylinder configuration | Inline 6-cylinder (only 1 cylinder in experiment setup) |
| Piston bowl profile | Double-cup |
| Cylinder head | Low swirl |
| Number of valves per cylinder | 4 |
| Intake valve diameter | 44 mm |
| Intake valve diameter | 41 mm |
| Intake valve lash | 0.5 mm |
| Exhaust valve lash | 0.55 mm |
| IVO (°aTDC) | 344 |
| IVC (°aTDC) | −153 |
| EVO (°aTDC) | 128 |
| EVC (°aTDC) | −346 |
| Port Fuel Injector Specifications |
| Port fuel injector | Bosch EV14 |
| Port fuel injected fuel | Conventional gasoline (EN228) |
| Port fuel injector SOI (°aTDC) | −320 |
| Direct In-Cylinder Fuel Injector |
| Common rail injector | Delphi DFI21 |
| Direct-injected fuel | European specification diesel (EN590) |
| Spray-included angle | 139 O |
| Number of holes | 7 |
| Hole diameter | 0.195 mm |
| Engine speed | 1200 RPM |
Table 2.
The operating condition of the engine validation case (base case).
Table 2.
The operating condition of the engine validation case (base case).
| Parameter | Value |
|---|
| Fuel blend ratio (PFI/total % mass) | 80 |
| SOI (°ATDC) | −68.66 |
| Common rail pressure (bar) | 520 bar |
| Intake pressure (bar) | 1.88 |
| Spray-included angle (deg) | 139 |
| EGR flow rate (%) | 48 |
Table 3.
Spray models.
| Physical CFD Spray Model | Model |
|---|
| Drop turbulent dispersion | O’Rourke [49] |
| Drop evaporation model | Frossling [50] |
| Collision model | NTC collision [51] |
| Drop drag model | Dynamic drop drag [52] |
| Spray–wall interaction model | Wall film [53] |
| Spray breakup | Modified KH-RT [54] |
Table 4.
Performance indicators experiment vs. 3D model.
Table 4.
Performance indicators experiment vs. 3D model.
| Parameter | MPRR [bar/CAD] | RI [MW/m2] | CA50 [CAD] | BD [CAD] |
|---|
| SOA −78.5 experiment | 16.5012 | 7.7226 | −0.8003 | 5.7848 |
| SOA −78.5 CFD | 15.87 | 7.60 | −0.84 | 6.45 |
| Relative error SOA −78.5 | 3.83% | 1.59% | 4.96% | 11.5% |
| SOA −70.1 experiment | 16.6985 | 7.7565 | −1.7883 | 5.889 |
| SOA −70.1 CFD | 15.85 | 7.60 | −1.62 | 7.17 |
| Relative error SOA −70.1 | 5.08% | 2.02% | 9.41% | 21.75% |
| SOA −62.1 experiment | 17.2187 | 8.1764 | −3.349 | 5.9753 |
| SOA −62.1 CFD | 16.08 | 7.83 | −3.37 | 7.47 |
| Relative error SOA −62.1 | 6.61% | 4.24% | 0.63% | 25.01% |
Table 5.
Performance indicators for different piston bowl profiles.
Table 5.
Performance indicators for different piston bowl profiles.
| Piston Bowl Profile | Bath. | Chamf. | Cyl. | DSO3 | Double | Re-Entrant | Single | - |
|---|
| Indicated efficiency | 45.02 | 44.12 | 44.38 | 44.75 | 44.88 | 44.58 | 44.60 | |
| Combustion efficiency | 98.40 | 99.44 | 98.48 | 98.60 | 98.53 | 99.03 | 98.52 | % |
| RI | 8.86 | 7.57 | 8.05 | 7.95 | 7.60 | 7.49 | 7.56 | MW/m2 |
| MPRR | 16.97 | 15.57 | 16.55 | 16.15 | 15.85 | 15.98 | 16.02 | bar/CAD |
Table 6.
The effect of number of pulses on the engine performance. IMEP = 8.7 bar; speed 1200 RPM.
Table 6.
The effect of number of pulses on the engine performance. IMEP = 8.7 bar; speed 1200 RPM.
| Number of DI Pulses | 1 | 2 | 3 | Unit |
|---|
| SOI1 | −68.66 | −68.66 | −88.66 | CAD aTDC |
| SOI2 | | −58.66 | −78.66 | CAD aTDC |
| SOI3 | | | −63.88 | CAD aTDC |
| Ignition delay | 61.96 | 52.28 | 57.44 | CAD |
Table 7.
Base double-pulse case with the same total fuel mass as the validated case.
Table 7.
Base double-pulse case with the same total fuel mass as the validated case.
| Parameter | Value | Unit |
|---|
| SOI1 fuel mass | 8.83 | mg |
| SOI1 injection pressure | 520 | bar |
| SOI1 timing | −68.66 | CAD aTDC |
| SOI2 fuel mass | 8.83 | mg |
| SOI2 injection pressure | 520 | bar |
| SOI2 timing | −32 | CAD aTDC |
Table 8.
Injection strategy settings.
Table 8.
Injection strategy settings.
| Parameter | Single DI | Double DI | DDI | Unit |
|---|
| PFI octane mass | 71.81 | 71.81 | 45.3 | mg |
| SOI1 fuel mass | 17.67 | 8.835 | 17.67 | mg |
| SOI1 inj. pressure | 520 | 520 | 520 | bar |
| SOI1 timing | −68.66 | −68.66 | −31 | CAD aTDC |
| SOI2 fuel mass | - | 8.835 | 26.5 (octane) | mg |
| SOI2 inj. pressure | - | 520 | 1000 | bar |
| SOI2 timing | - | −58.66 | −5.5 | CAD aTDC |
Table 9.
The effect of the injection strategy on the performance indicators of the engine.
Table 9.
The effect of the injection strategy on the performance indicators of the engine.
| Injection Strategy | Single DI | Double DI | DDI | - |
|---|
| Power | 17.36 | 17.40 | 17.68 | kW |
| Combustion efficiency | 98.61 | 98.92 | 97.56 | % |
| RI | 7.60 | 7.11 | 3.33 | MW/m2 |
| MPRR | 15.85 | 15.40 | 9.77 | bar/CAD |
Table 10.
The effect of EGR levels on the engine performance.
Table 10.
The effect of EGR levels on the engine performance.
| EGR Percentage | 0 | 15 | 35 | 48 | 60 | % |
|---|
| Power | 18.00 | 17.03 | 17.16 | 17.36 | 17.42 | kW |
| Combustion efficiency | 99.49 | 99.33 | 99.12 | 98.61 | 97.89 | % |
| RI | 42.05 | 19.50 | 14.19 | 7.60 | 2.63 | MW/m2 |
| MPRR | 37.09 | 25.59 | 21.56 | 15.85 | 9.22 | bar/CAD |
Table 11.
The effect of boost pressure on the engine performance.
Table 11.
The effect of boost pressure on the engine performance.
| Intake Pressure | 1.28 | 1.48 | 1.88 | 2.08 | 2.28 | 2.48 | Bar |
|---|
| Power | 8.66 | 16.75 | 17.36 | 17.51 | 17.68 | 17.79 | Kw |
| Combustion efficiency | 62.30 | 97.75 | 98.61 | 98.58 | 99.03 | 99.03 | % |
| RI | 0.18 | 16.84 | 7.60 | 6.23 | 6.60 | 5.30 | MW/m2 |
| MPRR | 1.50 | 21.28 | 15.85 | 14.98 | 15.66 | 14.40 | Bar/CAD |


