Article

A Combined 1D/3D Method to Accurately Model Fuel Stratification in an Advanced Combustion Engine

1
Power & Flow—Department of Mechanical Engineering, Eindhoven University of Technology, P.O. Box 513, 5600 MB Eindhoven, The Netherlands
2
CMT—Motores Térmicos, Polytechnic University of Valencia, Camino de Vera s/n, E-46022 Valencia, Spain
*
Author to whom correspondence should be addressed.
Joint First Author.
Fire 2025, 8(3), 117; https://doi.org/10.3390/fire8030117
Submission received: 17 January 2025 / Revised: 26 February 2025 / Accepted: 27 February 2025 / Published: 20 March 2025

Abstract

For computational fluid dynamic (CFD) modeling of advanced combustion engines, the cylinder is usually considered a closed system in which the initial conditions are estimated based on the experimental data. Most of these approximations hinder observing the effect of design parameters on engine performance and emissions accurately, and most studies are limited to a few design parameters. An approach is proposed based on the combination of a 1D gas dynamic and a 3D CFD model to simulate the whole engine with as few simplifications as possible. The impact of changing the in-cylinder initial conditions, injection strategy (dual direct injection or multiple pulse injections), and piston bowl geometry on a reactivity controlled compression ignition (RCCI) engine’s performance, emissions, and fuel stratification levels was investigated. It was found that applying the dual direct injection (DDI) strategy to the engine can be promising to reach higher load operations by reducing the pressure rise rate and causing stronger stratification levels. Increasing the number of injection pulses leads to lower Soot/NOx emissions. The best reduction in the pressure rise rate was found by the dual direct strategy (38.36% compared to the base experimental case) and higher exhaust gas recirculation (EGR) levels (41.83% reduction in comparison with the base experimental case). With the help of a novel piston bowl design, HC and CO emissions were reduced significantly. This resulted in a reduction of 54.58% in HC emissions and 80.22% in CO emissions.

1. Introduction

Electric vehicles (EVs) are a key solution for reducing climate change impact and fossil fuel dependency [1]. However, challenges like battery efficiency, charging infrastructure, and raw material sustainability hinder widespread adoption [2]. To address this, advanced combustion engines are being developed as a complementary strategy to improve energy efficiency and lower emissions in the near term [3]. Most of these strategies can be categorized under low-temperature combustion (LTC) [4], turbulent jet ignition (TJI) [5], and the usage of alternative fuels such as ammonia [6] and hydrogen [7]. In LTC mode, the engine works at lower combustion temperatures compared to conventional diesel mode engines [8]. The benefit of having a lower combustion temperature is reducing NOx emission while simultaneously improving thermal efficiency [9]. Various strategies can achieve LTC in combustion engines, for instance, homogeneous charge compression ignition (HCCI) [10,11] and partially premixed compression ignition (PPCI) [12], where the charge is fully (HCCI) or partially premixed (PPCI), reducing the NOx and soot emissions, respectively [13]. The reduction in or absence of NOx-soot formation is mainly due to the high level of pre-mixing [14]. However, compared to the conventional diesel combustion (CDC) engines, a mechanism to control the start of combustion is considerably reduced. In addition, at high load, the high maximum pressure rise rate (MPRR) can be a potential risk for the engine [15].
Reactivity controlled compression ignition (RCCI) [16], another variant of the LTC mode, provides LTC advantages under a wider engine operating window. This strategy usually utilizes two fuels with different reactivity: one as a premixed fuel and another as a direct-injected (DI) fuel [17]. The start of combustion and MPRR are controlled by the ratio of the DI fuel and premixed fuel, and combustion duration is governed by the local reactivity inside the cylinder. However, most of the fuel portion is premixed, which leads to high unburned fuel emissions (HC) and CO emissions [18]. Also, a small operating window is seen as compared with the operating window of conventional diesel engines [19]. The MPRR is still high for these engines as a result of a high proportion of premixed fuel [20]. Numerous solutions have been reported to mitigate the RCCI challenges [21]. However, most of them rely on an additional diesel oxidation catalyst (DOC) or an extra supply of gas or fuel, which demands significant hardware change, posing many problems regarding cost, design, space, and complexity.
Modeling RCCI engines and, in general, advanced combustion engines poses significant challenges due to the intricate processes governing their operation [22]. RCCI combustion relies on the controlled mixing and interaction of two fuels with varying reactivities, which introduces a complex interplay of chemical kinetics, turbulence, and heat transfer [23]. The inclusion of exhaust gas recirculation (EGR) and boost pressure adds further complexity, as these parameters significantly influence in-cylinder conditions, including temperature, pressure, and reactivity stratification [24]. Modeling the dynamic interactions between EGR, the boosting system, and the combustion process requires advanced tools capable of coupling thermodynamic and fluid flow simulations with chemical kinetics. Additionally, computational costs associated with simulating the coupled physical and chemical phenomena are often prohibitive, limiting the feasibility of real-time or high-fidelity modeling [25]. Most studies only model the closed combustion system, and the simulation is performed from intake valve close (IVC) to exhaust valve opening (EVO) timing. Therefore, the interactions between the EGR, boost, and combustion process are disregarded, and the initial conditions of the model, including the initial temperature, pressure, and species mass fractions, are estimated.
Tripathi and Krishnasamy [26] utilized a 3D CFD model to study the effect of adjusting the start of injection timing, the fuel ratio, and intake charge temperature and multiple injection strategies. Implementing multiple injection strategies, such as double pulses and varying intake valve closure temperatures, and injection timings led to reductions in CO, HC, and soot emissions (by 25.5%, 93.68%, and 3.7%, respectively) as well as improvements in combustion efficiency. Wang et al. [27] used a CFD model in their study and realized that the use of polyoxymethylene dimethyl ethers (also referred to as PODE, OME, or POM-DME) instead of diesel as the high-reactive fuel can suppress MPRR and extend the high load limit of RCCI engines while keeping NOx/soot emissions low because of the fuel’s oxygen content and its low heating value and its high reactivity, which improves reactivity and concentration stratification by prolonging injection duration. Vasudev et al. [28] employed an improved multizone model (MZM) to study the effect of injection strategy and boost pressure on a natural gas/diesel RCCI engine. The model prediction accuracy was within 1.5 °CA for combustion phasing, and all synthetic performance indicators derived from pressure trace were within 5% error. Li et al. [29] used a closed CFD model to create a dataset for training a data-driven model of an RCCI engine fueled with polyoxymethylene dimethyl ethers and hydrogen. The model was able to predict the engine performance within milliseconds. Subsequently, optimization algorithms were applied to identify optimal engine parameters that maximize efficiency and minimize emissions. Xiahou et al. [30] examined how injector positioning and timing affect the combustion mode in a gasoline/diesel dual-fuel engine using a closed 3D CFD model. The findings suggest that optimizing injector offset and injection timing in eccentric configurations can enhance engine performance by effectively managing the interplay between different combustion modes. Without offset, all the low-reactive fuel (LRF) plumes are ignited simultaneously by pilot diesel. With a large offset, all LRF plumes are in the partially premixed mode.
Most of the numerical investigations only utilized a closed 3D CFD model and not a combined 1D/3D model to include the dynamic interactions between different parts of the RCCI engines and did not carry out a comprehensive study on the effect of all design parameters on the same engine to judge better how the design parameters can be used to solve the problems of RCCI engines without hardware changes. The present study investigates the effects of most important design parameters to address the challenges encountered by RCCI engines with the aim to relieve the need for an extra DOC system or any other significant hardware changes. An approach is proposed based on a combined 1D gas dynamic and 3D CFD model to model the whole engine with as few simplifications as possible. The impact of changing the in-cylinder initial conditions, injection strategy (dual direct injection or multiple pulse injections at a fixed combustion phasing), and piston bowl geometry (at a fixed compression ratio) on the engine performance, emissions and fuel stratification levels was investigated. The investigation aims at acquiring more insight into how emissions can be reduced and how the engine operating window can be expanded by proper design of the engine and controlling the stratification levels.

2. Experimental Setup Specifications

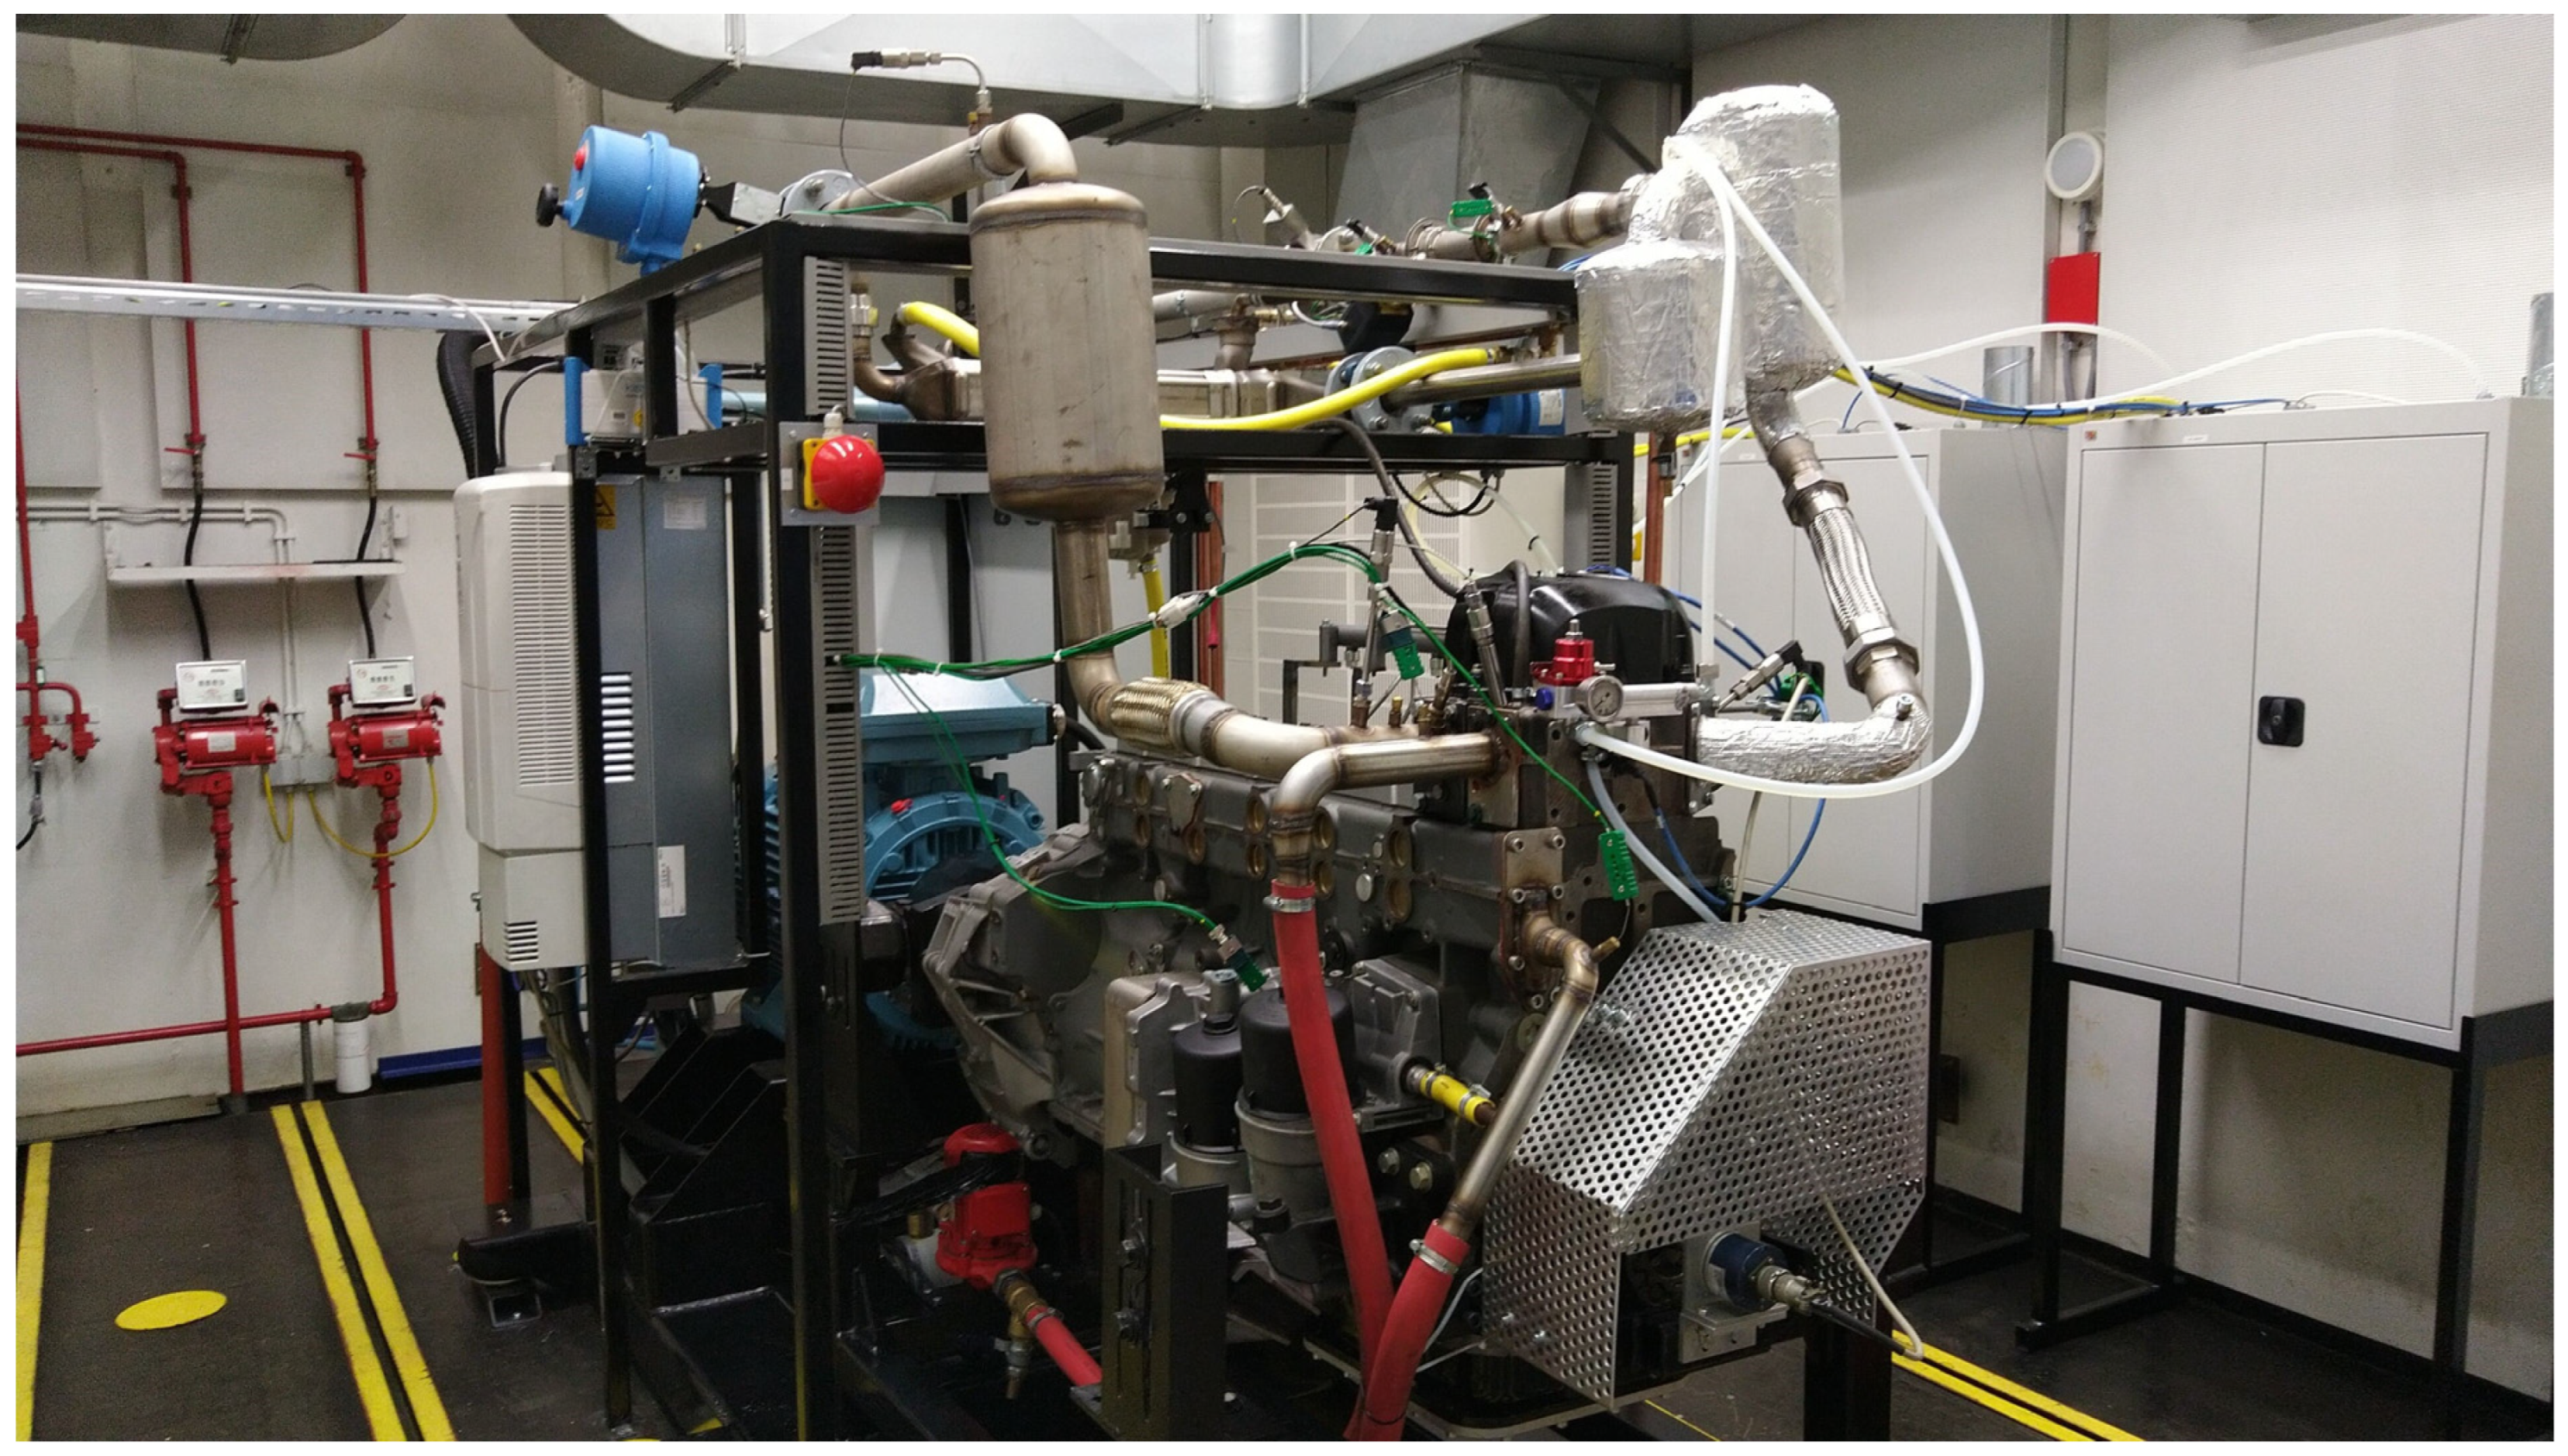
The model validation in the current study was performed against a set of experimental data obtained on an RCCI PACCAR MX-13 engine fueled by gasoline as the low-reactive fuel (LRF) and diesel as the high-reactive fuel (HRF). The engine is a heavy-duty engine with and a high-pressure common rail injector and compression ratio of 15.85. Details on collecting data and how the experiments were conducted were reported and analyzed deeply in a previous study [31]. The most important characteristics of the engine and the injector are given in Table 1. Figure 1 and Figure 2 show the schematic representation of the engine setup and the picture of the actual test cell. During the experiments, three different design parameters, namely boost pressure, the ratio of the two fuels, and the start of injection (SOI) timing, were altered. LRF mass ratio to the total fuel, boost pressure, and SOI were increased from 0.71 to 0.89, 1.58 to 2.22 bar, and −62.1 to 78.5 crank angel after top dead center (CAD aTDC), respectively.
The experimental data for the operating conditions to validate the computational methodology are listed in Table 2. The operating conditions were chosen to be avoid misfiring and unstable conditions in the engine, such as high unburned fuel and pressure rise rate, respectively.

3. Computational Methodology

In Figure 3, a schematic flowchart of the computational approach is depicted. The grey boxes indicate calculation of the essential parameters from the experimental data in MATLAB V2023. The experimental data were imported in this part, and the important parameters, such as in-cylinder average pressure trace, PFI fuel, DI fuel, air mass entering the cylinder, EGR percentage, pressure, and temperature in the intake and exhaust manifold were calculated. These parameters were then used to create and validate the one-dimensional model. Therefore, the one-dimensional model was first calibrated to achieve the same values of the aforementioned parameters in the experimental data. Once the validation of the 1D model was accomplished, the 3D model was designed using output data from the 1D model, which in essence are the initial in-cylinder conditions. The combined 1D/3D model was then validated against the experimental data for in-cylinder pressure, heat release trace, and emissions output. Finally, the validated model was used to carry out parametric study to achieve the optimum design addressing RCCI engine challenges. The influence of DI design parameters, including multiple injections and dual direct injection strategy, piston bowl geometry, EGR level, and boost pressure, was investigated. For each run, first, the 1D model was executed to determine the correct initial condition for the 3D model. The 3D model was then used to assess the effects of the design parameters, mostly focusing on fuel stratification visualized by contour of the local equivalence ratio (yellow box).
By testing the combined 1D/3D model, the complex interactions between different components of an engine can be understood better. While 1D models efficiently simulate the overall system performance and gas dynamics, they lack the spatial resolution needed to analyze localized phenomena within the combustion chamber. On the other hand, 3D models provide detailed insights into in-cylinder processes, such as turbulence, heat transfer, and chemical reactions, but are computationally expensive for simulating the entire engine system. By integrating the two approaches, it becomes possible to study the impact of component-level interactions, such as intake, exhaust, and combustion dynamics, on overall engine behavior, enabling a more comprehensive and efficient optimization of engine design and performance.

3.1. One-Dimensional Model

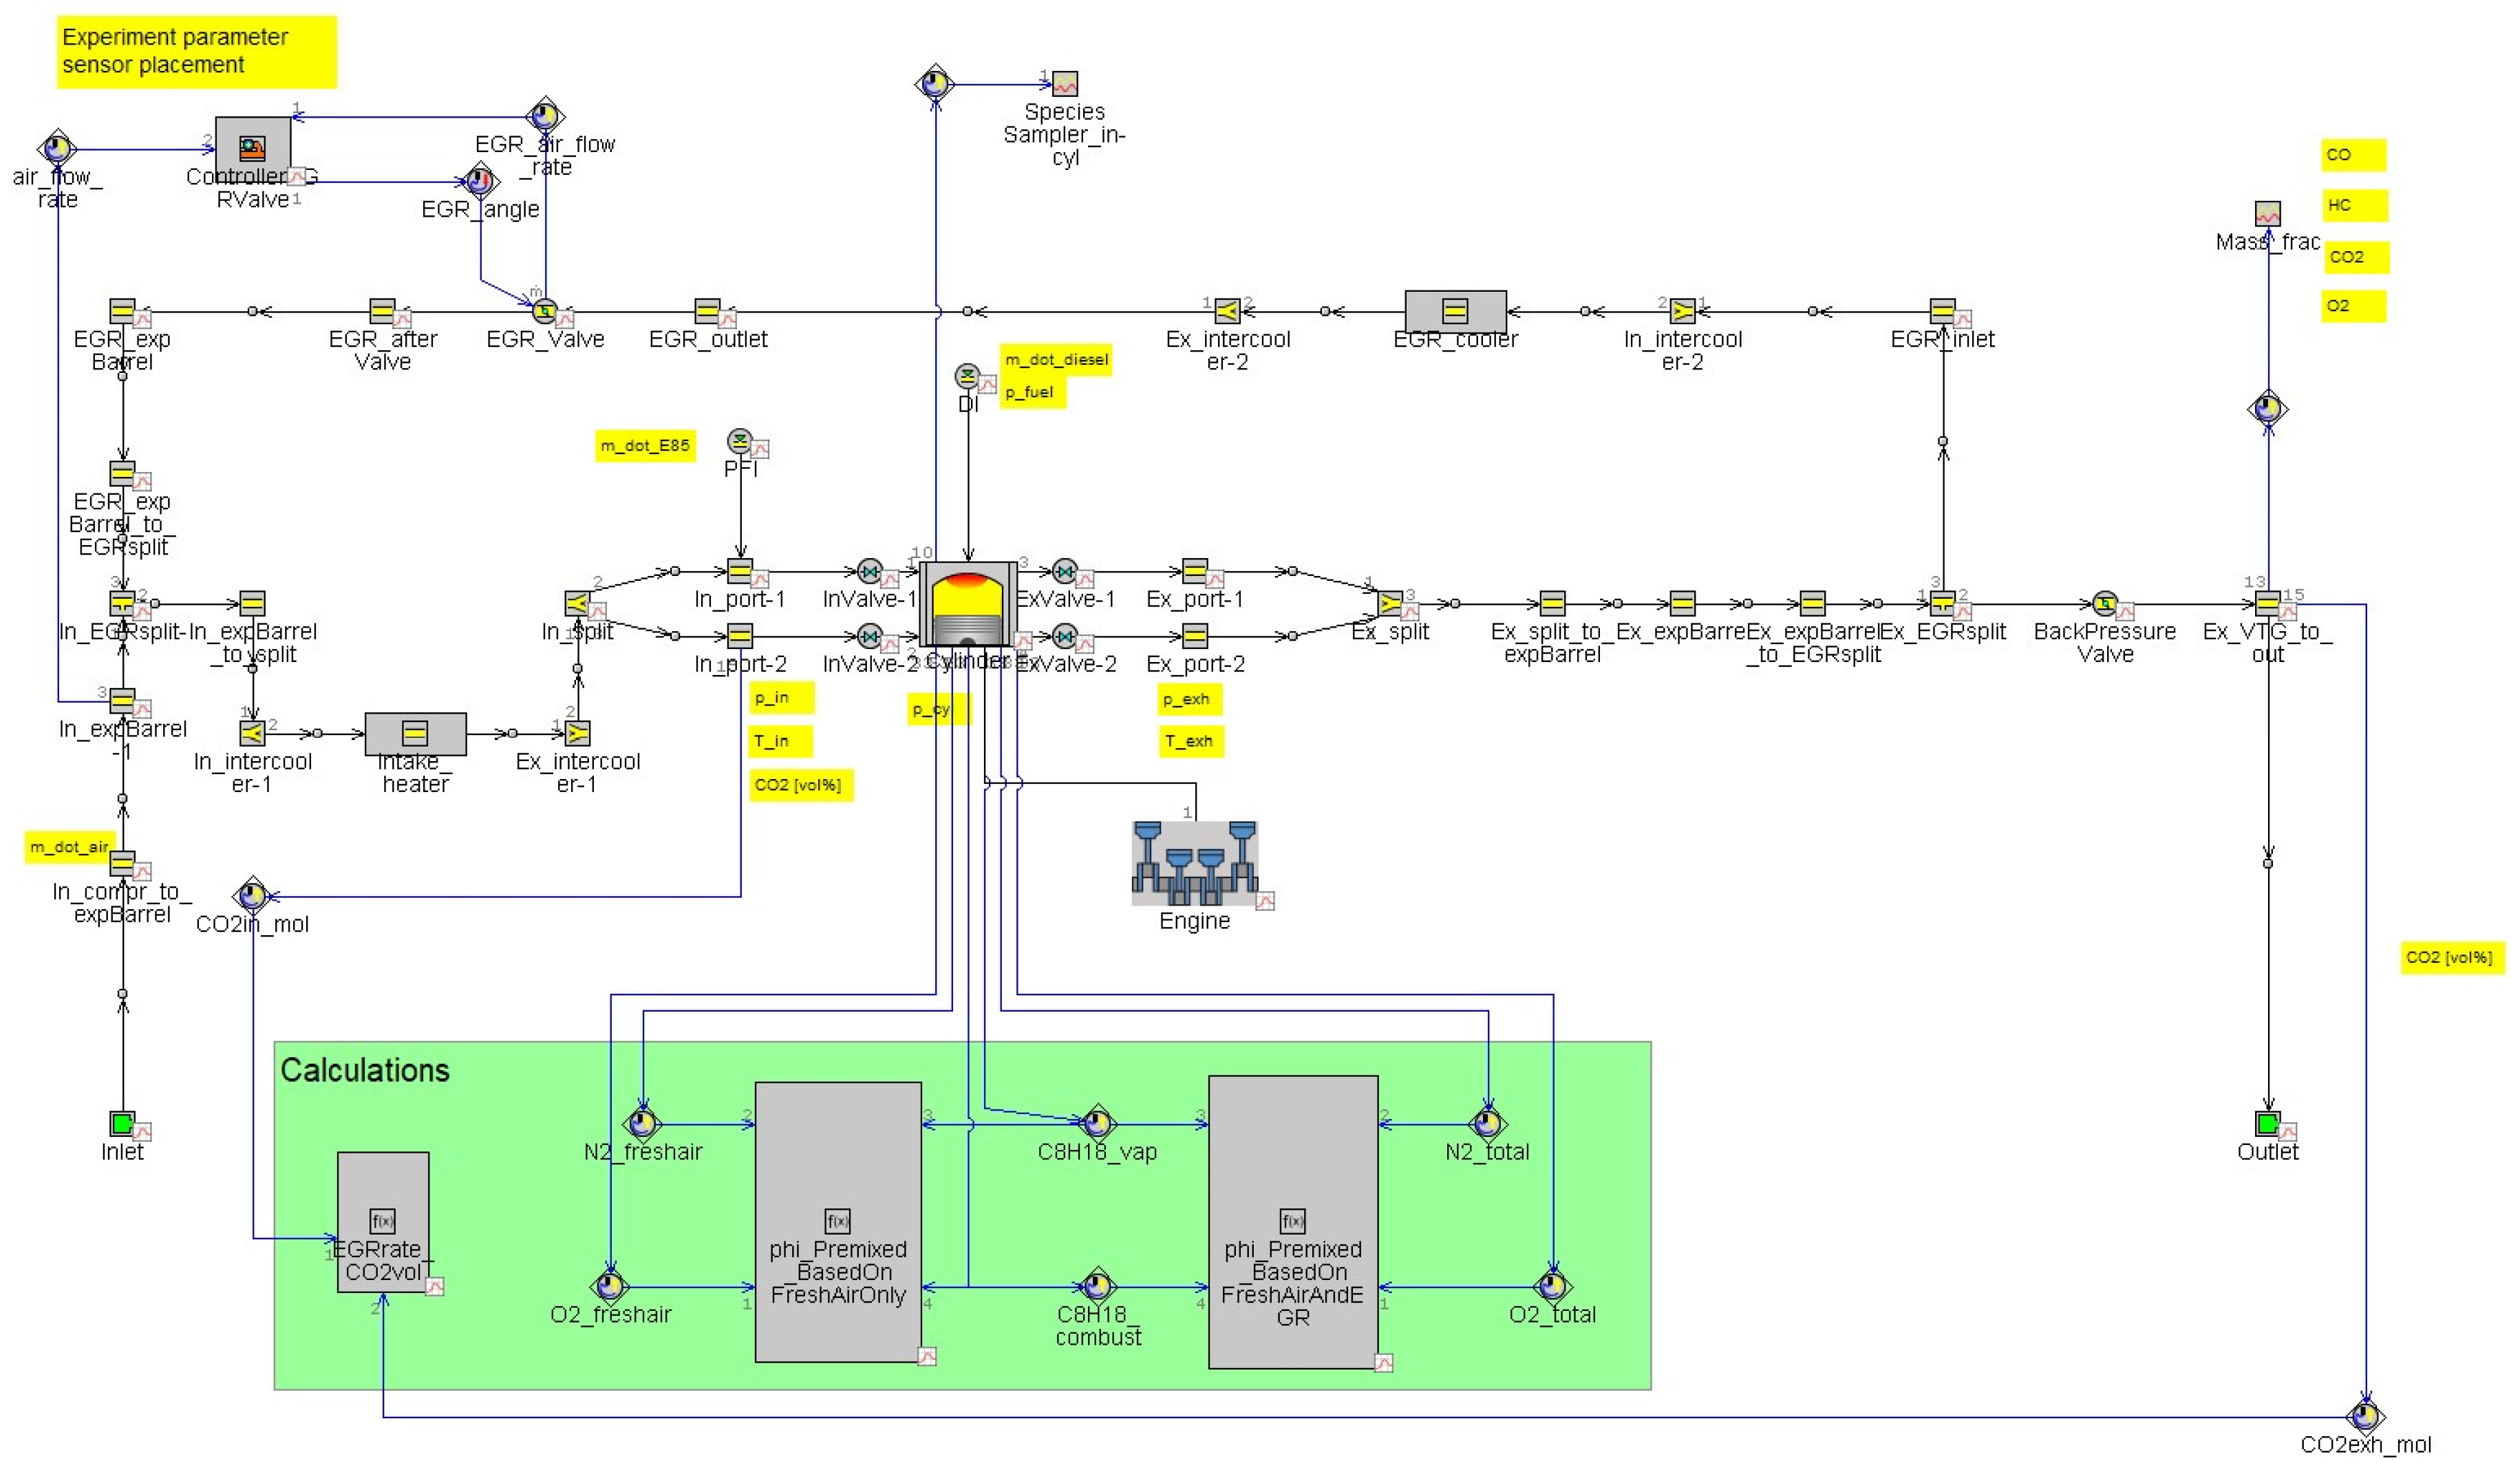
GT-Power V2023 was used to simulate the gas dynamics equations describing the flow and heat transfer in the piping and other flow components of the experimental setup. In the schematic in Figure 4, the 1D model is given. These equations are based on the Navier–Stokes equations, namely the conservation of continuity, momentum, and energy equations, and the discretization of the equations was performed according to the staggered grid approach [32].
To build the 1D model, including valves lift profiles, tube, pipe diameter, material of different components and lengths were measured from the engine test cell. For the heat transfer coefficient (hc), the correlation developed by Chang et al. [33] needed for low-temperature combustion engines was added. This results in a lower hc and decreased heat loss to the cylinder wall. However, some parameters, such as wall temperature of the engine’s components, valve and nozzle discharge coefficient [34], swirl ratio and initial turbulent parameters [35], and the fuel temperatures, are not known from the engine test setup and experimental data. The values for all these unknowns were found by an iterative process or an educated approximation based on the literature and example models from the software.
The yellow parts in the figure show the locations where experimental data were collected during the engine test setup. The 1D model was run for multiple cycles to match the experimental data, including the in-cylinder pressure trace, PFI and DI fuel quantities, air mass entering the cylinder, EGR percentage, and the pressure and temperature in both the intake and exhaust manifolds. An EGR control valve was employed to regulate the EGR valve to achieve the desired EGR percentage within the cylinder. The large green box contains mathematical equations. The first box calculates the EGR rate using the same methodology as the experiments. The other two boxes calculate the equivalence ratio: one based on the fresh intake charge alone and the other accounting for both the fresh intake charge and EGR flow.
Iso-octane and n-heptane were used to resemble gasoline and diesel [36]. The reactivity for these fuels is similar to the fuels used in the experiment. The equivalence ratio of the in-cylinder charge was slightly adjusted to have the same value as the experimental data. The total fuel energy was kept the same as the fuels used in the experiments. According to Equation (1), the total fuel energy Ei is related to the fuel mass mi and fuel lower heating value LHVi.
Ei = mi·LHVi

3.2. Three-Dimensional Model

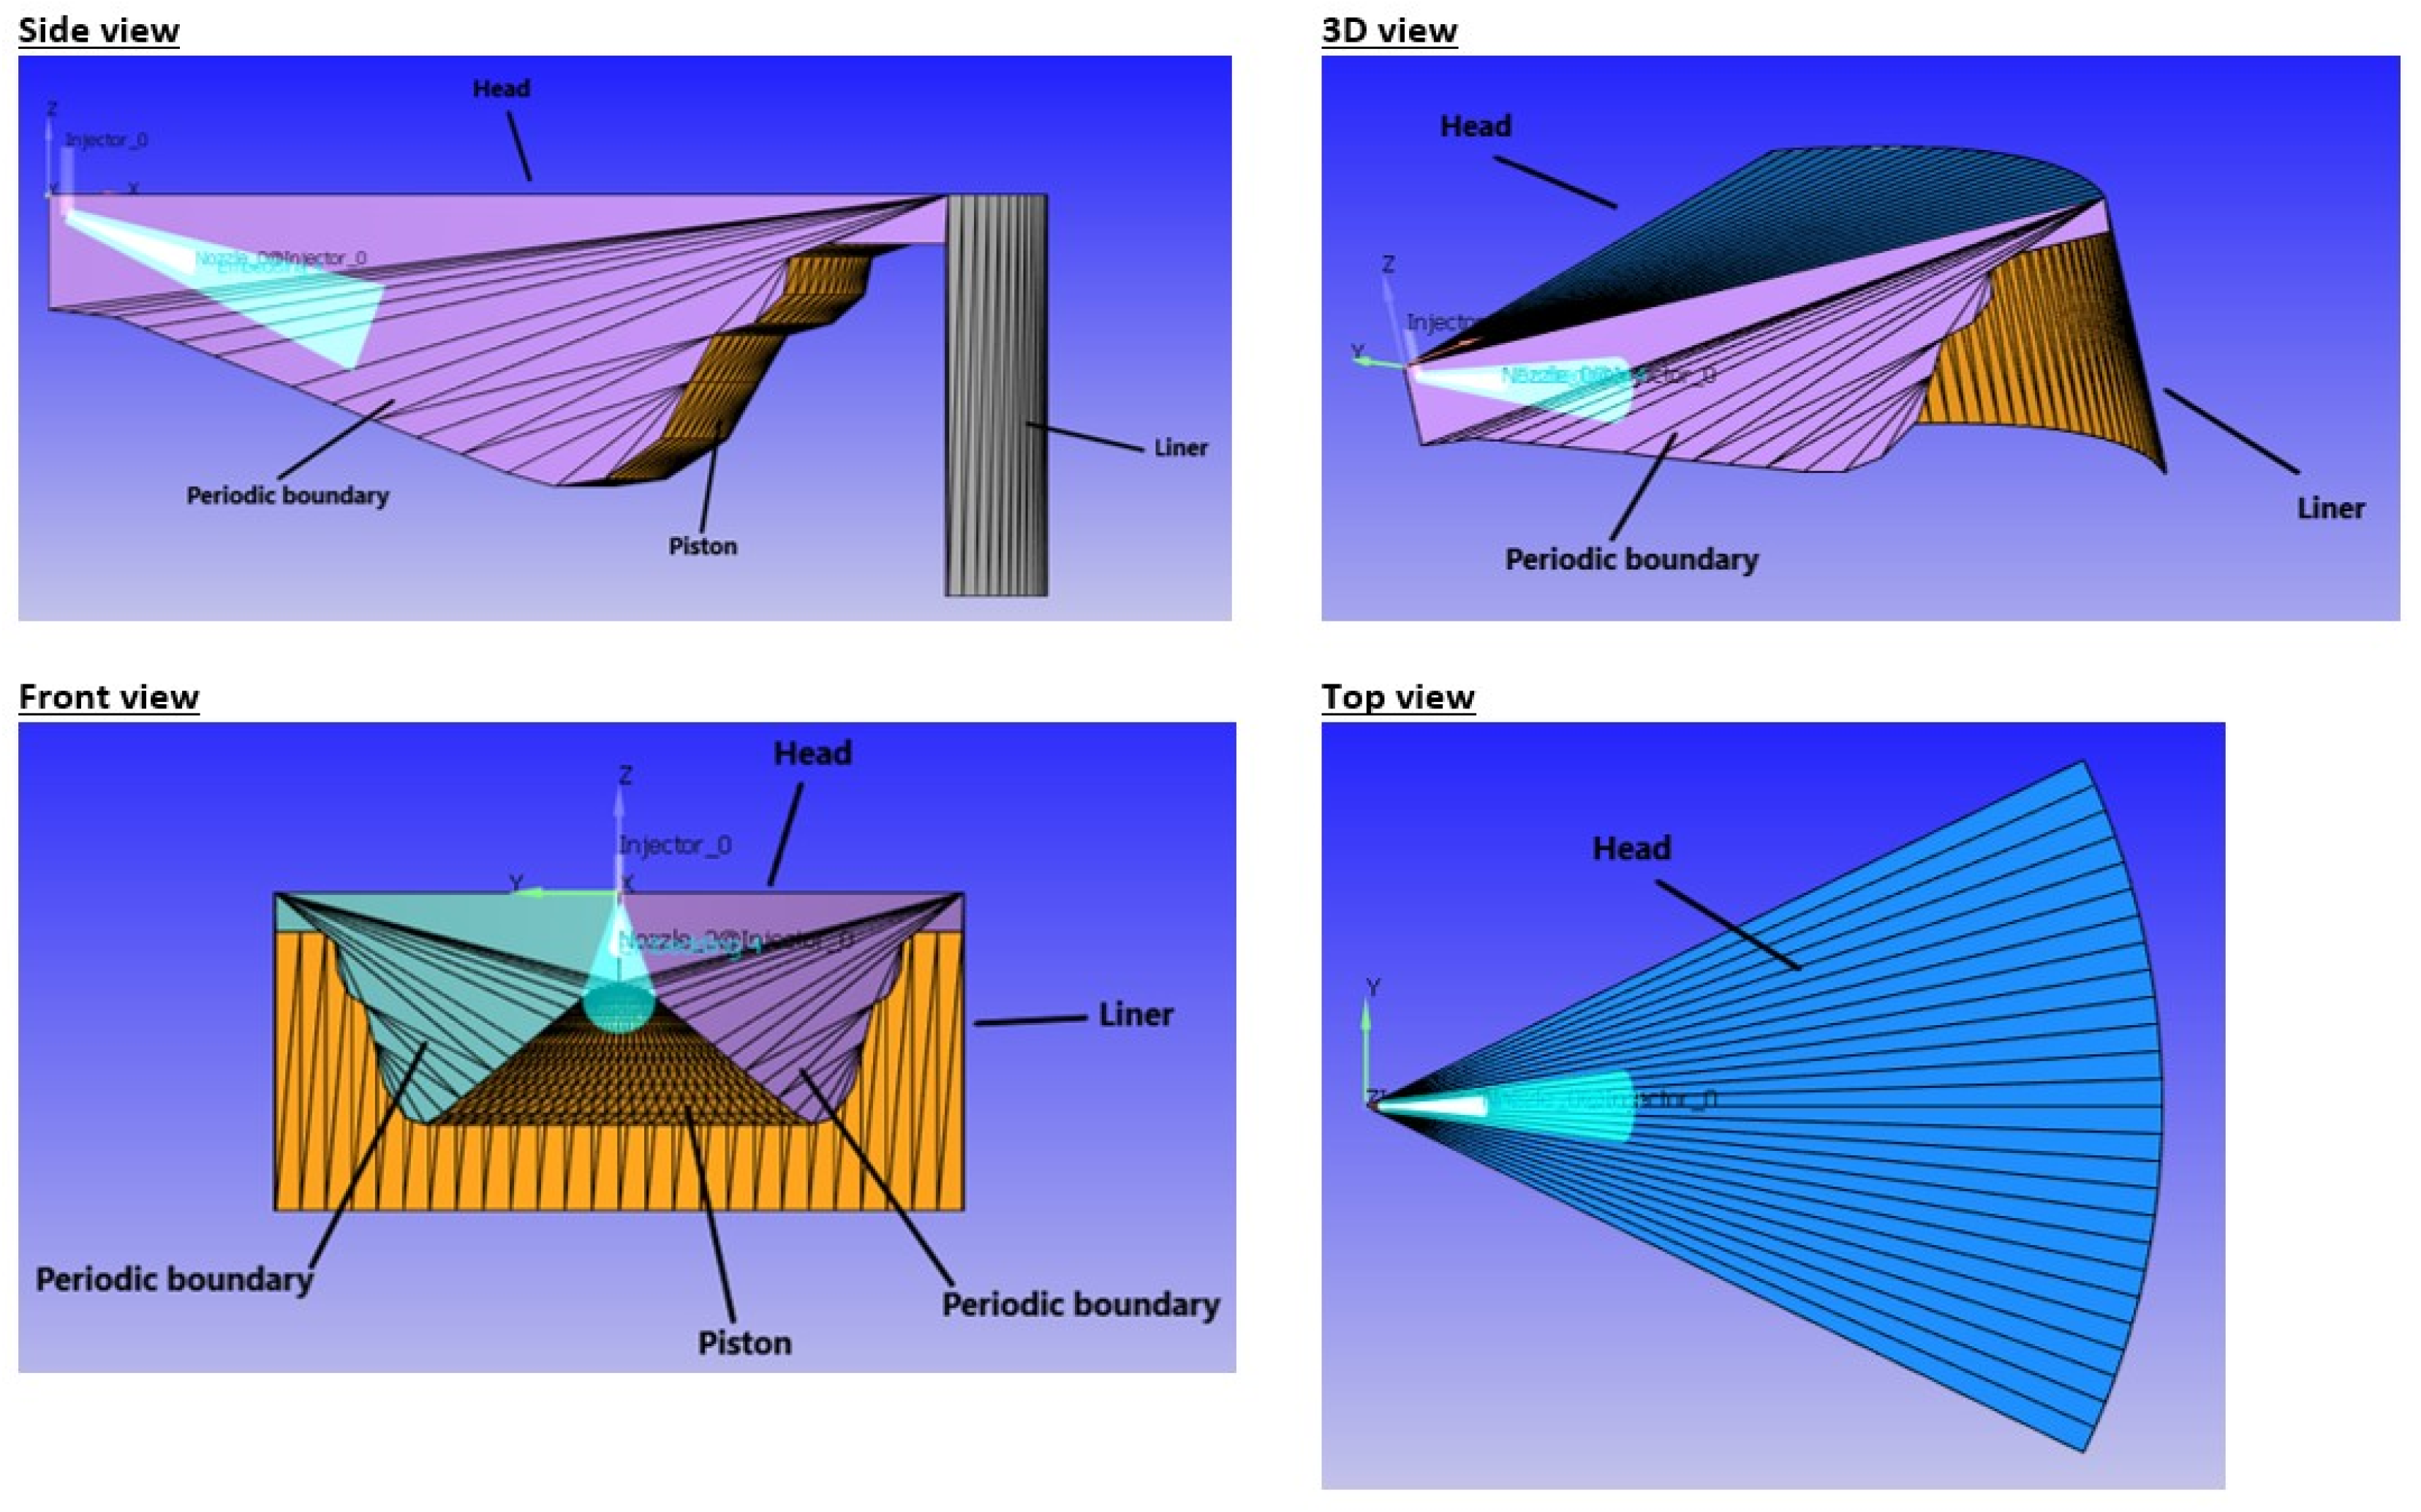
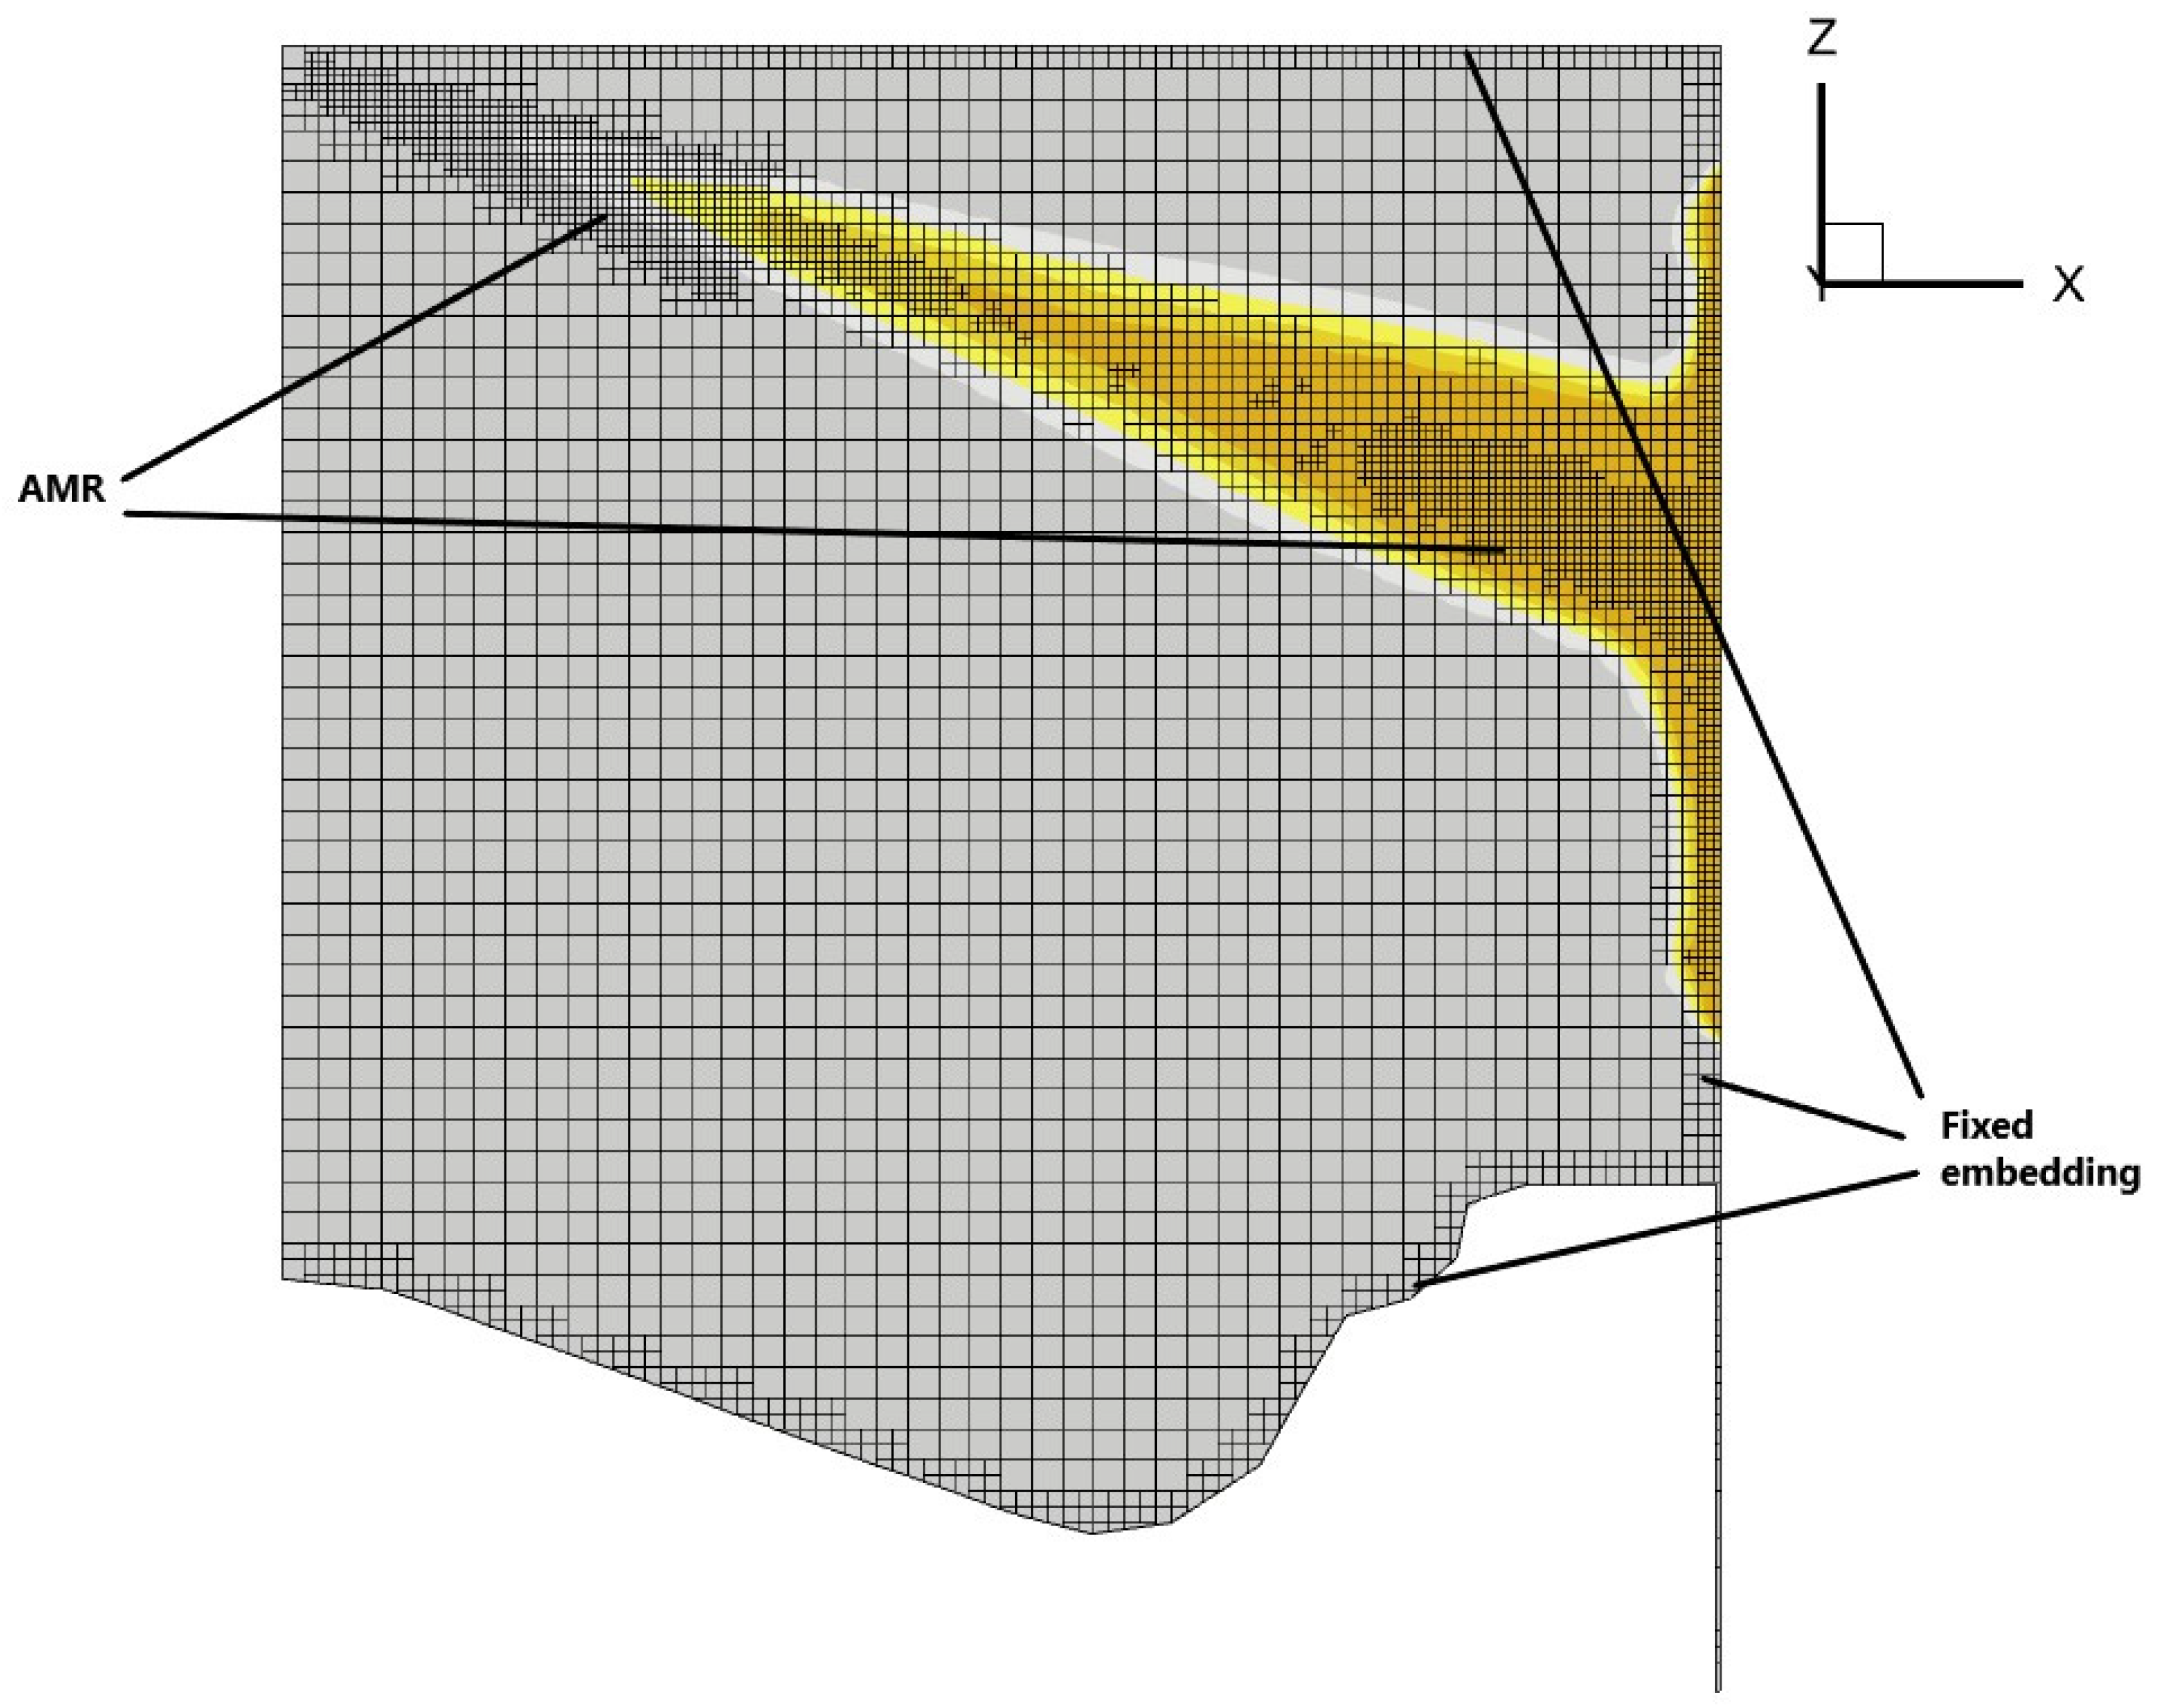
CONVERGE version 3.1 was used for solving conservation equations governing the CFD modeling of the fluid flow inside the cylinder. The capability of CONVERGE software has been demonstrated in many recent research works on dual-fuel engines, including RCCI engines [37,38]. Given that the injector has seven equally distributed holes in the middle of the cylinder, the domain can be divided into seven identical parts. This simplification was explained in detail in [39]. Figure 5 shows the engine sector that was simulated. To reach a grid-independent solution, adaptive mesh refinement (AMR) and fixed embedding features were used in certain zones inside the cylinder, as depicted in Figure 6. The mesh was refined in the wall boundary zones using a fixed embedding feature. Additionally, areas where adaptive mesh refinement (AMR) was applied can be observed, particularly in the spray region and the area where the spray impacts the cylinder liner. These features enhance result accuracy while reducing computational time by dynamically adjusting the mesh size in specific regions. Still, a base mesh grid size was defined as 1.4 × 1.4 × 1.4 mm. Also, finer base sizes were tested to be sure that the results were mesh-independent.
Adaptive zoning [40] was employed to accelerate chemical calculations by grouping similar computational cells and solving the chemistry for the entire group collectively. Additional computational efficiency was achieved by skipping temperature calculations unless the temperature change from combustion in a cell exceeded a predefined threshold, which was set to 2 kelvin by default in CONVERGE.
The initial temperature, pressure, and species mass fractions for the CFD model were extracted using the 1D model. Additionally, the simulation required turbulent kinetic energy (k) and turbulent dissipation (ε). These values were not directly provided by the 1D model, as it only outputs the normalized turbulent intensity within the cylinder. The normalized intensity at IVC was then used to calculate k and ε [41]. The Reynolds-averaged Navier–Stokes (RANS) renormalization group (RNG) turbulence model [42] was utilized to ensure accurate results by enhancing the mixing rates of momentum, energy, and species. Previous studies have shown that the RNG model offers a good balance between computational efficiency and the accurate prediction of key engine performance parameters [43,44]. CONVERGE includes a validated preset for this model, and in this study, the default settings for the RNG k-ε turbulence model were used.
For chemical mechanisms in the 3D model, diesel fuel was replaced with n-heptane due to its similar chemical properties, while predefined diesel spray settings were used for the spray’s physical properties. The reduced kinetic mechanism developed by Hu et al. [45], containing 73 species and 296 reactions, was used for kinetic modeling of combustion. The SAGE detailed chemical kinetics solver [46] was used to model the different combustion regimes in RCCI engines. The Hiroyasu–NSC model [47] and the extended Zel’dovich mechanism [48] were used for soot and NOx formation prediction.
Models for different phases of spray events were incorporated into the spray model, including discharge, liquid jet breakup, spray particle collisions, and fuel evaporation, and they are summarized in Table 3.
The spray cone angle was derived from the experimental data using the Siebers correlation for vaporizing spray [55]:
tan θ 2 = 0.27 ρ in - cyl ρ inj 0.19 0.0043 ρ inj ρ in - cyl 0.5
where θ is the spray cone angle, ρin-cyl is the in-cylinder gas mixture density at start of injection, and ρinj is the DI fuel density in the common rail. The value for ρin-cyl is interpolated and calculated from the measured experimental in-cylinder pressure using the ideal gas law defined in Equation (3).
ρ in - cyl = p in - cyl R in - cyl T in - cyl
where pin-cyl is the in-cylinder pressure at SOI, Rin-cyl is the specific gas constant (e.g., cp-cv)) at SOI, and Tin-cyl is the in-cylinder temperature at SOI.

3.3. Model Validation

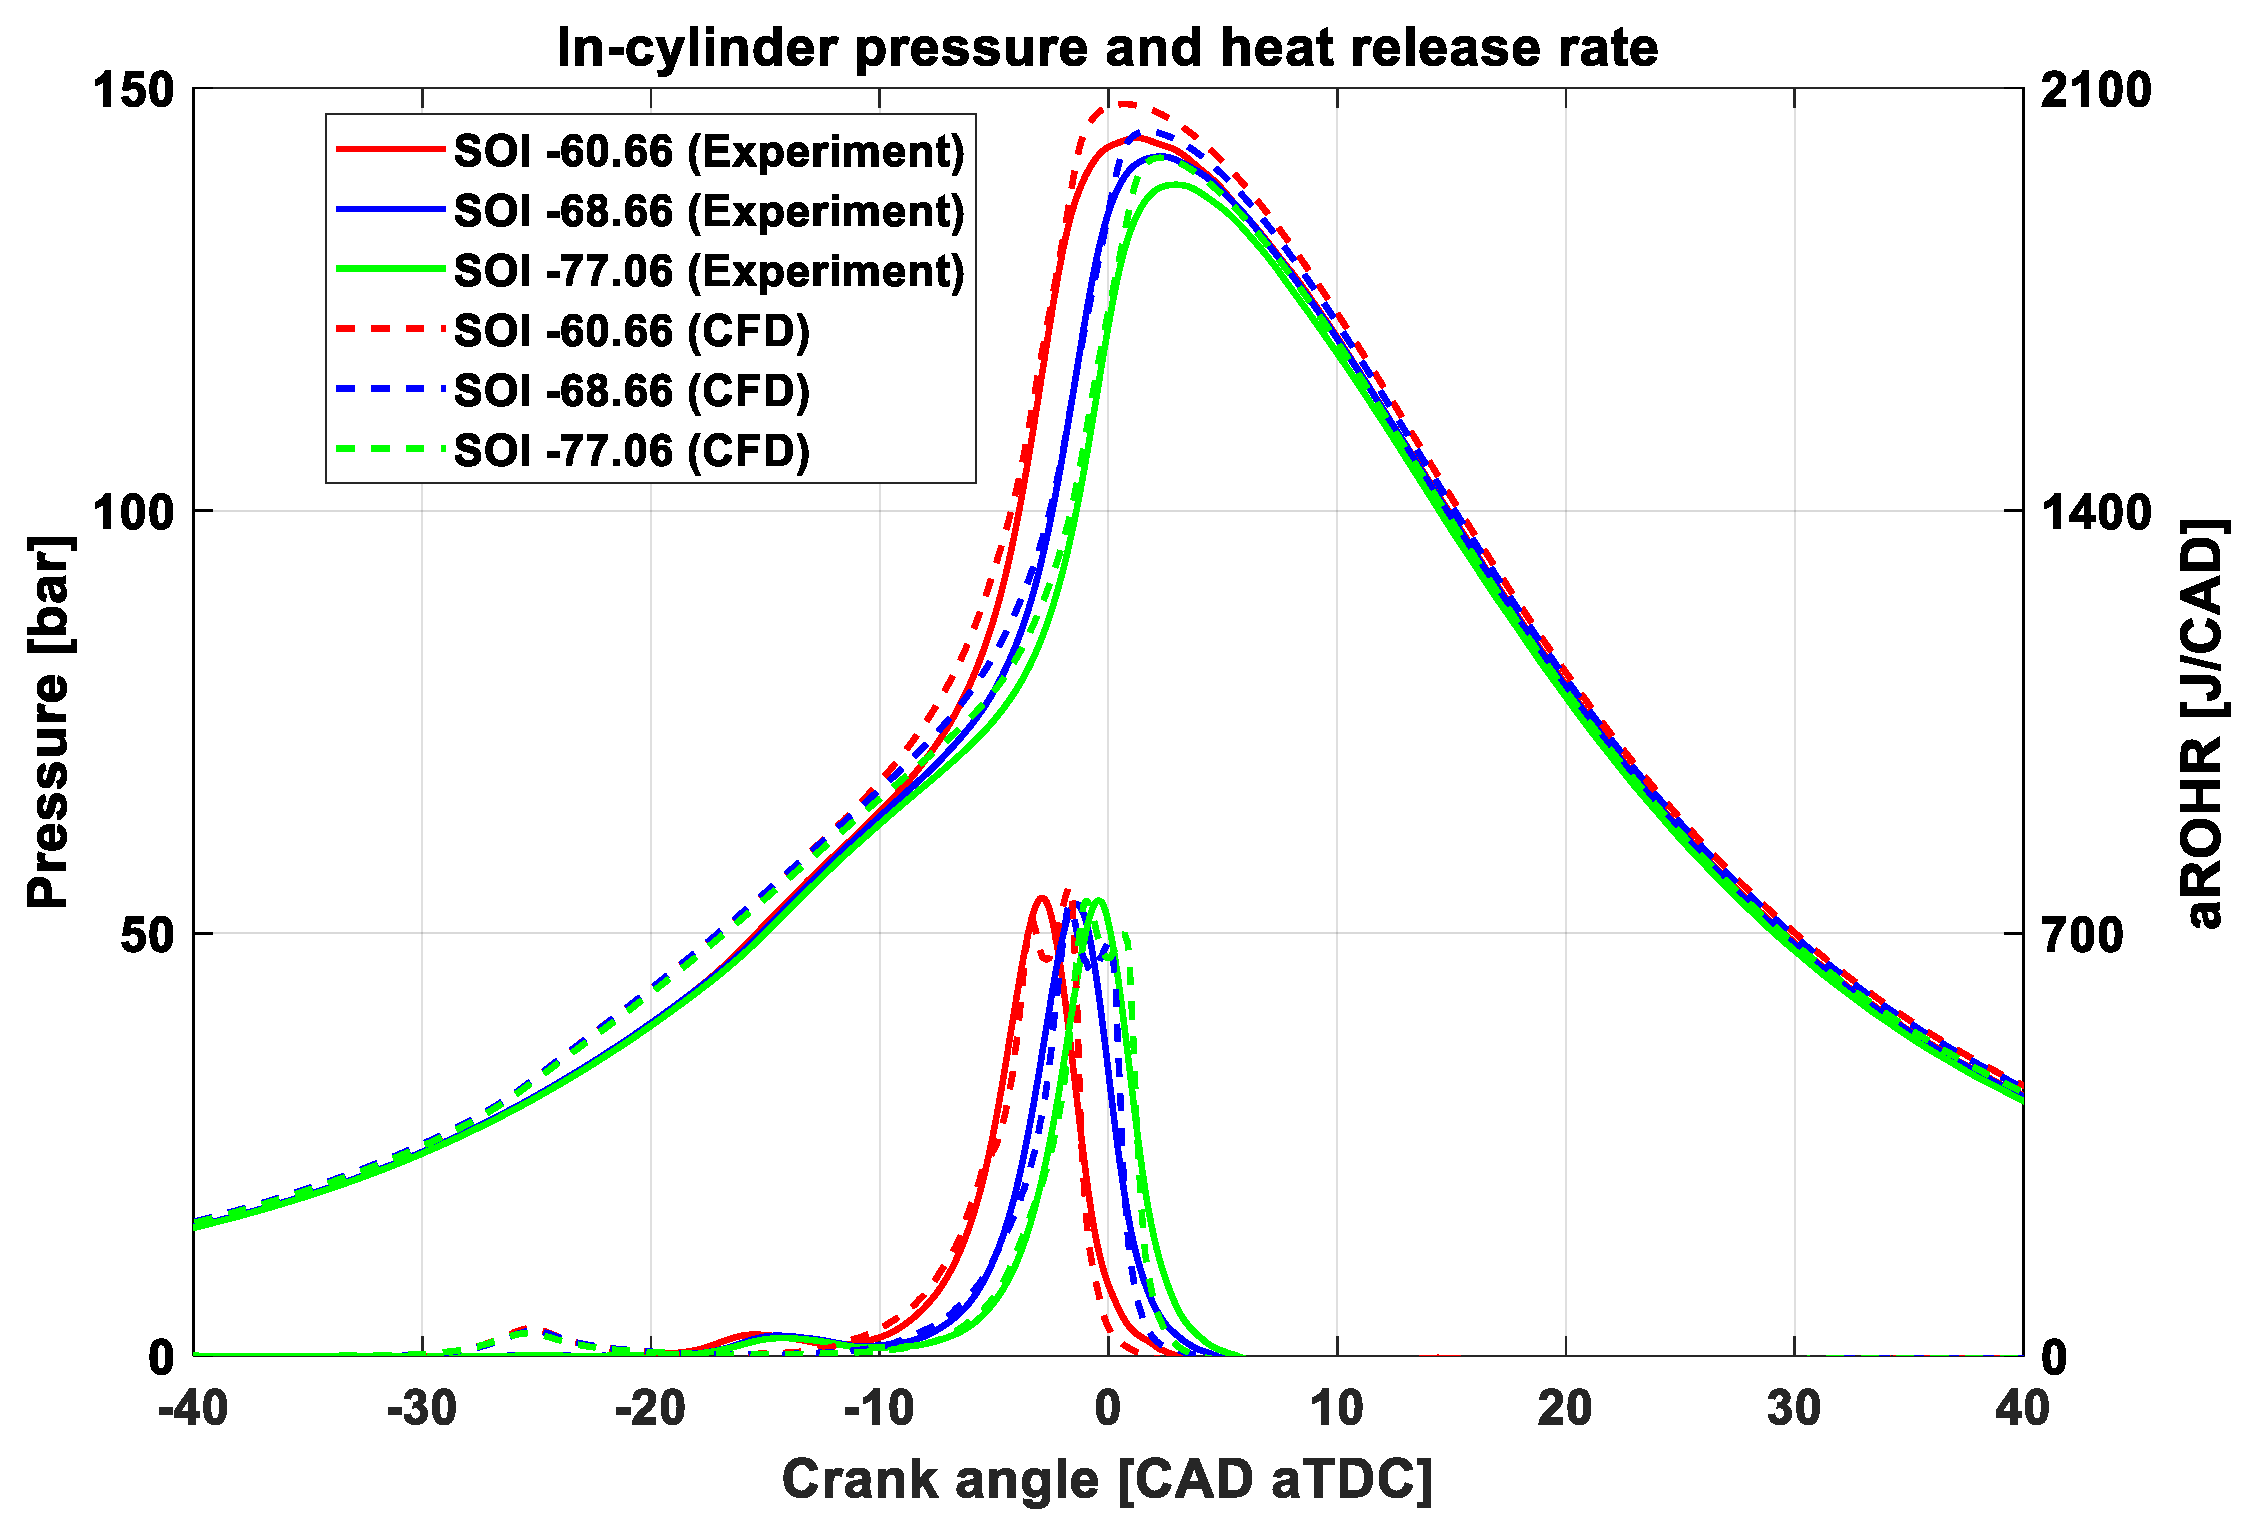
Figure 7 compares the simulation results of the in-cylinder pressure trace and apparent rate of heat release (aROHR) with experimental data for three different SOI timings. The SOI sweep serves as a valuable reference for validating typical RCCI engine behavior since it shows a different trend compared to conventional diesel combustion (CDC) engines. The figure shows that the simulated 3D model accurately captures this behavior and aligns well with experimental results. However, two key differences are observed. First, starting around −28 CAD aTDC, the 3D model predicts a higher pressure, attributed to the reduced chemical mechanism, as noted in [45], which causes an earlier low-temperature heat release (occurring between −28 CAD aTDC and −23 CAD aTDC). In contrast, the experimental data show this release occurring later, between −17 CAD aTDC and −12 CAD aTDC. Despite this, the high-temperature heat release closely matches the experimental data. The second difference observed is in the maximum pressure between the experimental and CFD data. This discrepancy is again linked to the earlier low-temperature heat release in the CFD results, which causes a slightly higher overall in-cylinder pressure.
Figure 8a displays the emissions data, where differences are noted between the experimental and CFD emissions values. Exact emission predictions are challenging due to the use of reduced chemical mechanisms and the uncertainties discussed earlier. However, for validating the 3D model, it is essential to compare the trends during the SOI sweep rather than absolute values. In the experimental data, NOx formation decreases with earlier SOI. This occurs because earlier SOI allows the DI fuel more time to mix, reducing the local equivalence ratio and lowering the local combustion temperature, resulting in lower NOx emissions. Additionally, the extended mixing time from earlier SOI enables more evaporation of DI fuel, further cooling the gas mixture. This same trend is observed in the combined model’s results.
For HC and CO emissions, the opposite trend is seen. Advancing the SOI leads to increased emissions. Earlier SOI causes more fuel to become trapped in the cylinder’s crevice region, leaving more unburned hydrocarbons after combustion. Furthermore, the increased mixing time lowers the local equivalence ratio of the gas mixture, leading to higher CO emissions. This trend is also reflected in the CFD data, indicating that the 3D model replicates the combustion behavior observed in the experimental engine.
It should be noted that the experimental data for soot emission are missing and not reported here. However, it has been shown that the soot model mentioned earlier is sufficient to capture the emission trend while varying the design parameters [56,57]. In Figure 8b, the scaled emission comparison between CFD and experimental results is represented (with root mean square error of 0.0724, 1.1140, 1.0768 for NOx, HC, and CO, respectively). This shows that the tendency is predicted well (perfect prediction is represented by the dashed line). The relative increase in NOx and HC is higher than in the experiment, whereas for CO, it is lower. Still, the trends are captured.
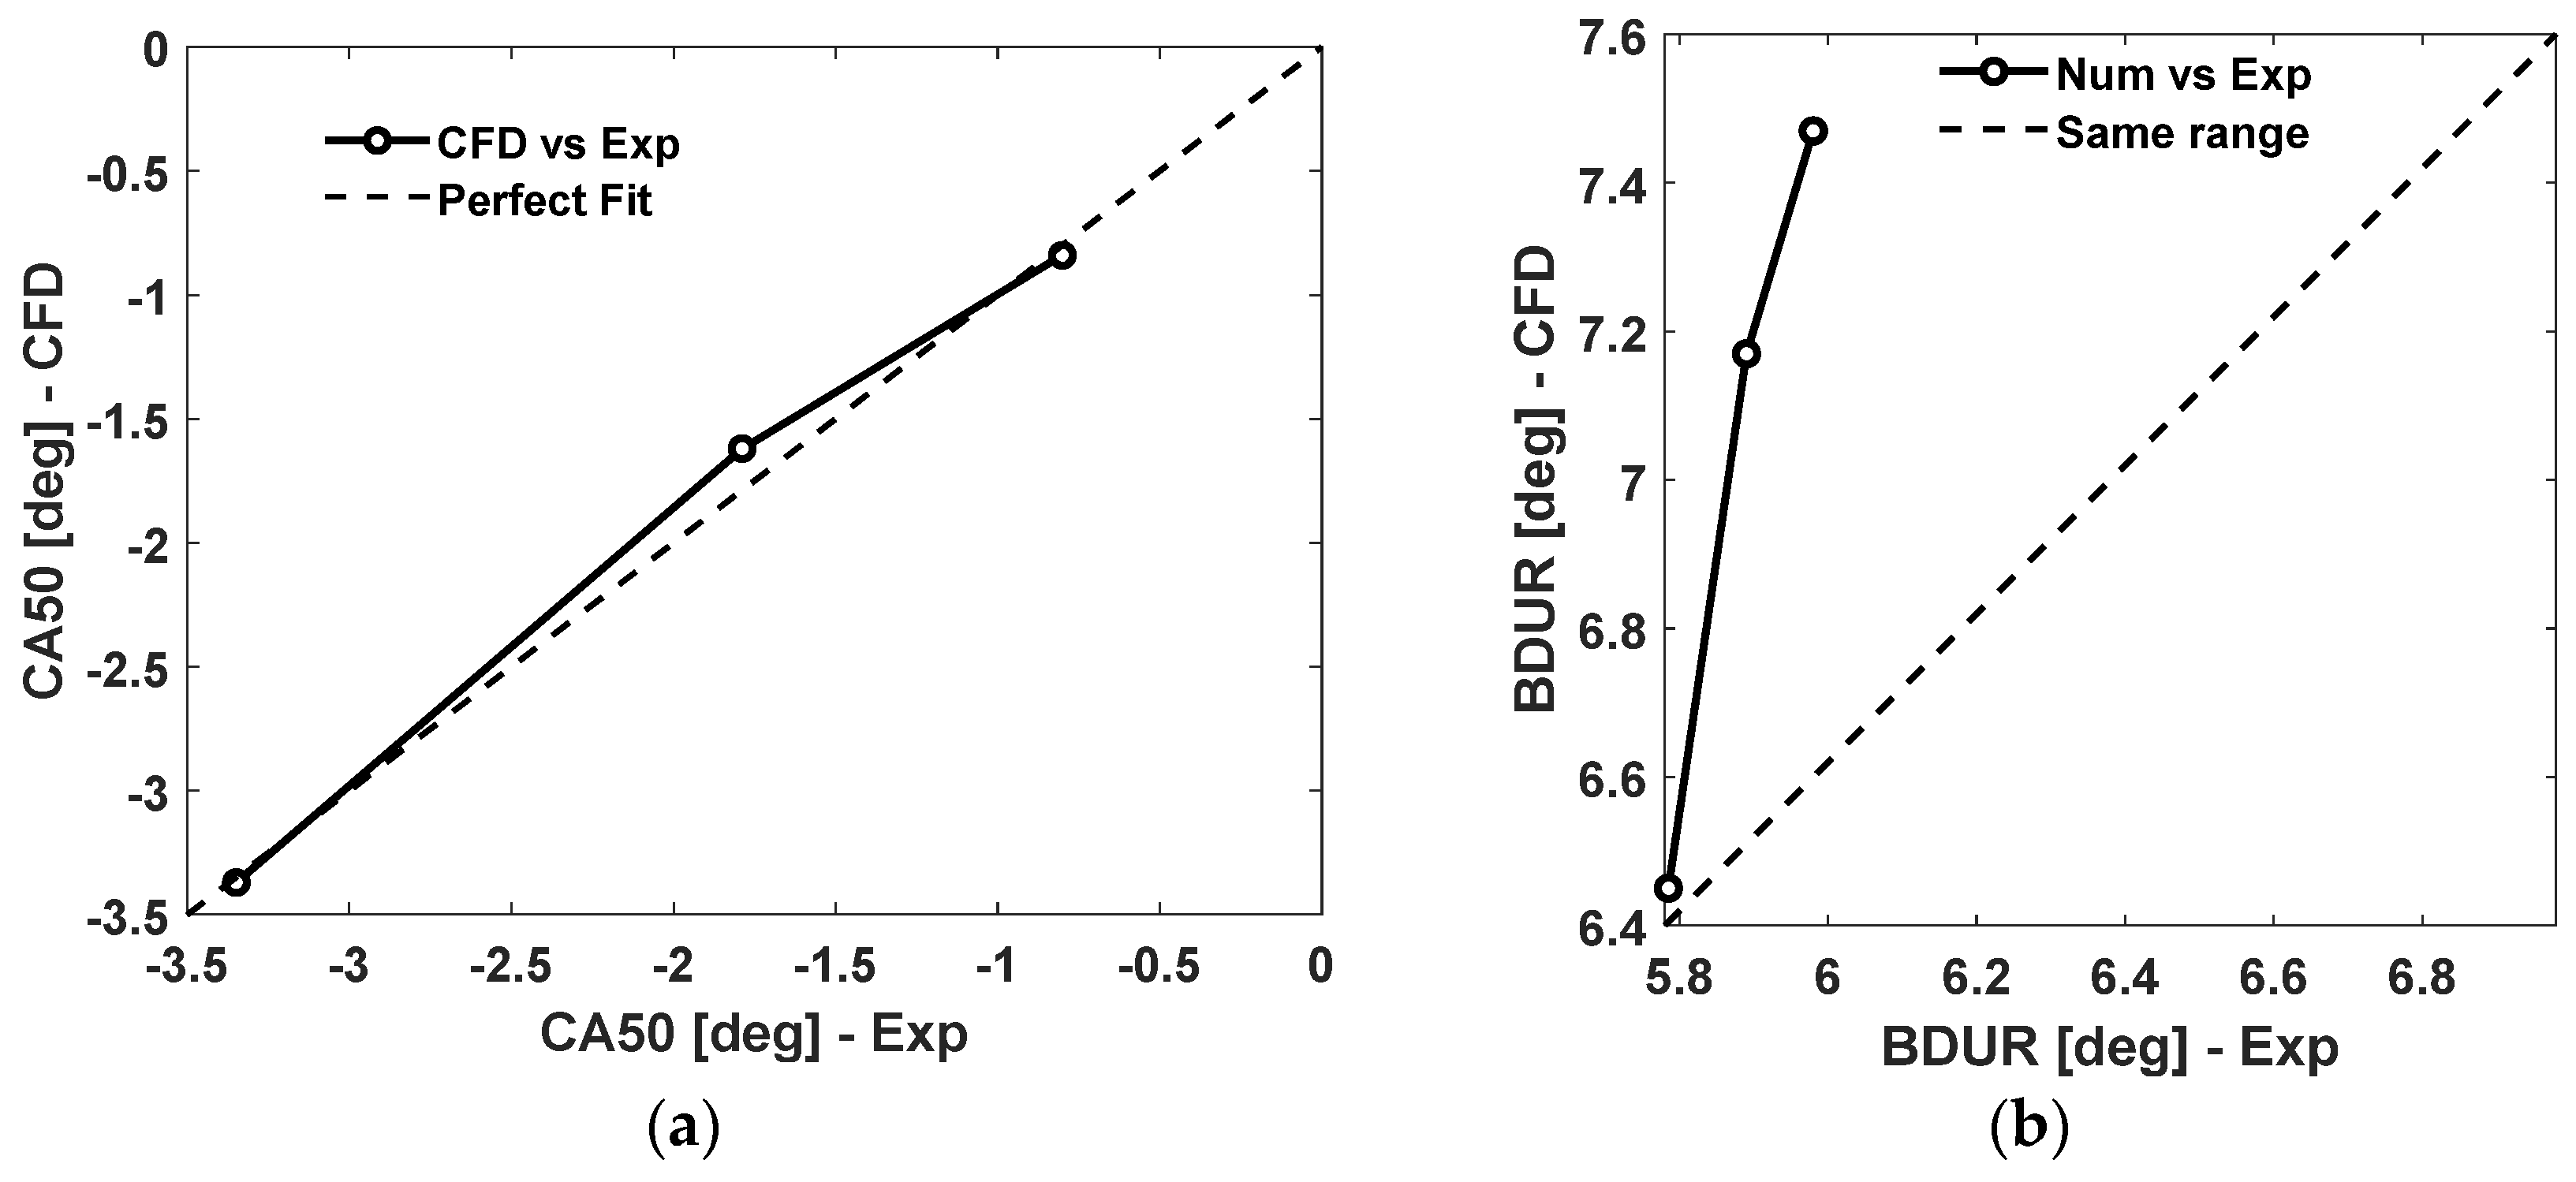
Table 4 reports the relative errors (RE) of the values predicted by the model. There is only a slight deviation between the MPRR and ringing intensity (RI) [58] of the experimental and CFD data. The relative error for the CA50 is relatively large sometimes, as it is close to TDC (zero value). Hence, even a deviation of 0.15 degrees (SOA –70.1) yields relatively high numbers. In fact, the relative error in the prediction of the ignition delay (CA50-SOA) yields a relative error of 0.2%. More important is the prediction of the trend for CA50, which is excellent, as is clear from the aROHR curves in Figure 7 and Figure 9a.
Lastly, the burn duration (BD) shows higher relative error values. In general, the combustion takes more time in the 3D model as compared to the experimental data. The trend is the same, where an advanced SOI leads to a shorter BD, but the effect is larger than observed in the experiment (Figure 9b).

4. Results and Discussion

In this section, the validated model is used to study the effects of the changing design parameters, including piston bowl profile, EGR, and a multiple-injections strategy (e.g., dual direct injection, two and three DI pulses, and fuel pressure distribution between the pulses) on the performance and emissions of the RCCI engine.

4.1. Effect of Piston Bowl Profile

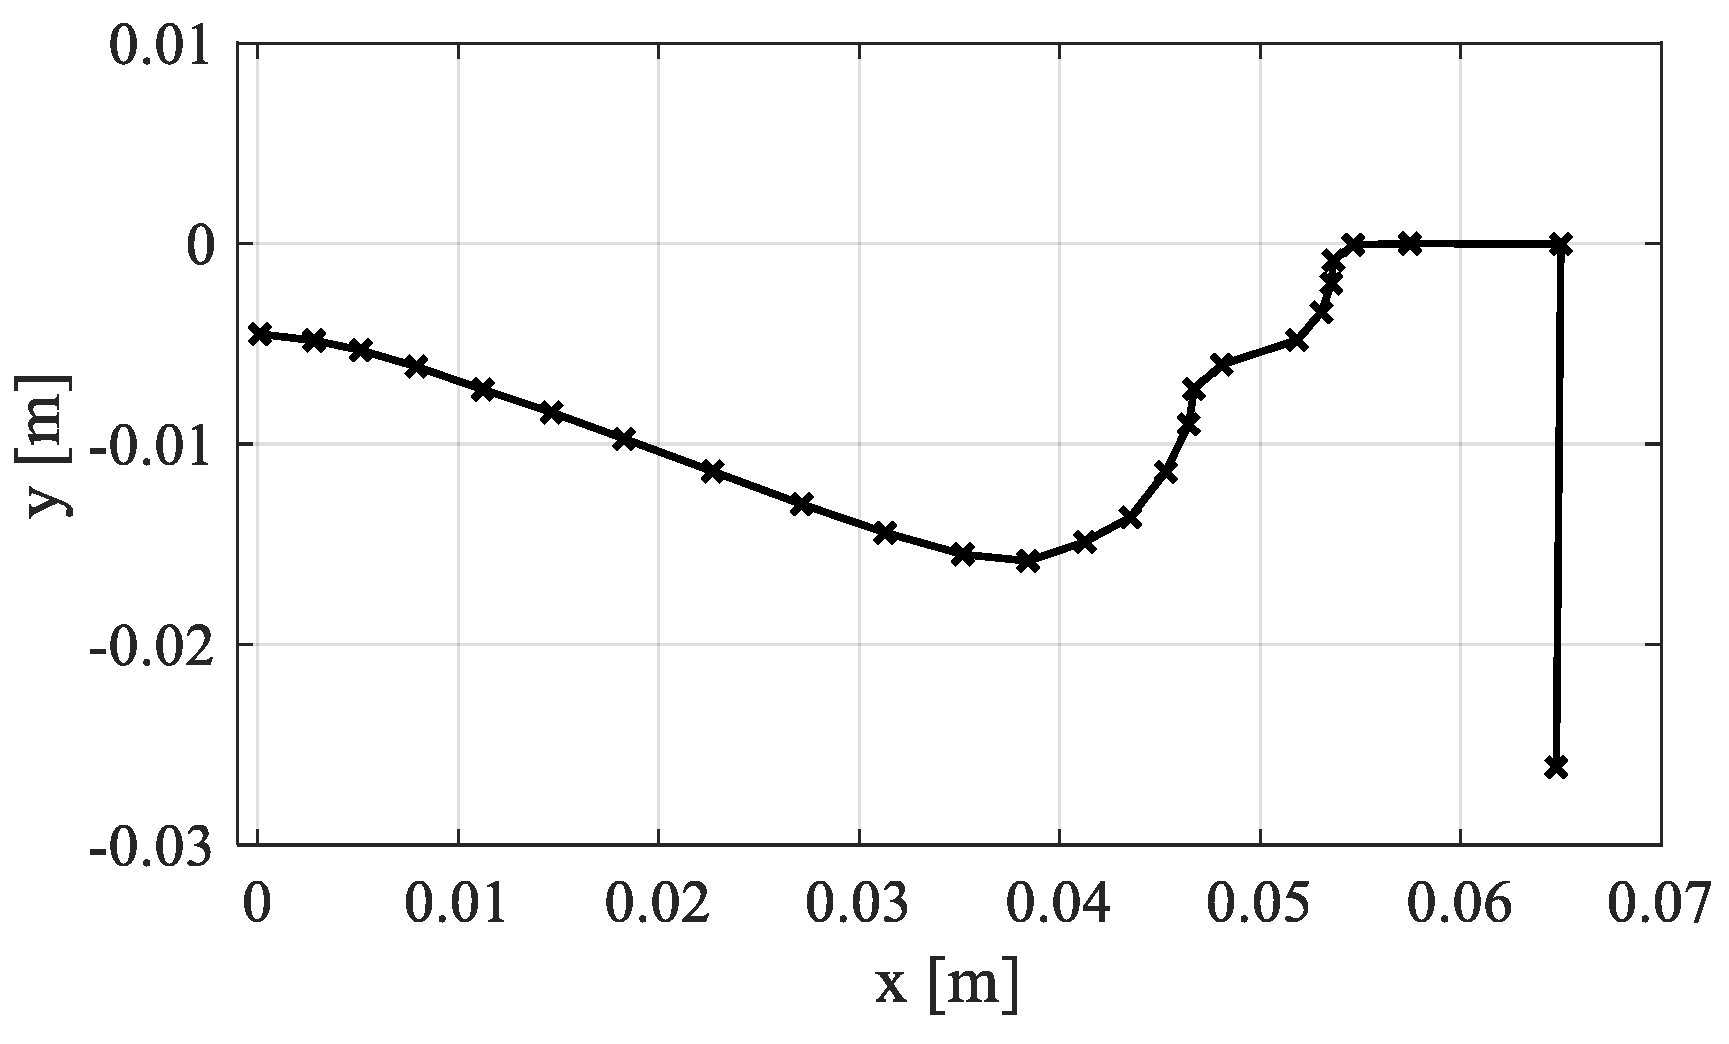
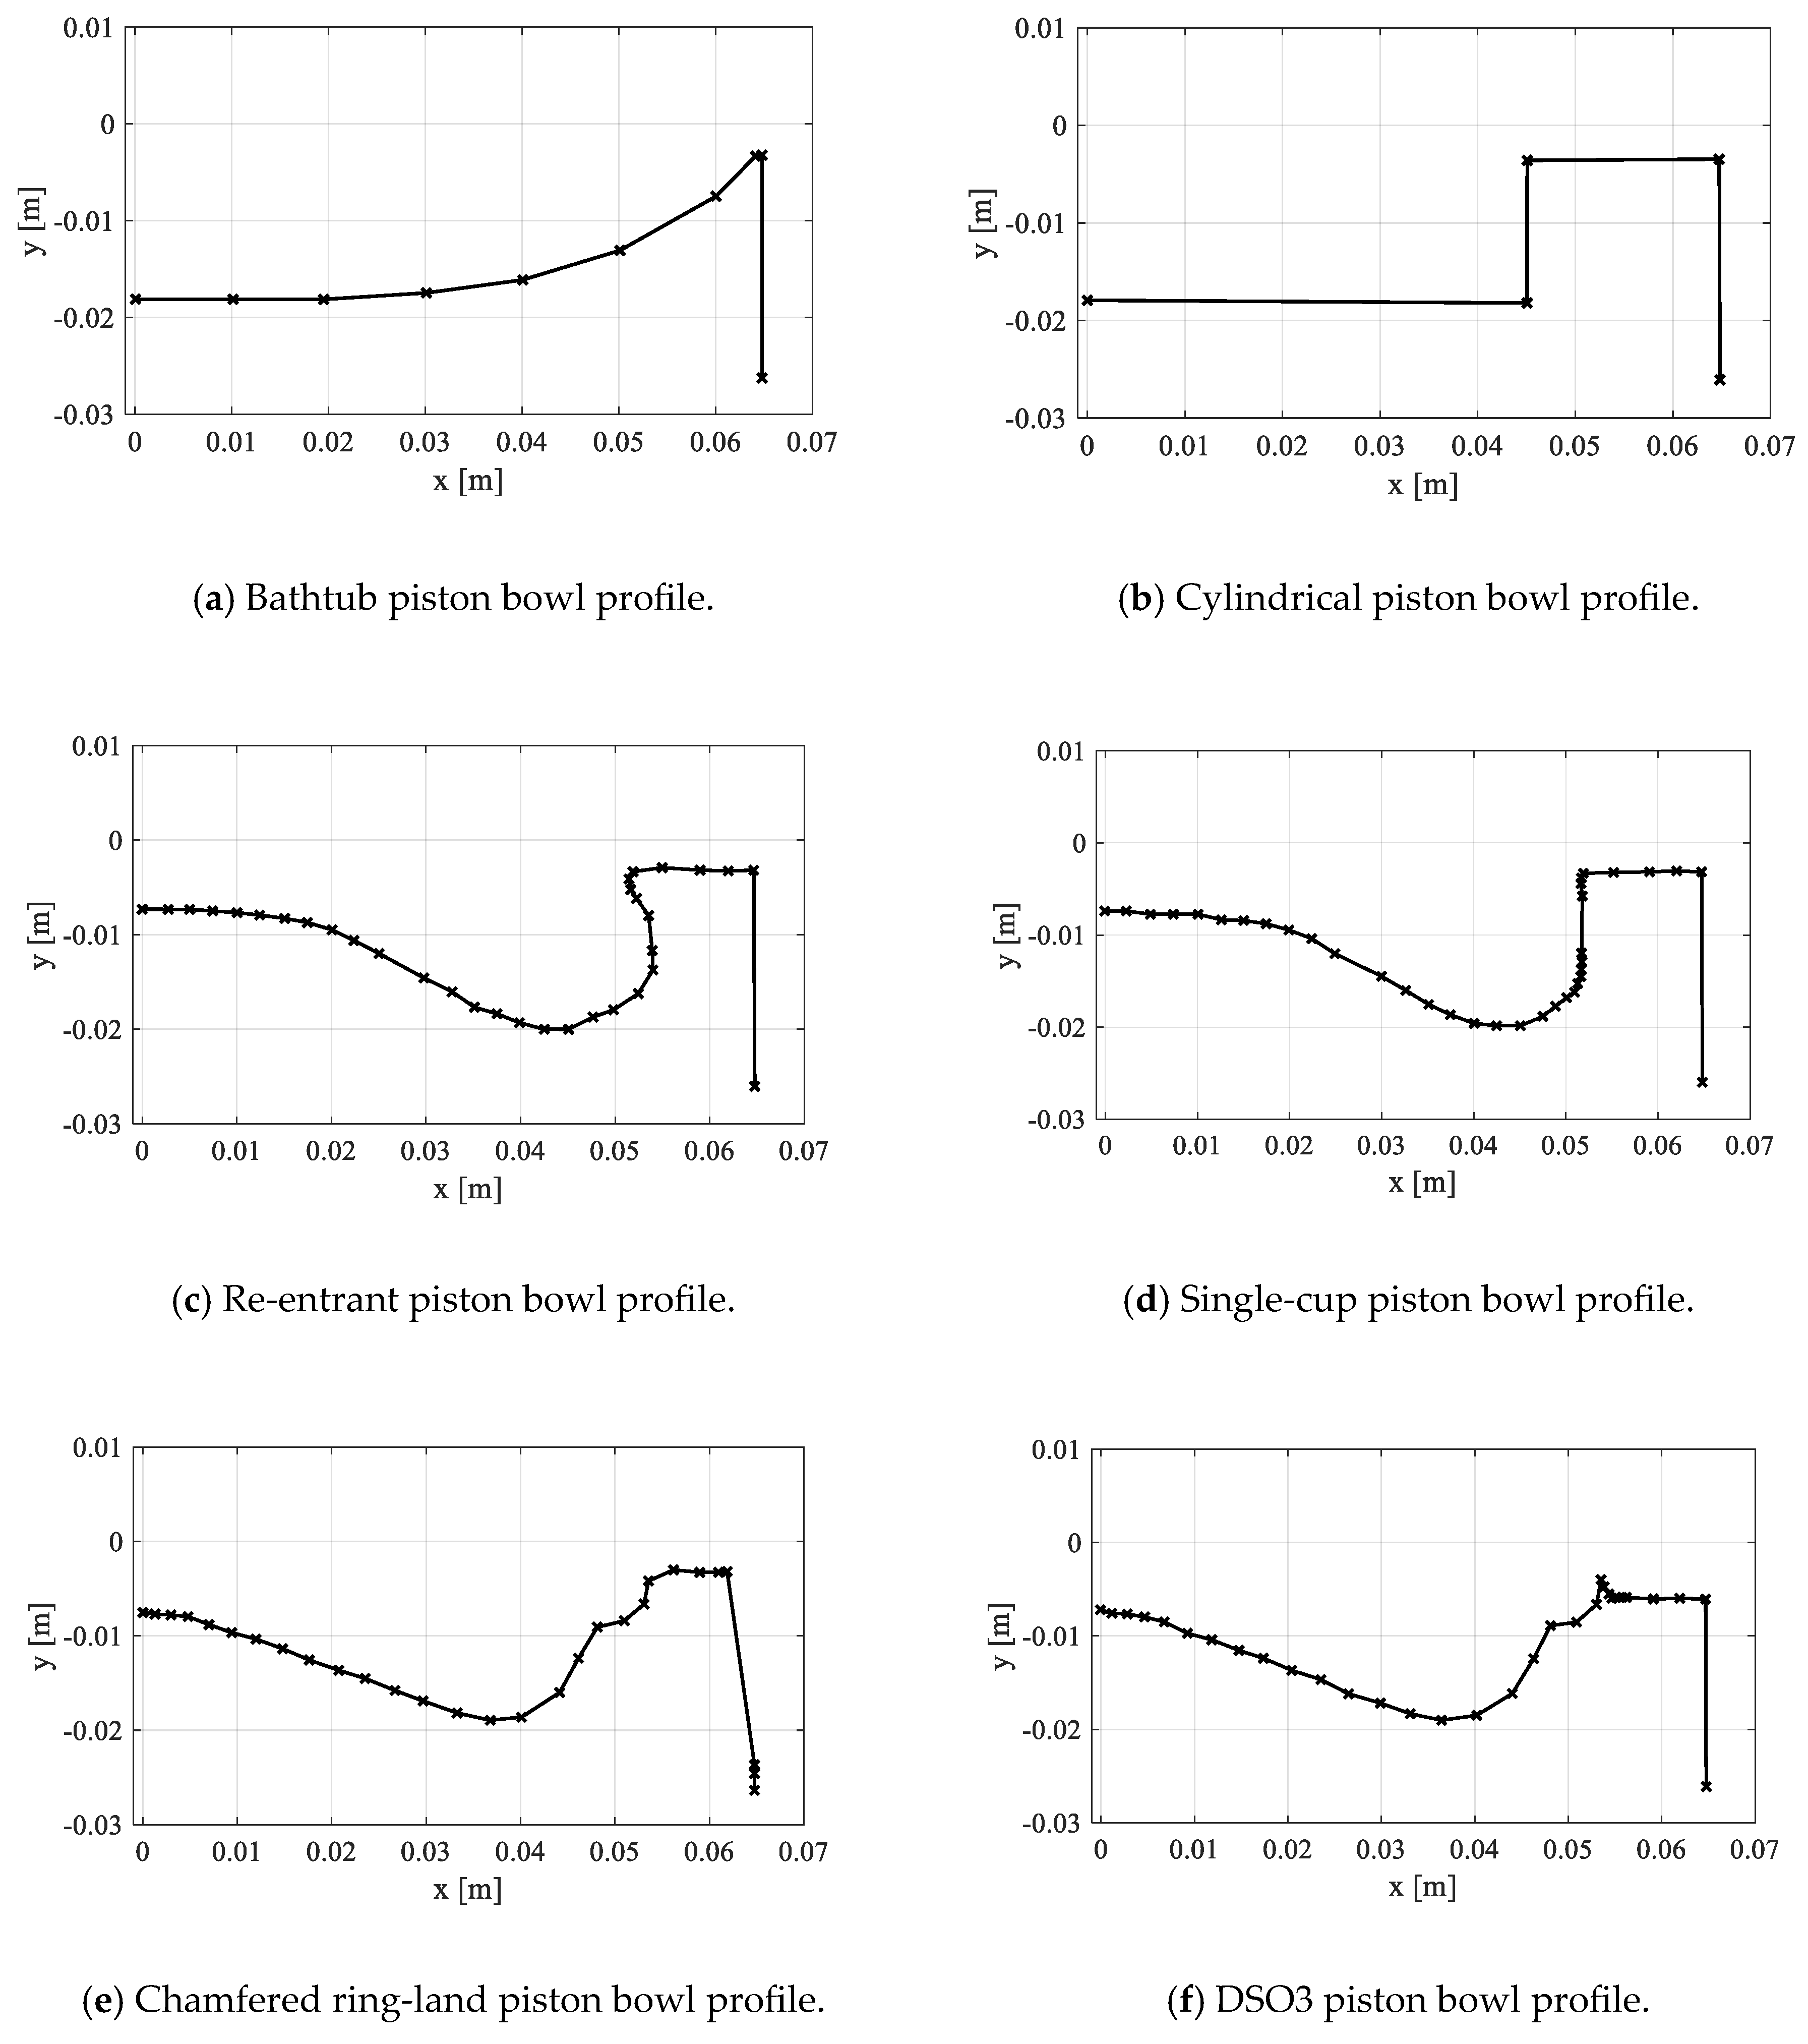
In this study, both common and less conventional piston shapes found in the literature were simulated, keeping the compression ratio the same as in the experimental data. The base design corresponds to the original specifications of the MX-13 engine, featuring a double-cup piston profile, as illustrated in Figure 10. The profile represents half of the full piston bowl geometry since the engine simulations were performed on a 1/7th sector of the engine. Four of the simulated profiles follow more traditional designs, including the bathtub, cylindrical, re-entrant, and single-cup shapes. The chamfered ring-land [59] and DSO3 [60] (Figure 11) are a novel type of piston bowl that can lead to emission reduction and lower pressure rise rate. Also, all other settings were kept the same as for the base case (Table 2).
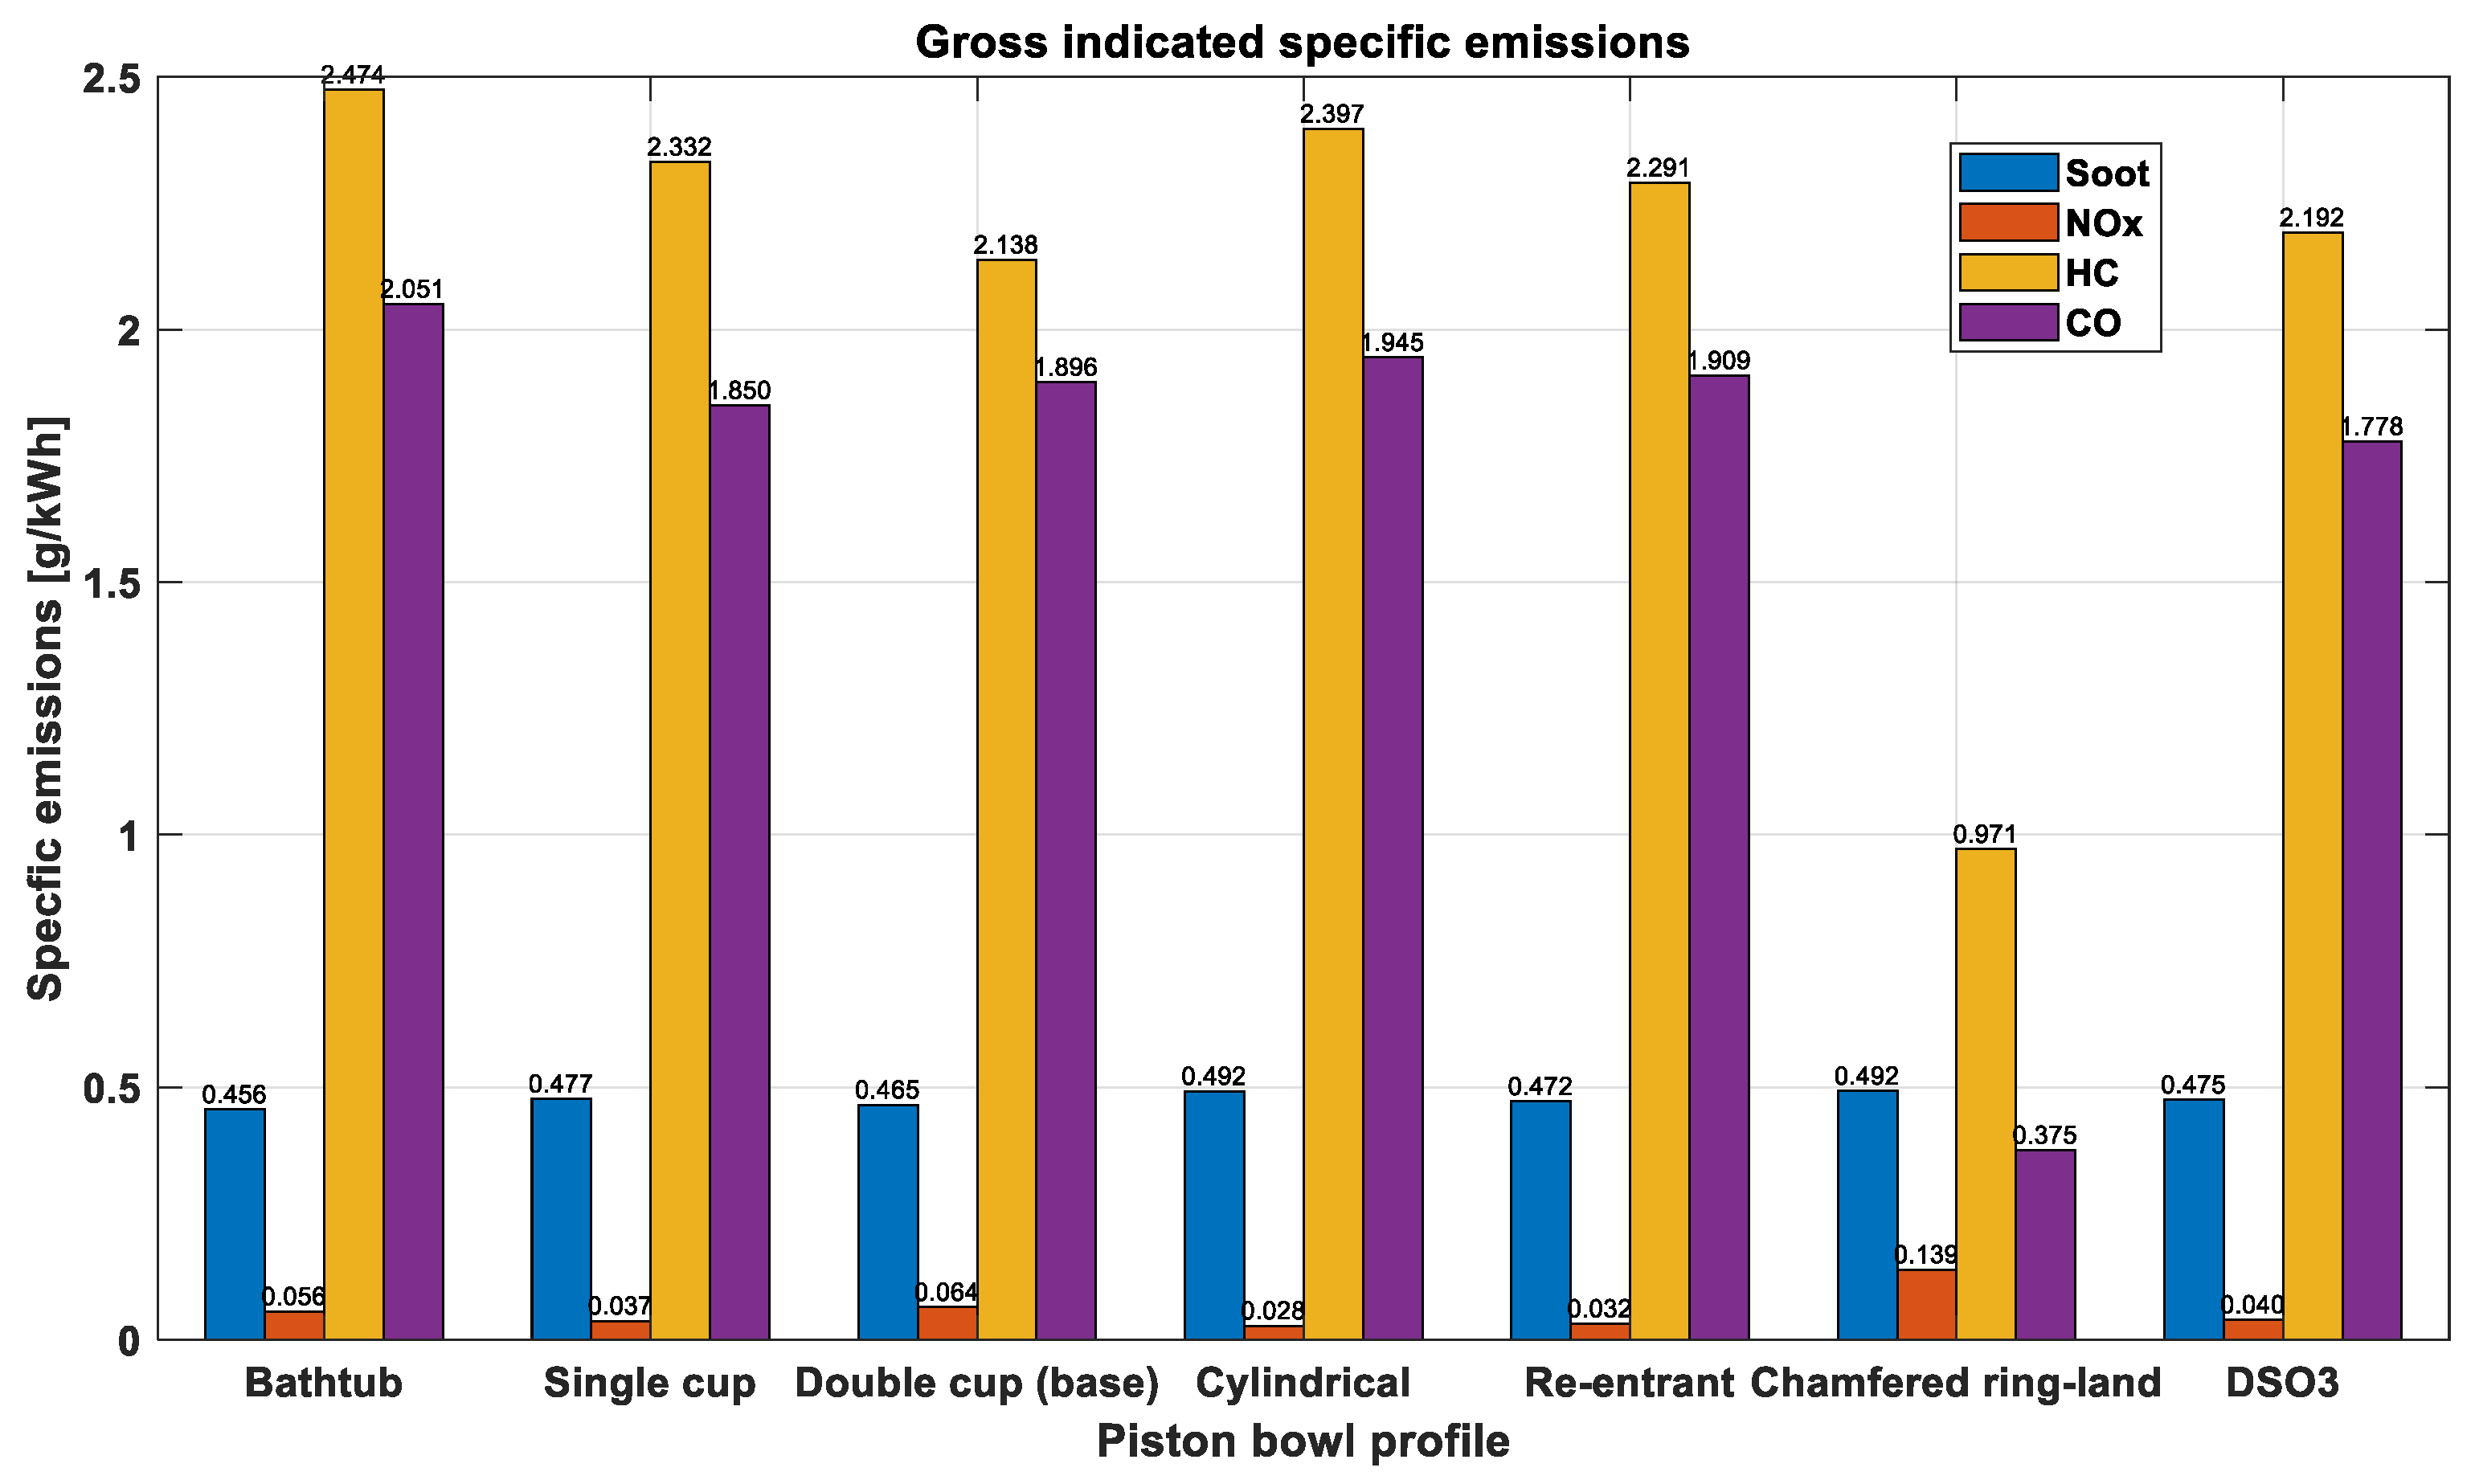
Since the compression ratio and all other engine settings remained constant across all geometries, changes to the piston bowl profile had minimal impact on pressure, apparent rate of heat release (aROHR), and overall combustion characteristics. However, a significant difference was observed in the emissions when comparing the chamfered ring-land profile to other designs, as shown in Figure 12 and Figure 13. This profile results in noticeably lower HC and CO emissions, while NOx emissions are slightly higher. Soot emissions, on the other hand, are barely affected by the geometry changes.
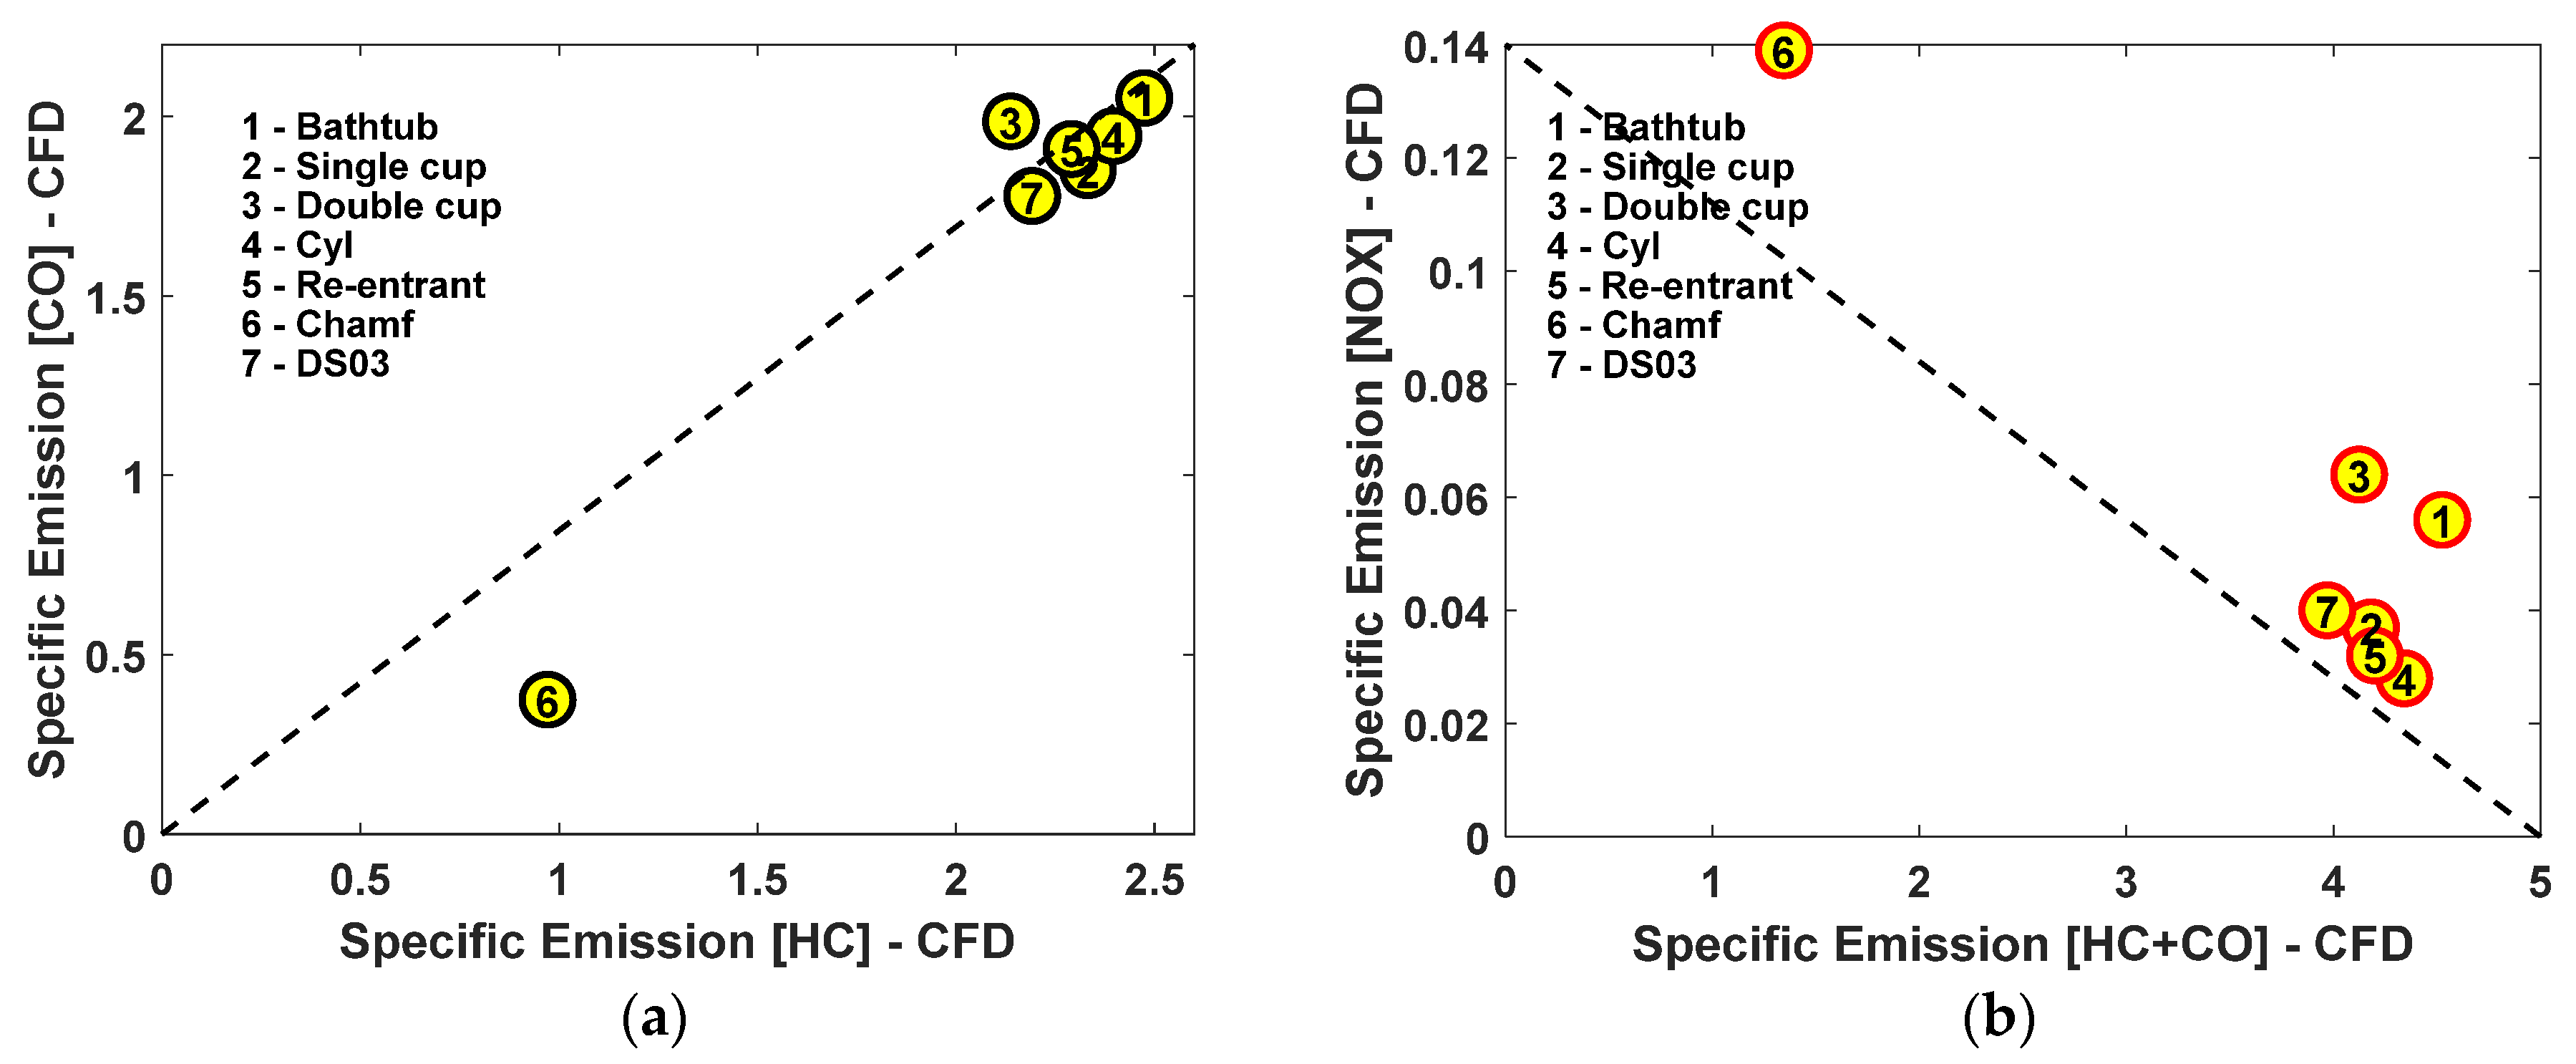
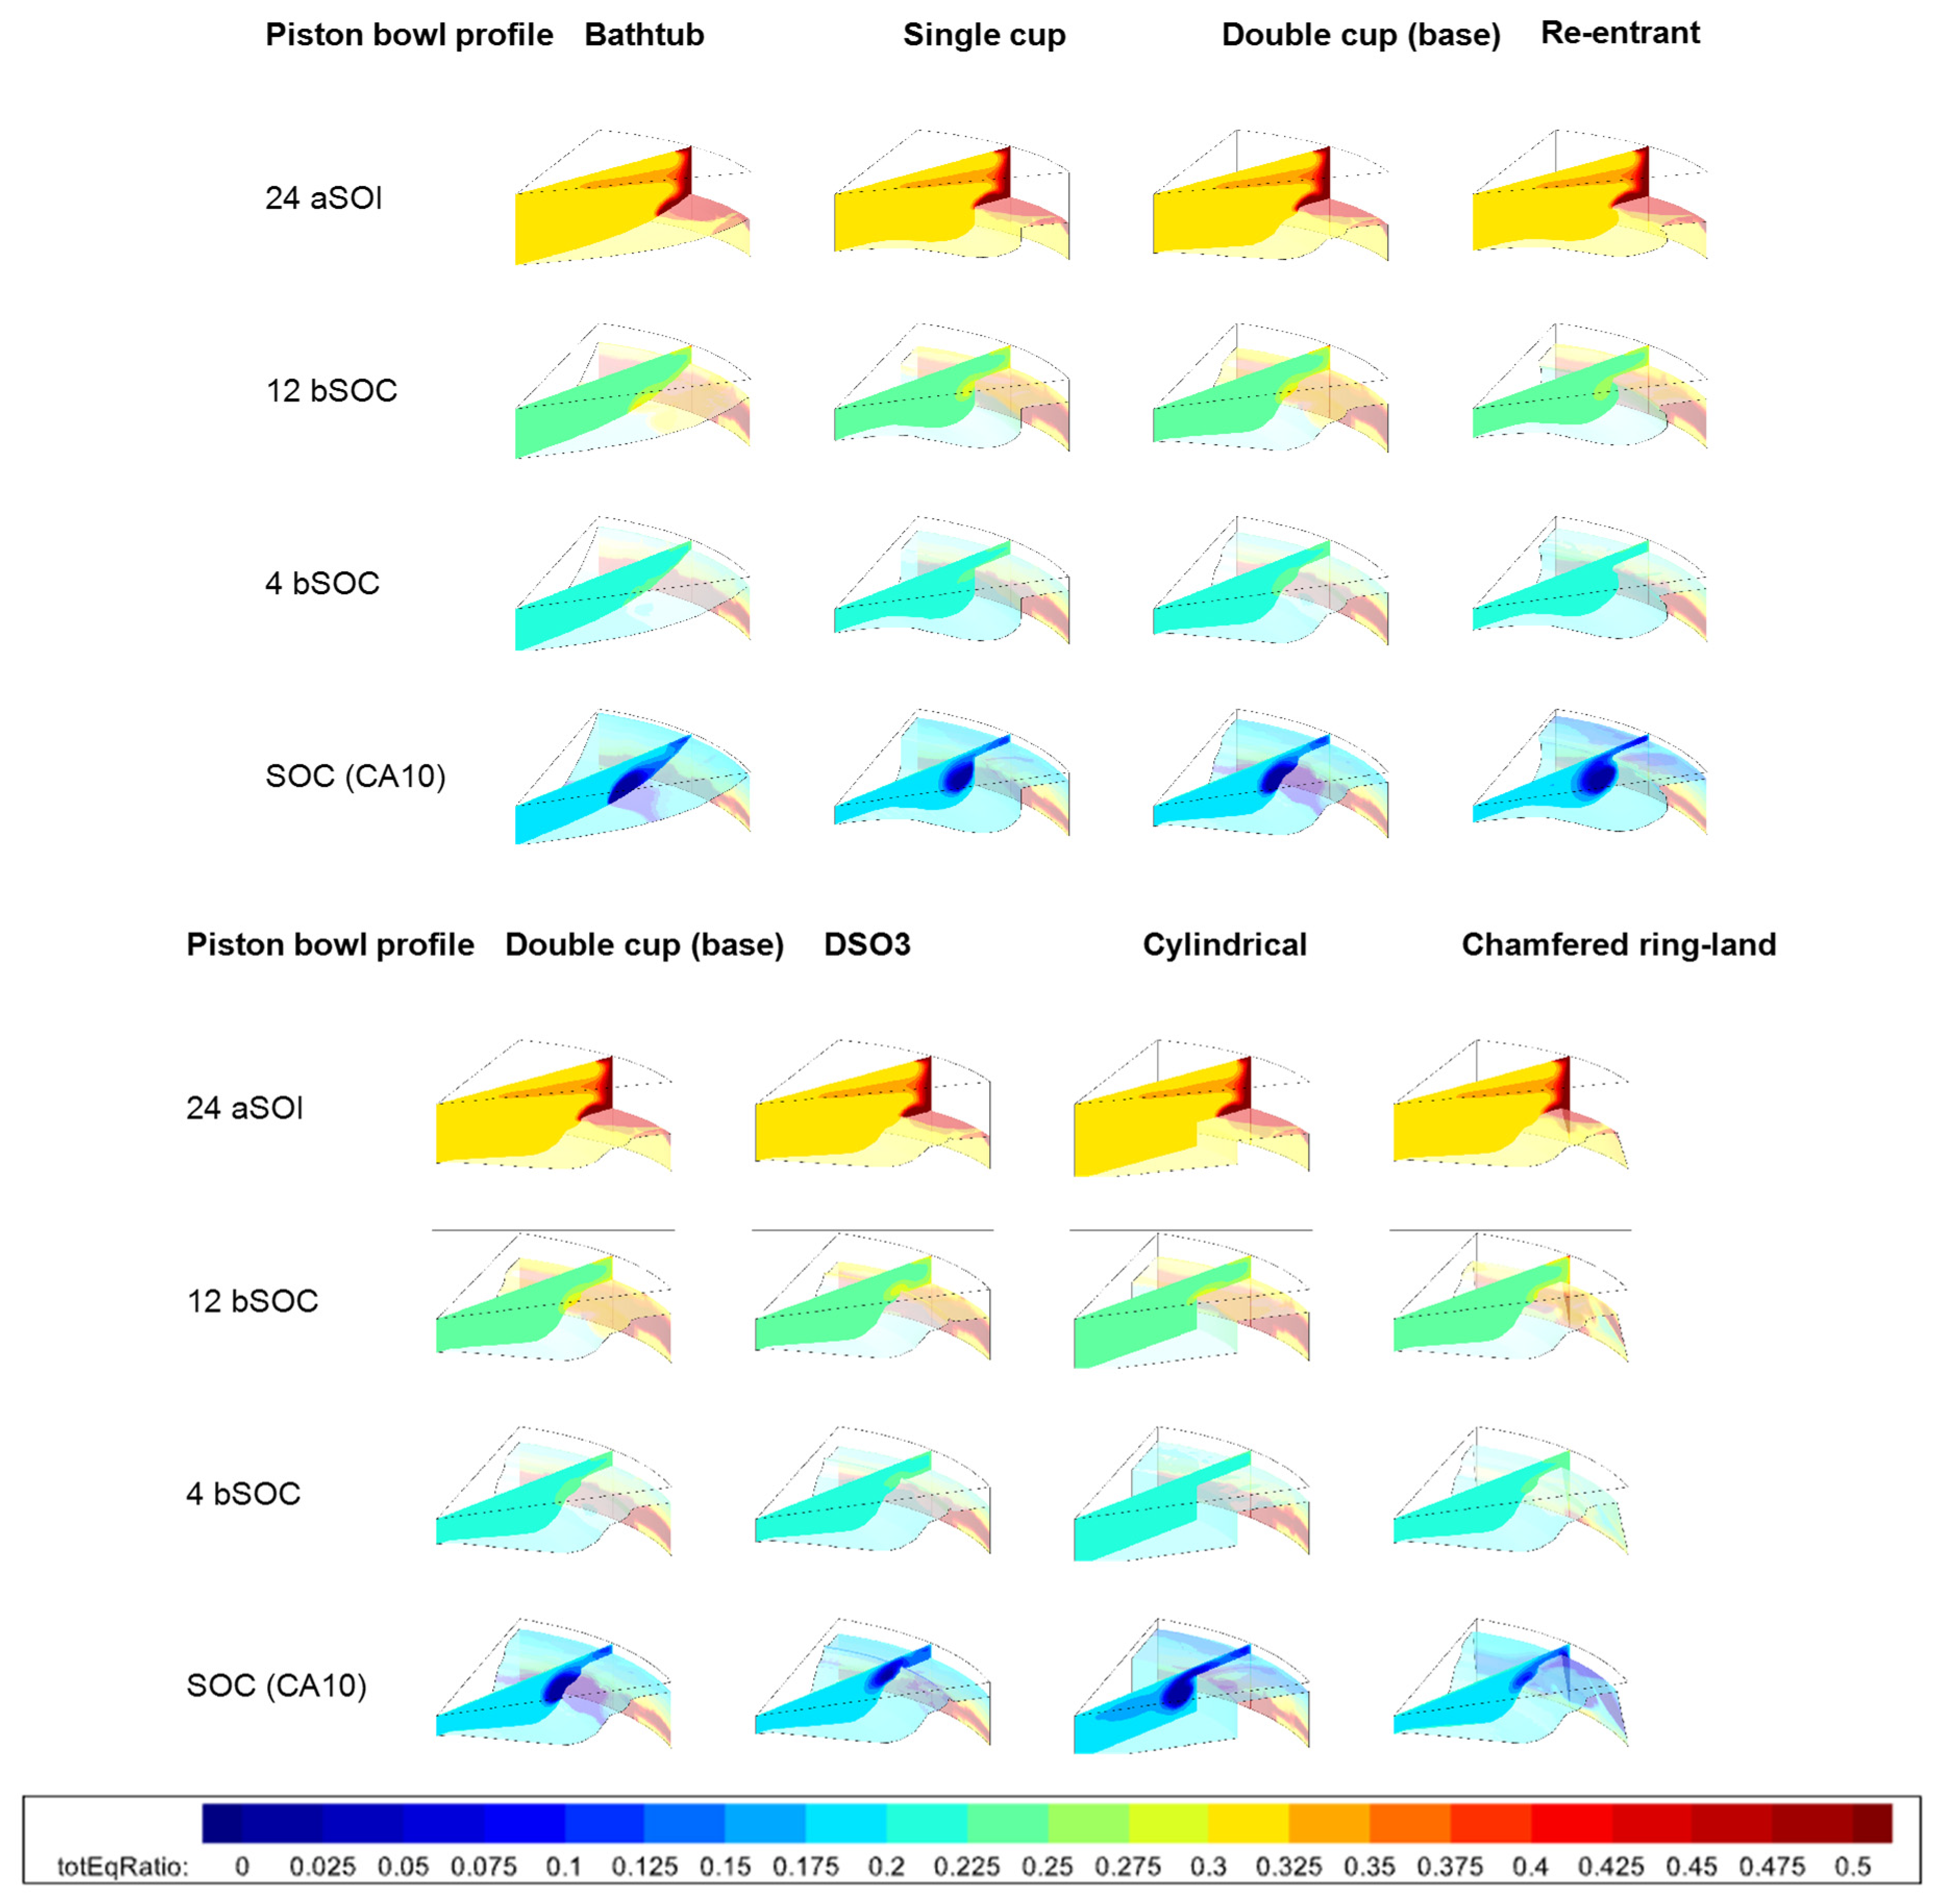
Additionally, a correlation is evident between HC and CO emissions as well as between NOx emissions and the combined total of HC and CO. HC and CO decrease simultaneously, whereas NOx emissions exhibit the opposite trend, increasing as the total HC and CO emissions decrease. To investigate the origins of these differences, contour plots of the local equivalence ratio and temperature are provided in Figure 14. For the commonly used geometries, such as the bathtub, single-cup, double-cup, and re-entrant profiles, the contour plots reveal minimal variation. In the single- and double-cup designs, two distinct regions with relatively high equivalence ratios and reactive mixtures were identified: one in the cylinder’s squish region and the other in the upper portion of the piston cup.
The bathtub profile results in a high concentration of fuel along the boundary of the piston profile. Additionally, due to the absence of a defined cup shape, more fuel is injected into the crevice region, causing higher HC emissions compared to the base case. In contrast, the contour plot for the chamfered ring-land geometry shows significant differences from other designs. Notable distinctions can also be observed between the cylindrical profile and the DSO3 and chamfered ring-land profiles. The cylindrical profile demonstrates a more uniform fuel distribution, whereas the other two profiles exhibit greater fuel accumulation in the cylinder’s squish region and crevice.
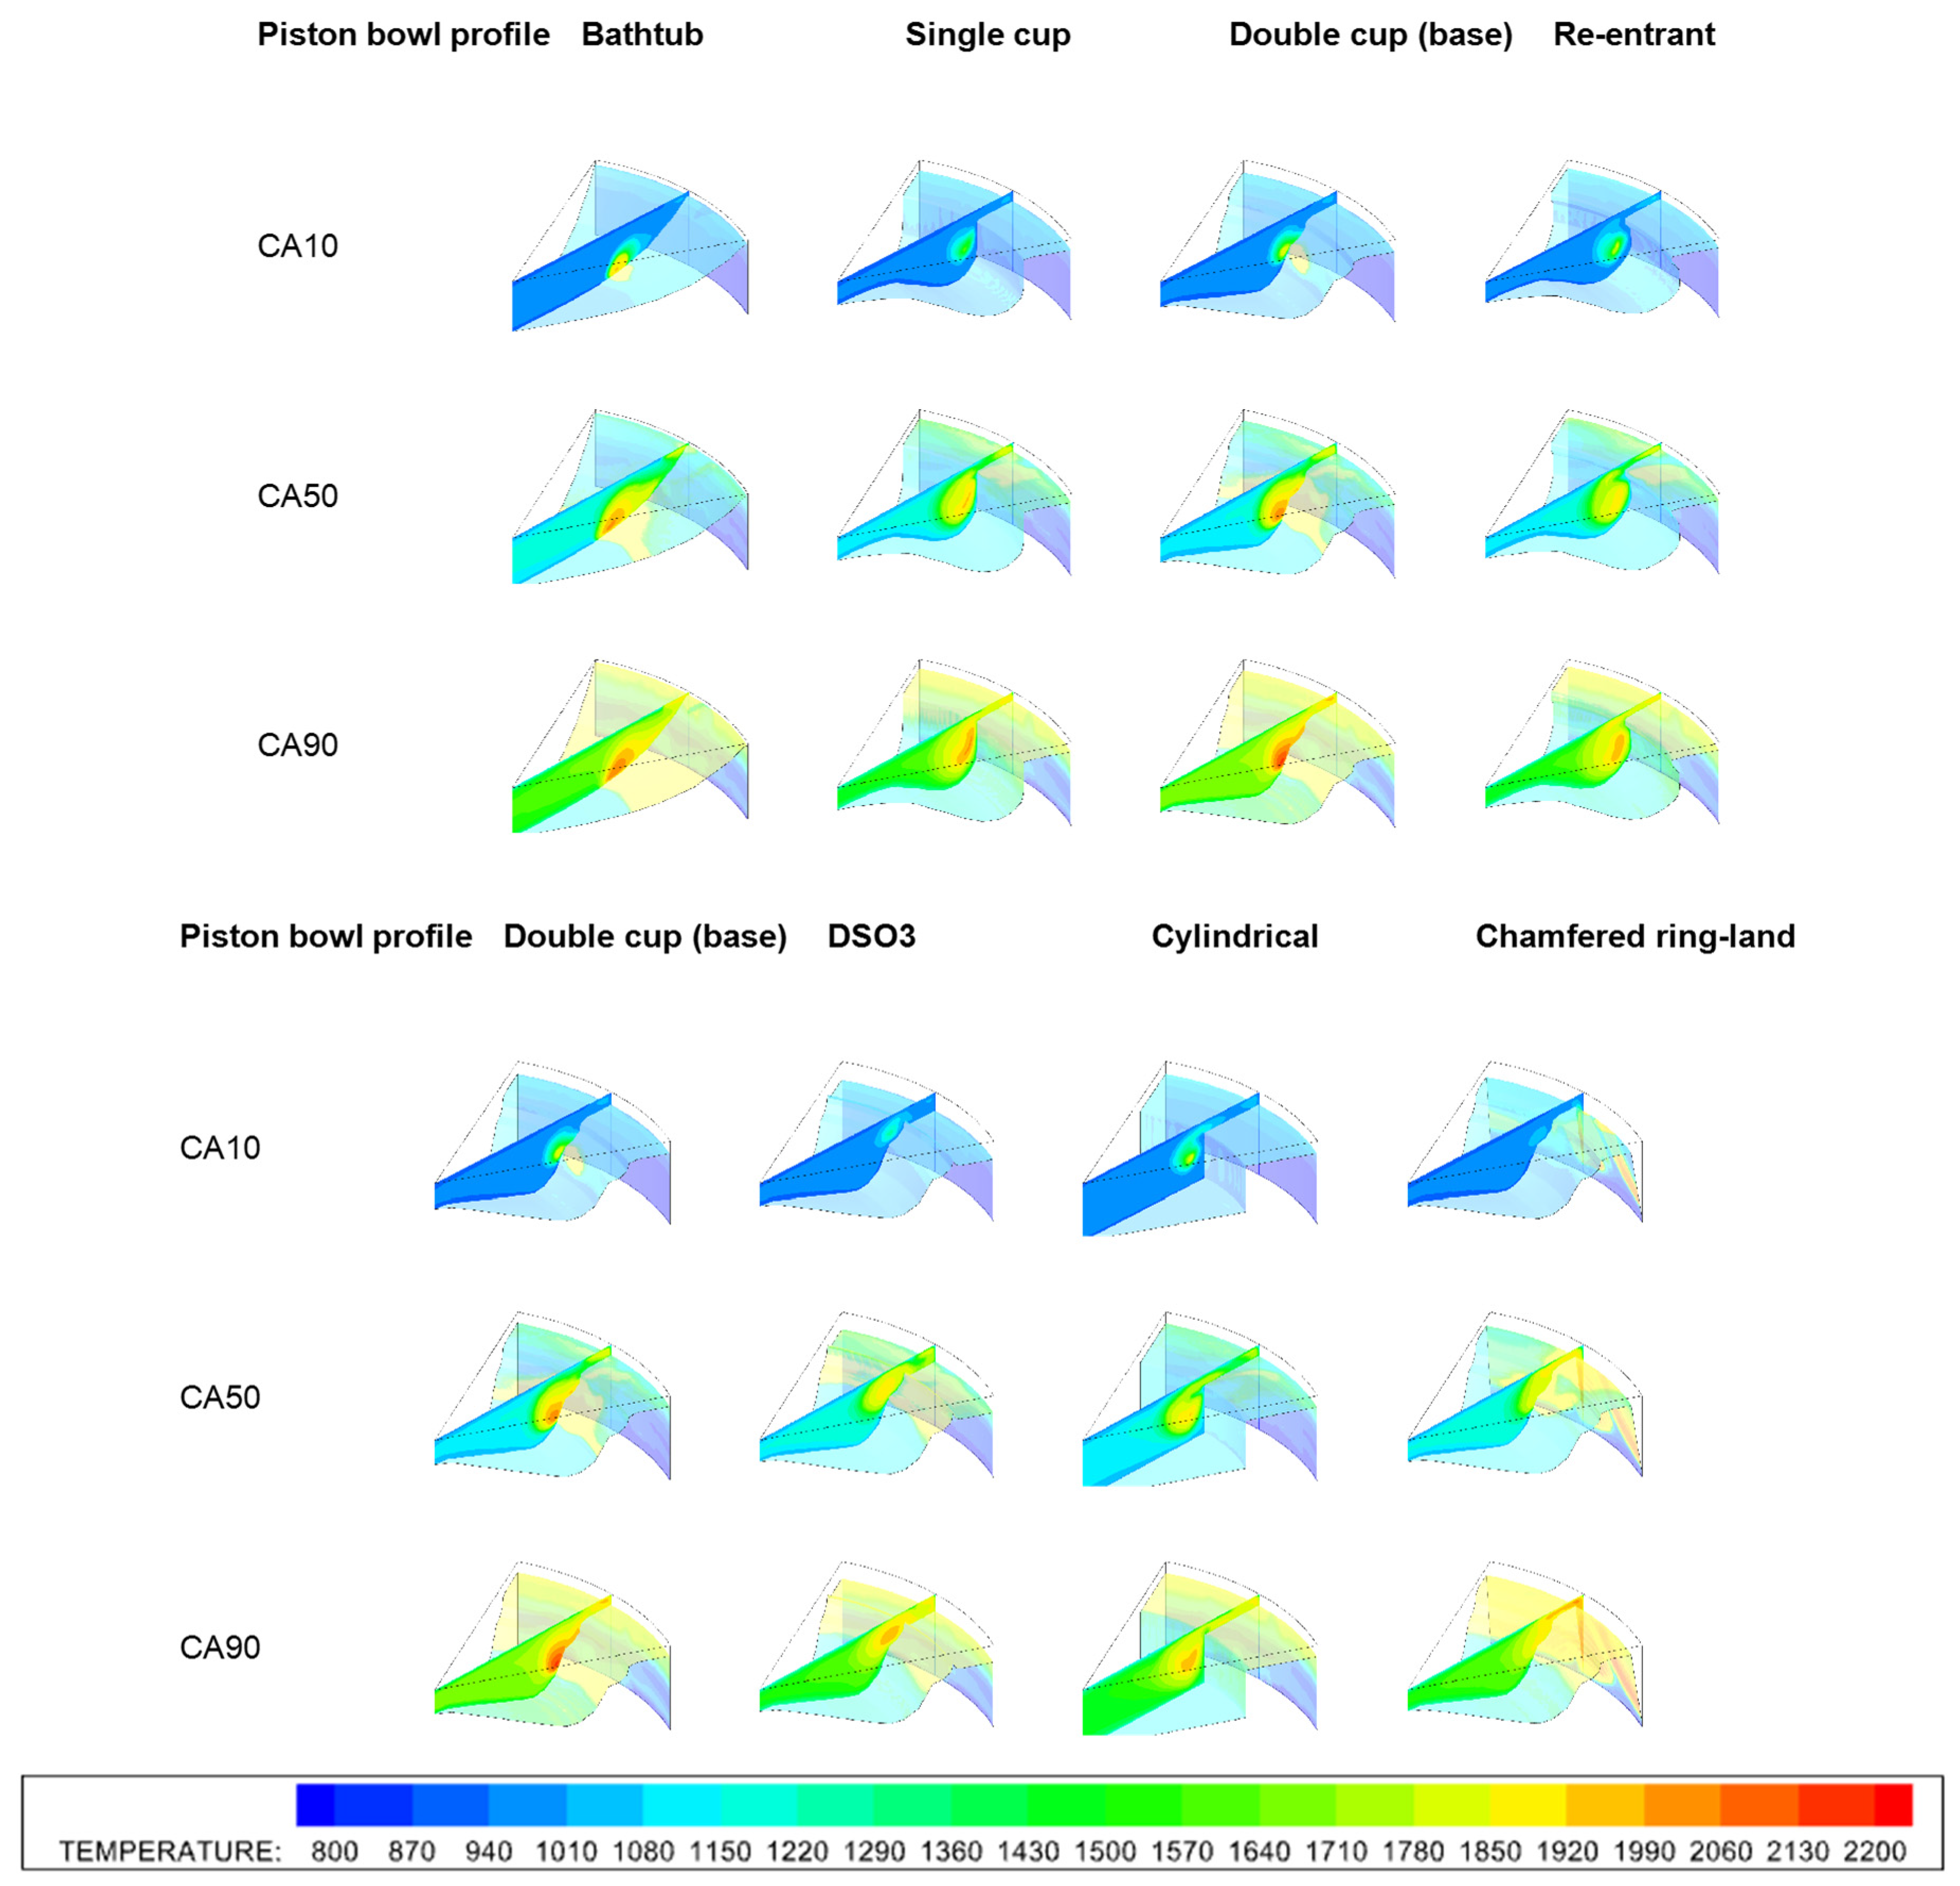
In the DSO3 profile, a fuel-rich area forms near the “bump” due to rebound behavior, where fuel deflects from the cylinder liner back into the combustion chamber. The temperature contour plots in Figure 15 help explain the emissions. They reveal much lower local gas temperatures in the piston cup region for the DSO3, cylindrical, and chamfered ring-land profiles. This is attributed to better mixing or reduced fuel accumulation in the piston cup, which generally leads to lower NOx emissions compared to the base profile. However, the chamfered ring-land geometry is an exception. Its design provides additional space in the upper crevice for oxygen to oxidize fuel trapped there. This results in significantly lower HC emissions and more complete combustion, reducing CO emissions but increasing NOx emissions in that region, as shown in Figure 13b.
From Figure 15, it is evident that combustion in the bathtub and base double-cup profiles initiates near the piston bowl boundary, resulting in elevated local temperatures in that region. This contributes to higher NOx emissions, as shown in Figure 12. In contrast, the single-cup profile spreads the high-reactivity fuel over a larger area, reducing the local equivalence ratio and consequently lowering the local gas temperature. The re-entrant profile amplifies this effect due to increased turbulence, further reducing NOx emissions.
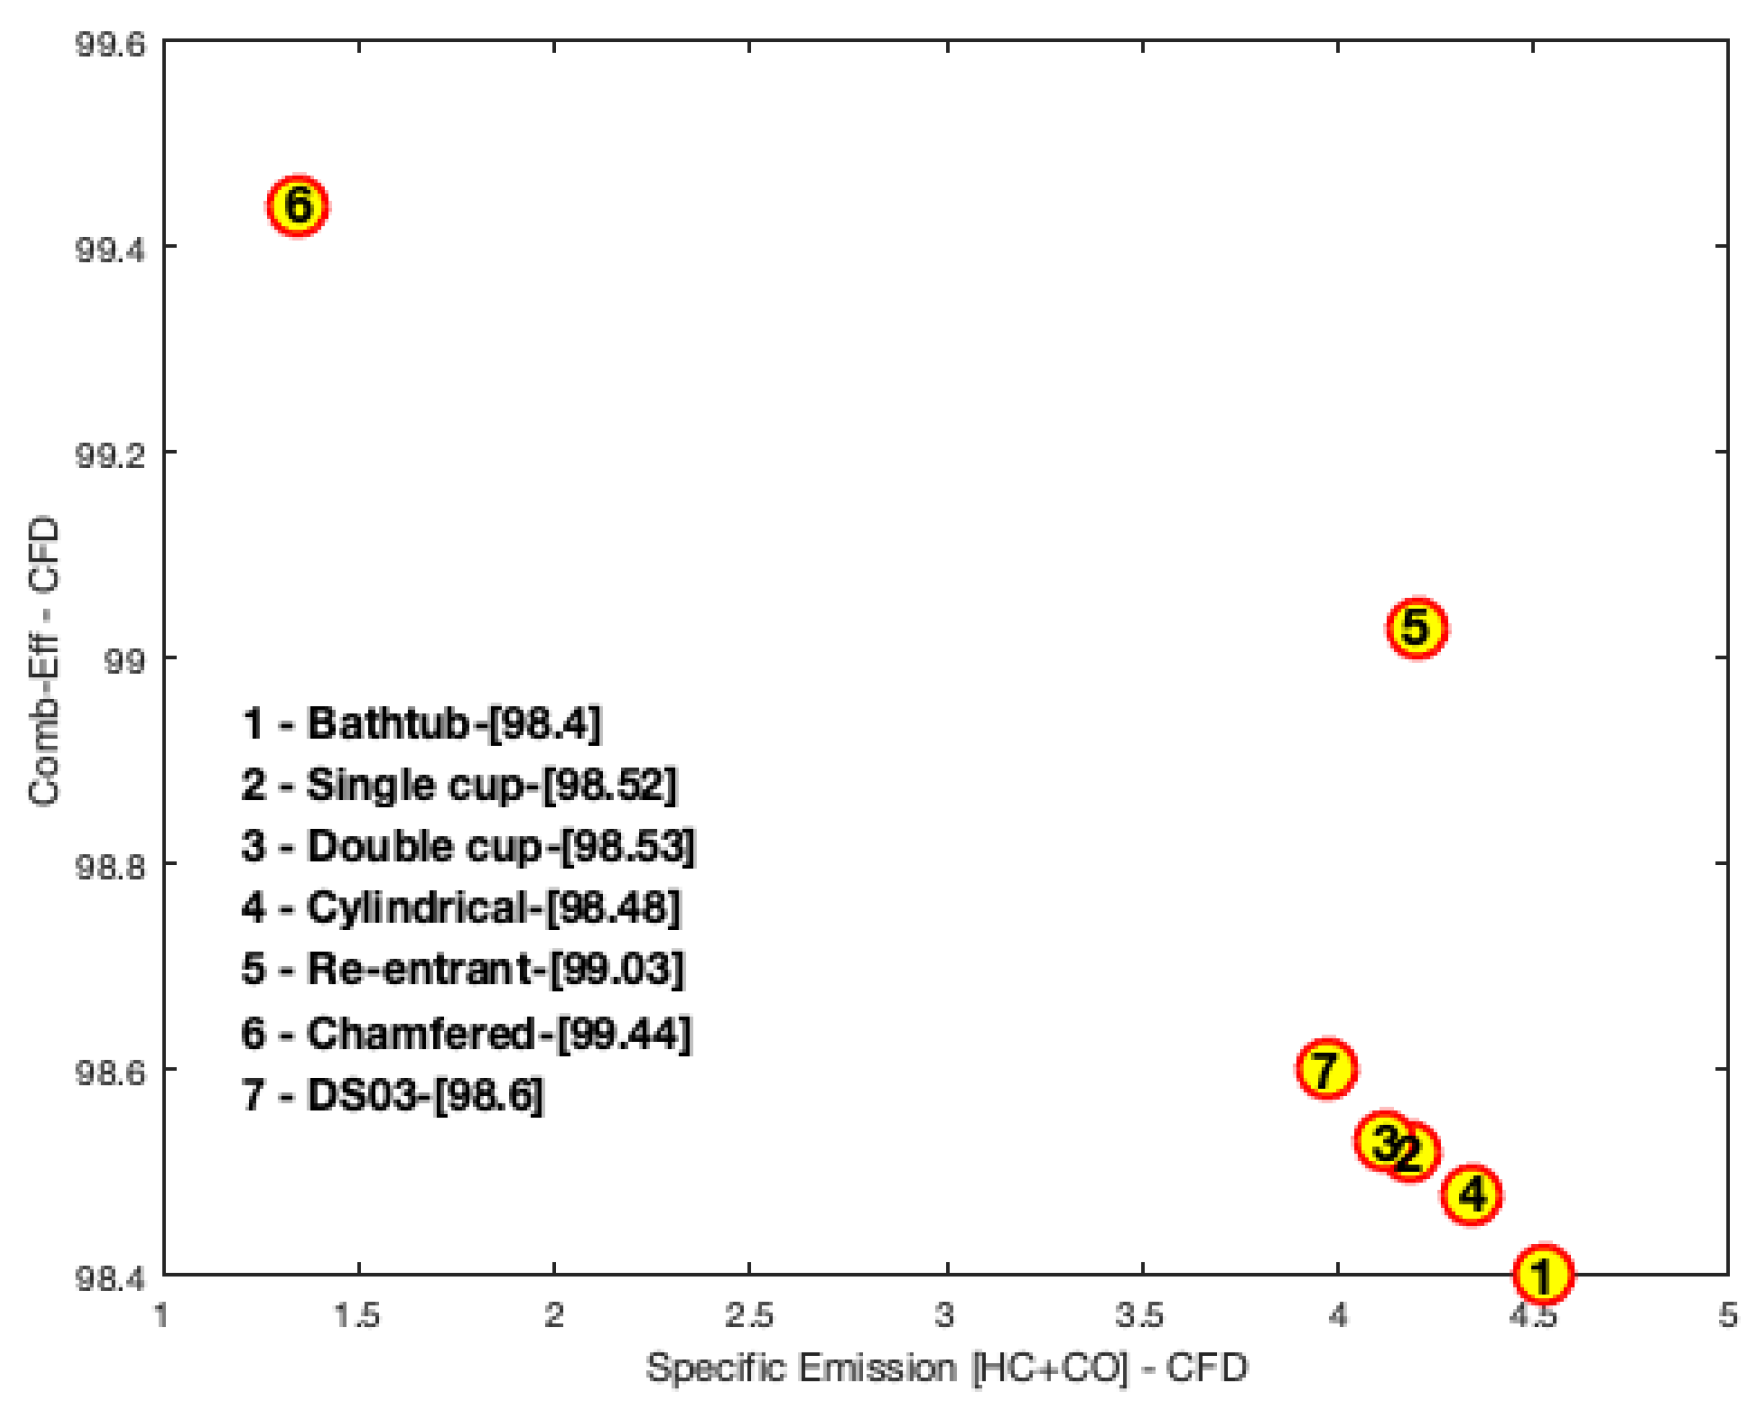
Table 5 presents the performance indicators for the various piston bowl profiles, revealing a clear correlation between CO/HC emissions and combustion efficiency. This relationship is further illustrated in the accompanying figure (Figure 16).
It can be also seen that the chamfered ring-land profile leads to lower RI and MPRR due to the longer combustion duration because the combustion starts in the corner of the piston and moves toward the piston bowl and the center of the cylinder (Figure 15). A common observation is that a more pronounced cup shape leads to lower values of pressure rise rate.

4.2. Effect of Injection Strategy

This section reports the effect of the number of injections pulses while keeping CA50 fixed. CA50 was kept fixed by changing the injection timing of the last pulse. Double-pulse and a triple-pulse cases were simulated and compared. The total amount of DI fuel mass was kept constant, and the mass was divided equally between the pulses. The fuel pressure was also kept the same as for the base case. Note that in CONVERGE, the injection duration and mass flow rate is specified. Hence, the injection durations were corrected accordingly. Table 6 presents the injection timings for the different cases along with the corresponding ignition delay. The timings were chosen in such a way that the CA50 was the same as that of the base case.
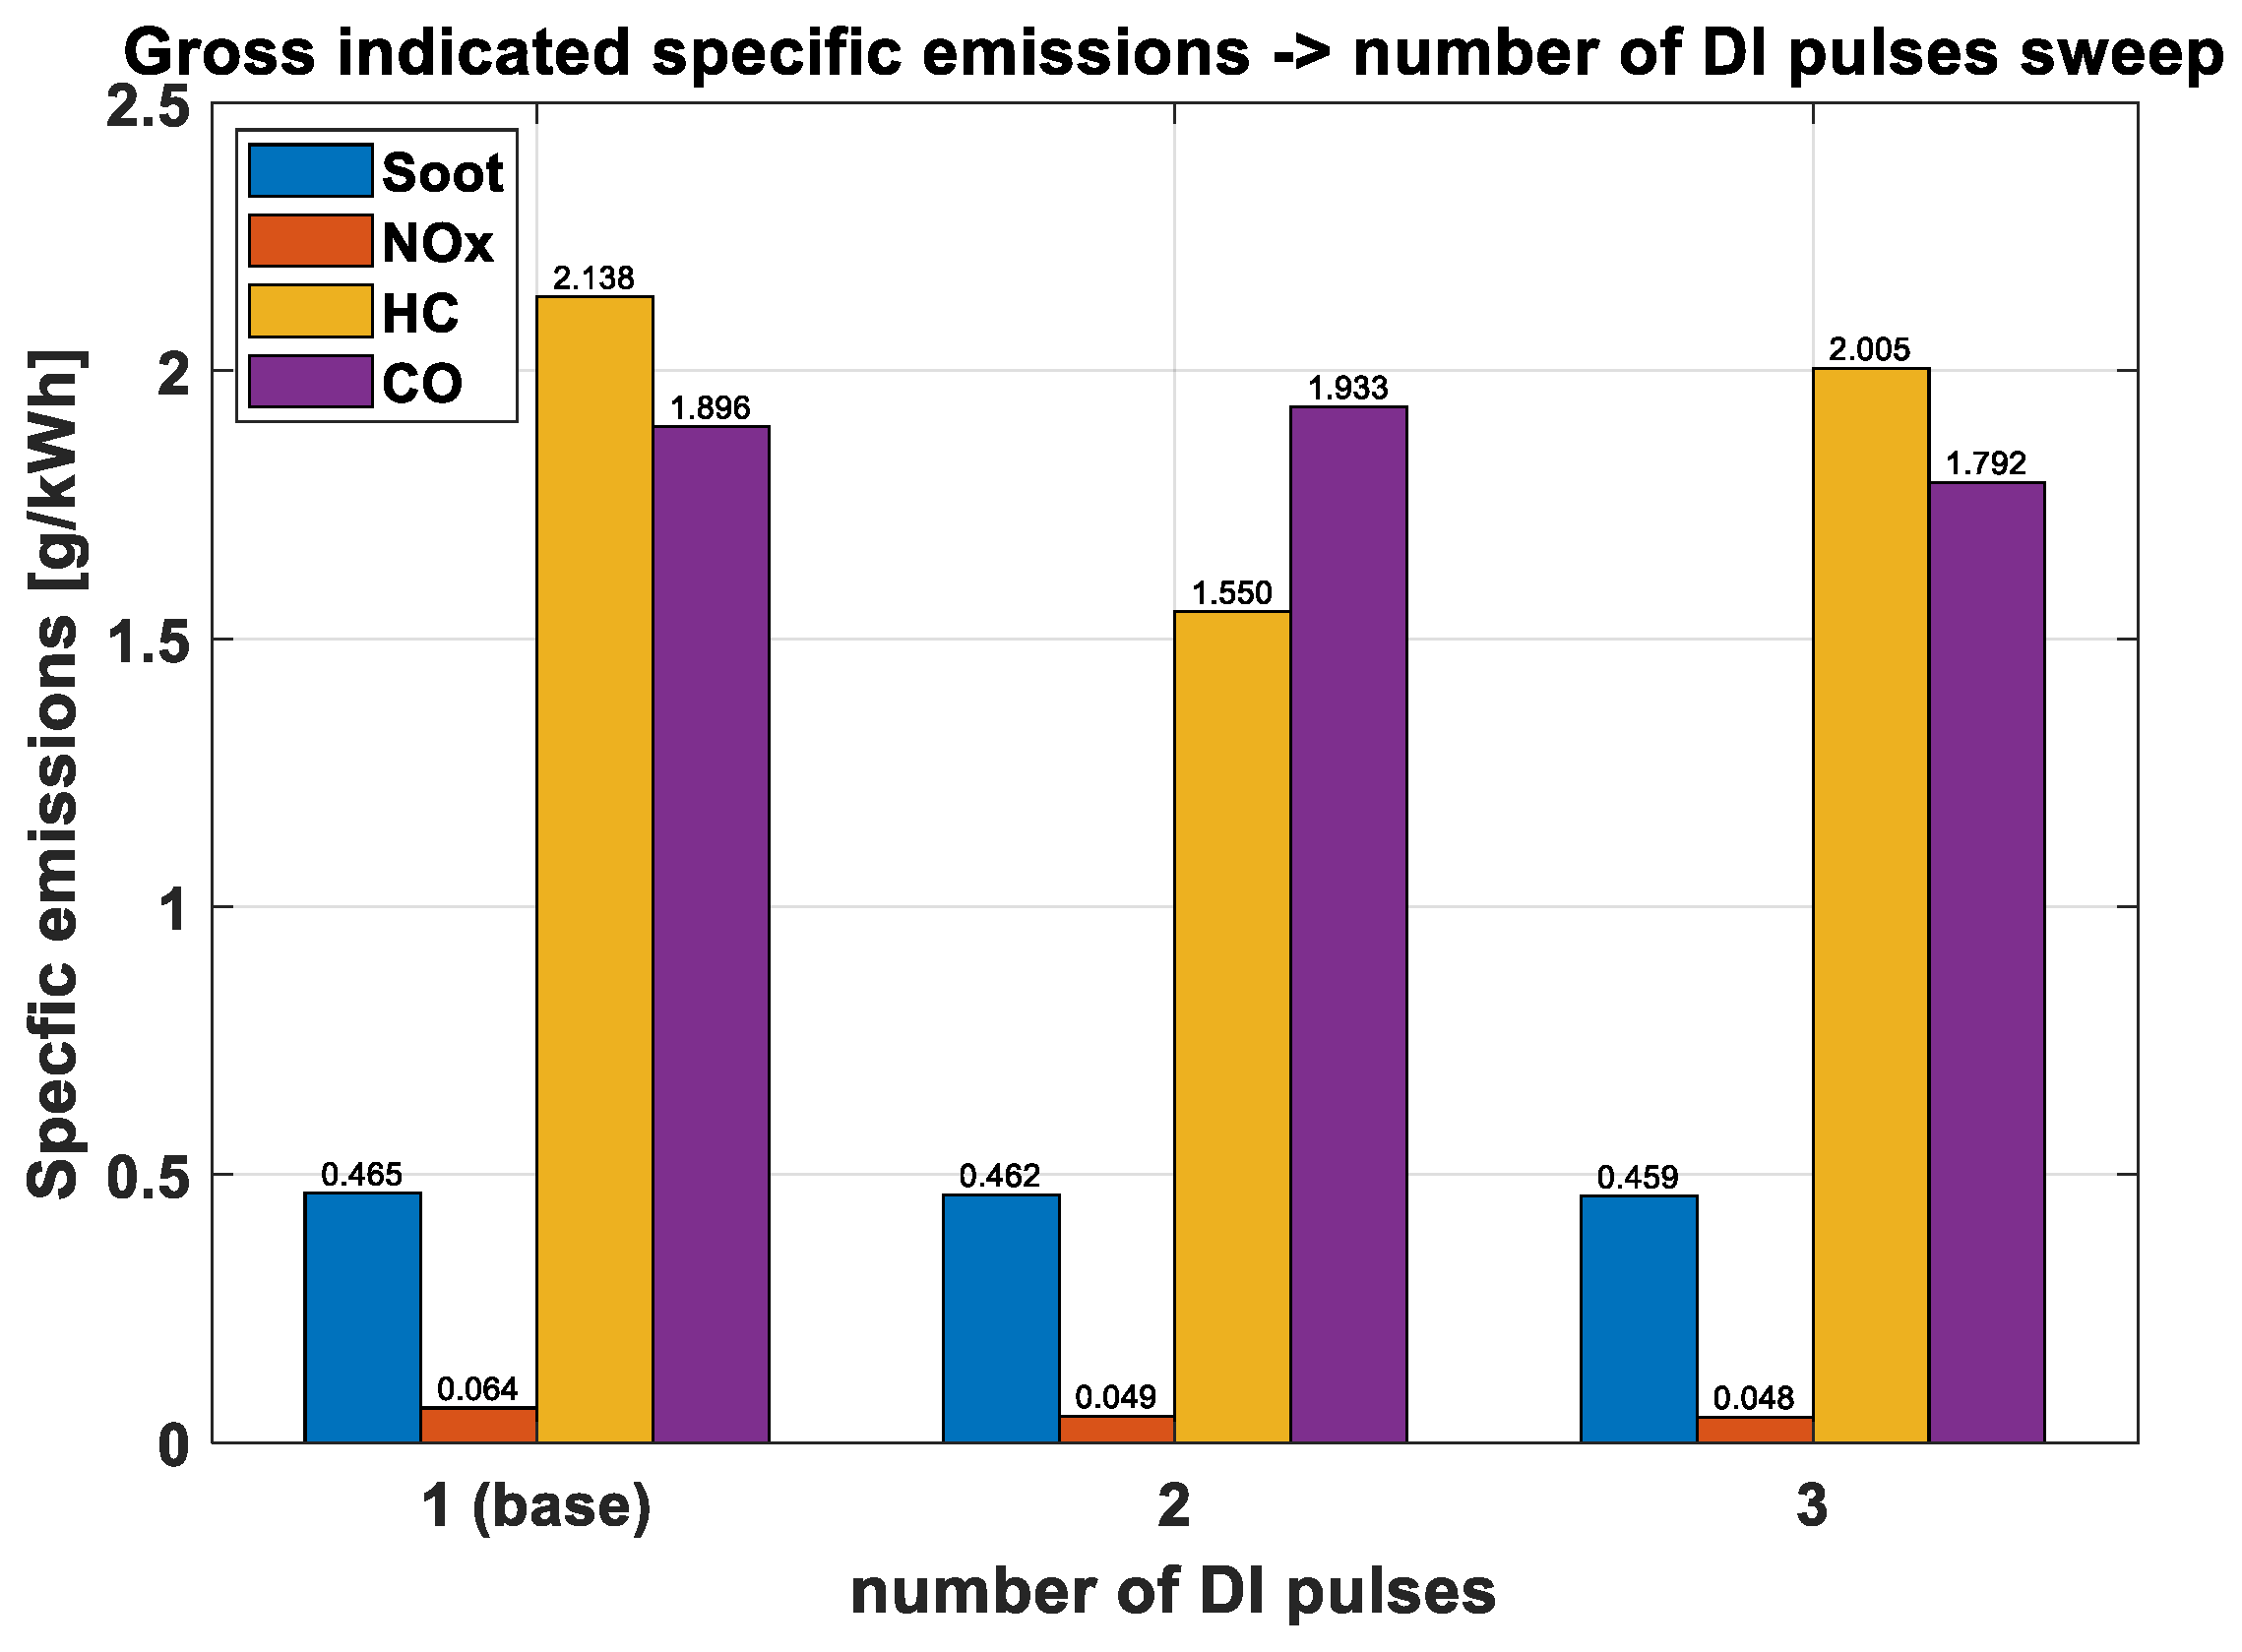
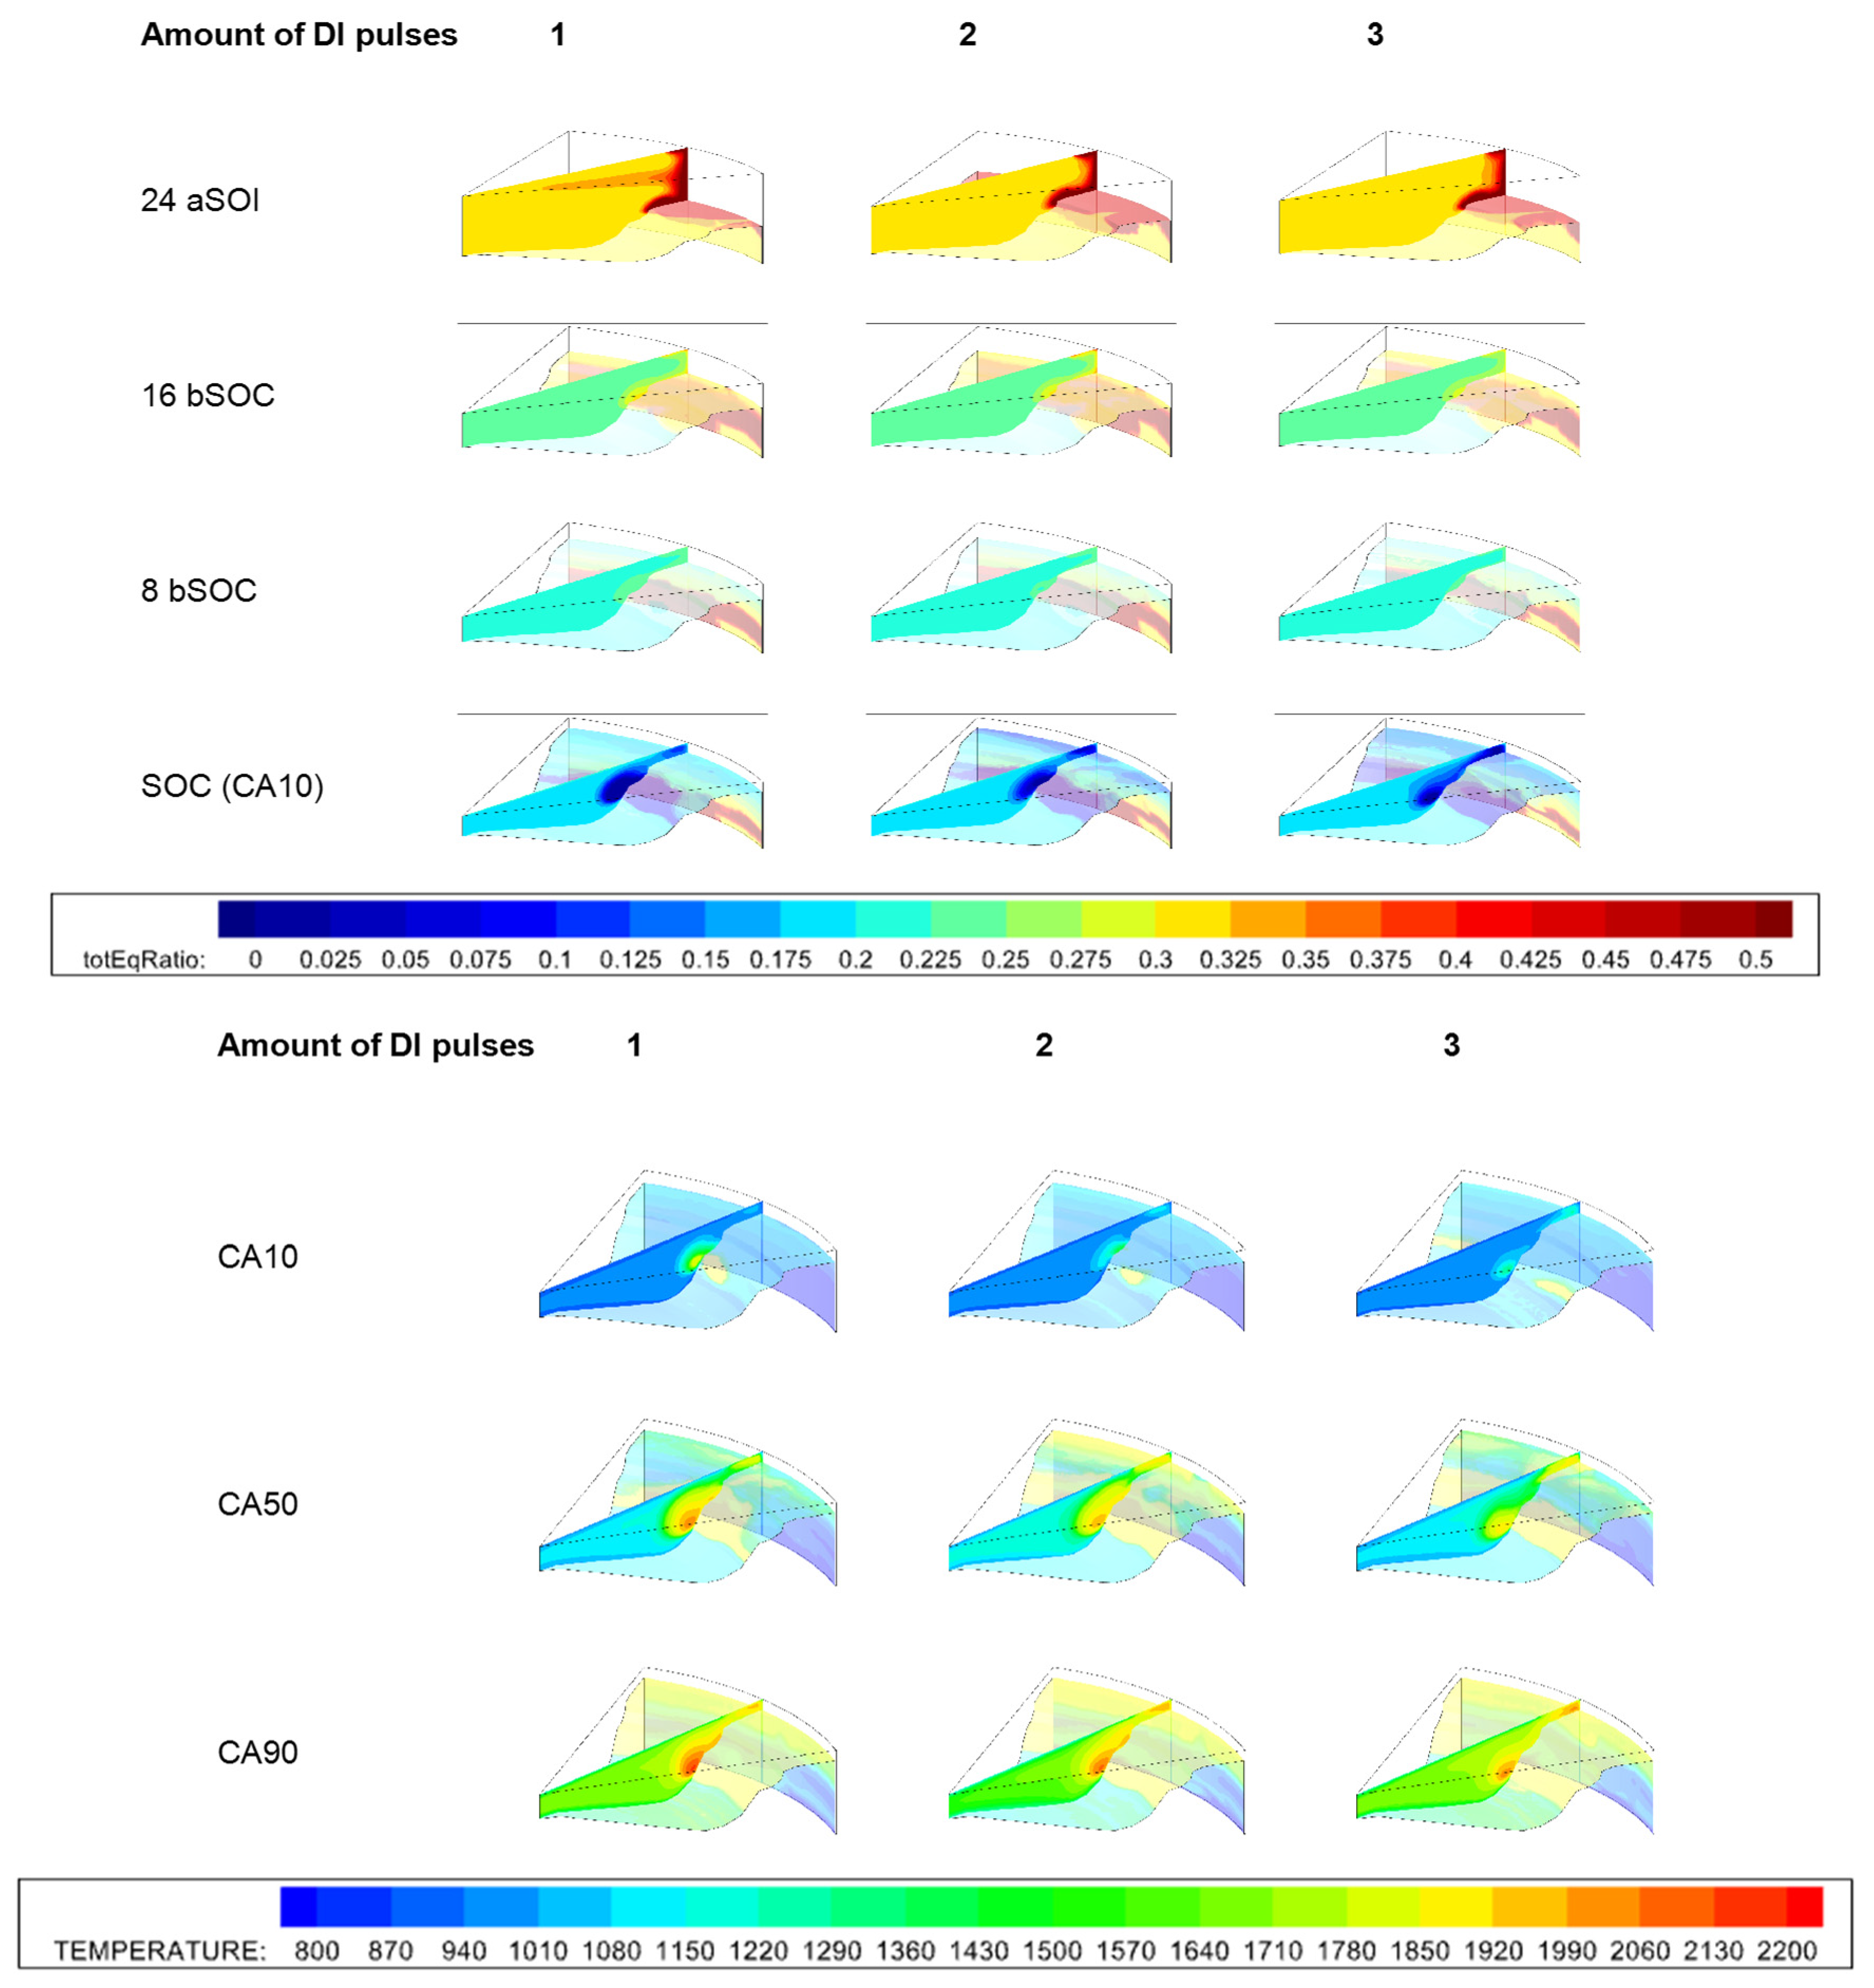
The number of DI pulses has minimal impact on the pressure and aROHR at a fixed CA50, as all injection pulses occur relatively early in the compression stroke, and CA50 remains constant. This indicates that the differences in mixture stratification are negligible. As a result, their results are not reported here. The emissions (see Figure 17) show that with an increasing number of DI pulses, the NOx and soot emissions decrease. This could be the result of the lower local temperature due to the lower local equivalence ratio (see Figure 18). The other emissions show a minor change: only the HC emissions for the double-injection strategy are significantly lower compared to the single and triple case. This can be attributed to more fuel hitting the cooler cylinder wall. Note that earlier in the compression stroke, the average temperature inside the cylinder is lower. With three pulses, the first injection occurs much earlier, resulting in a more homogeneous mixture and consequently higher HC emissions. The mixture is also more homogeneous with two pulses compared to a single pulse. However, in the two-pulse case, the last injection timing is later than in the three-pulse case. This means the piston is slightly higher, causing the DI spray to hit the hot piston boundary more frequently. In contrast, the three-pulse case injects more fuel into the crevice region, leading to slightly higher HC emissions due to the earlier injection timing of SOI1 and SOI2 in the triple-pulse configuration. A single injection pulse results in higher temperatures around the piston cup boundary, as shown in Figure 18, due to a higher local equivalence ratio following the injection. This explains the slightly increased NOx emissions. Generally, the single-pulse strategy initiates combustion primarily around the piston cup boundary, whereas multiple injections cause combustion to begin in both the piston cup boundary and the cylinder squish region.

4.2.1. Pressure Distribution Between the Two Pulses

The settings for this study are provided in Table 7, with the SOI2 timing set to −32 CAD aTDC. This timing was selected to prevent engine misfire when adjusting the mass distribution.
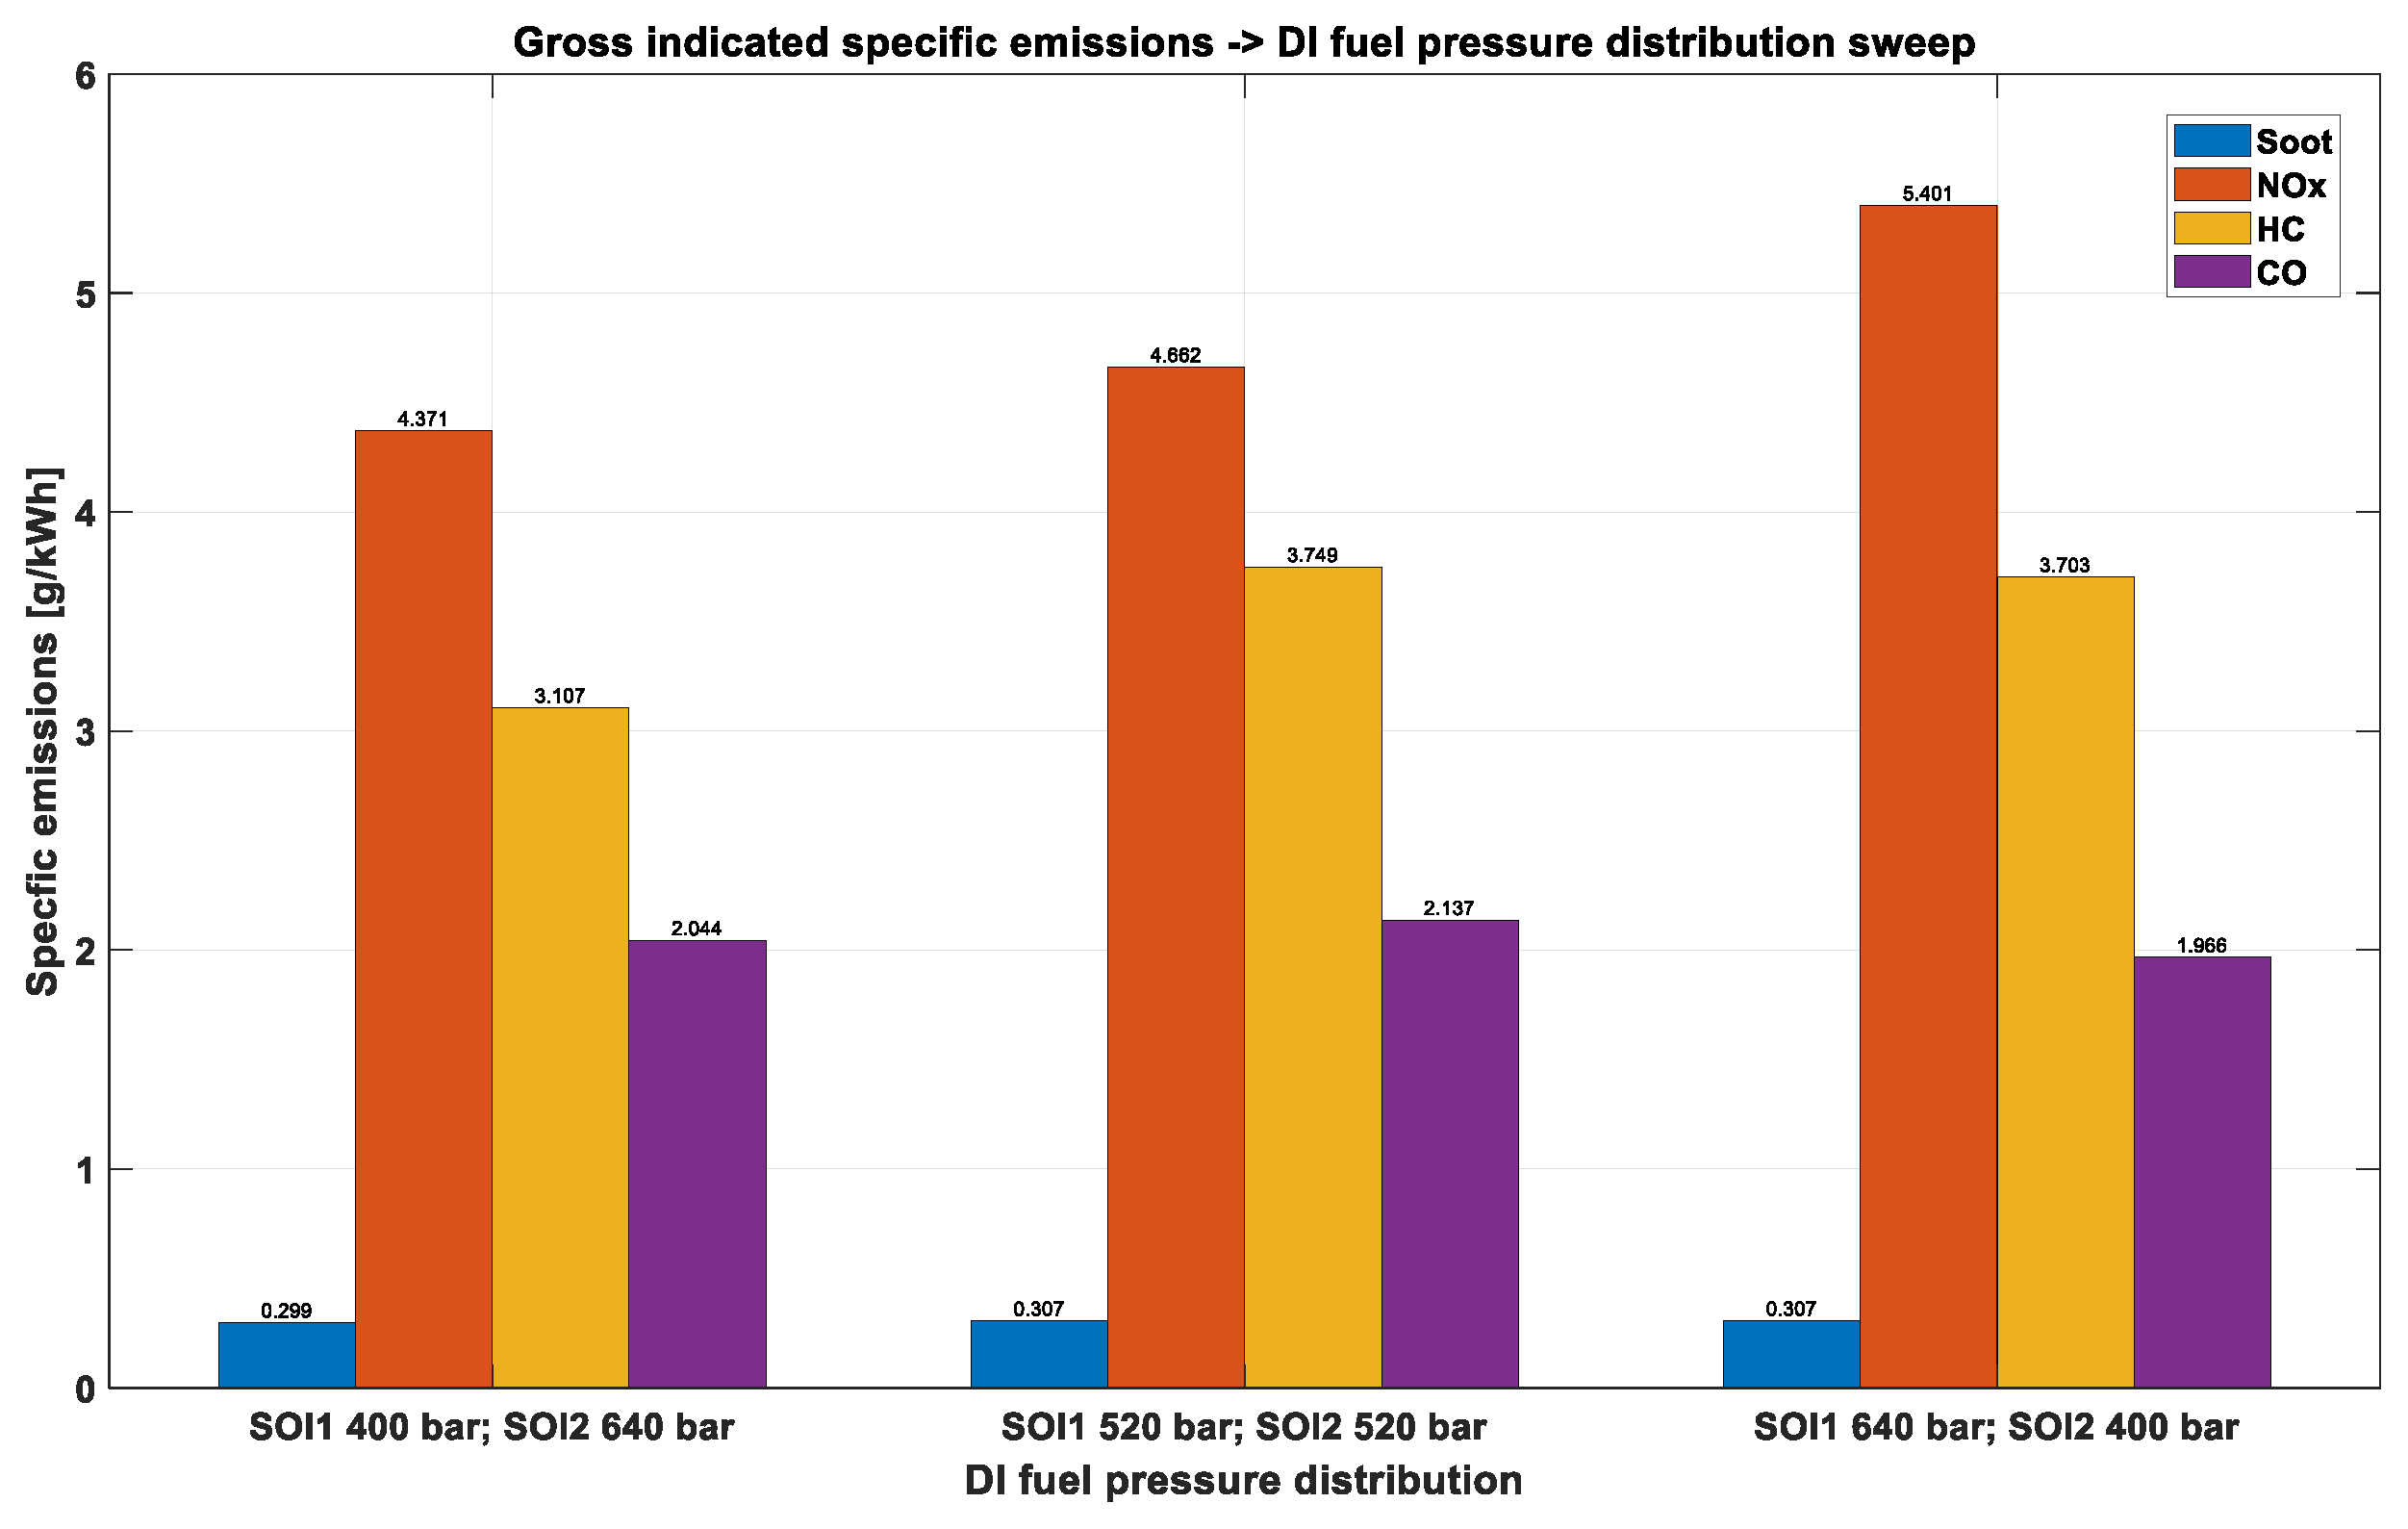
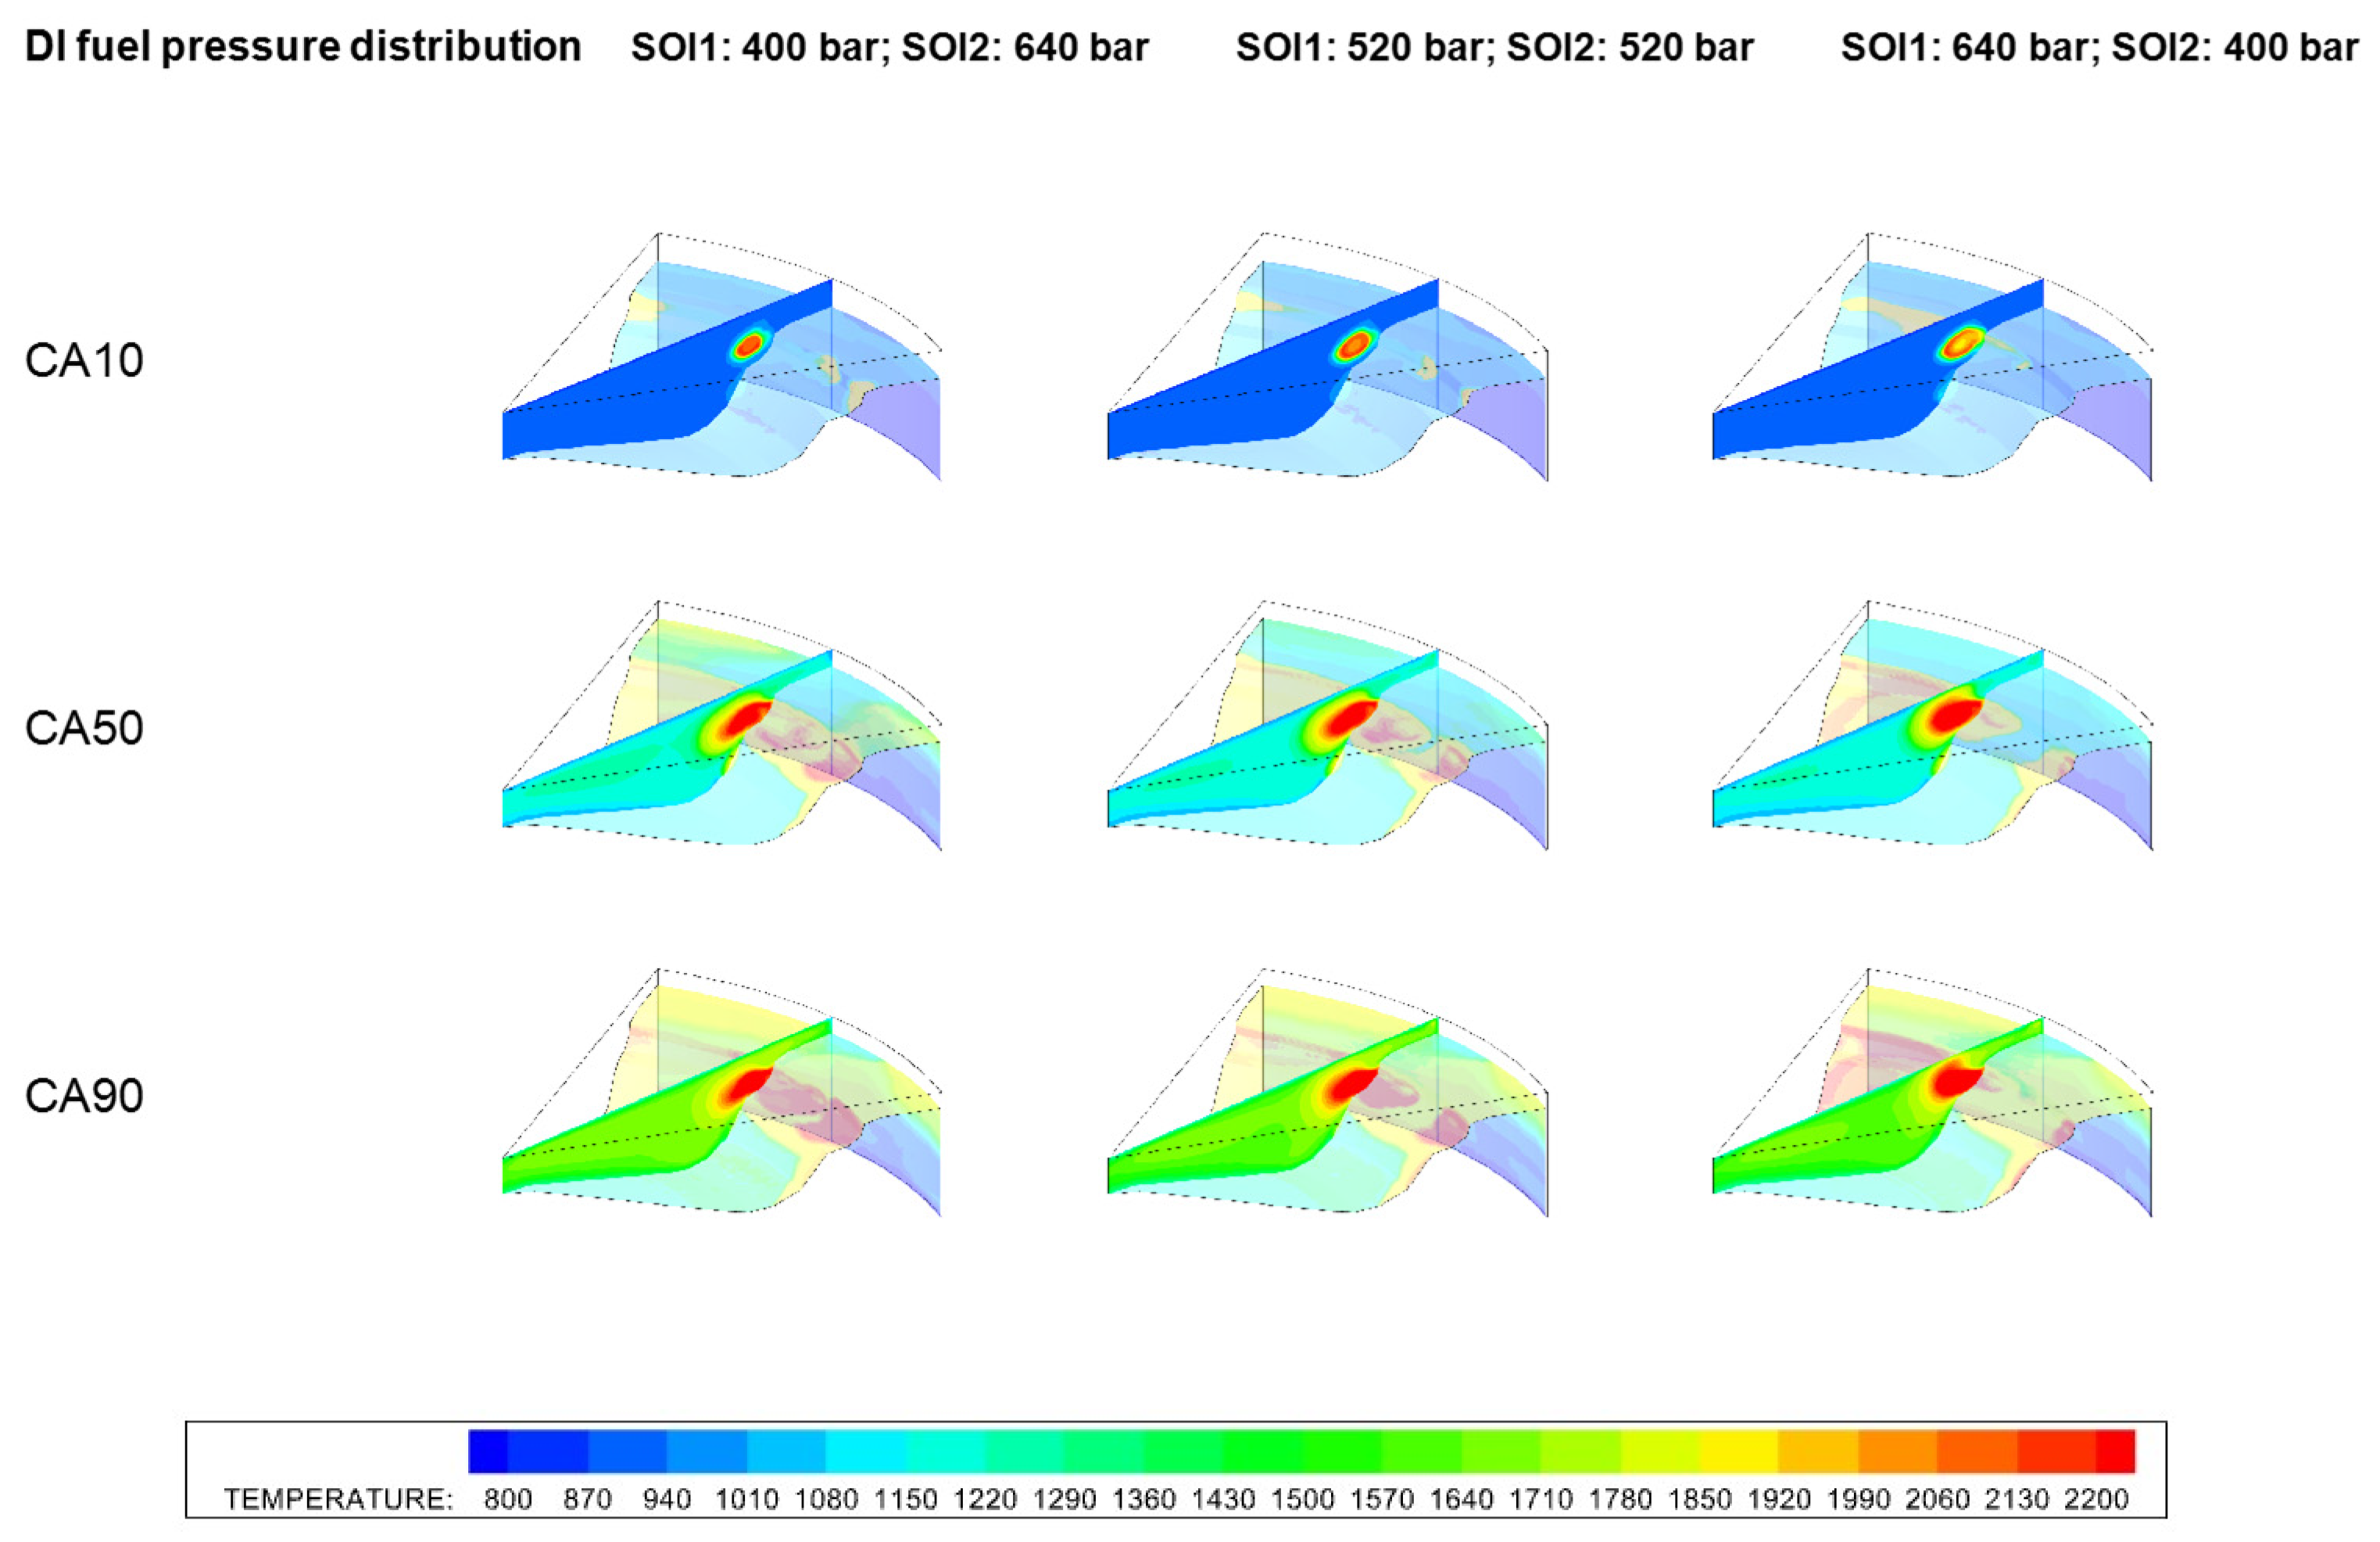
This section examines the effect of varying the fuel pressure of the second pulse (SOI2) on emissions. Preliminary simulations exploring variations in the fuel pressure of the first pulse showed minimal impact on emissions and engine performance. In the baseline double-pulse case, the fuel pressure for both pulses was approximately 520 bar. Two additional cases were analyzed: one with SOI2 at 400 bar (longer injection duration) and another with SOI2 at 640 bar (shorter injection duration). The in-cylinder pressure trace, aROHR, combustion phasing, and global gas temperature showed no significant differences between the three cases, so these plots were omitted for brevity. However, slight variations in NOx and HC emissions were observed across the cases as shown in Figure 19.
Increasing the injection pressure of the second pulse results in lower NOx. For HC, a slight increase is seen for higher fuel pressure of the second pulse. The contour plot for temperature can give more clarification for these trends and is displayed in Figure 20. The most noticeable phenomenon is that with the lower fuel pressure of SOI2, the region where high temperatures occur is bigger due to greater fuel stratification around the piston cup region. This results in more NOx formation. A higher fuel pressure for SOI2 leads to more DI fuel being evaporated, drawing heat energy from the gas mixture, leading to a slight increase in HC and a decrease in NOx.

4.2.2. Dual Direct Injection Strategy

This section elaborates on the effect of using direct injection of the two fuels rather than having iso-octane injection only inside the intake port. The approach is called dual direct injection (DDI). In the DDI concept, two DI injectors are present in the engine. With this setup, it is possible to have more control of the stratification of the charge reactivity. In this section, a comparison is made between setups with a fixed CA50 for three different injection strategies. The rest of the operating condition were kept the same as the base case. In this numerical setup, both the i-octane and the n-heptane were injected at the same location. The appropriate SOI in the DDI approach for heptane and octane were iteratively determined to match the CA50 (around −1.62 CAD aTDC) of the single, double, and triple DI cases.
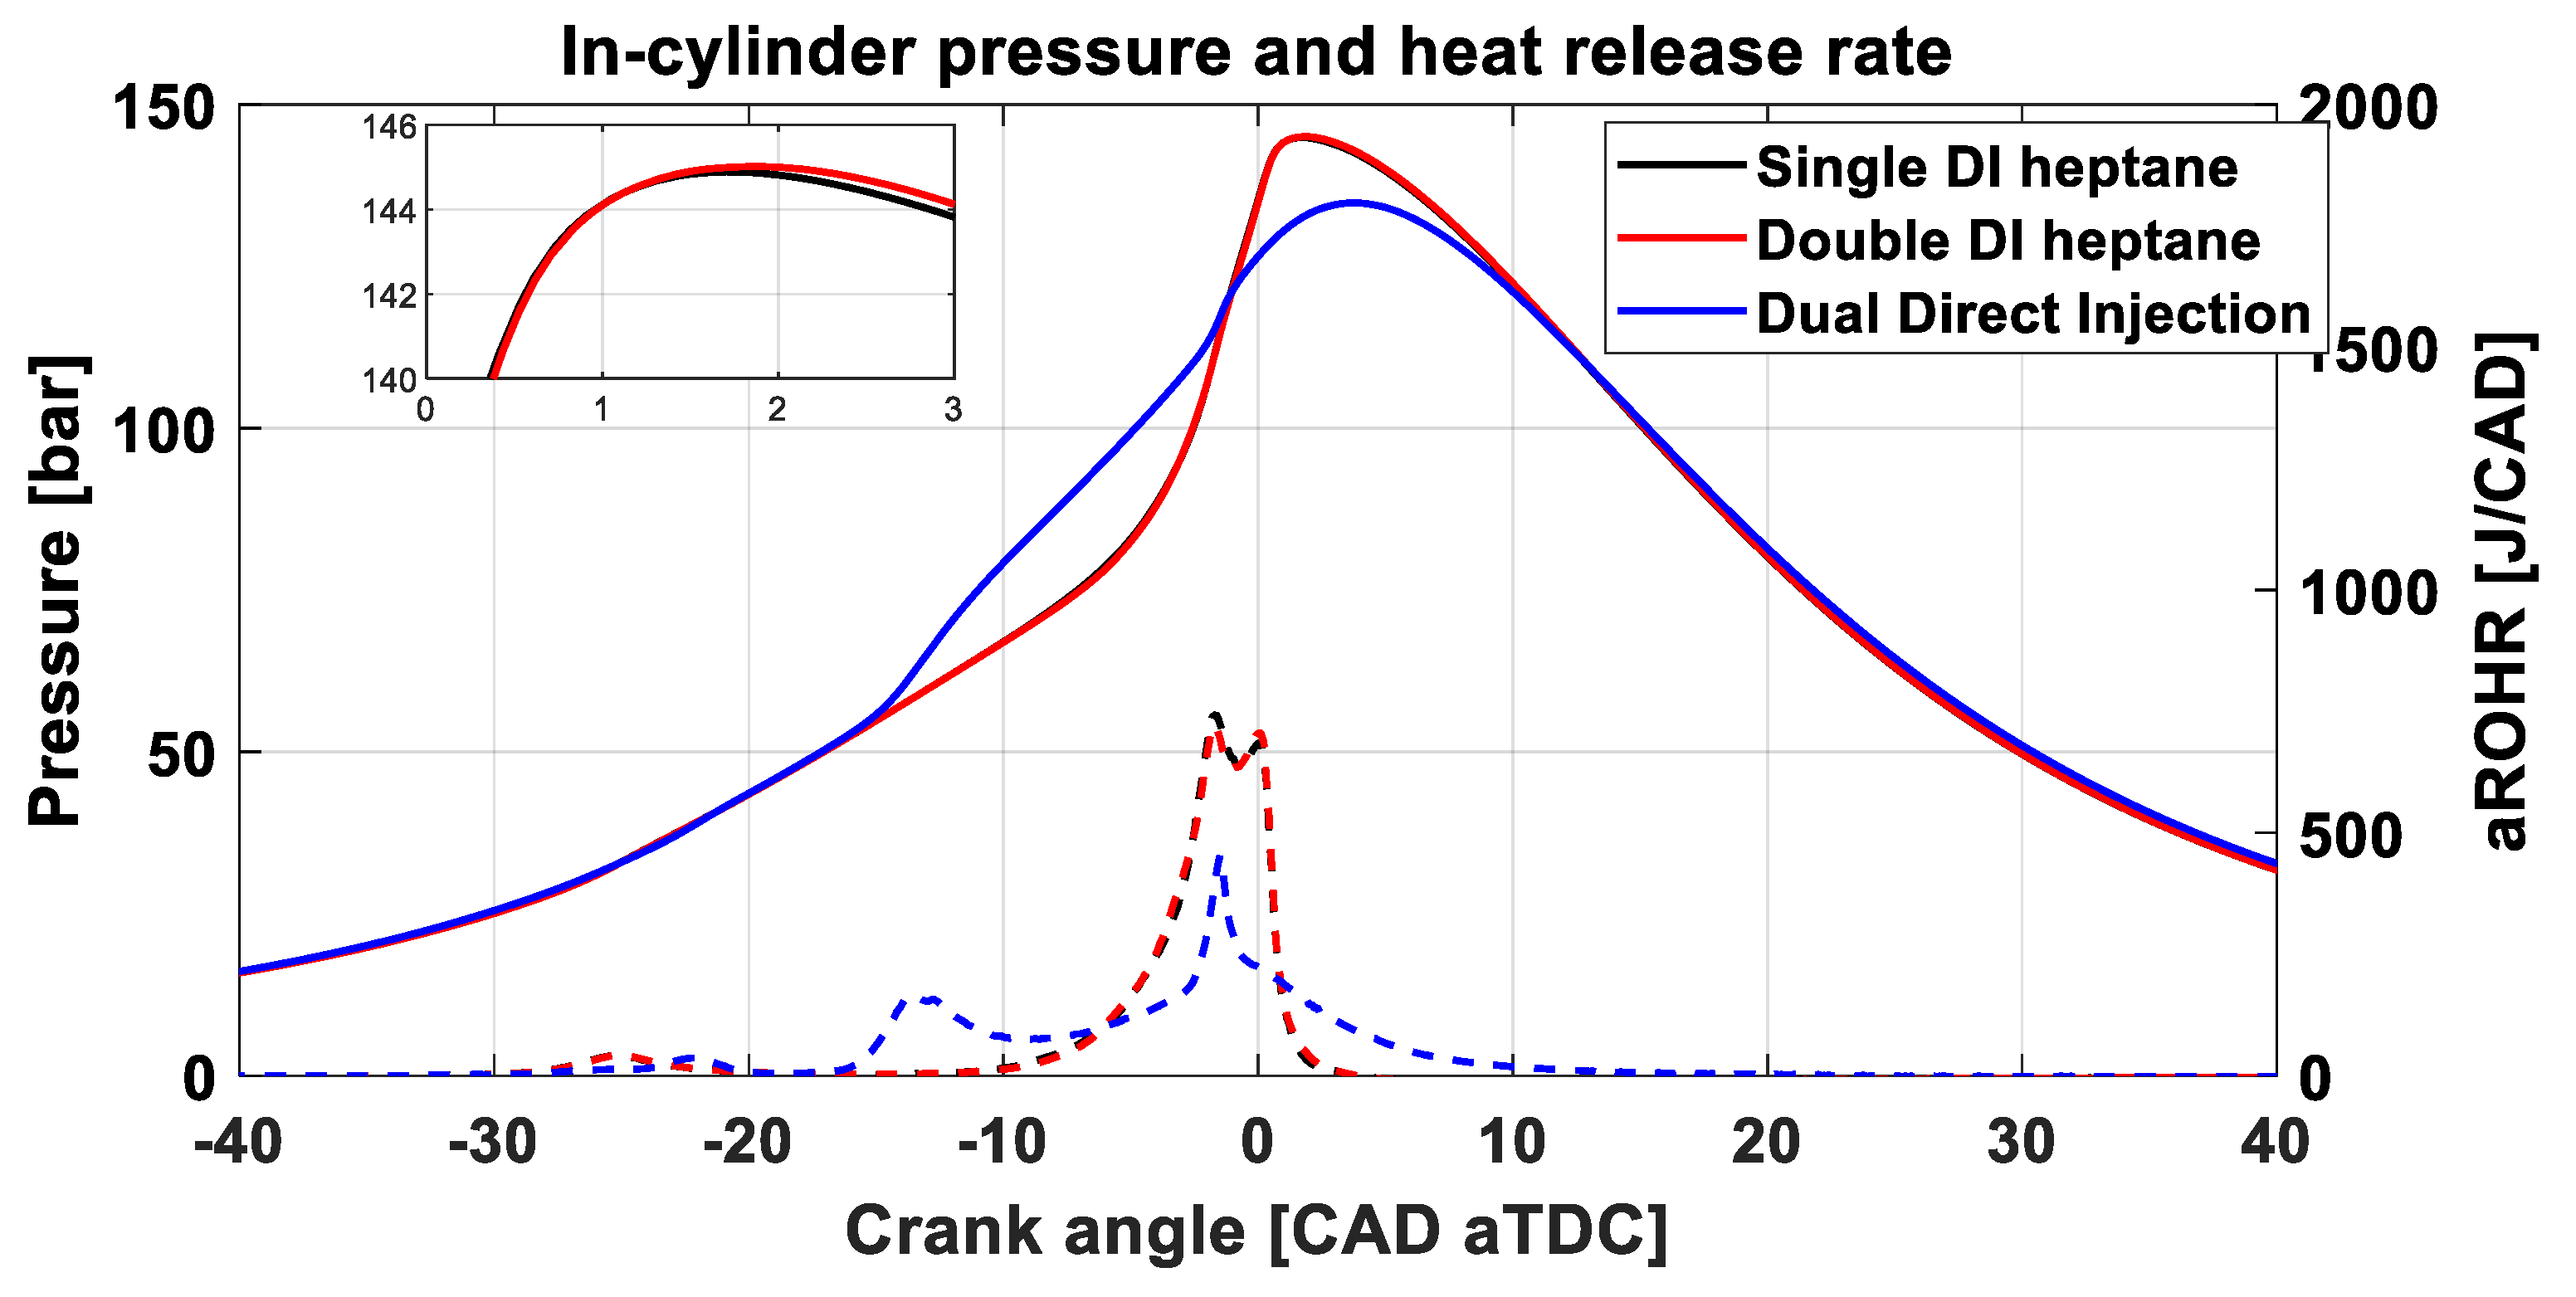
In the DDI setup, the ratio of octane to heptane remained constant, but the injection of octane into the combustion chamber was split into two pulses. The octane mass distribution was set at 63% for the first injection and 37% for the second. Since the first octane injection occurs at −340 CAD aTDC, outside the modeled 3D range from IVC (−153 CAD aTDC) to EVO (128 CAD aTDC), it is treated as premixed. Based on Wissink’s study [61], the injection timing of n-heptane and the second octane pulse was adjusted to achieve the same CA50. Additionally, the injection pressure for octane was set to 1000 bar, as the injection timing is close to TDC. Using these parameters and the settings detailed in Table 8, the three cases are compared. Figure 21 compares the average pressure and heat release rate of the three cases.
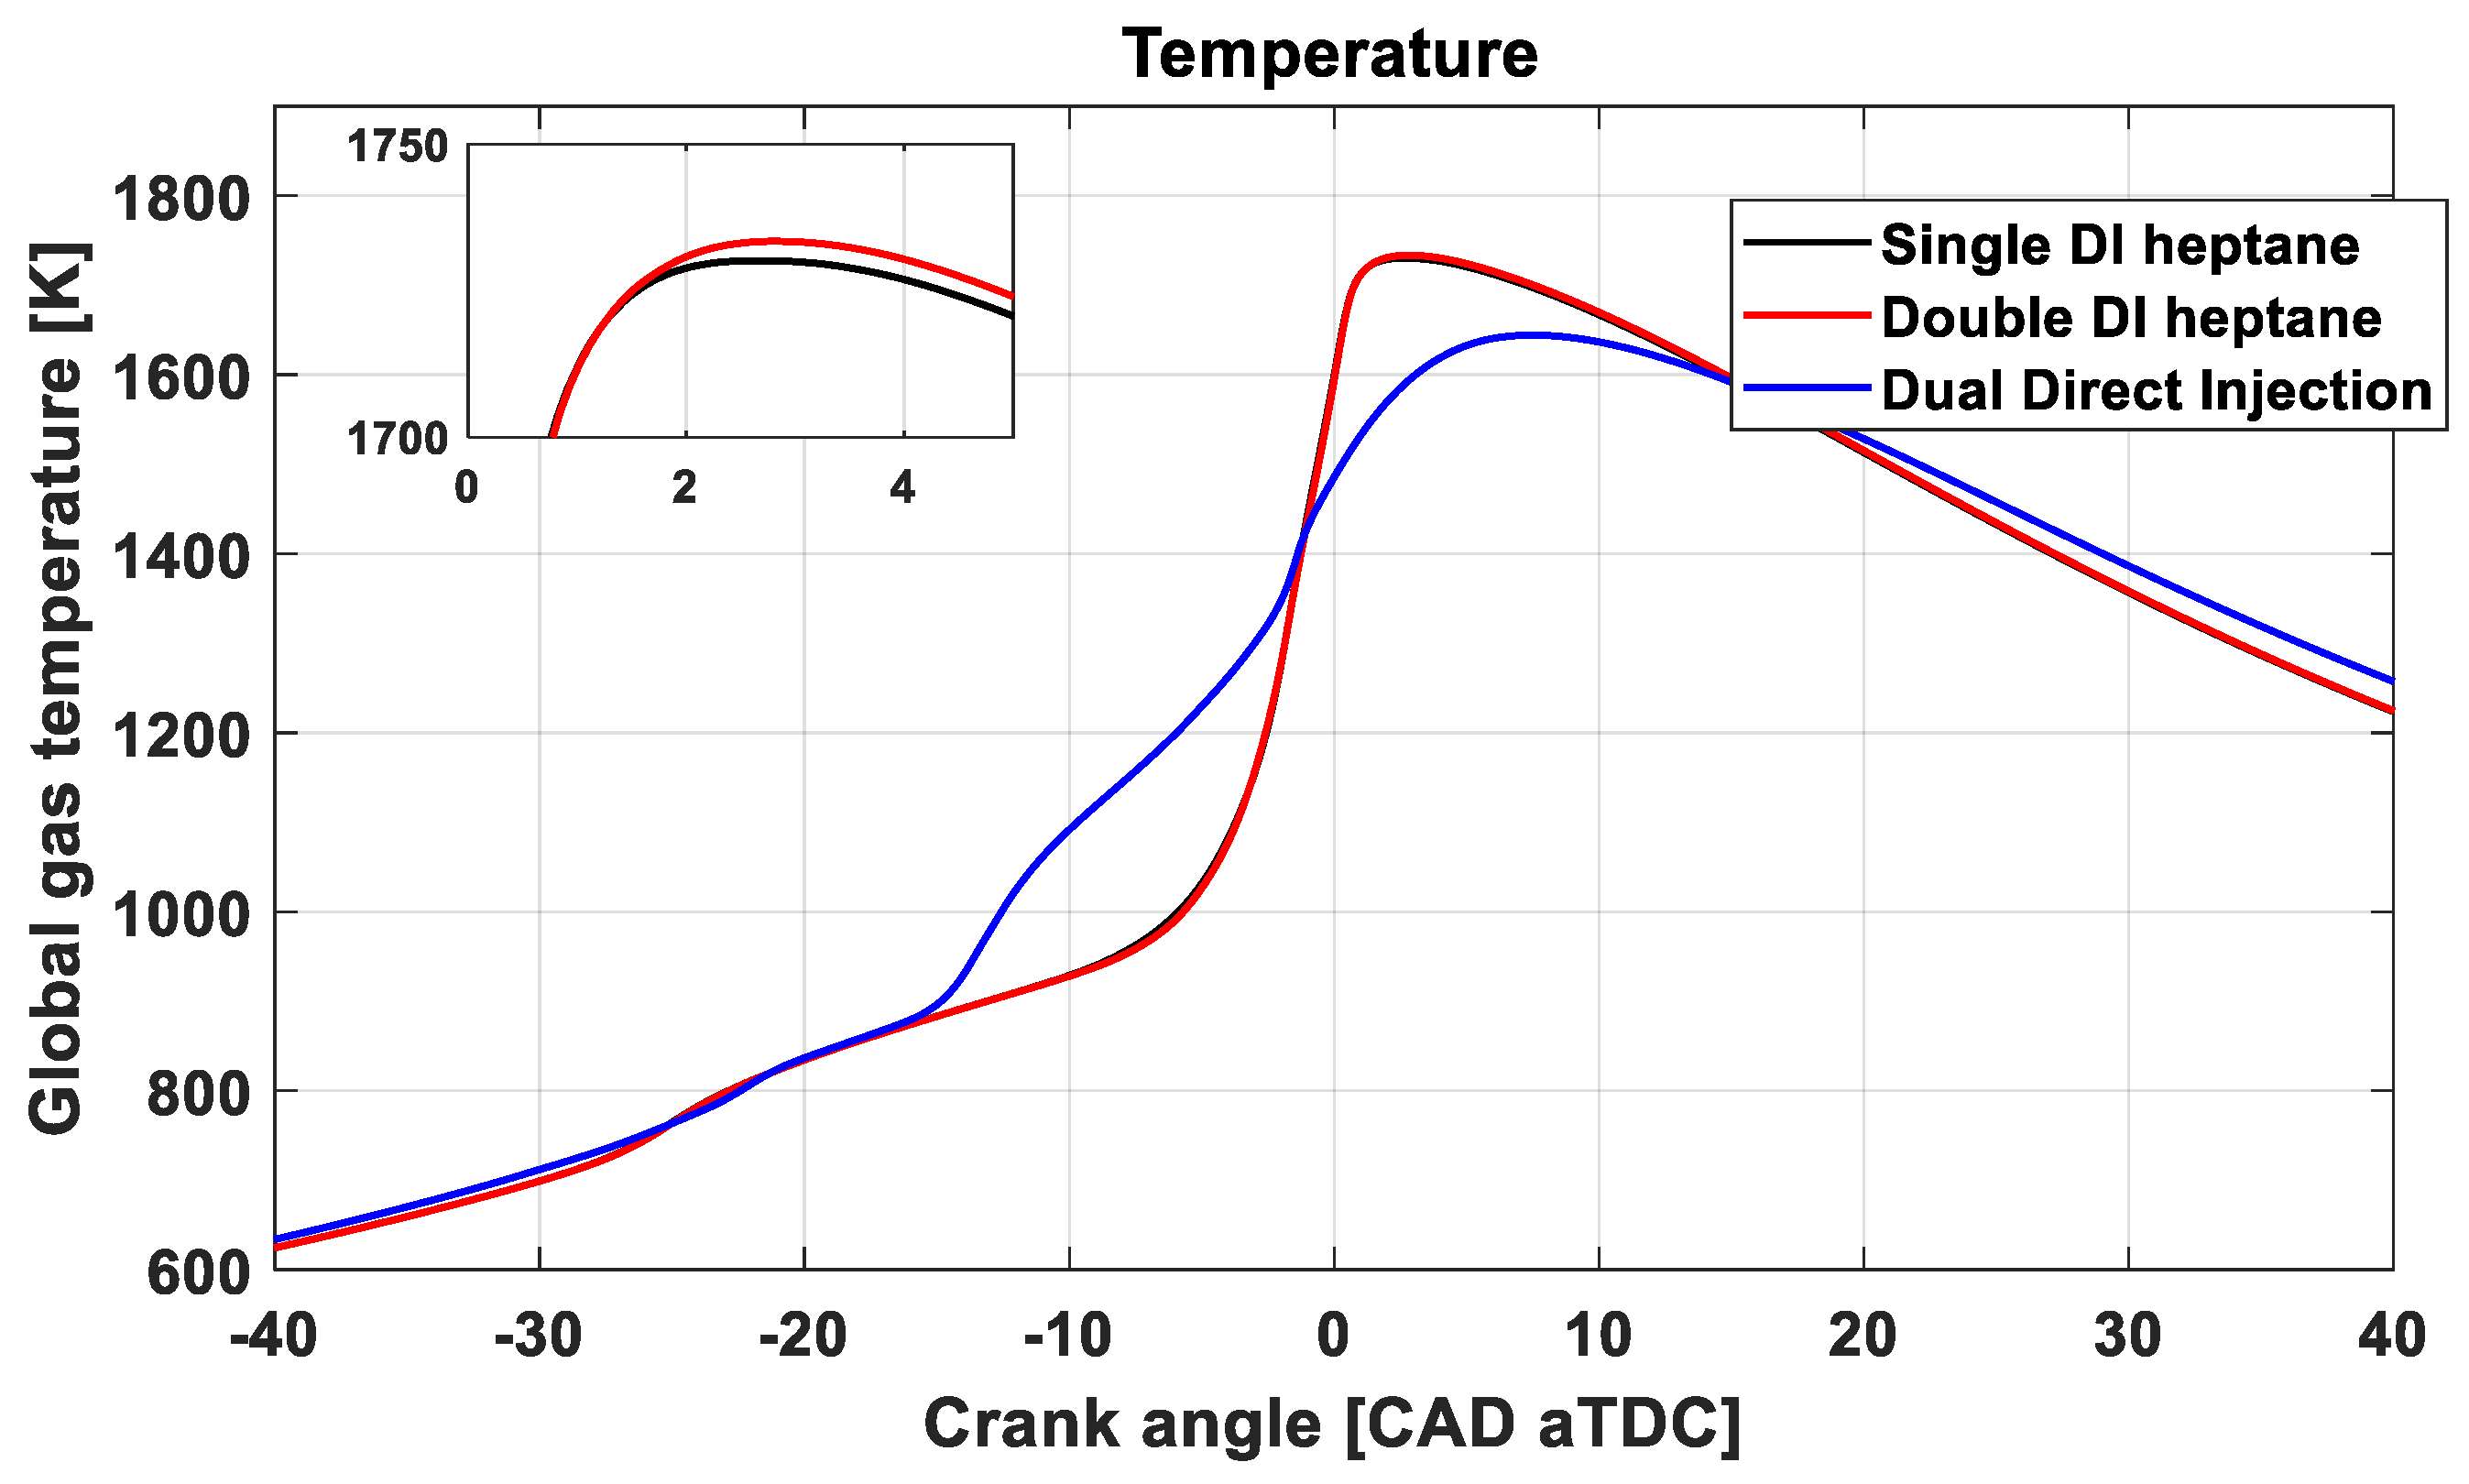
The combustion phasing graph is given in Figure 22. For the dual direct strategy, combustion timing is advanced due to a higher ratio of highly reactive heptane to premixed fuel, making the mixture more susceptible to self-ignition and leading to an earlier SOC. However, after octane injection at −5.5 CAD aTDC, a second combustion event occurs due to high compression and temperature within the cylinder. This combustion progresses more slowly, resulting in a lower peak pressure and longer heat release as shown in Figure 21. The in-cylinder global gas temperature is shown in Figure 23.
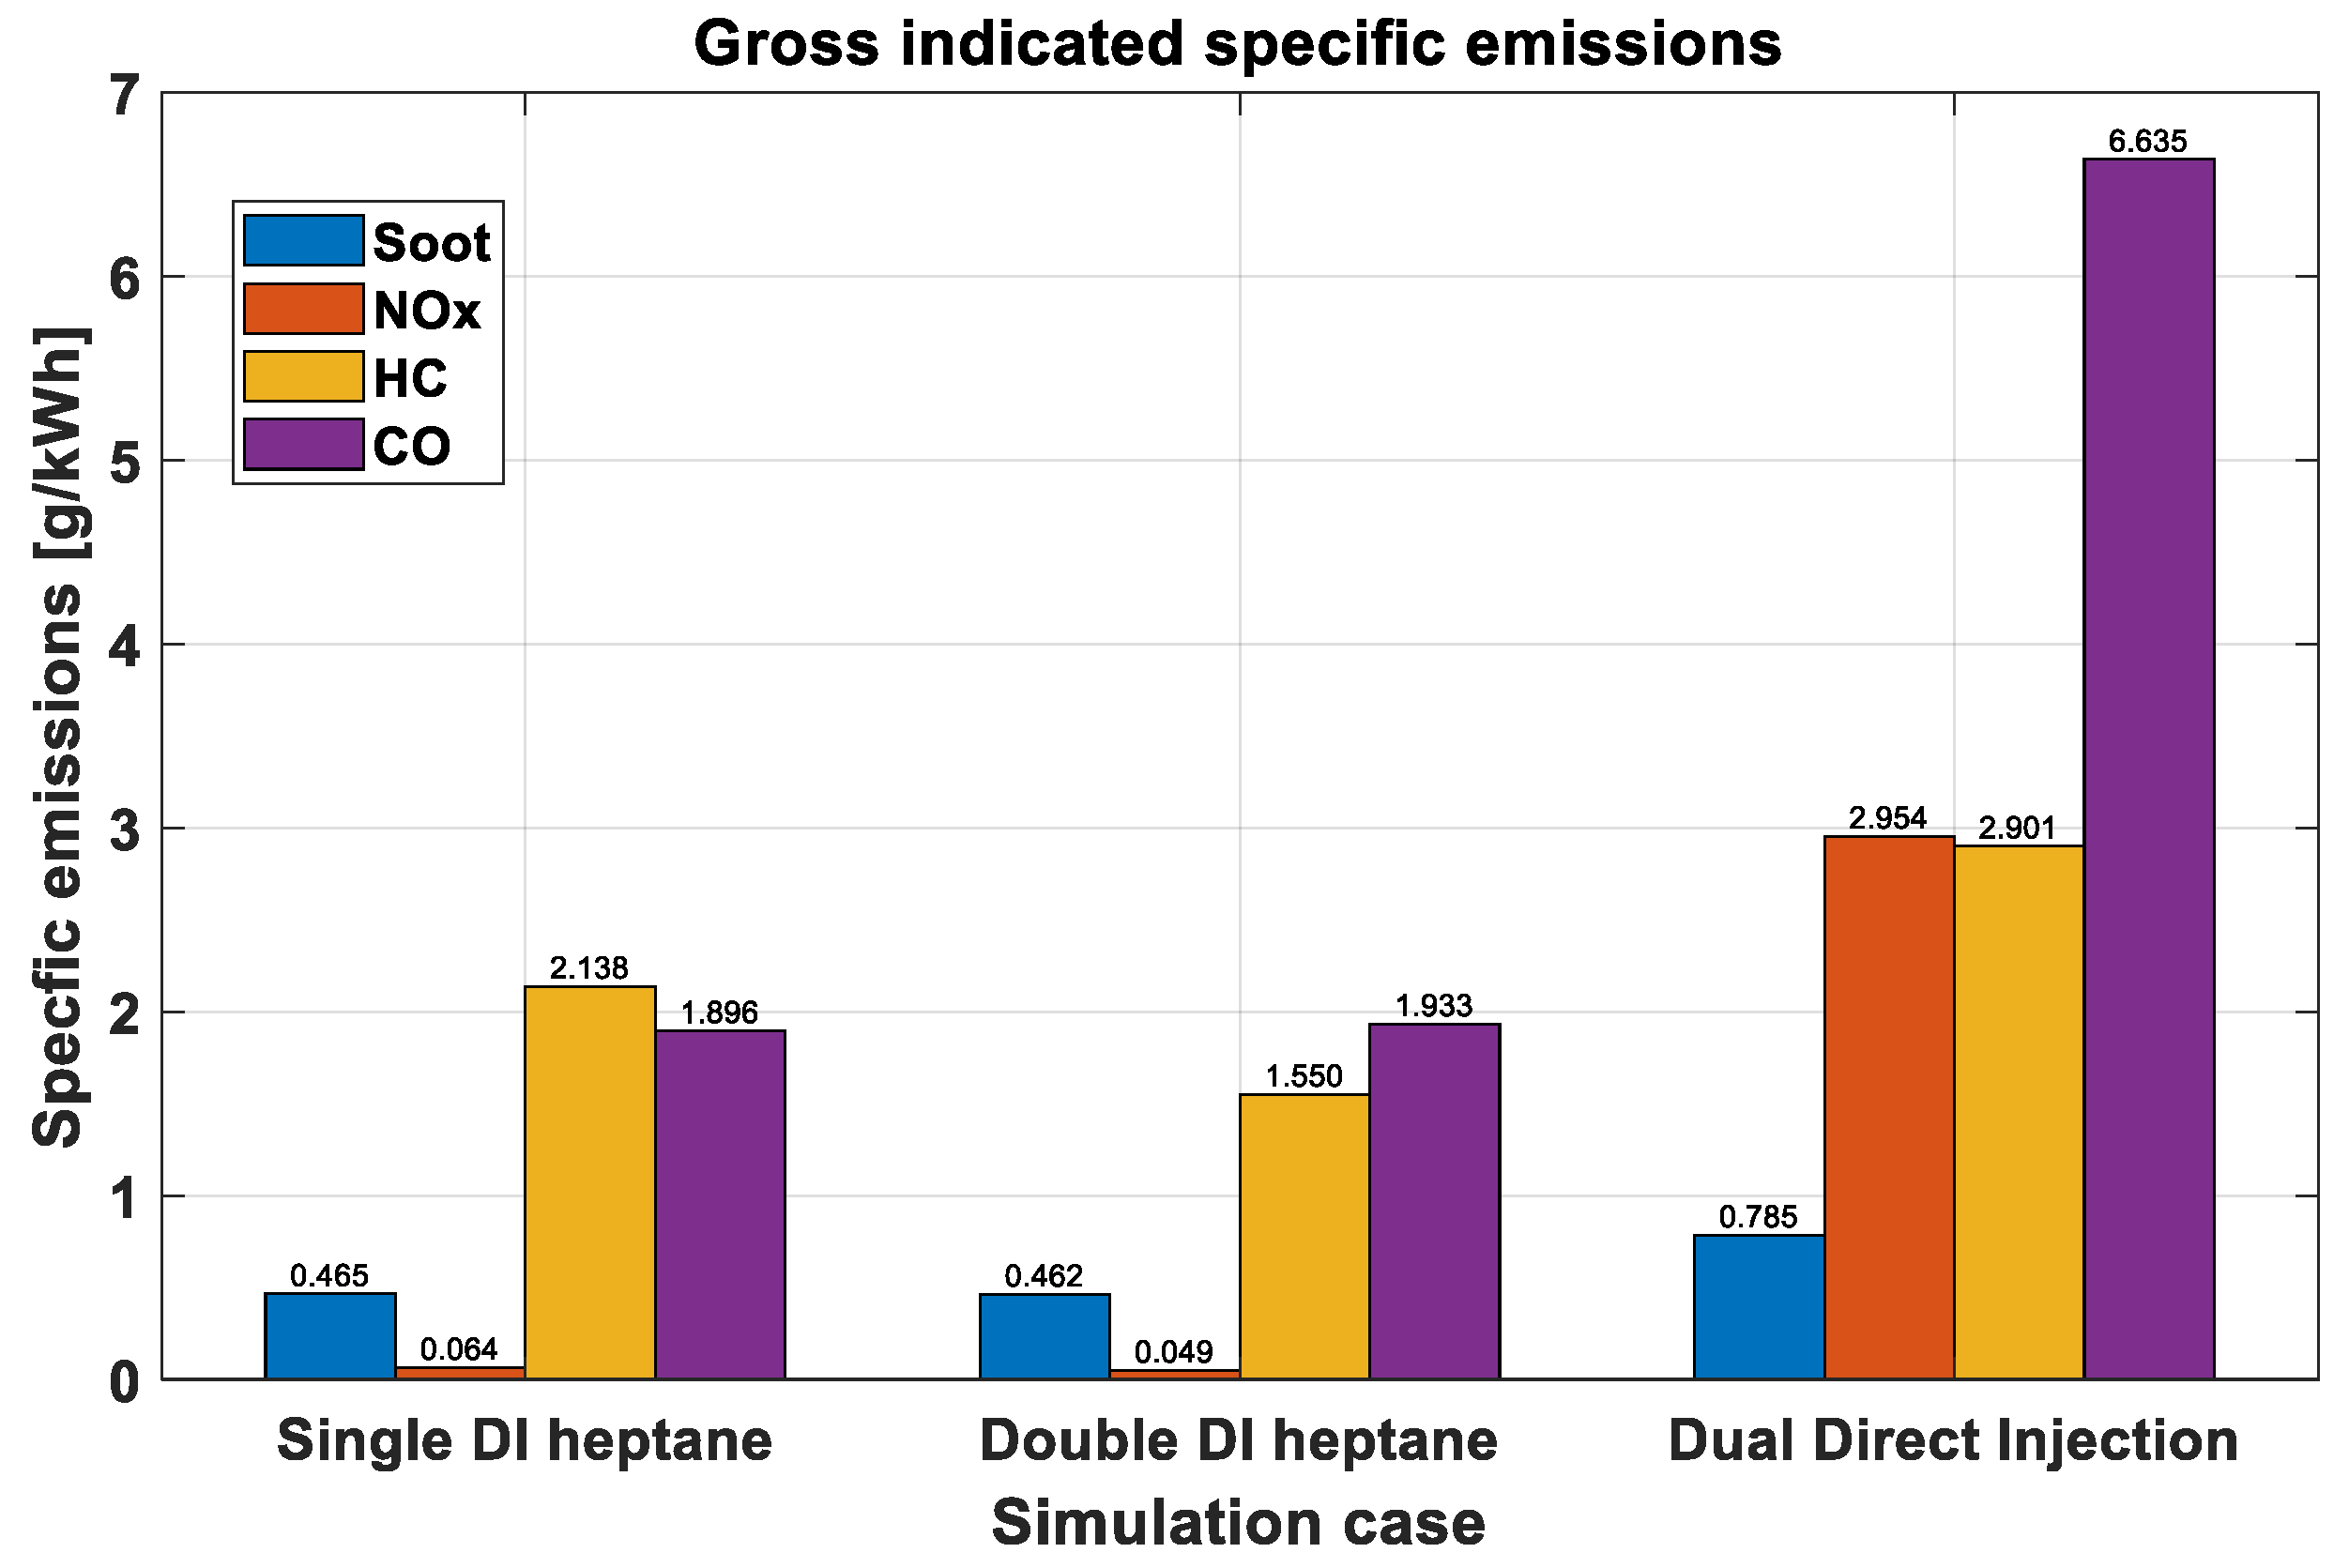
In the dual direct setting, the temperature around TDC is significantly lower. However, since SOC occurs earlier, the temperature is higher starting around –15 CAD aTDC compared to the single and double DI strategies. This temperature pattern affects emissions, as shown in Figure 24, with DDI producing much higher emissions compared to the single and double DI cases. While a lower global gas temperature might suggest reduced NOx emissions, the contour plots provide clarification for the observed increase.
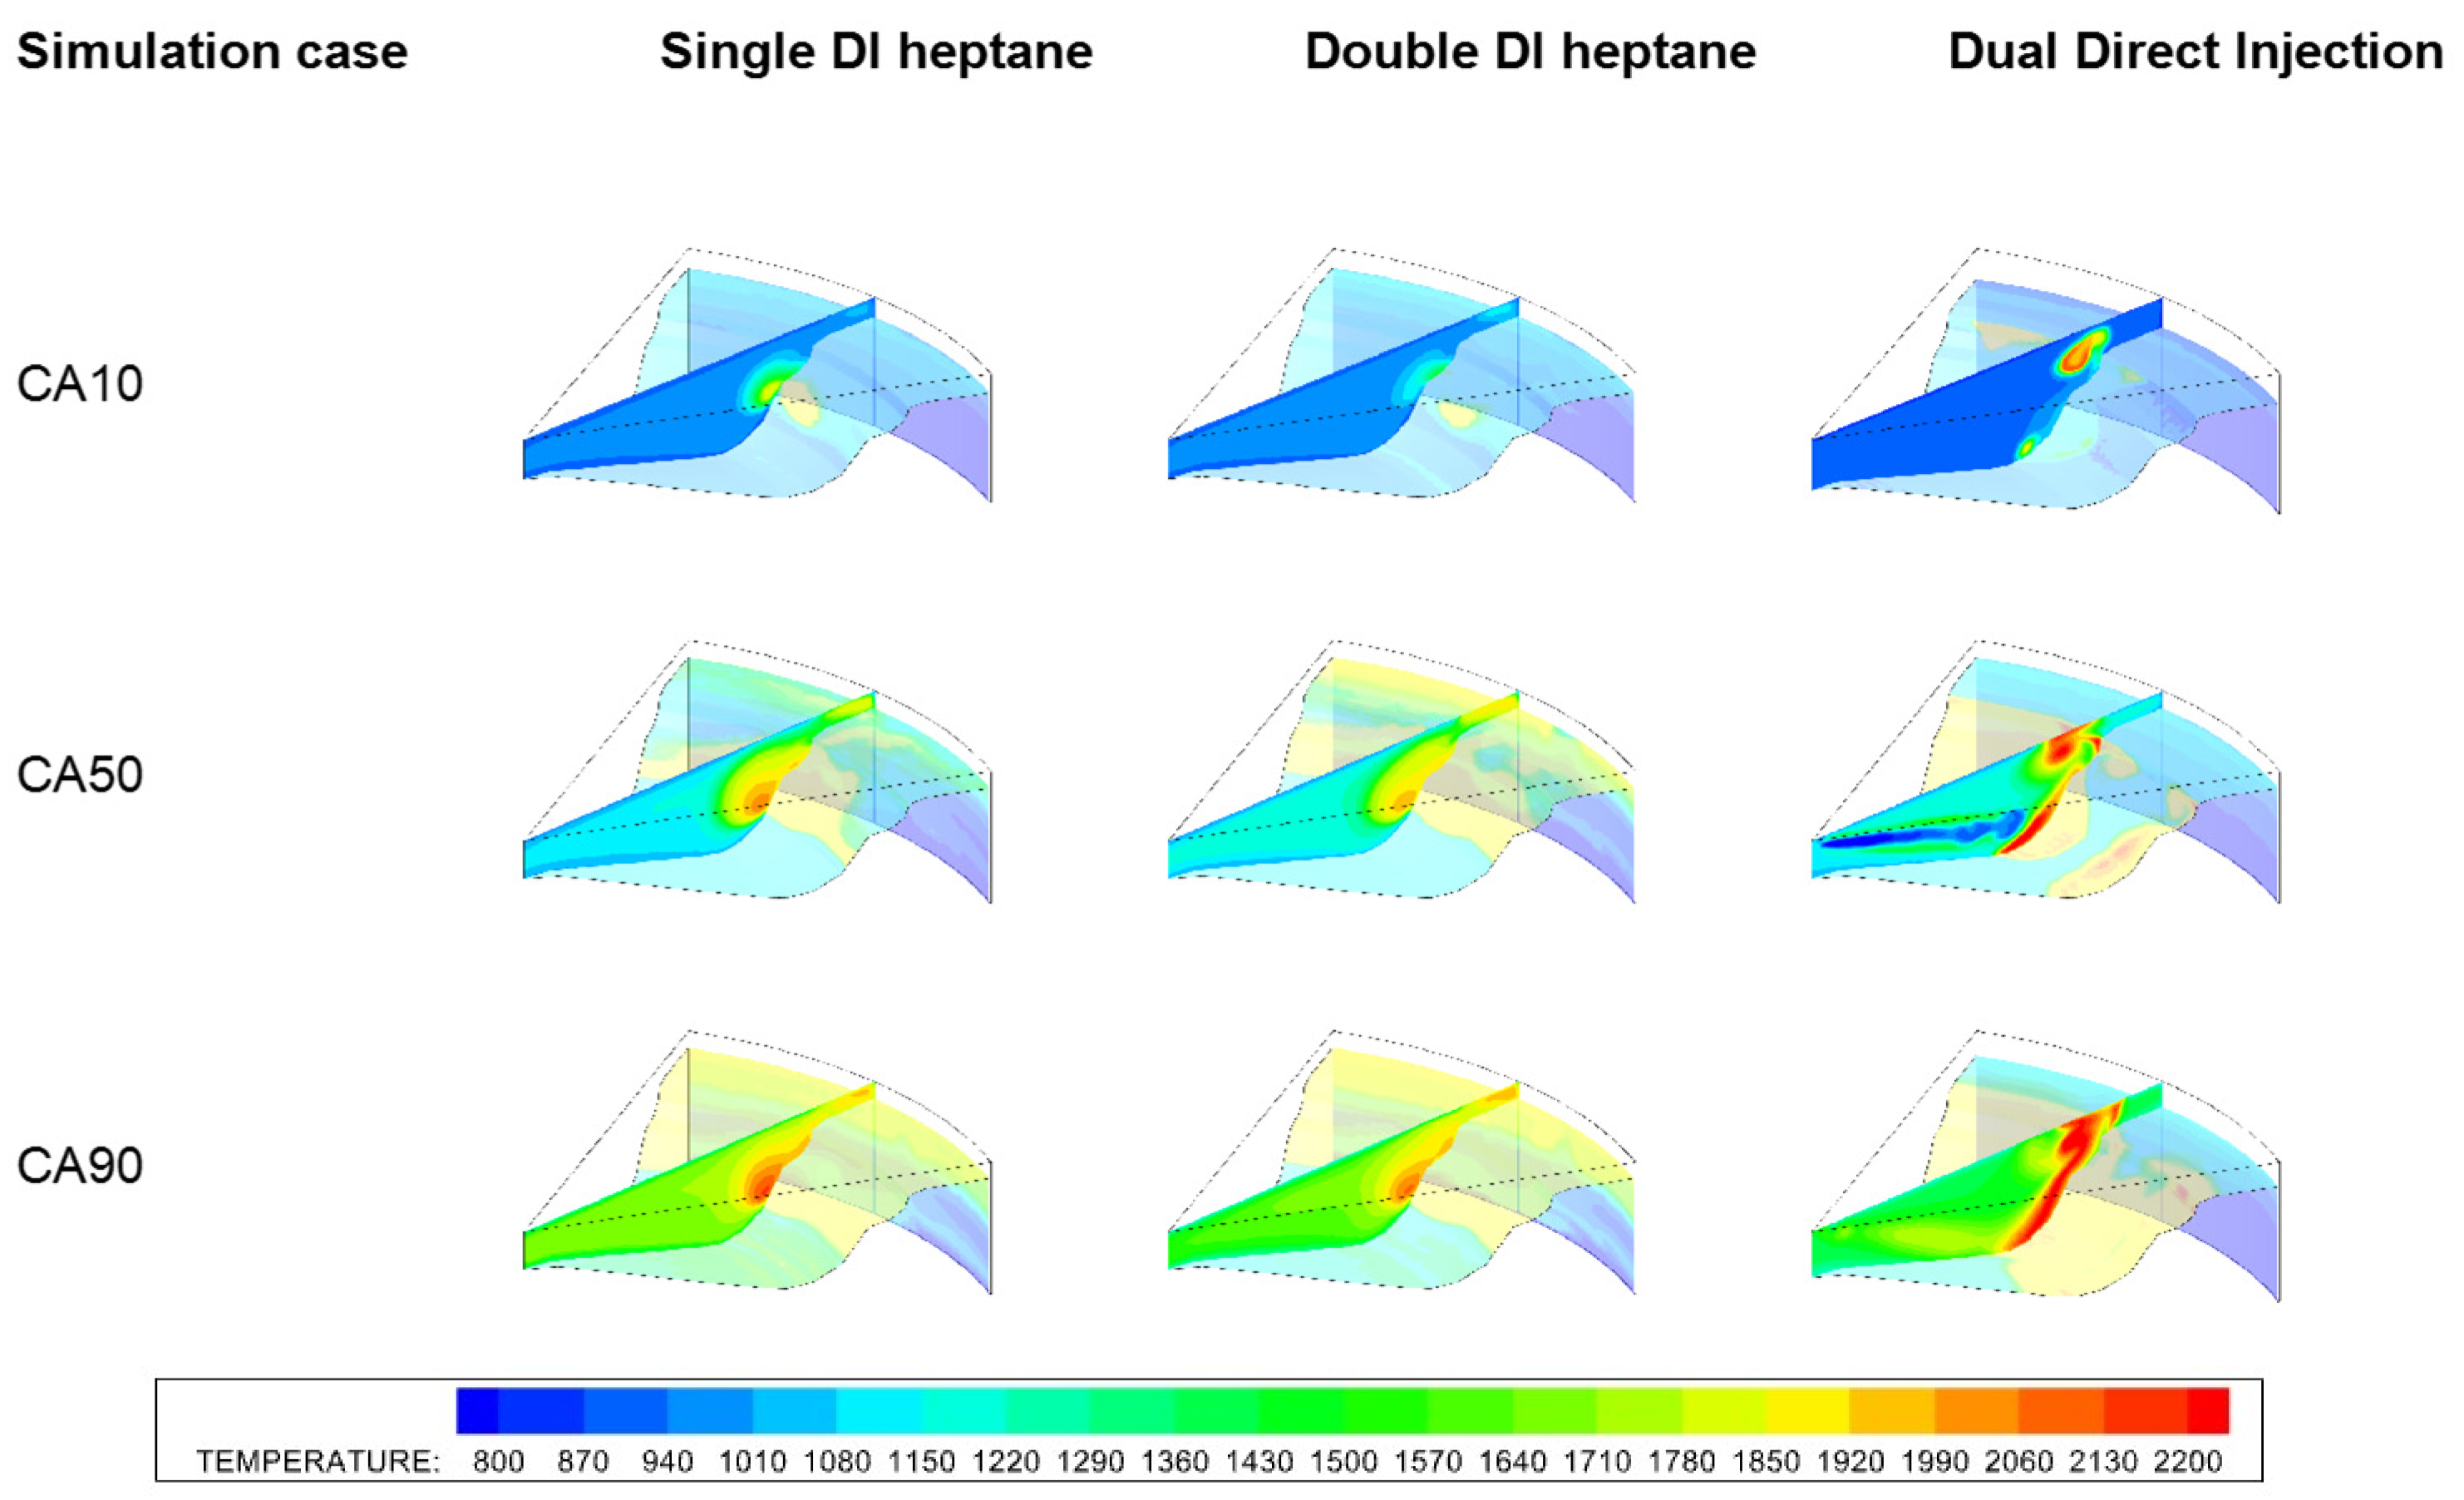
Figure 25 illustrates the temperature distribution resulting from the DDI setup. The local temperature at the piston cup boundary remains elevated for an extended period, encouraging NOx formation in that region. Additionally, the octane injection during the DDI process, visible in the CA50 image, causes a rapid temperature drop around the spray region, which leads to increased HC emissions. This phenomenon also contributes to higher CO emissions due to incomplete combustion. The CA10 trend further reveals that SOC occurs significantly earlier in the DDI setup. The results of the DDI strategy are summarized in Table 9. The DDI strategy clearly reduces RI (ringing intensity) and MPRR (maximum pressure rise rate) while maintaining engine power and combustion efficiency. Lower RI and MPRR helps the engine to operate smoothly at higher loads. The primary reason for the reduced RI and MPRR values is the injection of octane just before TDC, which extends the combustion duration.
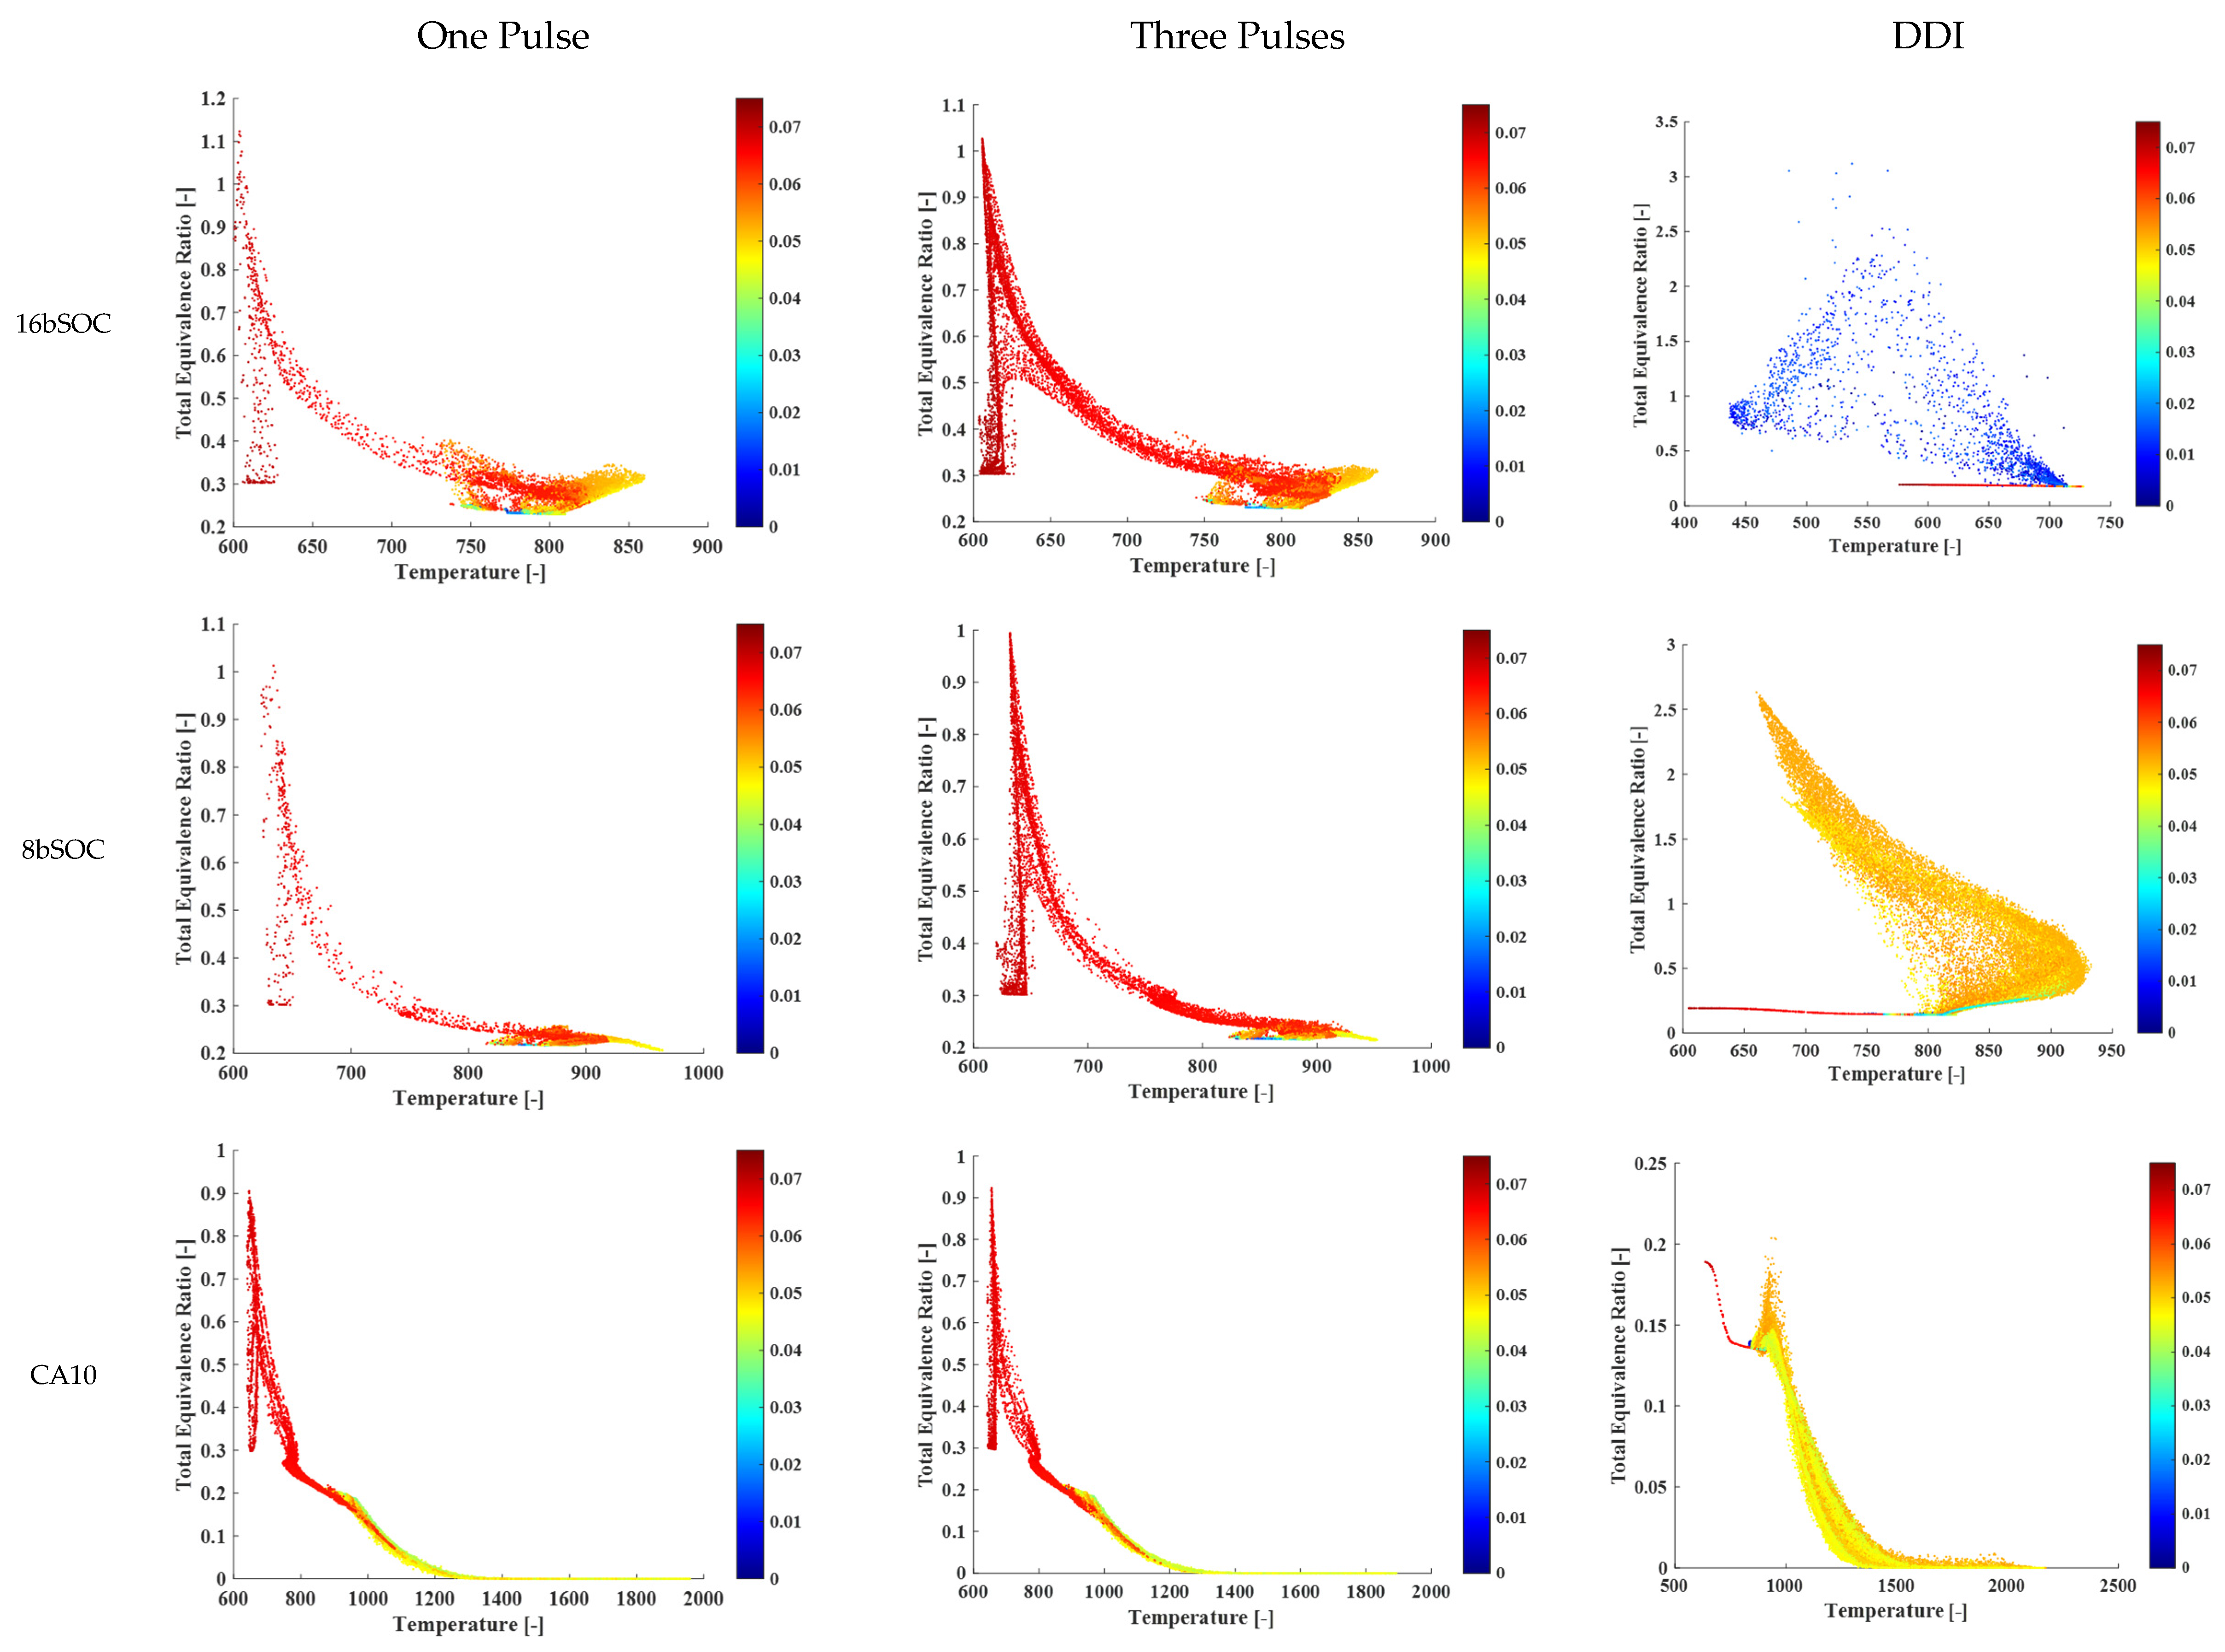
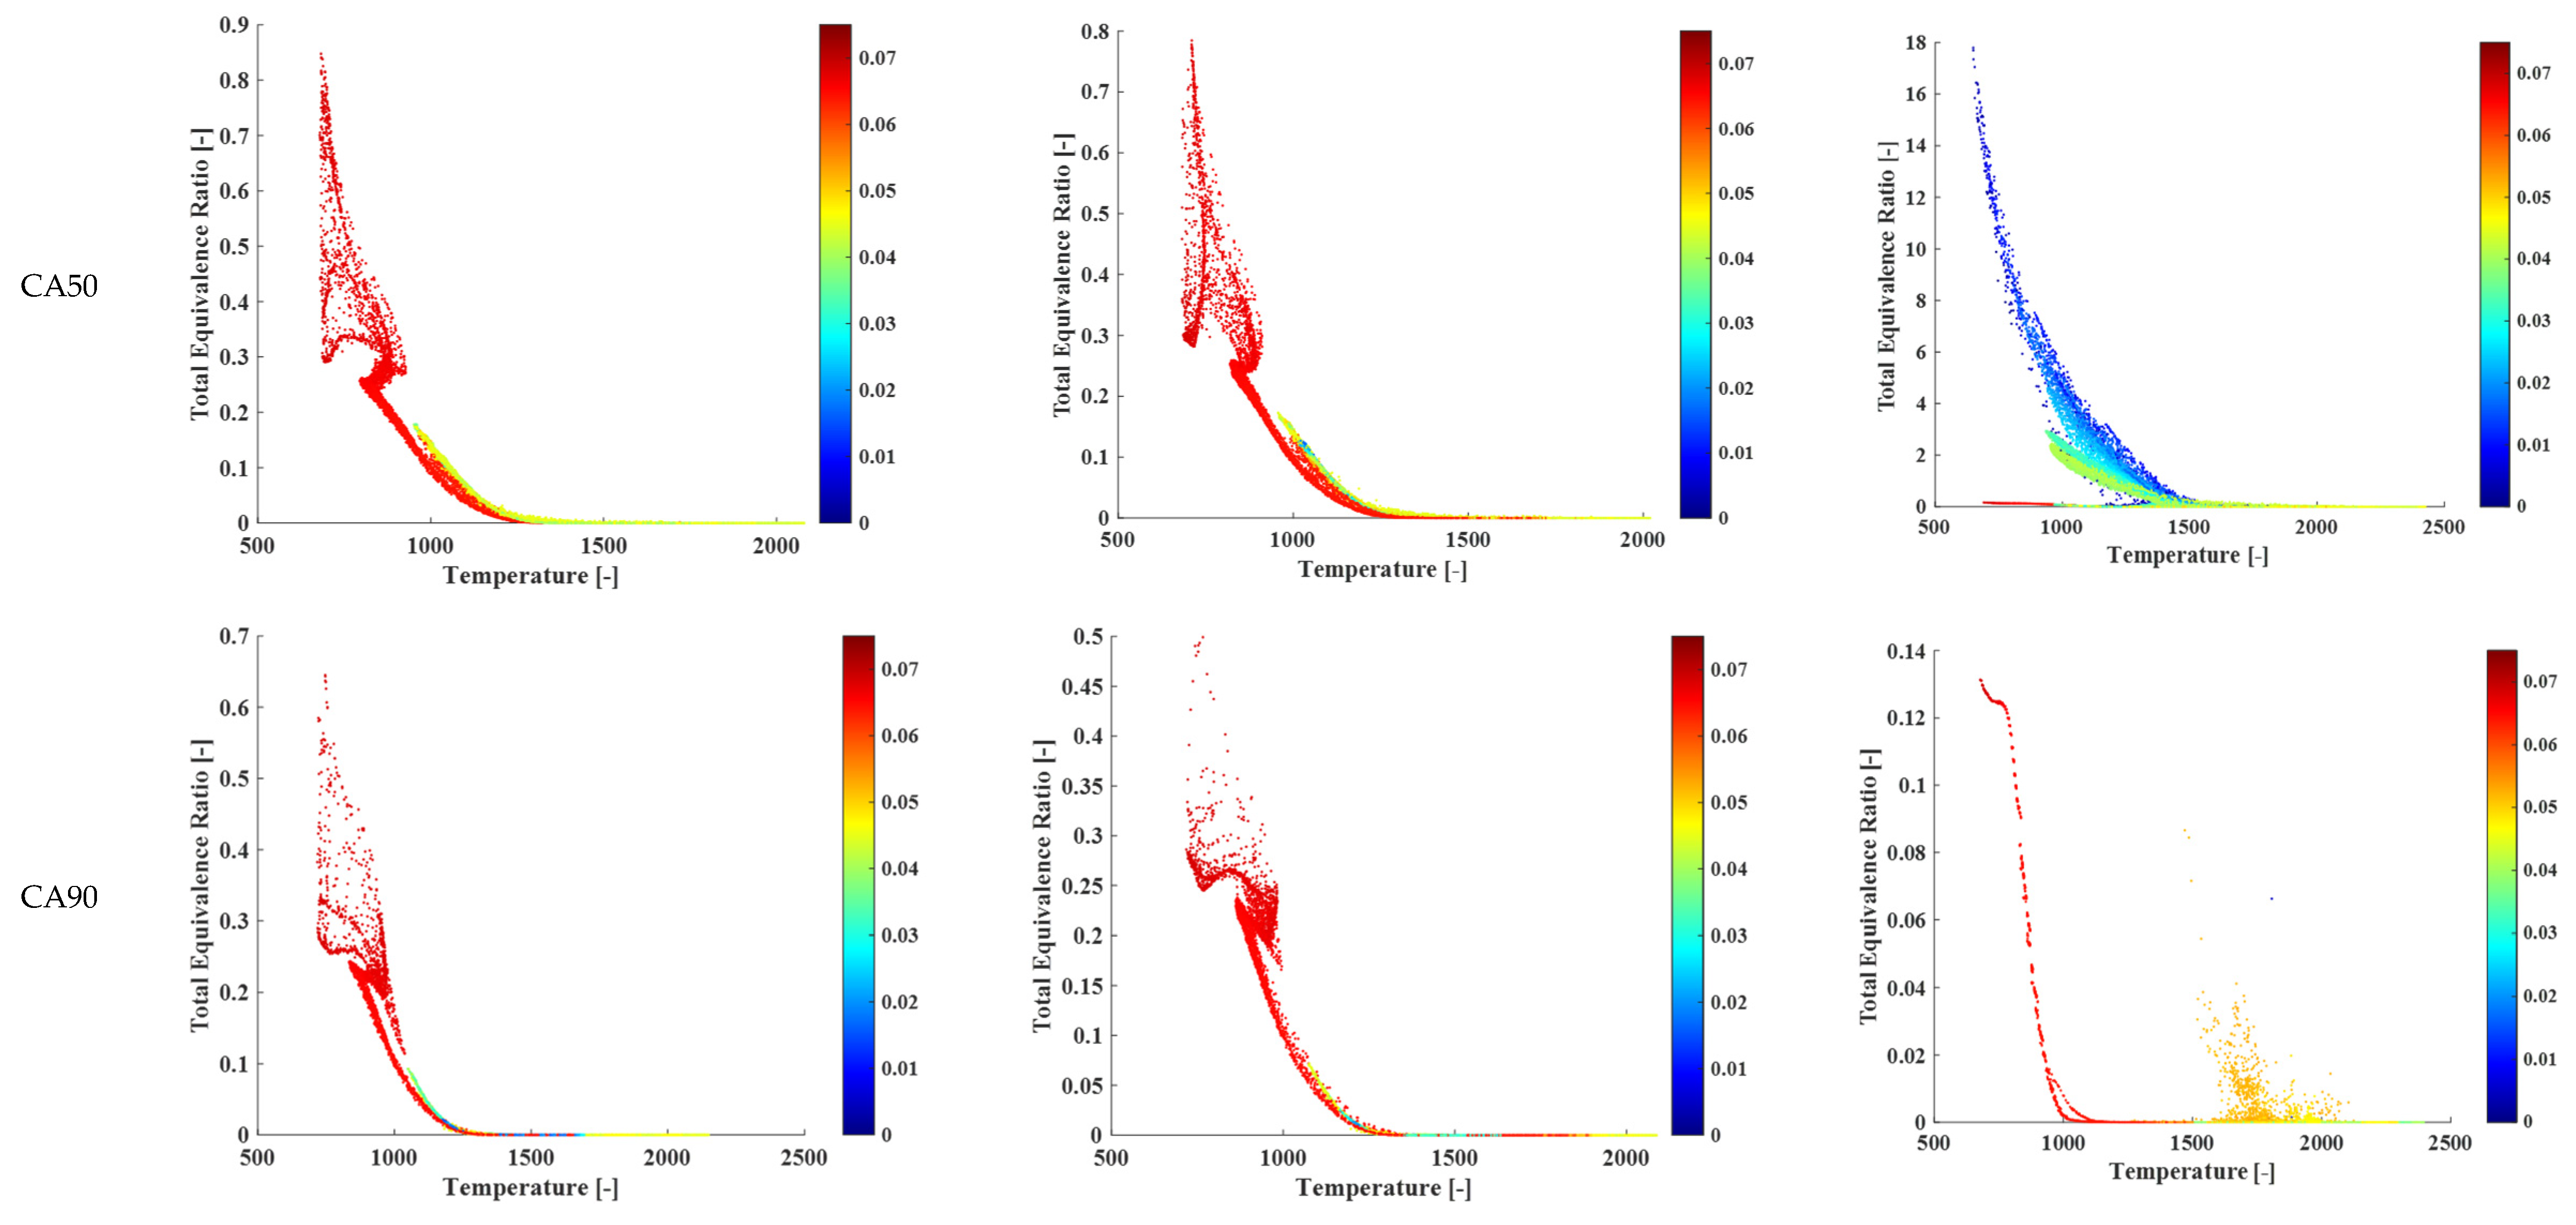
Figure 26 shows the distribution of total equivalence ratio and temperature throughout the cylinder at five different computational times in the three strategies of one pulse, three pulses, and DDI. The points are colored with the distance from the injector. It can be seen that at the time of 16bSOC, with the increase in the number of injection pulses, fuel vaporization becomes easier, more cells have a high equivalence ratio, and these cells are near the crevice area and farther away from the injector. But the maximum value of the equivalence ratio with only one injection pulse is always higher because all the fuel is injected at once, and the fuel is more concentrated in one area of the cylinder. In the DDI strategy at 16bTDC timing, since the diesel fuel the fuel is being injected, and a large amount of fuel is still concentrated near the injector, the value of the equivalence ratio is higher near the injector. However, at the time of 8bSOC, a large amount of fuel evaporates and mixes with the premixed charge inside the cylinder, and as a result, more cells contain fuel. The evaporated fuel accumulates near the edge of the piston bowl step and is therefore at a distance of 5 cm from the injector, which leads to the start of combustion from this area. After the start of combustion, the fuel is consumed in this area, and the value of the equivalence ratio decreases significantly (as is clear at the time of CA10). At CA50, when octane injection starts, the equivalence ratio value increases again, and it is higher near the injector. The higher local equivalence ratio and later injection in DDI compared to the other two strategies causes the local temperature inside the cylinder to be higher in all the shown computational times. As is clear from the figures, the degree of stratification, which is determined by the range of equivalence ratio, is much higher in DDI.

4.3. EGR Percentage

This section reports the influence of EGR defined by the following equation on engine output characteristics.
EGR = C O 2 ,   in 0.0415 C O 2 ,   exh 0.0415
where CO2,in and CO2,exh are the concentrations in mole in the intake and exhaust ports, and 0.0415 is the CO2 concentration in the atmosphere [62].
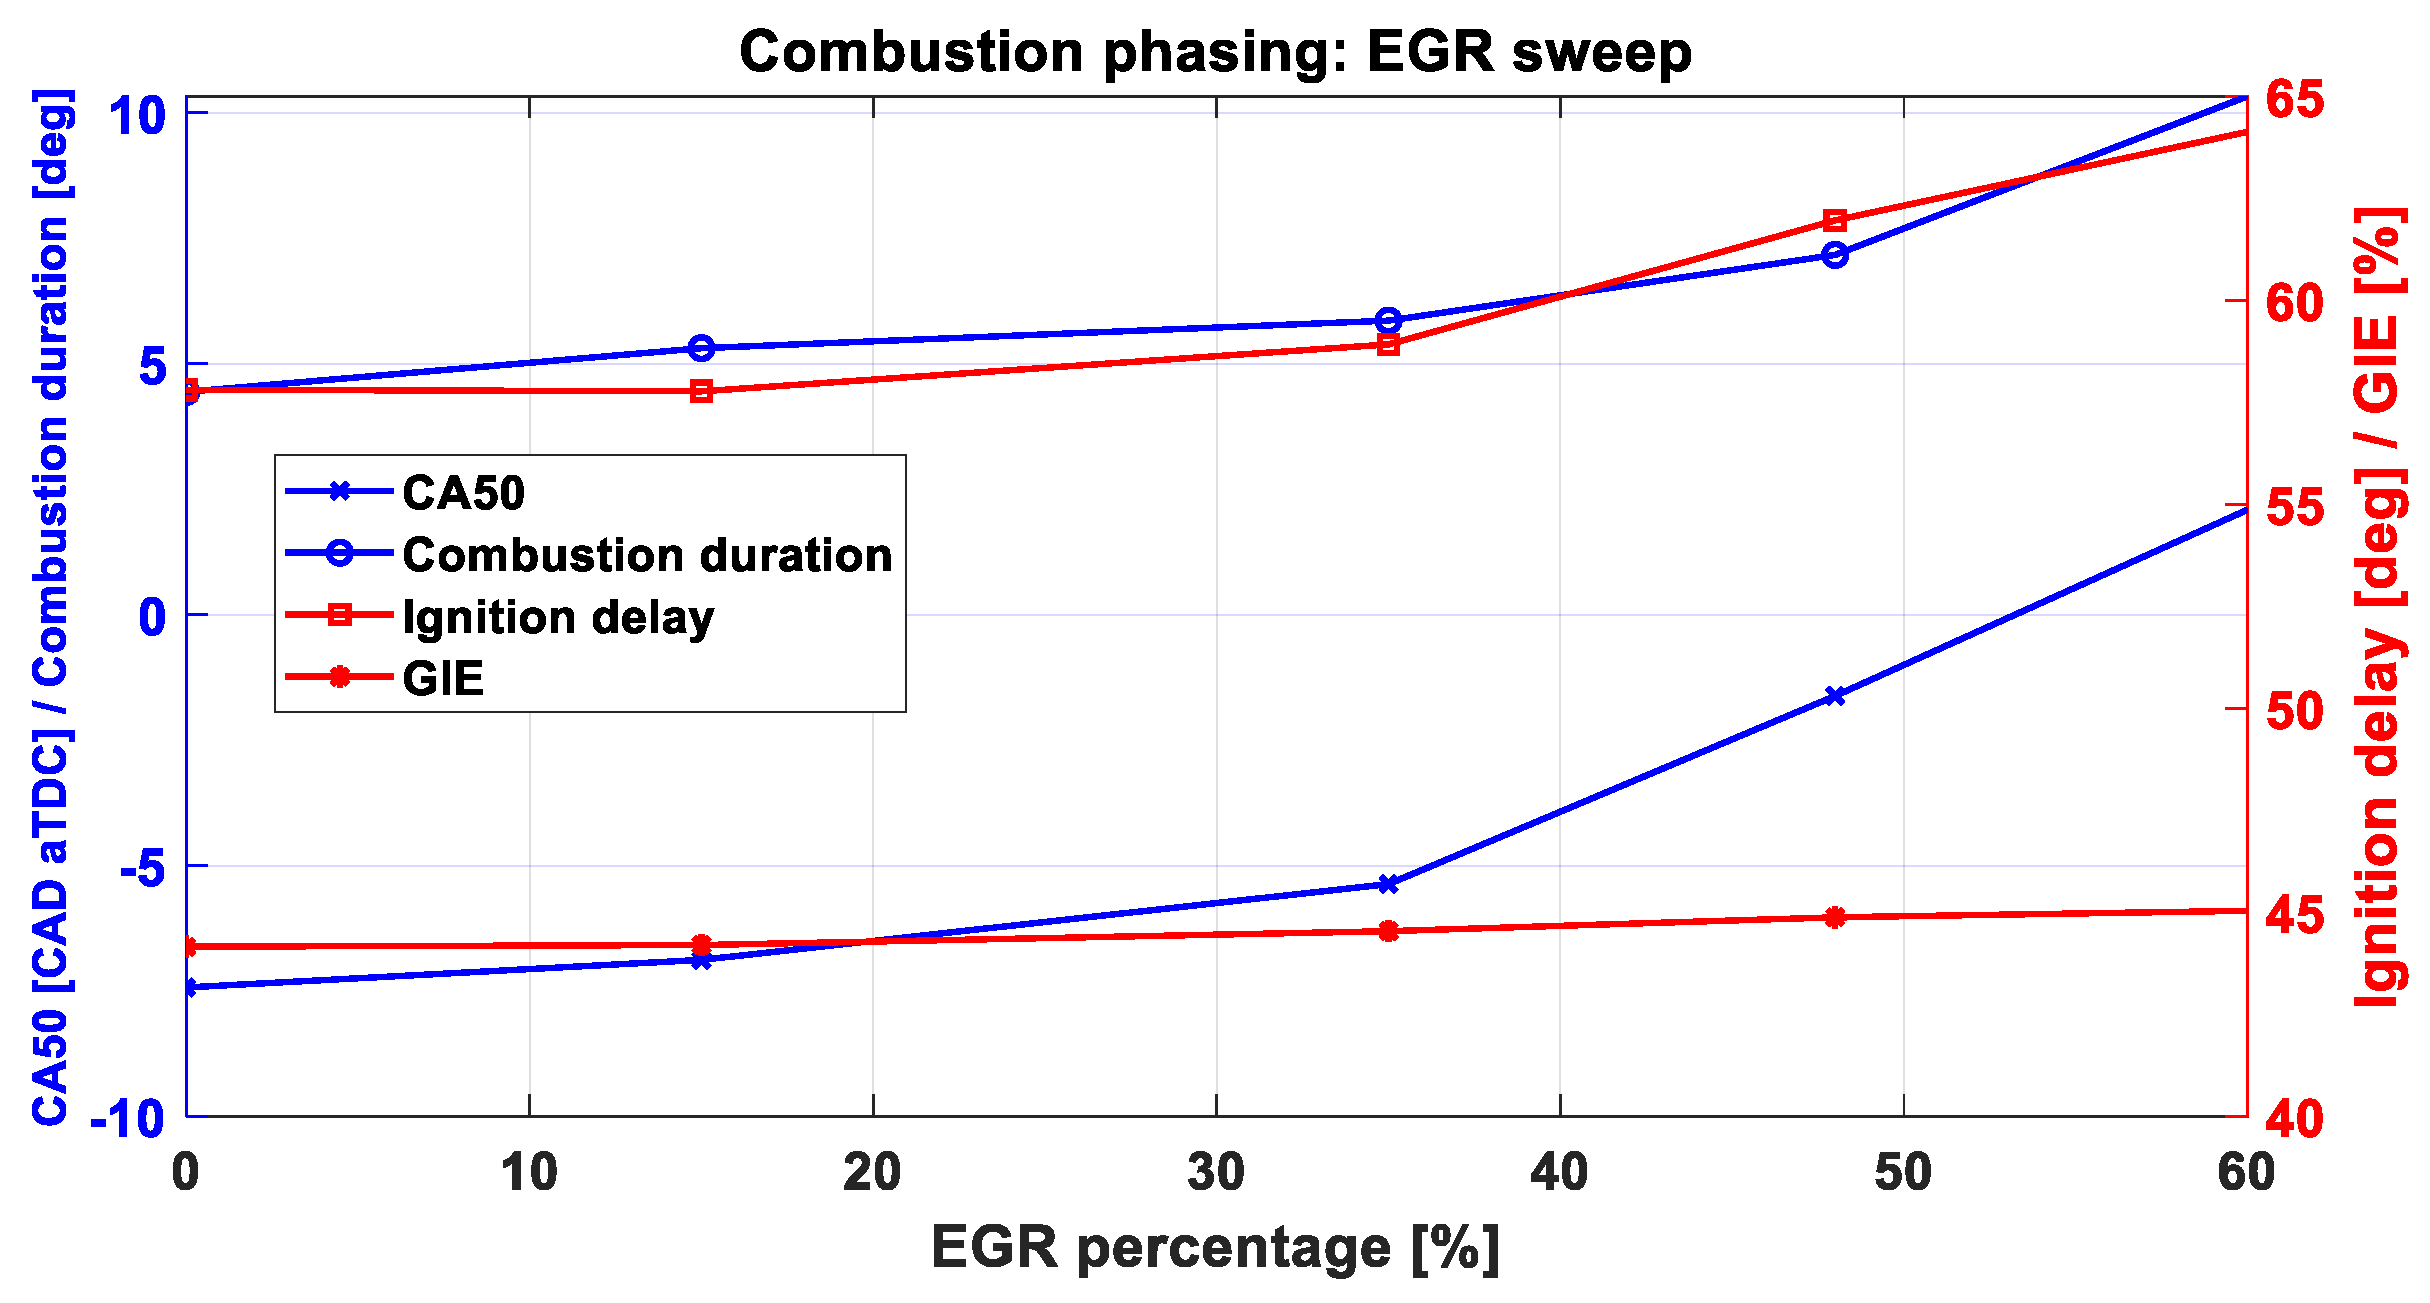
Figure 27 shows the effect of varying EGR percentage on the combustion characteristics. EGR percentage has a dilution effect, and higher EGR levels reduce the global gas temperature by limiting the availability of O2 for oxidizing fuel particles, leading to decreased NOx emissions as shown in Figure 28. However, lack of enough O2 affects the combustion phasing as well, as shown in Figure 27. In the case with 0% EGR, SOC occurs much earlier compared to the base case and the 60% EGR due to the abundance of O2 and the shorter combustion duration.
A higher EGR level has an adverse effect on the rest of the emissions due to lower in-cylinder temperature and combustion efficiency. However, the amount of EGR has minimal impact on gross indicated efficiency (GIE), allowing for a trade-off where EGR levels between 35% and 48% can be utilized to effectively reduce emissions without significantly compromising engine efficiency.
The effects of EGR level on engine performance indicators are summarized in Table 10. While power and combustion efficiency remain nearly identical across the five EGR cases, there are significant variations in RI and MPRR. Higher EGR levels lead to considerably lower RI and MPRR, as the reduced oxygen in the cylinder slows fuel oxidation and combustion initiation. This results in a more gradual pressure rise, reducing both RI and MPRR. EGR thus becomes a key factor in controlling these parameters and can be effectively combined with a dual-direct injection strategy to achieve the highest possible load in RCCI engines.

4.4. Boost Pressure

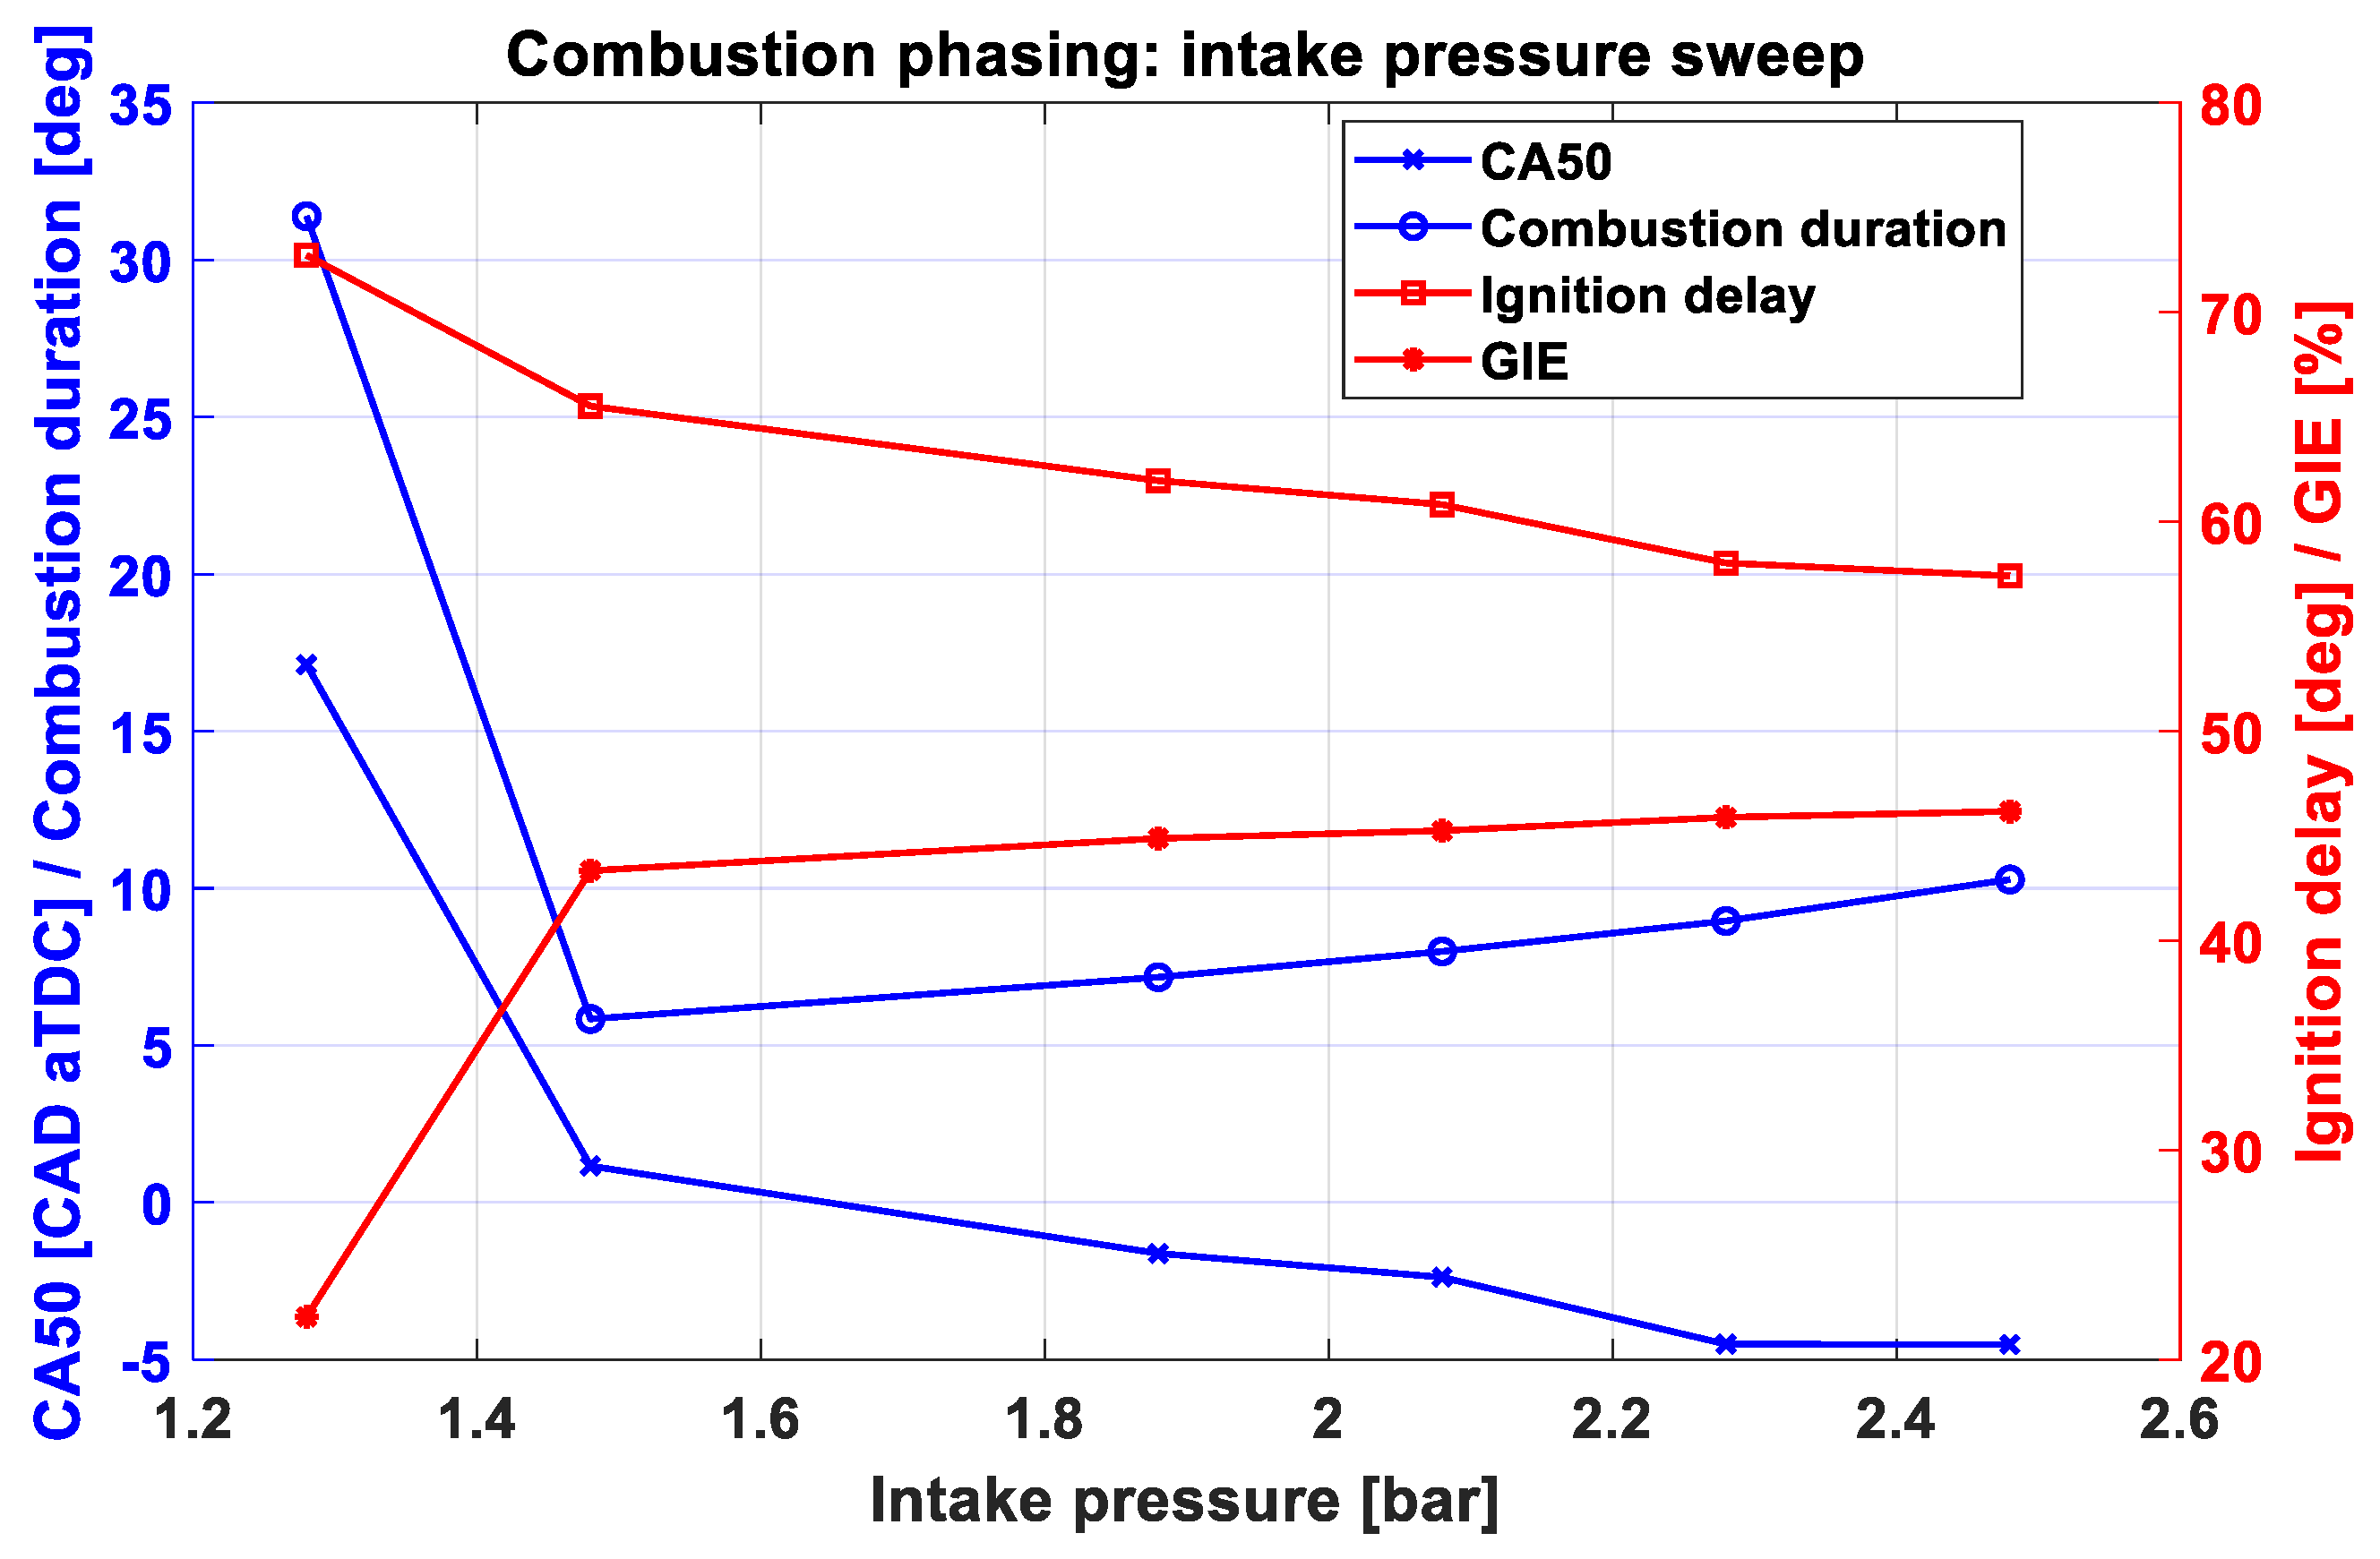
For this investigation, the octane/heptane fuel ratio was kept constant. It is important to note that boosting the intake pressure in the 1D model leads to variations in premixed equivalence ratios across the case studies, as the air mass changes, while the octane mass remains fixed. One notable effect of increased intake pressure is the rise in overall pressure trace, which advances the SOC. Figure 29 illustrates combustion characteristics and engine efficiency. A significant difference is observed between the 1.28 bar case and cases with higher intake pressure, particularly in combustion duration and GIE. In lower intake pressure cases, less air is available for fuel oxidation, reducing the force exerted on the piston during combustion. This results in lower power output and consequently lower GIE.
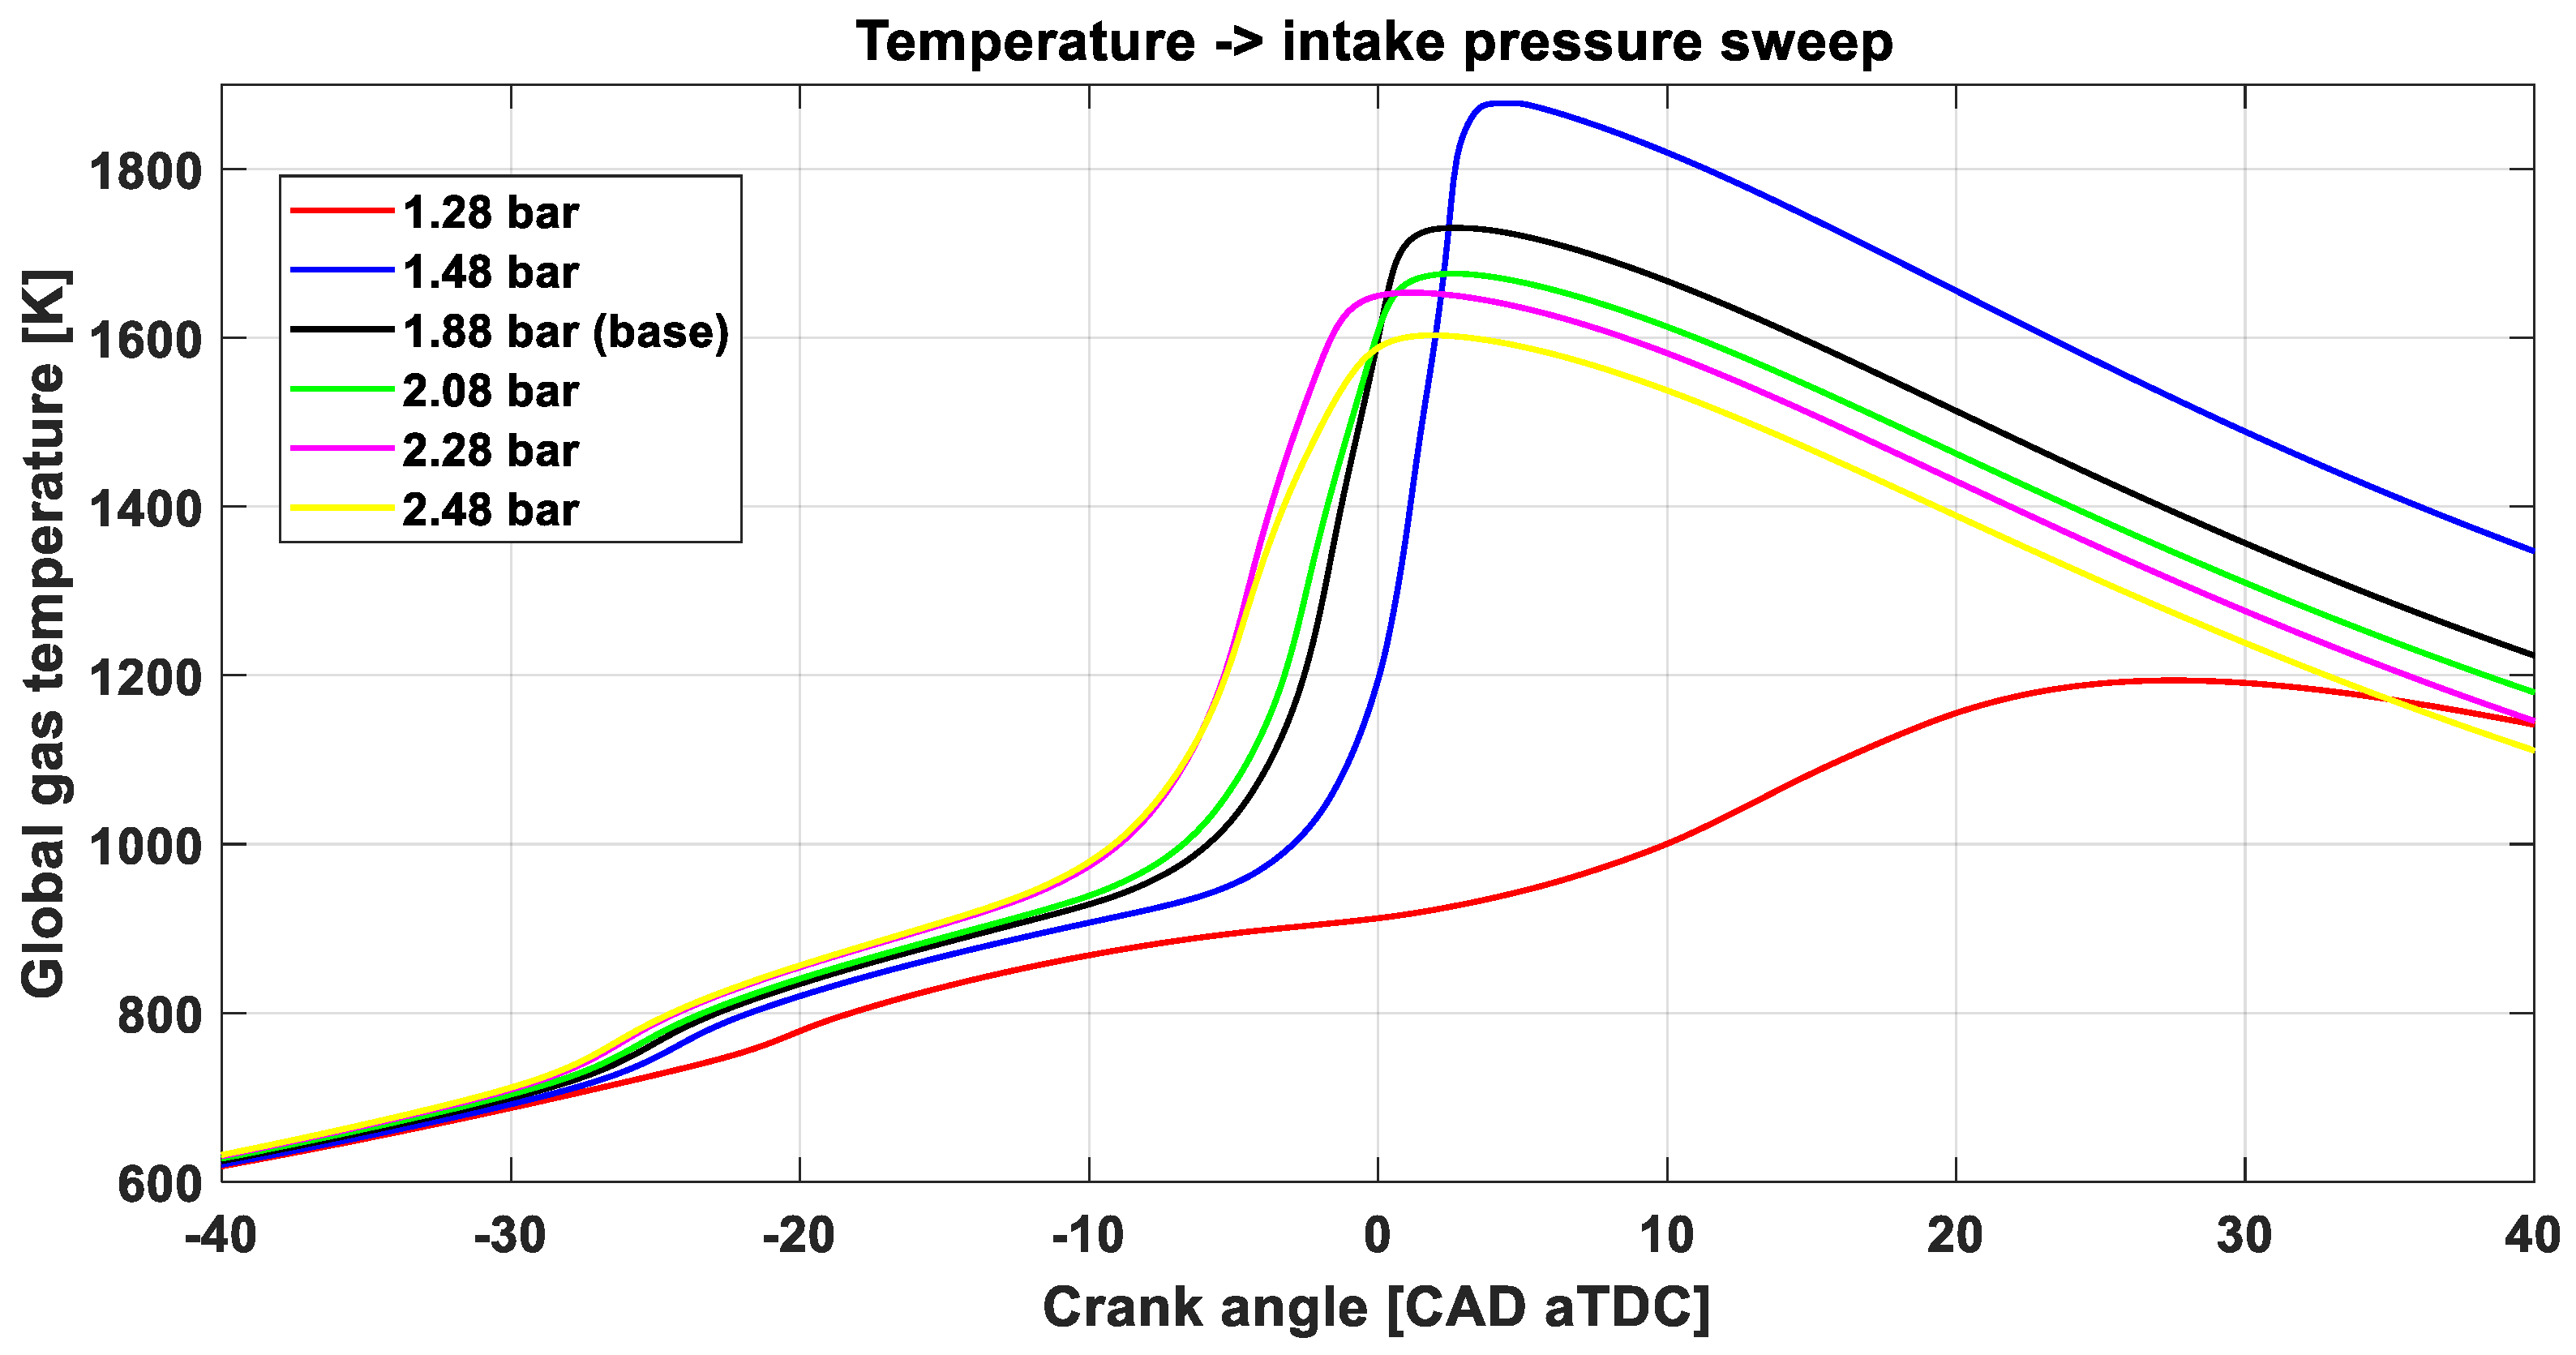
Changes in intake pressure also influence the global gas temperature in the cylinder, as shown in Figure 30. While there is a near-linear correlation between intake pressure, peak pressure, and SOC, this relationship does not hold for temperature. In general, increasing the intake pressure reduces the maximum temperature. However, an exception is observed in the 1.28 bar case, which appears to result in engine misfire. The reduction in maximum temperature with higher intake pressure is attributed to a shift in combustion phasing, which alters the in-cylinder volume at SOC as well as changes in the total trapped mass. Higher boost pressure introduces more cool air into the cylinder, further lowering the average temperature.
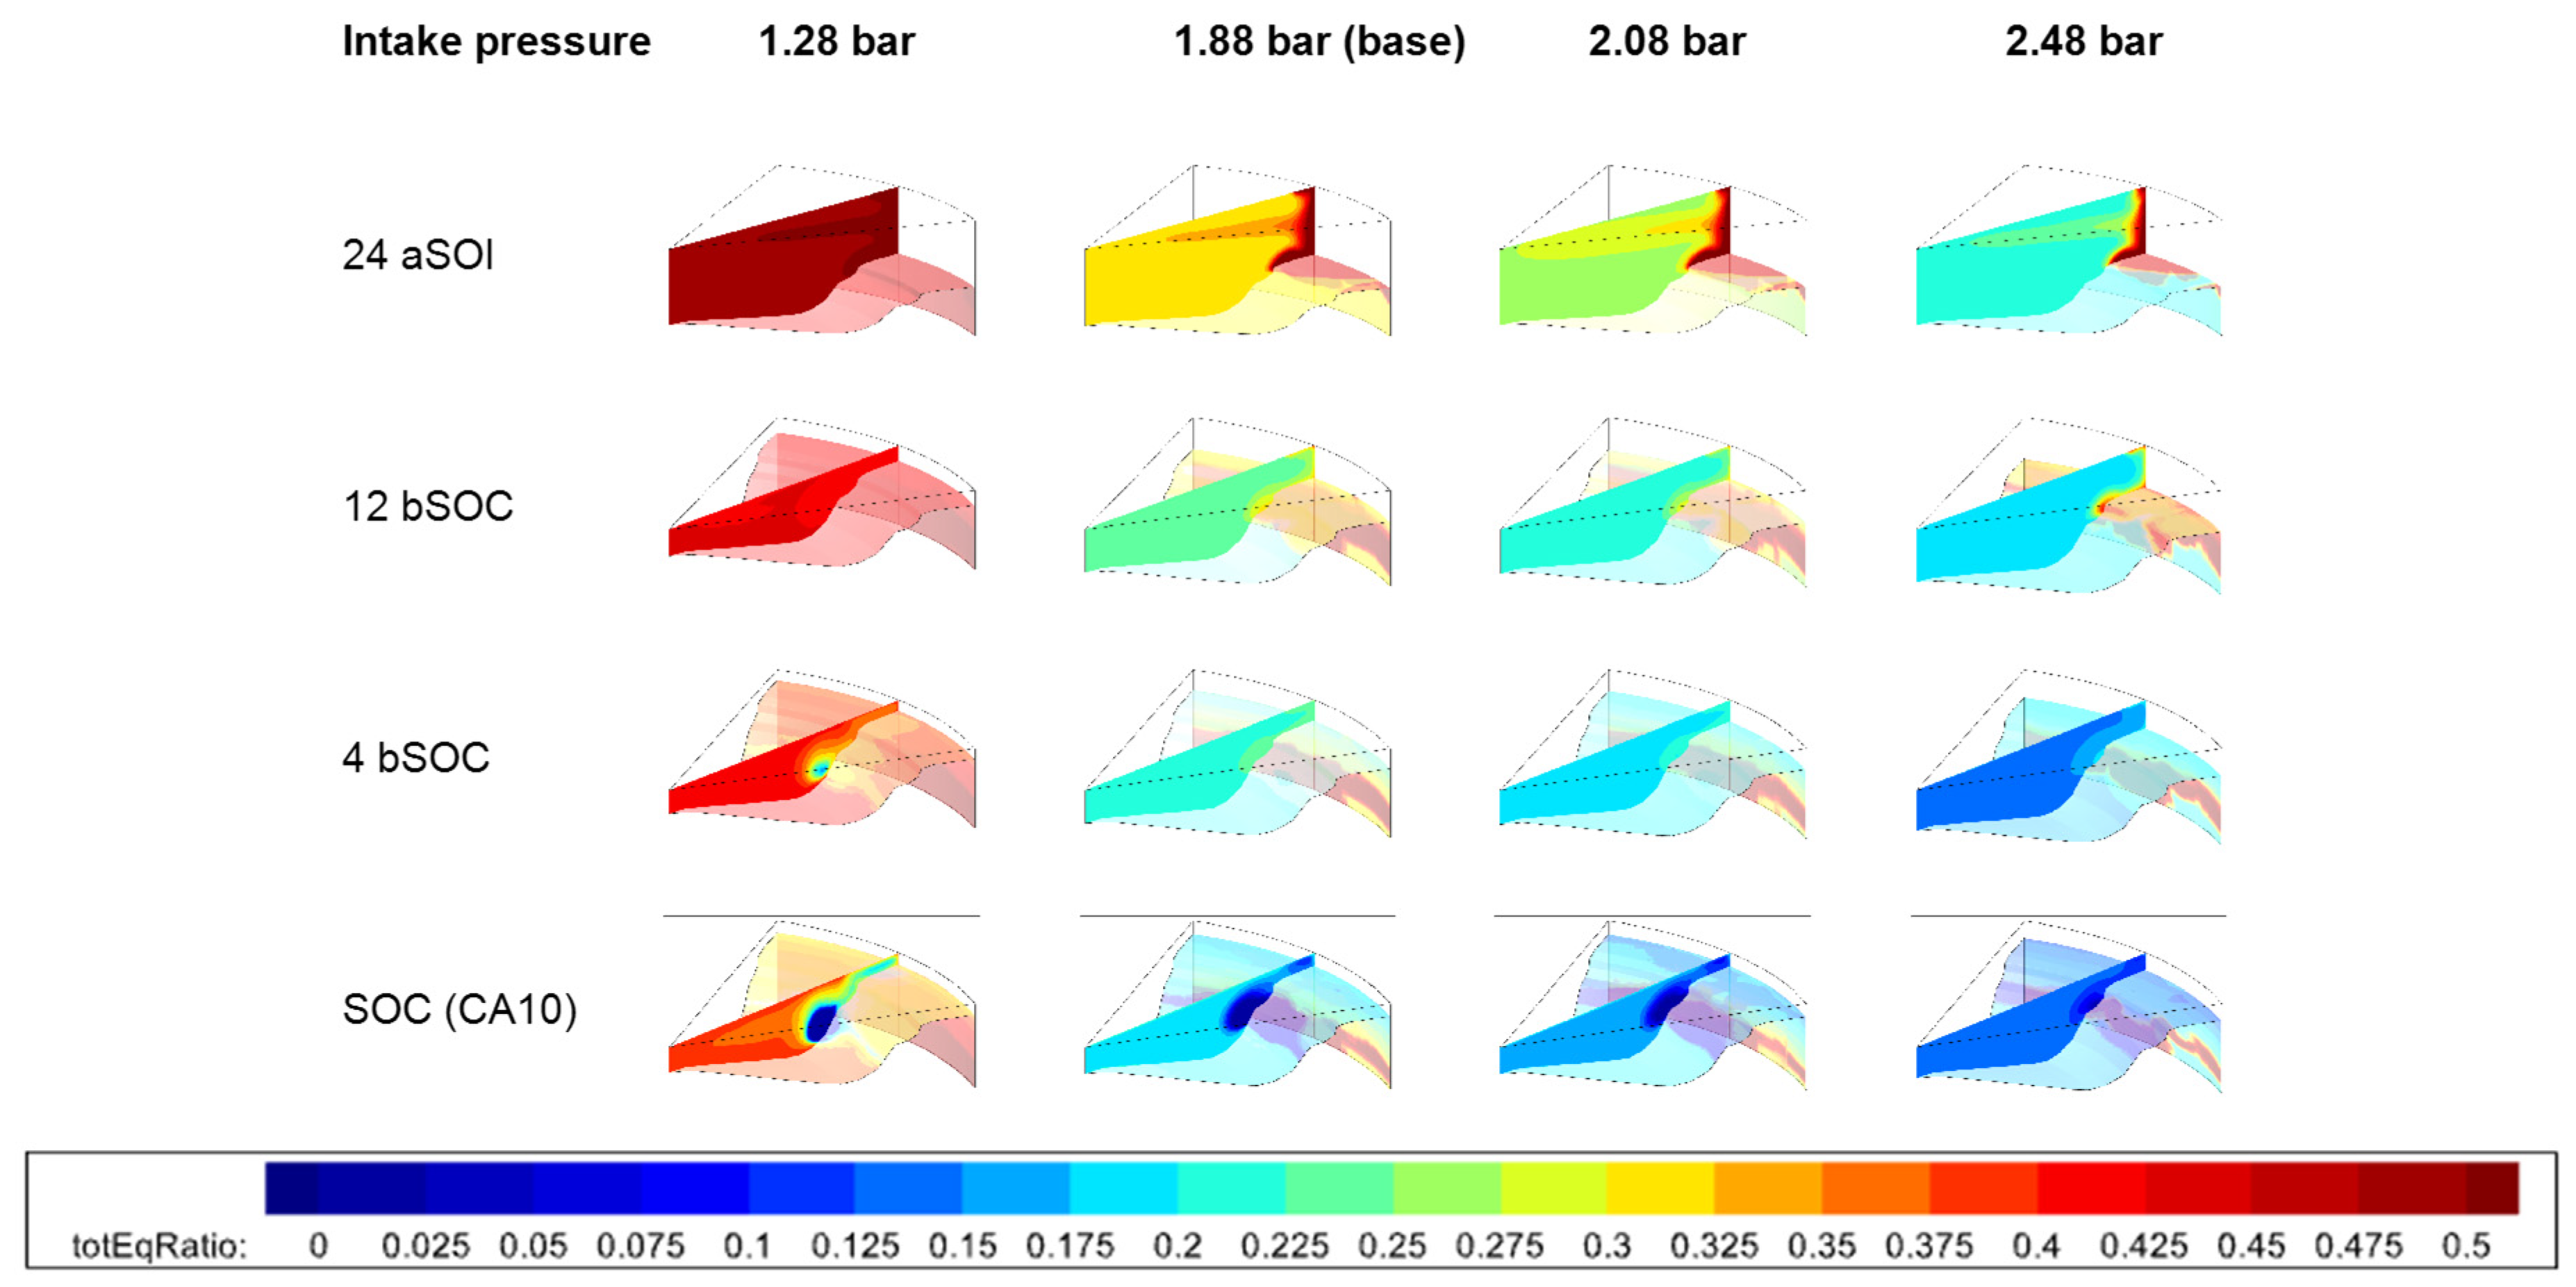
Figure 31 shows a comparison of emissions under varying intake pressures. In the 1.28 bar case, the low in-cylinder temperature results in low NOx emissions but extremely high soot, HC, and CO emissions, which are indicative of a misfire condition. Increasing the intake pressure significantly reduces HC and NOx emissions. Soot emissions decrease noticeably from the 1.28 bar to the 1.48 bar case; however, further increases in intake pressure cause a gradual rise in soot emissions. For CO emissions, a slight downward trend is observed up to the 2.48 bar case. Figure 32 further examines the effect of intake pressure on fuel stratification, revealing distinct changes in stratification patterns as intake pressure varies.
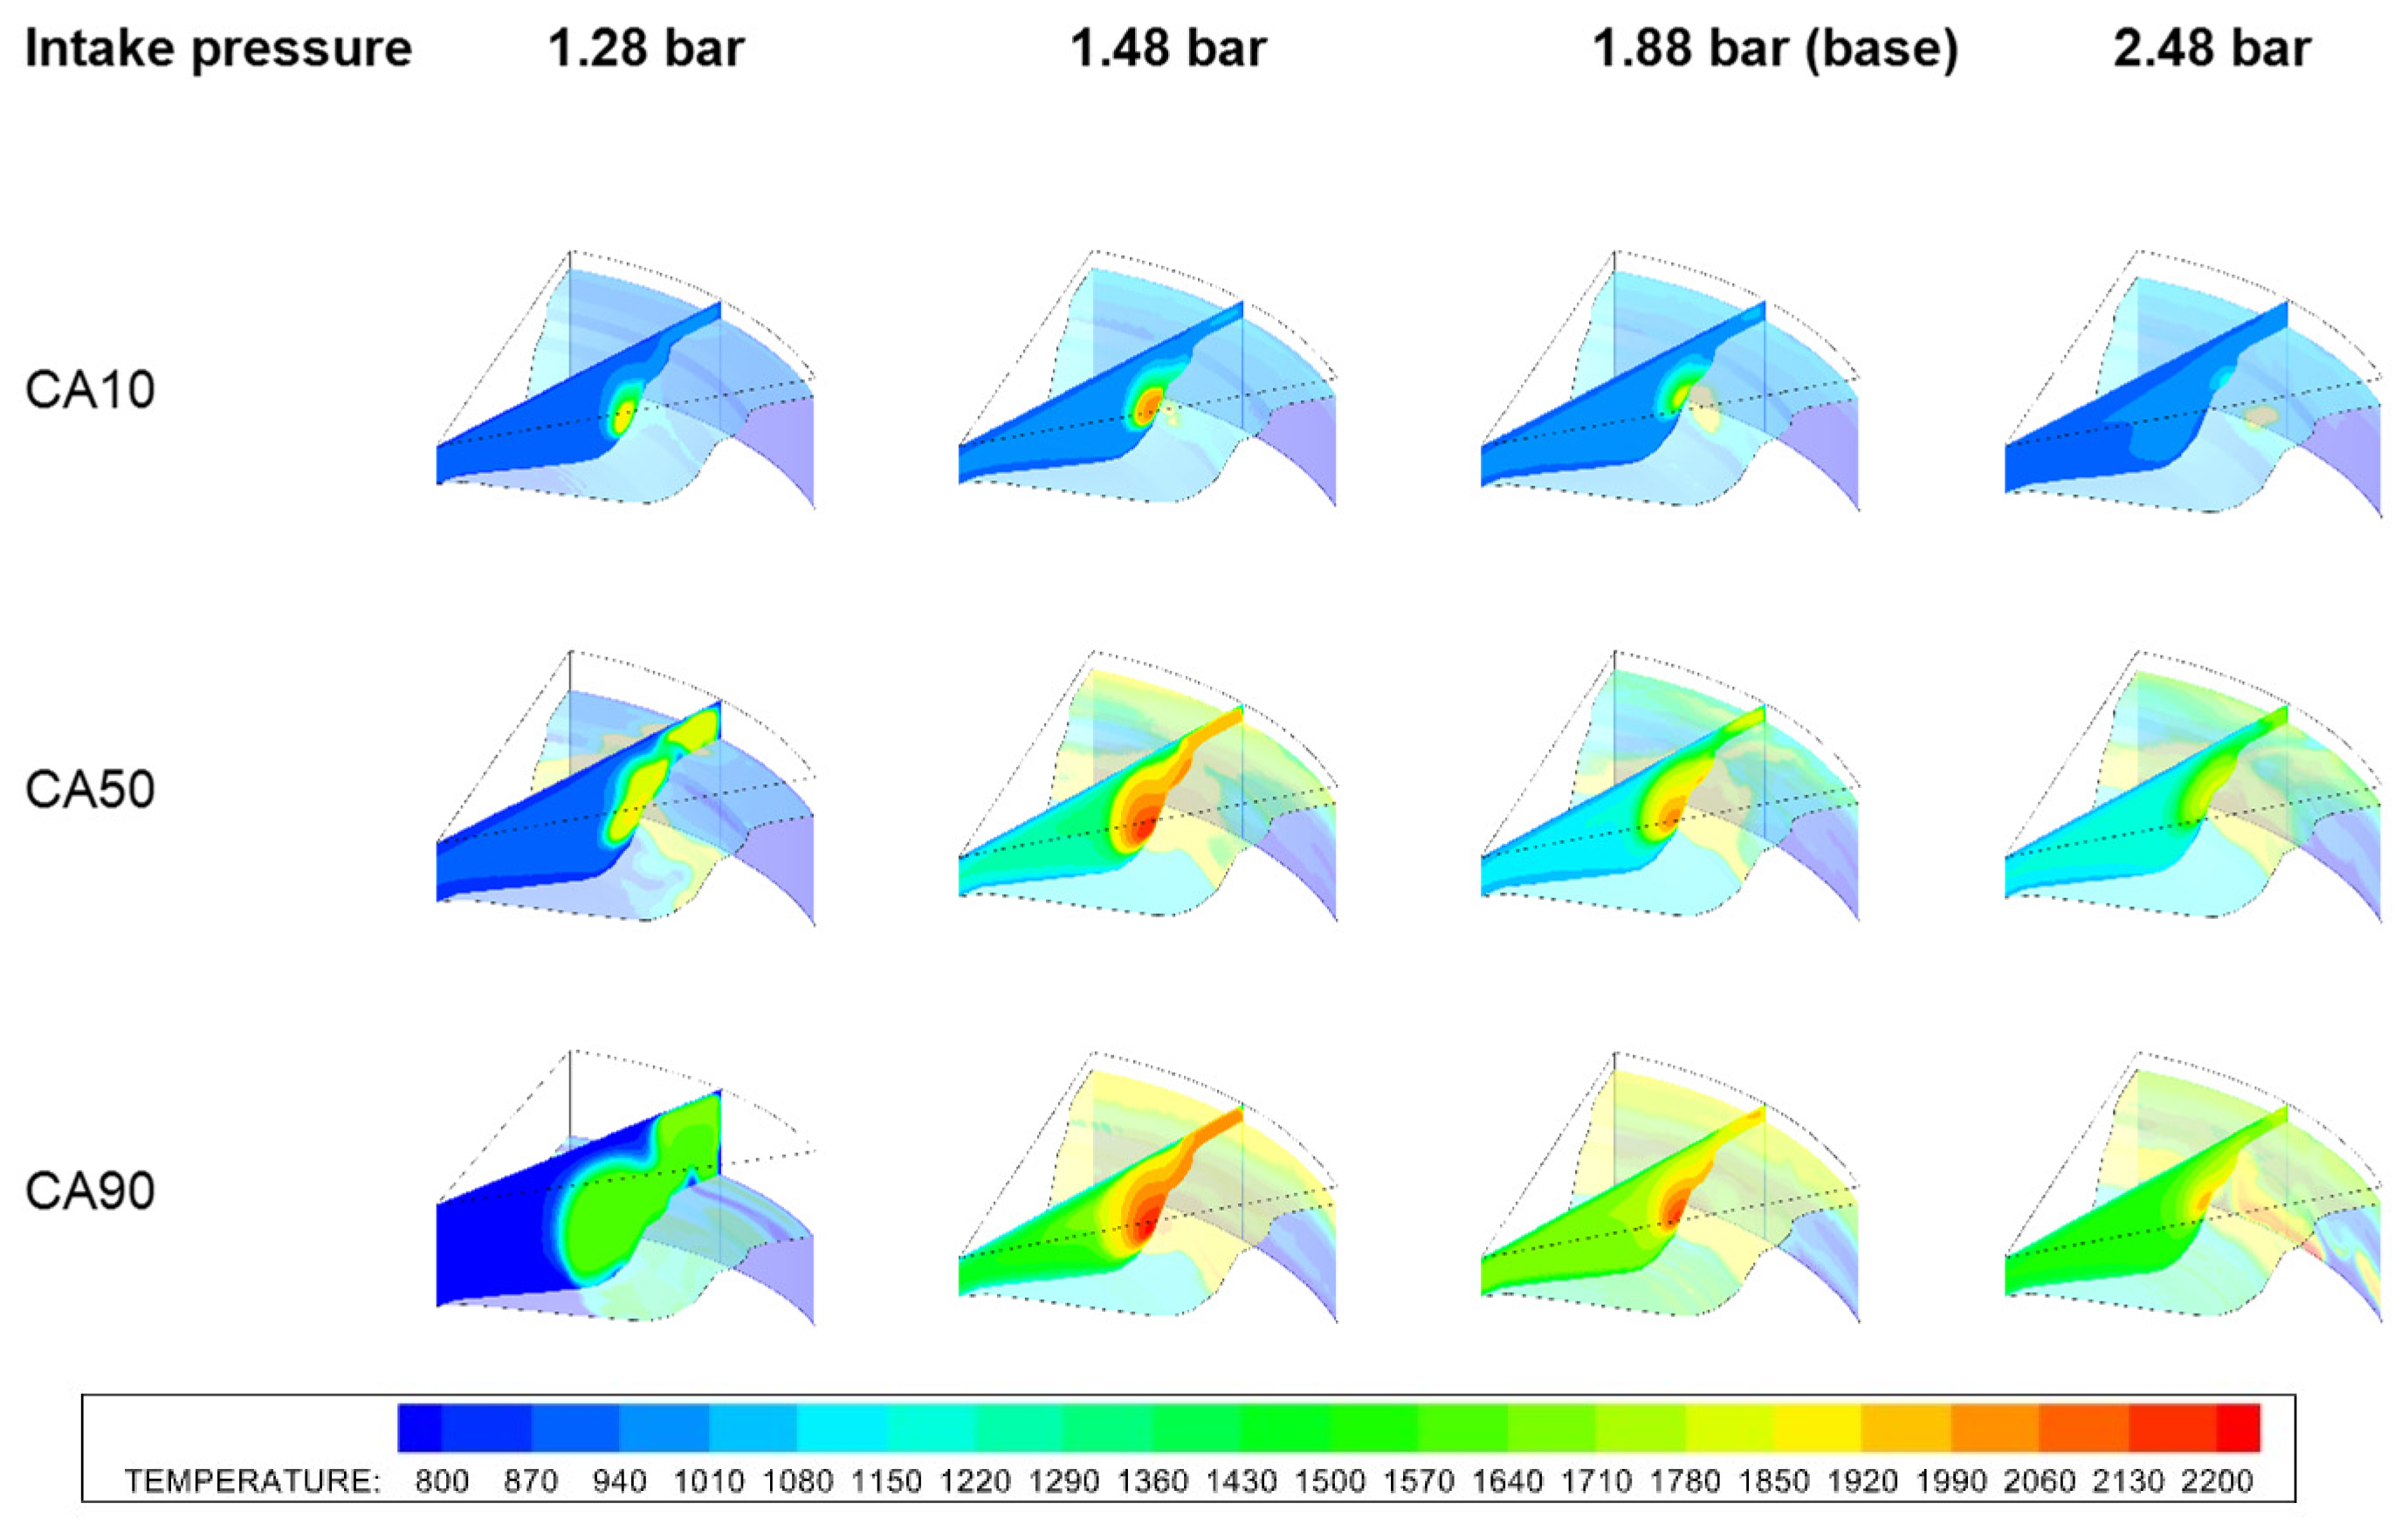
The overall trend suggests that higher boost pressure leads to a decrease in the equivalence ratio of the background mixture of gasoline/air. Additionally, the average temperature prior to the start of combustion rises as intake pressure increases, which is clearly illustrated in Figure 33. This results in an advanced start of combustion for these cases. After combustion, the average temperature is reduced with higher intake pressure.
At the lowest intake pressure, combustion is incomplete, showing misfire, while at the highest intake pressure, fuel tends to concentrate in the cylinder squish region, with combustion starting from that area. At lower intake pressures, fuel is more evenly distributed throughout the combustion chamber, whereas higher intake pressures lead to fuel-rich conditions in certain areas.
As shown in Figure 33, there are notable differences in maximum temperature regions during combustion. Except for the lowest boost pressure case, reduction in the boost pressure results in higher local temperature, which in turn leads to higher NOx emissions and lower soot emissions. The influence on performance indicators is further detailed in Table 11.
There is an important performance improvement when the intake pressure is increased from the lowest intake pressure case. At the lowest boost pressure (1.28 bar), incomplete combustion occurs, leading to poor combustion efficiency and MPRR and RI. With the increase in boost pressure, a significant improvement in power and combustion efficiency is observed. Conversely, RI and MPRR decrease as intake pressure rises. This is due to the excess intake air introduced by higher intake pressures, resulting in a very lean air/fuel ratio (AFR).

5. Conclusions

An approach is herein proposed based on the combination of a 1D gas dynamic and a 3D computational fluid dynamic model to simulate the whole engine with as few simplifications as possible. With the help of this method, the dynamic interactions between exhaust gas recirculation (EGR), the boosting system, and the combustion process can be captured while maintaining the computational costs. (Since the one-dimensional model does not take more than a few minutes, the majority of the runtime is devoted to the 3D dimensional model.) Experimental data for a heavy-duty engine were used to develop and validate the 1D and 3D models for this engine.
Using the combined model, the key challenges of reactivity controlled compression ignition (RCCI) engines were addressed by investigating the influence of critical design parameters on reducing emissions, enabling higher load operation, and controlling fuel stratification levels. However, the method can be applied to different engine types and fuel formulations under various operating conditions.
Various piston bowl profiles were analyzed at a fixed compression ratio. The chamfered ring-land geometry proved effective in reducing HC and CO emissions by providing additional space in the cylinder squish and crevice regions for oxidizing fuel particles. This increased local gas temperature in those regions, which, being less affected by the cooler cylinder liner, resulted in higher NOx emissions. However, indicators like gross indicated efficiency and maximum pressure rise rate (MPRR) were not significantly affected, making this geometry particularly useful for reducing HC and CO emissions.
A multiple-injection strategy also showed potential. The number of injection pulses was studied at a fixed combustion phasing, revealing that increasing the number of pulses reduces soot and NOx emissions. Further analysis of the double-pulse strategy focused on the fuel pressure distribution between the two pulses. It was found that varying the pressure of the first pulse had minimal effect, while adjusting the pressure of the second pulse could lower NOx emissions. Higher fuel pressure for the second pulse enhanced fuel evaporation, cooling the local gas temperature. The dual direct injection (DDI) strategy, which introduced a second octane pulse just before top dead center instead of heptane, increased fuel stratification and reduced MPRR by 38.36%. This strategy extended the combustion duration and expanded the engine’s operating range by lowering MPRR.
Initial in-cylinder conditions also significantly influenced fuel stratification. Varying the EGR levels was found to dramatically lower MPRR, enabling the engine to operate under higher loads. However, EGR introduced a trade-off: higher levels reduced NOx emissions but increased soot, HC, and CO emissions. By selecting an appropriate EGR value for a given load, a balance between MPRR and emissions can be achieved. Increasing boost pressure also affected the start of combustion (SOC) by advancing ignition timing. Higher intake pressure reduced NOx and HC emissions, while CO emissions exhibited an optimal range. Similarly, higher boost pressures were generally beneficial for lowering MPRR and emissions while improving efficiency, as the overall equivalence ratio decreased.

Author Contributions

Conceptualization, B.S. and P.R.; Methodology, A.S. and P.R.; Software, A.S. and P.R.; Validation, A.S.; Formal analysis, A.S. and P.R.; Investigation, A.S. and P.R.; Resources, R.N. and B.S.; Data curation, R.N. and B.S.; Writing—original draft, A.S. and P.R.; Writing—review & editing, R.N. and B.S.; Supervision, R.N. and B.S. project administration, B.S. and R.N. All authors have read and agreed to the published version of the manuscript.

Funding

This work was funded by the Netherlands Organisation for Scientific Research (NWO, project number HiEff, 10022252).

Institutional Review Board Statement

Not applicable.

Informed Consent Statement

Not applicable.

Data Availability Statement

The raw data supporting the conclusions of this article will be made available by the authors on request.

Acknowledgments

The authors would like to thank the Netherlands Organisation for Scientific Research (NWO, project number HiEff, 10022252) for providing the funding and Robbert C. Willems for providing the experimental data and his explanation.

Conflicts of Interest

The authors declare no conflict of interest.

References

  1. Maiorino, A.; Cilenti, C.; Petruzziello, F.; Aprea, C. A review on thermal management of battery packs for electric vehicles. Appl. Therm. Eng. 2024, 238, 122035. [Google Scholar]
  2. Azari, M.; Arif, J.; Jawab, F.; Moustabchir, H. Smart city implementation of electric vehicles: Challenges and Opportunities. In Proceedings of the IEEE 15th International Colloquium on Logistics and Supply Chain Management (LOGISTIQUA), Sousse, Tunisia, 2–4 May 2024; pp. 1–6. [Google Scholar]
  3. Dahham, R.Y.; Wei, H.; Pan, J. Improving thermal efficiency of internal combustion engines: Recent progress and remaining challenges. Energies 2022, 15, 6222. [Google Scholar] [CrossRef]
  4. Pan, S.; Cai, K.; Cai, M.; Du, C.; Li, X.; Han, W.; Wang, X.; Liu, D.; Wei, J.; Fang, J.; et al. Experimental study on the cyclic variations of ethanol/diesel reactivity controlled compression ignition (RCCI) combustion in a heavy-duty diesel engine. Energy 2021, 237, 121614. [Google Scholar] [CrossRef]
  5. Novella, R.; Gomez-Soriano, J.; Barbery, I.; Martinez-Hernandiz, P.J. Exploring the passive the pre-chamber ignition concept for spark-ignition engines fueled with natural gas under EGR-diluted conditions. Energy 2024, 294, 130909. [Google Scholar] [CrossRef]
  6. El-Adawy, M.; Nemitallah, M.A.; Abdelhafez, A. Towards sustainable hydrogen and ammonia internal combustion engines: Challenges and opportunities. Fuel 2024, 364, 131090. [Google Scholar]
  7. Goyal, H.; Jones, P.; Bajwa, A.; Parsons, D.; Akehurst, S.; Davy, M.H.; Leach, F.C.P.; Esposito, S. Design trends and challenges in hydrogen direct injection (H2DI) internal combustion engines—A review. Int. J. Hydrogen Energy 2024, 86, 1179–1194. [Google Scholar]
  8. Zhao, W.; Mi, S.; Wu, H.; Zhang, Y.; Zhang, Q.; He, Z.; Qian, Y.; Lu, X. Towards a comprehensive understanding of mode transition between biodiesel-biobutanol dual-fuel ICCI low temperature combustion and conventional CI combustion—Part I: Characteristics from medium to high load. Energy 2022, 246, 123414. [Google Scholar] [CrossRef]
  9. Han, J.; Somers, L.M.T.; Cracknell, R.; Joedicke, A.; Wardle, R.; Mohan, V.R.R. Experimental investigation of ethanol/diesel dual-fuel combustion in a heavy-duty diesel engine. Fuel 2020, 275, 117867. [Google Scholar]
  10. Koszalka, G.; Hunicz, J. Comparative study of energy losses related to the ring pack operation in homogeneous charge compression ignition and spark ignition combustion. Energy 2021, 235, 121388. [Google Scholar] [CrossRef]
  11. Vinodkumar, V.; Karthikeyan, A. Effect of manifold injection of n-decanol on neem biodiesel fuelled CI engine. Energy 2022, 241, 122856. [Google Scholar]
  12. Chakraborty, A.; Biswas, S.; Kakati, D.; Banerjee, R. Leveraging hydrogen as the low reactive component in the optimization of the PPCI-RCCI transition regimes in an existing diesel engine under varying injection phasing and reactivity stratification strategies. Energy 2022, 244, 122629. [Google Scholar] [CrossRef]
  13. Rahnama, P.; Paykani, A.; Bordbar, V.; Reitz, R.D. A numerical study of the effects of reformer gas composition on the combustion and emission characteristics of a natural gas/diesel RCCI engine enriched with reformer gas. Fuel 2017, 209, 742–753. [Google Scholar]
  14. Sun, W.; Zeng, W.; Guo, L.; Zhang, H.; Yan, Y.; Lin, S.; Zhu, G.; Sun, Y. Experimental investigation into the effects of pilot fuel and intake condition on combustion and emission characteristics of RCCI engine. Fuel 2022, 325, 124912. [Google Scholar] [CrossRef]
  15. Rahnama, P.; Paykani, A.; Reitz, R.D. A numerical study of the effects of using hydrogen, reformer gas and nitrogen on combustion, emissions and load limits of a heavy duty natural gas/diesel RCCI engine. Appl. Energy 2017, 193, 182–198. [Google Scholar]
  16. Krishnan, M.G.; Rajkumar, S.; Devarajan, Y.; Rajiv, A. A comprehensive review on advancement and challenges of renewable biofueled reactivity controlled compression ignition (RCCI) engine. J. Energy Inst. 2024, 113, 101540. [Google Scholar]
  17. Wang, L.; Liang, W.; Ma, H.; Ji, Q.; Sun, P.; Liu, J. Simulation study on effects of EGR ratio and compression ratio on combustion and emission characteristics of PODE/methanol RCCI engine. Fuel 2023, 334, 126593. [Google Scholar] [CrossRef]
  18. Hunicz, J.; Yang, L.; Rybak, A.; Ji, S.; Gęca, M.S.; Mikulski, M. Comparison of diesel and hydrotreated vegetable oil as the high-reactivity fuel in reactivity-controlled compression ignition. Energy Convers. Manag. 2025, 323, 119264. [Google Scholar] [CrossRef]
  19. Agarwal, A.K.; Singh, A.P.; García, A.; Monsalve-Serrano, J. Challenges and Opportunities for Application of Reactivity-Controlled Compression Ignition Combustion in Commercially Viable Transport Engines. Prog. Energy Combust. Sci. 2022, 93, 101028. [Google Scholar] [CrossRef]
  20. Paykani, A.; Garcia, A.; Shahbakhti, M.; Rahnama, P.; Reitz, R.D. Reactivity controlled compression ignition engine: Pathways towards commercial viability. Appl. Energy 2021, 282, 116174. [Google Scholar]
  21. Rao, G.A.P.; Reddy, K.J.; Reddy, R.M. Review on effective abatement of pollutant emissions of an RCCI engine with hydrogen addition as LRF and other fuels as HRF. Int. J. Ambient. Energy 2025, 46, 2446516. [Google Scholar] [CrossRef]
  22. Rahnama, P.; Maghbouli, A.; Bao, H.; Vasavan, A.; Novella, R.; Somers, B. Generalizing progress variable definition in CFD simulation of combustion systems using tabulated chemistry models. Appl. Energy Combust. Sci. 2023, 14, 100132. [Google Scholar] [CrossRef]
  23. Dahham, R.Y.; Wei, H.; Zhang, R.; Li, J.; Shu, G.; Pan, J. Numerical study for the comparison between direct dual-fuel stratification and reactivity-controlled compression ignition of ammonia-based engines. Appl. Therm. Eng. 2025, 258, 124624. [Google Scholar]
  24. Lee, J.; Chu, S.; Kang, J.; Min, K. Effects of Varying Equivalence Ratios on the Combustion Efficiency Characteristic of a Dual-Fuel Compression Ignition Engine by Changing Intake Pressures and Exhaust Gas Recirculation Rates. Int. J. Automot. Technol. 2024, 25, 173–182. [Google Scholar]
  25. Li, K.; Rahnama, P.; Novella, R.; Somers, B. Combining flamelet-generated manifold and machine learning models in simulation of a non-premixed diffusion flame. Energy AI 2023, 14, 100266. [Google Scholar] [CrossRef]
  26. Tripathi, S.; Krishnasamy, A. Strategies to Reduce Higher Unburned Hydrocarbon and Carbon Monoxide Emissions in Reactivity Controlled Compression Ignition; SAE Technical Paper; SAE: Warrendale, PA, USA, 2024. [Google Scholar]
  27. Wang, H.; Zhong, X.; Mi, S.; Yao, M. Numerical investigation on the combustion characteristics of PODE3/gasoline RCCI and high load extension. Fuel 2020, 263, 116366. [Google Scholar] [CrossRef]
  28. Vasudev, A.; Kakoee, A.; Axelsson, M.; Almani, H.M.; Hyvönen, J.; Mikulski, M. Advancing autonomy of chemical kinetics based multizone models for reactivity controlled compression ignition engines. Energy Convers. Manag. 2024, 312, 118562. [Google Scholar]
  29. Li, H.; Wu, S.; Jia, M.; Lei, J.; Amaratunga, G.A.J.; Li, J.; Yang, W. An efficient data-driven approach for modeling and optimization of reactivity-controlled compression ignition engine fueled with polyoxymethylene dimethyl ethers and hydrogen. Int. J. Hydrogen Energy 2024, 79, 1019–1029. [Google Scholar] [CrossRef]
  30. Xiahou, M.; Feng, Y.; Liu, H.; Wang, Z.; Wang, T. Numerical investigation of the combustion regime in pilot-ignited high-pressure direct-injection low reactivity fuel combustion with the injection system of eccentric configuration. Appl. Therm. Eng. 2024, 238, 122209. [Google Scholar] [CrossRef]
  31. Willems, R.C. Designed Experiments for Efficient Engines. Ph.D. Thesis, Technical University of Eindhoven, Eindhoven, The Netherlands, 2020. [Google Scholar]
  32. Gamma Technologies. GT-SUITE Flow Theory Manual; Gamma Technol. LLC: Westmont, IL, USA, 2021. [Google Scholar]
  33. Chang, J.; Güralp, O.; Filipi, Z.; Assanis, D.; Kuo, T.-W.; Najt, P.; Rask, R. New heat transfer correlation for an HCCI engine derived from measurements of instantaneous surface heat flux. SAE Trans. 2004, 113, 1576–1593. [Google Scholar]
  34. Tavakoli, S.; Saettone, S.; Steen, S.; Andersen, P.; Schramm, J.; Pedersen, E. Modeling and analysis of performance and emissions of marine lean-burn natural gas engine propulsion in waves. Appl. Energy 2020, 279, 115904. [Google Scholar] [CrossRef]
  35. Jena, A.; Singh, A.P.; Agarwal, A.K. Optical and computational investigations of the effect of Spray-Swirl interactions on autoignition and soot formation in a compression ignition engine fuelled by Diesel, dieseline and diesohol. Appl. Energy 2022, 324, 119677. [Google Scholar]
  36. Bahrami, S.; Poorghasemi, K.; Solmaz, H.; Calam, A.; İpci, D. Effect of nitrogen and hydrogen addition on performance and emissions in reactivity controlled compression ignition. Fuel 2021, 292, 120330. [Google Scholar] [CrossRef]
  37. Jafari, B.; Seddiq, M.; Mirsalim, S.M. Impacts of diesel injection timing and syngas fuel composition in a heavy-duty RCCI engine. Energy Convers. Manag. 2021, 247, 114759. [Google Scholar] [CrossRef]
  38. Shin, J.; Choi, J.; Seo, J.; Park, S. Pre-chamber combustion system for heavy-duty engines for operating dual fuel and diesel modes. Energy Convers. Manag. 2022, 255, 115365. [Google Scholar] [CrossRef]
  39. Rahnama, P.; Arab, M.; Reitz, R.D. A Time-Saving Methodology for Optimizing a Compression Ignition Engine to Reduce Fuel Consumption through Machine Learning. SAE Int. J. Engines 2020, 13, 267–288. [Google Scholar]
  40. Babajimopoulos, A.; Assanis, D.N.; Flowers, D.L.; Aceves, S.M.; Hessel, R.P. A fully coupled computational fluid dynamics and multi-zone model with detailed chemical kinetics for the simulation of premixed charge compression ignition engines. Int. J. Engine Res. 2005, 6, 497–512. [Google Scholar]
  41. Rutland, C.J.; Eckhause, J.; Hampson, G.; Hessel, R.; Kong, S.; Patterson, M.; Pierpont, D.; Sweetland, P.; Tow, T.; Reitz, R.D. Toward predictive modeling of diesel engine intake flow, combustion and emissions. SAE Trans. 1994, 103, 1939–1952. [Google Scholar]
  42. Han, Z.; Reitz, R.D. Turbulence modeling of internal combustion engines using RNG κ-ε models. Combust. Sci. Technol. 1995, 106, 267–295. [Google Scholar]
  43. Kumar, A. A CFD Study on DME/Methanol Fuelled Unconventional RCCI. Master’s Thesis, Technical University of Eindhoven, Eindhoven, The Netherlands, 2021. [Google Scholar]
  44. Sener, R.; Yangaz, M.U.; Gul, M.Z. Effects of injection strategy and combustion chamber modification on a single-cylinder diesel engine. Fuel 2020, 266, 117122. [Google Scholar]
  45. Wang, H.; Yao, M.; Reitz, R.D. Development of a reduced primary reference fuel mechanism for internal combustion engine combustion simulations. Energy Fuels 2013, 27, 7843–7853. [Google Scholar] [CrossRef]
  46. Senecal, P.K.; Richards, K.J.; Pomraning, E.; Yang, T.; Dai, M.Z.; McDavid, R.M.; Patterson, M.A.; Hou, S.; Shethaji, T. A New Parallel Cut-Cell Cartesian CFD Code for Rapid Grid Generation Applied to In-Cylinder Diesel Engine Simulations; SAE Technical Paper; SAE: Warrendale, PA, USA, 2007. [Google Scholar]
  47. Hiroyasu, H.; Kadota, T. Models for Combustion and Formation of Nitric Oxide and Soot in Direct Injection Diesel Engines. SAE Trans. 1976, 85, 513–526. [Google Scholar]
  48. Heywood, J.B. Internal Combustion Engine Fundamentals; McGraw-Hill Education: New York, NY, USA, 2018. [Google Scholar]
  49. O’Rourke, P.J. Collective Drop Effects on Vaporizing Liquid Sprays. Ph.D. Thesis, Princeton University, Princeton, NJ, USA, 1981. [Google Scholar]
  50. Amsden, A.A.; O’Rourke, P.J.; Butler, T.D. KIVA-II: A Computer Program for Chemically Reactive Flows with Sprays; Los Alamos National Lab. (LANL): Los Alamos, NM, USA, 1989. [Google Scholar]
  51. Schmidt, D.P.; Rutland, C. A new droplet collision algorithm. J. Comput. Phys. 2000, 164, 62–80. [Google Scholar]
  52. Liu, A.B.; Mather, D.; Reitz, R.D. Modeling the Effects of Drop Drag and Breakup on Fuel Sprays; SAE Technical Paper 930072; SAE: Warrendale, PA, USA, 1993. [Google Scholar]
  53. O’Rourke, P.J.; Amsden, A.A. A spray/wall interaction submodel for the KIVA-3 wall film model. SAE Trans. 2000, 109, 281–298. [Google Scholar]
  54. Beale, J.C.; Reitz, R.D. Modeling spray atomization with the Kelvin-Helmholtz/Rayleigh-Taylor hybrid model. At. Sprays 1999, 9, 623–650. [Google Scholar]
  55. Siebers, D.L. Liquid-phase fuel penetration in diesel sprays. SAE Trans. 1998, 107, 1205–1227. [Google Scholar]
  56. Paykani, A.; Kakaee, A.-H.; Rahnama, P.; Reitz, R.D. Effects of diesel injection strategy on natural gas/diesel reactivity controlled compression ignition combustion. Energy 2015, 90, 814–826. [Google Scholar] [CrossRef]
  57. Paykani, A.; Kakaee, A.-H.; Rahnama, P.; Reitz, R.D. Progress and recent trends in reactivity-controlled compression ignition engines. Int. J. Engine Res. 2015, 17, 481–524. [Google Scholar] [CrossRef]
  58. Duan, H.; Jia, M.; Wang, H.; Bai, S.; Li, G. Insight into the combustion and emission performance of reactivity-controlled compression ignition (RCCI) fueled with hydrogen (H2) and polyoxymethylene dimethyl ethers (PODEn). Int. J. Hydrogen Energy 2024, 60, 458–467. [Google Scholar]
  59. Lim, J.H.; Reitz, R.D. Improving the efficiency of low temperature combustion engines using a chamfered ring-land. J. Eng. Gas Turbines Power 2015, 137, 111509. [Google Scholar]
  60. Shen, Z.; Wang, X.; Zhao, H.; Lin, B.; Shen, Y.; Yang, J. Numerical investigation of natural gas-diesel dual-fuel engine with different piston geometries and radial clearances. Energy 2021, 220, 119706. [Google Scholar]
  61. Wissink, M.; Reitz, R.D. Direct dual fuel stratification, a path to combine the benefits of RCCI and PPC. SAE Int. J. Engines 2015, 8, 878–889. [Google Scholar] [CrossRef]
  62. NASA. NASA, Carbon Dioxide. Available online: https://climate.nasa.gov/vital-signs/carbon-dioxide/ (accessed on 1 June 2021).
Figure 1. Schematic overview of the experimental engine setup.
Fire 08 00117 g001
Figure 2. Engine setup in the engine test cell.
Fire 08 00117 g002
Figure 3. Schematic flowchart of the steps taken during this work.
Fire 08 00117 g003
Figure 4. Schematic overview of the GT-Power model.
Fire 08 00117 g004
Figure 5. Simulated engine sector surface at TDC position in four different view perspectives.
Fire 08 00117 g005
Figure 6. Slice view in the Y-plane of the engine sector mesh after DI SOI. Yellow area shows the fuel vapor distribution.
Fire 08 00117 g006
Figure 7. Validation of in-cylinder pressure trace and aROHR during direct injection start of actuation sweep.
Fire 08 00117 g007
Figure 8. (a) Validation of emissions during direct injection start of actuation sweep. (b) Scaled emission comparison between CFD and experiment results.
Fire 08 00117 g008
Figure 9. Comparison between CFD and experiment results for (a) CA50 and (b) burn duration.
Fire 08 00117 g009
Figure 10. Double-cup piston bowl profile.
Fire 08 00117 g010
Figure 11. Different piston bowl profiles.
Fire 08 00117 g011
Figure 12. Emissions trend while varying piston bowl profile at the base case operating conditions.
Fire 08 00117 g012
Figure 13. Correlation graph between HC and CO (a) and between NOx and HC + CO (b).
Fire 08 00117 g013
Figure 14. Equivalence ratio [−] contour images for piston bowl profiles for four different characteristic crank angles (unit in degrees) (24 deg. aSOI, 12 deg. bSOC,4 deg. bSOC, and at SOC). aSOI: after SOI; bSOC: before SOC. SOC is defined as CA10, i.e., crank angle at 10% heat released.
Fire 08 00117 g014
Figure 15. Temperature [K] contour images during combustion for less common piston bowl profiles.
Fire 08 00117 g015
Figure 16. Correlation graph between HC + CO and combustion efficiency.
Fire 08 00117 g016
Figure 17. The influence of the number of injection pulses on the emissions variations at the base case operating conditions.
Fire 08 00117 g017
Figure 18. Equivalence ratio [−] contours after injection and temperature contours during combustion for different number of DI pulses.
Fire 08 00117 g018
Figure 19. The influence of injection pressure distribution between the two pulses on emissions variations.
Fire 08 00117 g019
Figure 20. Temperature [K] contour images during combustion for the DI fuel pressure distribution. Piston = double-cup.
Fire 08 00117 g020
Figure 21. Pressure and aROHR traces effected by varying injection strategy. Solid lines are average pressure and dash lines are heat release rate.
Fire 08 00117 g021
Figure 22. Influence of changing injection strategy on combustion characteristics and engine efficiency.
Fire 08 00117 g022
Figure 23. Influence of changing injection strategy on in-cylinder average temperature.
Fire 08 00117 g023
Figure 24. Influence of changing injection strategy on emission characteristics.
Fire 08 00117 g024
Figure 25. The effect of the injection strategy on the temperature [K] distribution. Piston bowl profile = double-cup.
Fire 08 00117 g025
Figure 26. The distribution of total equivalence ratio and temperature inside the cylinder colored by the distance from the injector.
Fire 08 00117 g026aFire 08 00117 g026b
Figure 27. Combustion characteristics trend while varying EGR.
Fire 08 00117 g027
Figure 28. Influence of EGR percentage on emissions characteristics.
Fire 08 00117 g028
Figure 29. Combustion phasing trend while varying intake pressure.
Fire 08 00117 g029
Figure 30. Global gas temperature trace effected by varying intake pressure.
Fire 08 00117 g030
Figure 31. Emissions trend while varying intake pressure.
Fire 08 00117 g031
Figure 32. The effect of boost pressure [bar] on the distribution of total equivalence ratio [−].
Fire 08 00117 g032
Figure 33. The effect of boost pressure [bar] on the temperature [K] distribution.
Fire 08 00117 g033
Table 1. MX-13 engine and injectors specifications.
ParameterValue
Engine Specifications
Displaced volume2.097 L
Bore130 mm
Stroke158 mm
Connecting rod length266.7 mm
Compression ratio15.85
Wrist pin to crank offset0 mm
Cylinder configurationInline 6-cylinder (only 1 cylinder in experiment setup)
Piston bowl profileDouble-cup
Cylinder headLow swirl
Number of valves per cylinder4
Intake valve diameter44 mm
Intake valve diameter41 mm
Intake valve lash0.5 mm
Exhaust valve lash0.55 mm
IVO (°aTDC)344
IVC (°aTDC)−153
EVO (°aTDC)128
EVC (°aTDC)−346
Port Fuel Injector Specifications
Port fuel injectorBosch EV14
Port fuel injected fuelConventional gasoline (EN228)
Port fuel injector SOI (°aTDC)−320
Direct In-Cylinder Fuel Injector
Common rail injectorDelphi DFI21
Direct-injected fuelEuropean specification diesel (EN590)
Spray-included angle139 O
Number of holes7
Hole diameter0.195 mm
Engine speed1200 RPM
Table 2. The operating condition of the engine validation case (base case).
ParameterValue
Fuel blend ratio (PFI/total % mass)80
SOI (°ATDC)−68.66
Common rail pressure (bar)520 bar
Intake pressure (bar)1.88
Spray-included angle (deg)139
EGR flow rate (%)48
Table 3. Spray models.
Physical CFD Spray ModelModel
Drop turbulent dispersionO’Rourke [49]
Drop evaporation modelFrossling [50]
Collision modelNTC collision [51]
Drop drag modelDynamic drop drag [52]
Spray–wall interaction modelWall film [53]
Spray breakupModified KH-RT [54]
Table 4. Performance indicators experiment vs. 3D model.
ParameterMPRR [bar/CAD]RI [MW/m2]CA50 [CAD]BD [CAD]
SOA −78.5 experiment16.50127.7226−0.80035.7848
SOA −78.5 CFD15.877.60−0.846.45
Relative error SOA −78.53.83%1.59%4.96%11.5%
SOA −70.1 experiment16.69857.7565−1.78835.889
SOA −70.1 CFD15.857.60−1.627.17
Relative error SOA −70.15.08%2.02%9.41%21.75%
SOA −62.1 experiment17.21878.1764−3.3495.9753
SOA −62.1 CFD16.087.83−3.377.47
Relative error SOA −62.16.61%4.24%0.63%25.01%
Table 5. Performance indicators for different piston bowl profiles.
Piston Bowl ProfileBath.Chamf.Cyl.DSO3DoubleRe-EntrantSingle-
Indicated efficiency45.0244.1244.3844.7544.8844.5844.60
Combustion efficiency98.4099.4498.4898.6098.5399.0398.52%
RI8.867.578.057.957.607.497.56MW/m2
MPRR16.9715.5716.5516.1515.8515.9816.02bar/CAD
Table 6. The effect of number of pulses on the engine performance. IMEP = 8.7 bar; speed 1200 RPM.
Number of DI Pulses123Unit
SOI1−68.66−68.66−88.66CAD aTDC
SOI2 −58.66−78.66CAD aTDC
SOI3 −63.88CAD aTDC
Ignition delay61.9652.2857.44CAD
Table 7. Base double-pulse case with the same total fuel mass as the validated case.
ParameterValueUnit
SOI1 fuel mass8.83mg
SOI1 injection pressure520bar
SOI1 timing−68.66CAD aTDC
SOI2 fuel mass8.83mg
SOI2 injection pressure520bar
SOI2 timing−32CAD aTDC
Table 8. Injection strategy settings.
ParameterSingle DIDouble DIDDIUnit
PFI octane mass71.8171.8145.3mg
SOI1 fuel mass17.678.83517.67mg
SOI1 inj. pressure520520520bar
SOI1 timing−68.66−68.66−31CAD aTDC
SOI2 fuel mass-8.83526.5 (octane)mg
SOI2 inj. pressure-5201000bar
SOI2 timing-−58.66−5.5CAD aTDC
Table 9. The effect of the injection strategy on the performance indicators of the engine.
Injection StrategySingle DIDouble DIDDI-
Power17.3617.4017.68kW
Combustion efficiency98.6198.9297.56%
RI7.607.113.33MW/m2
MPRR15.8515.409.77bar/CAD
Table 10. The effect of EGR levels on the engine performance.
EGR Percentage015354860%
Power18.0017.0317.1617.3617.42kW
Combustion efficiency99.4999.3399.1298.6197.89%
RI42.0519.5014.197.602.63MW/m2
MPRR37.0925.5921.5615.859.22bar/CAD
Table 11. The effect of boost pressure on the engine performance.
Intake Pressure1.281.481.882.082.282.48Bar
Power8.6616.7517.3617.5117.6817.79Kw
Combustion efficiency62.3097.7598.6198.5899.0399.03%
RI0.1816.847.606.236.605.30MW/m2
MPRR1.5021.2815.8514.9815.6614.40Bar/CAD
Disclaimer/Publisher’s Note: The statements, opinions and data contained in all publications are solely those of the individual author(s) and contributor(s) and not of MDPI and/or the editor(s). MDPI and/or the editor(s) disclaim responsibility for any injury to people or property resulting from any ideas, methods, instructions or products referred to in the content.