


Oil and Gas Structures: Forecasting the Fire Resistance of Steel Structures with Fire Protection under Hydrocarbon Fire Conditions


Abstract
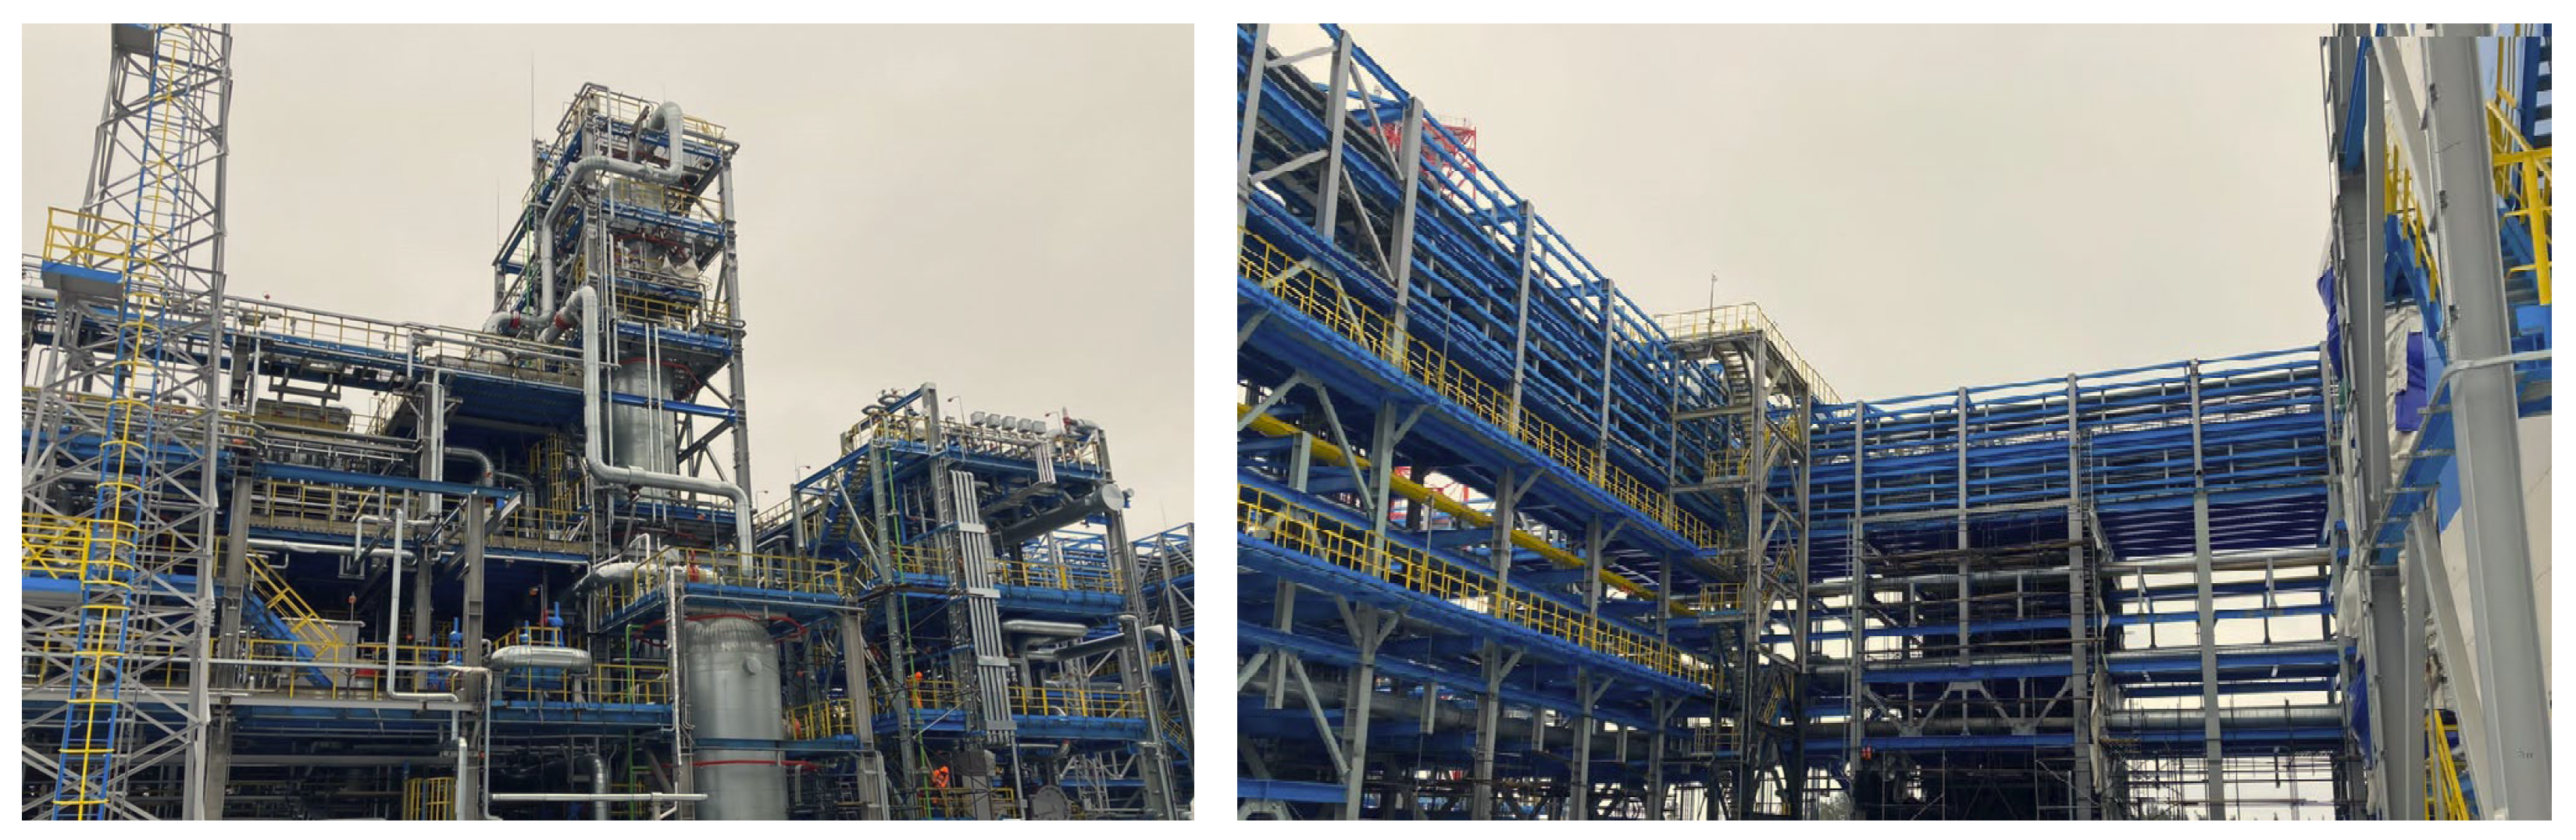
1. Introduction
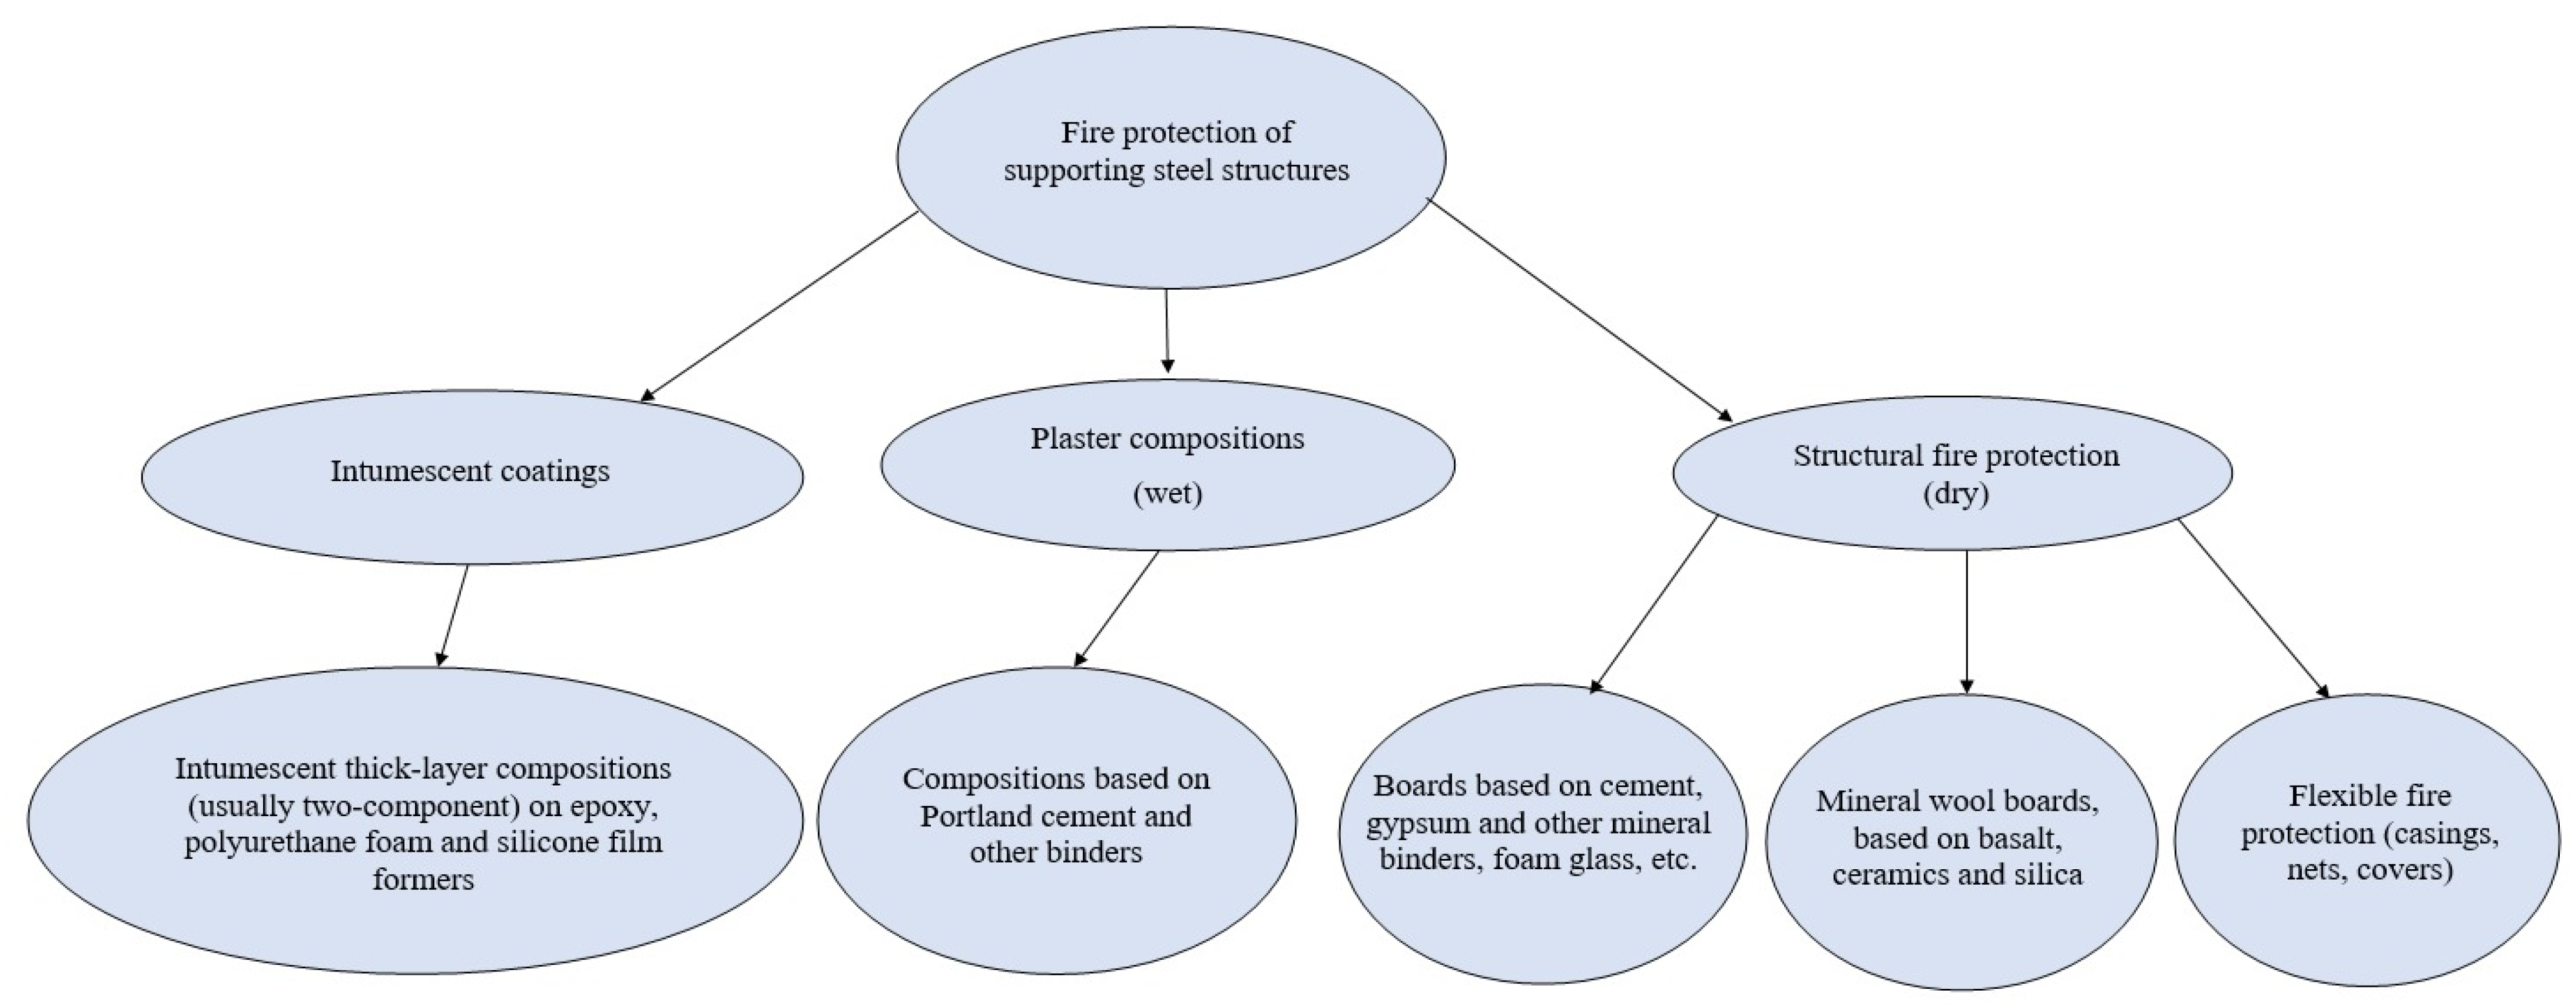
1.1. The Nominal Temperature–Time Curves and Fire Protection
- “dry” substances as structural protection with boards;
- “wet” substances as plasters, impregnations, and flame retardants;
- intumescent substances such as paints and coatings.
1.2. Limit States of Structures and Predictive Model with Fire Protection
1.3. Concept for Optimization of Fire Protection
- ▪
- adequacy of dependencies CΣ({pj}) and θa({pj}, treq) (formed for various categories of protective materials), determined by the completeness and quality of the statistical and/or experimental data used;
- ▪
- effectiveness of the computational algorithm assigned to implement the model in accordance with the structure of the generated dependencies.
1.4. Review of Research on Predicting the Fire Resistance of Structures under Different Fire Exposure
1.5. Aims and Objectives of this Study
2. Materials and Methods
2.1. Experimental Studies
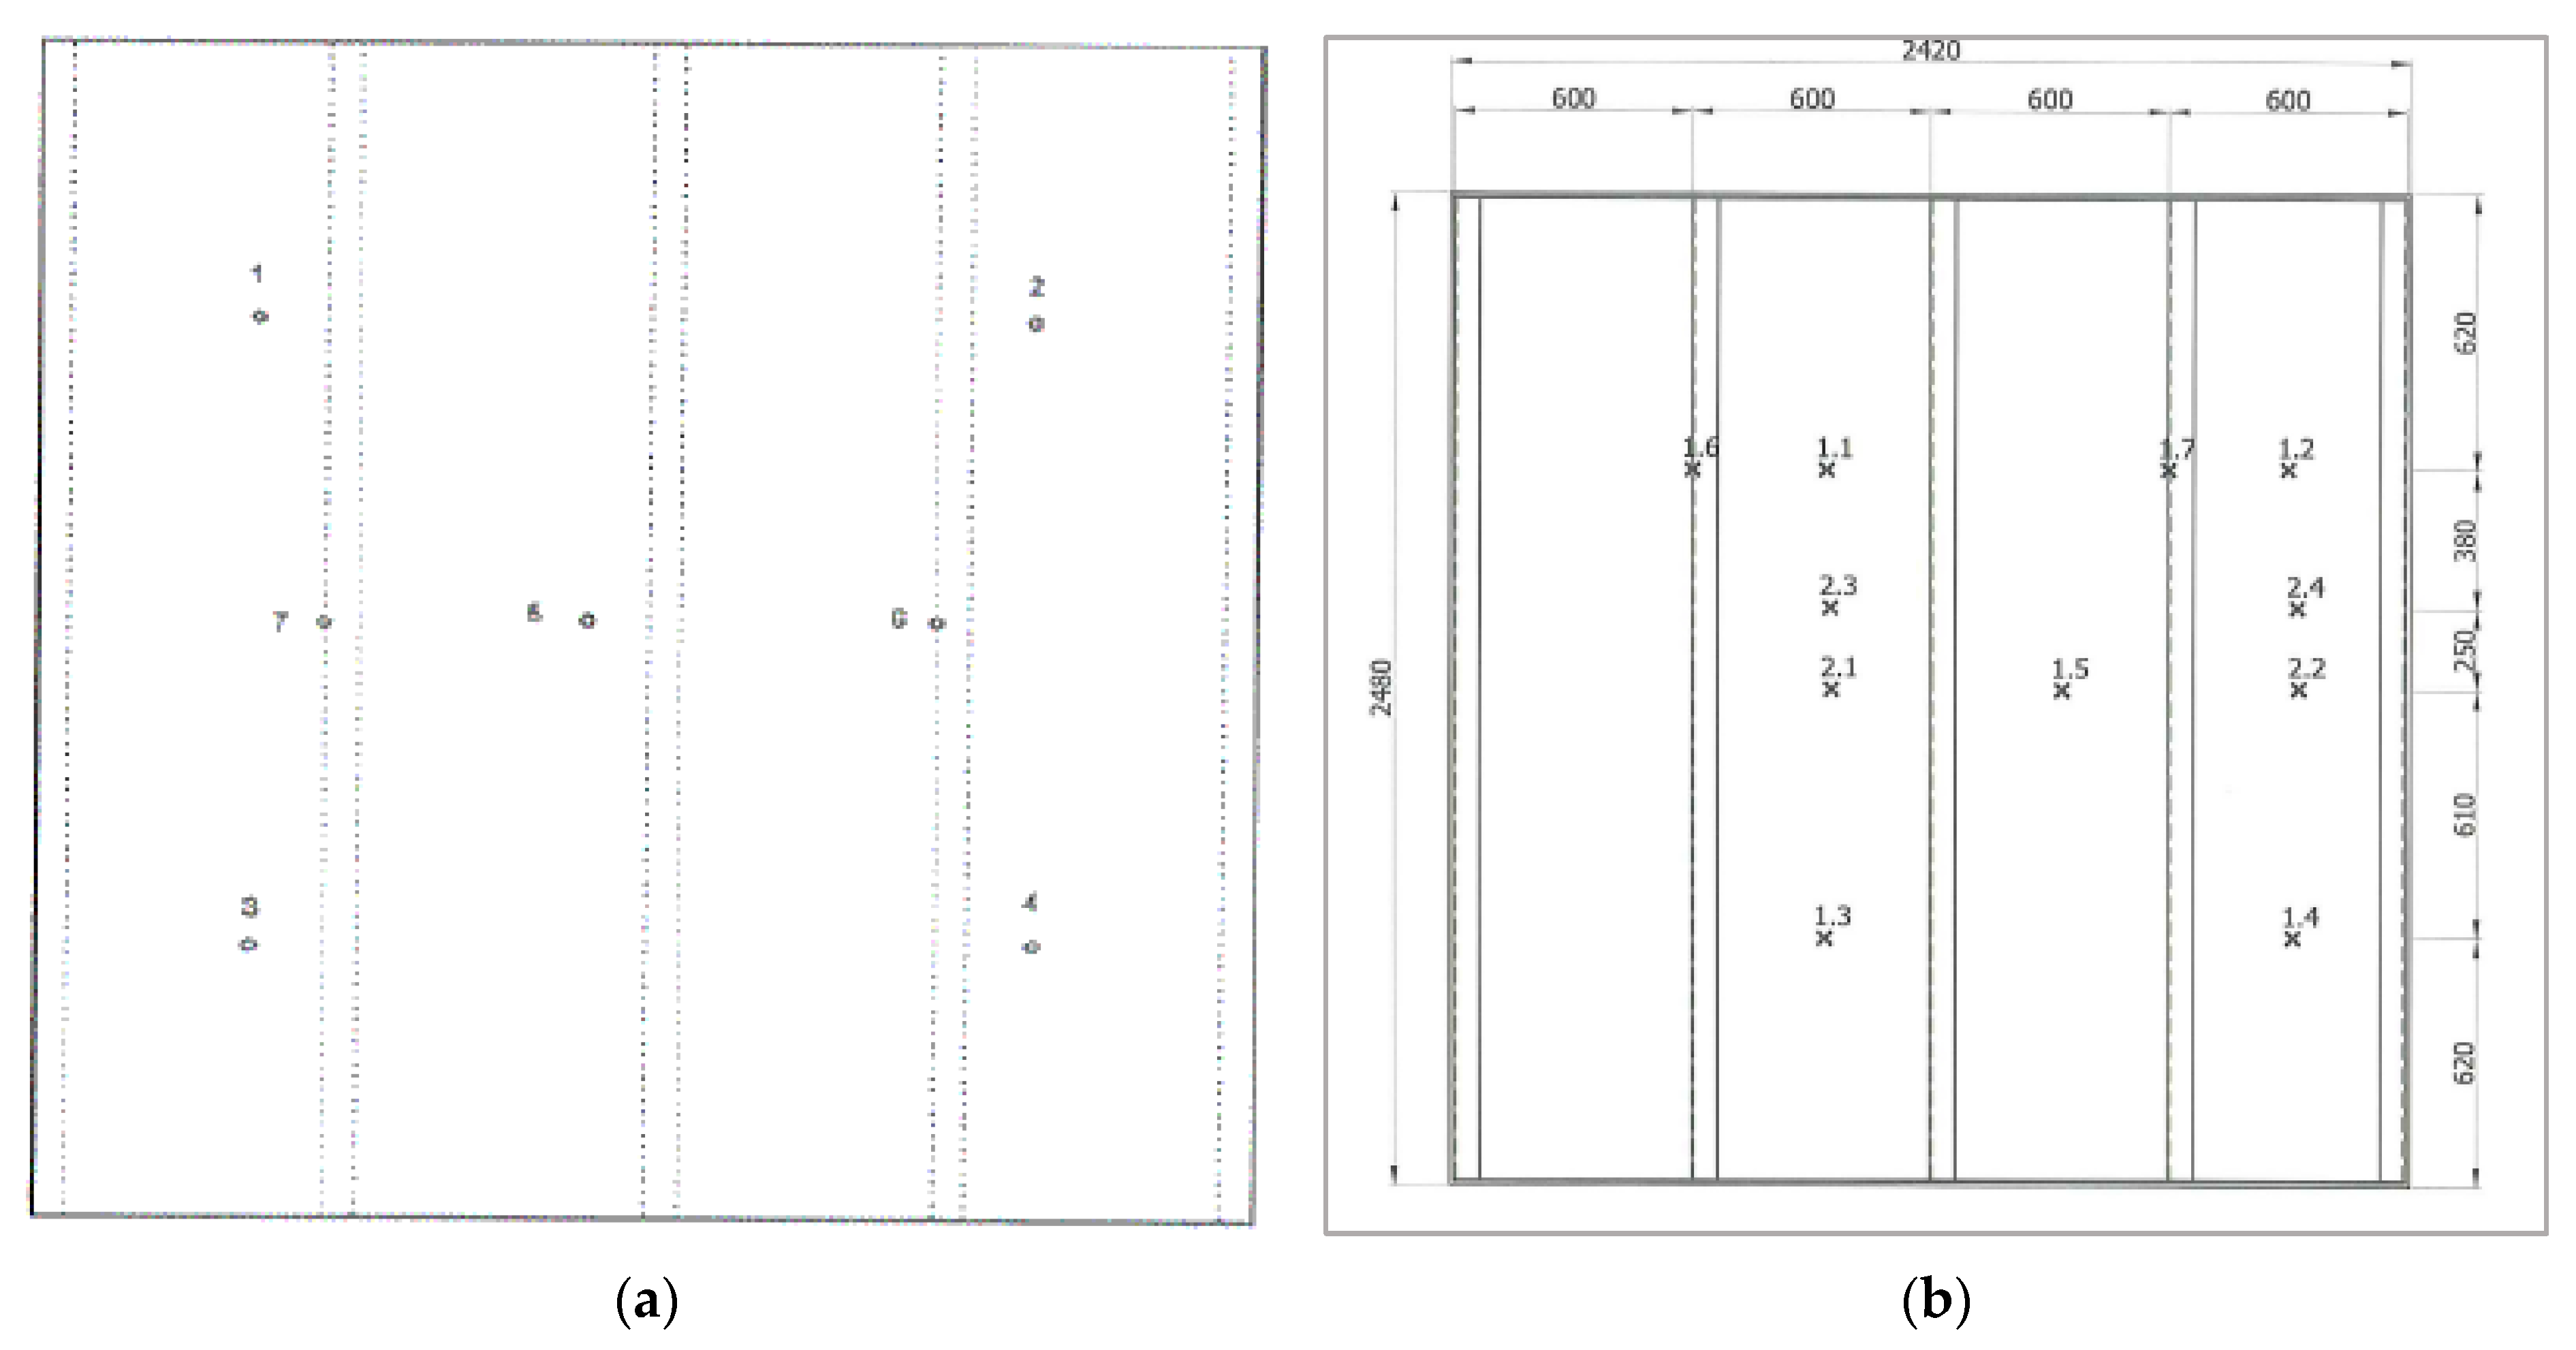
2.1.1. Decks and Bulkheads
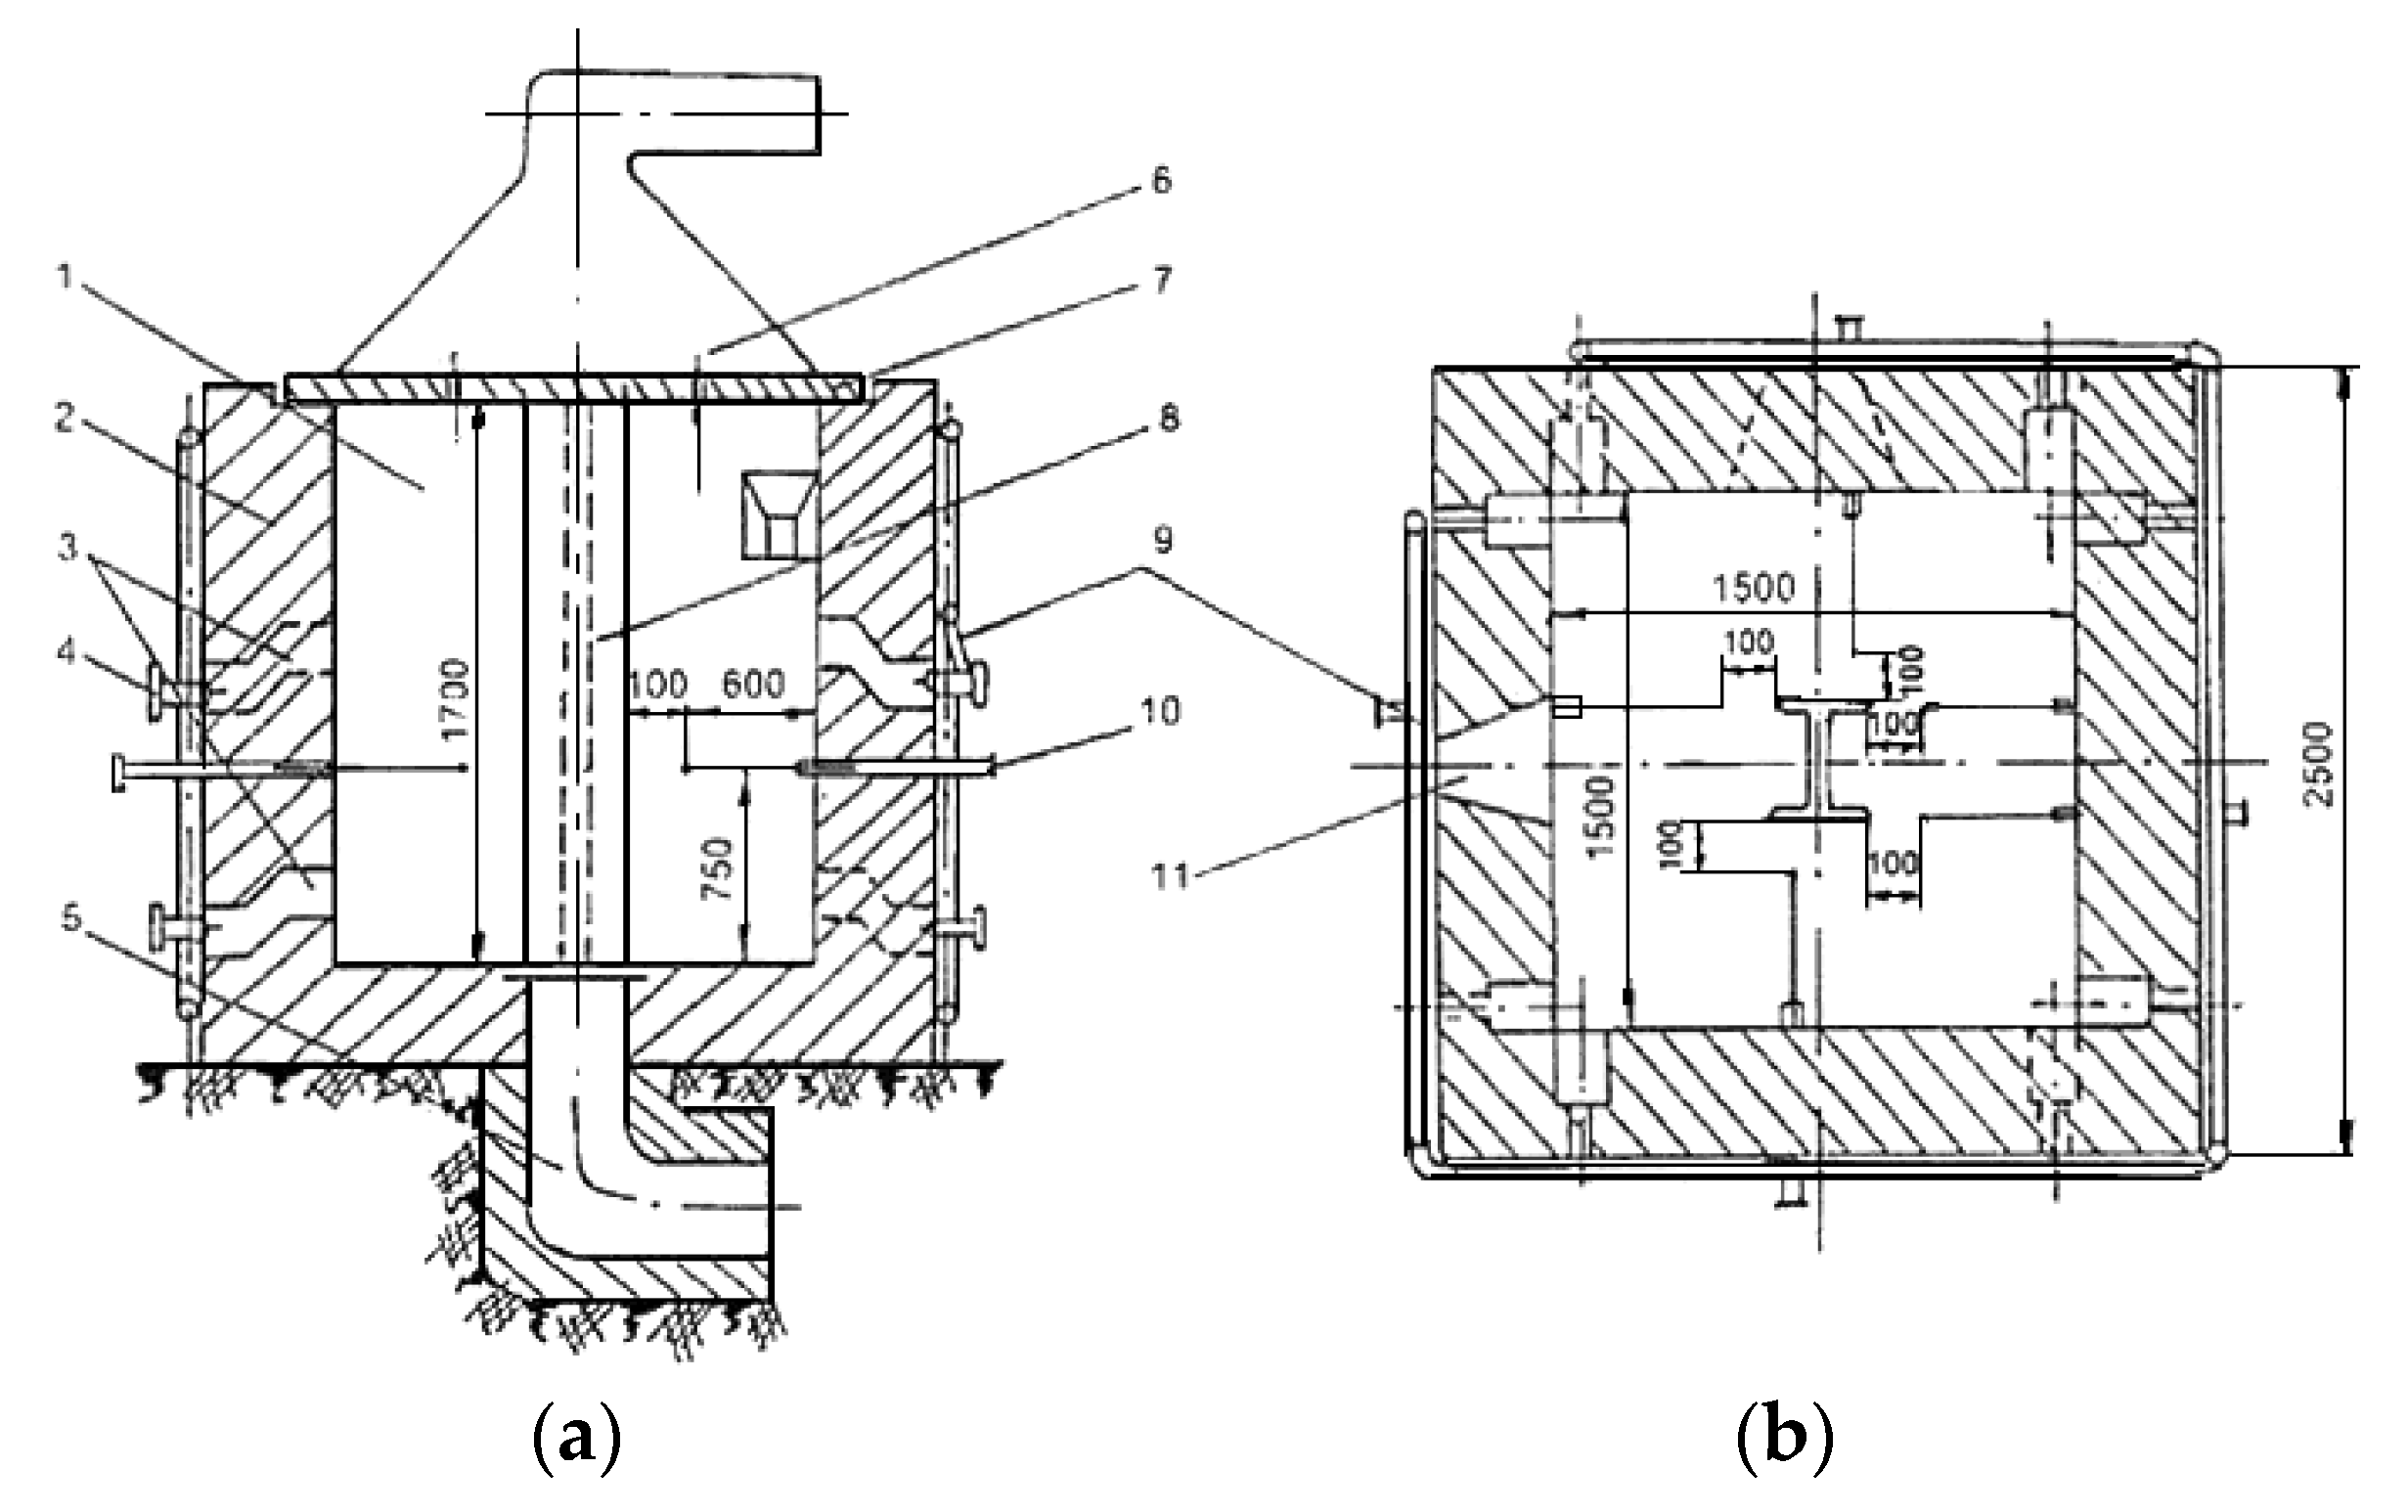
2.1.2. Columns
2.2. Modeling Method
- -
- equation of heat conduction
- -
- initial condition
- -
- boundary condition on the surface of the inverse heat conduction task at x ≤ dp
- -
- boundary condition on the inner surface of the fireproof coating at x = 0
3. Discussion and Results
3.1. The Analysis of the GAPS Report [33,34] and Data Provided in the Standards
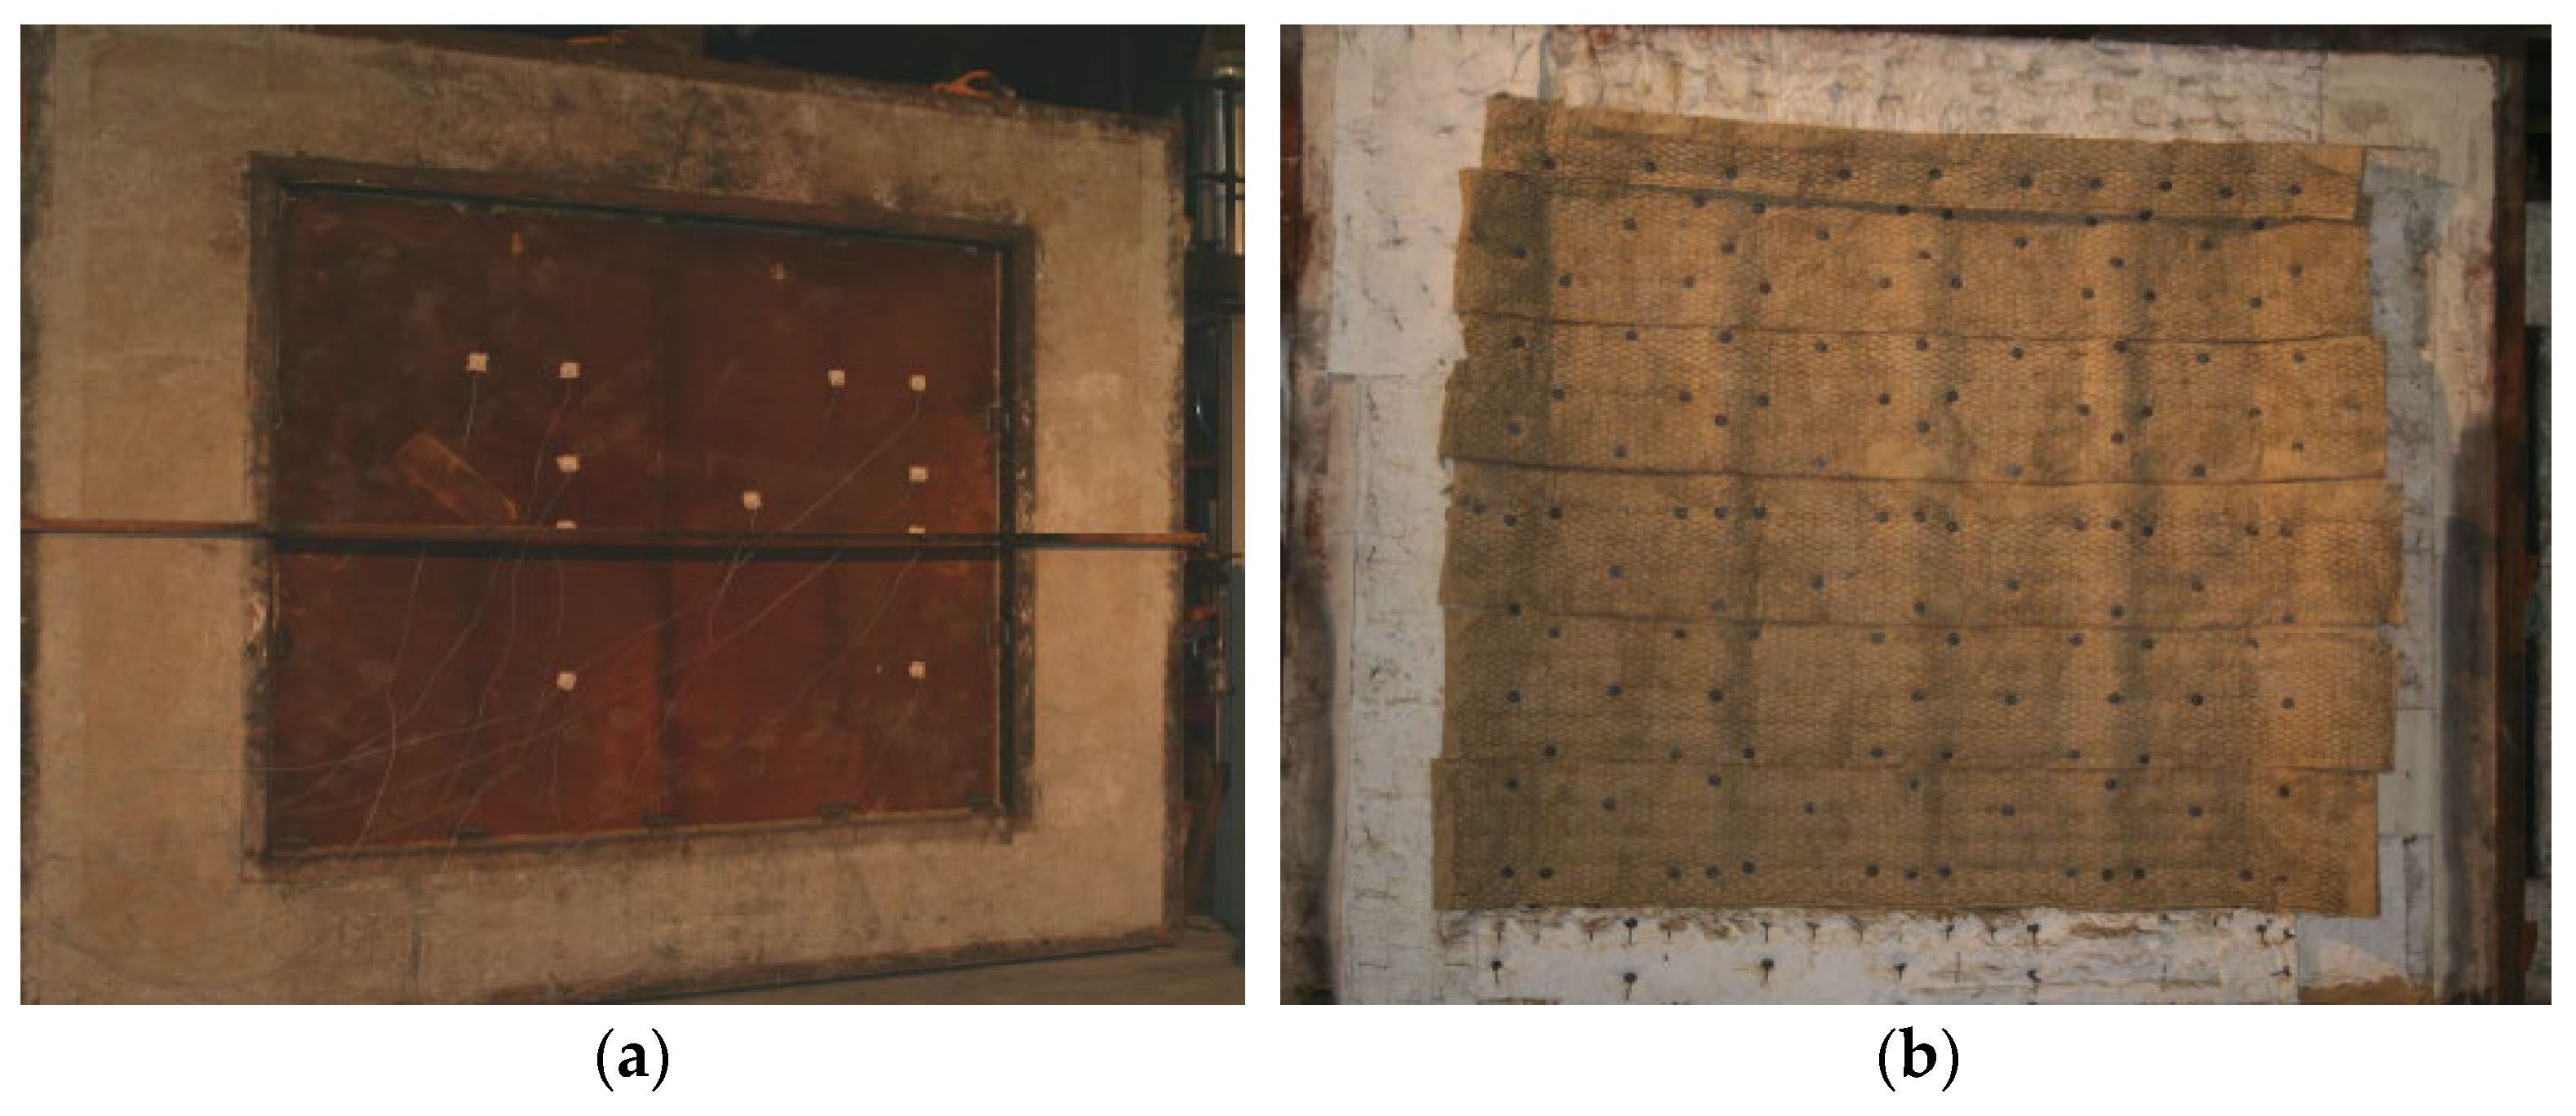
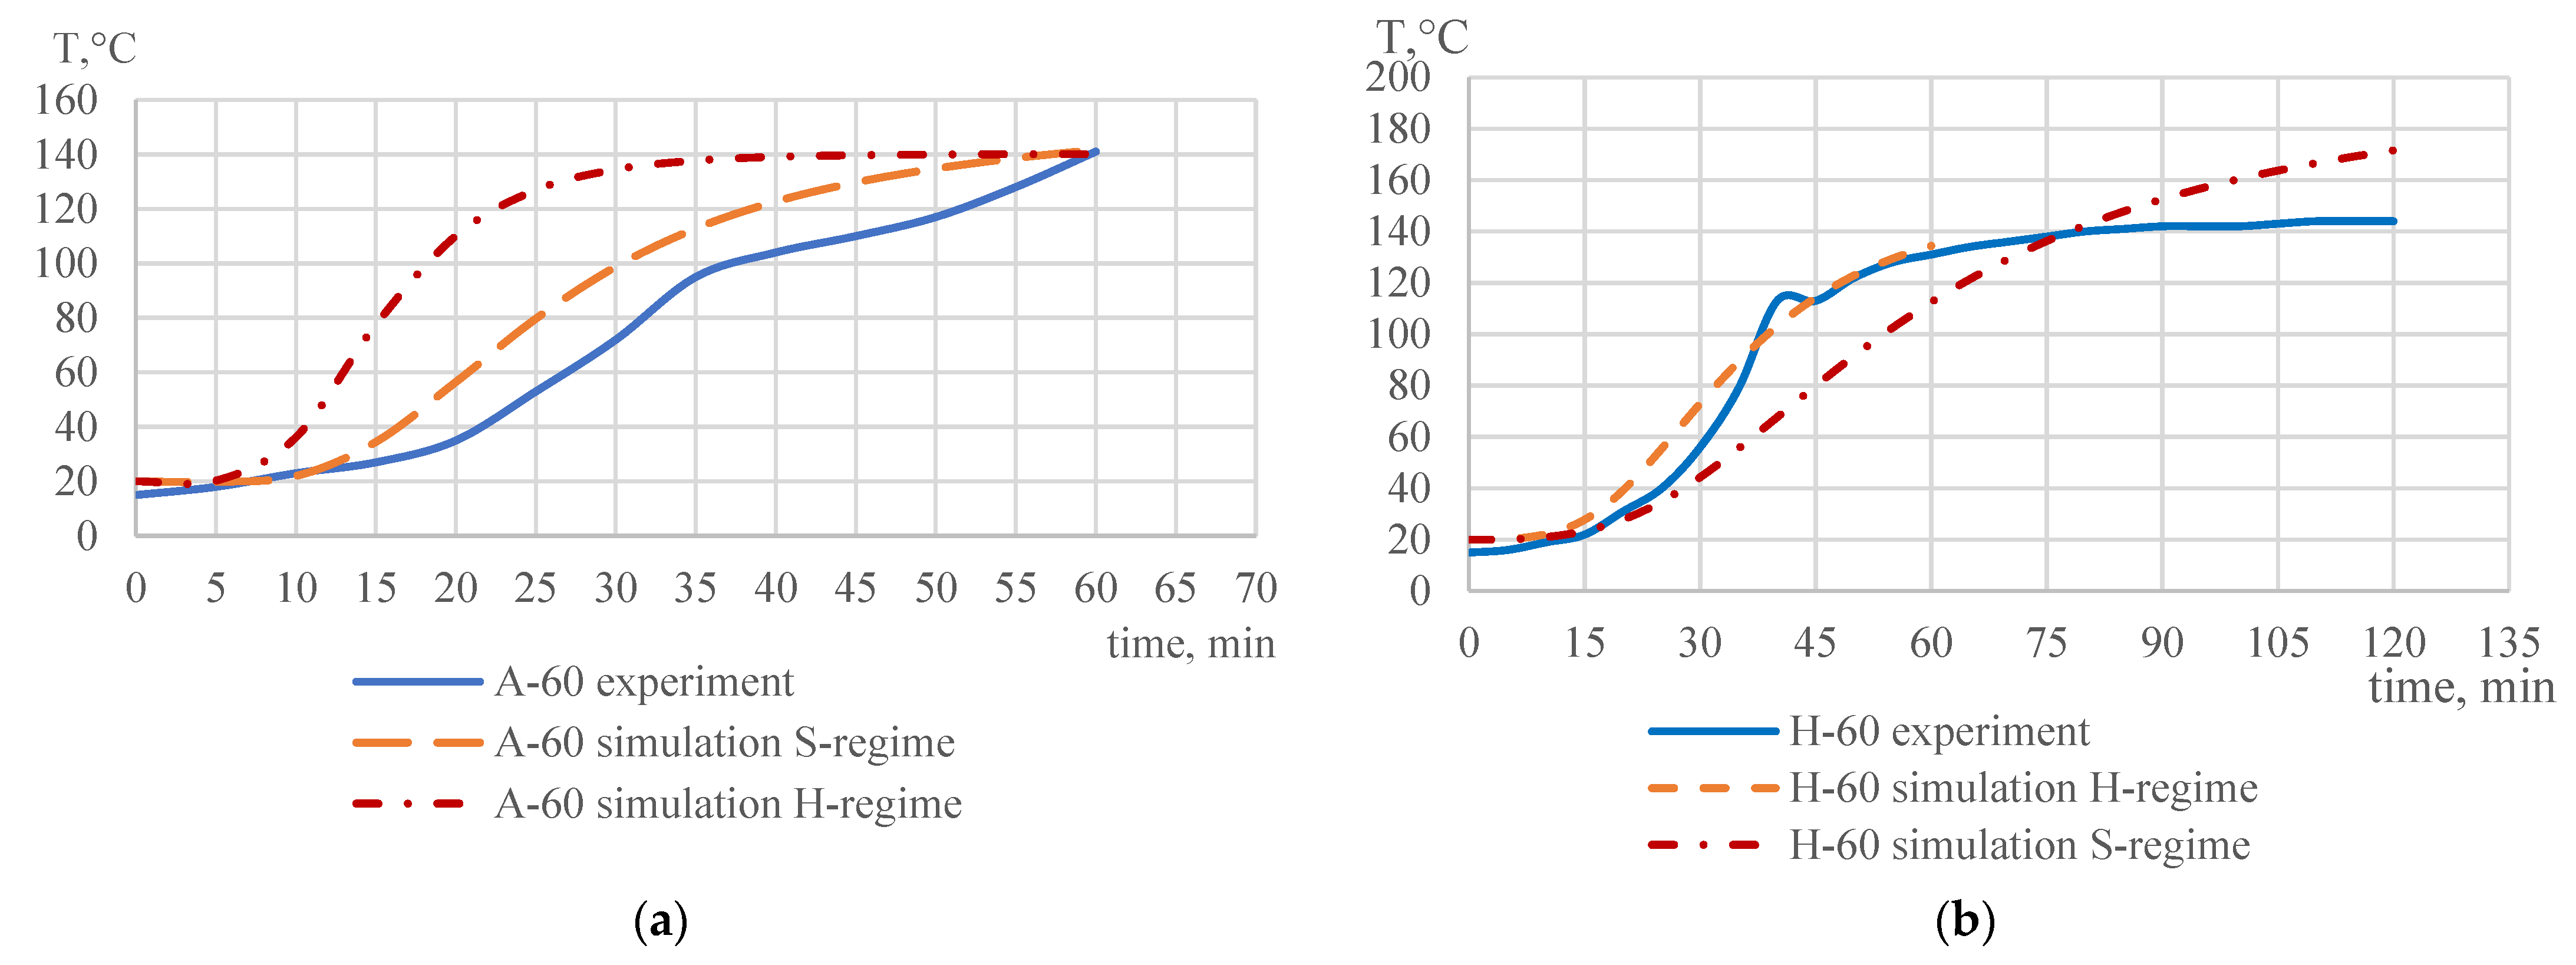
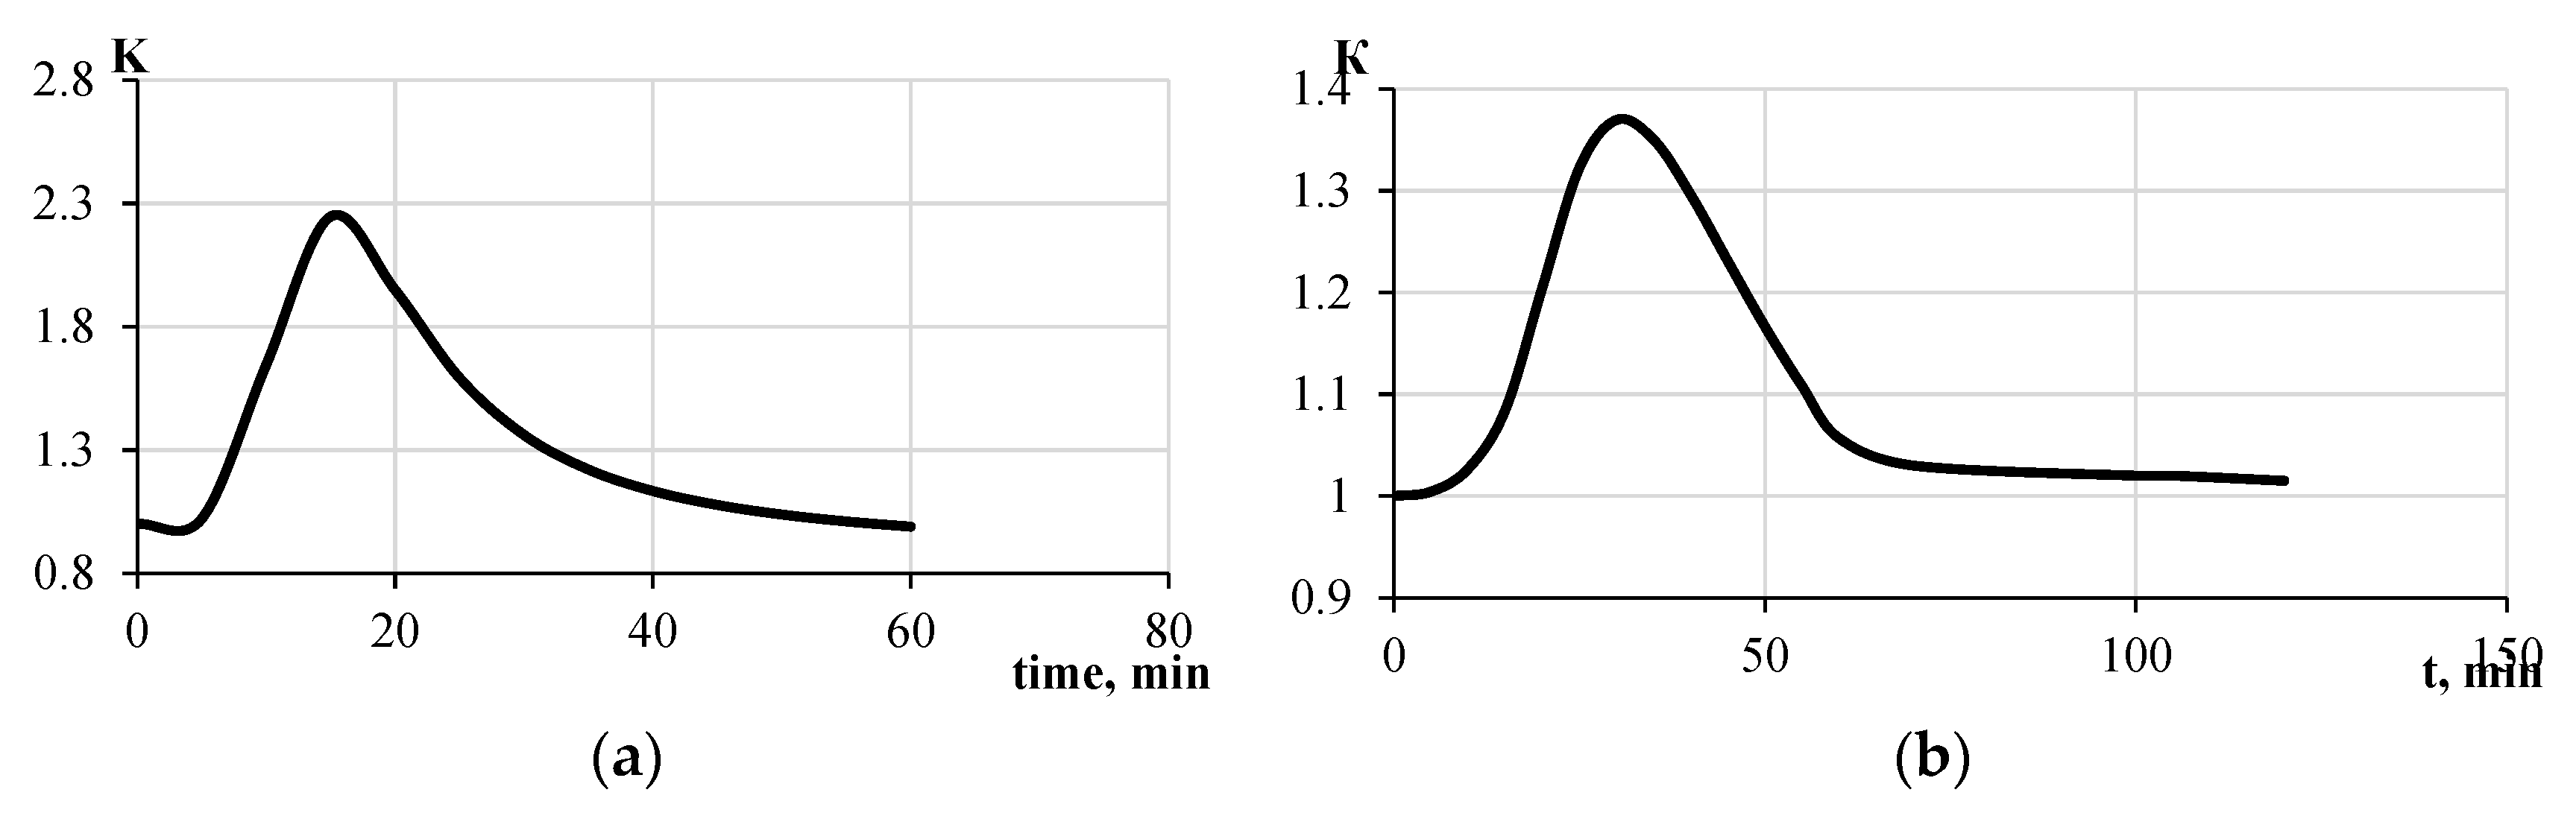
3.2. Steel Decks and Bulkheads with Mineral Wool Fire Protection
- -
- H-60 bulkhead: two layers of mineral wool, each 60/125 mm thick, density 150 kg/m3
- -
- A-60 bulkhead: two layers of mineral wool, each 60/85 mm thick, density 100 kg/m3.
3.3. Fire-Retardant Plasters and Epoxy Coatings
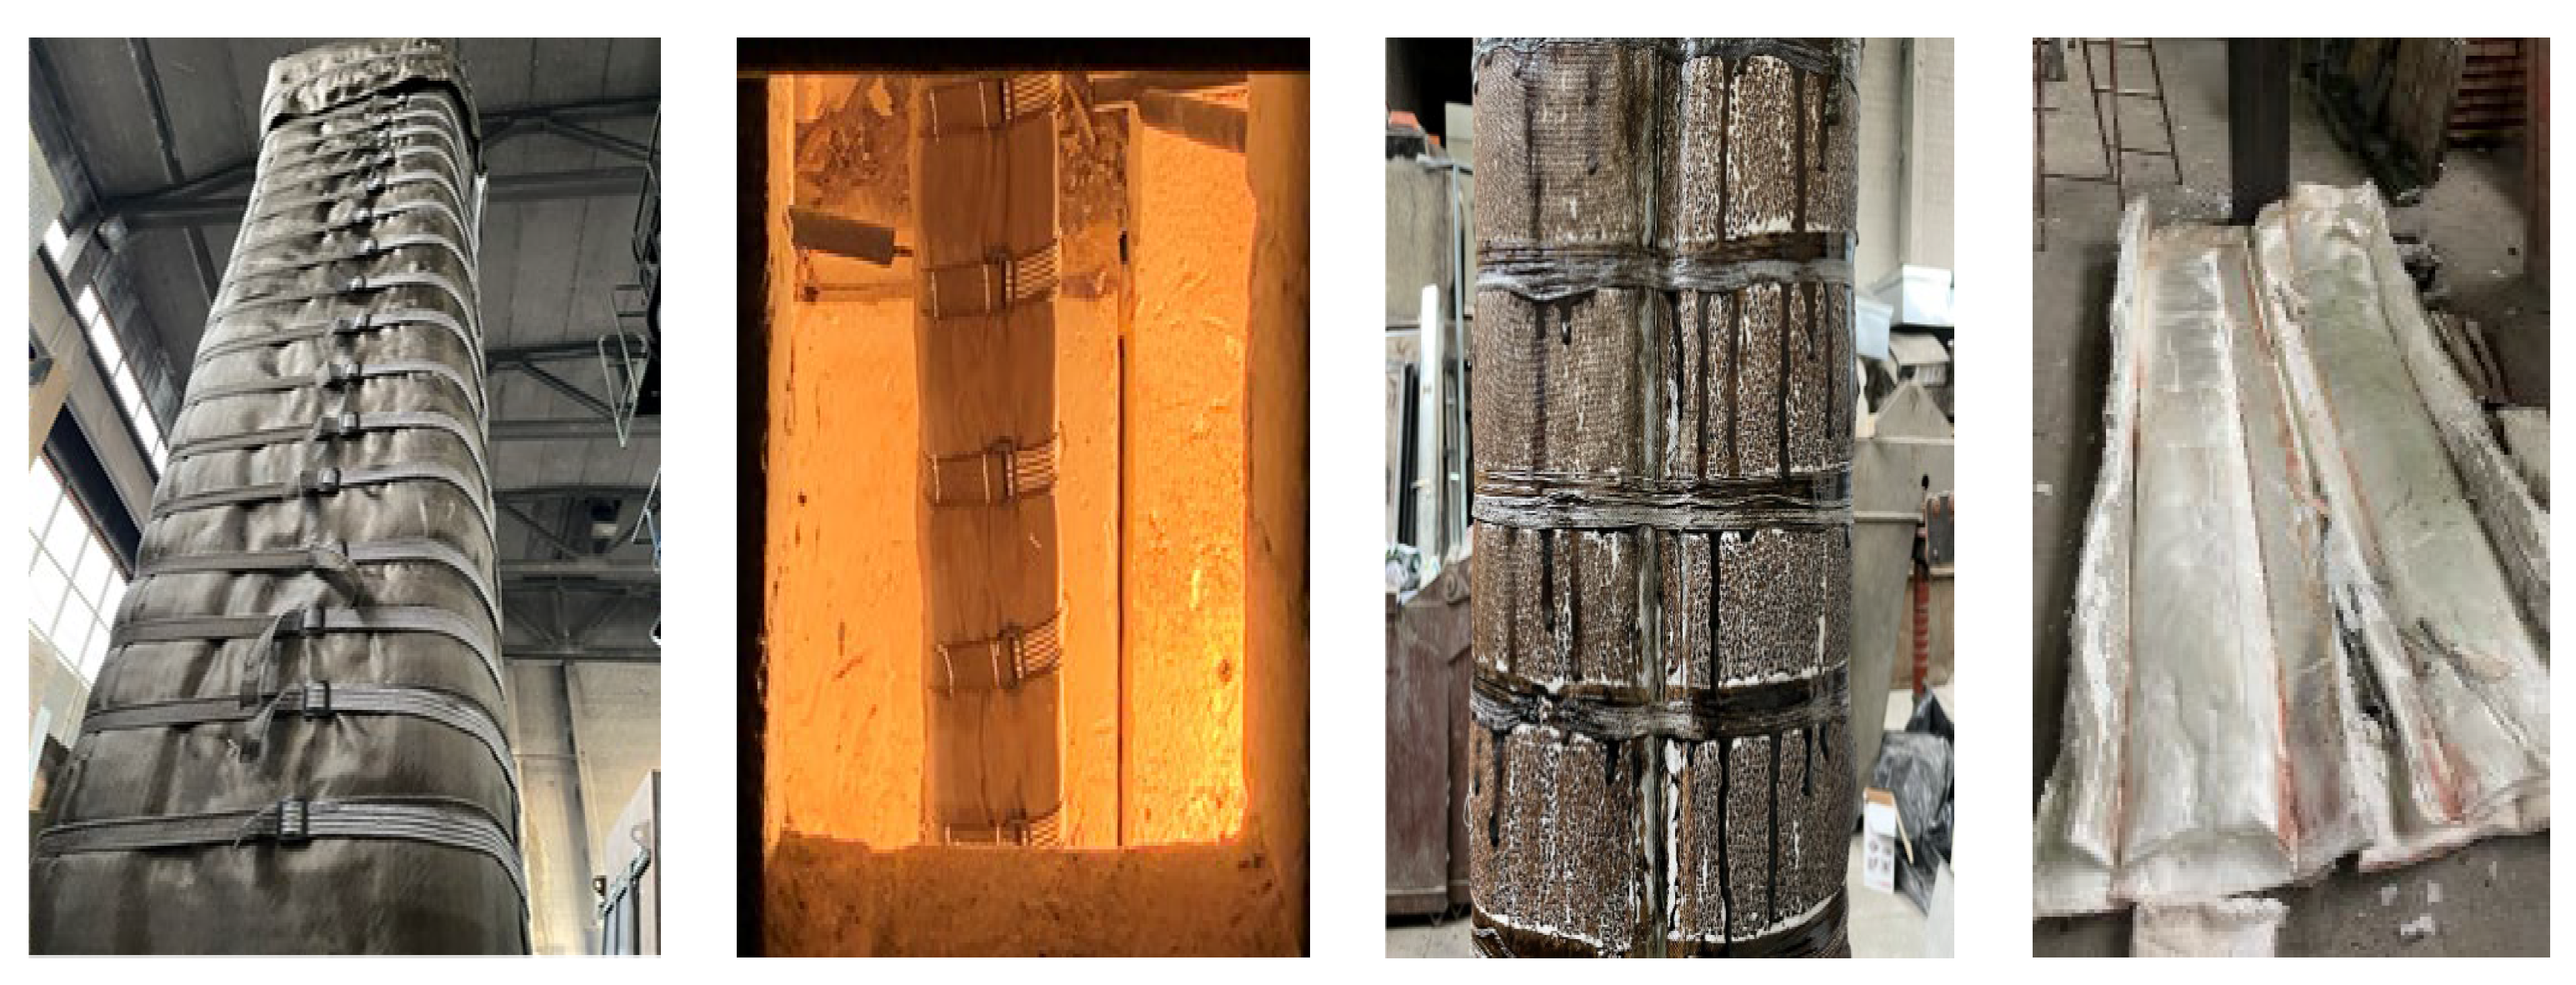
3.4. Fire Protection System with Basalt and Ceramic Fibers (Non-Combustible Covers)
3.5. Portland Cement-Based Fireproofing Boards
4. Conclusions
Author Contributions
Funding
Institutional Review Board Statement
Informed Consent Statement
Data Availability Statement
Acknowledgments
Conflicts of Interest
References
- Nolan, D.P. Handbook of Fire and Explosion Protection Engineering Principles for Oil, Gas, Chemical, and Related Facilities, 4th ed; Gulf Professional Publishing: Houston, TX, USA, 2018; p. 522. ISBN 978-0-12-816002-2. [Google Scholar]
- Matyushin, A.V.; Kondashov, A.A.; Matyushin, Y.A.; Sibirko, V.I. Analytical Methodology for Substantiating the Optimal Frequency of Scheduled Inspections of the Fire-fighting Condition of Industrial and Warehouse Buildings. Occup. Saf. Ind. 2023, 9, 32–38. [Google Scholar] [CrossRef]
- Brkić, D.; Praks, P. Probability Analysis and Prevention of Offshore Oil and Gas Accidents: Fire as a Cause and a Consequence. Fire 2021, 4, 71. [Google Scholar] [CrossRef]
- Hosseinnia Davatgar, B.; Paltrinieri, N.; Bubbico, R. Safety Barrier Management: Risk-Based Approach for the Oil and Gas Sector. J. Mar. Sci. Eng. 2021, 9, 722. [Google Scholar] [CrossRef]
- EN 1363-2:1999; Fire Resistance Tests—Part 2: Alternative and Additional Procedures. CEN (European Committee for Standardization): Brussels, Belgium, 2001. Available online: https://nd.gostinfo.ru/document/6239985.aspx (accessed on 2 September 2023).
- ISO 834-1:1999/Amd 2; 2021 Fire-Resistance Tests. Elements of Building Construction. Part 1: General Requirements. International Organization for Standardization: Geneva, Switzerland, 2012. Available online: https://cdn.standards.iteh.ai/samples/81661/75243e089adb4a66b90d236c28cc55da/ISO-834-1-1999-Amd-2-2021.pdf (accessed on 18 May 2024).
- UL 1709-2017; Standard for Safety Rapid Rise Fire Tests of Protection Materials for Structural Steel. Underwriters Laboratories Inc. (UL): Northbrook, IL, USA, 2017. Available online: https://docs.cntd.ru/document/550713257 (accessed on 29 January 2024).
- Abdulkareem, B.F.; Izzet, A.F.; Oukaili, N. Post-Fire Behavior of Non-Prismatic Beams with Multiple Rectangular Openings Monotonically Loaded. Eng. Technol. Appl. Sci. Res. 2021, 11, 7763–7769. [Google Scholar] [CrossRef]
- Mahmood, E.M.; Allawi, A.A.; El-Zohairy, A. Analysis and Residual Behavior of Encased Pultruded GFRP I-Beam under Fire Loading. Sustainability 2022, 14, 13337. [Google Scholar] [CrossRef]
- Chen, L.; Tong, H.; Liu, Z.; Zhang, Z.; Mou, P. Research on Quantitative Calculation Method of Accident Scope of Gathering and Transportation Station. Energies 2022, 15, 9476. [Google Scholar] [CrossRef]
- Li, N.; Zhang, B.; Liu, X.; Wang, K.; Wang, H. Experimental Research and Numerical Analysis of Marine Oil Leakage and Accidental Ignition in Fishing Vessels. Appl. Sci. 2023, 13, 11510. [Google Scholar] [CrossRef]
- IMO Resolution A.754 (18); Recommendation for Testing Fire Resistance of Class “A”, “B” and “F” Slabs. International Maritime Organization: London, UK, 1993. Available online: https://wwwcdn.imo.org/localresources/en/KnowledgeCentre/IndexofIMOResolutions/AssemblyDocuments/A.754(18).pdf (accessed on 18 May 2024).
- ASTM E119; Standard Test Methods for Fire Tests of Building Construction and Materials. ASTM International: West Conshohocken, PA, USA, 2022. Available online: https://www.astm.org/e0119-00a.html (accessed on 29 January 2024).
- EN 1991-1-2; Eurocode 1: Actions on Structures—Part 1–2: General Actions—Actions on Structures Exposed to Fire. CEN (European Committee for Standardization): Brussels, Belgium, 2002. Available online: https://www.phd.eng.br/wp-content/uploads/2015/12/en.1991.1.2.2002.pdf (accessed on 25 October 2023).
- GOST 30247.1-94; Elements of Building Constructions. Fire-Resistance Test Methods. Loadbearing and Separating Constructions. IPK Izdatelstvo Standartov: Moscow, Russia, 1995. Available online: https://docs.cntd.ru/document/9055247 (accessed on 20 November 2023).
- Standard of the Organization of the Russian Association for the Development of Steel Construction “Design of Fire Protection of Load-Bearing Steel Structures with the Use of Various Types of Coatings”. Izdatelstvo: Development Association Steel Construction. Available online: https://steel-development.ru/en/for-designers/ntd-kategoriya/sto-arss (accessed on 7 May 2024).
- API RP 2218; Fireproofing Practices in Petroleum and Petrochemical Processing Plants. API Publishing Services: Washington, DC, USA, 2013; p. 68. Available online: https://www.apiwebstore.org/standards/2218 (accessed on 7 May 2024).
- GOST 53295-2009; Fire Retardant Compositions for Steel Constructions. General Requirement. Method for Determining Fire Retardant Efficiency. IPK Izdatelstvo Standartov: Moscow, Russia, 2009. Available online: https://docs.cntd.ru/document/1200071913 (accessed on 7 May 2024).
- Eremina, T.; Korolchenko, D. Fire Protection of Building Constructions with the Use of Fire-Retardant Intumescent Compositions. Buildings 2020, 10, 185. [Google Scholar] [CrossRef]
- Häßler, D.; Hothan, S. Performance of intumescent fire protection coatings applied to structural steel tension members with circular solid and hollow sections. Fire Saf. J. 2022, 131, 103605. [Google Scholar] [CrossRef]
- Randaxhe, J.; Popa, N.; Vassart, O.; Tondini, N. Development of a plug-and-play fire protection system for steel columns. Fire Saf. J. 2021, 121, 103272. [Google Scholar] [CrossRef]
- Al-Jadiri, M.S.F.; Said, A.M.I. Reinforced Concrete Columns Insulated by Different Gypsum Layers Exposed to 900 °C One Side Fire Flame. Eng. Technol. Appl. Sci. Res. 2023, 13, 11586–11592. [Google Scholar] [CrossRef]
- Diaconu, B.; Cruceru, M.; Anghelescu, L. Fire Retardance Methods and Materials for Phase Change Materials: Performance, Integration Methods, and Applications—A Literature Review. Fire 2023, 6, 175. [Google Scholar] [CrossRef]
- Barthelemy, B.; Kruppa, J. Fire Resistance of Building Structures/Transl.; Predtechensky, M.V., Zhukov, V.V., Zhukov, V., Eds.; Stroyizdat: Moscow, Russia, 1985; 216 c.-Translation from: Resistance au feu des structures beton-asier-bois/V. Barthelemy, J. Kruppa. [Google Scholar]
- Bogdanova, V.V.; Kobets, O.I.; Buraya, O.N.; Ustinov, A.A.; Zybina, O.A. Intumescent compounds for fireproofing of polymer pipelines. Mag. Civ. Eng. 2022, 116, 11607. [Google Scholar] [CrossRef]
- Ustinov, A.; Babikova, A.; Zybina, O.; Lobov, D.; Printseva, M.; Klaptyuk, I.; Shkitronov, M. Improvement of Methodology for Assessing Fire-Protective Efficiency of Intumescent Coatings Applied on Metal Constructions. E3S Web Conf. 2021, 320, 02009. [Google Scholar] [CrossRef]
- Wang, X.; Weinell, C.E.; Ring, L.; Kiil, S. Thermal insulation performance and char formation and degradation mechanisms of boron-containing hydrocarbon intumescent coatings. Fire Saf. J. 2021, 123, 103369. [Google Scholar] [CrossRef]
- Häßler, D.; Mund, M.; Daus, L.; Hothan, S.; Schaumann, P.; Schartel, B. Durability of intumescent coatings and recommendations for test concepts for a working life of more than 10 years. Fire Saf. J. 2024, 146, 104173. [Google Scholar] [CrossRef]
- Strakhov, V.L.; Kuz’min, I.A.; Bakulin, V.N. Complex mathematical modeling of thermal protection made of highly extended elastomers. High Temp. 2019, 57, 250–255. [Google Scholar] [CrossRef]
- Polevoda, I.I.; Ivanitskiy, A.G.; Zhamoydik, S.M.; Prorovsky, V.M. Software Tool for Calculating the Dynamics of Heating of Steel Structures with Structural Fire Protection//Fire Safety: Problems and Prospects. 2010. N°1 (1). Available online: https://cyberleninka.ru/article/n/programmnoe-sredstvo-dlya-rascheta-dinamiki-progreva-stalnyh-konstruktsiy-s-konstruktivnoy-ognezaschitoy (accessed on 10 November 2023).
- Gravit, M.; Shabunina, D.; Shcheglov, N. Thermal Characteristics of Epoxy Fire-Retardant Coatings under Different Fire Regimes. Fire 2023, 6, 420. [Google Scholar] [CrossRef]
- Wang, S.; Hou, X.; Wang, Y.; Chen, Y.; Xu, D.; Liu, C.; Huang, Q. Design and Validation of Lifetime Prediction Model for Lithium-Thiocarbonyl Chloride Batteries Based on Accelerated Aging Experiments. Metals 2023, 13, 1579. [Google Scholar] [CrossRef]
- Cheng, S.; Yuan, Z.; Ye, X.; Zhang, F.; Liu, J. Empirical prediction model for Li/SOCl2 cells based on the accelerated degradation test. Microelectron. Reliab. 2015, 55, 101–106. [Google Scholar] [CrossRef]
- Fireproofing for Hydrocarbon Fire Exposures//GAPS Guidelines. Publication of Global Asset Protection Services LLC. 2000. Available online: https://www.appliedbuildingtech.com/system/files/gap2.5.1.fireproofingforhydrocarbonexposures.pdf (accessed on 24 August 2021).
- AXA XL Risk Consulting. GAPS© 2020. Available online: https://axaxl.com/-/media/axaxl/files/pdfs/prc-guidelines/prc-2/prc251fireproofingforhydrocarbonfireexposuresv1.pdf (accessed on 7 May 2024).
- Shebeko, Y.N.; Zuban, A.V.; Shebeko, A.Y. An evaluation of an actual fire resistance limit of non-protected steel structures for different temperature regimes of fires. Pozharovzryvobezopasnost/Fire Explos. Saf. 2019, 28, 29–34. (In Russian) [Google Scholar] [CrossRef]
- Cherkasov, E.Y.; Voroncova, A.A.; Mit’ko, A.V. Fire resistance of steel structures exposed to standard and hydrocarbon fire regimes. Neftegaz.RU. 2021, 12, 100–102. (In Russian). Available online: https://magazine.neftegaz.ru/articles/prombezopasnost/714005-ognestoykost-stalnykh-konstruktsiy-pri-vozdeystvii-standartnogo-i-uglevodorodnogo-rezhimov-pozhara/ (accessed on 7 May 2024).
- Gravit, M.; Shabunina, D. Numerical and Experimental Analysis of Fire Resistance for Steel Structures of Ships and Offshore Platforms. Fire 2022, 5, 9. [Google Scholar] [CrossRef]
- Gravit, M.; Shabunina, D.; Antonov, S.; Danilov, A. Thermal Characteristics of Fireproof Plaster Compositions in Exposure to Various Regimes of Fire. Buildings 2022, 12, 630. [Google Scholar] [CrossRef]
- Gravit, M.; Prusakov, V.; Shcheglov, N.; Kotlyarskaya, I. Fire Protection of Steel Structures of Oil and Gas Facilities: Multilayer, Removable, Non-Combustible Covers. Fire 2024, 7, 86. [Google Scholar] [CrossRef]
- Gravit, M.; Golub, E.; Klementev, B.; Dmitriev, I. Fire Protective Glass Fiber Reinforced Concrete Plates for Steel Structures under Different Types of Fire Exposure. Buildings 2021, 11, 187. [Google Scholar] [CrossRef]
- QuickField. Modeling of Two-Dimensional Fields by the Finite Element Method. Available online: https://quickfield.com/ (accessed on 17 December 2023).
- Kung, F.; Yang, M.C. Improvement of the Heat-Dissipating Performance of Powder Coating with Graphene. Polymer 2020, 12, 1321. [Google Scholar] [CrossRef] [PubMed]
- GOST 26020-83; Russian State Standard, Hot-Rolled Steel I-Beam with Parallel Flange Edges. Dimensions. IPK Izdatelstvo Standartov: Moscow, Russia, 2003. Available online: https://internet-law.ru/gosts/gost/21141/ (accessed on 29 January 2024).
- Markus, E.S.; Snegirev, A.Y.; Kuznetsov, E.A. Numerical Simulation of a Fire Using Fire Dynamics; St. Petersburg Polytech-Press: St. Petersburg, Russia, 2021. [Google Scholar]
- Palevoda, I.I.; Zhamoydik, S.M.; Zaynudinova, N.V.; Nekhan, D.S. Regulation of the fire resistance of modern building structures of reinforced concrete. J. Civ. Prot. 2023, 7, 144–163. [Google Scholar] [CrossRef]
- Garashchenko, A.N.; Antonov, S.P.; Vinogradov, A.V. Studying the thermal characteristics and effectiveness of structural fire proofing made of PROSASK Firepanel cement boards by means of reproducing the high-temperature effect. Pozharovzryvobezopasnost/Fire Explos. Saf. 2022, 31, 13–29. (In Russian) [Google Scholar] [CrossRef]
- Garashchenko, A.N.; Danilov, A.I.; Antonov, S.P.; Marchenkova, S.V.; Pavlov, V.V. The thermal analysis of fire test results obtained for loaded cast iron tubing used to line subway tunnels, their rational fire protection and pre-set fire resistance. Pozharovzryvobezopasnost/Fire Explos. Saf. 2022, 31, 21–39. [Google Scholar] [CrossRef]


| Material | ASTM E-119 Ratings (min)—S-Curve | |||||||||
|---|---|---|---|---|---|---|---|---|---|---|
| 30 | 45 | 60 | 90 | 120 | 150 | 180 | 240 | 300 | 360 | |
| Corresponding Rating For UL 1709 (min)—H-curve | ||||||||||
| Intumescent Epoxy 1 | 39 | 52 | 72 | 125 | ||||||
| Ceramic Mat | 98 | 154 | ||||||||
| Magnesiumoxychloride | 35 | 60 | 90 | 150 | 240 | |||||
| Intumescent Epoxy 2 | 62 | 90 | 115 | 138 | 240 | |||||
| Cement Panels | 148 | |||||||||
| GAPS Normal Concrete | 158 | 350 | ||||||||
| GAPS Light Concrete | 225 | 355 | ||||||||
| Sample | Structure | Fire Protection, Type | Fire Protection: Thickness, mm | Figure |
|---|---|---|---|---|
| H-60 | 70/110 mm Deck: 5 mm Stiffener: 10 mm | rock wool Density: 150 kg/m3 | exposed surface: on the level: 70 mm on stiffeners: 50 mm below stiffeners: 60 mm |  |
| A-60 | 65/85 mm Deck: 5 mm Stiffener: 6 mm | rock wool Density: 100 kg/m3 | unexposed surface: on the level: 60 mm on stiffeners: 25 mm below stiffeners: 60 mm |  |
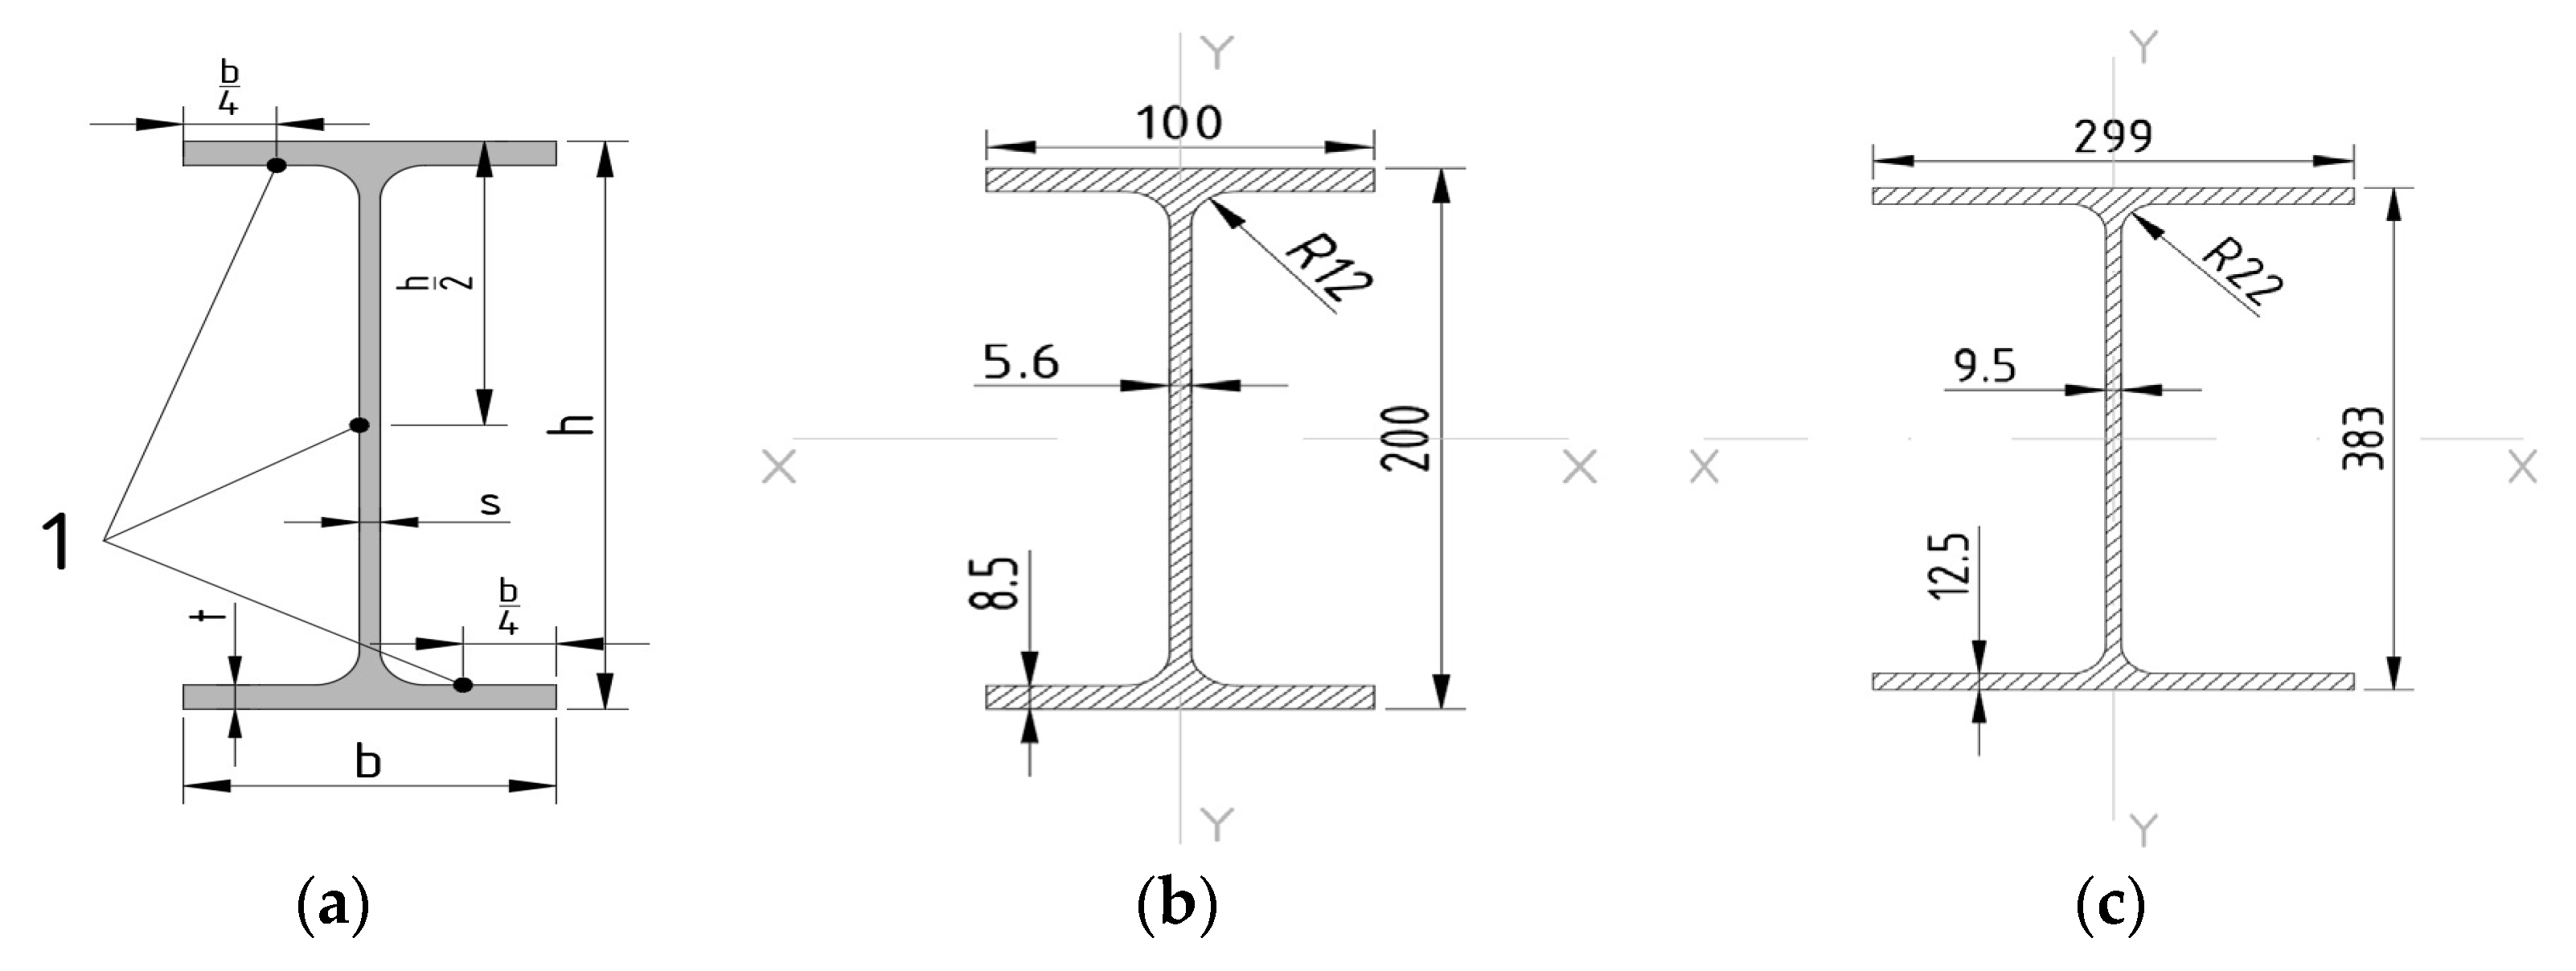
| Type | h, mm | b, mm | S, mm | t, mm | R, mm | F, cm2 | Ix, cm4 | Iy, cm4 |
|---|---|---|---|---|---|---|---|---|
| 20B1 | 200 | 100 | 5.6 | 8.5 | 12 | 28.49 | 1943 | 142.3 |
| I40 | 383 | 299 | 9.5 | 12.5 | 22 | 112.91 | 30,556 | 5575.4 |
| I30K1 | 298 | 299 | 9.0 | 14.0 | 18 | 110.8 | 18,848 | 6241 |
| Sample | Structure | Fire Protection | Thickness, mm | Fire |
|---|---|---|---|---|
| Sample No. 1.1 | I40: A/V = 134 m−1, H = 2700 mm | Plaster coating | 32 mm | S-curve |
| Sample No. 1.2 | I40: A/V = 134 m−1, H = 2700 mm | Plaster coating | 32 mm | S-curve |
| Sample No. 1.3 | I40: A/V = 134 m−1, H = 2700 mm | Plaster coating | 32 mm | H-curve |
| Sample | Structure | Fire Protection | Thickness, mm | Fire |
|---|---|---|---|---|
| Sample No. 2.1 | I50B2: A/V = 172 m−1, H = 1700 mm | epoxy coating | 9.20 mm | S-curve |
| Sample No. 2.2 | I50B2: A/V = 172 m−1, H = 1700 mm | epoxy coating | 8.40 mm | H-curve |
| Sample No. 2.3 | I14B1: A/V = 408 m−1, H = 1700 mm | epoxy coating | 10.30 mm | H-curve |
| Sample No. 2.4 | I14B1: A/V = 408 m−1, H = 1700 mm | epoxy coating | 14.44 mm | H-curve |
| Sample No. 2.5 | I14B1: A/V = 408 m−1, H = 1700 mm | epoxy coating | 6.30 mm | S-curve |
| Sample No. 2.6 | I14B1: A/V = 408 m−1, H = 1700 mm | epoxy coating | 8.75 mm | S-curve |
| Sample | Structure | Fire Protection | Thickness, mm | Fire |
|---|---|---|---|---|
| Sample No. 3.1 | I20B1: A/V = 294 m−1, H = 1700 mm | MIX PROPLATE | 15 mm | S-curve |
| Sample No. 3.2 | I20B1: A/V = 294 m−1, H = 1700 mm | MIX PROPLATE | 15 mm | H-curve |
| Sample No. 3.3 | I20B1: A/V = 294 m−1, H = 1700 mm | MIX PROPLATE | 50 mm | S-curve |
| Sample No. 3.4 | I20B1: A/V = 294 m−1, H = 1700 mm | MIX PROPLATE | 50 mm | H-curve |
| Sample No. 3.5 | I40: A/V = 134 m−1, H = 1700 mm | MIX PROPLATE | 50 mm | S-curve |
| Sample | Structure | Fire Protection | Thickness, mm | Fire |
|---|---|---|---|---|
| Sample No. 4.1 | I30K1: A/V = 157 m−1, H = 1700 mm | “Pyrosafe-Austover T” | 40 mm | S-curve |
| Sample No. 4.2 | I30K1: A/V = 157 m−1, H = 1700 mm | “Pyrosafe-Austover T” | 40 mm | H-curve |
| Name of the Value | Value | Information Source |
|---|---|---|
| Convection heat transfer coefficient with hydrocarbon temperature regime, W/(m2K) | 50 | [14] |
| Convection heat transfer coefficient with standard temperature regime, W/(m2K) | 25 | [14] |
| Surface absorption coefficient | 0.5 | [45] |
| Initial ambient temperature, °C | 20 | - |
| Sample | s, mm | ρ, kg/m3 | S-Curve, min | H-Curve, min | K = S/H |
|---|---|---|---|---|---|
| H-60 | 70/110 | 150 | 78 * | 60 | 1.30 |
| A-60 | 60/85 | 100 | 60 | 37 * | 1.62 |
| Sample | S-Curve, min | H-Curve, min | K = S/H |
|---|---|---|---|
| Sample No. 1.1 | 195 | 124 * | 1.56 |
| Sample No. 1.2 | 183 | 118 * | |
| Sample No. 1.3 | 187 * | 120 |
| Sample | Thickness, mm | S-Curve, min | H-Curve, min | K = S/H |
|---|---|---|---|---|
| Sample No. 2.1 | 9.20 mm | 120 | - | 1.26 |
| Sample No. 2.2 | 8.40 mm | 95 | ||
| Sample No. 2.3 | 10.30 mm | cracked | 65 | |
| Sample No. 2.4 | 14.44 mm | - | 125 | 1.71 * |
| Sample No. 2.5 | 6.30 mm | 93 | - | |
| Sample No. 2.6 | 8.75 mm | 123 | - |
| Sample | Ap/V | s, mm | S-Curve, min | H-Curve, min | K = S/H |
|---|---|---|---|---|---|
| Sample No. 3.1, 3.2 | 294 | 15 | 60 | 30 | 2.0 |
| Sample No. 3.3, 3.4 | 294 | 50 | 130 | 93 | 1.44 |
| Sample No. 3.5 | 134 | 50 | 180 | 130 * | 1.38 |
| T, °C | 25 | 100 | 200 | 300 | 400 | 500 | 700 | 800 | 1000 |
|---|---|---|---|---|---|---|---|---|---|
| λ, W/K·m | 0.18 0.257 * | 0.14 - | 0.12 - | 0.11 | 0.09 | 0.08 | 0.09 | 0.12 | 0.25 |
| C, J/kgK | 750/732 * | 800/1068 * | 815/1219 * | 830/1164 * | 840 | 850 | 870 | 880 | 910 |
| Sample | Thickness, mm | Critical Temperature | S-Curve, min | H-Curve, min | K = S/H |
|---|---|---|---|---|---|
| Sample No. 4.1 | 40 | T = 632 °C | 247 | - | 1.34 |
| Sample No. 4.2 | 40 | T = 715 °C | - | 184 |
Disclaimer/Publisher’s Note: The statements, opinions and data contained in all publications are solely those of the individual author(s) and contributor(s) and not of MDPI and/or the editor(s). MDPI and/or the editor(s) disclaim responsibility for any injury to people or property resulting from any ideas, methods, instructions or products referred to in the content. |
© 2024 by the authors. Licensee MDPI, Basel, Switzerland. This article is an open access article distributed under the terms and conditions of the Creative Commons Attribution (CC BY) license (https://creativecommons.org/licenses/by/4.0/).
Share and Cite
Gravit, M.; Dmitriev, I.; Shcheglov, N.; Radaev, A. Oil and Gas Structures: Forecasting the Fire Resistance of Steel Structures with Fire Protection under Hydrocarbon Fire Conditions. Fire 2024, 7, 173. https://doi.org/10.3390/fire7060173
Gravit M, Dmitriev I, Shcheglov N, Radaev A. Oil and Gas Structures: Forecasting the Fire Resistance of Steel Structures with Fire Protection under Hydrocarbon Fire Conditions. Fire. 2024; 7(6):173. https://doi.org/10.3390/fire7060173
Chicago/Turabian StyleGravit, Marina, Ivan Dmitriev, Nikita Shcheglov, and Anton Radaev. 2024. "Oil and Gas Structures: Forecasting the Fire Resistance of Steel Structures with Fire Protection under Hydrocarbon Fire Conditions" Fire 7, no. 6: 173. https://doi.org/10.3390/fire7060173
APA StyleGravit, M., Dmitriev, I., Shcheglov, N., & Radaev, A. (2024). Oil and Gas Structures: Forecasting the Fire Resistance of Steel Structures with Fire Protection under Hydrocarbon Fire Conditions. Fire, 7(6), 173. https://doi.org/10.3390/fire7060173