1. Introduction
Urbanization has exacerbated transportation expansion [
1]. With the rapid development of the economy and transportation technology, rail transport plays an increasingly important role in alleviating traffic congestion and improving the transportation efficiency. Specifically, by the end of 2023, the railway operating mileage in China reached 159,000 km, which includes 45,000 km of high-speed rail, ranking first in the world. According to the 2023 railway transportation data released by the Ministry of Transport of the People’s Republic of China, the volume of passenger traffic (VPT) significantly increased compared with that during the pandemic. The VPT reached 328.58 million commuters in April, a year-on-year growth increase of 477.4%. Notably, the VPT has been the greatest since the third quarter, reaching the highest value of 428.60 million commuters in August. Relevant official data indicate that the development trend of rail transit in China is relatively positive. With the continuous investment and expansion of the rail network, China has become a global leader in high-speed rail and urban rail transit. This development has significantly improved the transportation efficiency and connectivity in China.
Railway station hubs have become city landmarks and tourist attractions. The substantial increases in the transportation capacity and speed have led to increased scales and expanded functionalities. Newly built large or ultralarge railway stations exhibit large building volumes and complex structures for passenger and freight transport. With the development of various transportation modes, such as subways, light rail, and bus stations, comprehensive transportation hubs have increasingly been constructed that connect both intercity and urban passenger transportation networks. In recent years, the transformation of transportation in some cities has completed the process of hub integration. The operation of hub stations not only reduces the distance between cities but also provides passengers with convenient transportation choices and travel experiences [
2].
The importance of fire safety and evacuation in railway station hubs cannot be overstated. These locations are densely populated, and a fire can lead to notable casualties and property damage. Effective fire prevention and evacuation plans are crucial. Given the mobility of people and the unpredictability of fire loads, the fire risk in train station waiting halls is relatively high. In transportation hubs such as train stations, there is frequent movement of people, and the number of passengers is large. Therefore, effective fire prevention measures and emergency evacuation plans must be implemented to ensure the safety of passengers and staff during transportation. Stations face challenges in terms of fire safety, which is one of the greatest hazards for both property and passenger safety. Specifically, on 21 August 2014, a fire occurred at a train station in Hami city, China. Fire was caused by a construction company accidentally igniting external wall insulation material in the construction process. The fire affected an area of approximately 600 m2. On 18 February 2019, a fire occurred at Ramses station in downtown Cairo, Egypt. Twenty-five people were killed, and fifty others were injured. Therefore, ensuring the safety of train stations during emergency situations is extremely important, especially in densely populated waiting halls.
Given the mobility of passengers and the unpredictability of fire loads, the fire risk in waiting halls is one of the highest in hubs. The main characteristic of fires at stations is the presence of materials in the waiting hall. Combustible materials inside the station represent hazards during railway station operation. The main risks and fire loads include shop fires, luggage fires, massage seat fires, and interior decoration material fires. After station safety inspection, an island shop in the waiting hall aims to provide convenience for passengers to purchase snacks, books, and souvenirs. This human-centered shop significantly enhances the convenience and comfort of passengers. Therefore, island-style shop owners also stock goods during peak passenger flows to avoid supply shortages, which increases the risk of fire. Although the main framework of island-style shops is a fireproof structure, the interior of shops selling items such as bread, books, and electronic products comprises easily combustible materials. Considering the thermal radiation effects after a shop fire erupts not only bridges the gap in related research but also helps quantify the risk of island-style shop fires.
Fire experiments and numerical simulations are the primary fire safety research methods. These methods provide in-depth insights into the development process and influencing factors of fires. Cost effectiveness and environmental friendliness are among the key advantages of numerical simulations, so with the development of simulation technology, research institutions have established a number of computer fire models and fire safety assessment software packages, such as the Fire Dynamics Simulator (FDS), FiRECAM, and JASMINE [
3]. The FDS entails the use of the large-eddy simulation (LES) method to simulate the turbulent flow of air and aims to predict the temperature distribution in indoor fires [
4]. The LES method can capture large-scale turbulent structures that play a crucial role in fire dynamics. This fire model solves the conservation equations for mass, momentum, energy, and species concentrations in each computational cell. Moreover, parameters can be configured in the model to realistically simulate the response after fire safety systems are activated, including sprinklers, smoke detectors, smoke exhaust fans, etc. [
5].
Research on pedestrian evacuation is mainly conducted from two aspects: empirical data focusing on pedestrian movement characteristics from control experiments and simulation models aimed at reproducing the evacuation process [
6,
7,
8]. Due to ethics and high expenses, evacuation research in complex scenes typically adopts numerical simulation methods. Furthermore, researchers are committed to developing evacuation models, including macroscopic models based on fluid dynamics and microscopic models represented by cellular automata models, social force models, and agent-based models [
8,
9,
10,
11]. Regarding user-oriented applications, evacuation software with simple interfaces, flexible parameter settings, and compatibility with complex scenes has been developed and widely used, e.g., Pathfinder, STEPS, and AnyLogic. In this research, Pathfinder was considered due to its accuracy and suitability for large-scale crowd evacuation [
12].
The rapid recovery of passenger flows after the pandemic poses a significant challenge to the safe operation and management of rail transit. Therefore, in this study, a waiting hall of a rail transit hub in China was chosen as an example, and safety simulation analysis at the waiting hall level of an ultralarge railway station was conducted. This study focused on personnel evacuation and the impact of thermal radiation from island-style shop fires. In this paper, the first section focuses on the background of transportation hubs and existing fire risk issues. In the second section, a physical railway station model is built for both heat flux and evacuation simulations. In the third section, the impact of thermal radiation on the environment is examined via mathematical and computational models. In the fourth section, evacuation simulation analysis for personnel evacuation in the waiting hall is provided, and conclusions and recommendations are outlined in the last section.
2. Experimental Section—Building the Model
Understanding passenger flow is crucial for the design and planning of hub stations. Predicting mid- and long-term passenger flows during the design phase helps determine the scale and functional layout of the station to meet future needs. Forecasting peak passenger flows is also essential, as it facilitates the design of effective evacuation and safety measures to ensure that the station can operate safely during peak periods. Therefore, considering the size of the station and future passenger flow predictions, the number of peak hourly passengers exceeds 10,000 people. According to the Code for the Design of Railway Passenger Station Buildings, this railway station is classified as an ultralarge railway station [
13].
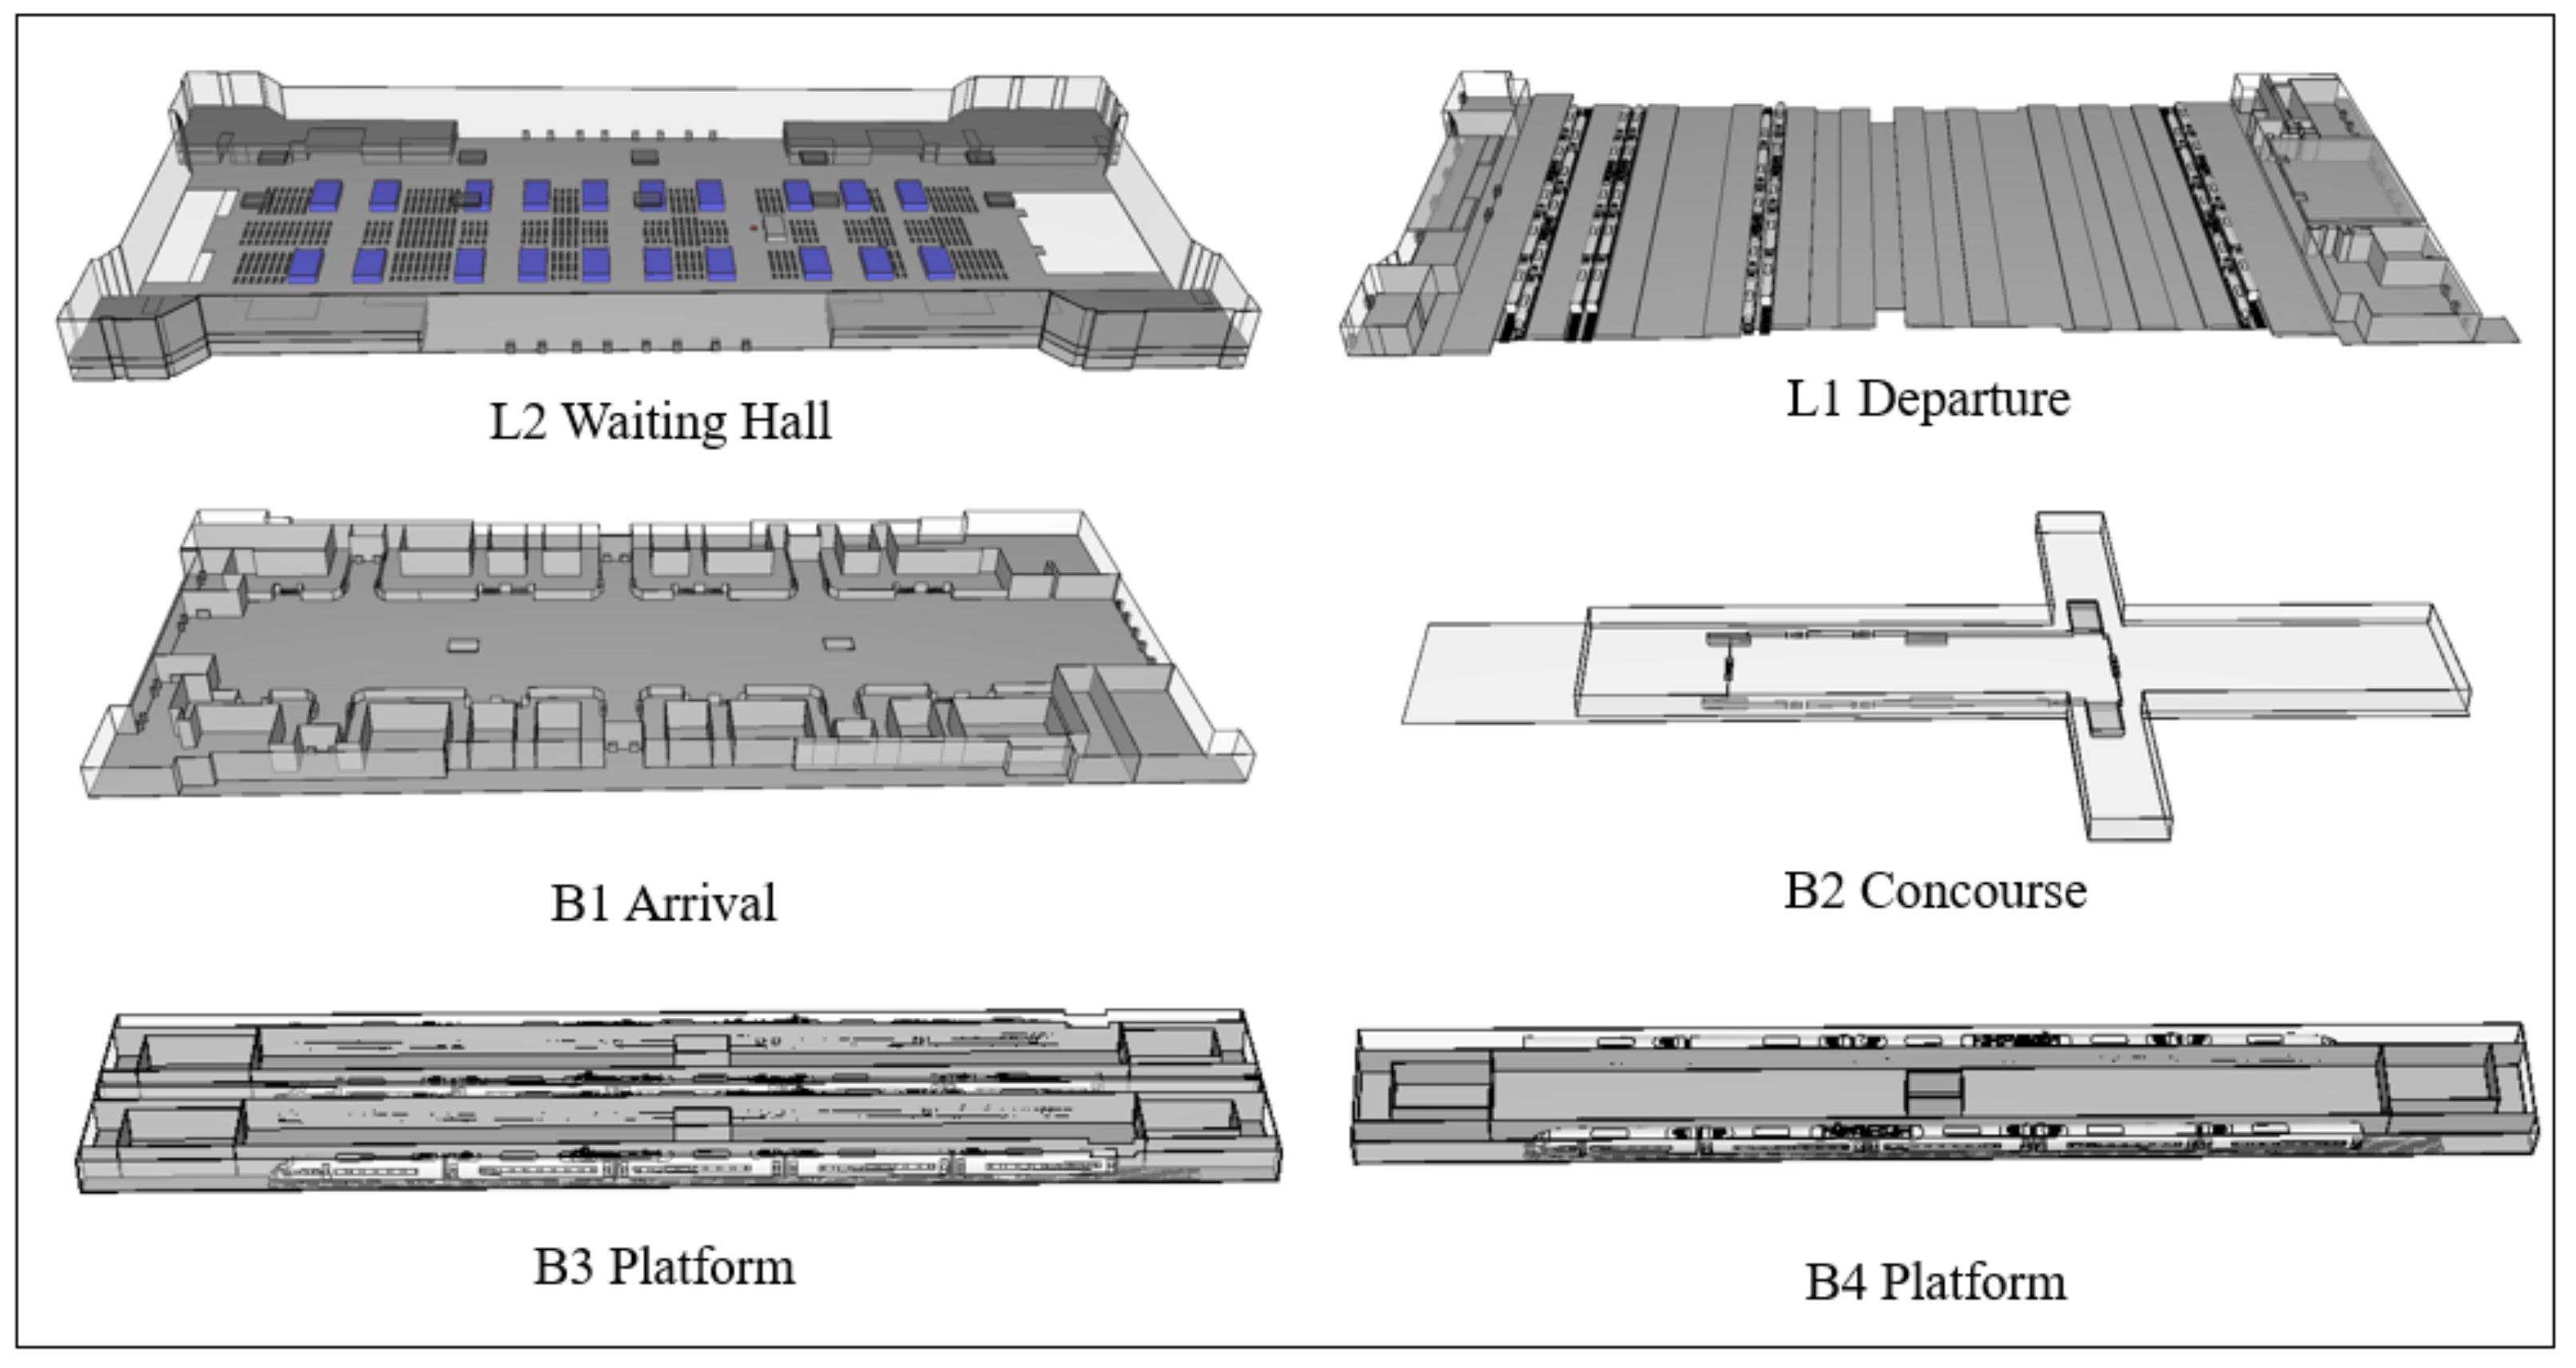
The greatest benefit of a hub station is that it enables passengers to transfer between subways, trains, and buses within the station. The ultralarge railway station hub includes a transfer subway station with 4 platforms, a high-speed railway station, and a city coach station. The total building area of the hall is 99,283 m2. The hub encompasses 2 aboveground levels and 4 belowground levels, with B2-B4 denoting the subway station and B1-L2 denoting the high-speed rail station. The design of the high-speed railway station includes 22 platforms and 26 tracks. The platforms are 450 m long and 20 m wide, with a spacing of 9.5 m.
This study focused on the railway hall at the L2 level of the station. As shown in
Figure 1, the dimensions of the railway hall are 353 m (length) and 170 m (width), with a total station area of approximately 29,000 m
2. The height of the waiting hall is 22 m, and the waiting hall is surrounded by mezzanines, which are mainly used for dining purposes.
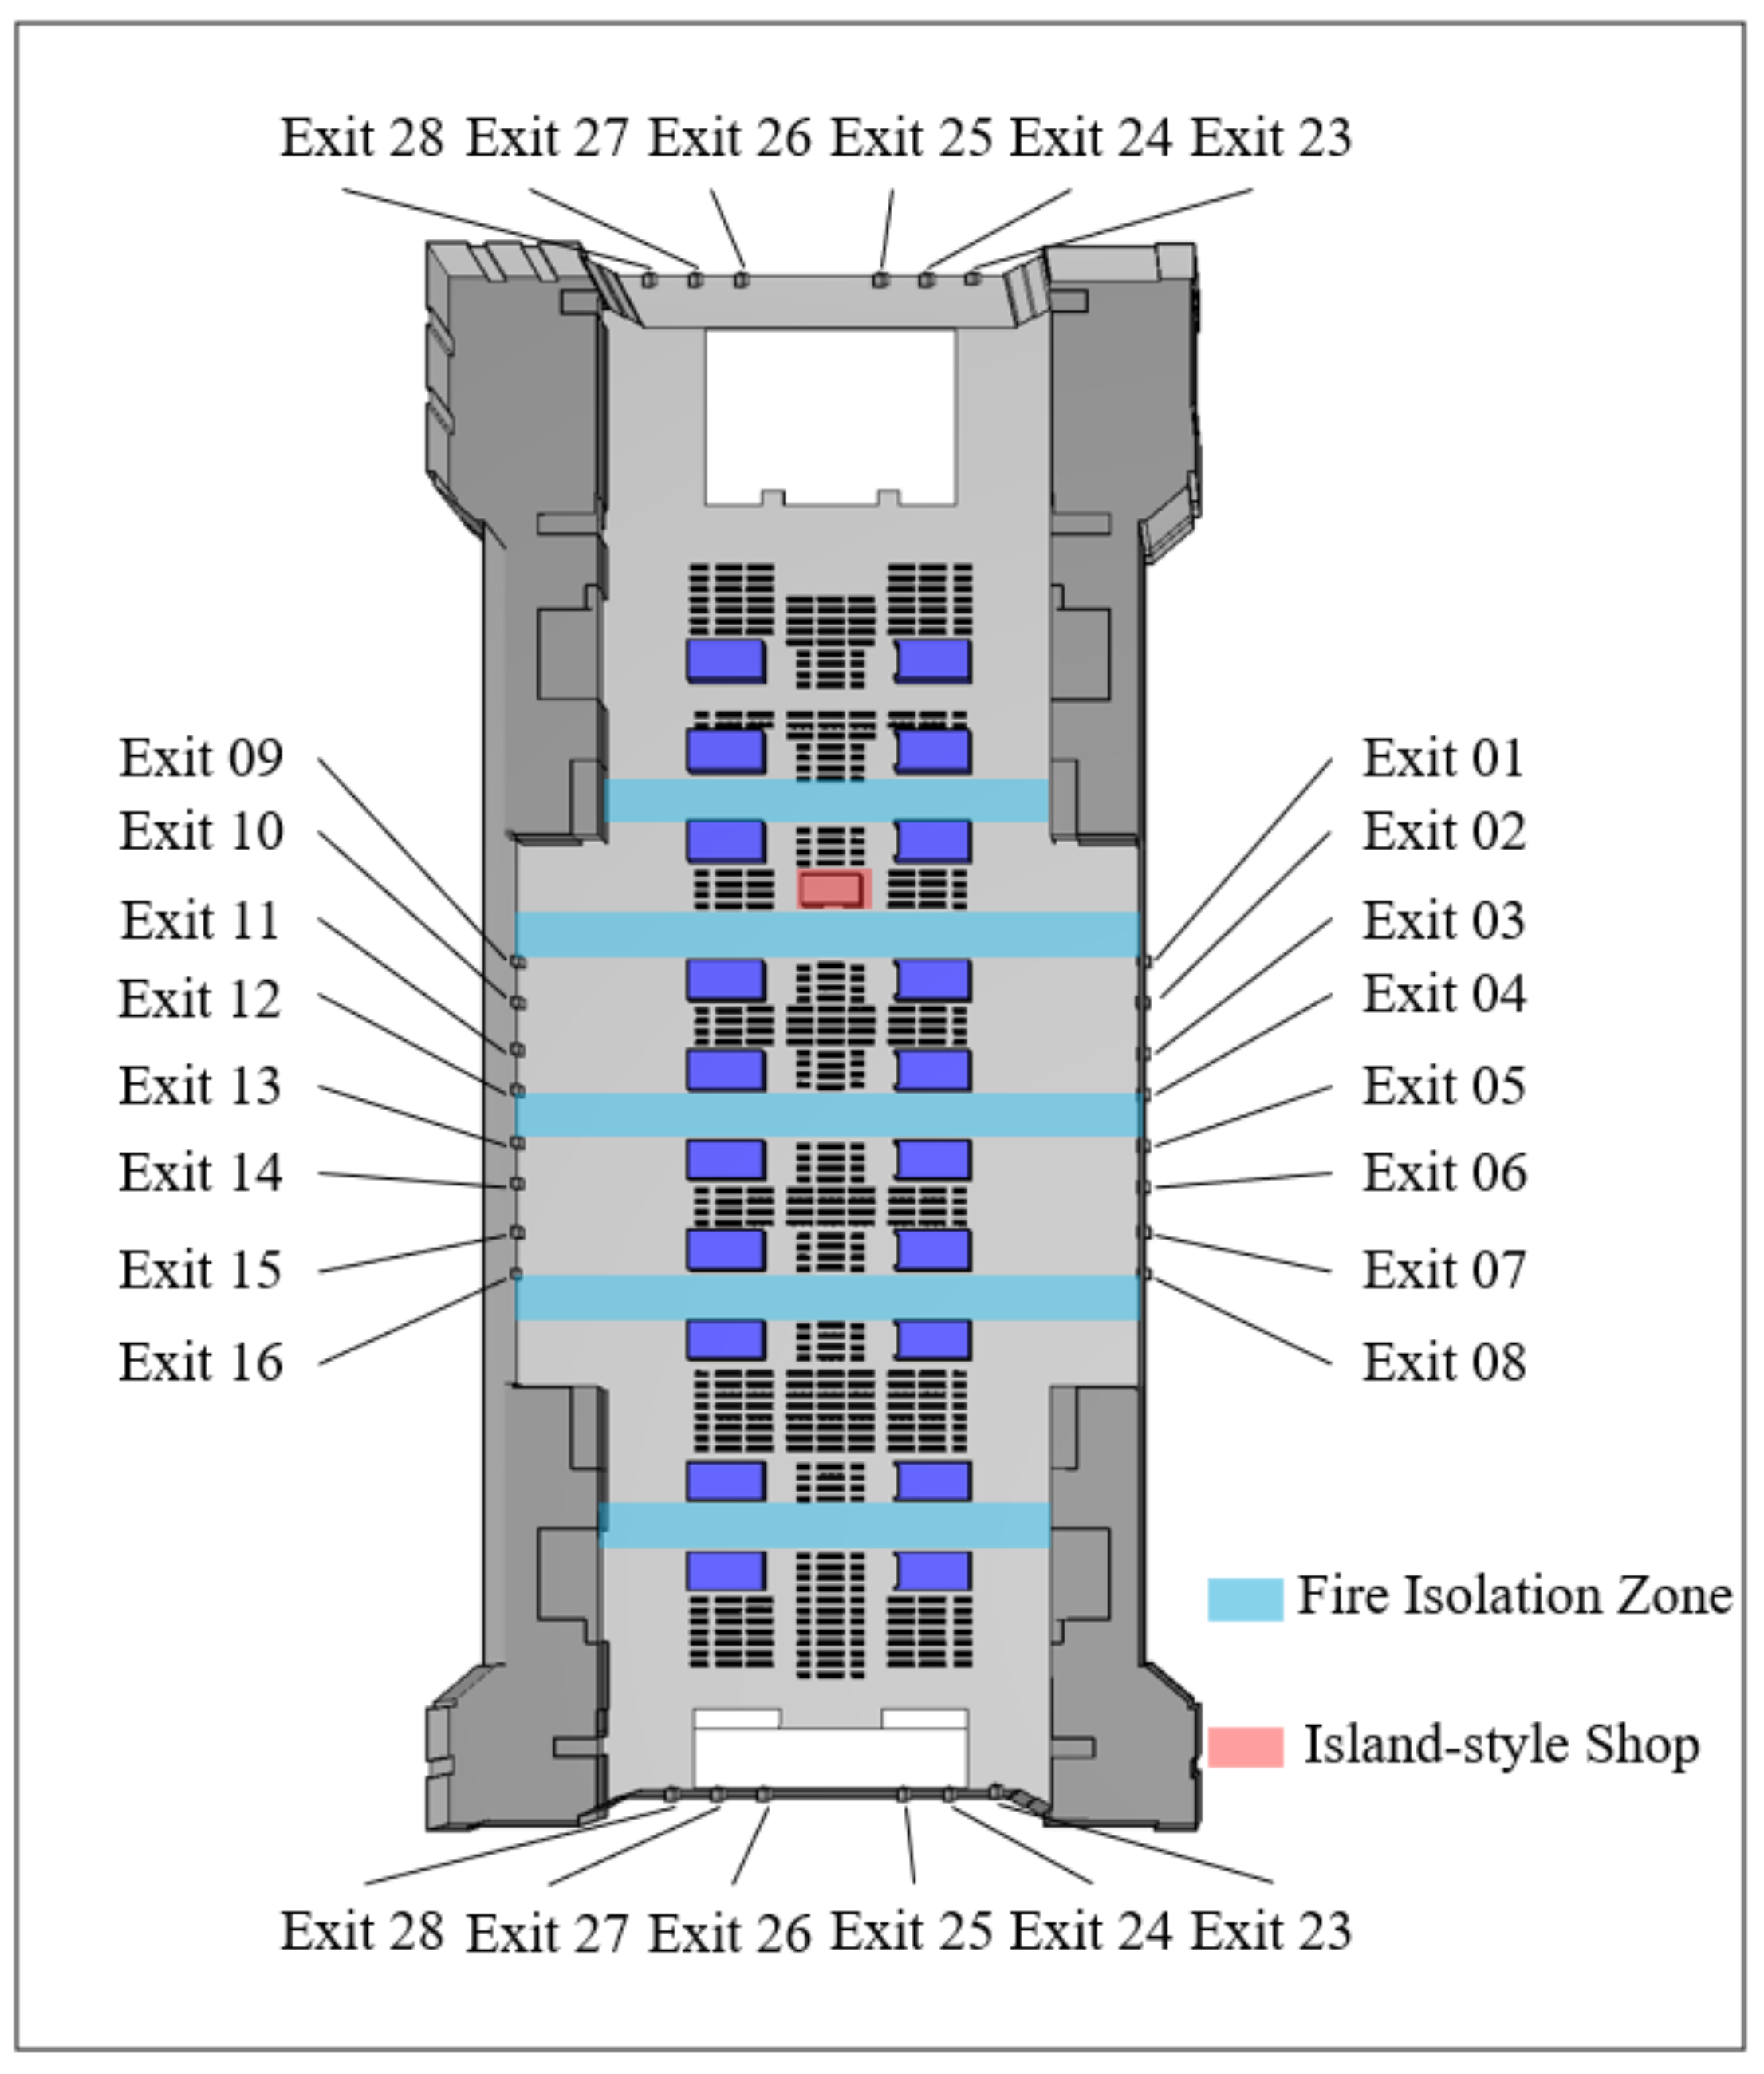
Based on architectural drawings of the ultralarge railway station hub, an equal-scale computer model was built in ProSim [
14], as shown in
Figure 2. The hall contains 28 evenly distributed evacuation exits, and the total evacuation width for passengers is 56.64 m. The width of Exits 01–16 is 2.34 m, and that of Exits 17–28 is 1.60 m. Island-style shops, waiting seats, exits, stairs, ticket checkpoints, etc., were established in the model for simulation research.
3. Thermal Radiation Safety Analysis
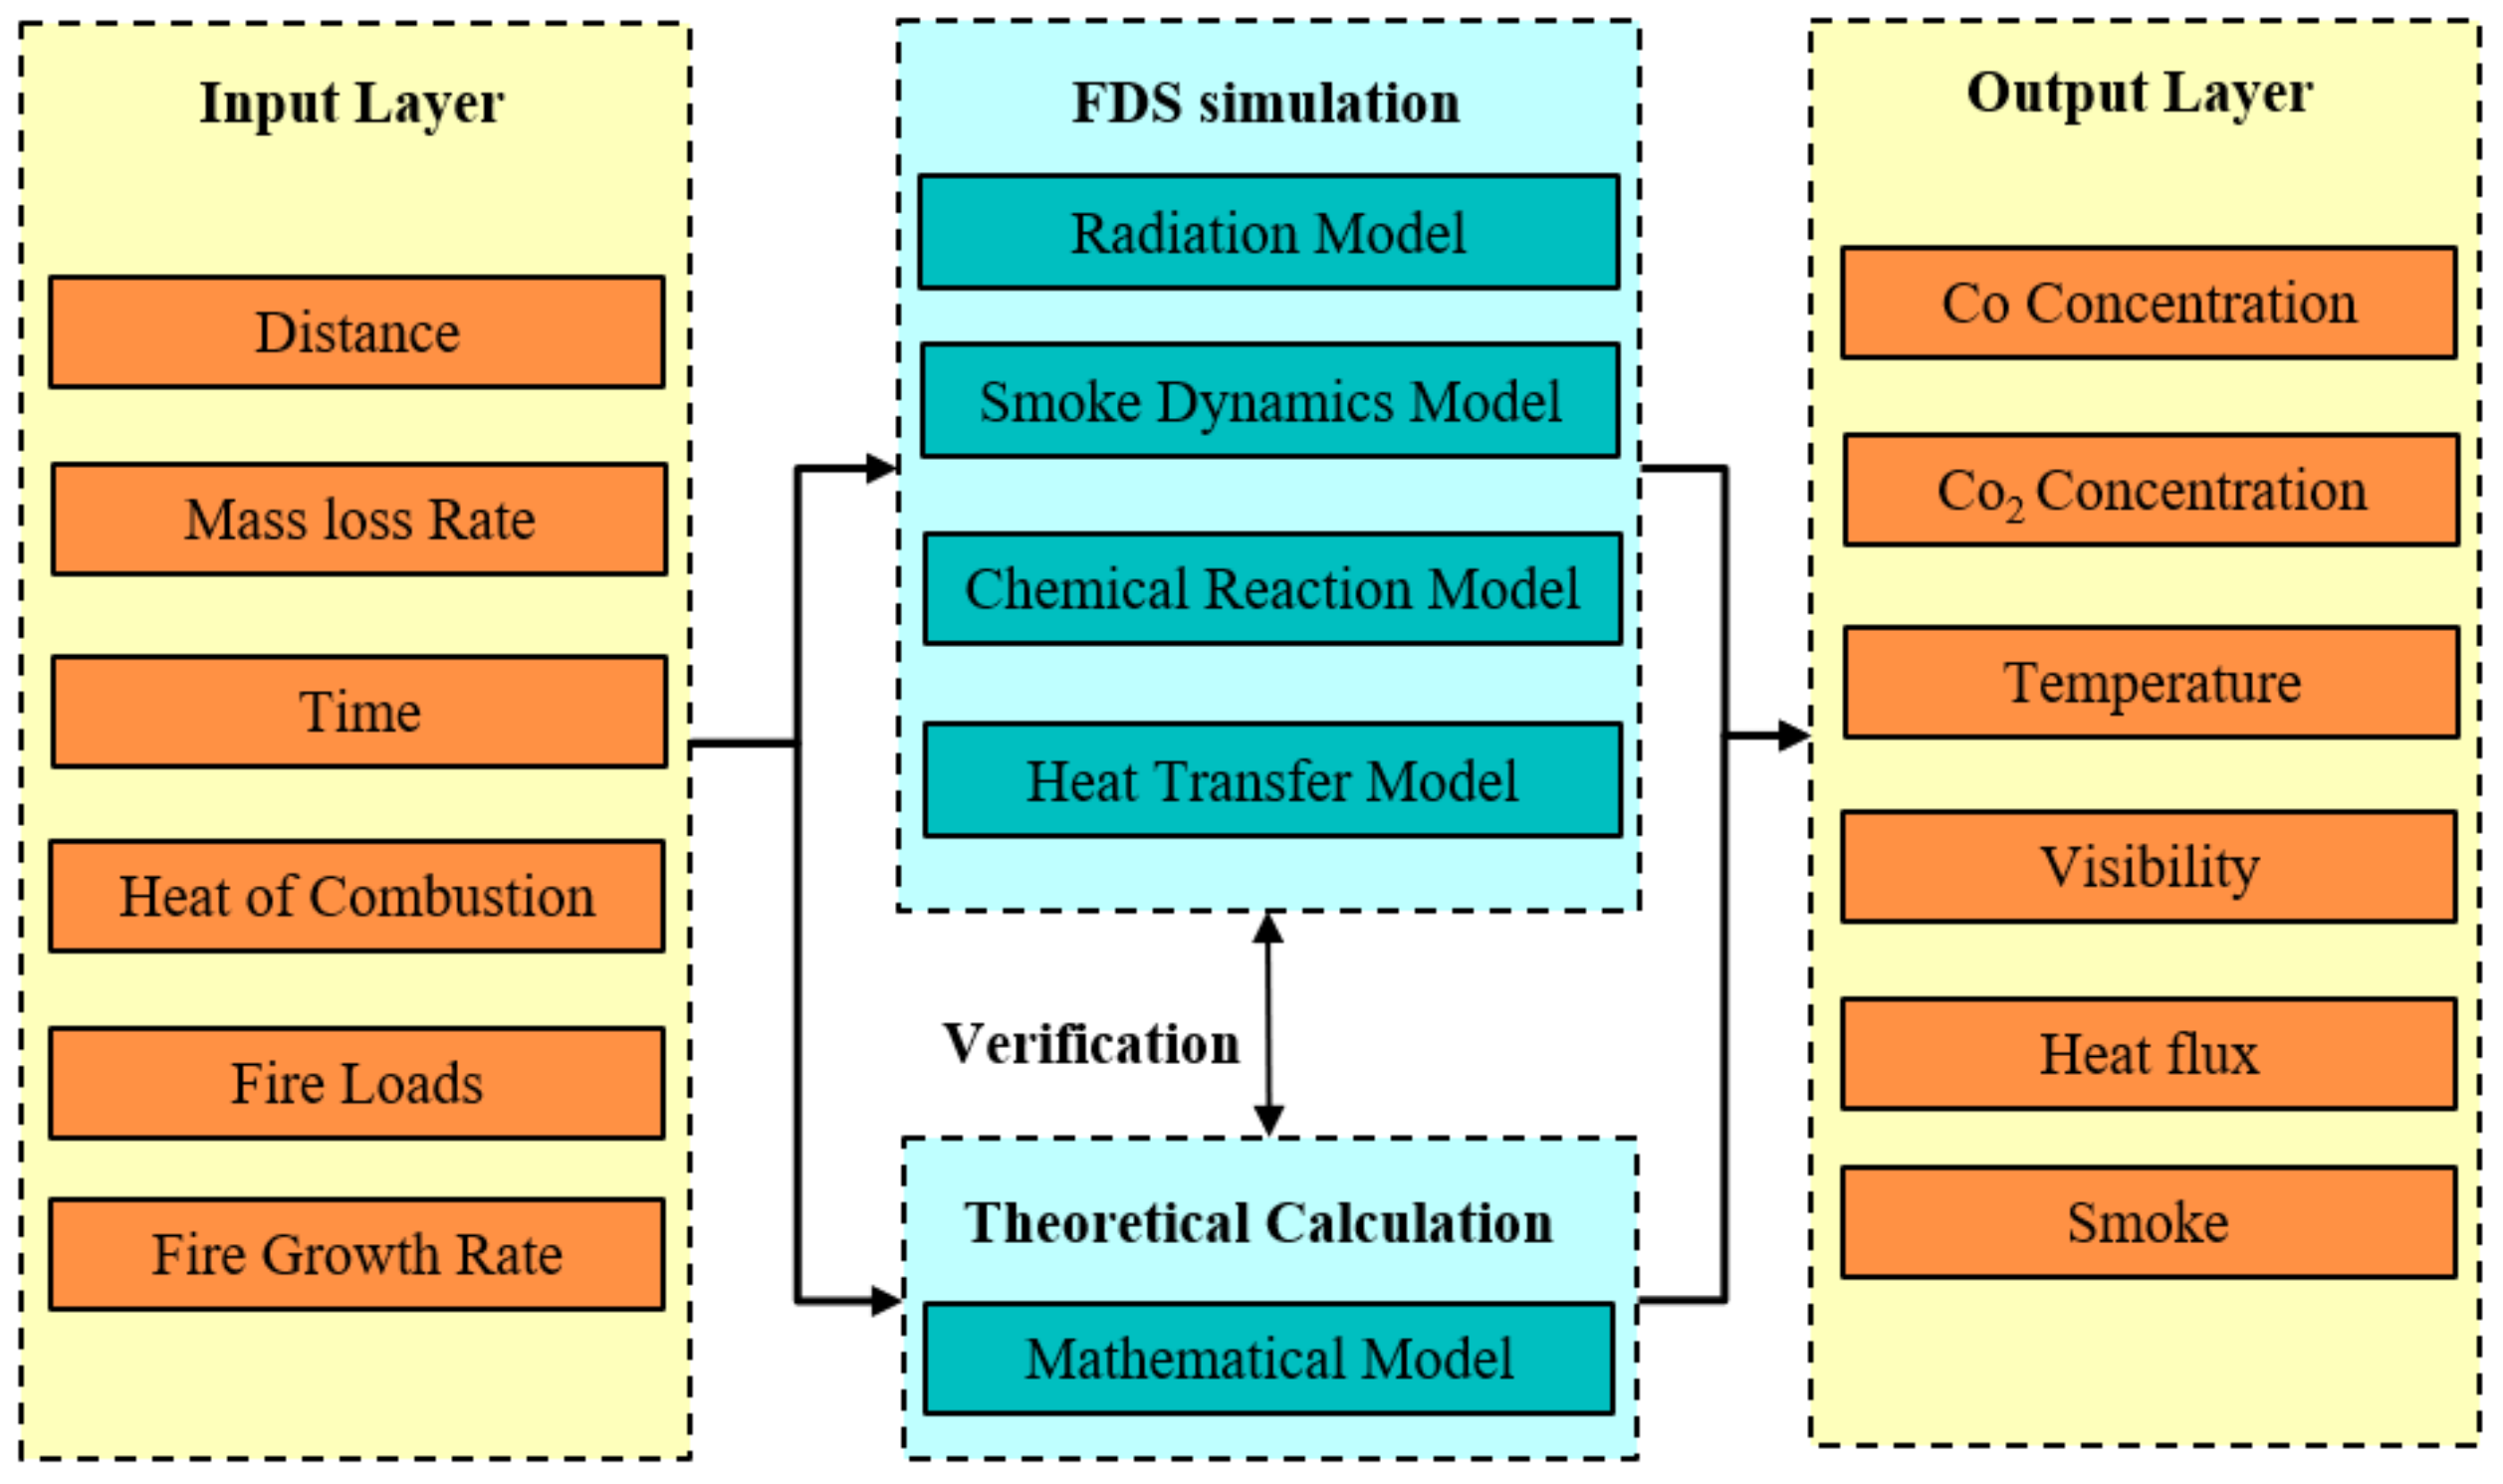
The dual-validation model is established based on both FDS simulation and mathematical calculation methods, as shown in
Figure 3. By inputting fire environment parameters such as distance of isolation zones, fire loads, fire growth rate, etc., along with corresponding validation indicators, the potential danger level of island-style shop fires can be assessed.
The establishment of the dual-validation model begins with constructing a physical model of the rail transit building, with relevant boundary conditions set according to actual circumstances in the input layer. Subsequently, calculations are conducted separately using the FDS and mathematical methods, followed by comparative analysis based on safety standards for personnel from the output layer. The effectiveness of the fire isolation zone design for rail transit is determined by both simulation and experimental results meeting safety standards. If only one result is valid while the other is not, the design of the fire isolation zone is considered unsuccessful and requires redesign.
3.1. Fire Risk Analysis
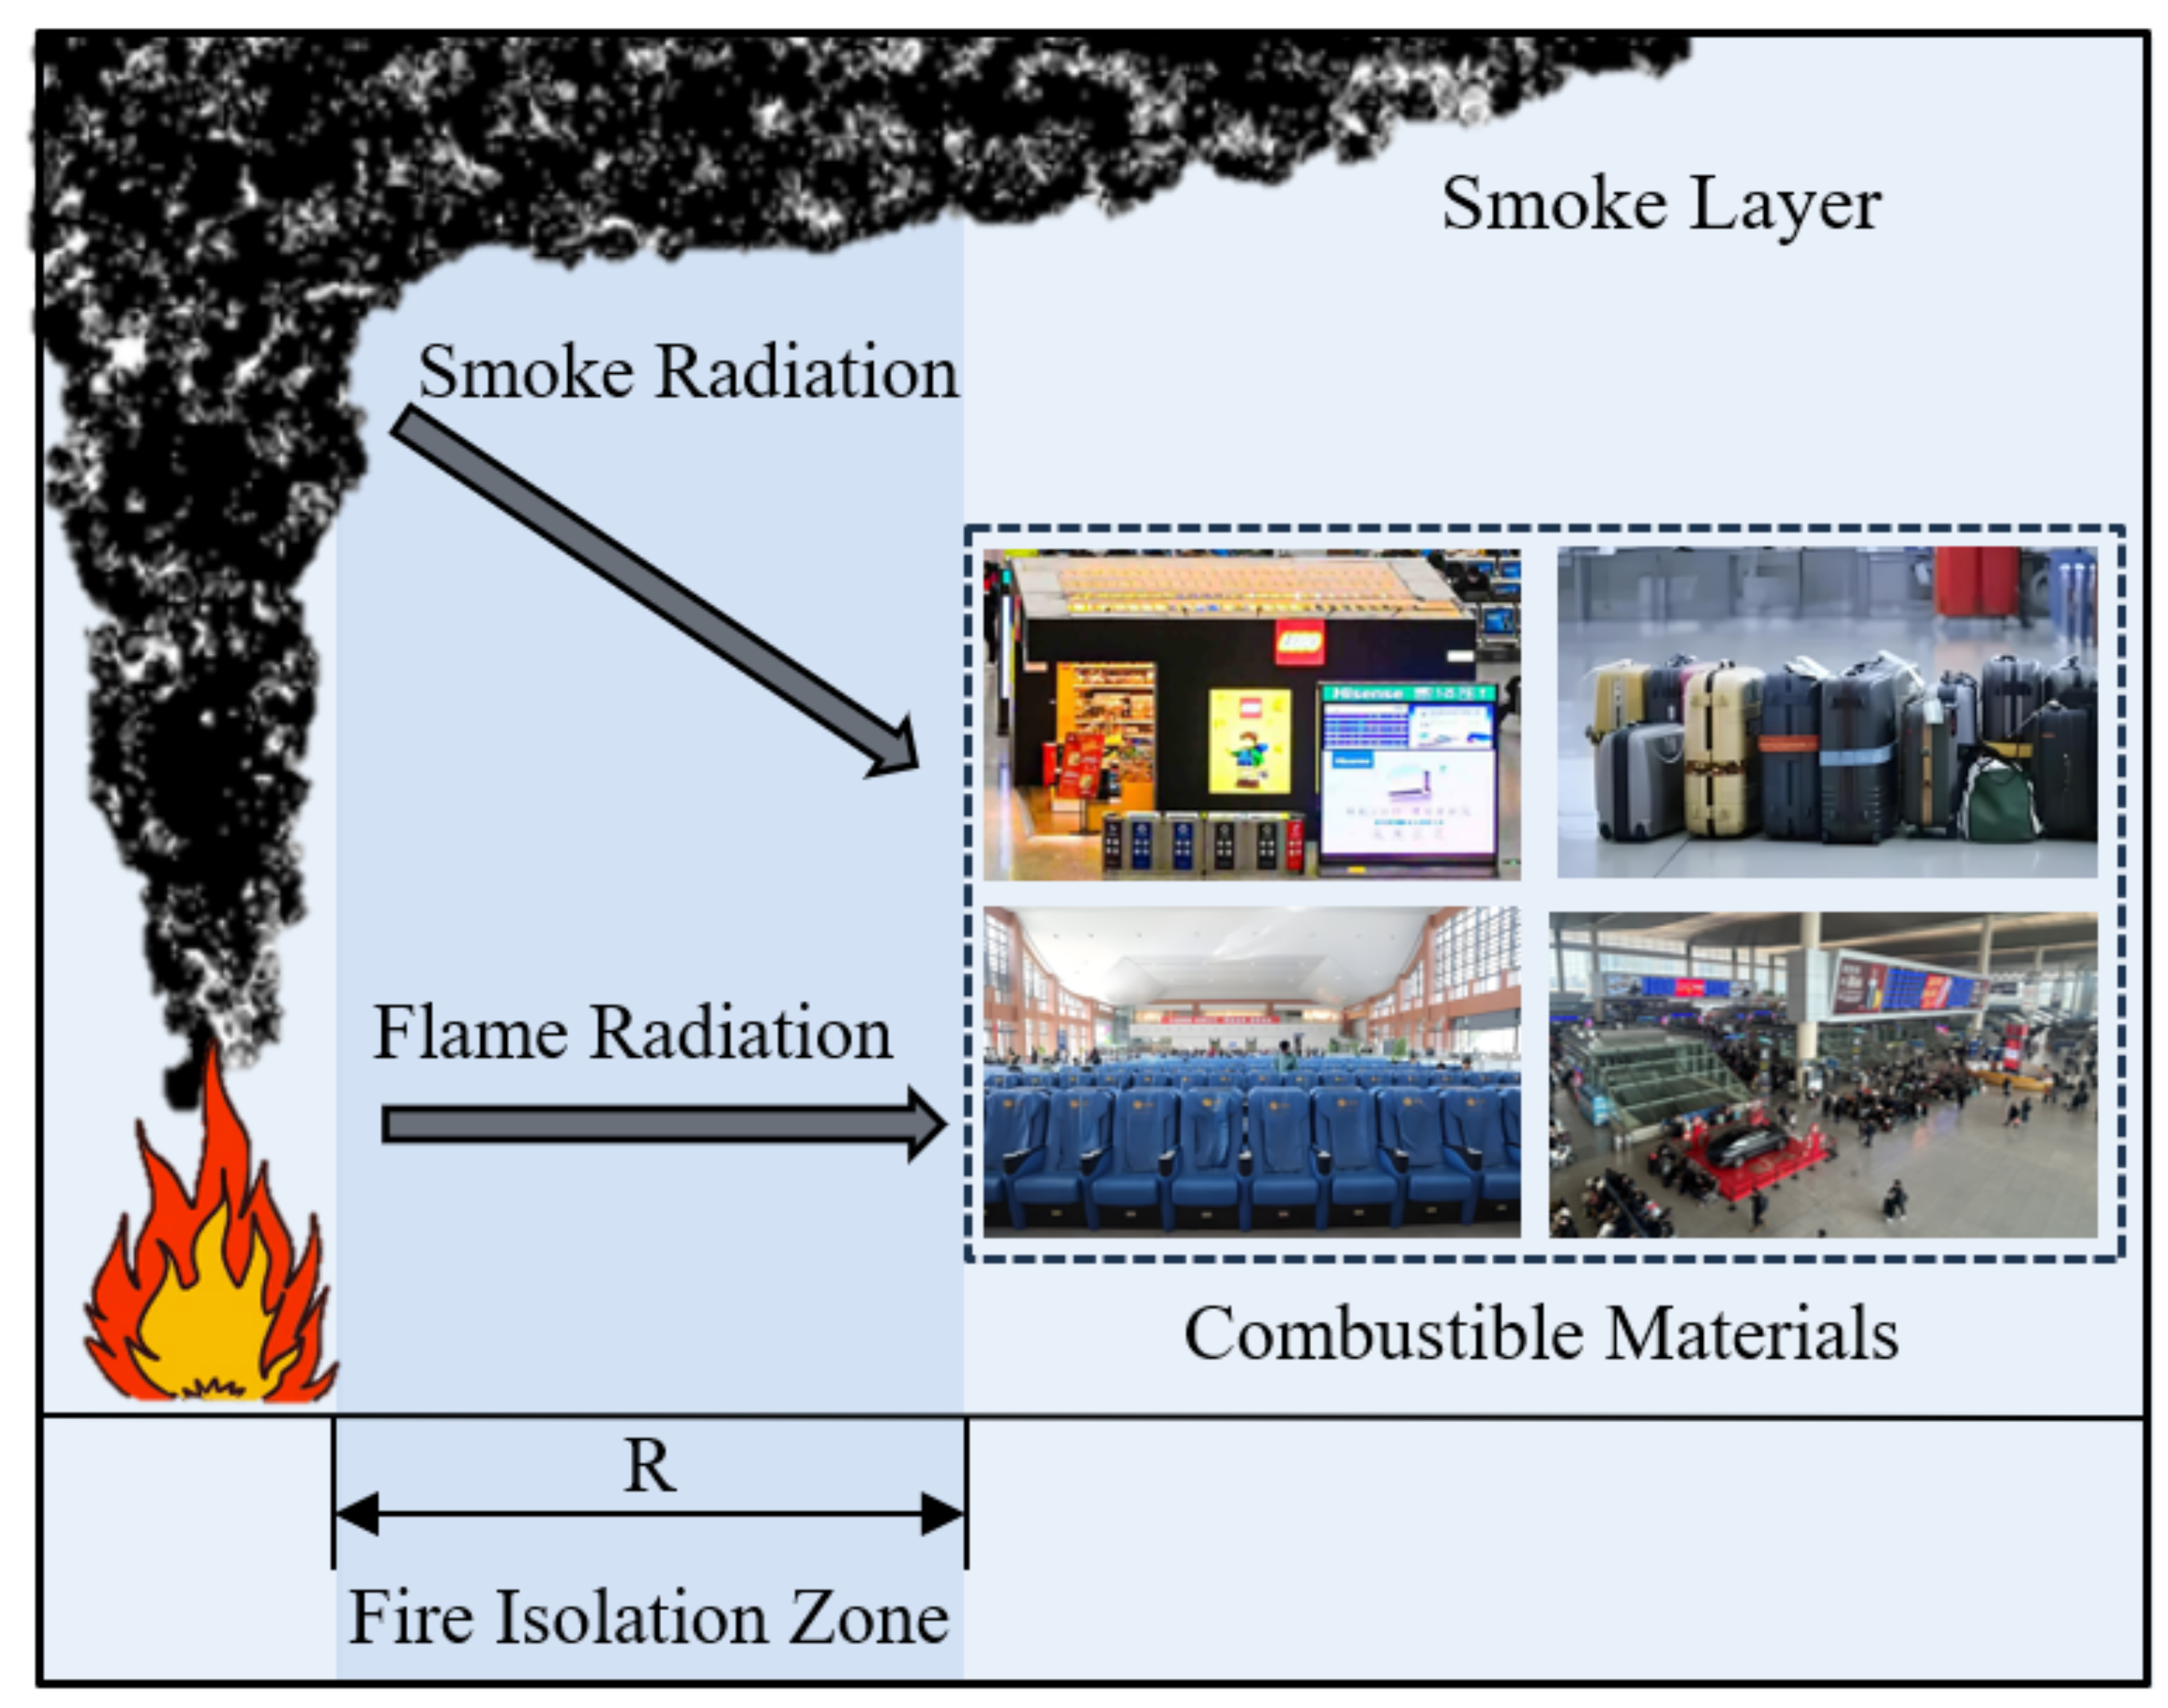
The aim of fire isolation zones is to prevent the connection of combustibles, as shown in
Figure 4. The entire train station could be engulfed in flames without an isolation zone under the fire scenario. Not placing any combustibles within the isolation zones helps to decrease the fire load during fires. To control the scale of shop fires, the area and combustible load of island-style shops should be limited. Combustible material can release large amounts of smoke, toxic gas, and heat during the fire period, which can quickly spread and diffuse throughout the waiting hall. This phenomenon can adversely affect the safety of personnel in the waiting hall.
The heat transfer modes include thermal conduction, natural convection, and surface radiation [
15]. These modes affect the speed of fire spread and the impact of fire thermal radiation on passengers at the station. To ensure the safety requirements of transportation functionality, the hall is considered a complete large space without fire compartmentations, and five fire isolation zones were established with a width of 6 m to reduce the risk of fire spreading in the railway space. Therefore, combustible materials in adjacent areas are not ignited by the thermal radiation from smoke and flames, effectively inhibiting the spread of the fire.
Scholars also clearly indicate that other parameters such as temperature, visibility, and toxic gas concentrations will have an impact on both passengers and the environment during a fire. The smoke temperature above 2 m should not exceed 180 °C, while the ambient temperature below 2 m should not exceed 60 °C [
16]. Moreover, visibility should be maintained at a minimum of 10 m during the evacuation process [
17]. When individuals are exposed to high concentrations of toxic gases, symptoms such as headaches and vomiting that affect evacuation may occur. Typically, the concentration of CO should not exceed 500 ppm [
18].
3.2. Theoretical Calculation
When a fire occurs, the fire source produces thermal radiation and discharges convective heat into its surroundings. The temperature of combustibles around the fire source gradually increases under the action of thermal radiation. When combustibles reach their ignition temperature, the phenomenon of fire spreading may occur. The heat flux at a certain distance from the fire source can be obtained as [
19]:
where
is the radiation heat flux, kW/m
2;
is the combustion efficiency;
is the mass burning rate, kg/m
2·s;
is the surface area of fuel, m
2;
is the heat of combustion, kJ/g; and
is the separation distance from the target to the center of the fuel package, m.
Combustion efficiency is commonly assumed to be 0.3, yet studies have indicated that it varies depending on the fuel. SFPA has synthesized the research findings of five scholars, including Brzustowsk, as depicted in
Table 1 [
20].
According to the Stefan–Boltzmann equation [
21], the total emission can be expressed as:
where
is the total emissive power of a surface, kW/m
2;
is the Stefan–Boltzmann constant, at 5.67 × 10
−8 W/m
2K
4; and
is the emissivity.
The flame front generated by a fire source exhibits an irregular geometric shape, making it difficult to determine an exact calculation model using classical radiation heat transfer equations. In the field of fire safety engineering, the fire source is usually assumed as a geometric point with radiation emissivity, referred to as a point ignition source. This assumption can greatly simplify the calculation model for fire radiation and is considered to be controllable within the acceptable accuracy of engineering calculations.
The National Fire Protection Association [
22] proposed a radiative model for the relationship between the radiation received by combustibles at distance R from the center of the fire.
where
is the radiative portion of the heat release rate of the fire, kW; and
is the incident radiant flux required for piloted ignition, kW/m
2.
Based on relevant research results, considering a 1:3 ratio between the radiative portion of the heat release rate and the total heat release rate, a simplified thermal radiation model can be obtained as follows:
where
is the heat release rate, MW; and
is the critical heat flux for ignition, kW/m
2.
Based on mathematical equations, theoretical safety design of the fire isolation zone can be achieved. A fire isolation zone refers to a certain width of space in a large and tall area, which ensures that flames on one side do not radiate and spread to the other side during a fire. This zone should not contain any combustible materials. Regarding the design of the width of the fire isolation zone, this study refers to the experimental research results of the NFPA regarding the critical radiation flux for ignition of different materials. A critical radiation flux greater than 10 kW/m
2 for flammable materials was selected as the basis for calculating the width of the fire isolation zone. The Technical Standard for Smoke Management Systems in Buildings suggests a recommended value for the heat release rate when a fire reaches a stable state [
23]. Under a fire scenario without sprinklers, the suggested heat release rate is 10 MW. Based on the simplified thermal radiation model, a distance of 5.2 m between the combustibles and the fire can effectively prevent fire spread. The width of the fire isolation zone in the design of the train station is set to 6 m. Although economic benefits may be partially sacrificed, enhancing the safety of passengers and train stations is necessary. A 6 m wide fire isolation zone can improve the fire safety of the railway hall, and its design is reasonable.
The flame front generated by a fire source exhibits an irregular geometric shape, making it difficult to obtain an accurate calculation model using classical radiation heat transfer equations. In the field of fire safety engineering, the fire source is usually assumed as a geometric point with radiation emissivity, denoted as an ignition source. This assumption can greatly simplify the calculation model of fire source radiation and can be controlled within the acceptable accuracy of engineering calculations.
3.3. Simulation-Based Verification
The FDS is a distinctive fire smoke movement field model [
24] that comprehensively considers various subprocesses of fire smoke movement. In fire simulations, the heat released by a fire is transmitted to the surrounding environment through radiation, influencing the development and spread of the fire. This is mainly based on the principle of thermal radiation heat transfer. Radiation heat transfer is modelled using the finite-volume method (FVM). It divides the calculation domain into many small control volumes [
25]. It discretizes and integrates the conservation equations for mass, momentum, energy, etc., within these control volumes, deriving relationships between them to establish a system of discrete algebraic equations. In thermal radiation calculations, the FVM first aims to discretize the radiation transfer equation, after which the resulting system of equations is solved to compute the transfer and impact of thermal radiation. In addition, radiative heat transfer is incorporated into the model by solving the radiation transport equation for a gray gas. The FDS technical reference guide provides the radiative transport equation for simulation is shown as [
26]:
where
represents the radiation intensity at wavelength
, while
signifies the direction vector of the intensity.
and
correspond to the local absorption and scattering coefficients, respectively, and
denotes the emission source term. This method accurately describes the transfer and distribution of thermal radiation and forms the basis of thermal radiation simulations in the FDS.
Two fire load scenarios were designed for this island-style shop fire. The first scenario considers a fire load of 6 MW for shop fires [
27]. The second scenario accounts for the large quantity of goods stored in shops due to business requirements, resulting in an overall fire load of 10 MW [
28]. The critical 10 MW fire load and 6 MW island-style shop fire without a sprinkler system were simulated, and the core parameters in the model were set, including the ambient temperature, which was set to 25 °C; the mesh size was set to 0.25 m × 0.25 m × 0.25 m [
29] and the total number of meshes was 3,010,560; the fire growth rate
was set to 0.044 kW/s during the
period [
30]. The simulation duration was 900 s, and the smoke yield in the model was set to 0.015.
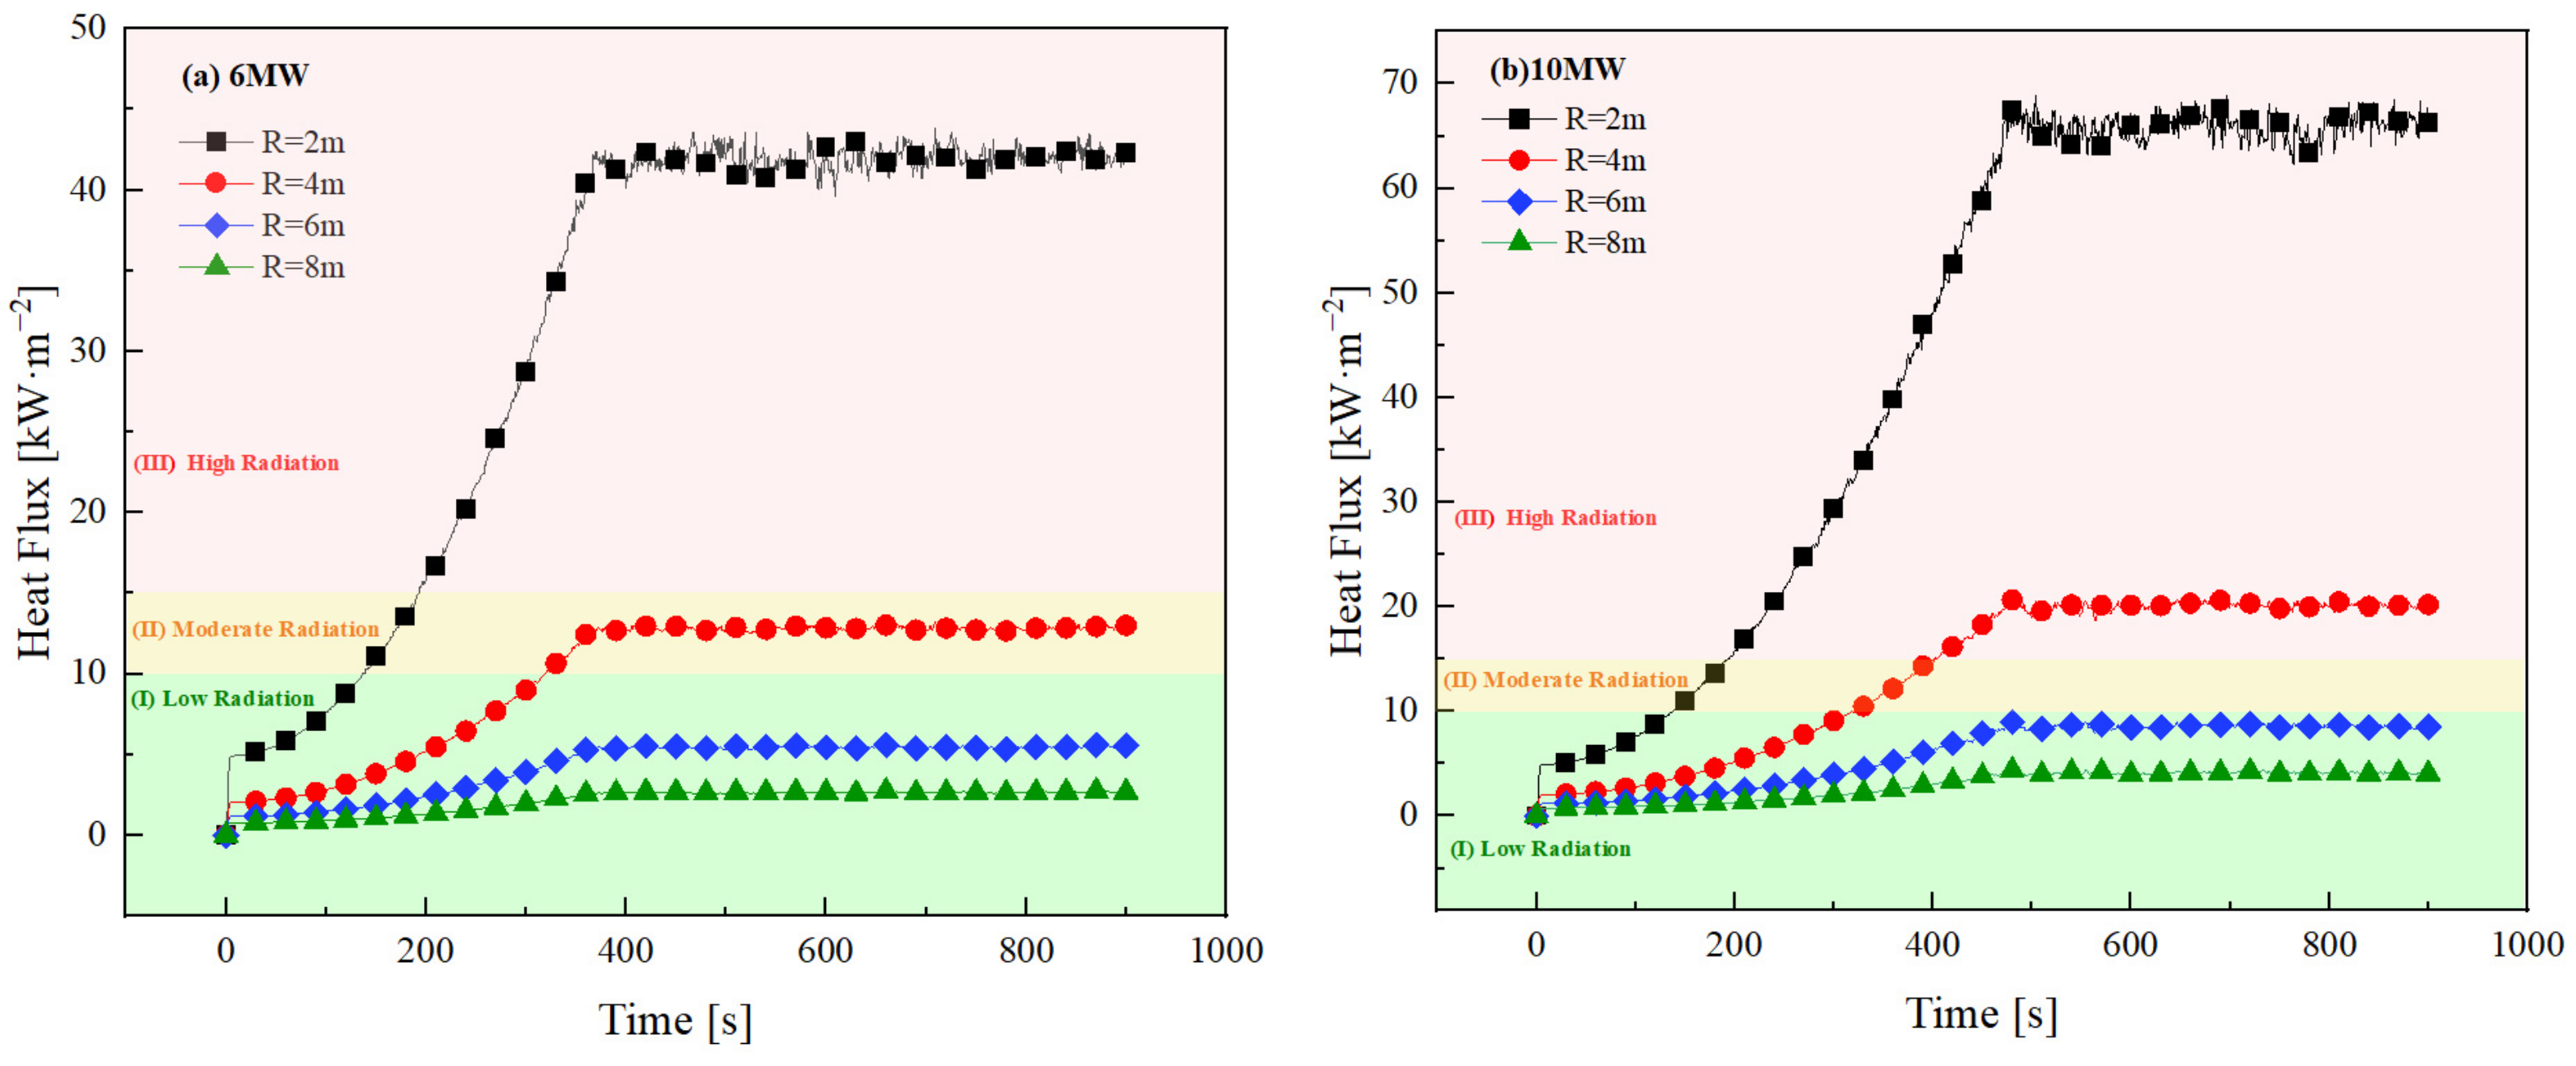
In this research, the FDS was utilized to conduct thermal radiation simulations and validate the systematic setting of fire isolation zones in railway station halls. As shown in
Figure 5, the maximum thermal radiation of 10 MW at R = 2 m was 66.3 kW/m
2 in the 900 s simulation process. The simulation results indicated that the thermal radiation flux decreased with increasing distance. It reached 16.6 kW/m
2 at R = 4 m and decreased to 7.4 kW/m
2 at R = 6 m. The simulation results showed that a fire isolation zone with a width of 6 m could reduce the thermal radiation to less than 10 kW/m
2, thereby suppressing the spread of fire in the waiting hall.
The thermal radiation trend of the island-style shop fire was surprisingly similar to that of a 10 MW fire. The thermal radiation value remained stable at approximately 350 s during the period shown. The peak heat flux was greater than 43.05 kW/m2 at R = 4 m. Although the fire load of the island-style shop was 4 MW less than that of the 10 MW fire, a 6 m wide fire isolation zone is still needed to meet the requirements for inhibiting fires. The heat flux at R = 4 m was 5.42 kW/m2, and other combustible materials were not ignited during the fire in the waiting hall.
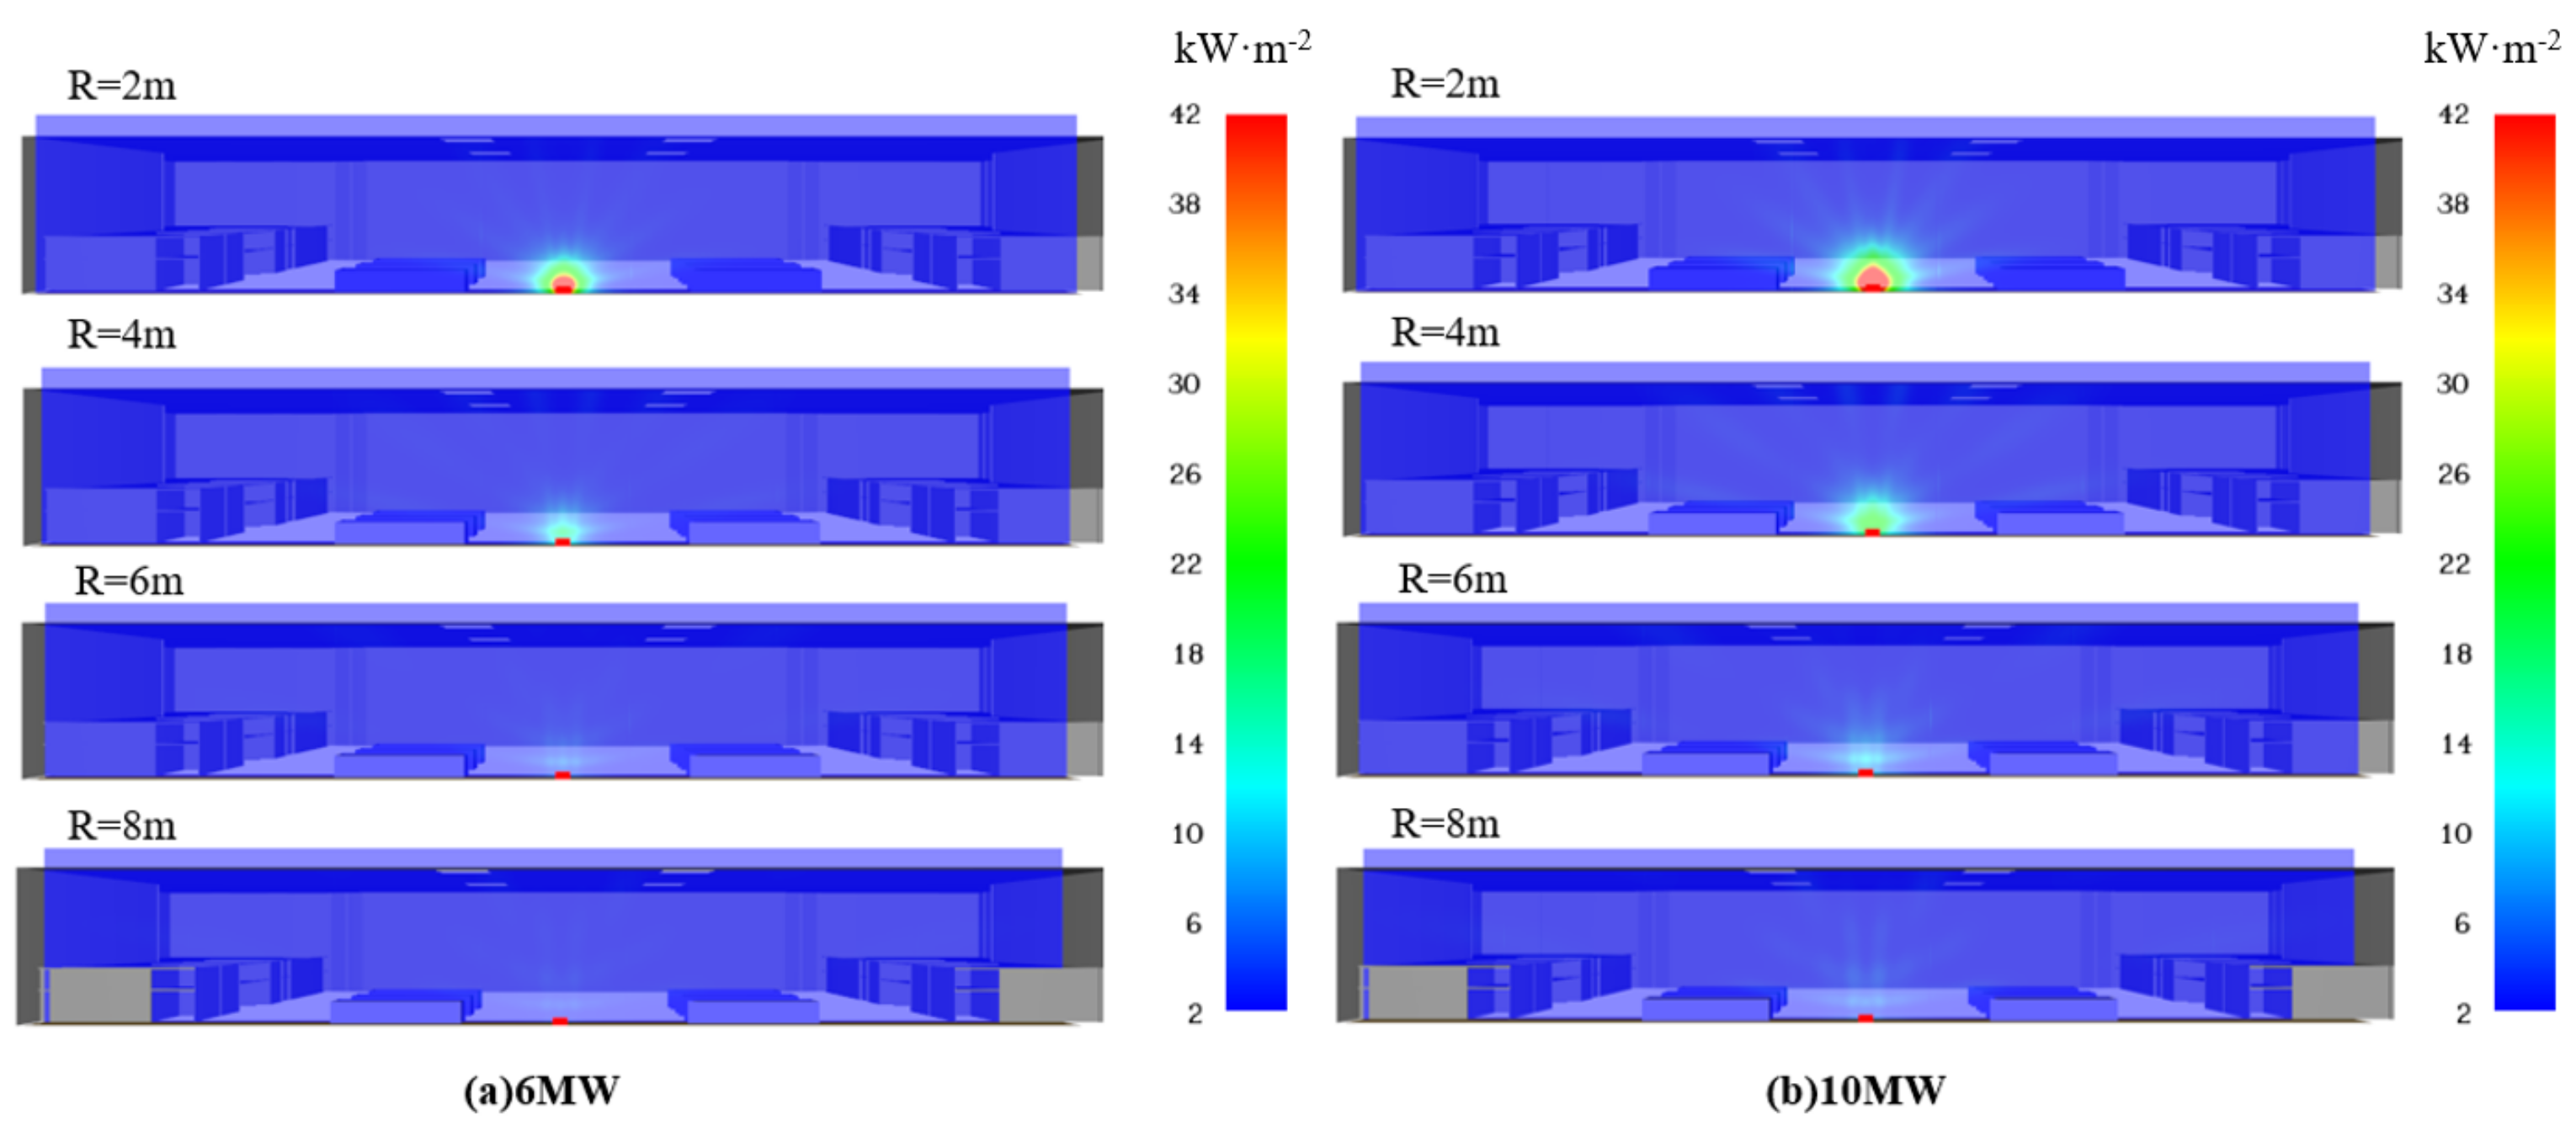
Figure 6 shows the effect of thermal radiation on the entire area of the waiting hall. The structure at the top of the train station remained safe during the fire period when the vertical space of the station did not contain any combustible billboards or advertisements. If there were combustibles in the space, the previous conclusion would be uncertain. Based on the simulation results, noncombustible or difficult-to-ignite materials should be used at the station to prevent vertical fire spread.
The visualization capabilities of the FDS 5.5.3 software are beneficial for visually understanding the impact of thermal radiation on the waiting hall. The slice shows the attenuation of thermal radiation. It is clear that only the heat flux in the top area of the island-style shop indicated high radiation, while the thermal flux was lower in the horizontal area at R = 4 m. With increasing distance R of the slice, the impact of the fire source on the environment decreased, and the most slices occurred at the blue stage after the distance R exceeded 4 m.
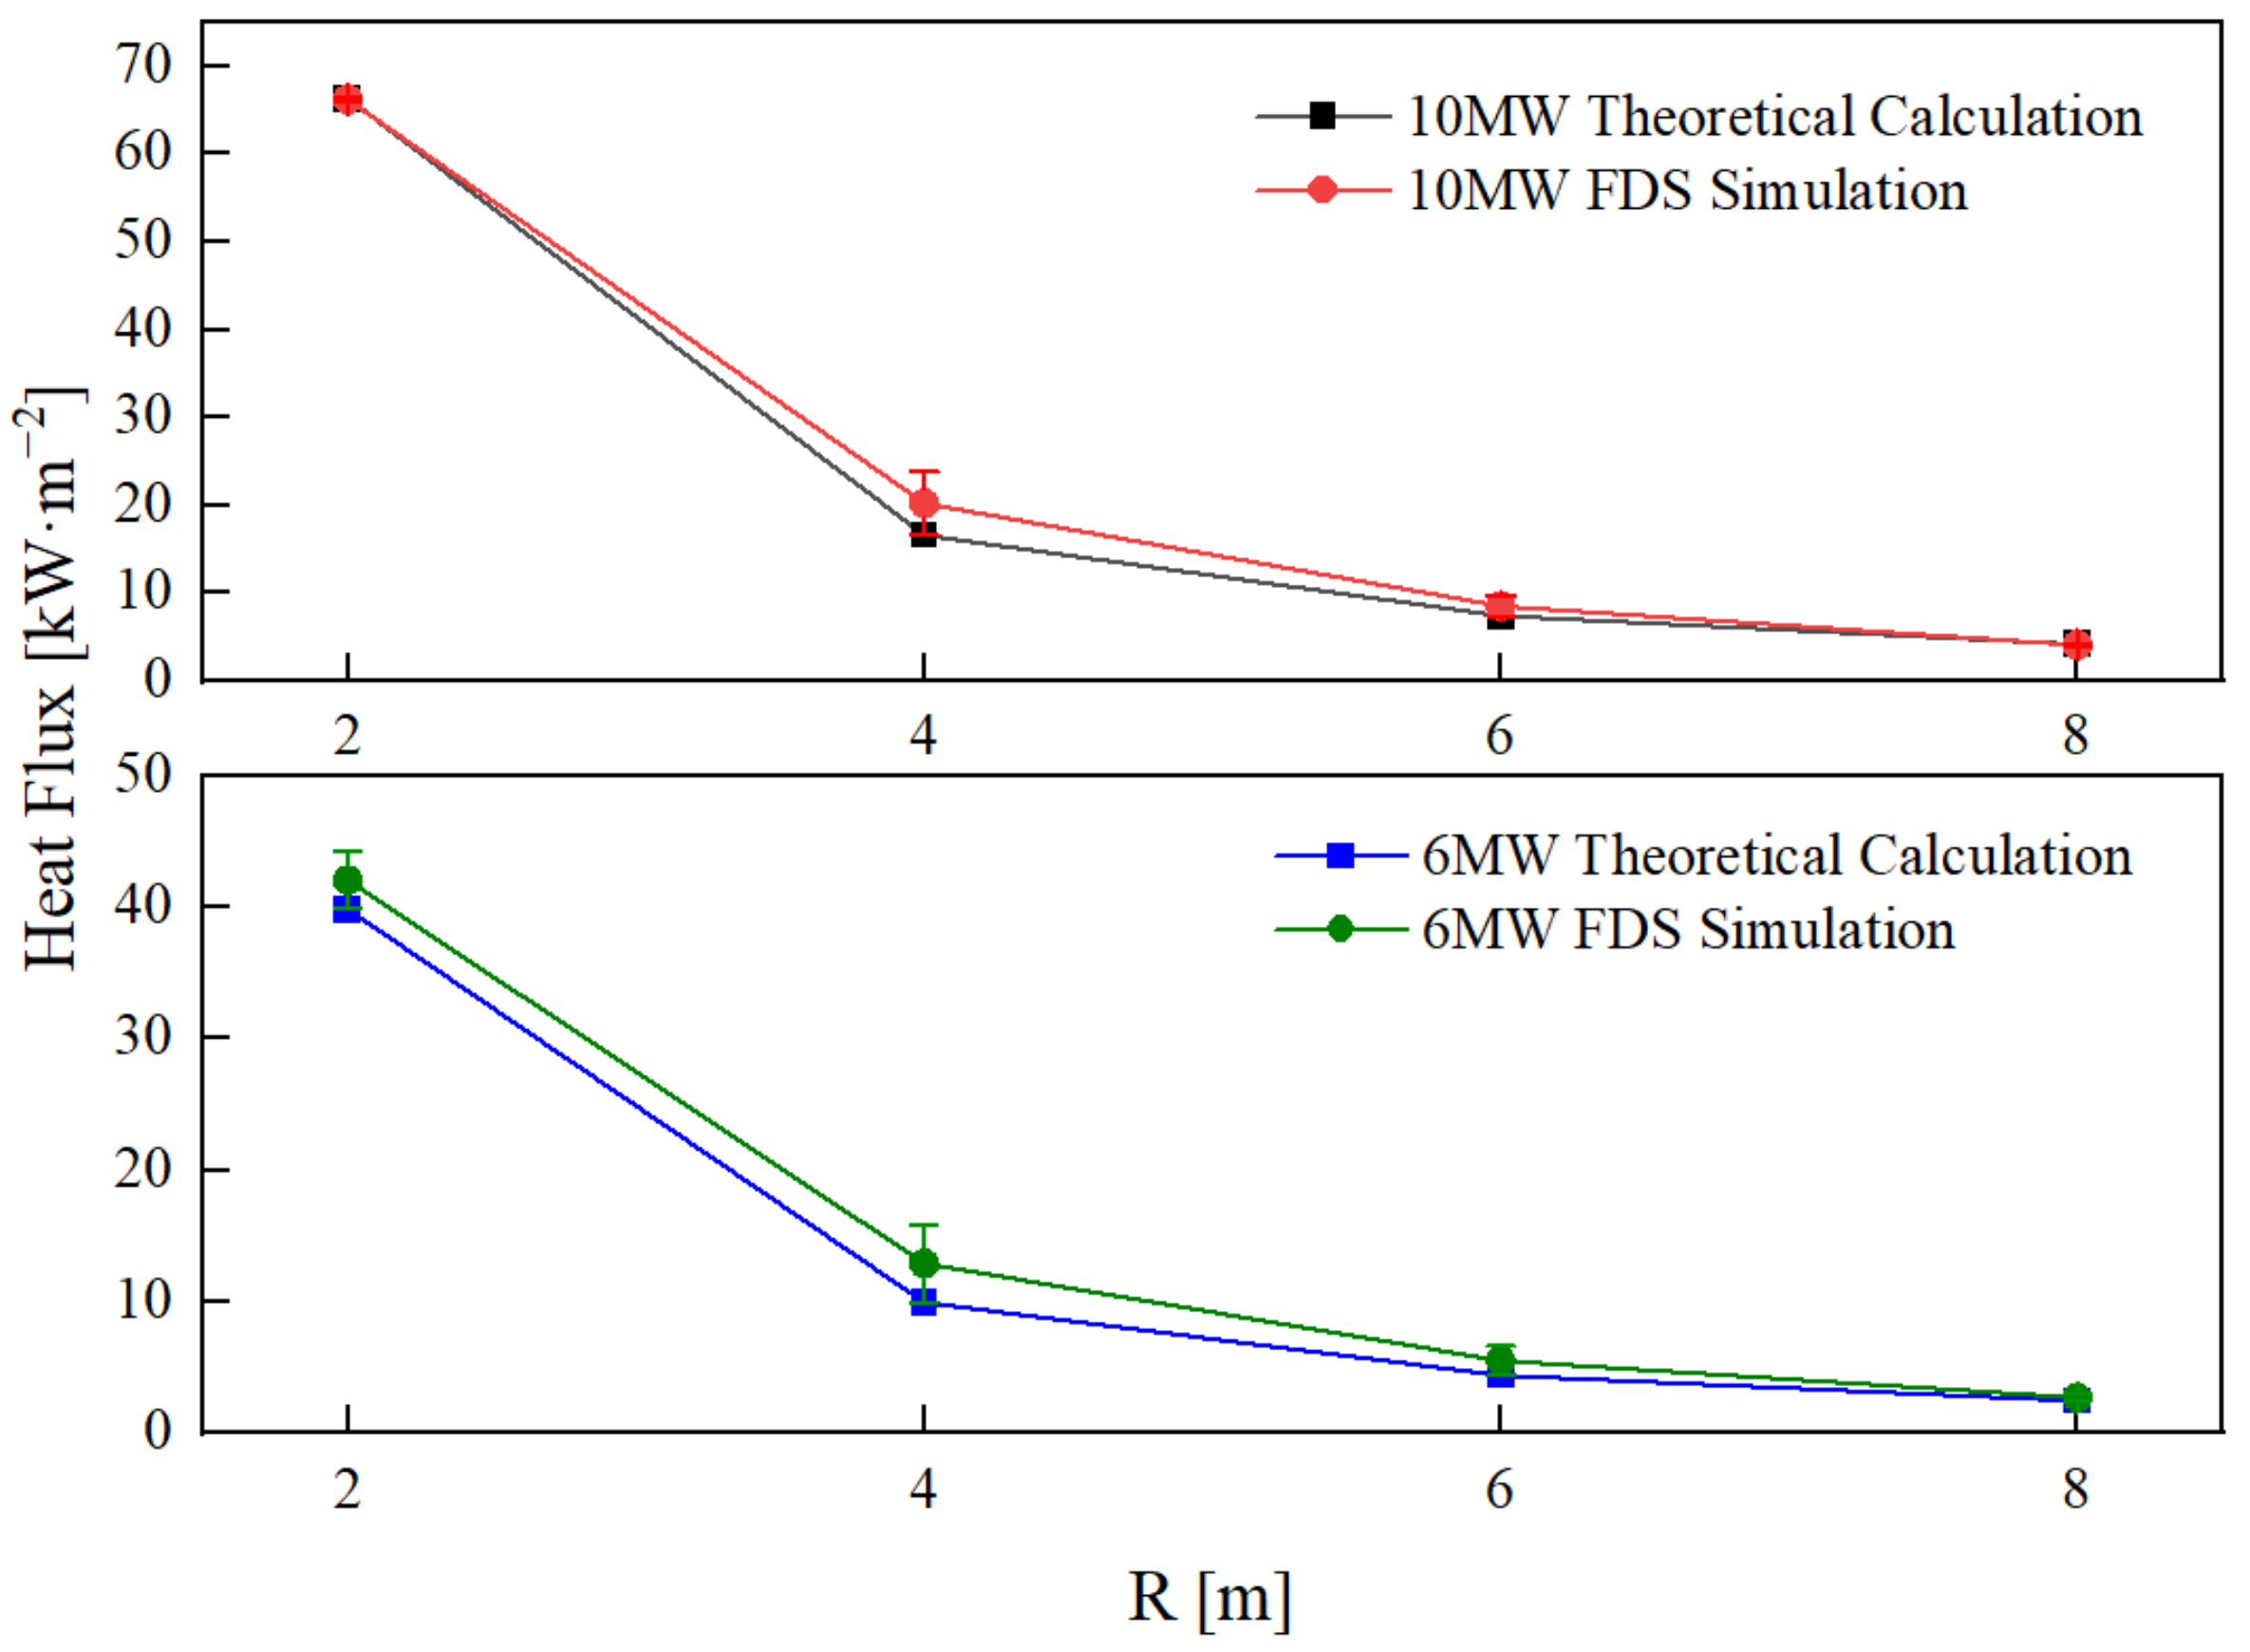
Figure 7 results exhibit similar trends, but there are still some differences between the methods. The absolute errors between the thermal radiation values obtained from the FDS simulations and the mathematical formula calculations for a 6 MW island-style shop fire decrease as the distance from the fire source increases. The maximum error occurs at R = 4 m and the minimum at R = 8 m. Similar trends are observed for a 10 MW shop fire. Specifically, at R = 2 m, 4 m, 6 m, and 8 m, the absolute errors are 2.21 kW/m
2, 2.95 kW/m
2, 1.12 kW/m
2, and 0.22 kW/m
2, respectively. When the fire load increases to 10 MW, the absolute errors at the same distances are 0.13 kW/m
2, 3.62 kW/m
2, 1.15 kW/m
2, and 0.09 kW/m
2, respectively.
In conclusion, the 6 m wide fire isolation zone is reasonable according to the dual-validation model of the theoretical calculation equation for thermal radiation isolation zones and simulation-based verification.
4. Evacuation and Congestion Simulations
Under fire conditions, minimizing the spread of fire is important. Furthermore, it is important to ensure the safety of passengers in waiting halls, i.e., passengers can be evacuated as quickly as possible without stampeding. Therefore, understanding the evolution of evacuations in waiting halls is valuable for management and guidance.
4.1. Evacuation Simulation Construction
Due to the difficulty of conducting real experiments involving passengers, simulations are commonly used instead. The evacuation simulation was performed using Pathfinder 2023.2.0816 software developed by Thunderhead Engineering [
31]. It is an agent-based egress and human movement simulator that provides a graphical user interface for simulation design and execution as well as 2D and 3D visualization tools for result analysis.
Ten thousand occupants during the peak hourly period in the ultralarge railway station were considered in the simulation. Based on Ref. [
32], the occupant parameters in Pathfinder are listed in
Table 2. Note that for simplicity of simulation, only the body size, ground speed, and stair speed were varied among the four categories. Other parameters, such as the reduction factor, acceleration time, persistence time, and collision response time, were set to default values. The evacuation simulation assumed that all personnel are evacuated to the outside of the waiting hall and that passengers cannot be evacuated to the platform through the ticket checkpoint.
4.2. Utilization of Exits
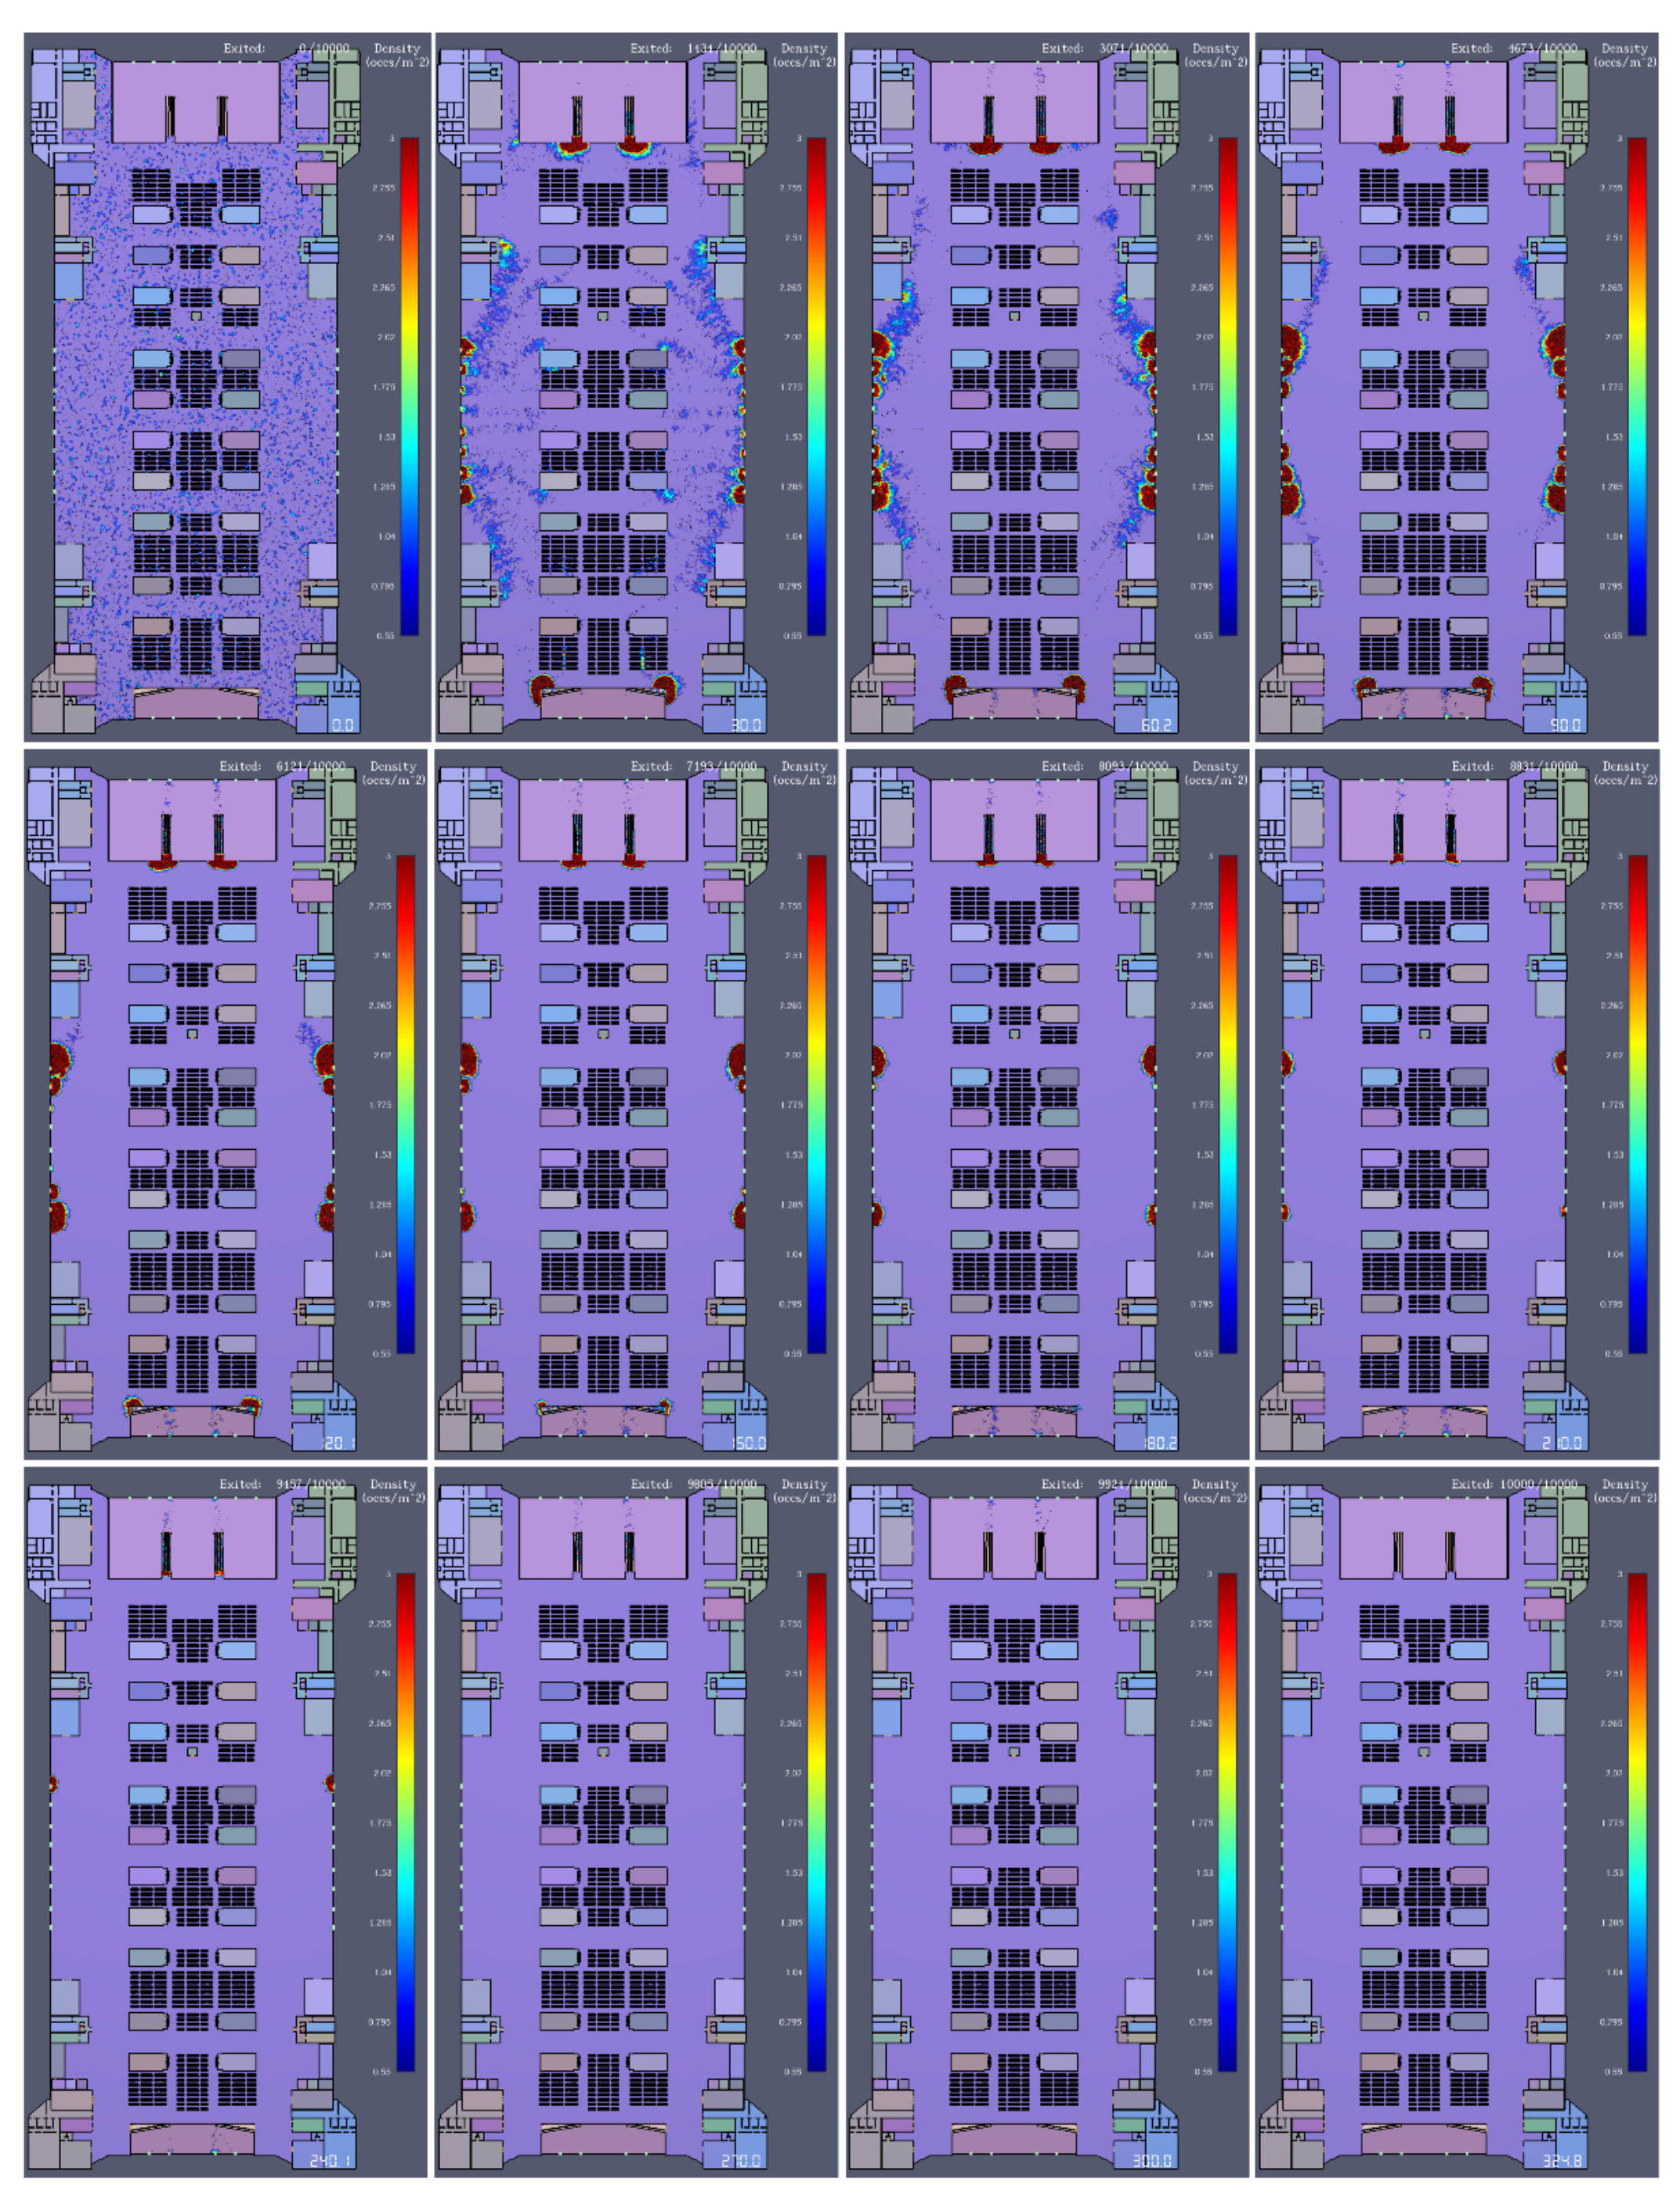
Figure 8 shows snapshots of the evacuation simulation process, and the interval between each snapshot is 30 s. The total evacuation process lasts 324.8 s. Although the total evacuation time is within a reasonable range,
Figure 8 shows that the utilization of exits is uneven. For example, at 90 s, a large number of pedestrians gathered at Exit 08, while Exit 05 exhibited almost no pedestrians.
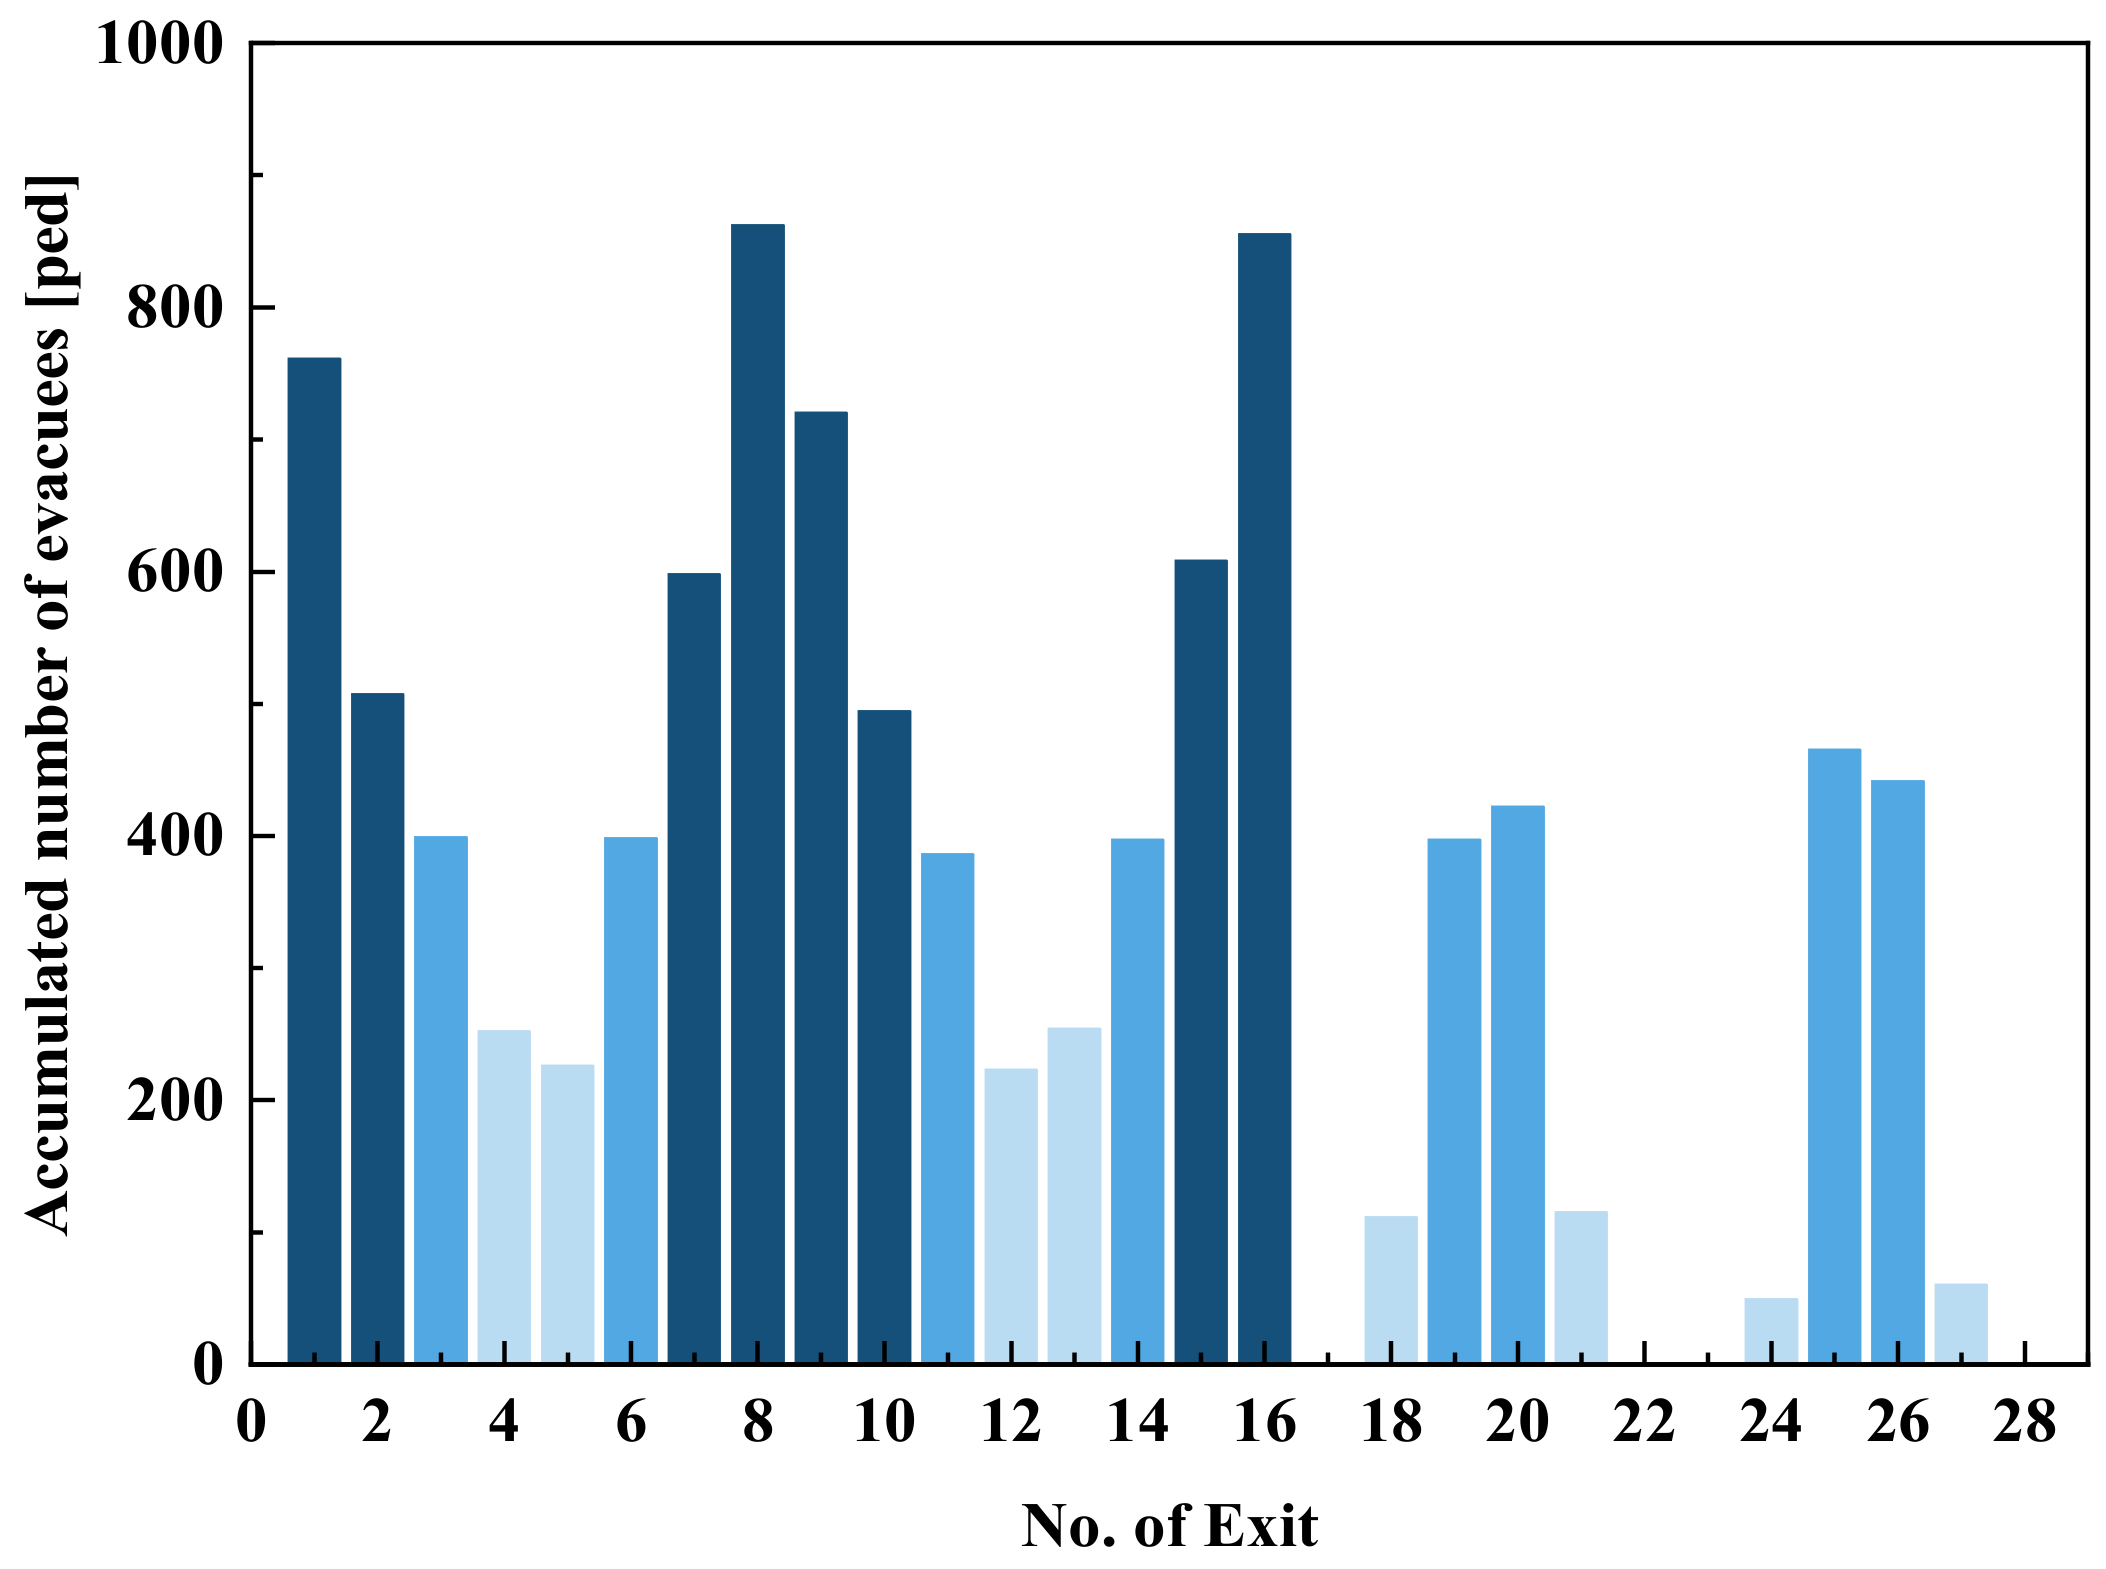
Figure 9 shows the cumulative number of evacuees at each exit. With the use of the Pareto chart [
33] and manual adjustment, we could obtain the frequently distributed exits and marked them in a dark color. The exits located on the outermost sides of the second floor (Exits 01–02, 07–10, and 15–16) exhibited a large number of evacuees, accounting for approximately 50% of the total number of people. In contrast, few evacuees left through Exits 04–05 and 12–13, even though the other exits were congested, leading to an increase in the evacuation time. Reasonably utilizing exits could effectively improve the evacuation efficiency. Therefore, it is necessary to provide reasonable guidance at these exits.
4.3. Evolution of Congestion
During evacuation, a large number of pedestrians gathered at exits within a short time, with an instantaneous density of 3 ped/m
2, especially at highly utilized exits, which is prone to dangerous outcomes. According to
Figure 9 and
Figure 10, we identified two types of congestion areas: high-utilization exits, including Exits 01–02, 07–10, and 15–16, denoted as congestion area I (CA-I), and the entrance area to escalators leading to the first floor, denoted as congestion area II (CA-II).
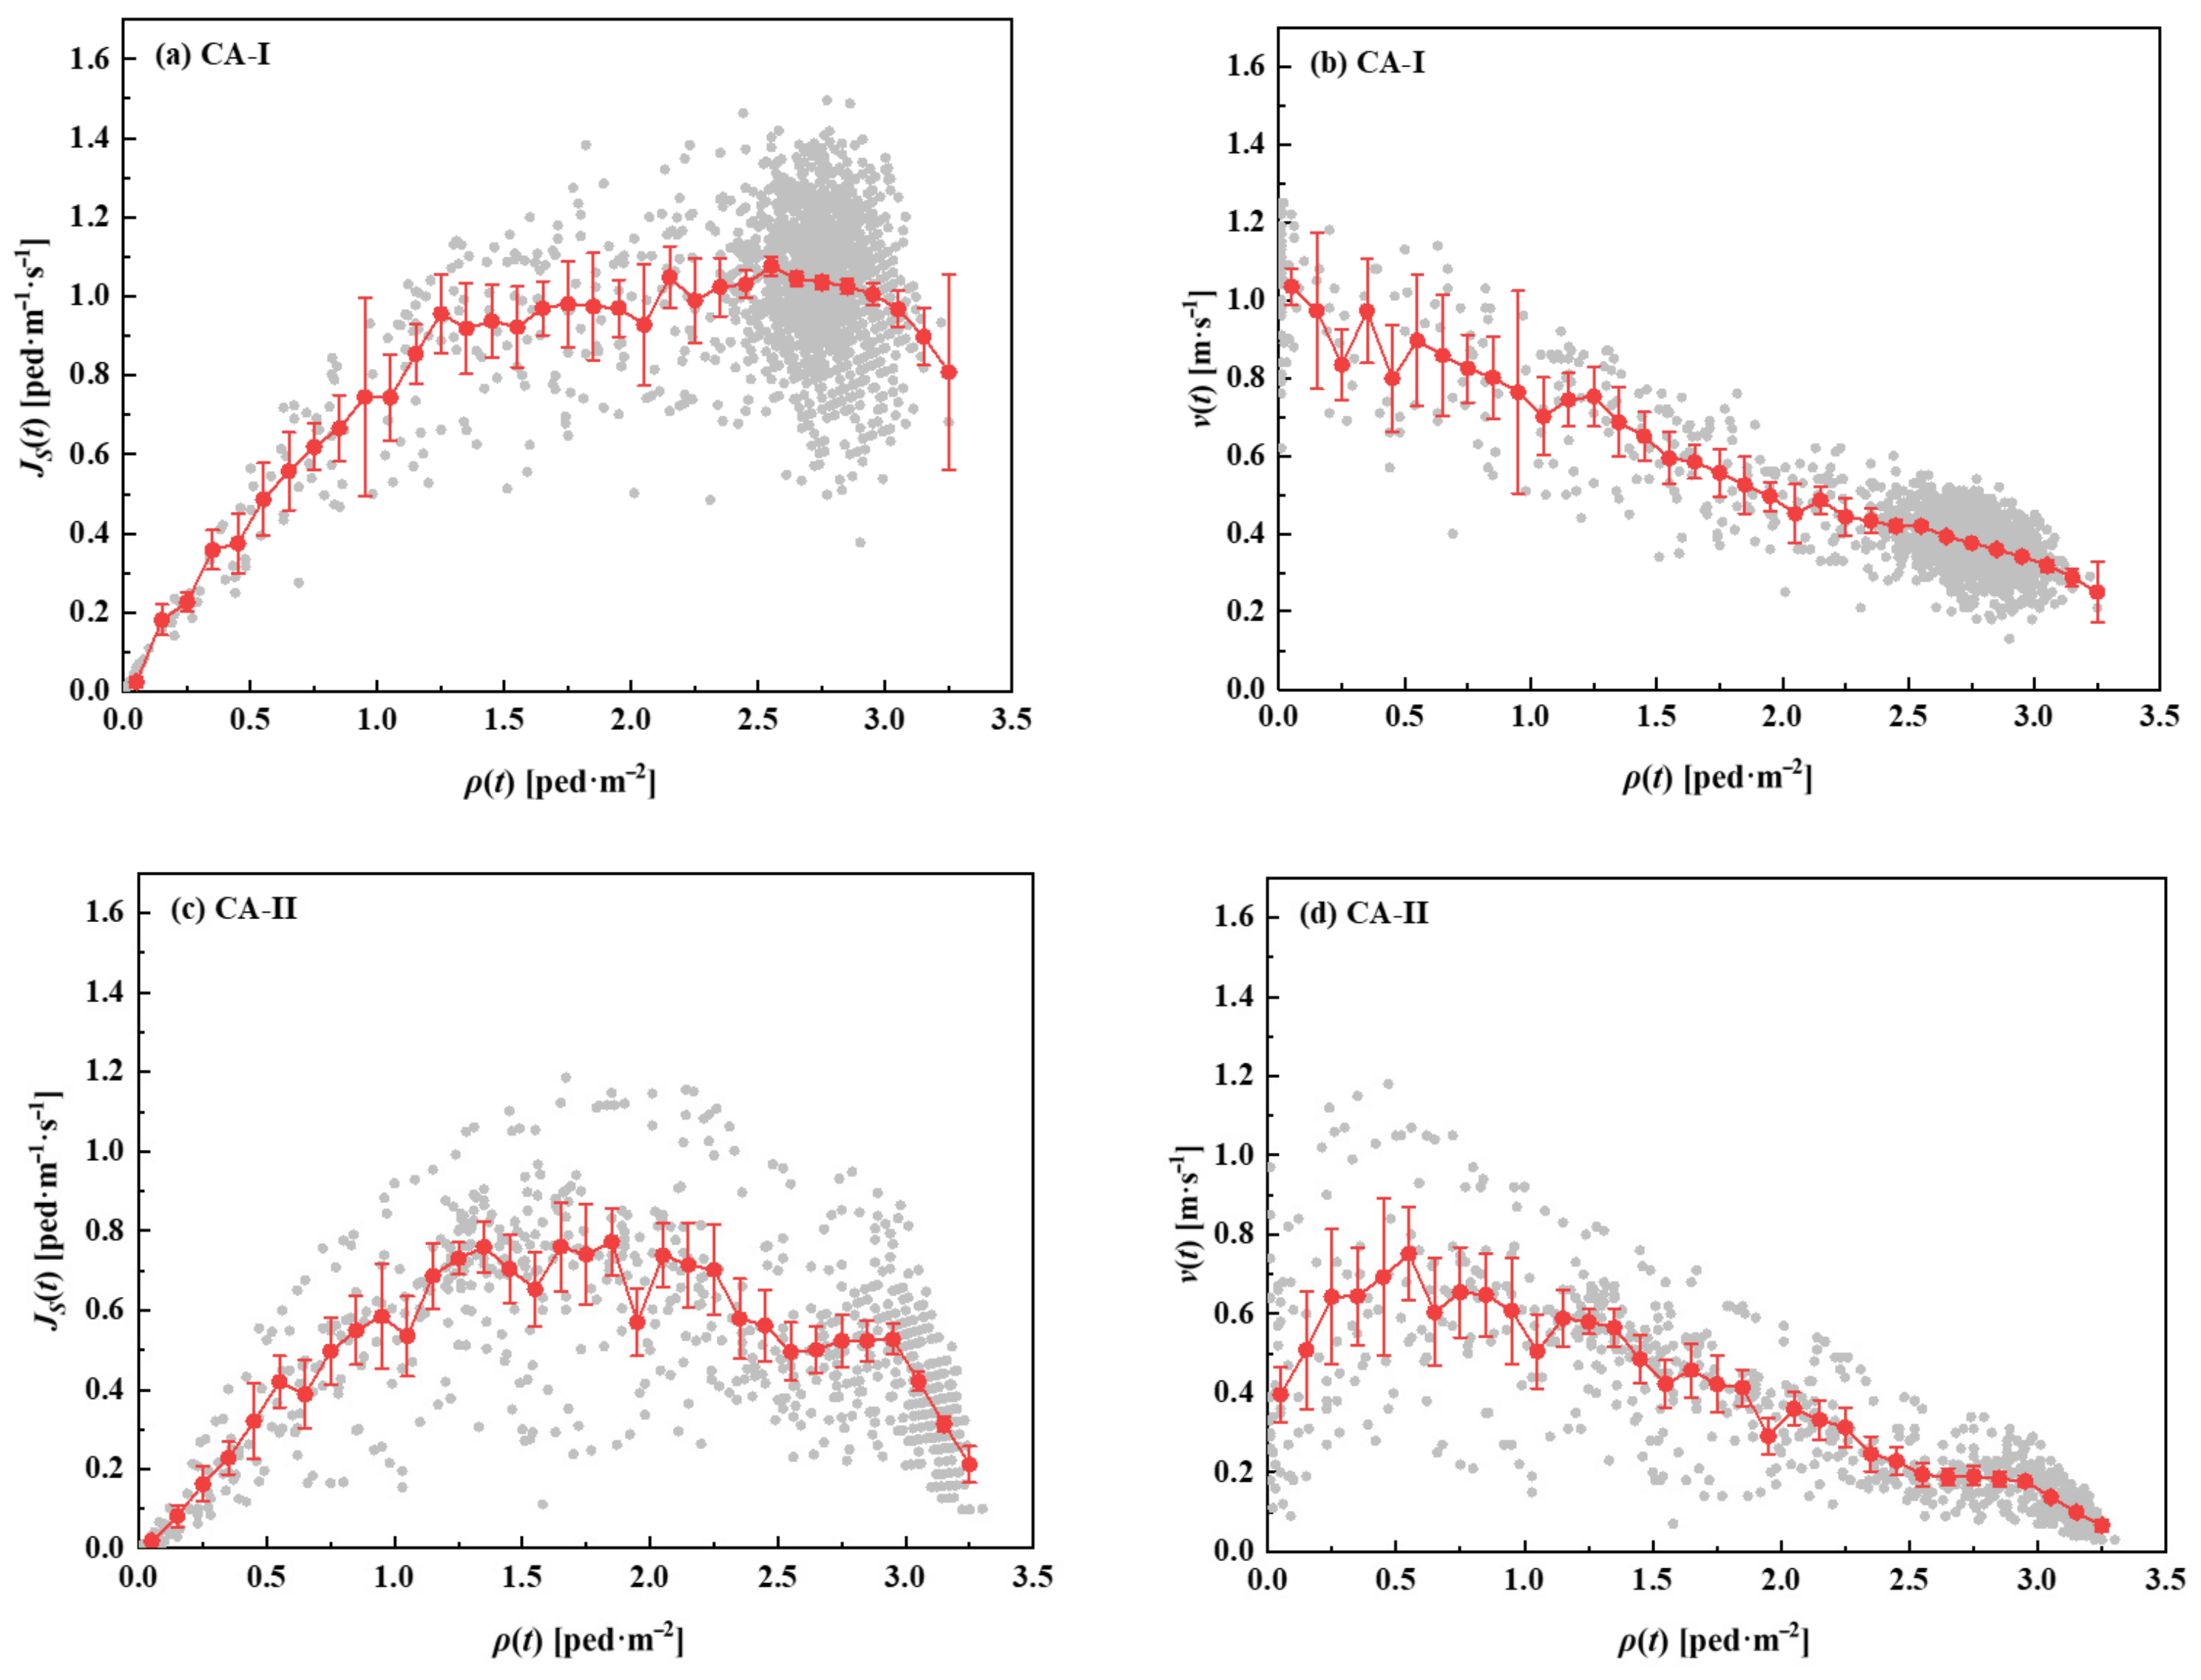
To quantitatively understand these two congestion areas, corresponding fundamental diagrams are shown in
Figure 10. The fundamental diagram shows the relationship between the velocity and density or between the flow and density according to the hydrodynamic equation. It is a basic input for engineering methods developed for the design and dimensioning of pedestrian facilities [
34].
Figure 10a,b show the instantaneous flow and velocity densities, respectively; the gray dots denote the raw data, and the red lines with error bars (95% confidence intervals) denote the data fitted through
ρ-binning [
35]. According to fundamental diagram theory, when the instantaneous flow rate begins to decrease, the onset of the congestion phase occurs [
36]. In the CA-I area, this critical density is 2.55 ped·m
−2, as shown in
Figure 10a. Correspondingly, the critical velocity indicating congestion is 0.42 m·s
−1. In other words, when the density in the CA-I area exceeds 2.55 ped·m
−2, congestion begins, and the velocity does not exceed 0.42 m·s
−1. Similarly, the critical density and velocity are 2.25 ped·m
−2 and 0.31 m·s
−1, respectively, as shown in
Figure 10c and
Figure 10d, respectively.
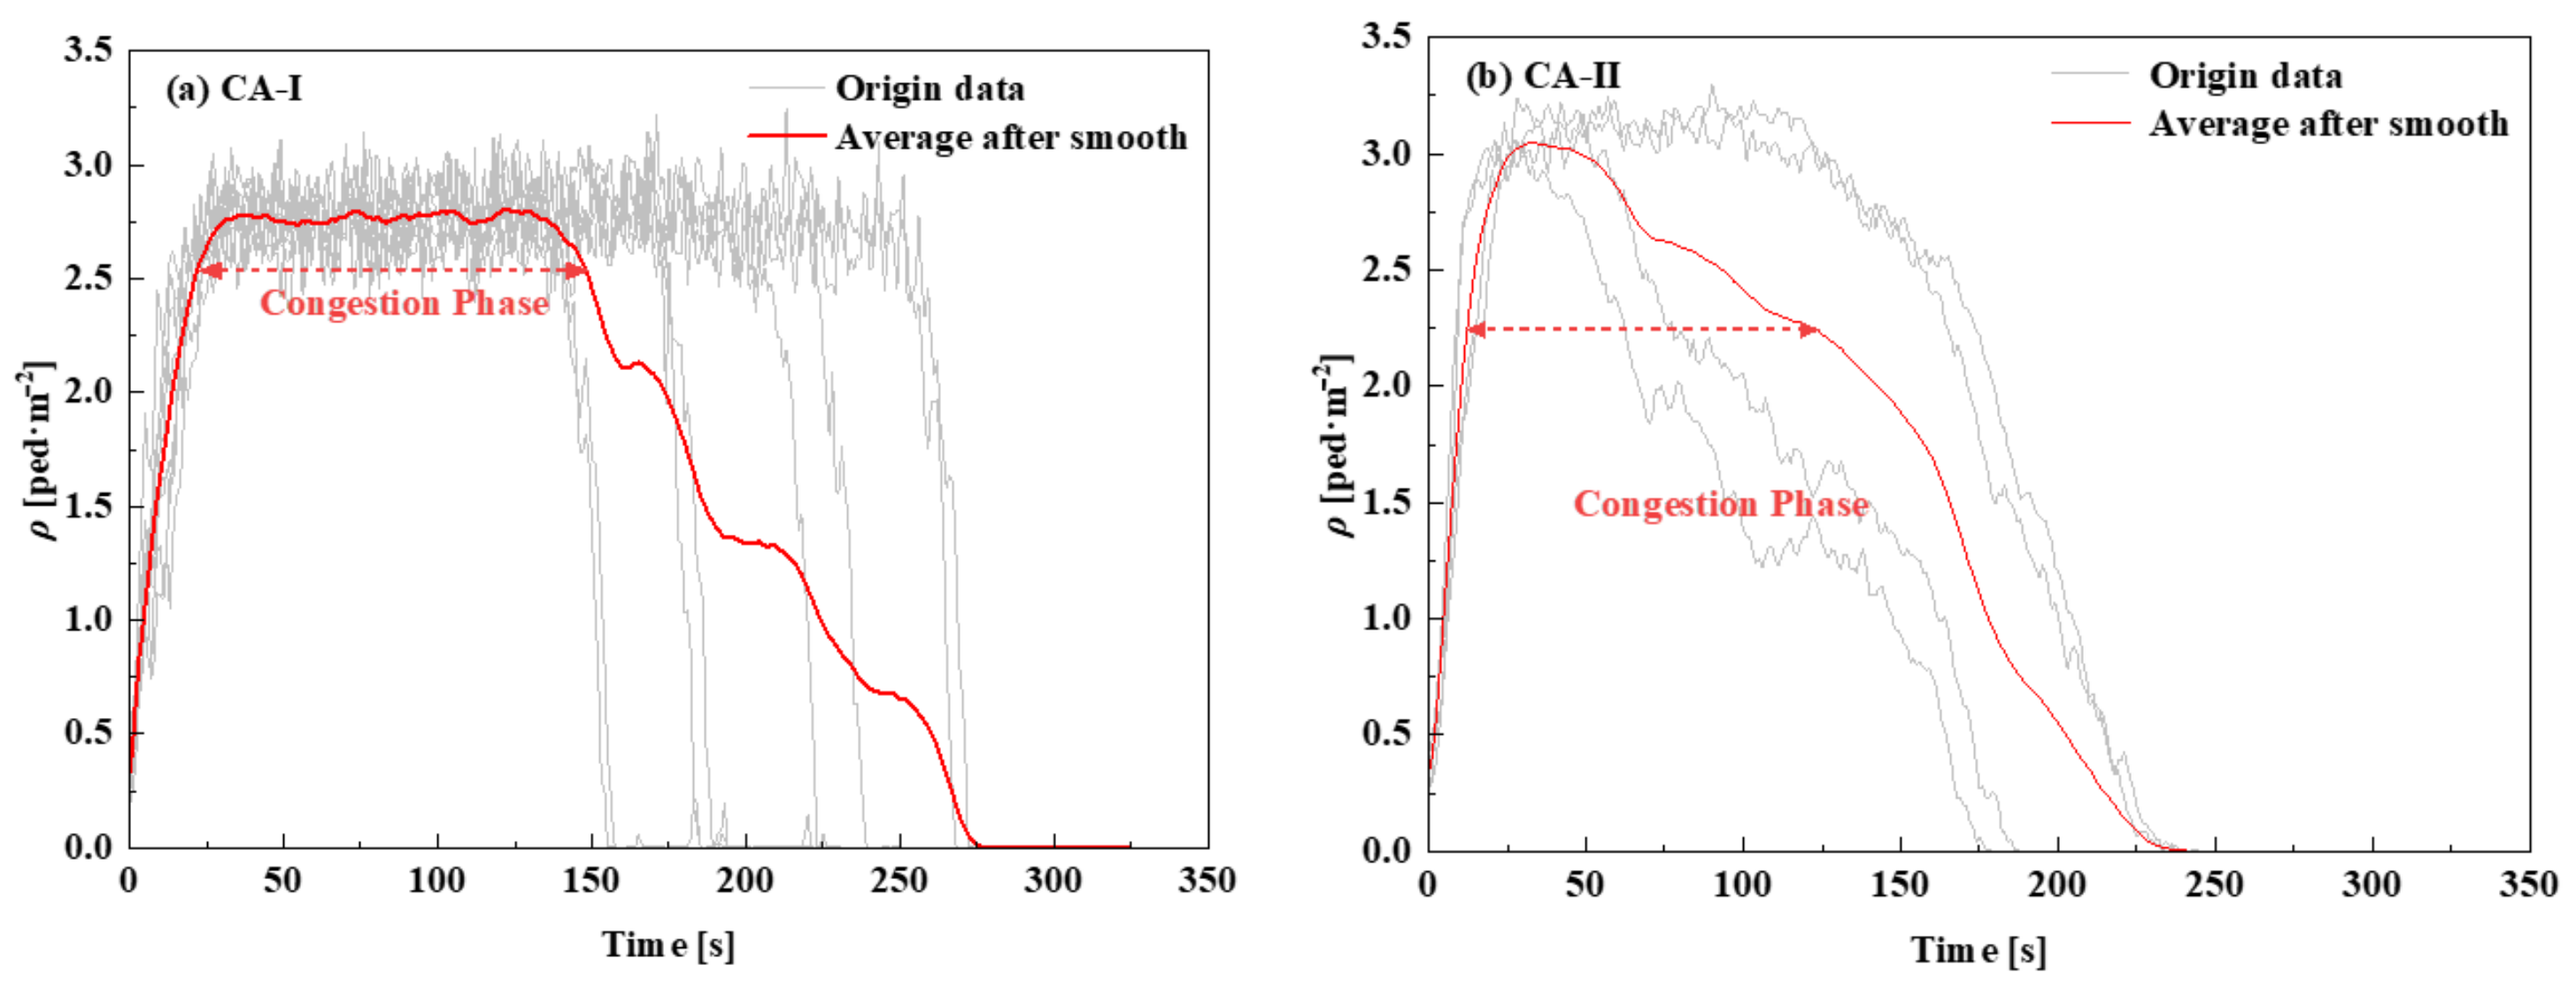
The fundamental diagram can reflect the critical value of congestion, and considering the evolution of density over time, as shown in
Figure 11, the temporal characteristics of congestion can be obtained. In
Figure 11, the gray lines denote the origin data of each exit, and the red line denotes the smoothed average values. In the CA-I area, congestion begins at 22 s, ends at 148 s, and lasts for 126 s. The density remains approximately 2.75 ped·m
−2 most of the time. In contrast to the CA-I area, where the density first rapidly increases, then stabilizes, and again decreases rapidly, in the CA-II area, after a rapid increase in the density, it begins to exhibit a slow downward trend. Congestion in the CA-II area lasts 109 s (from 12 to 121 s).
5. Discussion
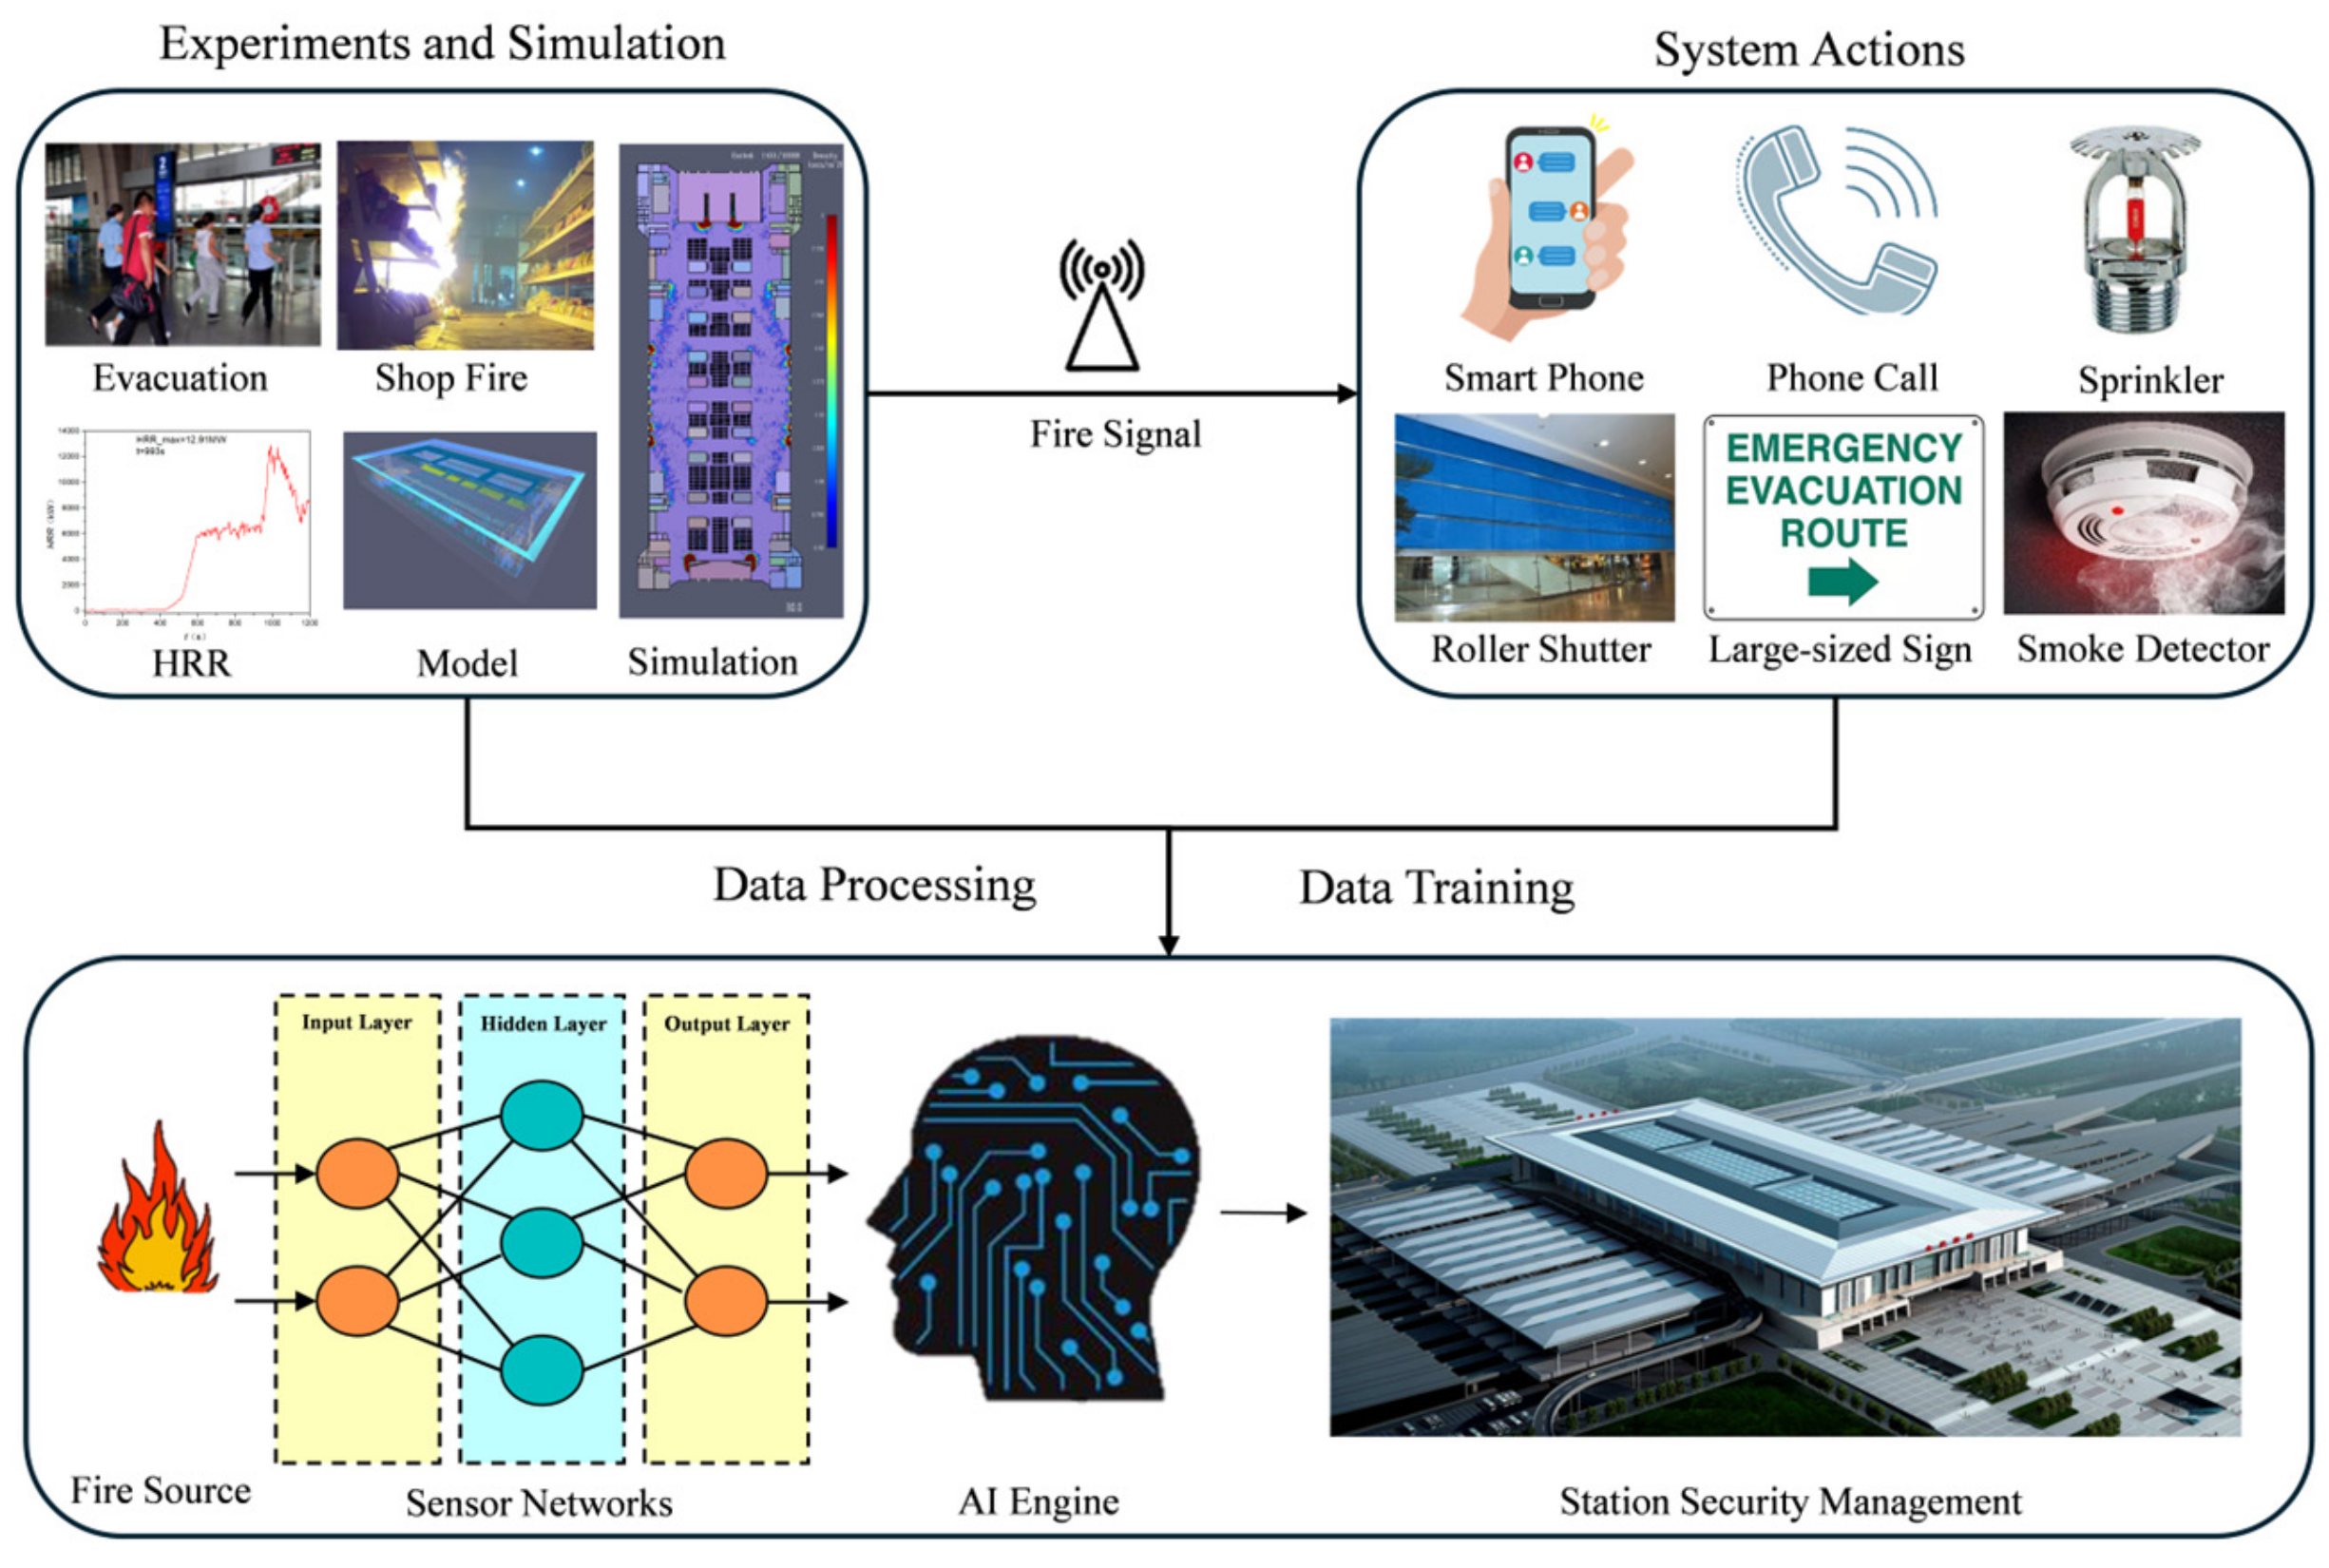
The railway station hub has implemented a data-driven approach to establish an intelligent fire protection system aimed at enhancing safety management in train stations. This system effectively mitigates potential risks posed by crowded passenger flows and high fire risks. Data pertaining to waiting hall conditions, including information on fire loads, sensor data, evacuation patterns, and crowd density, are collected through experiments and simulations. The collected data are then utilized to train AI models for predicting critical events such as fire propagation and evacuation risks. Additionally, real-time prediction and alert systems are deployed to anticipate fire and smoke evolution.
Not only is the fire protection system crucial, but also safety management in stations is of paramount importance. In the current safety management of railway stations, a certain number of staff members have been recruited as volunteer firefighters. These volunteers undergo regular monthly training, which equips them with the skills needed to organize orderly passenger evacuation and effectively utilize fire extinguishers to extinguish initial or small fires in an emergency.
In addressing crowded conditions during actual evacuation in transportation, improvement strategies should encompass a combination of physical infrastructure enhancements and technological innovations. For instance, installing fire-resistant and smoke-proof roller shutters in island-style shops can create barriers against fire spread [
37]. Additionally, leveraging technological disaster prevention measures, such as utilizing smartphones for indoor fire evacuation, can greatly enhance evacuation efficiency and effectiveness. Smartphone applications equipped with real-time evacuation maps, instructions, and communication capabilities enable individuals to navigate safely through crowded environments, receive timely updates, and communicate with emergency responders [
38]. Moreover, large-sized evacuation signs and high-quality evacuation drills are crucial elements in improving the efficient evacuation of passengers during emergency situations. By integrating both physical and technological enhancements, evacuation procedures can be optimized to mitigate risks and ensure the safety and well-being of evacuees, as illustrated in
Figure 12.
6. Conclusions
In this research, a full-size model of the waiting hall of an ultralarge railway station was established for fire and evacuation simulations based on the FDS and Pathfinder, respectively. Moreover, to better understand the evacuation evolution under the aforementioned fire conditions, an evacuation simulation of 10,000 evacuees lasting 324.8 s was conducted. The main conclusions are as follows:
(1) A 6 m wide fire isolation zone in the waiting hall of a train station can effectively suppress fire spread. According to the theoretical equations, a 5.2 m wide fire isolation zone can suppress the spread of a 10 MW fire and indicate the thermal radiation at R is 9.8 kW/m2. The FDS simulation results show a thermal radiation of 7.4 kW/m2 at a distance of 6 m from the fire source.
(2) The fire load of the island-style shop in the waiting hall should be less than 6 MW. The shop should endeavor to control its fire load as much as possible and be located adjacent to fire isolation zones to ensure its safety. It must not be situated near the main evacuation exits. Inside stations, noncombustible or difficult-to-ignite materials should be used to prevent thermal radiation from igniting combustible materials in the air, thus averting the vertical spread of fires.
(3) The utilization of exits is clearly uneven because of the cumulative number of evacuees. The eight exits, located on the outermost sides of the second floor (occupying only 28.6% of the total exits), exhibited a large number of evacuees, accounting for approximately 50% of the total number of people. Therefore, evacuation guidance measures should be formulated for balanced exit utilization and efficient evacuation.
(4) Two congested areas, i.e., high-utilization exits (CA-I) and the entrance area to escalators leading to the first floor (CA-II), were defined and analyzed based on the fundamental diagram theory. In the CA-I area, the critical density and velocity of congestion are 2.55 ped·m−2 and 0.42 m·s−1, respectively. Congestion in the CA-I area lasts 126 s (from 22 to 148 s). Similarly, congestion in the CA-II area begins at 12 s and ends at 121 s, lasting 109 s.
This research contributes numerical simulation results for heat fluxes and passenger evacuation in the waiting hall of an ultralarge railway station and provides insights into waiting hall design and management. To further validate and expand our research findings, we plan to conduct calibration experiments on island-style shop fire scales using fire calorimetry to obtain their heat release rates. Furthermore, conducting full-scale thermal radiation experiments is also an integral part of our future work, as the relevant experimental data can be used to refine existing thermal radiation models.
