


Analyzing Fire Severity and Post-Fire Vegetation Recovery in the Temperate Andes Using Earth Observation Data


Abstract
:1. Introduction
- To elaborate the FS of the fire event in September 2019 at the El Saco basin.
- To identify the most appropriate VIs derived from Sentinel-2 (S2) images for the monitoring of vegetation recovery after wildfires in the temperate climate zone in southern Ecuador.
- To assess the vegetation recovery in the different FS classes based on the previous selection of the best VIs for post-fire monitoring at the area in question.
2. Materials and Methods
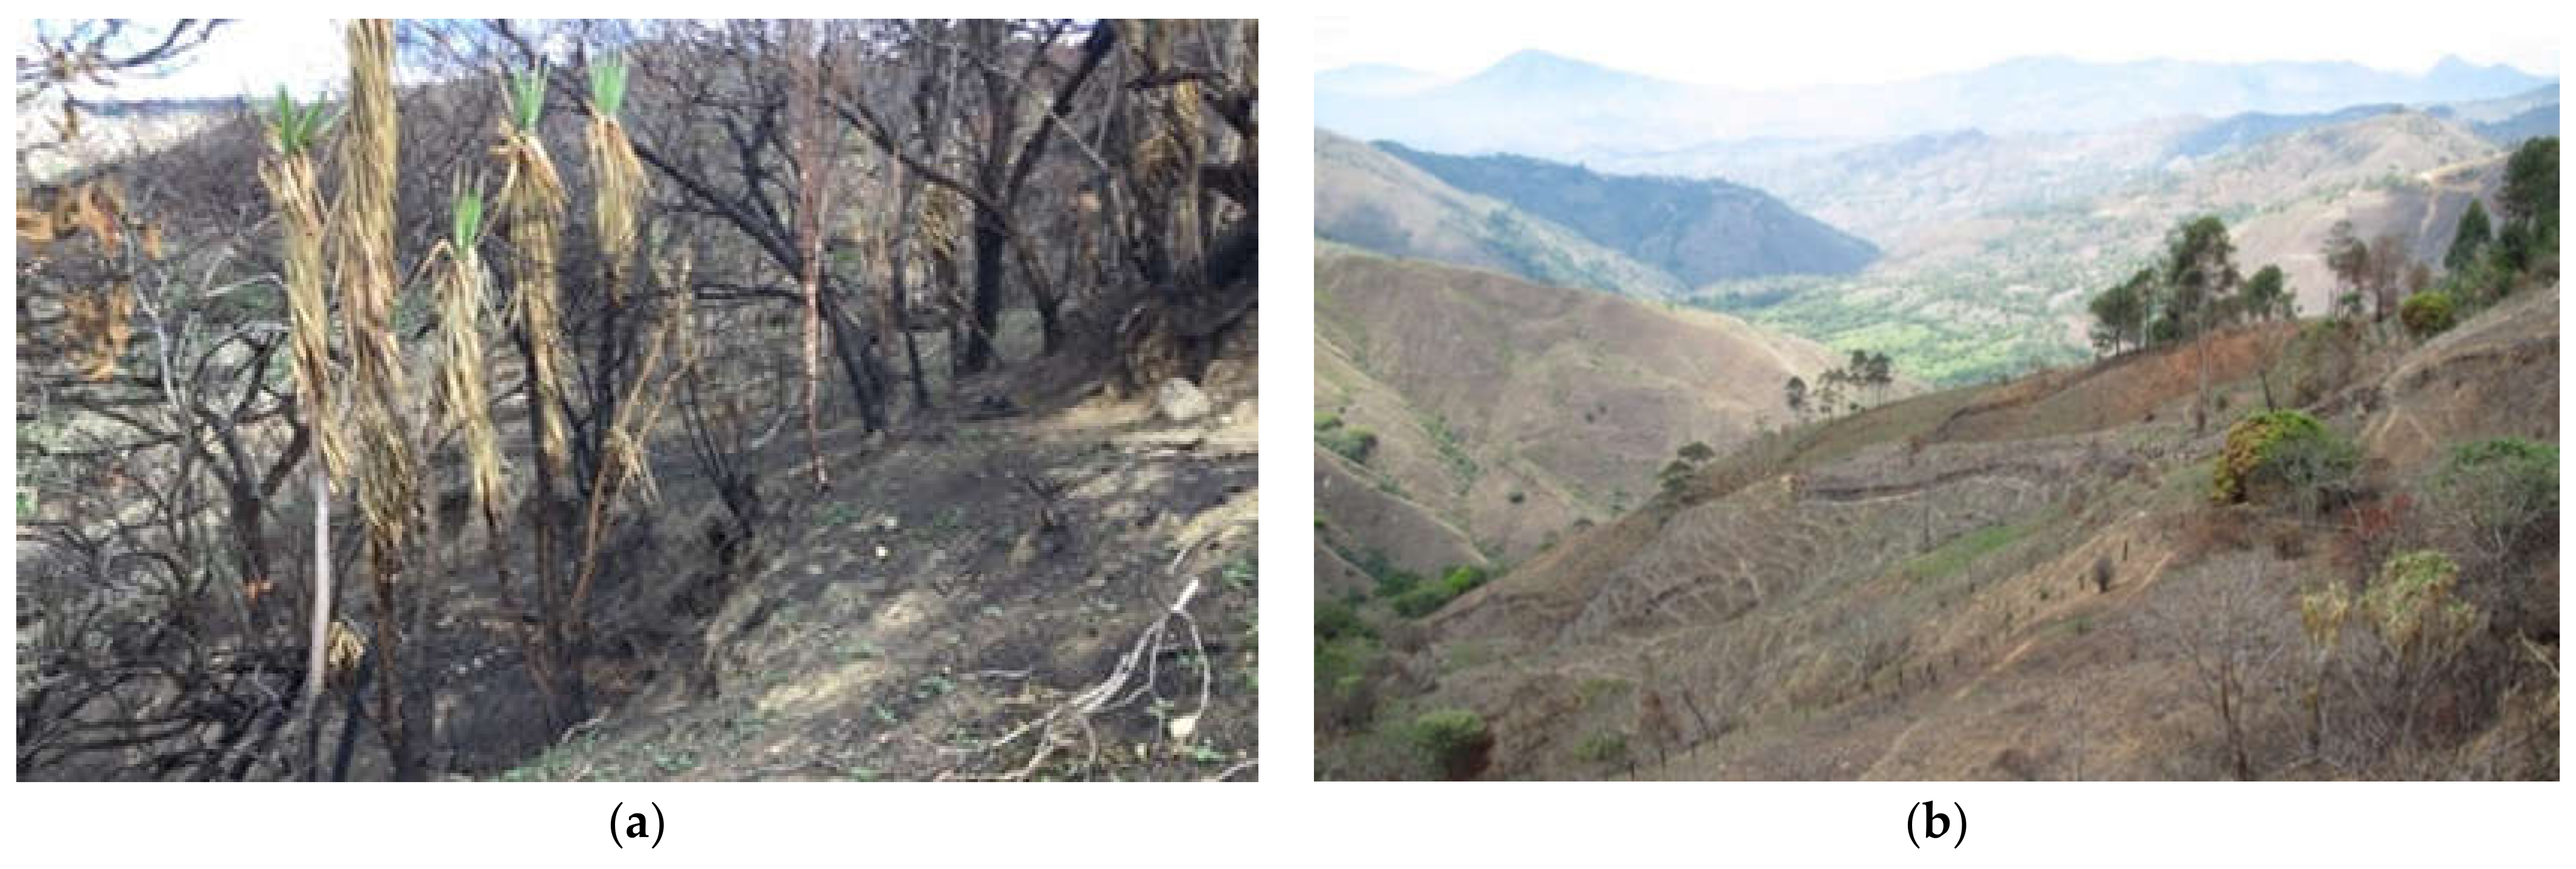
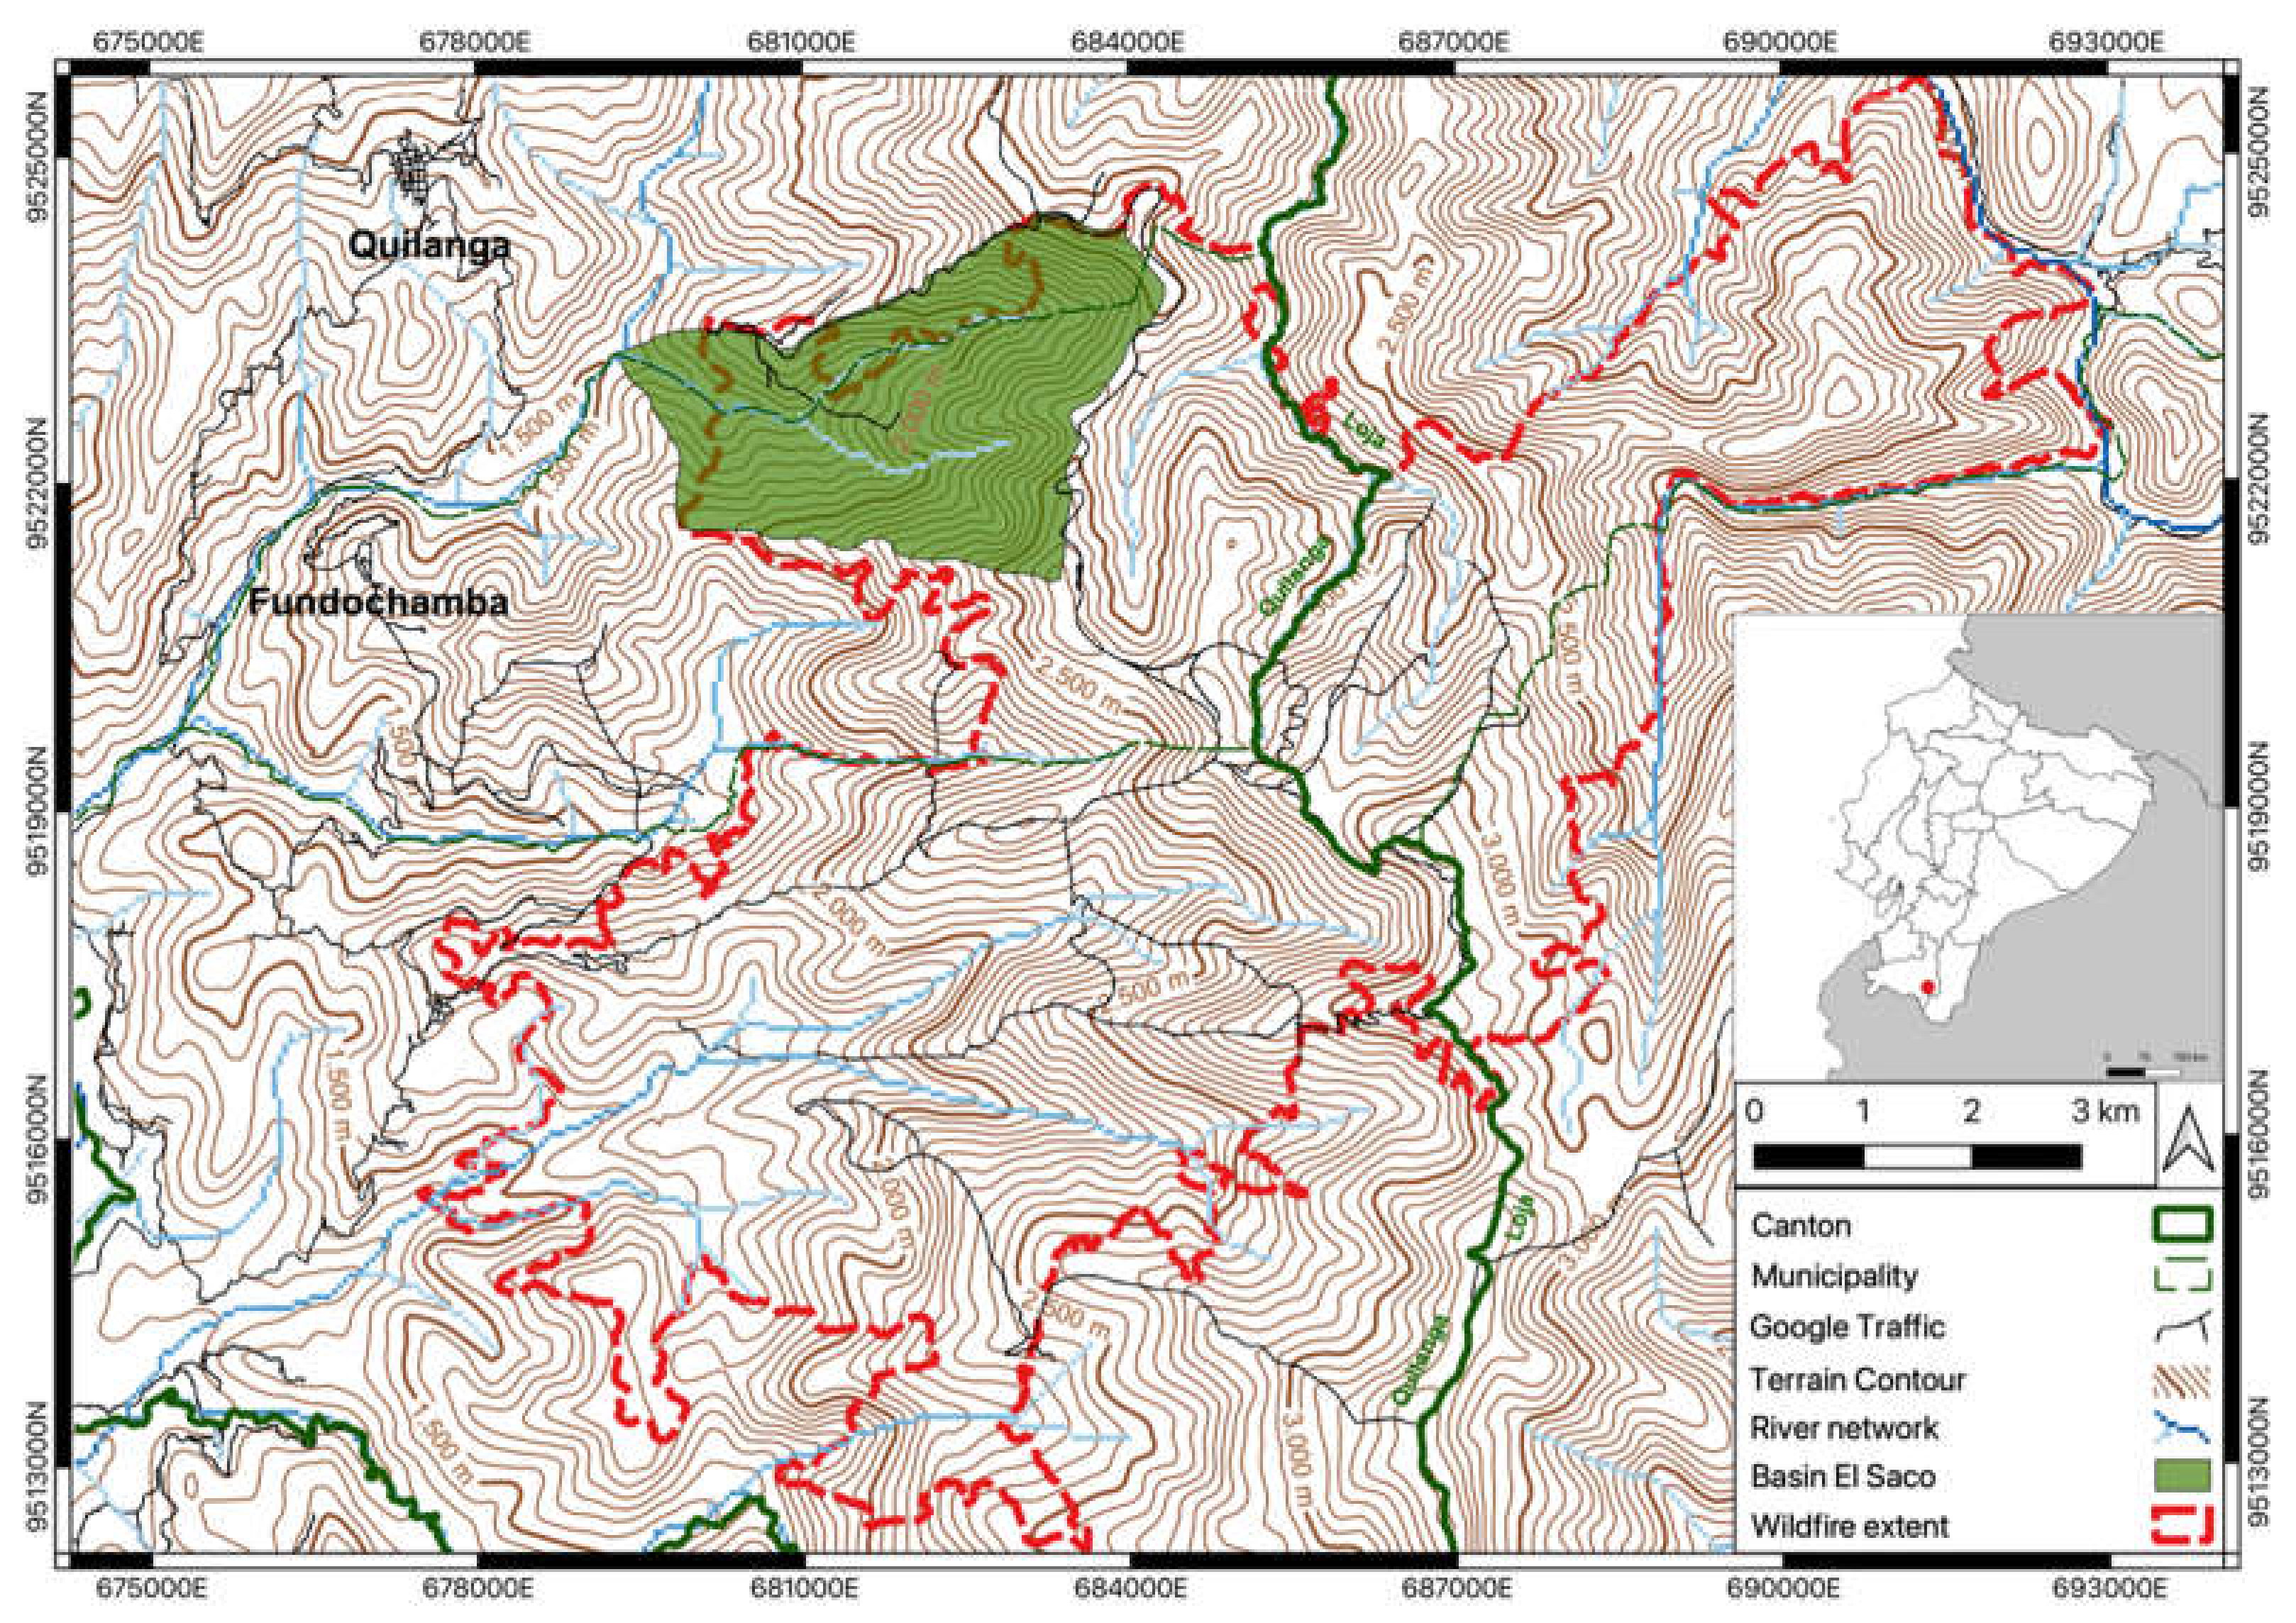
2.1. Study Site
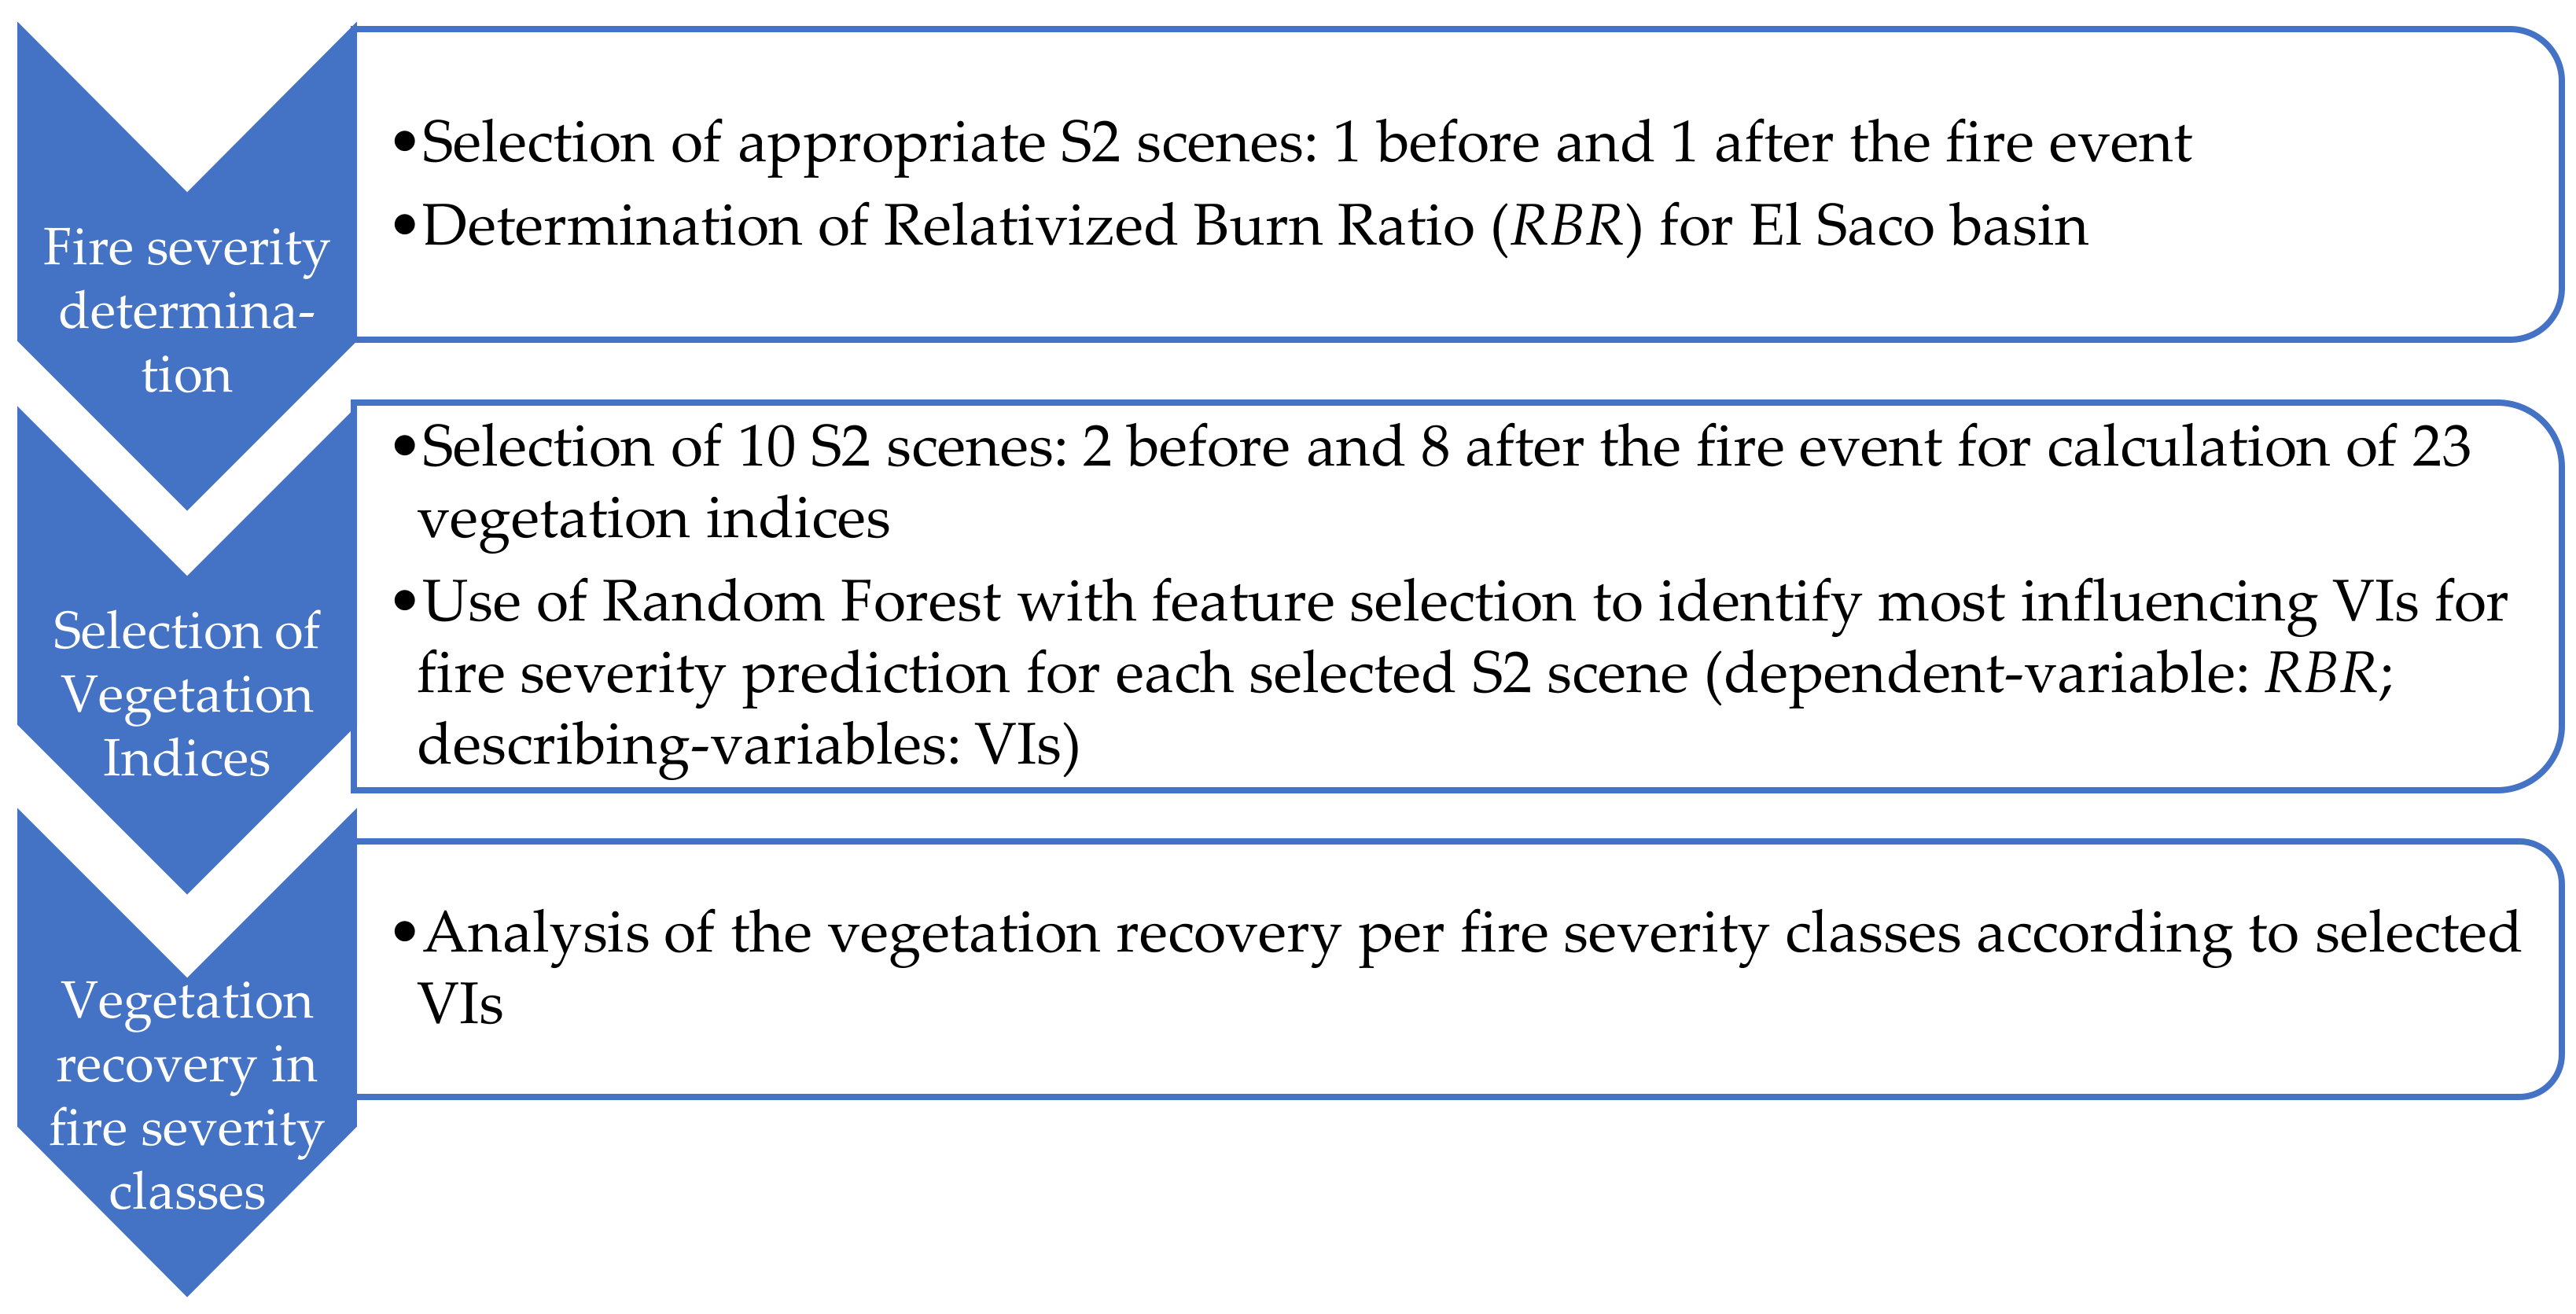
2.2. Workflow
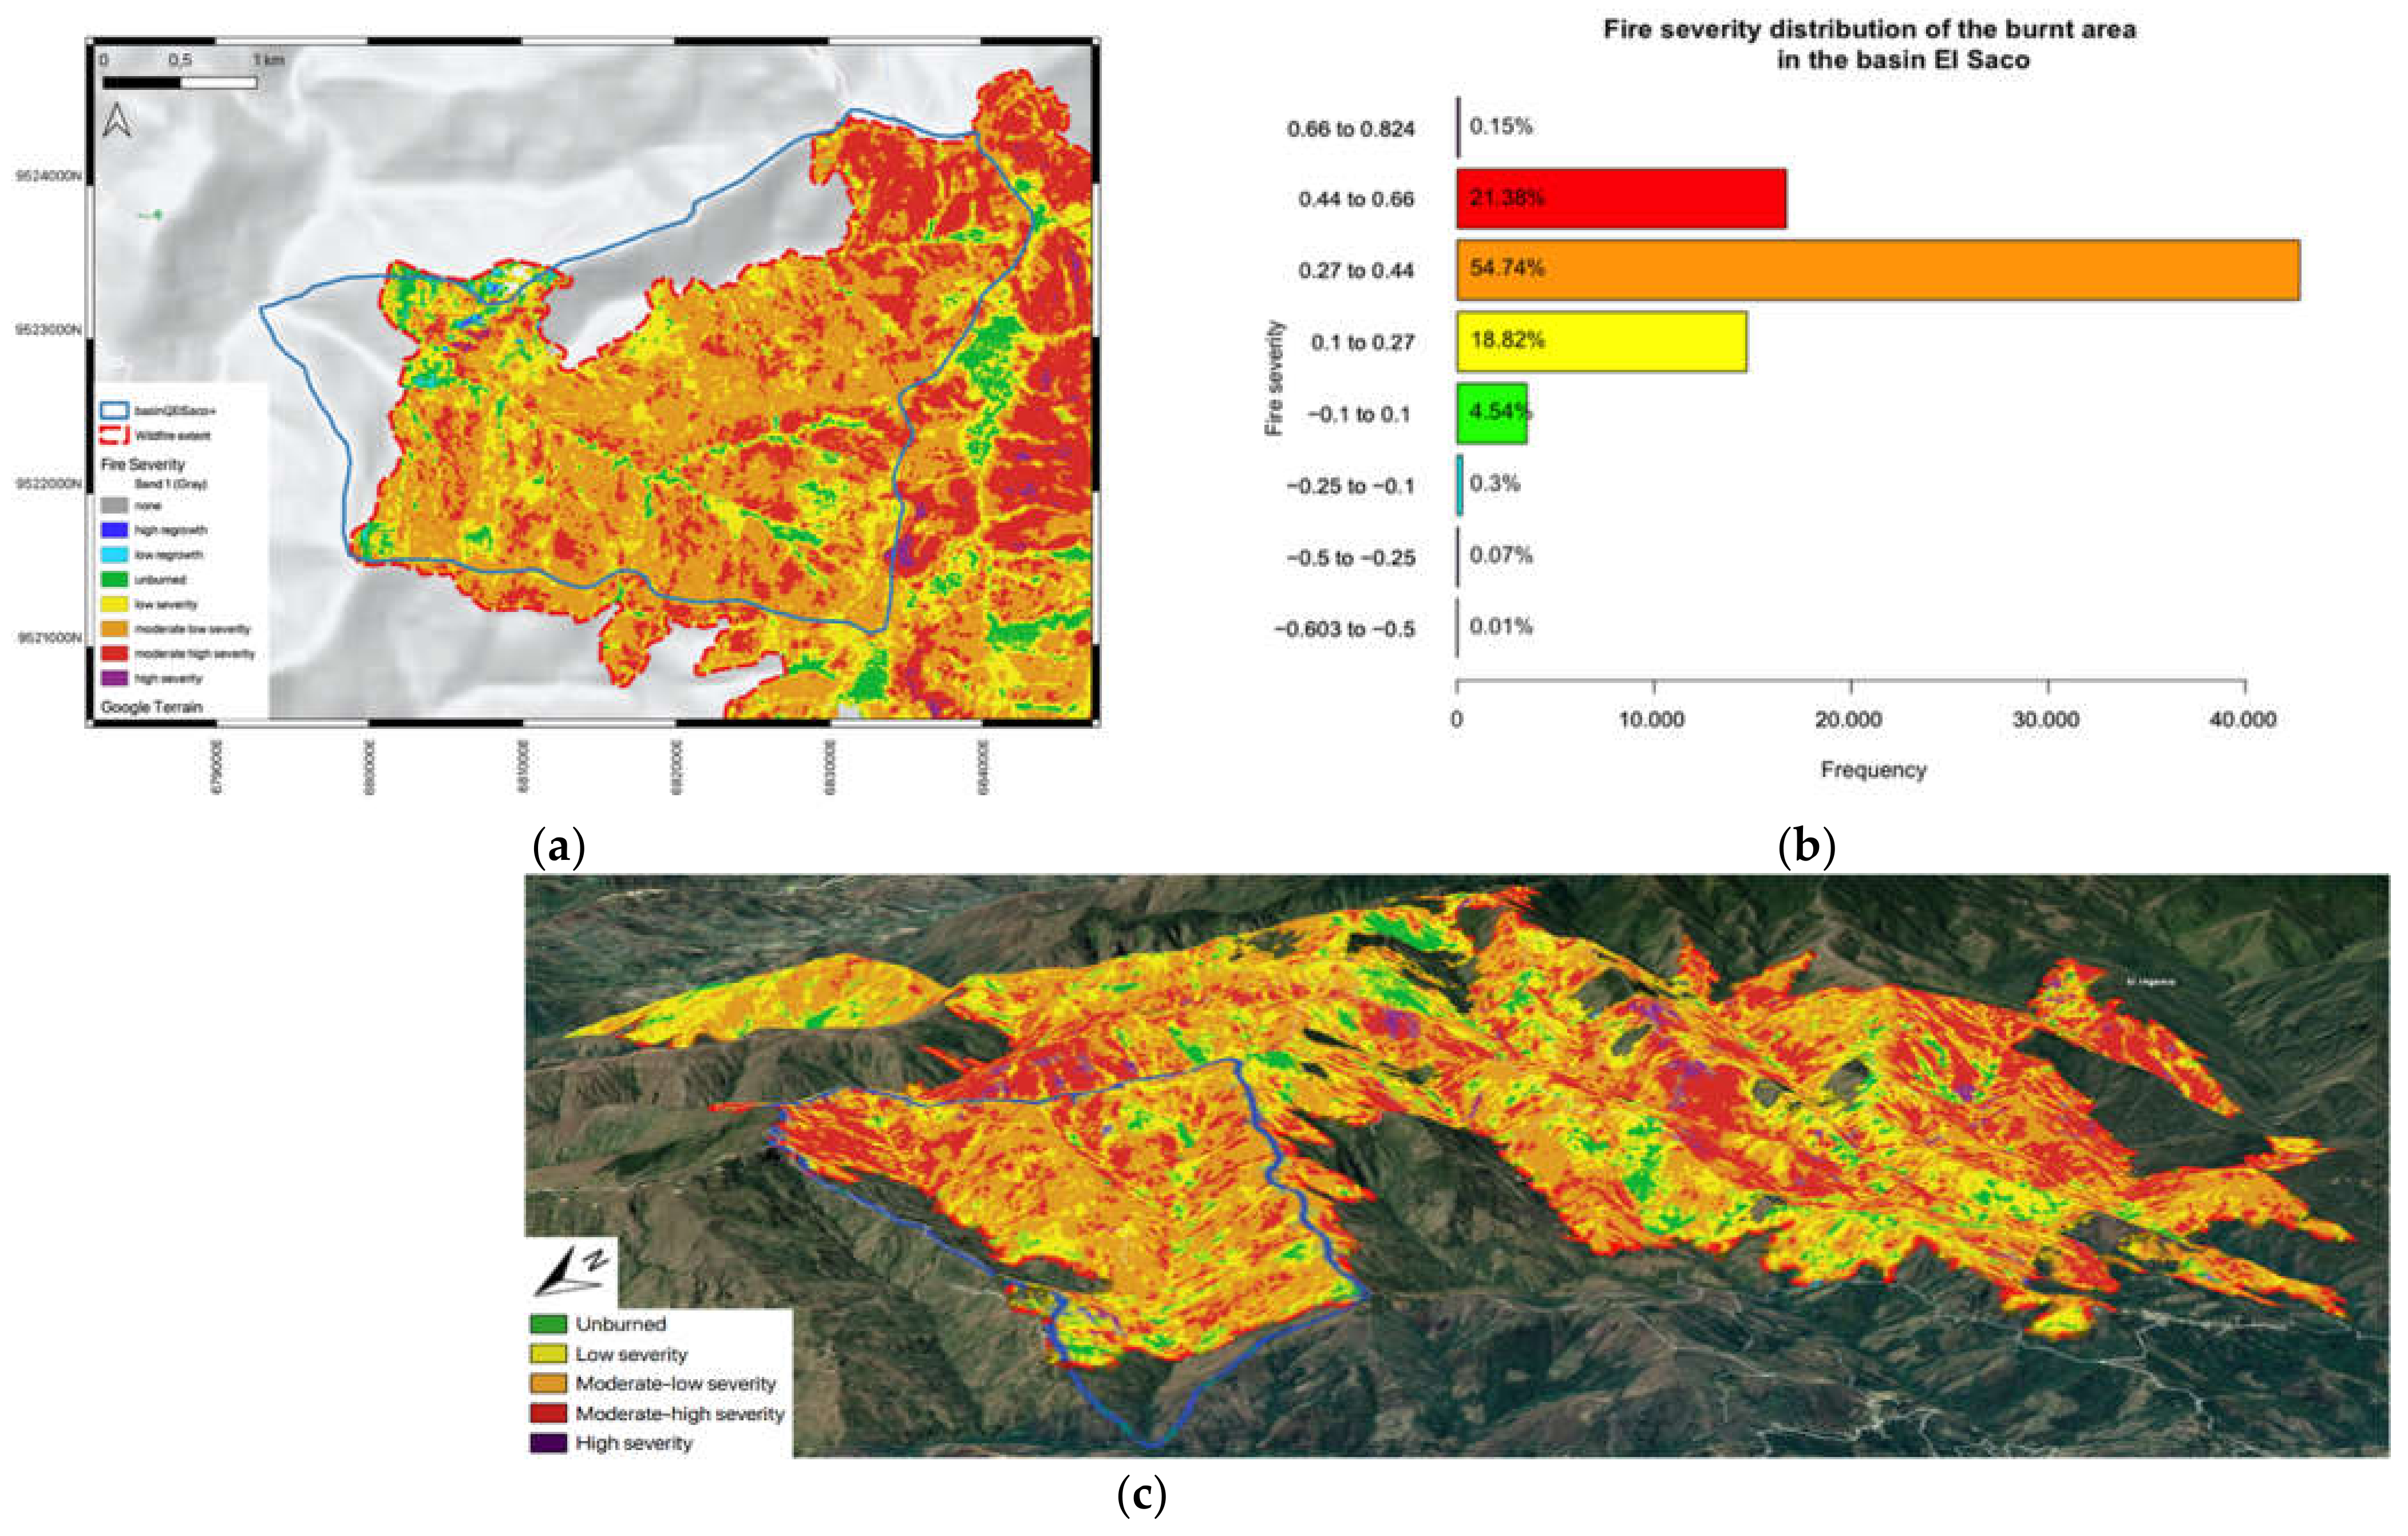
2.2.1. Elaboration of the Fire Severity
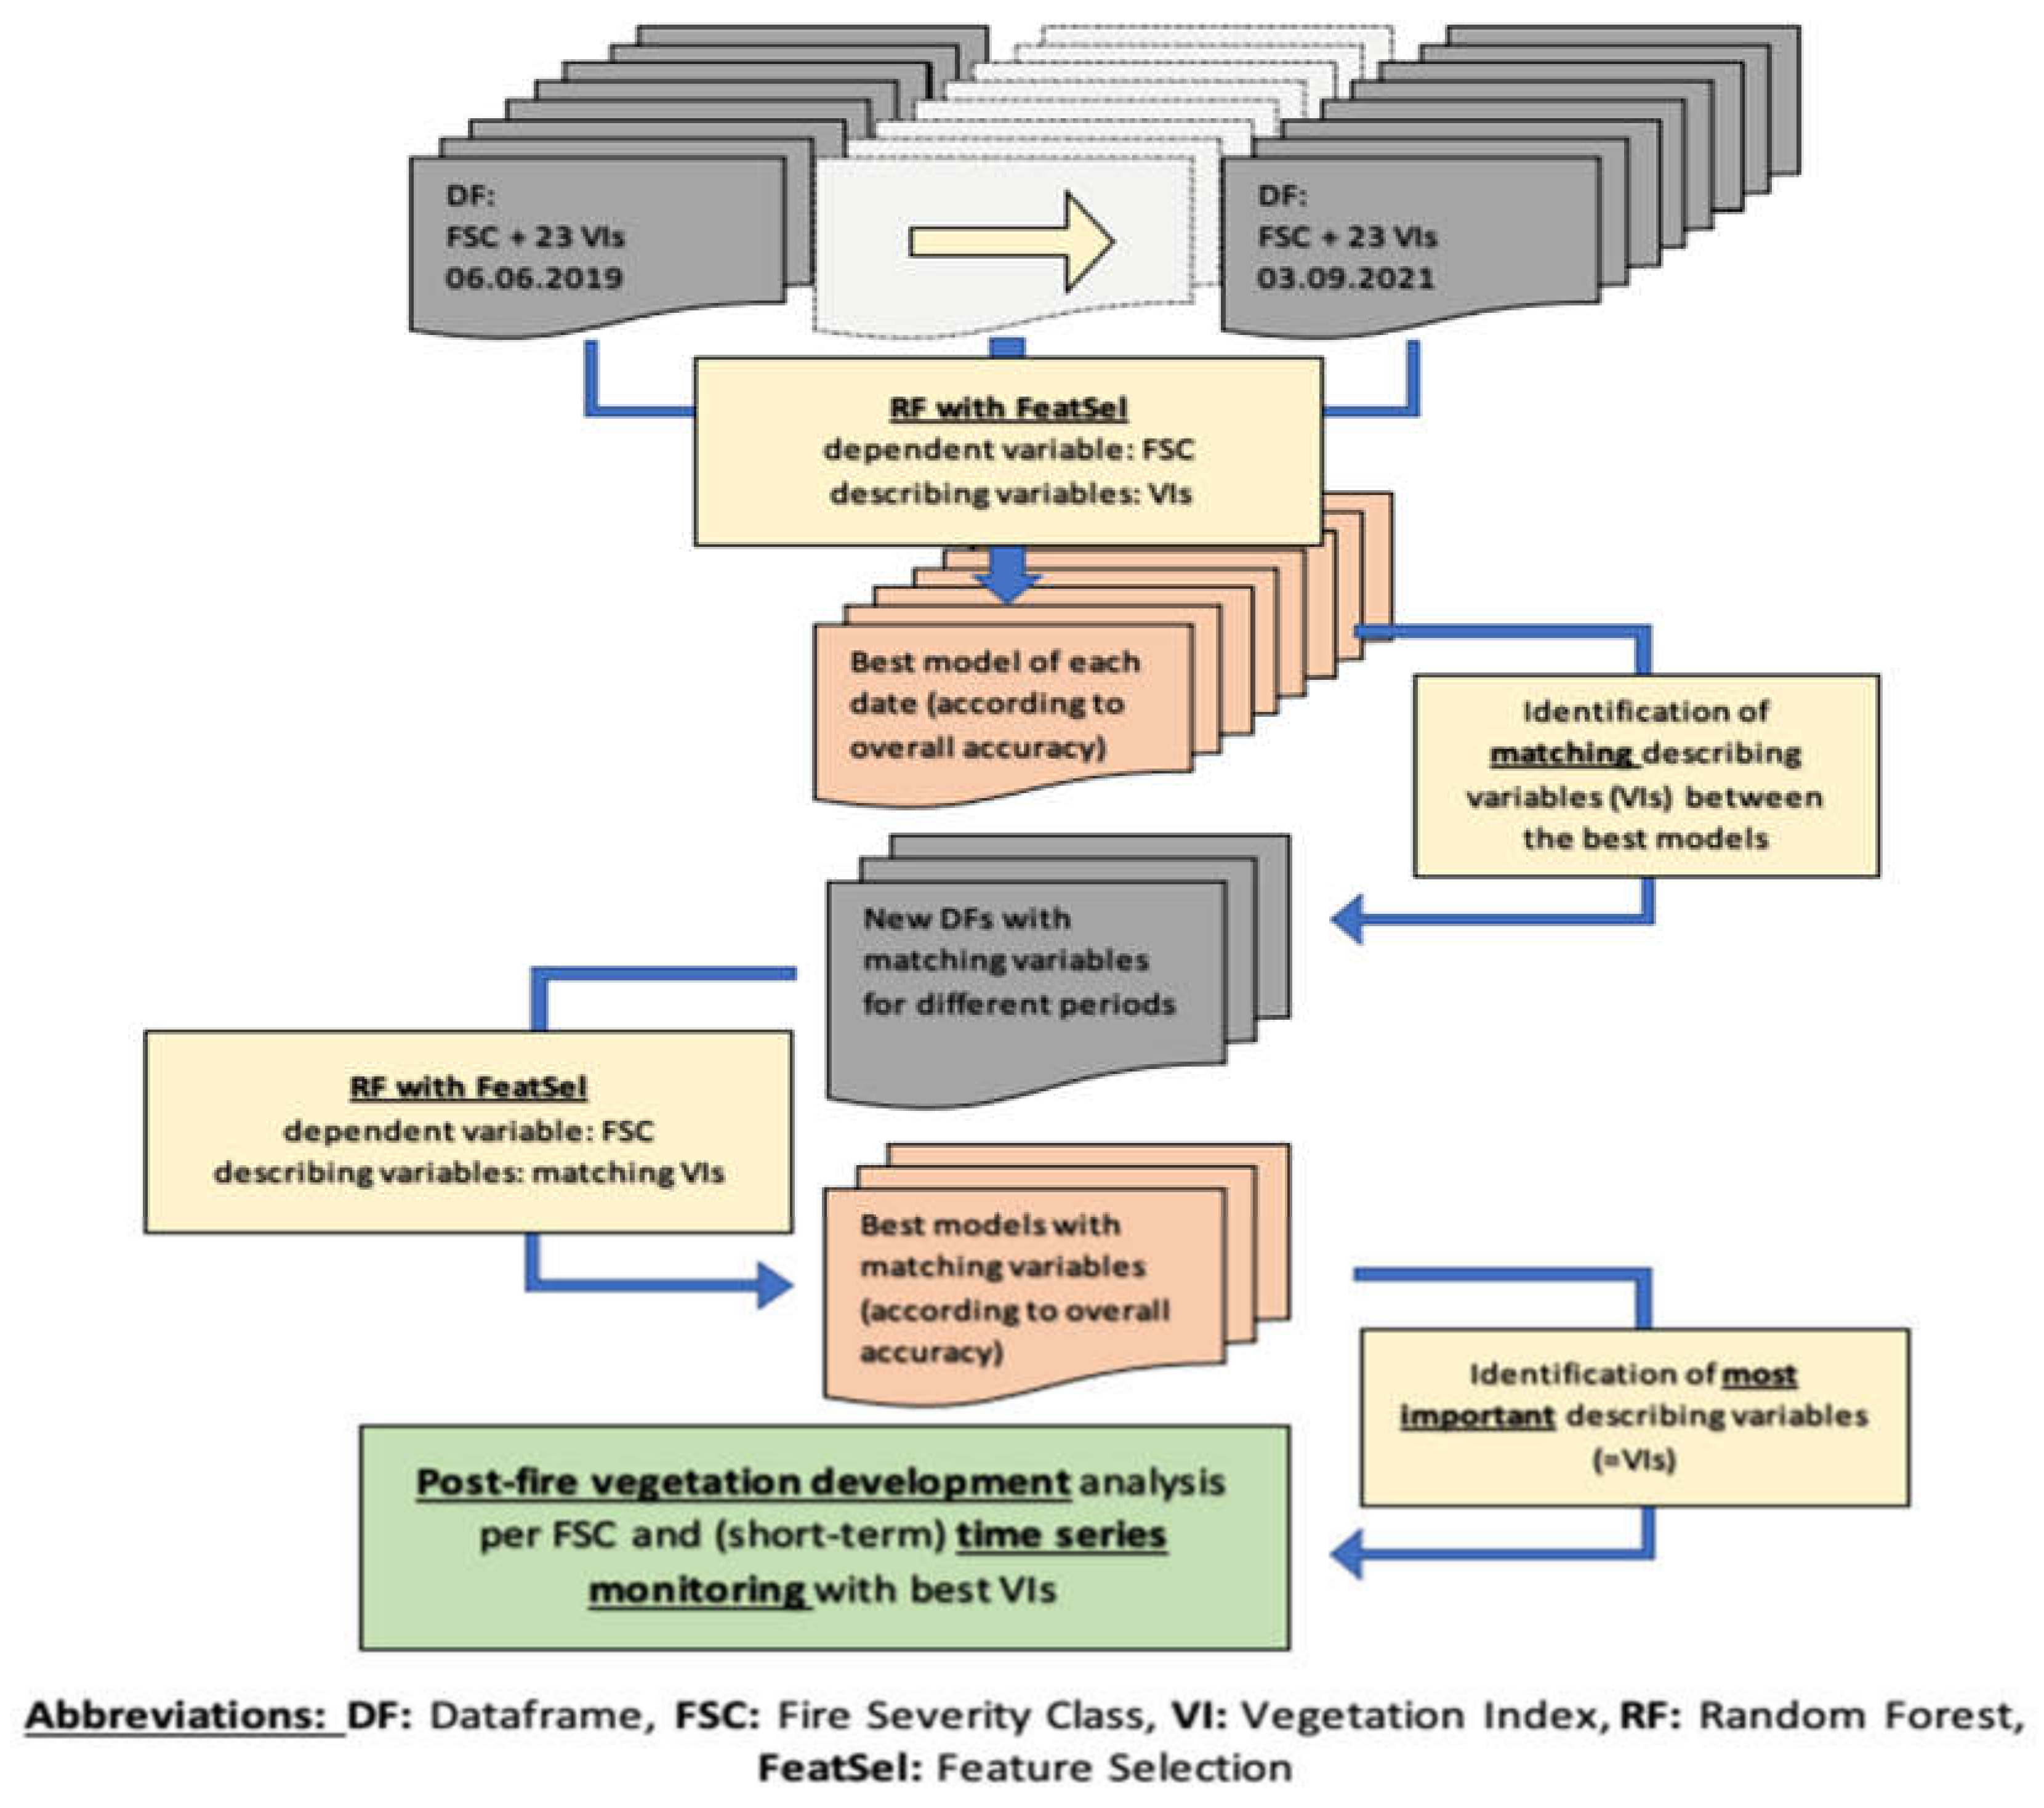
2.2.2. Identification of the Best VIs for the Monitoring of Vegetation Recovery in Different Fire Severity Classes
2.2.3. Analysis of Vegetation Recovery in Different Fire Severity Classes
3. Results
3.1. Elaboration of the Fire Severity
3.2. Identification of the Best VIs for Post-Fire Monitoring in the Temperate Andes
3.3. Analysis of the Vegetation Recovery in Different Fire Severity Classes
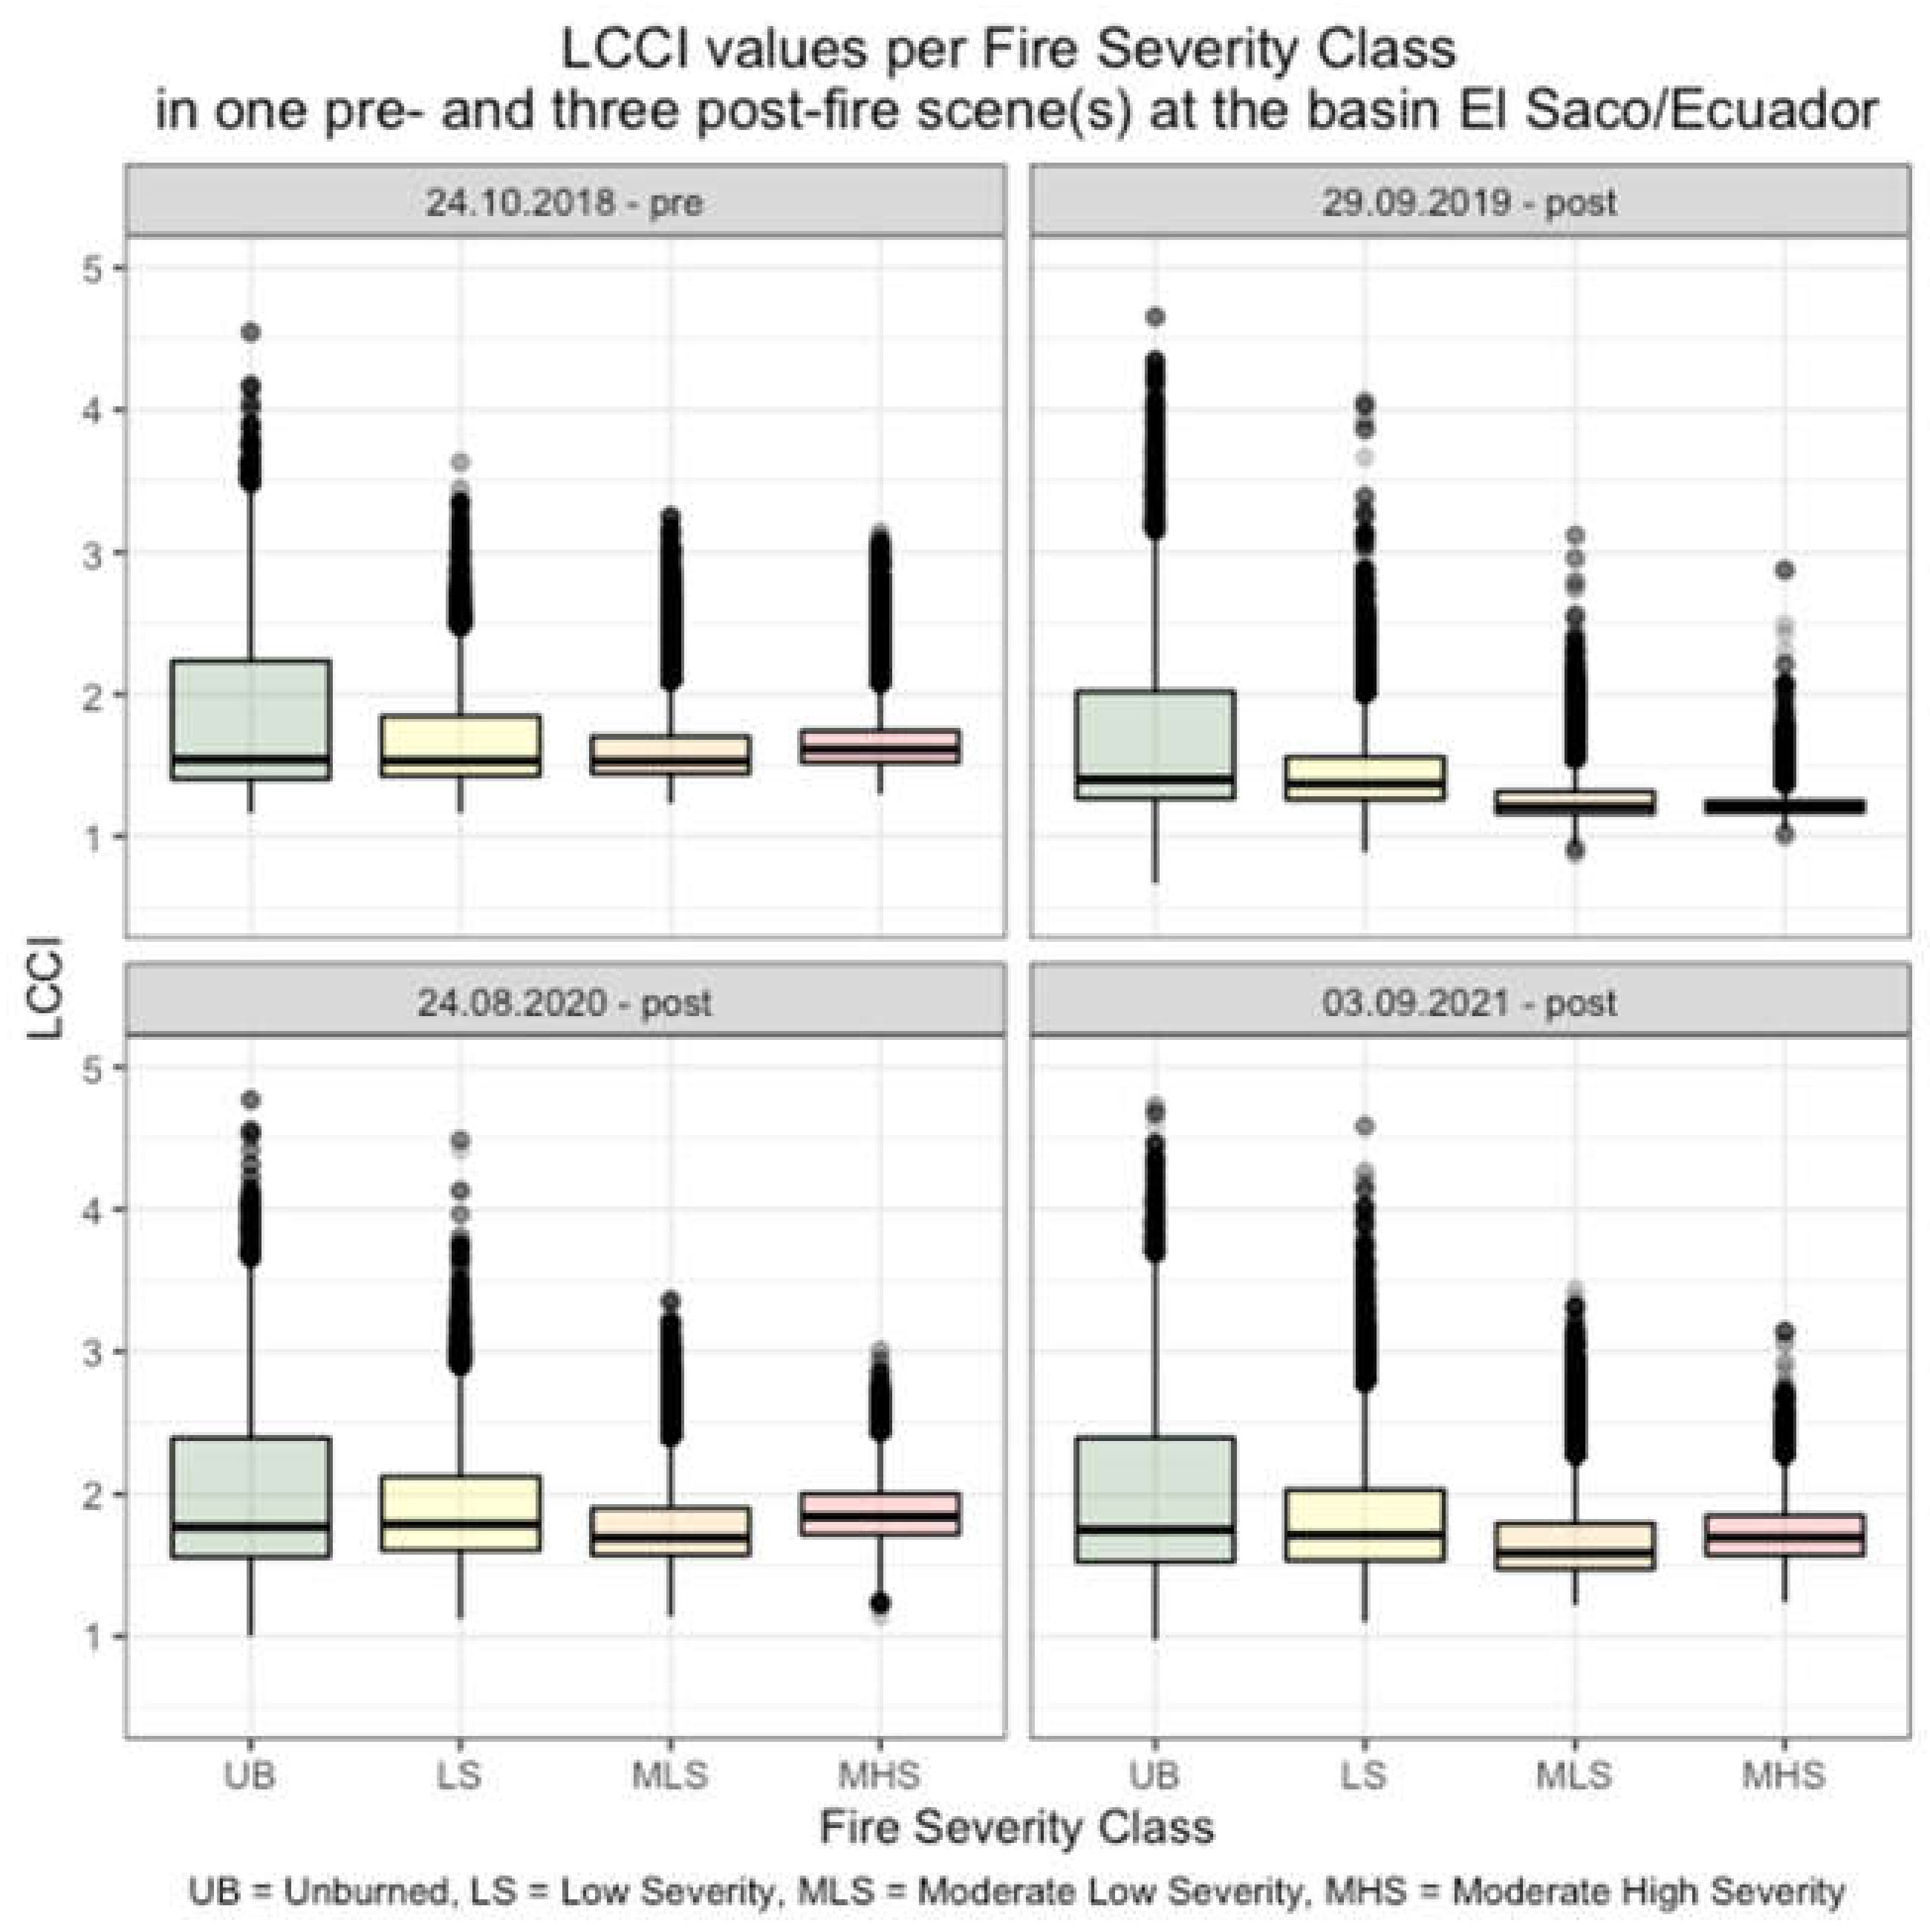
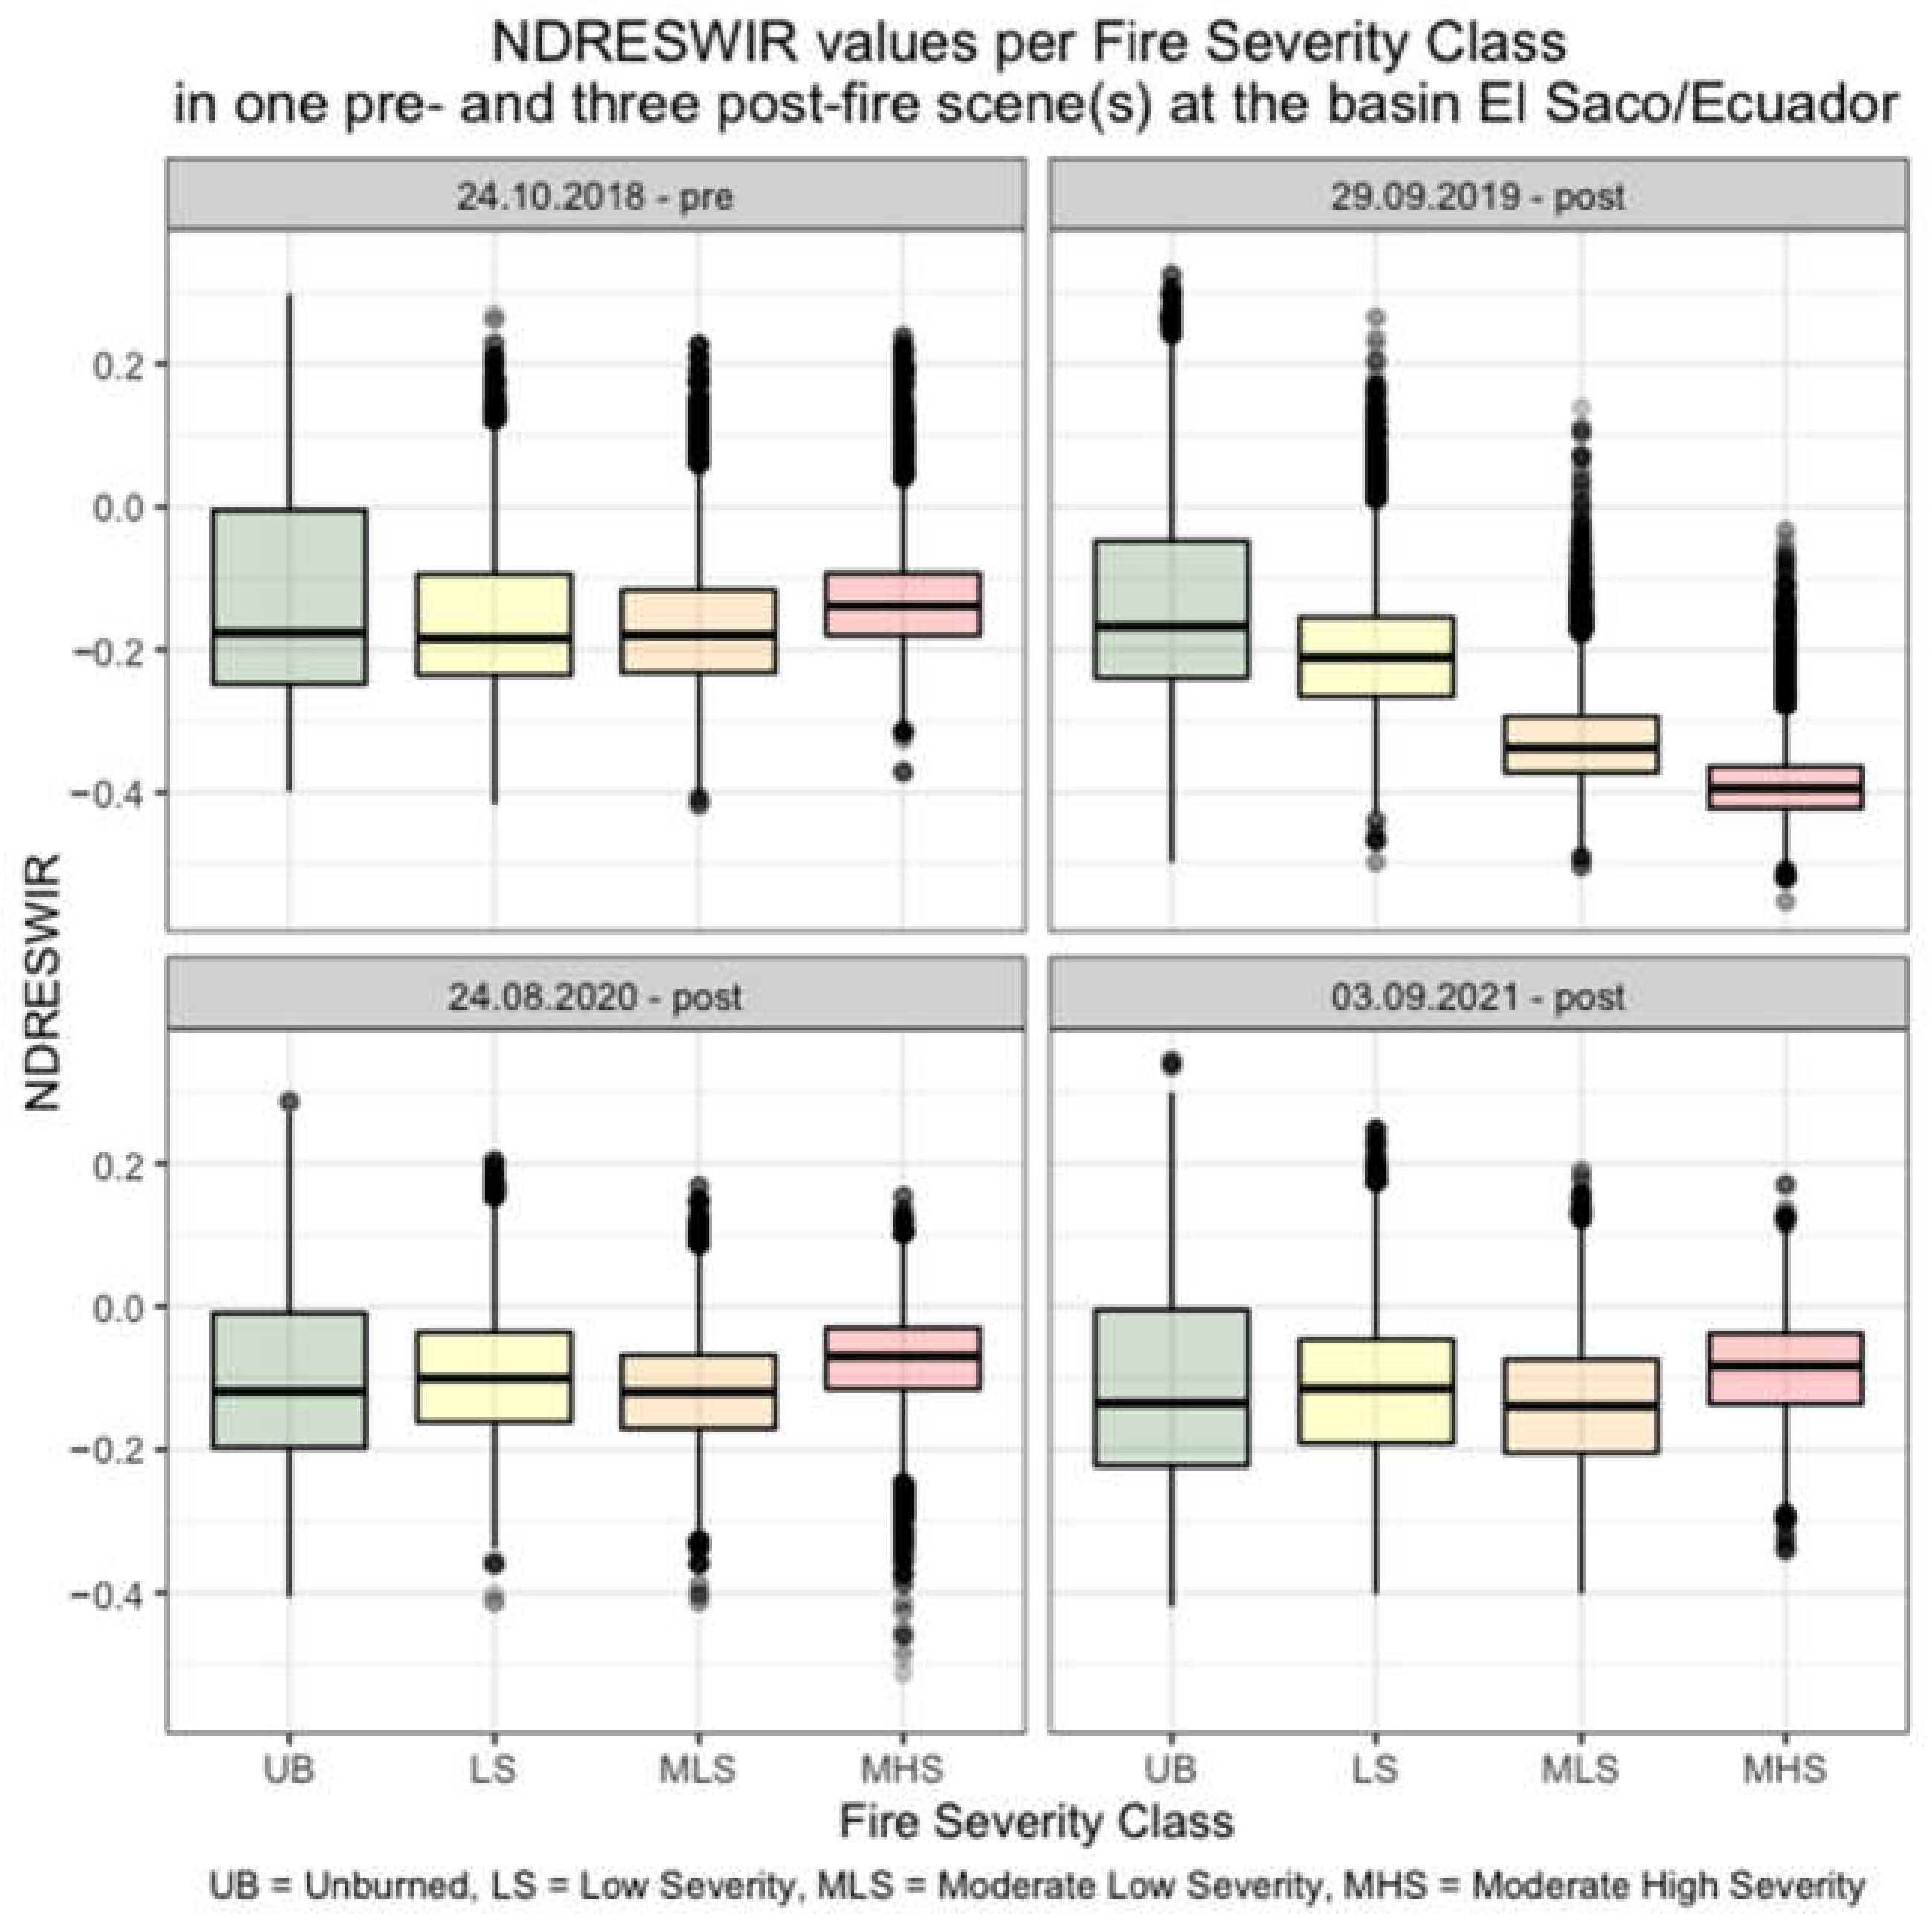
3.3.1. LCCI and NDRESWIR in One Pre- and Three Post-Fire Scenes
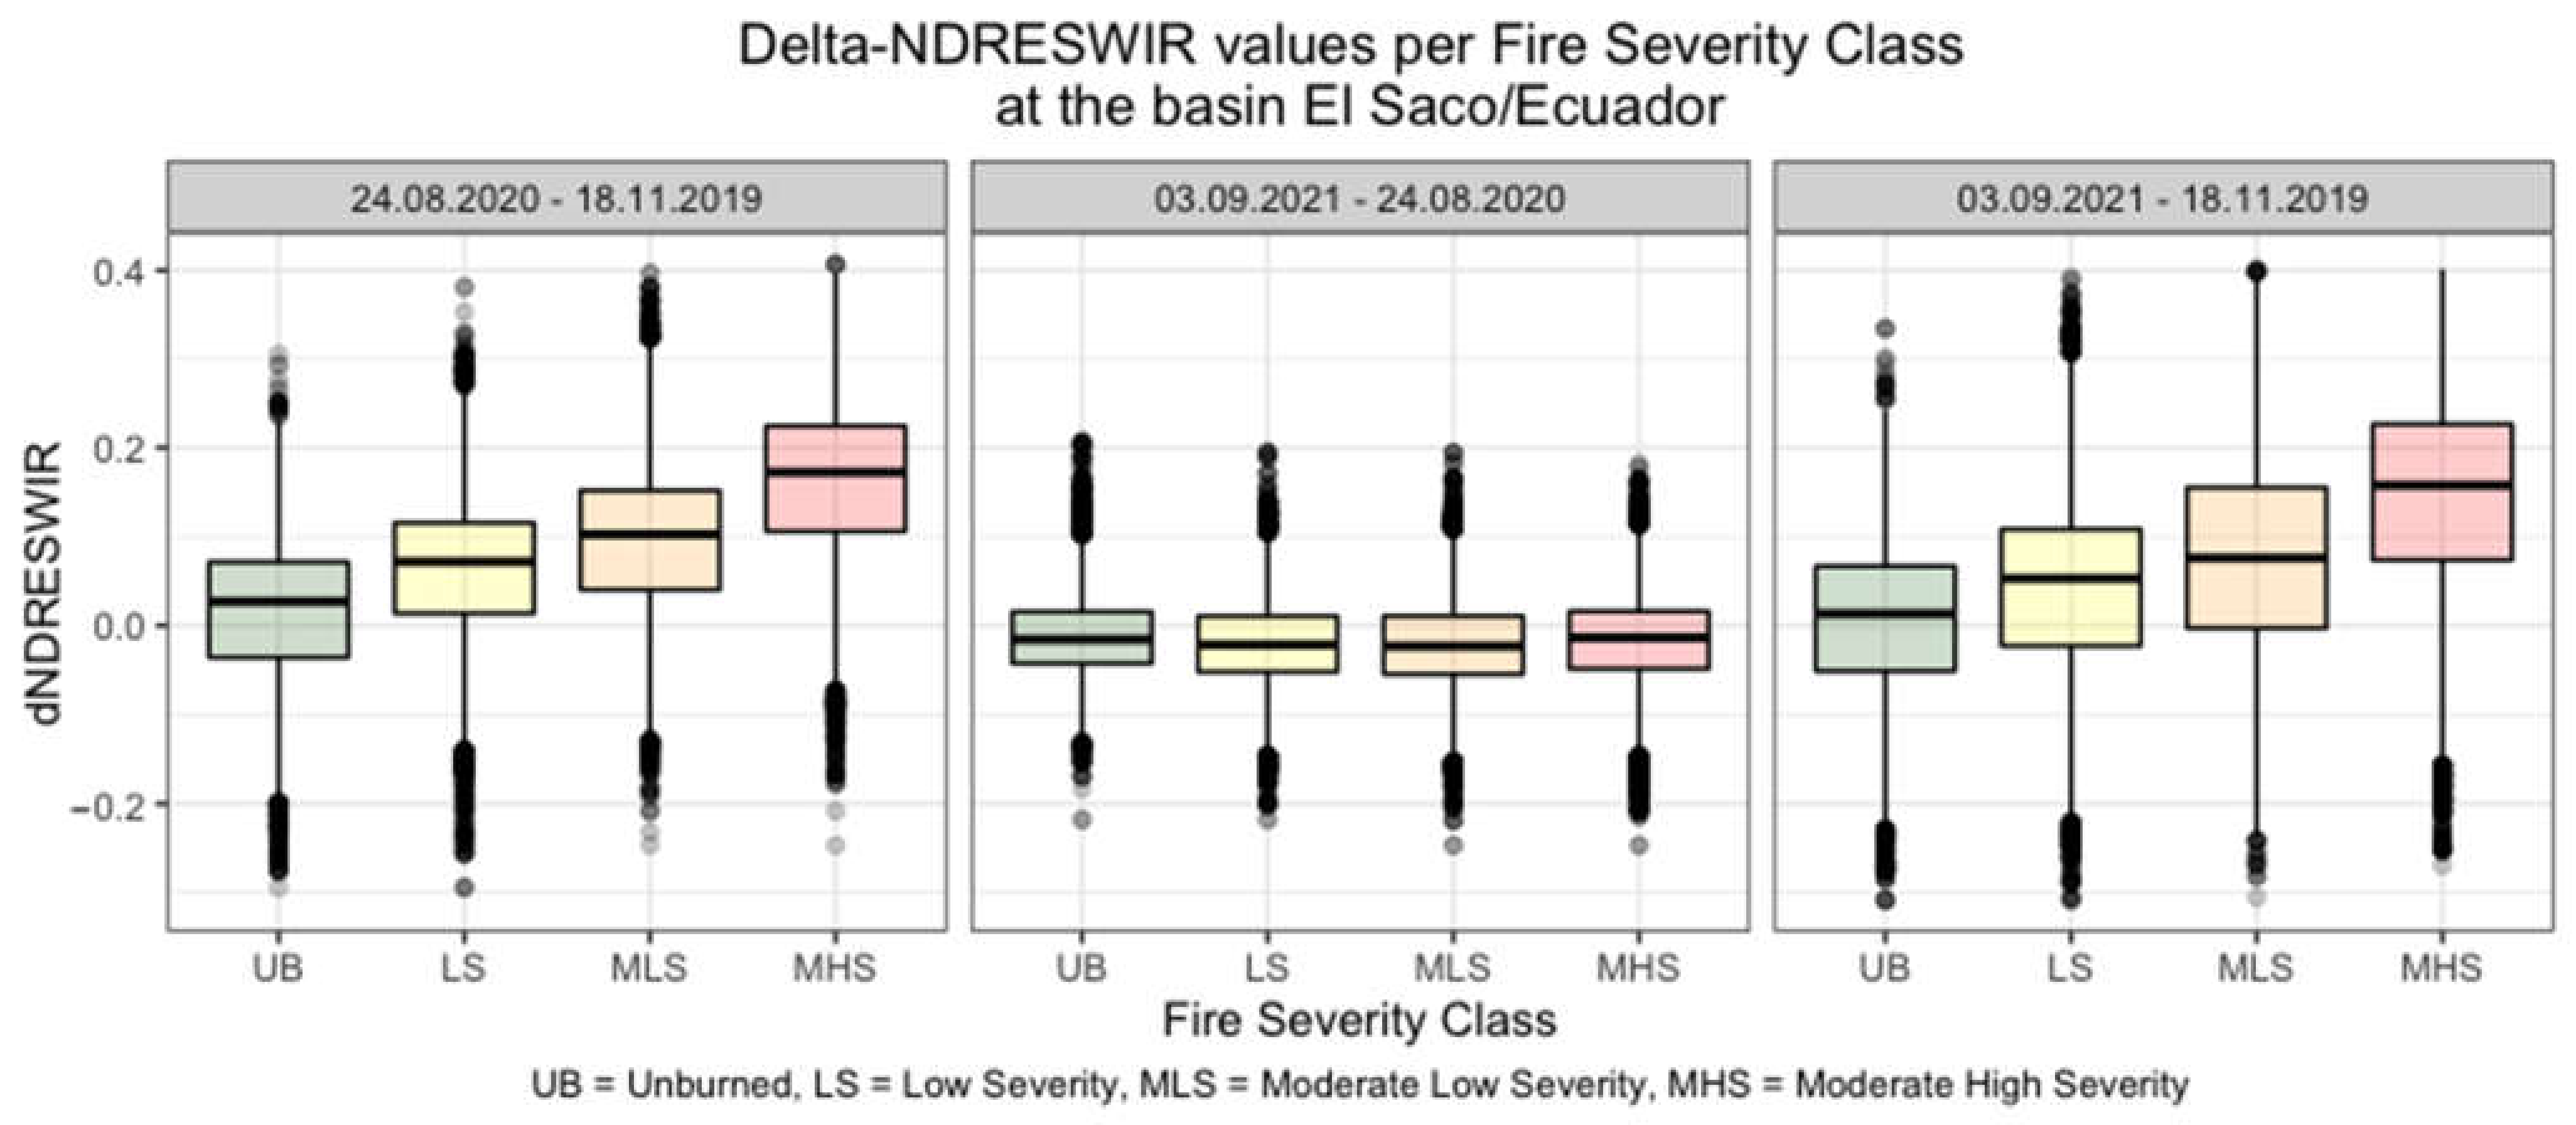
3.3.2. Development of the LCCI and the NDRESWIR in the First Two Post-Fire Years
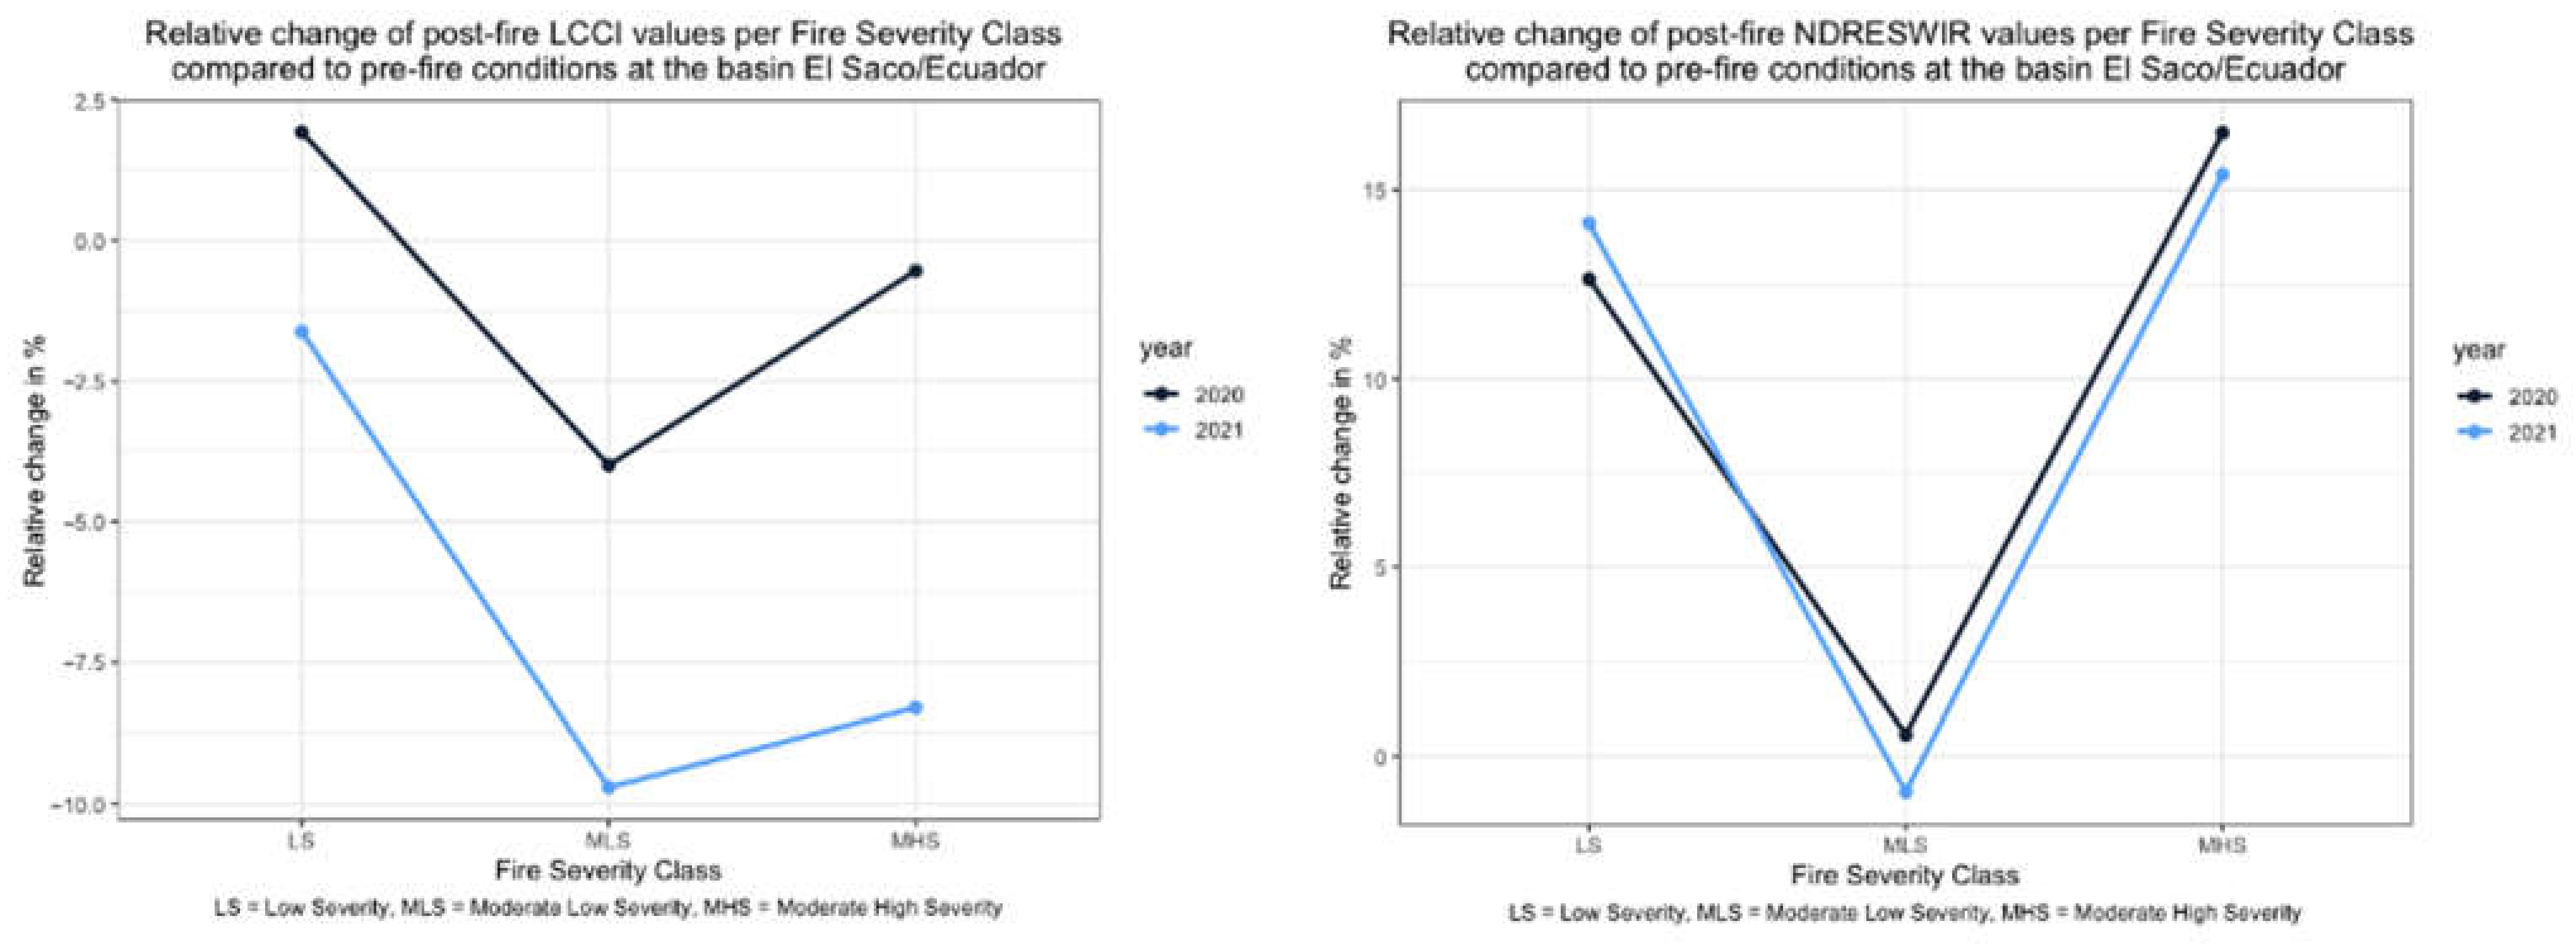
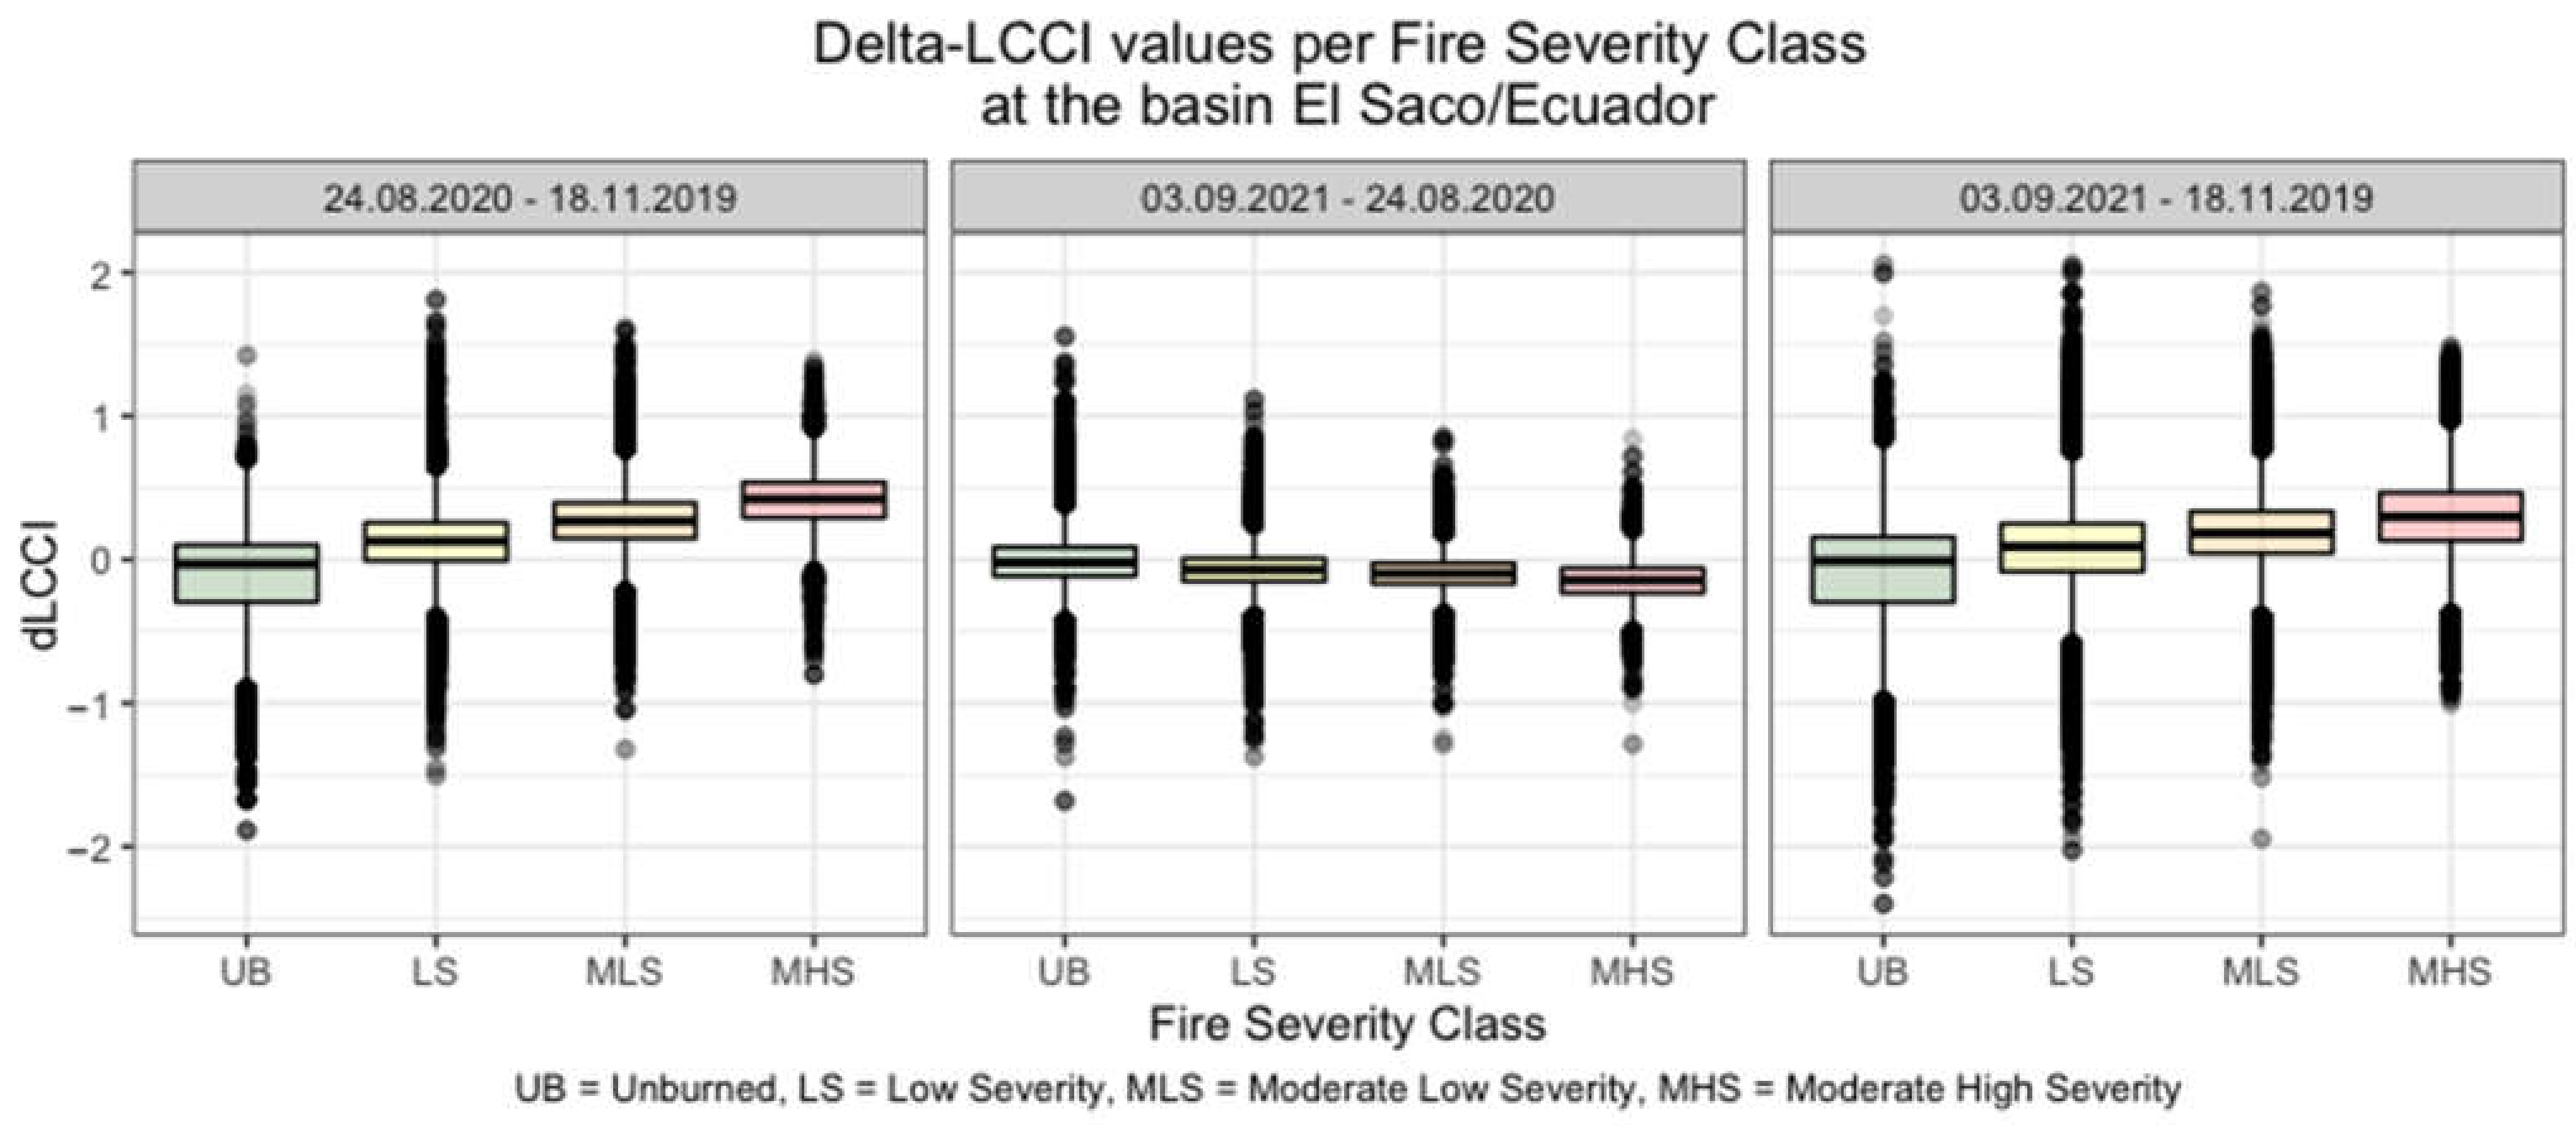
3.3.3. Relative Post-Fire Development of LCCI and NDRESWIR Per Fire Severity Class
4. Discussion
5. Conclusions
Author Contributions
Funding
Informed Consent Statement
Data Availability Statement
Acknowledgments
Conflicts of Interest
Appendix A

| Nr. | Name | Formula | Source |
|---|---|---|---|
| 1 | Built-up Area Index (BAI) | [50] | |
| 2 | Chlorophyll Green index (CGI) | [63] | |
| 3 | Global Environmental Monitoring Index (GEMI) | [64] | |
| 4 | Greenness Index (GI) | [65] | |
| 5 | Green Normalized Difference Vegetation Index (gNDVI) | [66] | |
| 6 | Leaf Chlorophyll Content Index (LCCI) | [67] | |
| 7 | Normalized Difference Red-Edge and SWIR2 (NDRESWIR) | [68] | |
| 8 | Normalized Difference Vegetation Index (NDVI) | [69] | |
| 9 | Red-Edge Normalized Difference Vegetation Index (reNDVI) | [66] | |
| 10 | Normalized Burn Ratio (NBR) | [13,15] | |
| 11 | Red-Edge Peak Area (REPA) | [68,70] | |
| 12 | Red-Edge Triangular Vegetation Index (RETVI) | [71] | |
| 13 | Soil Adjusted Vegetation Index (SAVI) | [17] | |
| 14 | Blue and RE1 ratio (SRBRE1) | [65] | |
| 15 | Blue and RE2 ratio (SRBRE2) | [72] | |
| 16 | Blue and RE3 ratio (SRBRE3) | [68] | |
| 17 | NIR and Blue ratio (SRNIRB) | [73] | |
| 18 | NIR and Green ratio (SRNIRG) | [65] | |
| 19 | NIR and Red ratio (SRNIRR) | [73] | |
| 20 | NIR and RE1 ratio (SRNIRRE1) | [63] | |
| 21 | NIR and RE2 ratio (SRNIRRE2) | [68] | |
| 22 | NIR and RE3 ratio (SRNIRRE3) | [68] | |
| 23 | Water Body Index (WBI) | [74] |
| LCCI | ||||||||
|---|---|---|---|---|---|---|---|---|
| Min | Median | Mean | Max | Standard Deviation | Skewness | Kurtosis | ||
| 24.October 2018 | UB | 1.165 | 1.540 | 1.860 | 4.546 | 0.615 | 1.210 | 3.437 |
| LS | 1.165 | 1.531 | 1.684 | 3.629 | 0.365 | 1.463 | 4.642 | |
| MLS | 1.232 | 1.527 | 1.613 | 3.257 | 0.262 | 1.938 | 7.757 | |
| MHS | 1.298 | 1.612 | 1.672 | 3.141 | 0.245 | 2.283 | 10.032 | |
| 29.September 2019 | UB | 0.668 | 1.400 | 1.700 | 5.244 | 0.650 | 1.434 | 4.641 |
| LS | 0.887 | 1.369 | 1.456 | 4.072 | 0.314 | 1.761 | 7.854 | |
| MLS | 0.867 | 1.207 | 1.261 | 3.124 | 0.157 | 2.306 | 12.066 | |
| MHS | 0.993 | 1.199 | 1.225 | 2.876 | 0.103 | 3.809 | 33.201 | |
| 24.August 2020 | UB | 1.002 | 1.769 | 2.024 | 5.751 | 0.623 | 1.228 | 4.058 |
| LS | 1.124 | 1.788 | 1.911 | 4.487 | 0.425 | 1.228 | 4.377 | |
| MLS | 1.141 | 1.693 | 1.774 | 3.369 | 0.292 | 1.392 | 5.250 | |
| MHS | 1.141 | 1.843 | 1.880 | 3.007 | 0.230 | 0.840 | 3.953 | |
| 3.September 2021 | UB | 0.978 | 1.749 | 2.024 | 6.069 | 0.674 | 1.283 | 4.184 |
| LS | 1.100 | 1.714 | 1.841 | 4.585 | 0.435 | 1.454 | 5.423 | |
| MLS | 1.222 | 1.586 | 1.678 | 3.437 | 0.290 | 1.613 | 5.920 | |
| MHS | 1.240 | 1.697 | 1.733 | 3.140 | 0.216 | 1.129 | 5.065 | |
| NDRESWIR | ||||||||
|---|---|---|---|---|---|---|---|---|
| Min | Median | Mean | Max | Standard Deviation | Skewness | Kurtosis | ||
| 24 October 2018 | UB | −0.398 | −0.177 | −0.125 | 0.298 | 0.153 | 0.663 | 2.267 |
| LS | −0.417 | −0.185 | −0.158 | 0.271 | 0.112 | 0.760 | 3.008 | |
| MLS | −0.417 | −0.180 | −0.168 | 0.227 | 0.088 | 0.760 | 3.687 | |
| MHS | −0.373 | −0.138 | −0.132 | 0.238 | 0.078 | 0.975 | 5.448 | |
| 29 September 2019 | UB | −0.498 | −0.168 | −0.134 | 0.325 | 0.141 | 0.807 | 2.969 |
| LS | −0.498 | −0.211 | −0.204 | 0.265 | 0.090 | 0.643 | 3.880 | |
| MLS | −0.504 | −0.338 | −0.327 | 0.139 | 0.066 | 1.101 | 5.119 | |
| MHS | −0.553 | −0.394 | −0.389 | −0.033 | 0.054 | 1.329 | 7.360 | |
| 24 August 2020 | UB | −0.406 | −0.119 | −0.098 | 0.287 | 0.126 | 0.459 | 2.479 |
| LS | −0.413 | −0.101 | −0.097 | 0.205 | 0.093 | 0.204 | 2.763 | |
| MLS | −0.413 | −0.120 | −0.118 | 0.168 | 0.075 | 0.179 | 2.899 | |
| MHS | −0.513 | −0.070 | −0.075 | 0.154 | 0.071 | −0.548 | 4.371 | |
| 3 September 2021 | UB | −0.419 | −0.135 | −0.105 | 0.344 | 0.147 | 0.576 | 2.491 |
| LS | −0.402 | −0.115 | −0.115 | 0.248 | 0.111 | 0.190 | 2.815 | |
| MLS | −0.401 | −0.139 | −0.137 | 0.190 | 0.092 | 0.194 | 2.683 | |
| MHS | −0.344 | −0.084 | −0.087 | 0.170 | 0.072 | −0.139 | 2.909 | |
References
- Giglio, L.; Randerson, J.T.; van der Werf, G.R. Analysis of Daily, Monthly, and Annual Burned Area Using the Fourth-Generation Global Fire Emissions Database (GFED4). J. Geophys. Res. Biogeosci. 2013, 118, 317–328. [Google Scholar] [CrossRef] [Green Version]
- Andela, N.; Morton, D.C.; Giglio, L.; Paugam, R.; Chen, Y.; Hantson, S.; van der Werf, G.R.; Randerson, J.T. The Global Fire Atlas of Individual Fire Size, Duration, Speed and Direction. Earth Syst. Sci. Data 2019, 11, 529–552. [Google Scholar] [CrossRef] [Green Version]
- van der Werf, G.R.; Randerson, J.T.; Giglio, L.; van Leeuwen, T.T.; Chen, Y.; Rogers, B.M.; Mu, M.; van Marle, M.J.E.; Morton, D.C.; Collatz, G.J.; et al. Global Fire Emissions Estimates during 1997–2016. Earth Syst. Sci. Data 2017, 9, 697–720. [Google Scholar] [CrossRef] [Green Version]
- NASA’s Jet Propulsion Laboratory Satellite Data Record Shows Climate Change’s Impact on Fires. Available online: https://climate.nasa.gov/news/2912/satellite-data-record-shows-climate-changes-impact-on-fires/ (accessed on 30 September 2021).
- Scheper, A.C.; Verweij, P.A.; van Kuijk, M. Post-Fire Forest Restoration in the Humid Tropics: A Synthesis of Available Strategies and Knowledge Gaps for Effective Restoration. Sci. Total Environ. 2021, 771, 144647. [Google Scholar] [CrossRef]
- Rodrigues, M.; Ibarra, P.; Echeverría, M.; Pérez-Cabello, F.; de la Riva, J. A Method for Regional-Scale Assessment of Vegetation Recovery Time after High-Severity Wildfires: Case Study of Spain. Prog. Phys. Geogr. 2014, 38, 556–575. [Google Scholar] [CrossRef]
- Shive, K.L.; Sieg, C.H.; Fulé, P.Z. Pre-Wildfire Management Treatments Interact with Fire Severity to Have Lasting Effects on Post-Wildfire Vegetation Response. For. Ecol. Manag. 2013, 297, 75–83. [Google Scholar] [CrossRef]
- van Leeuwen, W.J.D. Monitoring the Effects of Forest Restoration Treatments on Post-Fire Vegetation Recovery with MODIS Multitemporal Data. Sensors 2008, 8, 2017–2042. [Google Scholar] [CrossRef] [Green Version]
- European Space Agency. European Union Copernicus Open Access Hub. Available online: https://scihub.copernicus.eu/twiki/do/view/SciHubWebPortal/TermsConditions (accessed on 30 September 2021).
- Maia, P.; Pausas, J.G.; Arcenegui, V.; Guerrero, C.; Pérez-Bejarano, A.; Mataix-Solera, J.; Varela, M.E.T.; Fernandes, I.; Pedrosa, E.T.; Keizer, J.J. Wildfire Effects on the Soil Seed Bank of a Maritime Pine Stand—The Importance of Fire Severity. Geoderma 2012, 191, 80–88. [Google Scholar] [CrossRef]
- Davies, R.J.P.; Whalen, M.A.; Mackay, D.A.; Taylor, D.; Pisanu, P. Does Soil Seed Bank Diversity Limit Post-Fire Regeneration in Small, Fragmented, Long-Unburnt Remnants of Fire Adapted Vegetation? Biol. Conserv. 2013, 158, 287–295. [Google Scholar] [CrossRef]
- Vallejo, V.R.; Arianoutsou, M.; Moreira, F. Fire Ecology and Post-Fire Restoration Approaches in Southern European Forest Types. In Post-Fire Management and Restoration of Southern European Forests; Moreira, F., Arianoutsou, M., Corona, P., de las Heras, J., Eds.; Springer: Dordrecht, The Netherlands, 2012; Volume 24, pp. 93–119. ISBN 978-94-007-2207-1. [Google Scholar]
- Key, C.H.; Benson, N.C. Landscape Assessment (LA) Sampling and Analysis Methods. In FIREMON: Fire Effects Monitoring and Inventory System; Lutes, D.C., Keane, R.E., Caratti, J.F., Key, C.H., Benson, N.C., Sutherland, S., Gangi, L.J., Eds.; Rocky Mountain Research Station, U.S. Department of Agriculture, Forest Service: Fort Collins, CO, USA, 2006; pp. LA 1–LA 55. [Google Scholar]
- Parks, S.A.; Dillon, G.K.; Miller, C. A New Metric for Quantifying Burn Severity: The Relativized Burn Ratio. Remote Sens. 2014, 6, 1827–1844. [Google Scholar] [CrossRef]
- RUS Copernicus Burned Area Mapping with Sentinel-2 Using SNAP. Available online: https://rus-copernicus.eu/portal/wp-content/uploads/library/education/training/HAZA02_BurnedArea_Portugal_Tutorial.pdf (accessed on 4 December 2022).
- Collins, L.; Griffioen, P.; Newell, G.; Mellor, A. The Utility of Random Forests for Wildfire Severity Mapping. Remote Sens. Environ. 2018, 216, 374–384. [Google Scholar] [CrossRef]
- Huete, A.R. A Soil-Adjusted Vegetation Index (SAVI). Remote Sens. Environ. 1988, 25, 295–309. [Google Scholar] [CrossRef]
- Wohlgemuth, T.; Wasem, U.; Hester, C. Waldverjüngung nach Feuer—Konkurrenzstarke Lärche. Bündnerwald 2010, 63, 28–33. [Google Scholar]
- Gemitzi, A.; Koutsias, N. Assessment of Properties of Vegetation Phenology in Fire-Affected Areas from 2000 to 2015 in the Peloponnese, Greece. Remote Sens. Appl. 2021, 23, 100535. [Google Scholar] [CrossRef]
- Francos, M.; Úbeda, X.; Tort, J.; Panareda, J.M.; Cerdà, A. The Role of Forest Fire Severity on Vegetation Recovery after 18 Years. Implications for Forest Management of Quercus suber L. in Iberian Peninsula. Glob. Planet. Chang. 2016, 145, 11–16. [Google Scholar] [CrossRef]
- Vanderhoof, M.K.; Hawbaker, T.J.; Ku, A.; Merriam, K.; Berryman, E.; Cattau, M. Tracking Rates of Postfire Conifer Regeneration vs. Deciduous Vegetation Recovery across the Western United States. Ecol. Appl. 2021, 31, e02237. [Google Scholar] [CrossRef]
- Bright, B.C.; Hudak, A.T.; Kennedy, R.E.; Braaten, J.D.; Henareh Khalyani, A. Examining Post-Fire Vegetation Recovery with Landsat Time Series Analysis in Three Western North American Forest Types. Fire Ecol. 2019, 15, 8. [Google Scholar] [CrossRef] [Green Version]
- Cuevas-González, M.; Gerard, F.; Balzter, H.; Riaño, D. Analysing Forest Recovery after Wildfire Disturbance in Boreal Siberia Using Remotely Sensed Vegetation Indices. Glob. Chang. Biol. 2009, 15, 561–577. [Google Scholar] [CrossRef]
- Tran, B.N.; Tanase, M.A.; Bennett, L.T.; Aponte, C. Evaluation of Spectral Indices for Assessing Fire Severity in Australian Temperate Forests. Remote Sens. 2018, 10, 1680. [Google Scholar] [CrossRef] [Green Version]
- Ramsay, P.M. Giant Rosette Plant Morphology as an Indicator of Recent Fire History in Andean Páramo Grasslands. Ecol. Indic. 2014, 45, 37–44. [Google Scholar] [CrossRef]
- Borrelli, P.; Armenteras, D.; Panagos, P.; Modugno, S.; Schütt, B. The Implications of Fire Management in the Andean Paramo: A Preliminary Assessment Using Satellite Remote Sensing. Remote Sens. 2015, 7, 11061–11082. [Google Scholar] [CrossRef]
- Zomer, M.A.; Ramsay, P.M. Post-fire Changes in Plant Growth Form Composition and Diversity in Andean Páramo Grassland. Appl. Veg. Sci. 2021, 24, e12554. [Google Scholar] [CrossRef]
- Lara, J.G.M.; Mendoza, C.I.Á.; Coronel, L.J.J. Assessment of Fuel Related Data in the Metropolitan District of Quito for Modeling and Simulation of Wildfires, Case Study: Atacazo Hill Wildfire. Granja 2022, 34, 43–59. [Google Scholar] [CrossRef]
- Reyes-Bueno, F.; Loján-Córdova, J. Assessment of Three Machine Learning Techniques with Open-Access Geographic Data for Forest Fire Susceptibility Monitoring—Evidence from Southern Ecuador. Forests 2022, 13, 474. [Google Scholar] [CrossRef]
- Carrión-Paladines, V.; Hinojosa, M.B.; Álvarez, L.J.; Reyes-Bueno, F.; Quezada, L.C.; García-Ruiz, R. Effects of the Severity of Wildfires on Some Physical-Chemical Soil Properties in a Humid Montane Scrublands Ecosystem in Southern Ecuador. Fire 2022, 5, 66. [Google Scholar] [CrossRef]
- Pérez-Cabello, F.; Montorio, R.; Alves, D.B. Remote Sensing Techniques to Assess Post-Fire Vegetation Recovery. Curr. Opin. Environ. Sci. Health 2021, 21, 100251. [Google Scholar] [CrossRef]
- Gobierno Autónomo Descentralizado del Canton Quilanga. Plan de Ordenamiento Territorial Del Cantón Quilanga, Tema: Precipitación. 2014. [Google Scholar]
- Alcaldia del Cantón Quilanga Incendio Forestal en Quilanga. Available online: https://www.facebook.com/fredy.cuevarojas.1/videos/145016750072990/ (accessed on 17 October 2021).
- Keeley, J.E. Fire Intensity, Fire Severity and Burn Severity: A Brief Review and Suggested Usage. Int. J. Wildland Fire 2009, 18, 116–126. [Google Scholar] [CrossRef]
- UN-SPIDER Knowledge Portal Normalized Burn Ratio (NBR). Available online: https://un-spider.org/advisory-support/recommended-practices/recommended-practice-burn-severity/in-detail/normalized-burn-ratio (accessed on 17 October 2021).
- Mpakairi, K.S.; Ndaimani, H.; Kavhu, B. Exploring the Utility of Sentinel-2 MSI Derived Spectral Indices in Mapping Burned Areas in Different Land-Cover Types. Sci. Afr. 2020, 10, e00565. [Google Scholar] [CrossRef]
- Chen, X.; Vogelmann, J.E.; Rollins, M.; Ohlen, D.; Key, C.H.; Yang, L.; Huang, C.; Shi, H. Detecting Post-Fire Burn Severity and Vegetation Recovery Using Multitemporal Remote Sensing Spectral Indices and Field-Collected Composite Burn Index Data in a Ponderosa Pine Forest. Int. J. Remote Sens. 2011, 32, 7905–7927. [Google Scholar] [CrossRef]
- Efthimiou, N.; Psomiadis, E.; Panagos, P. Fire Severity and Soil Erosion Susceptibility Mapping Using Multi-Temporal Earth Observation Data: The Case of Mati Fatal Wildfire in Eastern Attica, Greece. Catena 2020, 187, 104320. [Google Scholar] [CrossRef] [PubMed]
- Hislop, S.; Jones, S.; Soto-Berelov, M.; Skidmore, A.; Haywood, A.; Nguyen, T.H. Using Landsat Spectral Indices in Time-Series to Assess Wildfire Disturbance and Recovery. Remote Sens. 2018, 10, 460. [Google Scholar] [CrossRef]
- Petropoulos, G.P.; Griffiths, H.M.; Kalivas, D.P. Quantifying Spatial and Temporal Vegetation Recovery Dynamics Following a Wildfire Event in a Mediterranean Landscape Using EO Data and GIS. Appl. Geogr. 2014, 50, 120–131. [Google Scholar] [CrossRef] [Green Version]
- Breiman, L. Random Forests. Mach. Learn. 2001, 45, 5–32. [Google Scholar] [CrossRef] [Green Version]
- Immitzer, M.; Neuwirth, M.; Böck, S.; Brenner, H.; Vuolo, F.; Atzberger, C. Optimal Input Features for Tree Species Classification in Central Europe Based on Multi-Temporal Sentinel-2 Data. Remote Sens. 2019, 11, 2599. [Google Scholar] [CrossRef] [Green Version]
- Romo Leon, J.R.; van Leeuwen, W.J.D.; Casady, G.M. Using MODIS-NDVI for the Modeling of Post-Wildfire Vegetation Response as a Function of Environmental Conditions and Pre-Fire Restoration Treatments. Remote Sens. 2012, 4, 598–621. [Google Scholar] [CrossRef] [Green Version]
- Li, M.; Guo, X. Evaluating Post-Fire Vegetation Recovery in North American Mixed Prairie Using Remote Sensing Approaches. Open J. Ecol. 2018, 8, 646–680. [Google Scholar] [CrossRef] [Green Version]
- Hammill, K.A.; Bradstock, R.A. Remote Sensing of Fire Severity in the Blue Mountains: Influence of Vegetation Type and Inferring Fire Intensity. Int. J. Wildland Fire 2006, 15, 213–226. [Google Scholar] [CrossRef]
- Trigg, S.; Flasse, S. An Evaluation of Different Bi-Spectral Spaces for Discriminating Burned Shrub-Savannah. Int. J. Remote Sens. 2001, 22, 2641–2647. [Google Scholar] [CrossRef]
- Qin, Q.; Xu, D.; Hou, L.; Shen, B.; Xin, X. Comparing Vegetation Indices from Sentinel-2 and Landsat 8 under Different Vegetation Gradients Based on a Controlled Grazing Experiment. Ecol. Indic. 2021, 133, 108363. [Google Scholar] [CrossRef]
- Steiner, J.L.; Wetter, J.; Robertson, S.; Teet, S.; Wang, J.; Wu, X.; Zhou, Y.; Brown, D.; Xiao, X. Grassland Wildfires in the Southern Great Plains: Monitoring Ecological Impacts and Recovery. Remote Sens. 2020, 12, 619. [Google Scholar] [CrossRef] [Green Version]
- Liu, J.; Maeda, E.E.; Wang, D.; Heiskanen, J. Sensitivity of Spectral Indices on Burned Area Detection Using Landsat Time Series in Savannas of Southern Burkina Faso. Remote Sens. 2021, 13, 2492. [Google Scholar] [CrossRef]
- Shahi, K.; Shafri, H.Z.M.; Taherzadeh, E.; Mansor, S.; Muniandy, R. A Novel Spectral Index to Automatically Extract Road Networks from WorldView-2 Satellite Imagery. Egypt. J. Remote Sens. Space Sci. 2015, 18, 27–33. [Google Scholar] [CrossRef] [Green Version]
- Alcaras, E.; Costantino, D.; Guastaferro, F.; Parente, C.; Pepe, M. Normalized Burn Ratio Plus (NBR+): A New Index for Sentinel-2 Imagery. Remote Sens. 2022, 14, 1727. [Google Scholar] [CrossRef]
- Liu, S.; Zheng, Y.; Dalponte, M.; Tong, X. A Novel Fire Index-Based Burned Area Change Detection Approach Using Landsat-8 OLI Data. Eur. J. Remote Sens. 2020, 53, 104–112. [Google Scholar] [CrossRef] [Green Version]
- Caon, L.; Vallejo, V.R.; Coen, R.J.; Geissen, V. Effects of Wildfire on Soil Nutrients in Mediterranean Ecosystems. Earth Sci. Rev. 2014, 139, 47–58. [Google Scholar] [CrossRef]
- White, J.D.; Ryan, K.C.; Key, C.C.; Running, S.W. Remote Sensing of Forest Fire Severity and Vegetation Recovery. Int. J. Wildland Fire 1996, 6, 125–136. [Google Scholar] [CrossRef] [Green Version]
- Asrar, G.; Myneni, R.B.; Li, Y.; Kanemasu, E.T. Measuring and Modeling Spectral Characteristics of a Tallgrass Prairie. Remote Sens. Environ. 1989, 27, 143–155. [Google Scholar] [CrossRef]
- Gordon, C.E.; Price, O.F.; Tasker, E.M. Mapping and Exploring Variation in Post-Fire Vegetation Recovery Following Mixed Severity Wildfire Using Airborne LiDAR. Ecol. Appl. 2017, 27, 1618–1632. [Google Scholar] [CrossRef] [PubMed] [Green Version]
- Maxwald, M.; Crocetti, C.; Ferrari, R.; Petrone, A.; Rauch, H.P.; Preti, F. Soil and Water Bioengineering Applications in Central and South America: A Transferability Analysis. Sustainability 2020, 12, 10505. [Google Scholar] [CrossRef]
- Girona-García, A.; Vieira, D.C.S.; Silva, J.; Fernández, C.; Robichaud, P.R.; Keizer, J.J. Effectiveness of Post-Fire Soil Erosion Mitigation Treatments: A Systematic Review and Meta-Analysis. Earth Sci. Rev. 2021, 217, 103611. [Google Scholar] [CrossRef]
- Zaimes, G.N.; Kasapidis, I.; Gkiatas, G.; Pagonis, G.; Savvopoulou, A.; Iakovoglou, V. Targeted Placement of Soil Erosion Prevention Works after Wildfires. IOP Conf Ser Earth Environ Sci 2020, 612, 12050. [Google Scholar] [CrossRef]
- Bandy, D.; Garrity, D.P.; Sánchez, P. EL Problema Mundial de La Agricultura de Tala y Quema. Agroforestería Américas 1994, 1, 14–20. [Google Scholar]
- Armenteras, D.; González, T.M.; Ríos, O.V.; Elizalde, M.C.M.; Oliveras, I. Fire in the Ecosystems of Northern South America: Advances in the Ecology of Tropical Fires in Colombia, Ecuador and Peru. Caldasia 2020, 42, 1–16. [Google Scholar] [CrossRef]
- Copernicus Climate Change Service Fire Weather Index. Available online: https://climate.copernicus.eu/fire-weather-index (accessed on 21 June 2022).
- Datt, B. A New Reflectance Index for Remote Sensing of Chlorophyll Content in Higher Plants: Tests Using Eucalyptus Leaves. J. Plant Physiol. 1999, 154, 30–36. [Google Scholar] [CrossRef]
- Pinty, B.; Verstraete, M.M. GEMI: A Non-Linear Index to Monitor Global Vegetation from Satellites. Vegetatio 1992, 101, 15–20. [Google Scholar] [CrossRef]
- le Maire, G.; François, C.; Dufrêne, E. Towards Universal Broad Leaf Chlorophyll Indices Using PROSPECT Simulated Database and Hyperspectral Reflectance Measurements. Remote Sens. Environ. 2004, 89, 1–28. [Google Scholar] [CrossRef]
- Gitelson, A.A.; Kaufman, Y.J.; Merzlyak, M.N. Use of a Green Channel in Remote Sensing of Global Vegetation from EOS-MODIS. Remote Sens. Environ. 1996, 58, 289–298. [Google Scholar] [CrossRef]
- Wulf, H.; Stuhler, S. Sentinel-2: Land Cover, Preliminary User Feedback on Sentinel-2A Data. In Proceedings of the Sentinel-2A Expert Users Technical Meeting, Frascati, Italy, 29–30 September 2015; pp. 29–30. [Google Scholar]
- Radoux, J.; Chomé, G.; Jacques, D.C.; Waldner, F.; Bellemans, N.; Matton, N.; Lamarche, C.; D’Andrimont, R.; Defourny, P. Sentinel-2’s Potential for Sub-Pixel Landscape Feature Detection. Remote Sens. 2016, 8, 488. [Google Scholar] [CrossRef] [Green Version]
- Tucker, C.J. Red and Photographic Infrared Linear Combinations for Monitoring Vegetation. Remote Sens Environ 1979, 8, 127–150. [Google Scholar] [CrossRef] [Green Version]
- Filella, I.; Peñuelas, J. The Red Edge Position and Shape as Indicators of Plant Chlorophyll Content, Biomass and Hydric Status. Int. J. Remote Sens. 1994, 15, 1459–1470. [Google Scholar] [CrossRef]
- Chen, P.; Tremblay, N.; Wang, J.; Vigneault, P.; Huang, W.; Li, B. New Index for Crop Canopy Fresh Biomass Estimation. Spectrosc. Spectr. Anal. 2010, 30, 512–517. [Google Scholar]
- Lichtenthaler, H.K.; Lang, M.; Sowinska, M.; Heisel, F.; Miehé, J.A. Detection of Vegetation Stress via a New High Resolution Fluorescence Imaging System. J. Plant Physiol. 1996, 148, 599–612. [Google Scholar] [CrossRef]
- Alan Blackburn, G. Quantifying Chlorophylls and Caroteniods at Leaf and Canopy Scales: An Evaluation of Some Hyperspectral Approaches. Remote Sens. Environ. 1998, 66, 273–285. [Google Scholar] [CrossRef]
- Domenech, E.; Mallet, C. Change Detection in High-Resolution Land Use/Land Cover Geodatabases (At Object Level). In European Spatial Data Research; EuroSDR: Vienna, Austria, 2014; Volume 64, pp. 9–57. [Google Scholar]


| Climate Zones in the Province of Loja | |
|---|---|
| Aw | Tropical, savannah |
| BSh | Arid, steppe, hot |
| BWh | Arid, desert, hot |
| Cfb | Temperate, no dry season, warm summer |
| Cfc | Temperate, no dry season, cold summer |
| Csb | Temperate, dry summer, warm summer |
| Cwb | Temperate, dry winter, warm summer |
| ET | Polar, tundra |
| Classification | RBR-Value |
|---|---|
| High regrowth | −0.500 to −0.251 |
| Low regrowth | −0.250 to −0.101 |
| Unburned | −0.100 to 0.099 |
| Low severity | 0.100 to 0.269 |
| Moderate low severity | 0.270 to 0.439 |
| Moderate high severity | 0.440 to 0.659 |
| High severity | 0.660 to 1.300 |
| Nr. | Sentinel-2 Satellite | Date | Sun Zenith Angle | Sun Azimuth Angle |
|---|---|---|---|---|
| 1 | A | 6 June 2019 | 35.06 | 39.19 |
| 2 | B | 31 July 2019 | 33.31 | 47.13 |
| Fire Event | ||||
| 3 | B | 29 September 2019 | 21.12 | 86.18 |
| 4 | B | 18 November 2019 | 24.54 | 129.68 |
| 5 | A | 21 April 2020 | 28.19 | 54.44 |
| 6 | A | 10 June 2020 | 35.50 | 38.95 |
| 7 | B | 24 August 2020 | 28.19 | 57.90 |
| 8 | A | 26 May 2021 | 33.78 | 40.46 |
| 9 | A | 5 July 2021 | 36.06 | 40.83 |
| 10 | A | 3 September 2021 | 25.91 | 63.91 |
| BEST MODELS: Dependent Variable: RBR; Descriptive Variables: 23 Vegetation Indices Classification: Random Forest with Feature Selection | |||||
|---|---|---|---|---|---|
| Scene Nr: | S2 Acquisition Date | n Variables after Feature Selection | Split | Overall Accuracy | Kappa |
| 1 | 6 June 2019 | 4 | 2 | 67.1% | 0.503 |
| 2 | 31 July 2019 | 4 | 2 | 67.5% | 0.508 |
| Fire Event | |||||
| 3 | 29 September 2019 | 12 | 3 | 84.9% | 0.779 |
| 4 | 18 November 2019 | 9 | 3 | 63.7% | 0.444 |
| 5 | 21 April 2020 | 4 | 2 | 67.7% | 0.511 |
| 6 | 10 June 2020 | 6 | 2 | 57.8% | 0.342 |
| 7 | 24 August 2020 | 5 | 2 | 61.4% | 0.408 |
| 8 | 26 May 2021 | 5 | 2 | 63.1% | 0.436 |
| 9 | 5 July 2021 | 5 | 2 | 60.6% | 0.401 |
| 10 | 3 September 2021 | 7 | 2 | 60.0% | 0.383 |
| Result: LCCI, NDRESWIR, REPA were part of every BEST model | |||||
| MODELS: Dependent Variable: RBR; Descriptive Variables: LCCI, NDRESWIR, REPA Classification: Random Forest | ||||||
|---|---|---|---|---|---|---|
| Scene Nr: | S2 Acquisition Date | n Variables | Split | Overall Accuracy | Change in Accuracy Compared to BEST Models | Kappa |
| 1 | 6 June 2019 | 3 | 1 | 75.5% | +8.4% | 0.636 |
| 2 | 31 July 2019 | 3 | 1 | 75.3% | +7.8% | 0.634 |
| Fire Event | ||||||
| 3 | 29 September 2019 | 3 | 1 | 81.3% | −3.6% | 0.725 |
| 4 | 18 November 2019 | 3 | 1 | 76.6% | +12.9% | 0.654 |
| 5 | 21 April 2020 | 3 | 1 | 77.0% | +9.3% | 0.660 |
| 6 | 10 June 2020 | 3 | 1 | 75.0% | +17.2% | 0.628 |
| 7 | 24 August 2020 | 3 | 1 | 76.9% | +15.5% | 0.660 |
| 8 | 26 May 2021 | 3 | 1 | 77.0% | +13.9% | 0.661 |
| 9 | 5 July 2021 | 3 | 1 | 76.4% | +15.8% | 0.651 |
| 10 | 3 September 2021 | 3 | 1 | 77.3% | +17.3% | 0.666 |
| BEST MODELS: Dependent Variable: RBR; Descriptive Variables: LCCI, NDRESWIR, REPA Classification: Random Forest with Feature Selection | ||||||
|---|---|---|---|---|---|---|
| Scene Nr: | Vegetation Indices from Different S2 Scenes | n Variables after Feature Selection | Split | Overall Accuracy | Kappa | 3 Most Influencing Variables According to Mean Decrease Accuracy |
| 5–7 | LCCI, NDRESWIR, REPA 3 SC 2020 | 9 | 3 | 82.4% | 0.744 | LCCI 24 August 2020 NDRESWIR 21 April 2020 LCCI 21 April 2020 |
| 8–10 | LCCI, NDRESWIR, REPA 3 SC 2021 | 9 | 3 | 82.6% | 0.746 | LCCI 03 September 2021 LCCI 26 May 2021 NDRESWIR 3 September 2021 |
| 1 and 4–10 | LCCI, NDRESWIR, REPA 8 SC 2019 to 2021 (no scenes from RBR calculation) | 22 | 4 | 83.5% | 0.760 | NDRESWIR 21 April 2020 LCCI 18 November 2019 LCCI 26 May 2021 |
| 1–10 | LCCI, NDRESWIR, REPA 10 SC 2019 to 2021 (with scenes from RBR calculation) | 11 | 3 | 86.3% | 0.800 | NDRESWIR 31 July 2019 NDRESWIR 29 September 2019 REPA 29 September 2019 |
| Change of LCCI Median with Year and Fire Severity | ||||
|---|---|---|---|---|
| Pre-Fire 24 October 2018 | Post-Fire 29 September 2019 | Post-Fire 24 August 2020 | Post-Fire 3 September 2021 | |
| Unburned | 100.00 PP | −9.09 PP | +14.87 PP | +13.57 PP |
| Low severity | 100.00 PP | −10.58 PP | +16.79 PP | +11.95 PP |
| Moderate low severity | 100.00 PP | −20.96 PP | +10.87 PP | +3.86 PP |
| Moderate high severity | 100.00 PP | −25.62 PP | +14.33 PP | +5.27 PP |
| Change of NDRESWIR Median with Year and Fire Severity | ||||
|---|---|---|---|---|
| Pre-Fire 24 October 2018 | Post-Fire 29 September 2019 | Post-Fire 24 August 2020 | Post-Fire 3 September 2021 | |
| Unburned | 100.00 PP | +5.08 PP | +32.76 PP | +23.72 PP |
| Low severity | 100.00 PP | −14.05 PP | +45.41 PP | +37.84 PP |
| Moderate low severity | 100.00 PP | −87.78 PP | +33.33 PP | +22.78 PP |
| Moderate high severity | 100.00 PP | −185.51 PP | +49.28 PP | +39.13 PP |
| Relativized Change of LCCI Median | |||
|---|---|---|---|
| Post-Fire 29 September 2019 | Post-Fire 24 August 2020 | Post-Fire 3 September 2021 | |
| Unburned | 0.00 PP | 0.00 PP | 0.00 PP |
| Low severity | −1.49 PP | +1.92 PP | −1.62 PP |
| Moderate low severity | −11.87 PP | −4.00 PP | −9.71 PP |
| Moderate high severity | −16.53 PP | −0.54 PP | −8.30 PP |
| Relativized Change of NDRESWIR MEDIAN | |||
|---|---|---|---|
| Post-Fire 29 September 2019 | Post-Fire 24 August 2020 | Post-Fire 3 September 2021 | |
| Unburned | 0.00 PP | 0.00 PP | 0.00 PP |
| Low severity | −19.13 PP | +12.65 PP | +14.12 PP |
| Moderate low severity | −92.86 PP | +0.57 PP | −0.94 PP |
| Moderate high severity | −190.59 PP | +16.52 PP | +15.41 PP |
Publisher’s Note: MDPI stays neutral with regard to jurisdictional claims in published maps and institutional affiliations. |
© 2022 by the authors. Licensee MDPI, Basel, Switzerland. This article is an open access article distributed under the terms and conditions of the Creative Commons Attribution (CC BY) license (https://creativecommons.org/licenses/by/4.0/).
Share and Cite
Maxwald, M.; Immitzer, M.; Rauch, H.P.; Preti, F. Analyzing Fire Severity and Post-Fire Vegetation Recovery in the Temperate Andes Using Earth Observation Data. Fire 2022, 5, 211. https://doi.org/10.3390/fire5060211
Maxwald M, Immitzer M, Rauch HP, Preti F. Analyzing Fire Severity and Post-Fire Vegetation Recovery in the Temperate Andes Using Earth Observation Data. Fire. 2022; 5(6):211. https://doi.org/10.3390/fire5060211
Chicago/Turabian StyleMaxwald, Melanie, Markus Immitzer, Hans Peter Rauch, and Federico Preti. 2022. "Analyzing Fire Severity and Post-Fire Vegetation Recovery in the Temperate Andes Using Earth Observation Data" Fire 5, no. 6: 211. https://doi.org/10.3390/fire5060211
APA StyleMaxwald, M., Immitzer, M., Rauch, H. P., & Preti, F. (2022). Analyzing Fire Severity and Post-Fire Vegetation Recovery in the Temperate Andes Using Earth Observation Data. Fire, 5(6), 211. https://doi.org/10.3390/fire5060211