
Wildfire Risk in the Complex Terrain of the Santa Barbara Wildland–Urban Interface during Extreme Winds

 ,
,  ,
,  ,
,  ,
, 
Abstract
1. Introduction
2. Data and Methods
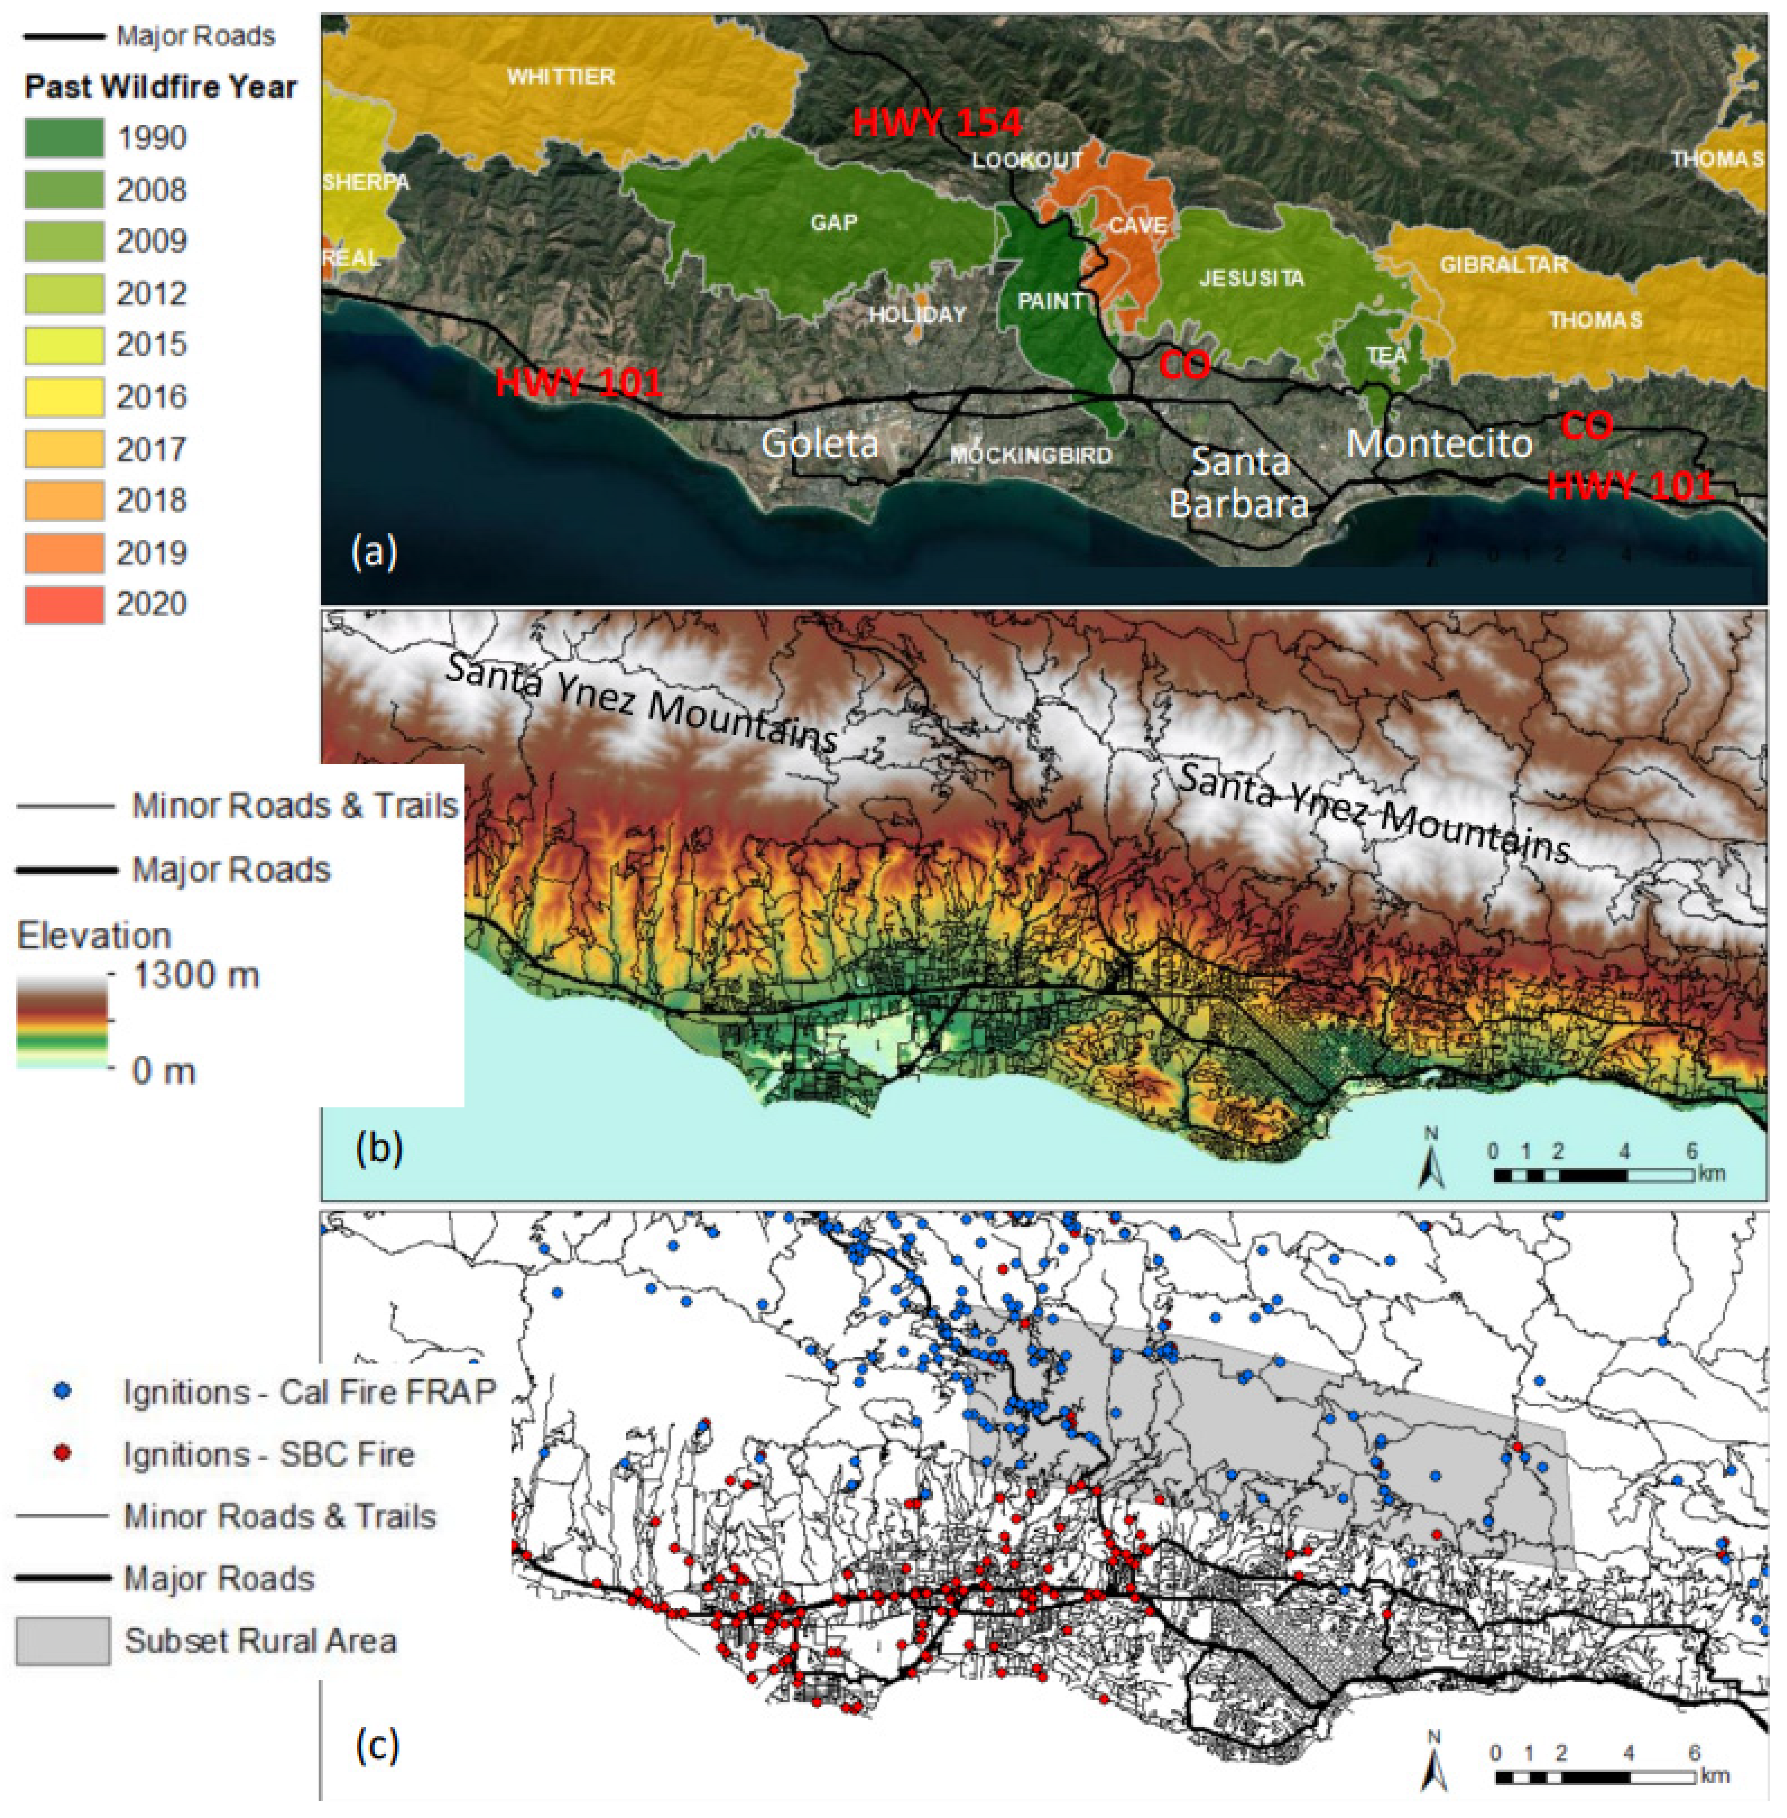
2.1. Study Area
2.2. Road and Trail, Ignition, and Historical Wildfire Data
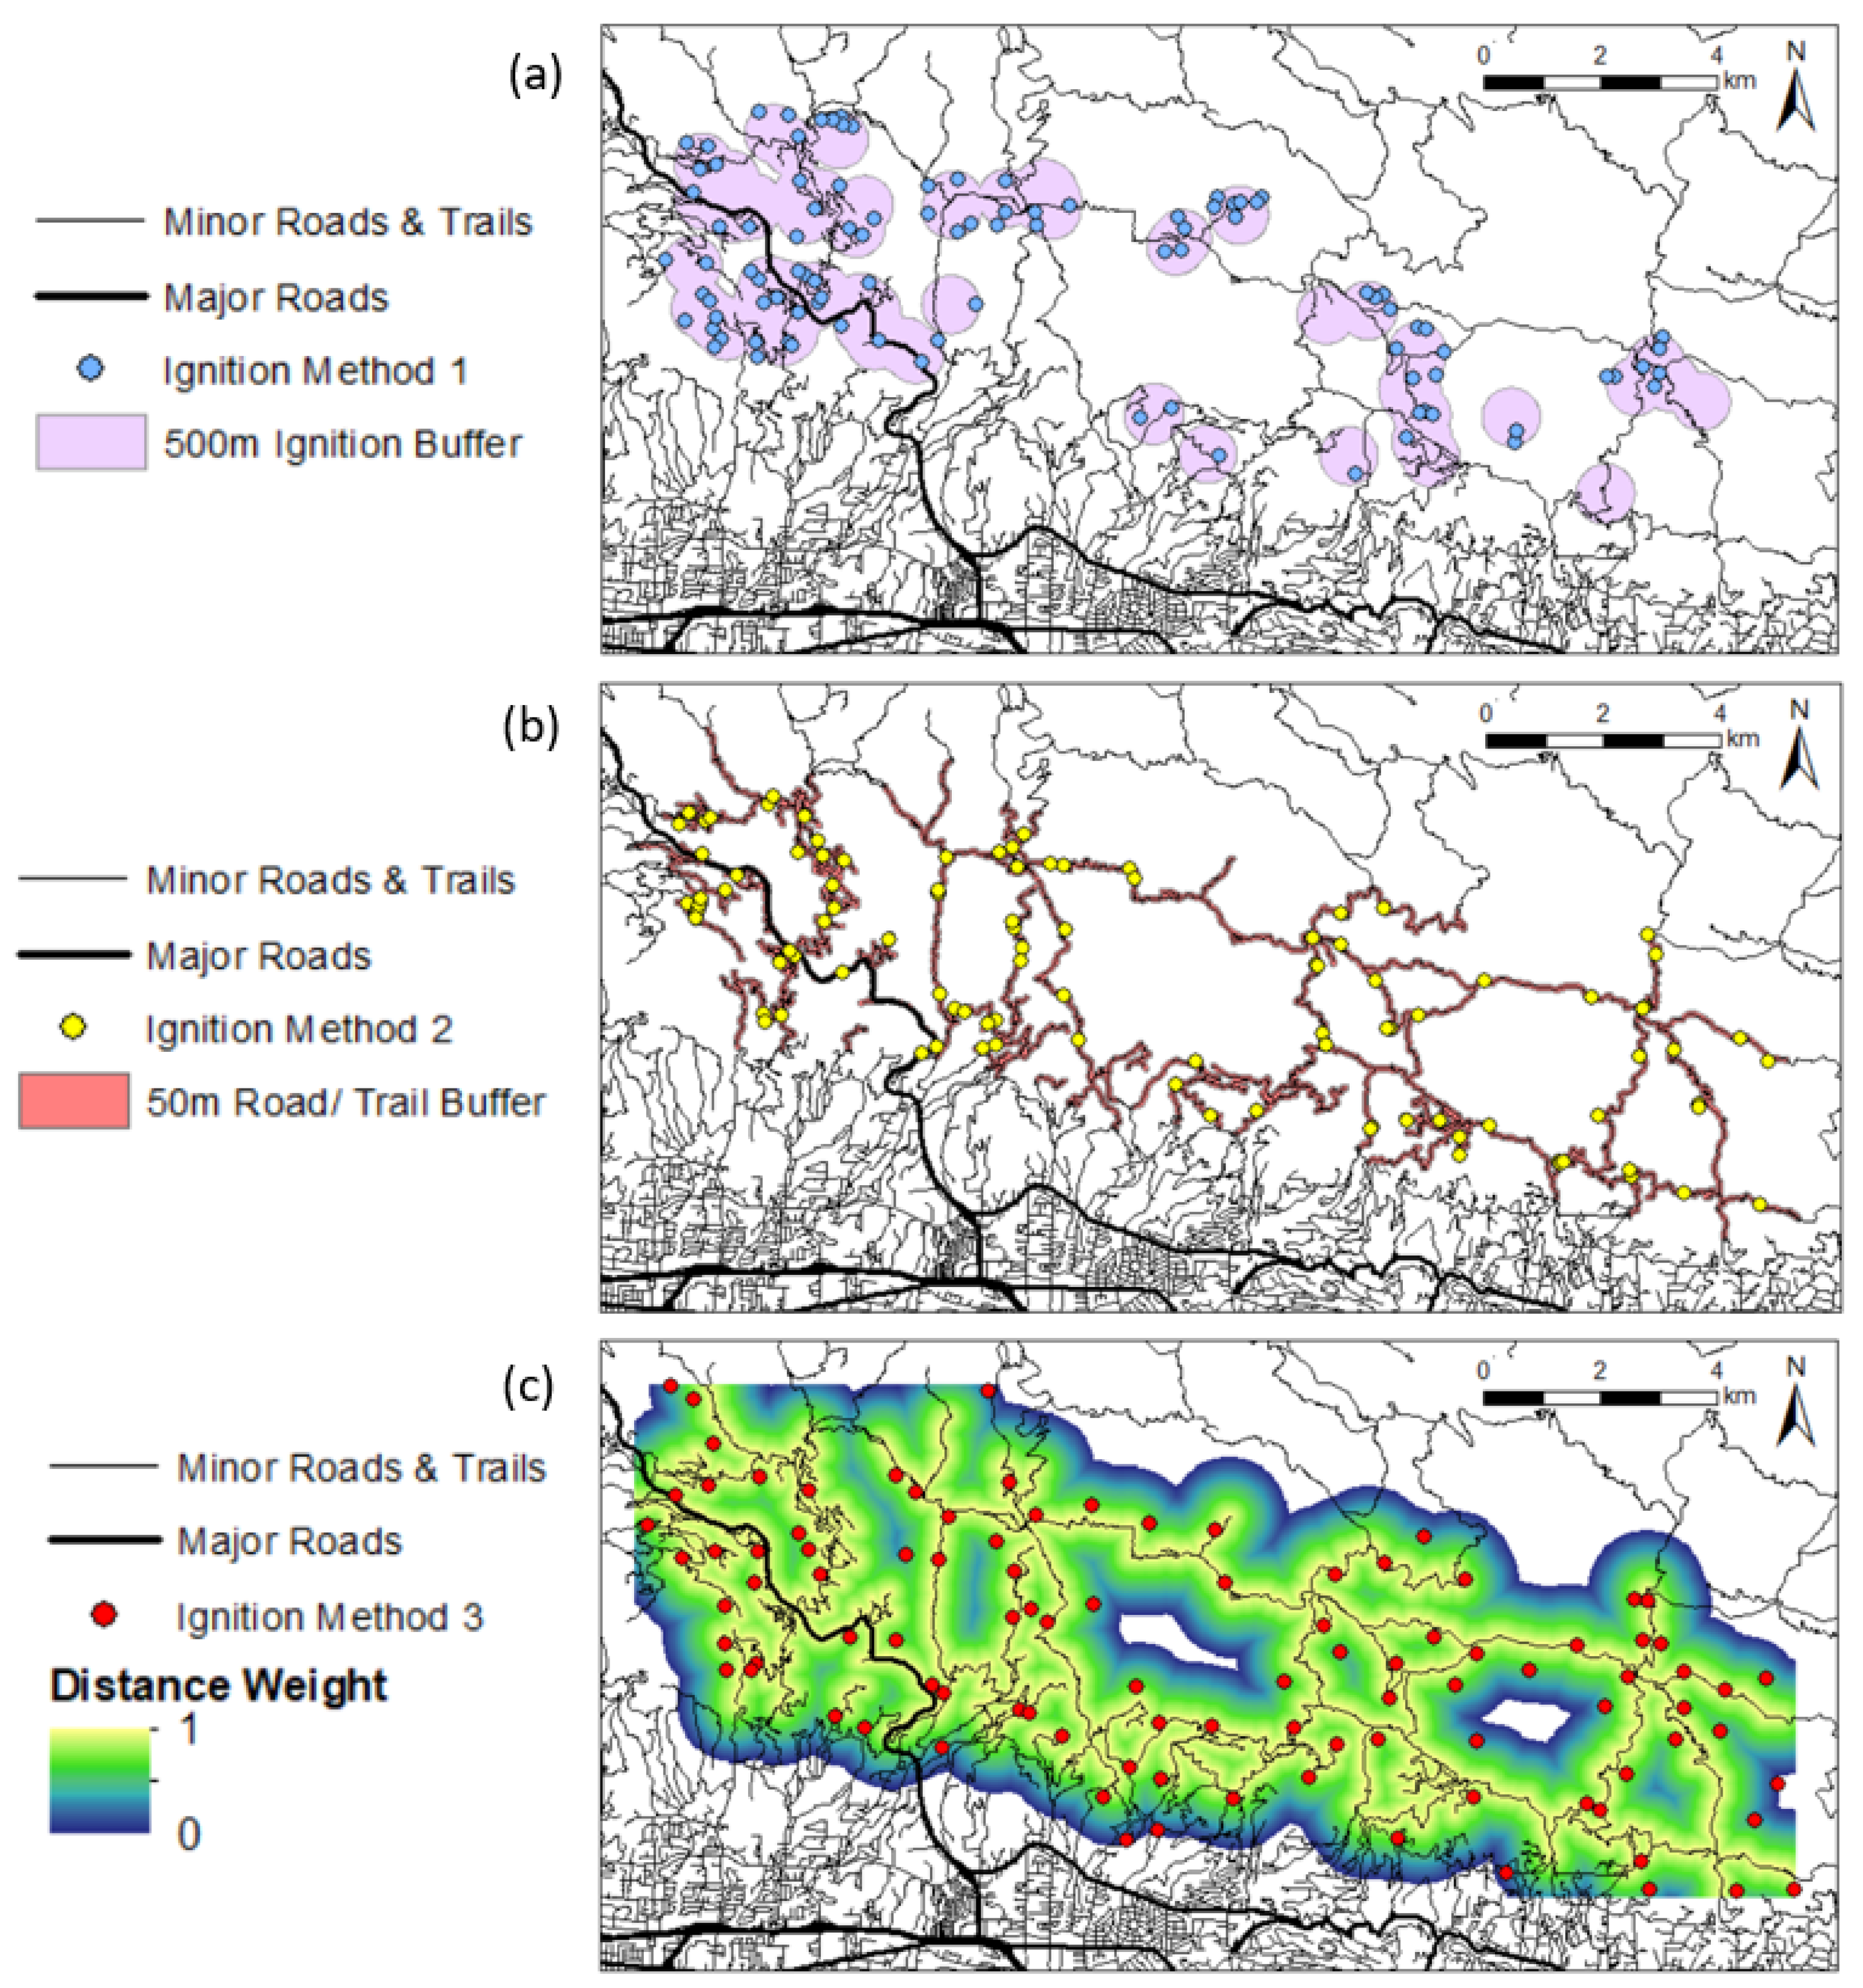
2.3. Ignition Modeling Methods
2.4. FARSITE and Model Input
3. Impacts of Varied Ignition Modeling Methods on Wildfire Spread
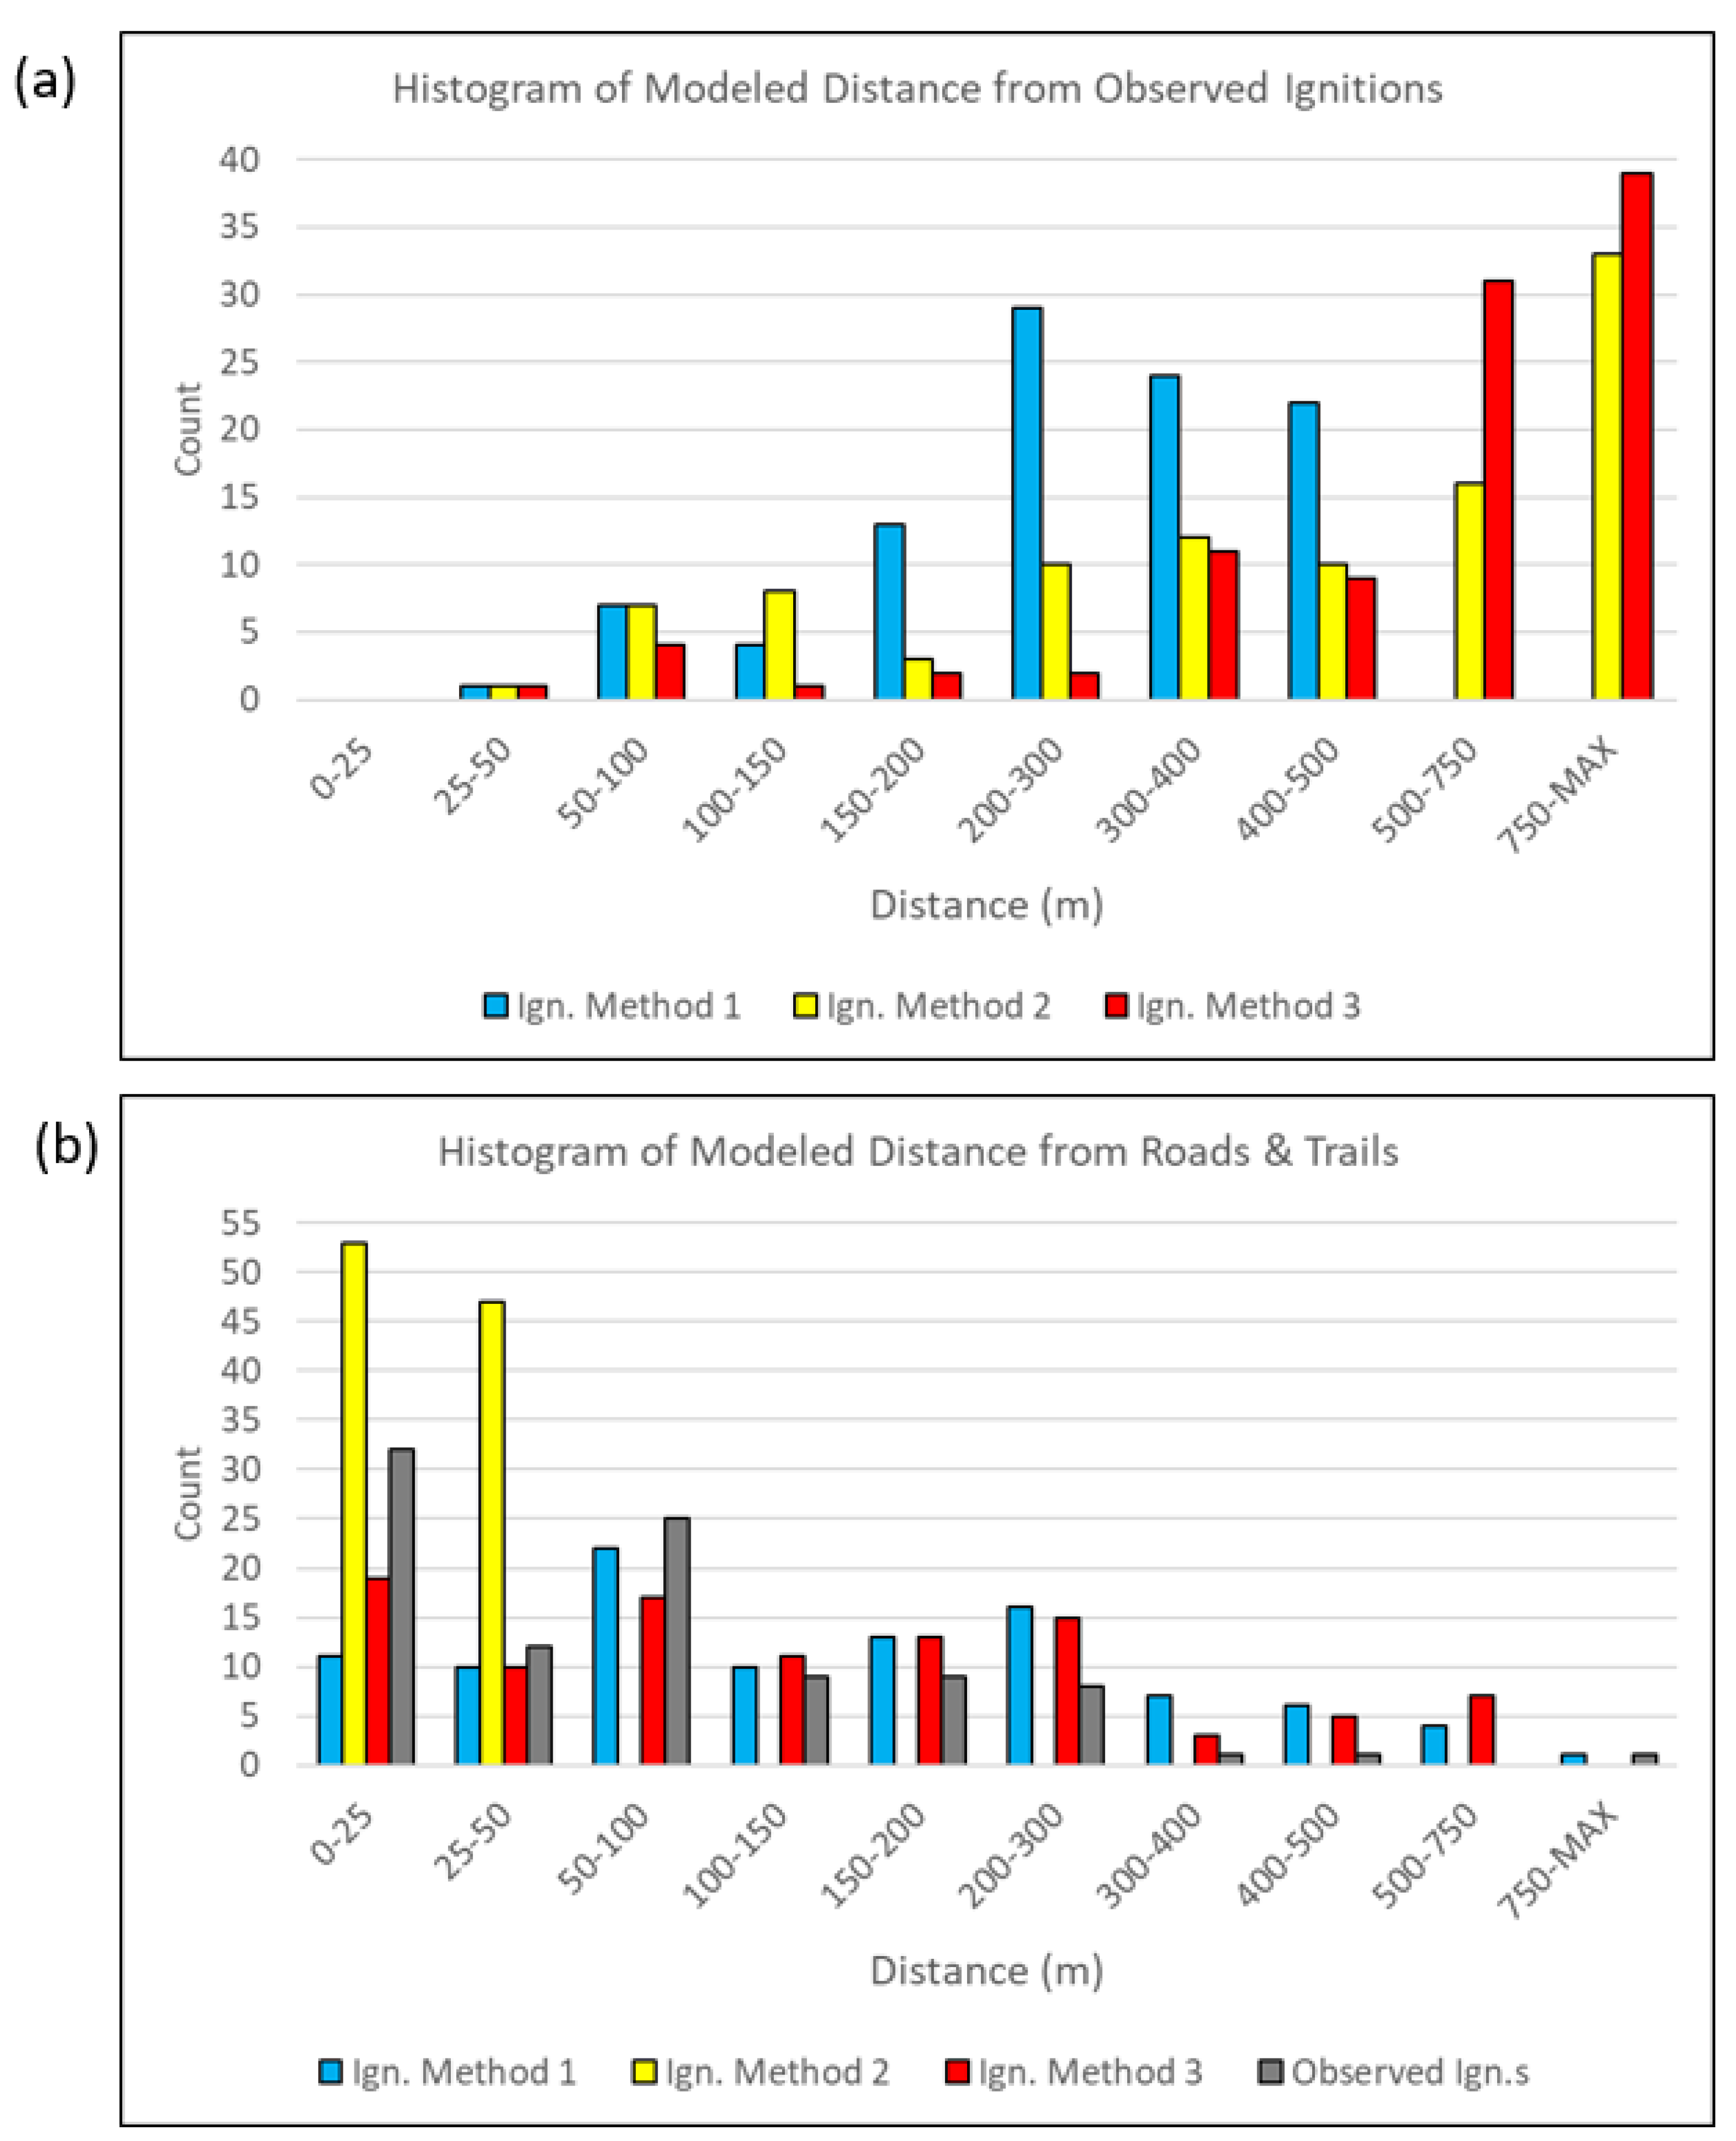
3.1. Ignitions in the WUI: Observations and Modeling
3.2. Wildfire Spread Risk in the WUI using Varied Ignition Methods and Wind Scenarios
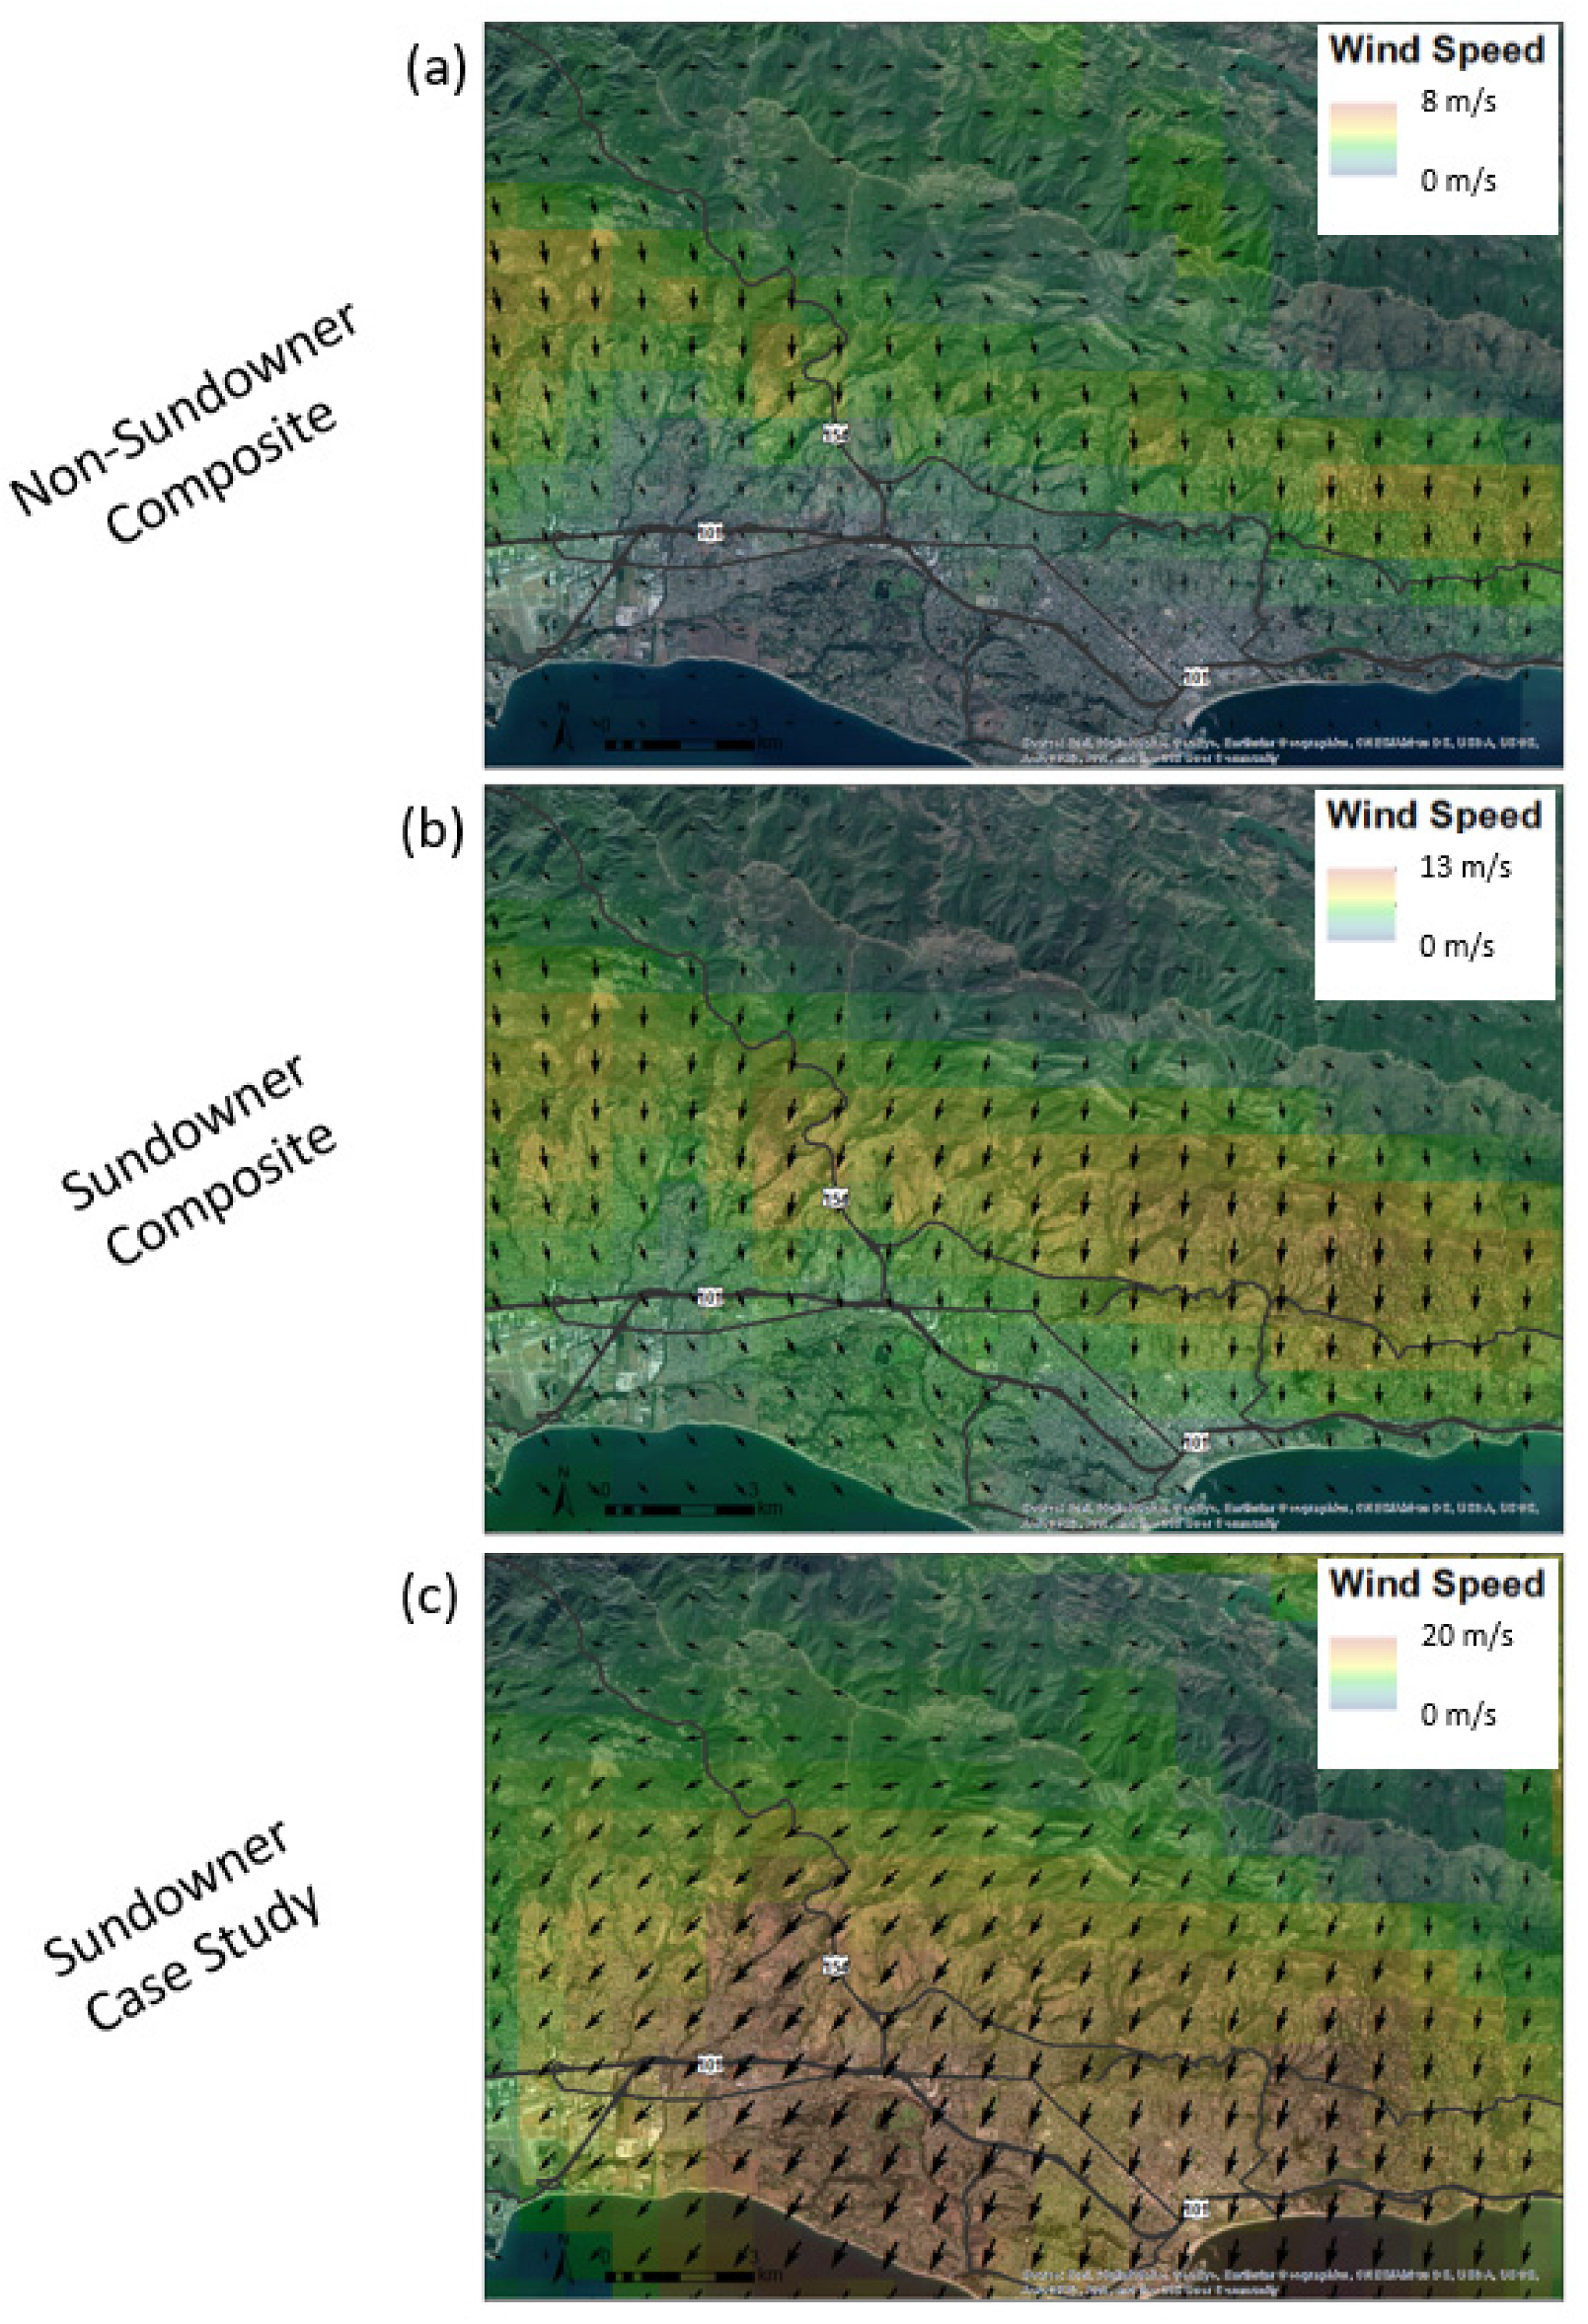
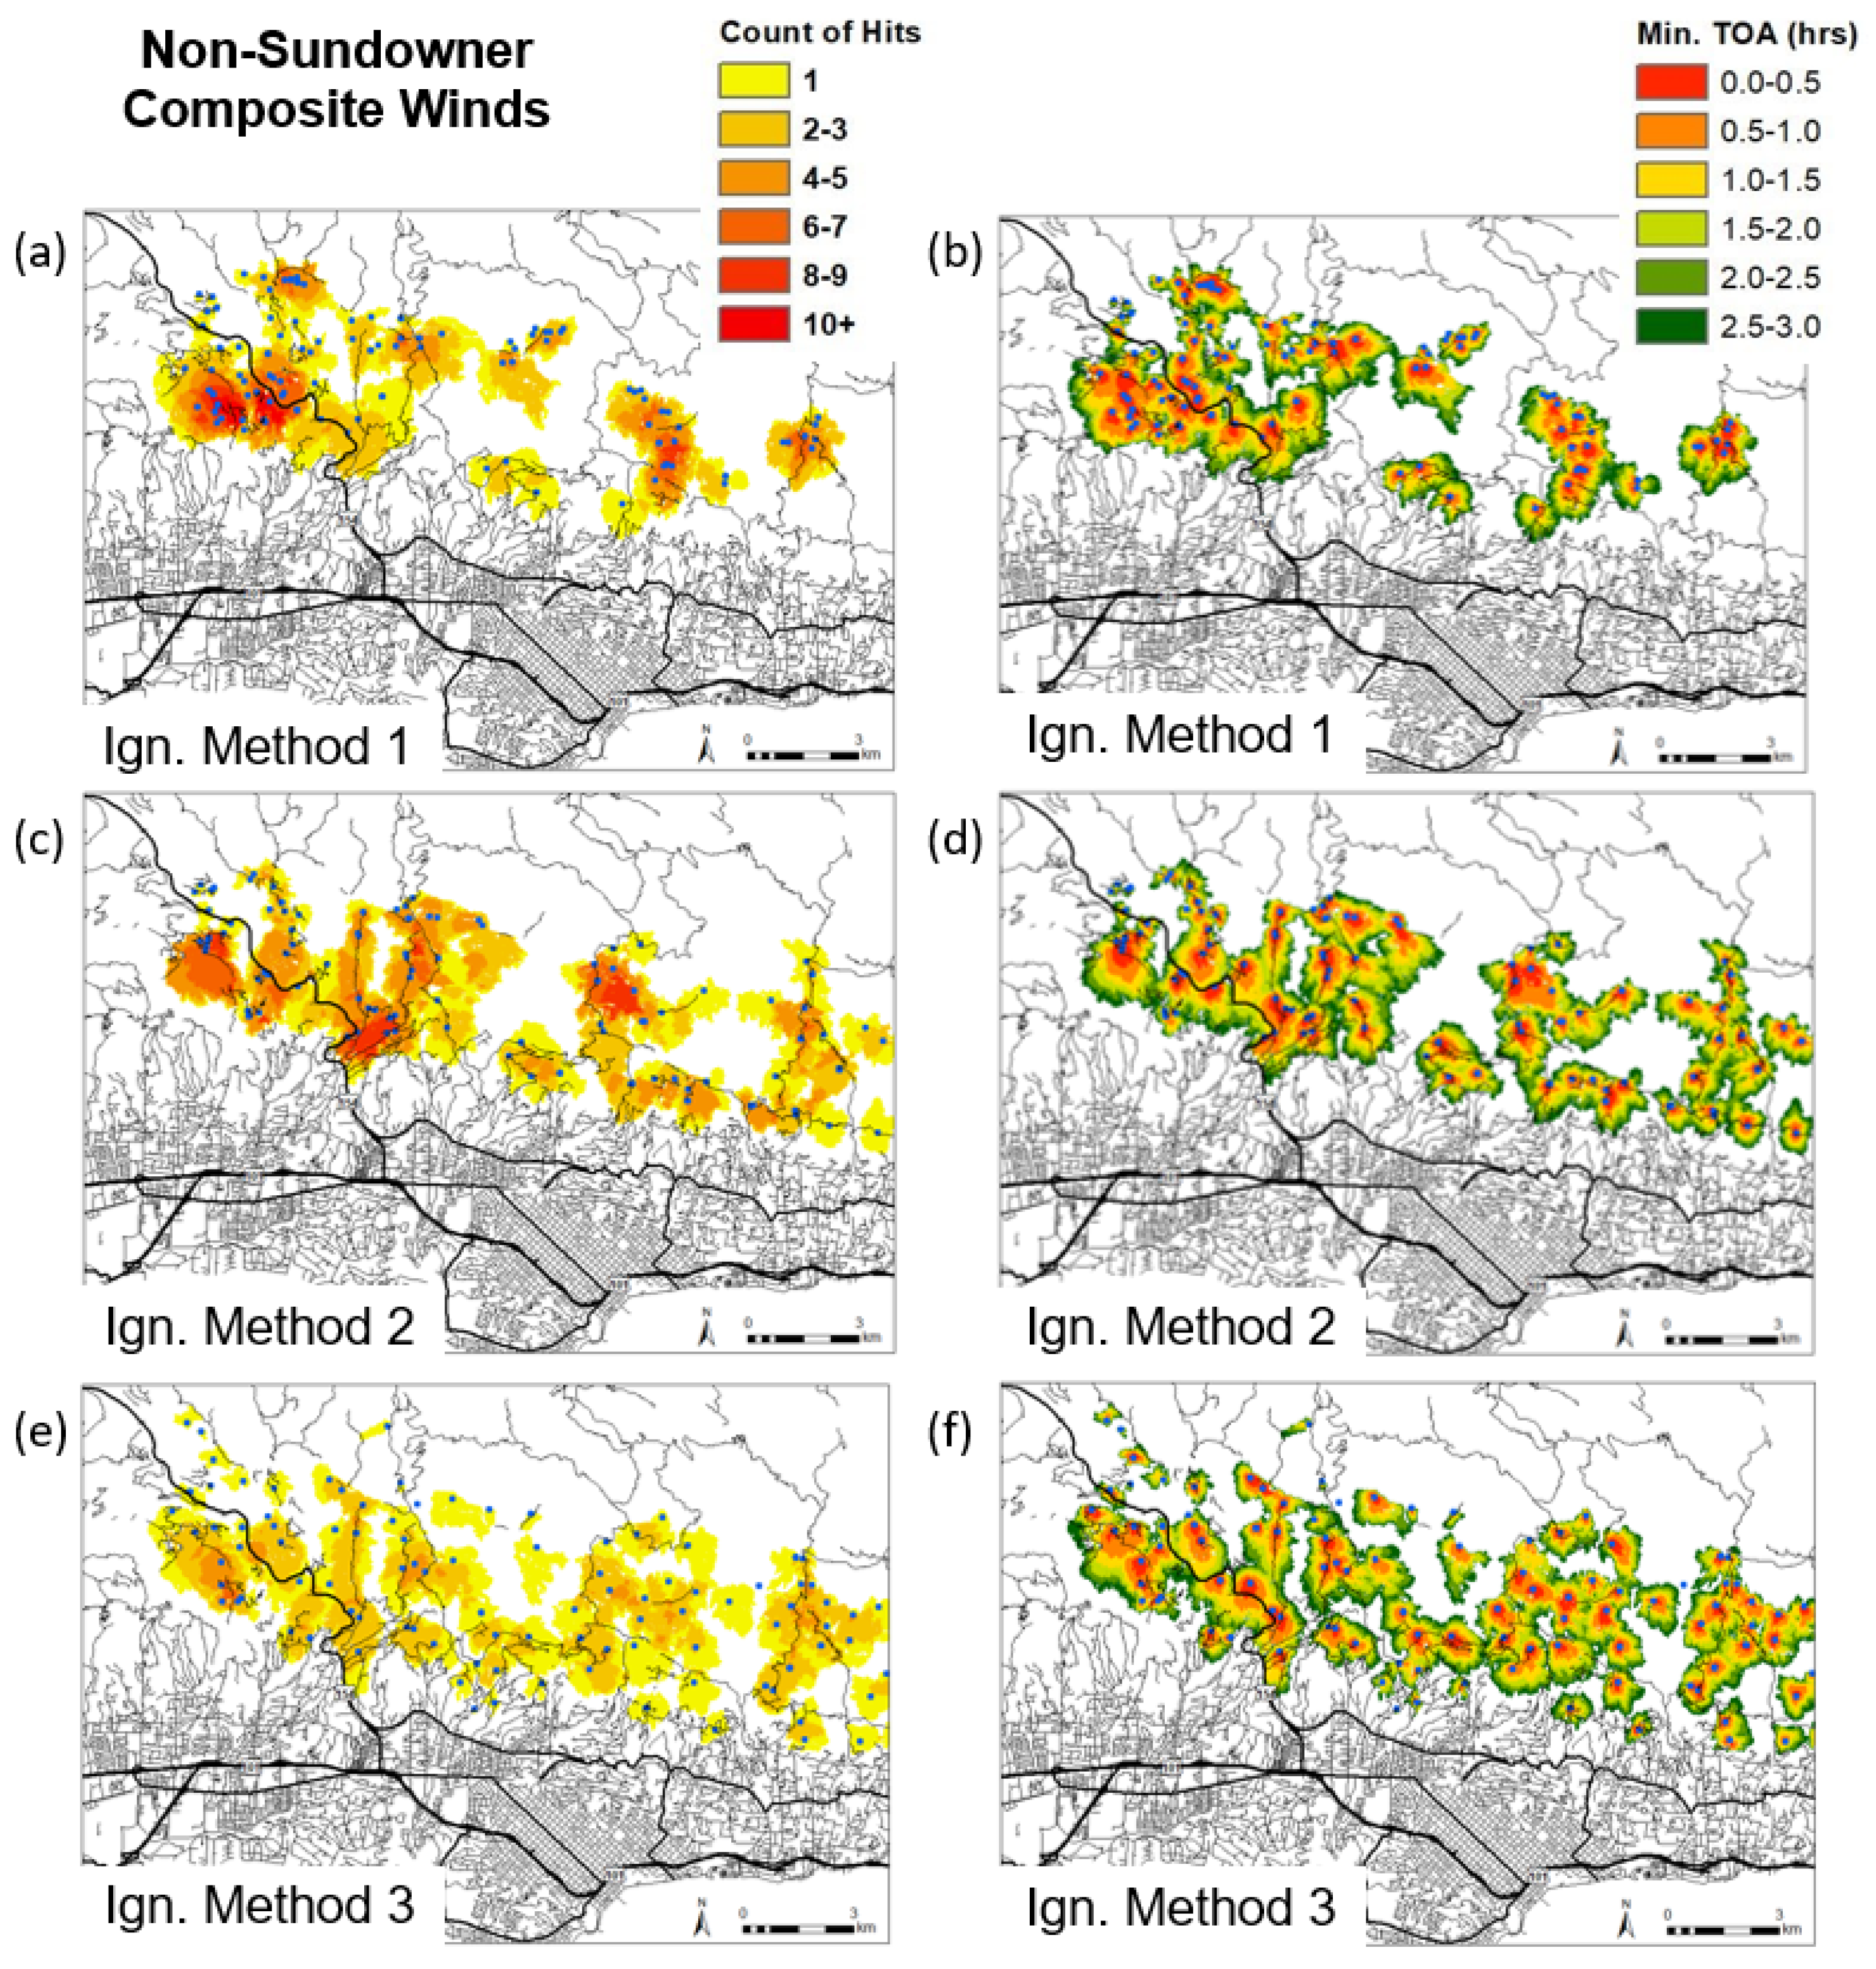
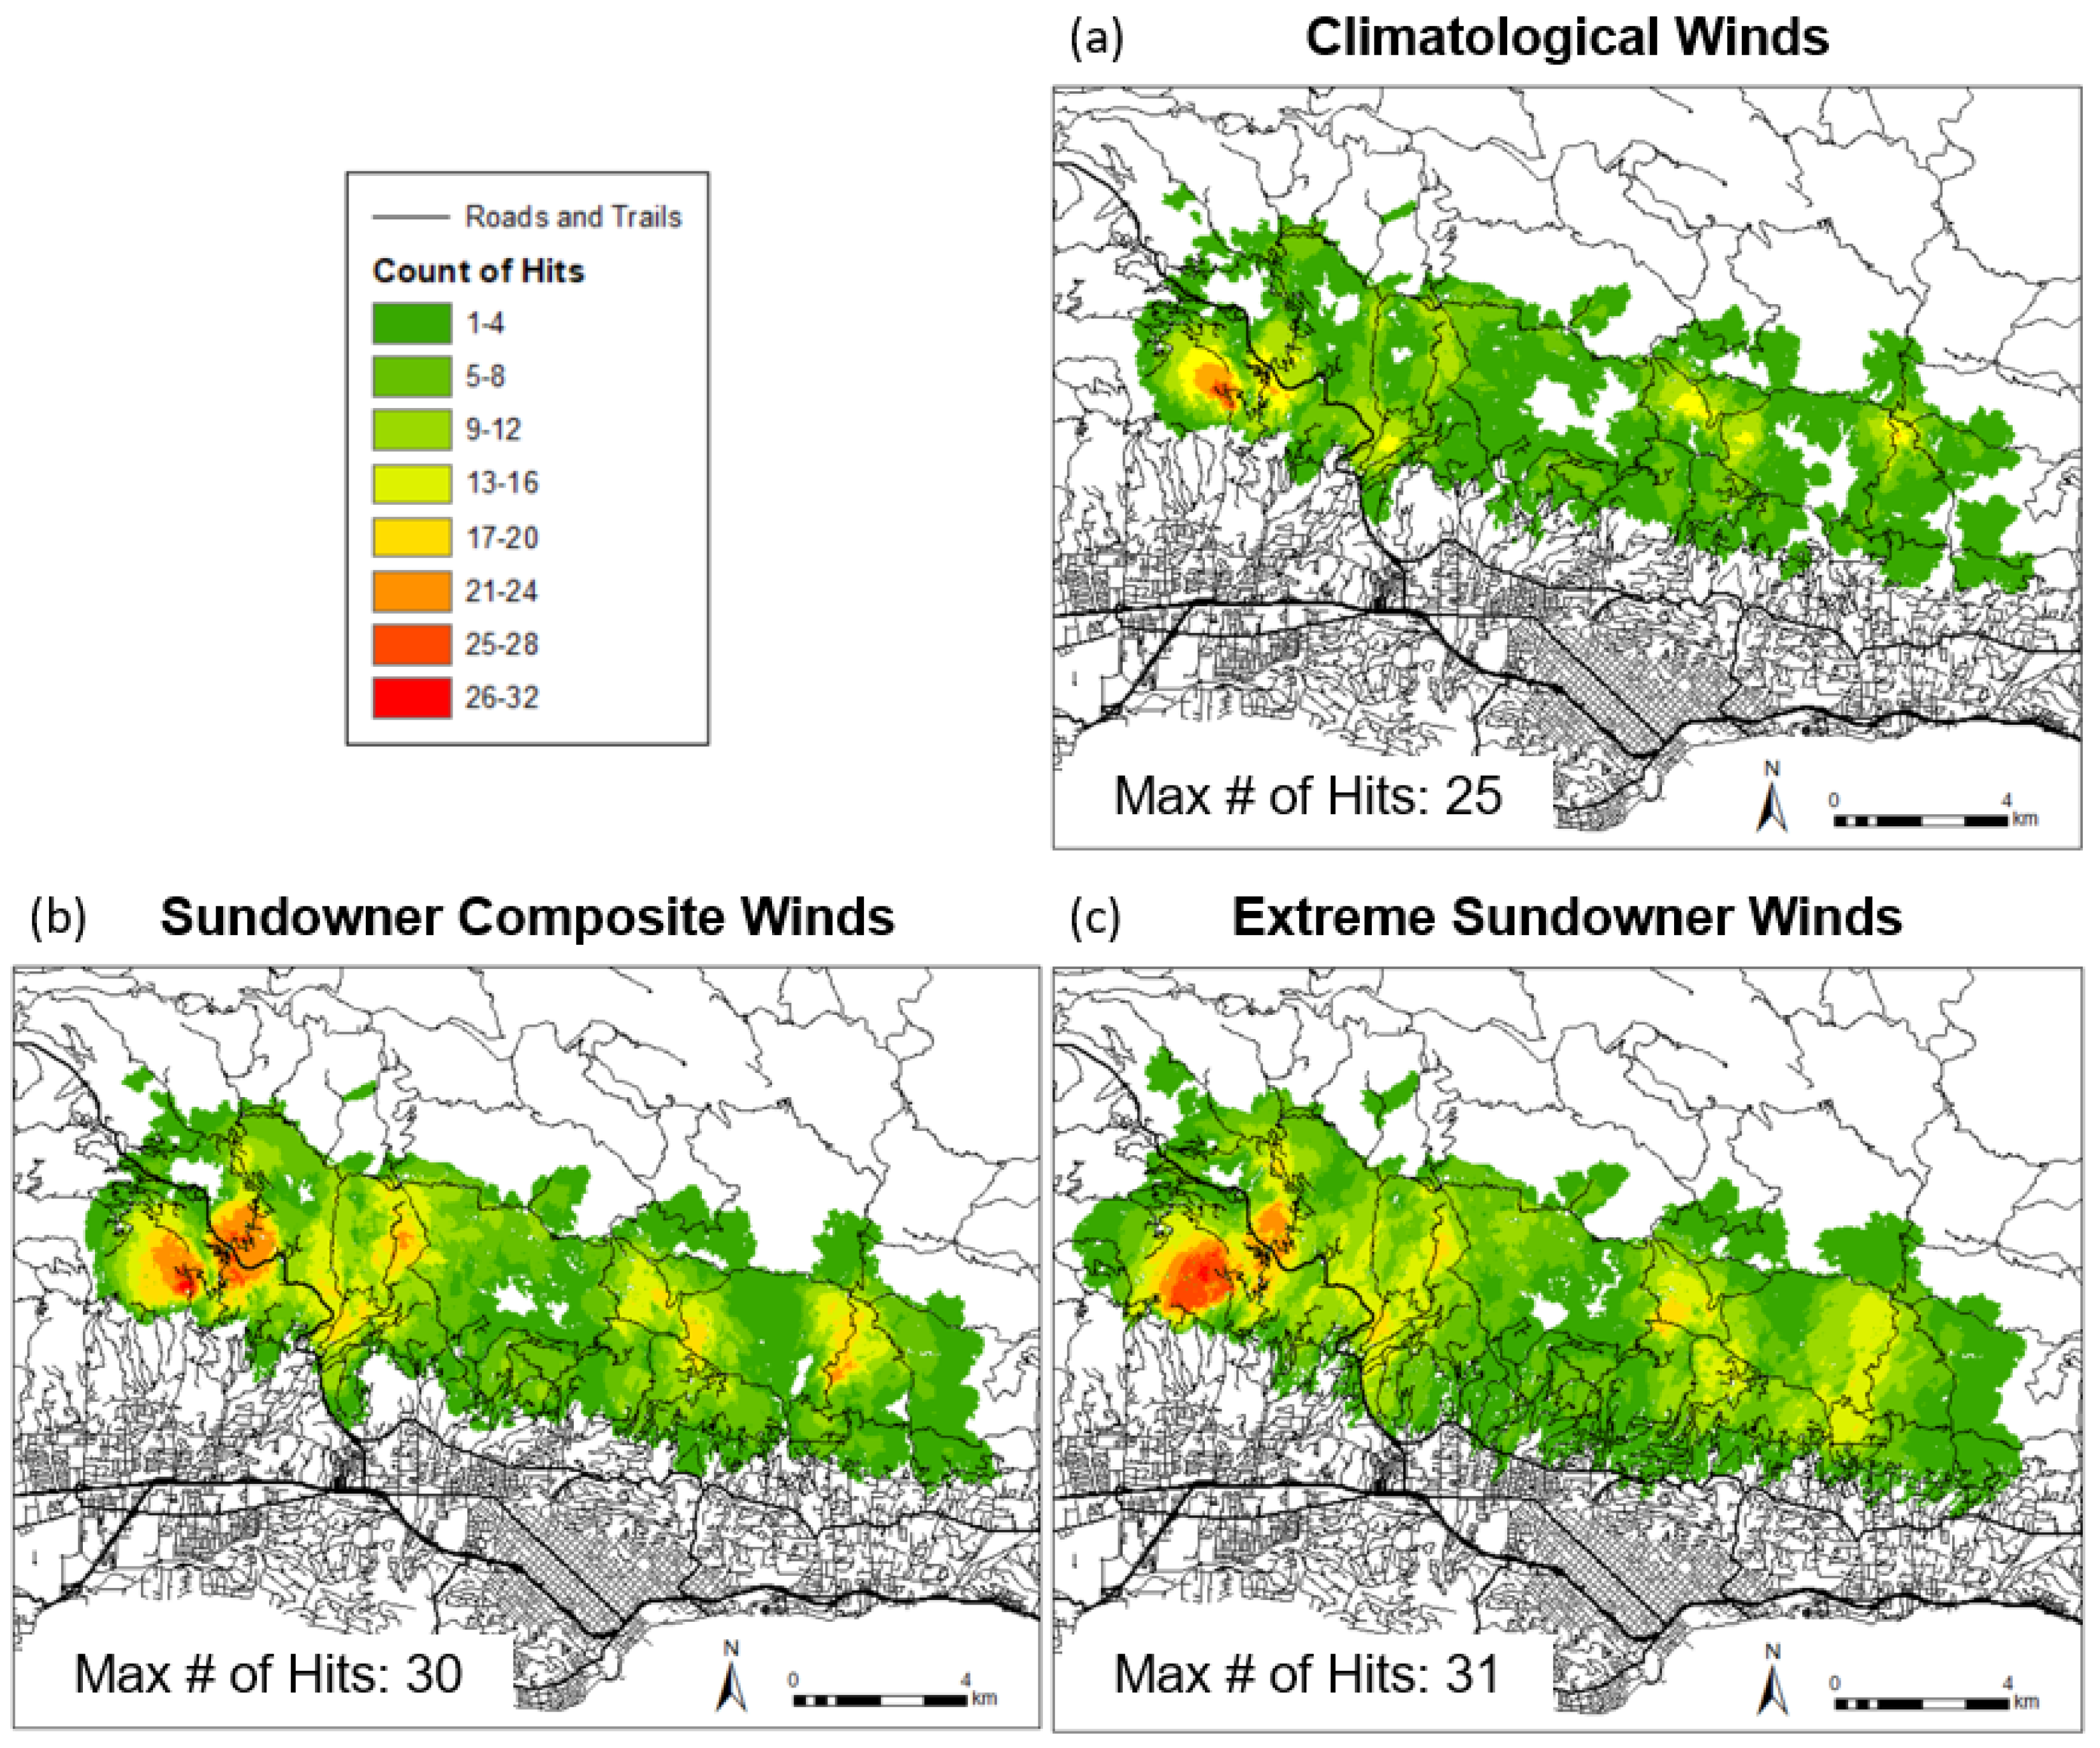
3.2.1. Climatological (Non-Sundowner) Conditions
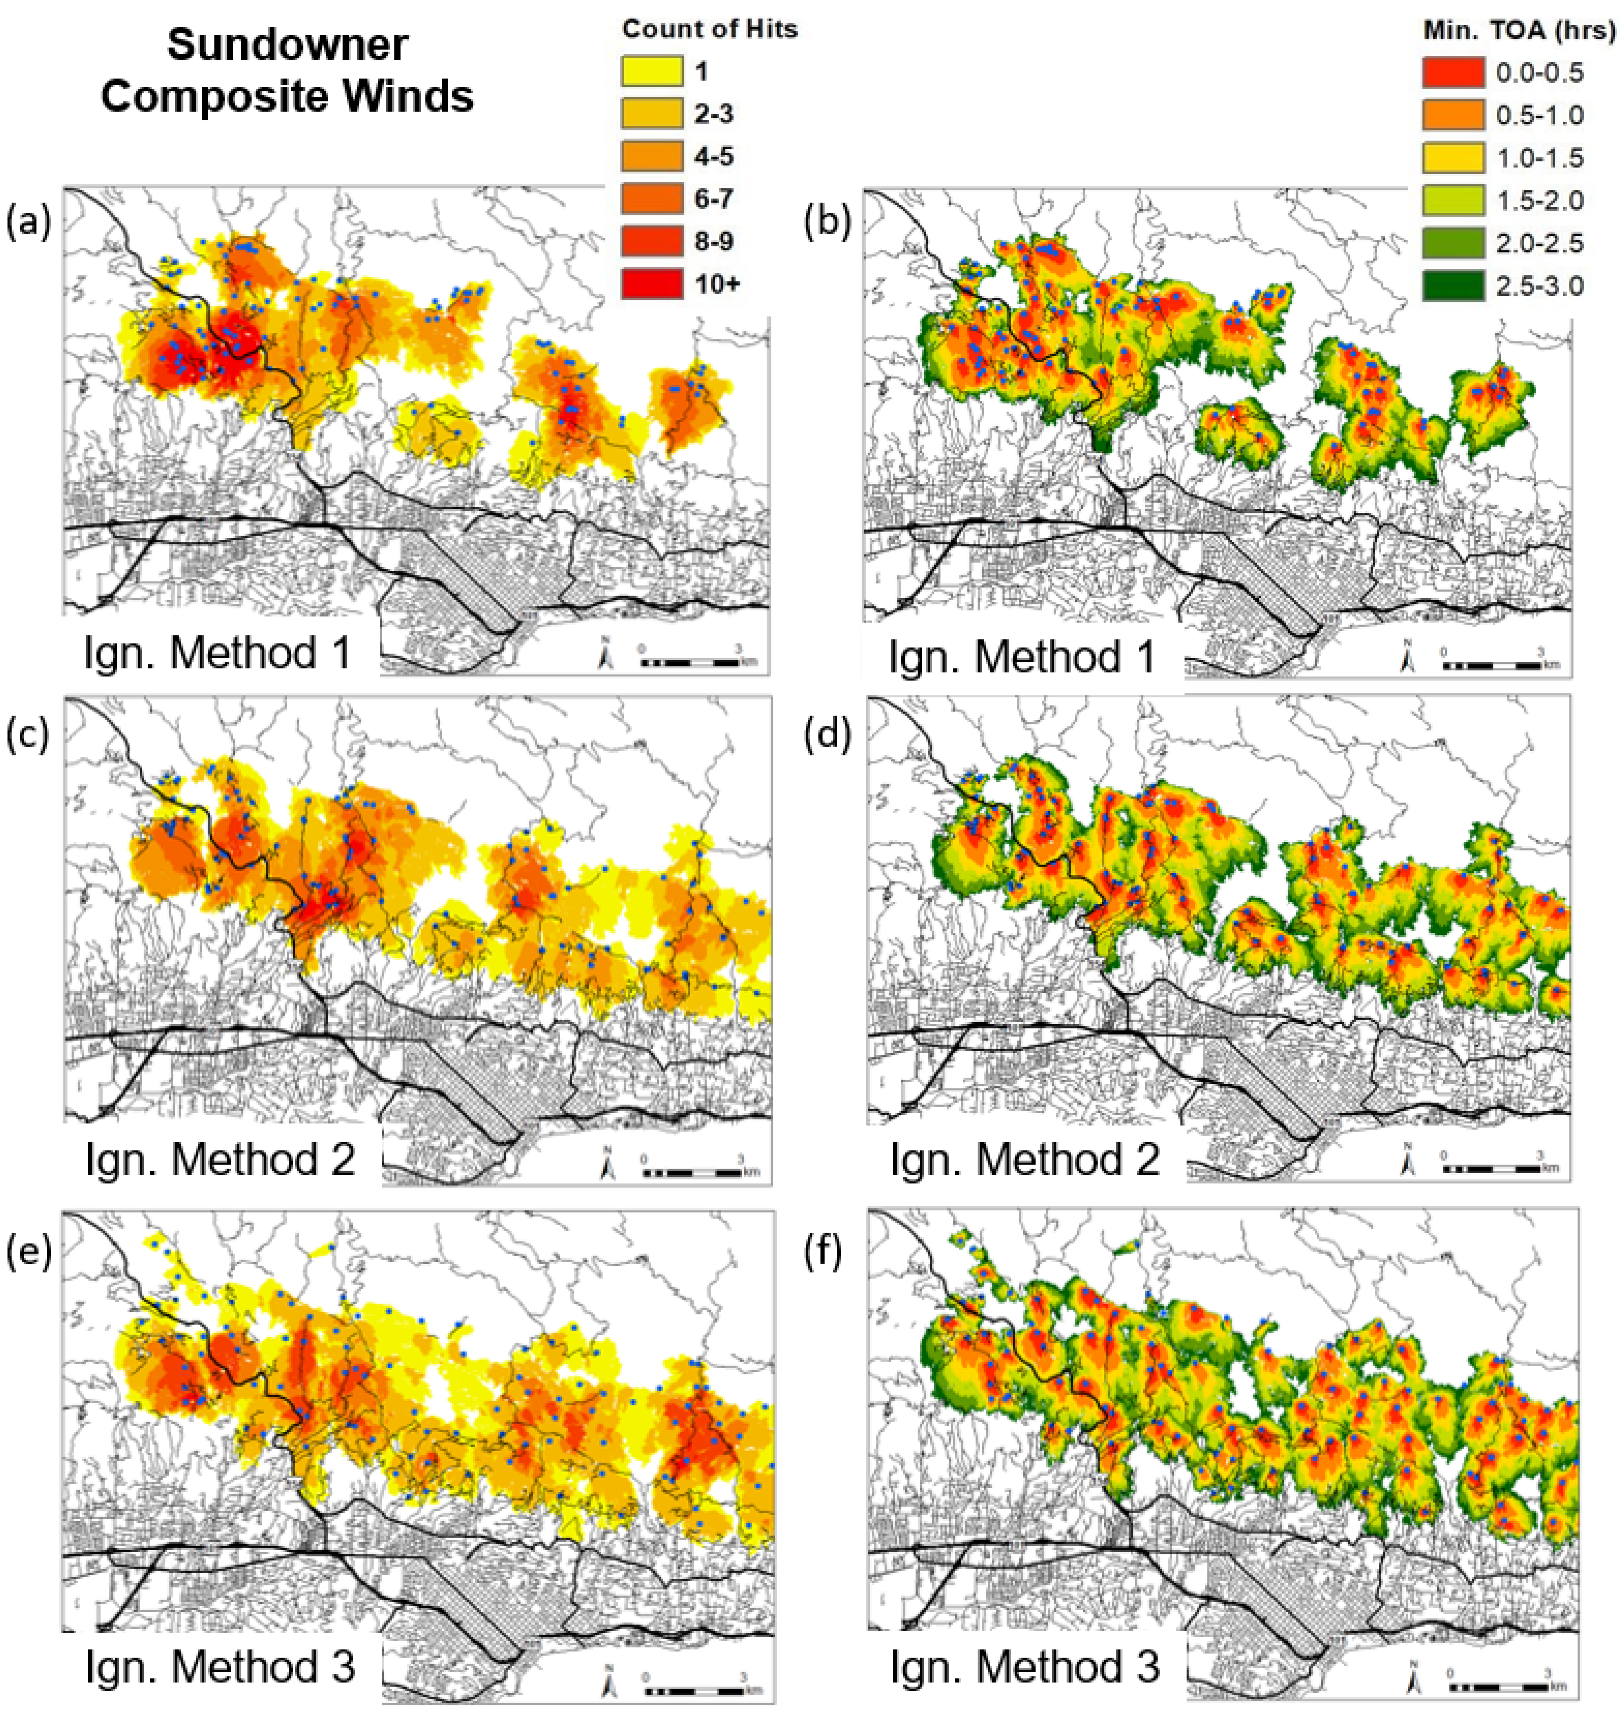
3.2.2. Mean Sundowner Conditions
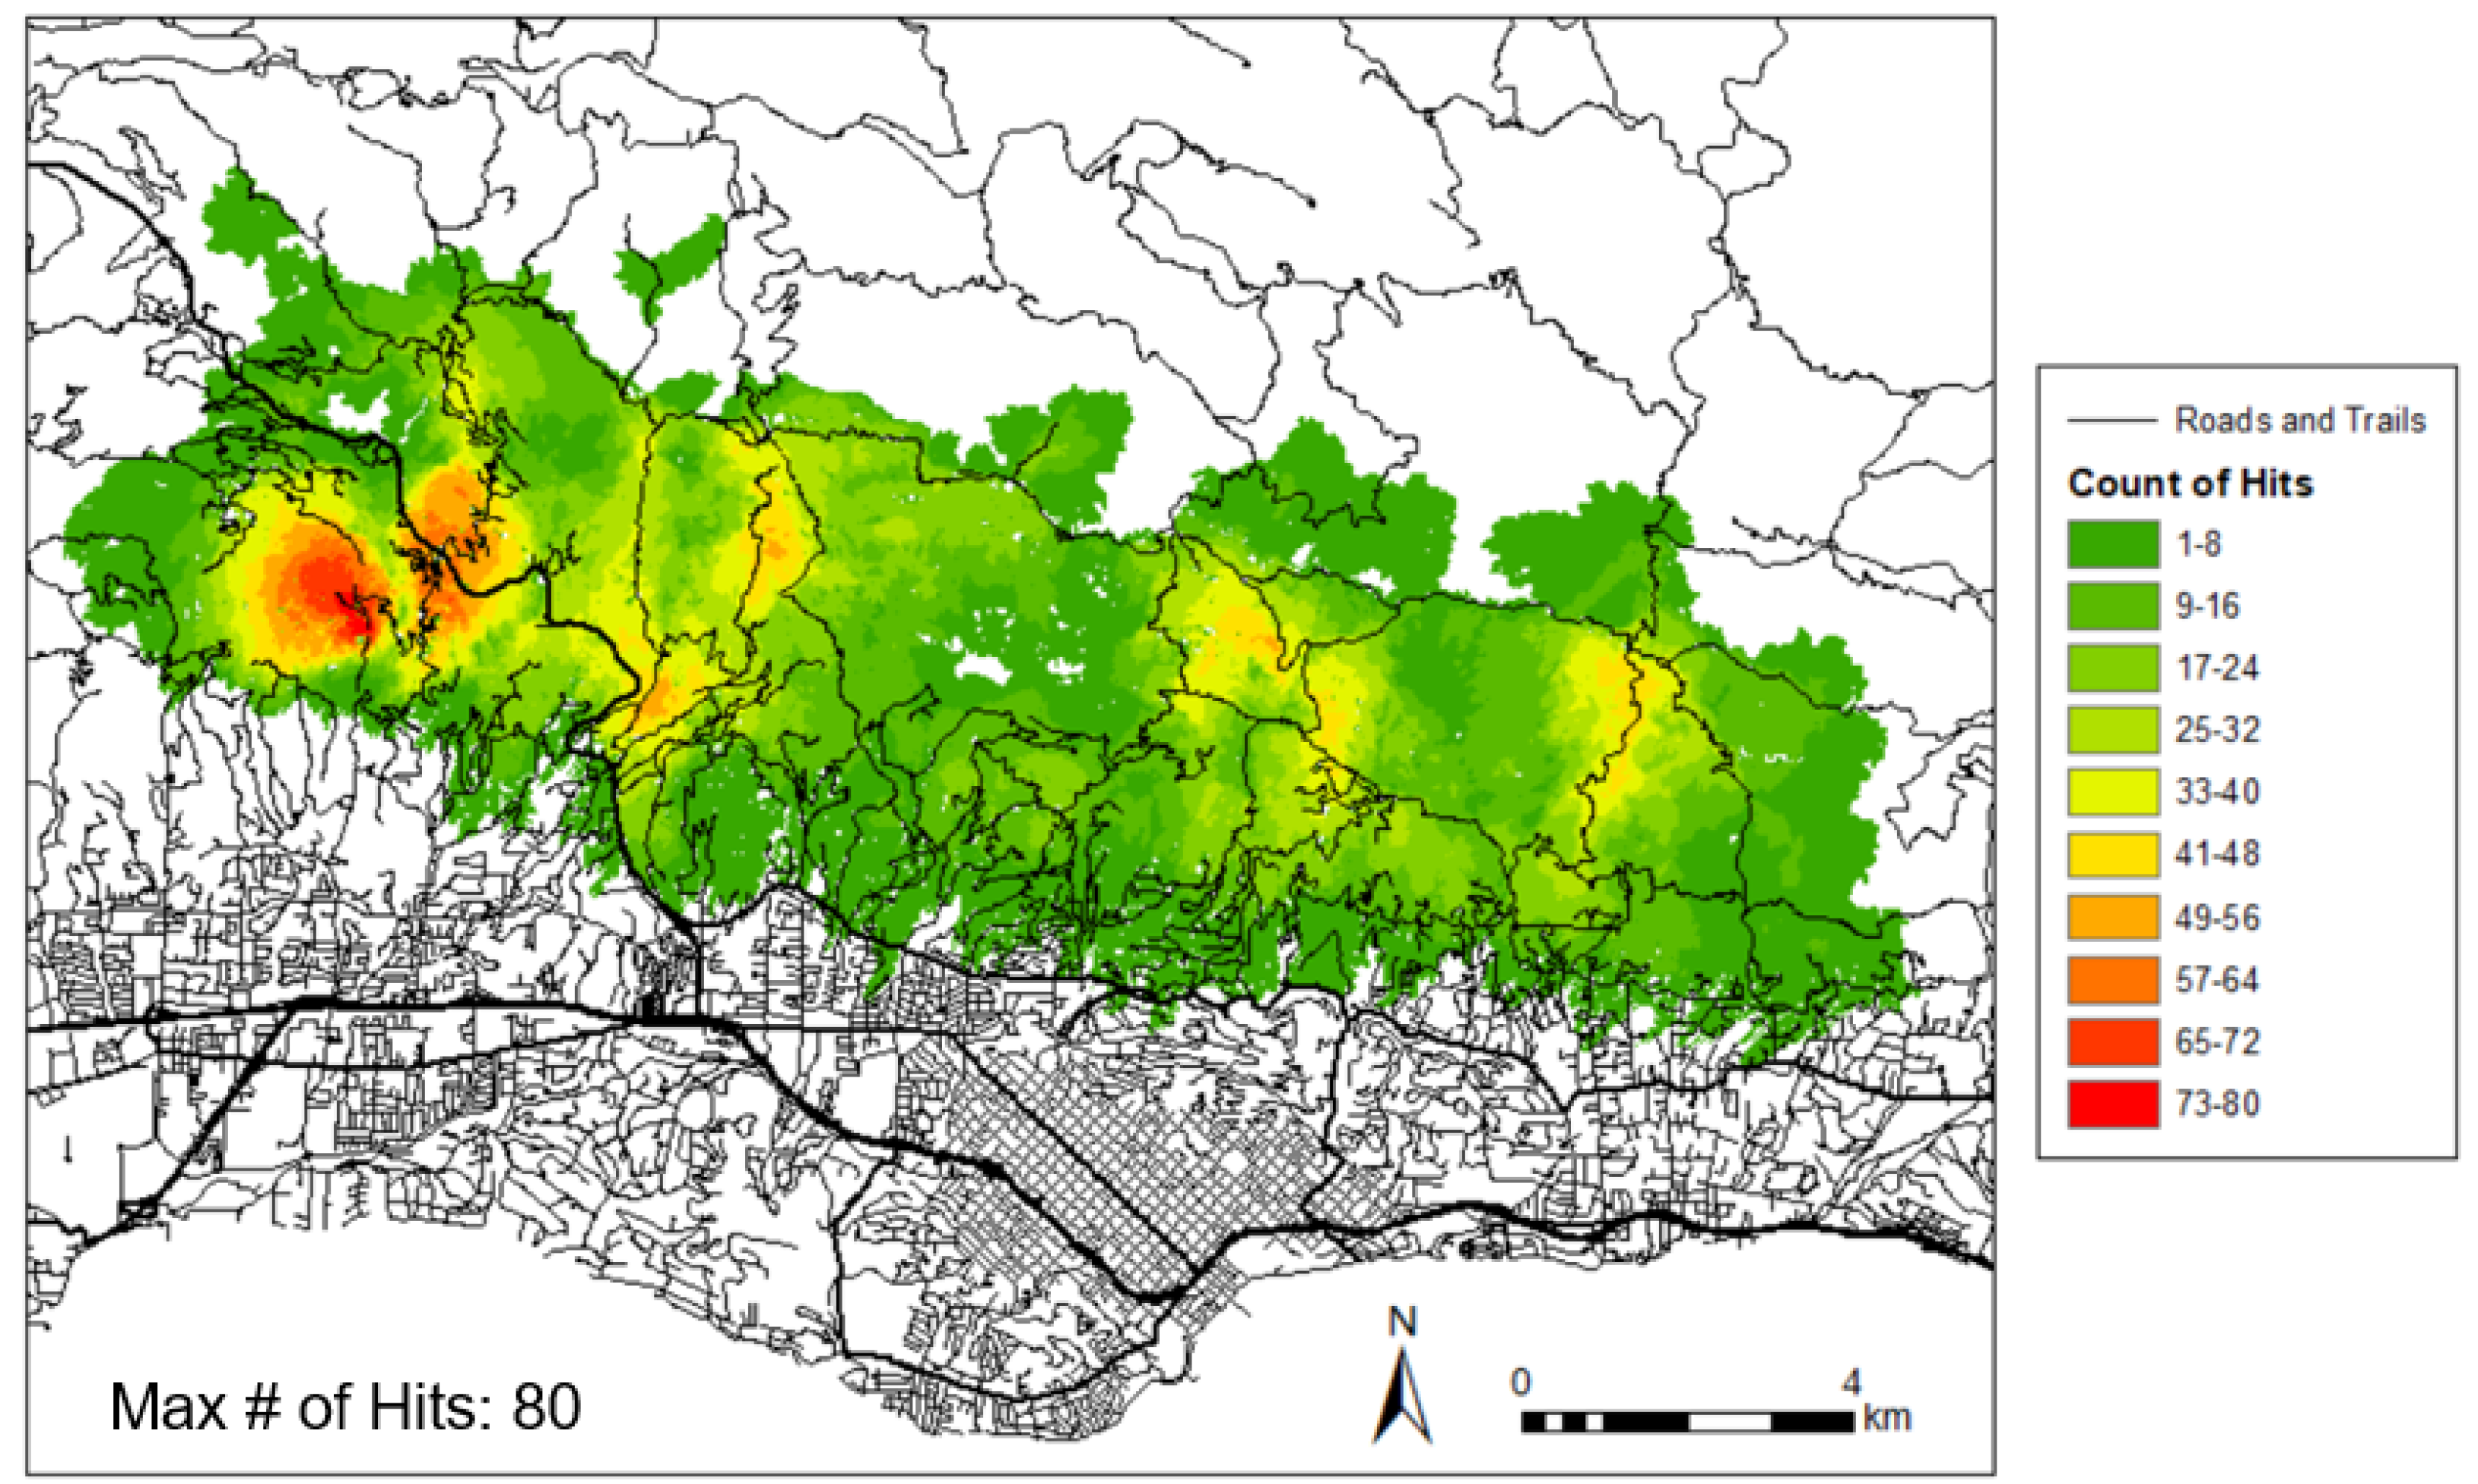
3.2.3. Extreme Sundowner Winds: 14 April 2005 case study
3.2.4. Analysis of All Simulations
4. Discussion and Conclusions
Author Contributions
Funding
Informed Consent Statement
Acknowledgments
Conflicts of Interest
Appendix A


References
- Radeloff, V.C.; Hammer, R.B.; Stewart, S.I.; Fried, J.S.; Holcomb, S.S.; McKeefry, J.F. The wildland–urban interface in the United States. Ecol. appl. 2005, 15, 799–805. [Google Scholar] [CrossRef]
- Radeloff, V.C.; Helmers, D.P.; Kramer, H.A.; Mockrin, M.H.; Alexandre, P.M.; Bar-Massada, A.; Butsic, V.; Hawbaker, T.J.; Martinuzzi, S.; Syphard, A.D.; et al. Rapid growth of the US wildland-urban interface raises wildfire risk. Proc. Natl. Acad. Sci. USA 2018, 115, 3314–3319. [Google Scholar] [CrossRef] [PubMed]
- Hammer, R.B.; Stewart, S.I.; Radeloff, V.C. Demographic trends, the wildland–urban interface, and wildfire management. Soc. Nat. Resour. 2009, 22, 777–782. [Google Scholar] [CrossRef]
- Moritz, M.A.; Batllori, E.; Bradstock, R.A.; Gill, A.M.; Handmer, J.; Hessburg, P.F.; Leonard, J.; McCaffrey, S.; Odion, D.C.; Schoennagel, T.; et al. Learning to coexist with wildfire. Nature 2014, 515, 58–66. [Google Scholar] [CrossRef]
- Kramer, H.A.; Mockrin, M.H.; Alexandre, P.M.; Radeloff, V.C. High wildfire damage in interface communities in California. Int. J. Wildland Fire 2019, 28, 641–650. [Google Scholar] [CrossRef]
- Keeley, J.E.; Fotheringham, C.J.; Moritz, M.A. Lessons from the october 2003. Wildfires in Southern California. J. For. 2004, 102, 26–31. [Google Scholar]
- Syphard, A.D.; Radeloff, V.C.; Keeley, J.E.; Hawbaker, T.J.; Clayton, M.K.; Stewart, S.I.; Hammer, R.B. Human influence on California fire regimes. Ecol. Appl. 2007, 17, 1388–1402. [Google Scholar] [CrossRef]
- Faivre, N.; Jin, Y.; Goulden, M.L.; Randerson, J.T. Controls on the spatial pattern of wildfire ignitions in Southern California. Int. J. Wildland Fire 2014, 23, 799–811. [Google Scholar] [CrossRef]
- Bryant, B.P.; Westerling, A.L. Scenarios for future wildfire risk in California: Links between changing demography, land use, climate, and wildfire. Environmetrics 2014, 25, 454–471. [Google Scholar] [CrossRef]
- Balch, J.K.; Bradley, B.A.; Abatzoglou, J.T.; Nagy, R.C.; Fusco, E.J.; Mahood, A.L. Human-started wildfires expand the fire niche across the United States. Proc. Natl. Acad. Sci. USA 2017, 114, 2946–2951. [Google Scholar] [CrossRef]
- Keeley, J.E.; Syphard, A.D. Historical patterns of wildfire ignition sources in California ecosystems. Int. J. Wildland Fire 2018, 27, 781–799. [Google Scholar] [CrossRef]
- Moritz, M.A.; Knowles, S.G. Coexisting with wildfire. Am. Sci. 2016, 104, 220. [Google Scholar]
- Nauslar, N.J.; Abatzoglou, J.T.; Marsh, P.T. The 2017 North Bay and Southern California fires: A case study. Fire 2018, 1, 18. [Google Scholar] [CrossRef]
- Bartlein, P.J.; Hostetler, S.W.; Shafer, S.L.; Holman, J.O.; Solomon, A.M. Temporal and spatial structure in a daily wildfire-start data set from the western United States (1986–1996). Int. J. Wildland Fire 2008, 17, 8–17. [Google Scholar] [CrossRef]
- Jin, Y.; Randerson, J.T.; Faivre, N.; Capps, S.; Hall, A.; Goulden, M.L. Contrasting controls on wildland fires in Southern California during periods with and without Santa Ana winds. J. Geophys. Res. Biogeosciences 2014, 119, 432–450. [Google Scholar] [CrossRef]
- Syphard, A.D.; Radeloff, V.C.; Keuler, N.S.; Taylor, R.S.; Hawbaker, T.J.; Stewart, S.I.; Clayton, M.K. Predicting spatial patterns of fire on a southern California landscape. Int. J. Wildland Fire 2008, 17, 602–613. [Google Scholar] [CrossRef]
- Syphard, A.D.; Keeley, J.E.; Massada, A.B.; Brennan, T.J.; Radeloff, V.C. Housing arrangement and location determine the likelihood of housing loss due to wildfire. PLoS ONE 2012, 7, e33954. [Google Scholar] [CrossRef]
- Syphard, A.D.; Keeley, J.E. Location, timing and extent of wildfire vary by cause of ignition. Int. J. Wildland Fire 2015, 24, 37–47. [Google Scholar] [CrossRef]
- Countryman, C.M. The Fire Environment Concept; USDA Forest Service: Berkeley, CA, USA, 1972; p. 15.
- Moritz, M.A. Spatiotemporal analysis of controls on shrubland fire regimes: Age dependency and fire hazard. Ecology 2003, 84, 351–361. [Google Scholar] [CrossRef]
- Abatzoglou, J.T.; Balch, J.K.; Bradley, B.A.; Kolden, C.A. Human-related ignitions concurrent with high winds promote large wildfires across the USA. Int. J. Wildland Fire 2018, 27, 377–386. [Google Scholar] [CrossRef]
- Blier, W. The sundowner winds of Santa Barbara, California. Weather. Forecast. 1998, 13, 702–716. [Google Scholar] [CrossRef]
- Jones, C.; Carvalho, L.; Duine, G.J.; Zigner, K. A New Climatology of Sundowner Winds in Coastal Santa Barbara, California, Based on 30-yr High Resolution WRF Downscaling. Atmos. Res. 2021, 249, 105305. [Google Scholar] [CrossRef]
- Zigner, K.; Carvalho, L.; Jones, C.; Duine, G.J. Extreme winds and fire weather in coastal Santa Barbara County, CA: An observational analysis. Int. J. Clim. 2021, 41, 597–618. [Google Scholar] [CrossRef]
- Cannon, F.; Carvalho, L.; Jones, C.; Hall, T.; Gomberg, D.; Dumas, J.; Jackson, M. WRF Simulation of Downslope Wind Events in Coastal Santa Barbara County. Atmos. Res. 2017, 191, 57–73. [Google Scholar] [CrossRef]
- Carvalho, L.; Duine, G.J.; Jones, C.; Zigner, K.; Clements, C.; Kane, H.; Gore, G.; Bell, G.; Gamelin, B.; Gomberg, D.; et al. The Sundowner Winds Experiment (SWEX) Pilot Study: Understanding Downslope Windstorms in the Santa Ynez Mountains, Santa Barbara, CA. Mon. Weather. Rev. 2020, 148, 1519–1539. [Google Scholar] [CrossRef]
- Duine, G.J.; Jones, C.; Carvalho, L.M.V.; Fovell, R.G. Simulating Sundowner Winds in Coastal Santa Barbara: Model Validation and Sensitivity. Atmosphere 2019, 10, 155. [Google Scholar] [CrossRef]
- Duine, G.J.; Carvalho, L.M.; Jones, C.; Zigner, K. The effect of upstream orography on the onset of sundowner winds in coastal Santa Barbara, CA. J. Geophys. Res. Atmos. 2021, 126, e2020JD033791. [Google Scholar] [CrossRef]
- Duine, G.J.; Carvalho, L.M.V.; Jones, C. Mesoscale patterns associated with two distinct heatwave events in coastal Santa Barbara, California, and their impact on local fire risk conditions. Weather. Clim. Extrem. 2022, 37, 100482. [Google Scholar] [CrossRef]
- Zigner, K.; Carvalho, L.; Peterson, S.; Fujioka, F.; Duine, G.J.; Jones, C.; Roberts, D.; Moritz, M. Evaluating the Ability of FARSITE to Simulate Wildfires Influenced by Extreme, Downslope Winds in Santa Barbara, California. Fire 2020, 3, 29. [Google Scholar] [CrossRef]
- Kolden, C.A.; Abatzoglou, J.T. Spatial distribution of wildfires ignited under katabatic versus non-katabatic winds in mediterranean Southern California USA. Fire 2018, 1, 19. [Google Scholar] [CrossRef]
- Skamarock, W.C.; Klemp, J.B.; Dudhia, J.; Gill, D.O.; Barker, D.M.; Wang, W.; Powers, J.G. A description of the Advanced Research WRF version 3. NCAR Technical note-475+ STR. Univ. Corp. Atmos. Res. 2008. [Google Scholar]
- Thompson, M.P.; Bowden, P.; Brough, A.; Scott, J.H.; Gilbertson-Day, J.; Taylor, A.; Anderson, J.; Haas, J.R. Application of wildfire risk assessment results to wildfire response planning in the southern Sierra Nevada, California, USA. Forests 2016, 7, 64. [Google Scholar] [CrossRef]
- Keane, R.E.; Agee, J.K.; Fule, P.; Keeley, J.E.; Key, C.; Kitchen, S.G.; Schulte, L.A. Ecological effects of large fires on US landscapes: Benefit or catastrophe? A. Int. J. Wildland Fire 2009, 17, 696–712. [Google Scholar] [CrossRef]
- Calkin, D.E.; Cohen, J.D.; Finney, M.A.; Thompson, M.P. How risk management can prevent future wildfire disasters in the wildland-urban interface. Proc. Natl. Acad. Sci. USA 2014, 111, 746–751. [Google Scholar] [CrossRef] [PubMed]
- Arno, S.F.; Brown, J.K. Overcoming the Paradox in Managing Wildland Fire; Western Wildlands, Montana Forest and Conservation Experiment Station: Missoula, MT, USA, 1991; pp. 40–46. [Google Scholar]
- Cohen, J. The wildland-urban interface fire problem. Fremontia 2010, 38, 16–22. [Google Scholar]
- Syphard, A.D.; Brennan, T.J.; Keeley, J.E. The importance of building construction materials relative to other factors affecting structure survival during wildfire. Int. J. Disaster Risk Reduction 2017, 21, 140–147. [Google Scholar] [CrossRef]
- Syphard, A.D.; Keeley, J.E. Factors associated with structure loss in the 2013–2018 California wildfires. Fire 2019, 2, 49. [Google Scholar] [CrossRef]
- Finney, M.A. FARSITE: Fire Area Simulator-Model Development and Evaluation; U.S. Department of Agriculture, Forest Service, Rocky Mountain Research Station: Fort Collins, CO, USA, 1998.
- Stratton, R.D. Guidance on Spatial Wildland Fire Analysis: Models, Tools, and Techniques; U.S. Department of Agriculture, Forest Service, Rocky Mountain Research Station: Ft. Collins, CO, USA, 2006.
- Scott, J.H. Comparison of Crown Fire Modeling Systems Used in Three Fire Management Applications; U.S. Department of Agriculture, Forest Service, Rocky Mountain Research Station: Ft. Collins, CO, USA, 2006.
- Finney, M.A.; Ryan, K.C. Use of the FARSITE Fire Growth Model for Fire Prediction in U.S. National Parks. In Proceedings of the International Emergency Management and Engineering Conference, San Diego, CA, USA, 9–12 May 1995; pp. 183–189. [Google Scholar]
- Papadopoulos, G.D.; Pavlidou, F.N. A Comparative Review on Wildfire Simulators. IEEE Syst. J. 2011, 5, 233–243. [Google Scholar] [CrossRef]
- Rothermel, R.C. A Mathematical Model. for Predicting Fire Spread in Wildland Fuels; U.S. Department of Agriculture, Forest Service, Intermountain Forest and Range Experiment Station: Ogden, UT, USA, 1972; p. 40.
- Preisler, H.K.; Brillinger, D.R.; Burgan, R.E.; Benoit, J.W. Probability based models for estimation of wildfire risk. Int. J. Wildland Fire 2004, 13, 133–142. [Google Scholar] [CrossRef]
- Peterson, S.H.; Moritz, M.A.; Morais, M.E.; Dennison, P.E.; Carlson, J.M. Modelling long-term fire regimes of southern California shrublands. Int. J. Wildland Fire 2011, 20, 1–16. [Google Scholar] [CrossRef]
- Moritz, M.A.; Moody, T.J.; Krawchuk, M.A.; Hughes, M.; Hall, A. Spatial variation in extreme winds predicts large wildfire locations in chaparral ecosystems. Geophys. Res. Lett. 2010, 37. [Google Scholar] [CrossRef]
- Parisien, M.A.; Snetsinger, S.; Greenberg, J.A.; Nelson, C.R.; Schoennagel, T.; Dobrowski, S.Z.; Moritz, M.A. Spatial variability in wildfire probability across the western United States. Int. J. Wildland Fire 2012, 21, 313–327. [Google Scholar] [CrossRef]
- Murray, A.T.; Carvalho, L.; Church, R.L.; Jones, C.; Roberts, D.; Xu, J.; Zigner, K.; Nash, D. Coastal vulnerability under extreme weather. Appl. Spat. Anal. Policy 2020, 14, 1–27. [Google Scholar] [CrossRef]
- Marsh, M. Santa Barbara County Fire Department, Santa Barbara, CA, USA. Personal communication, 2021.
- Roth, K.L.; Dennison, P.E.; Roberts, D.A. Comparing Endmember Selection Techniques for Accurate Mapping of Plant Species and Land Cover Using Imaging Spectrometer Data. Remote Sens. Environ. 2012, 127, 139–152. [Google Scholar] [CrossRef]
- Scott, J.H.; Thompson, M.P.; Calkin, D.E. A Wildfire Risk Assessment Framework for Land and Resource Management; RMRS-GTR-315; U.S. Department of Agriculture, Forest Service, Rocky Mountain Research Station: Ft. Collins, CO, USA, 2013.
- Finney, M.A.; McHugh, C.W.; Grenfell, I.C.; Riley, K.L.; Short, K.C. A simulation of probabilistic wildfire risk components for the continental United States. Stoch. Environ. Res. Risk Assess. 2011, 25, 973–1000. [Google Scholar] [CrossRef]


Publisher’s Note: MDPI stays neutral with regard to jurisdictional claims in published maps and institutional affiliations. |
© 2022 by the authors. Licensee MDPI, Basel, Switzerland. This article is an open access article distributed under the terms and conditions of the Creative Commons Attribution (CC BY) license (https://creativecommons.org/licenses/by/4.0/).
Share and Cite
Zigner, K.; Carvalho, L.M.V.; Jones, C.; Benoit, J.; Duine, G.-J.; Roberts, D.; Fujioka, F.; Moritz, M.; Elmquist, N.; Hazard, R. Wildfire Risk in the Complex Terrain of the Santa Barbara Wildland–Urban Interface during Extreme Winds. Fire 2022, 5, 138. https://doi.org/10.3390/fire5050138
Zigner K, Carvalho LMV, Jones C, Benoit J, Duine G-J, Roberts D, Fujioka F, Moritz M, Elmquist N, Hazard R. Wildfire Risk in the Complex Terrain of the Santa Barbara Wildland–Urban Interface during Extreme Winds. Fire. 2022; 5(5):138. https://doi.org/10.3390/fire5050138
Chicago/Turabian StyleZigner, Katelyn, Leila M. V. Carvalho, Charles Jones, John Benoit, Gert-Jan Duine, Dar Roberts, Francis Fujioka, Max Moritz, Nic Elmquist, and Rob Hazard. 2022. "Wildfire Risk in the Complex Terrain of the Santa Barbara Wildland–Urban Interface during Extreme Winds" Fire 5, no. 5: 138. https://doi.org/10.3390/fire5050138
APA StyleZigner, K., Carvalho, L. M. V., Jones, C., Benoit, J., Duine, G.-J., Roberts, D., Fujioka, F., Moritz, M., Elmquist, N., & Hazard, R. (2022). Wildfire Risk in the Complex Terrain of the Santa Barbara Wildland–Urban Interface during Extreme Winds. Fire, 5(5), 138. https://doi.org/10.3390/fire5050138