Article

Feed Gas Composition and Humidity Shape Reactive Species Signatures in a Clinical Cold Plasma Jet


1
ZIK plasmatis, Leibniz Institute for Plasma Science and Technology (INP), Felix-Hausdorff-Str. 2, 17489 Greifswald, Germany
2
Department of Dermatology, Venerology, and Allergology, Rostock University Medical Center, Strempelstr. 13, 18057 Rostock, Germany
*
Author to whom correspondence should be addressed.
Plasma 2026, 9(3), 27; https://doi.org/10.3390/plasma9030027
Submission received: 3 July 2026 / Revised: 25 July 2026 / Accepted: 29 July 2026 / Published: 31 July 2026
(This article belongs to the Special Issue Processes in Atmospheric-Pressure Plasmas—2nd Edition)

Abstract

Reactive oxygen and nitrogen species (RONS) generated by medical gas plasmas are considered major mediators of plasma-induced biological effects. This includes the atmospheric pressure argon plasma jet kINPen routinely used in clinical applications. The jet’s biomedical action has been shown to be tailored by modifying its feed gas. However, a systematic comparison of how feed gas composition and humidity shape plasma chemistry remains lacking, which would shift application-specific plasma chemistries from guessing to designing. In this study, we systematically investigated, compared, and statistically related 65 individual feed gas conditions of the kINPen argon plasma jet by increasing O2, N2, and combined O2 + N2 admixtures under dry and humidified conditions. Plasma gas phases were assessed using optical emission spectroscopy and reactive species produced in liquid via hydrogen peroxide, nitrite, and nitrate quantification. O2-containing admixtures generally reduced overall plasma emission and liquid-phase RONS accumulation, whereas N2-containing admixtures preferentially enhanced nitrogen-associated emission features. Water vapor addition via the admixture gas stream acted as an important secondary tuning parameter, exerting the strongest effects under combined O2 + N2 conditions. Multivariate analyses confirmed clear separation of chemistry profiles according to feed gas composition and humidity, while correlation and regression analyses identified several condition-dependent relationships between gas-phase emissions and liquid-phase reaction products. These data provide a comprehensive characterization of kINPen plasma chemistry under controlled feed gas modification and establish a reference framework for tailoring plasma-derived reactive species profiles in future plasma biology and medicine studies.

Graphical Abstract

1. Introduction

Cold gas plasma (hereafter referred to as plasma) has emerged as a promising technology in biomedicine and has demonstrated beneficial effects in a wide range of applications, including chronic wound management [1,2,3], anti-infective therapy [4], tissue regeneration [5,6], and cancer treatment [7,8]. Several plasma sources have already entered clinical practice [9,10], highlighting the translational potential of this technology and stimulating efforts to better understand the underlying mechanisms governing plasma-biological interactions.
The biological effects of plasma are primarily attributed to the generation of reactive oxygen and nitrogen species (RONS) [11,12,13]. These species are formed during the (partial) ionization of a carrier gas, most commonly a noble gas, such as argon, and comprise a complex mixture of short- and long-lived oxygen- and nitrogen-derived reactive molecules [14,15,16]. Upon contact with biological targets, plasma-derived RONS can alter cellular redox homeostasis and initiate signaling processes that regulate proliferation, differentiation, inflammation, antimicrobial responses, and cell death [17,18,19]. The composition and abundance of generated RONS strongly depend on plasma source characteristics and operational parameters, including feed gas composition, surrounding atmosphere, humidity, and treatment conditions [20,21]. Consequently, a detailed understanding of how these parameters shape plasma chemistry is essential for the rational development and optimization of plasma-based applications.
Among clinically established plasma devices, the atmospheric-pressure argon plasma jet kINPen MED has been extensively investigated and approved for medical use since 2013 [22]. Although the effects of feed gas composition and humidity on kINPen plasma chemistry have been investigated individually [23,24,25,26,27,28,29,30,31,32,33,34,35,36,37,38,39,40,41], their combined influence across oxygen (O2), nitrogen (N2), and O2 + N2 admixtures has not been systematically compared. Such data would allow a prediction of operating conditions ideal for minimizing or maximizing desired species generation, such as atomic oxygen enhancement shown to increase kINPen anticancer efficacy [42], decrease 357 nm emission profiles associated with poor plasma tolerability [43], and elevate hydrogen peroxide to maximize antimicrobial effects [44]. To this end, this study characterized the emission profiles and liquid species production under controlled dry and humidified operating conditions. Feed gas-dependent reactive species signatures and major plasma chemistry shifts were mapped, for the first time in this variety, based on an array of 65 different kINPen feed gas operating conditions.

2. Materials and Methods

2.1. Cold Gas Plasma Jet

The atmospheric pressure plasma jet kINPen, the research version of the class IIb clinically approved kINPen MED (neoplas med, Greifswald, Germany) [22], was operated using its standard radiofrequency (RF) power supply at a frequency of 1 MHz and a voltage of 2–6 kV with automatic impedance matching. High-purity argon gas (99.9999%; Air Liquide, Düsseldorf, Germany) served as the feed gas at a flow rate of one standard liter per minute (slm). All experiments were performed using identical device operating conditions, while only the feed gas composition and humidification were varied according to the experimental design. To modulate the plasma chemistry, varying admixtures of O2 and N2, either alone or in combination, were supplied to the feed gas. The reported admixture values represent volumetric flow fractions (vol%) of the total feed gas flow, which was maintained at 1 slm throughout all experiments. Both dry and humidified conditions were investigated. Humidified conditions were generated by passing either the argon carrier gas or the respective admixture gas stream (O2 or N2) through double-distilled water prior to plasma generation. Consequently, humidified argon and humidified admixture conditions were investigated separately. Humidification percentages indicate the fraction of the total feed gas flow routed through the water-filled humidifier prior to plasma generation and do not represent the resulting water vapor concentration. Because humidification was applied separately to the individual gas streams, the absolute amount of water vapor introduced into the plasma may have differed between the different feed gas compositions. Apart from the intentional variation in feed gas composition and humidification, all other plasma operating conditions remained constant throughout the study.

2.2. Optical Emission Spectroscopy

Reactive oxygen and nitrogen species generated in the plasma gas phase were characterized by optical emission spectroscopy (OES). Emission spectra were recorded using a UV-sensitive spectrometer (AvaSpec-2048-USB2; Avantes, Apeldoorn, The Netherlands) with a spectral resolution of 0.7 nm. Spectral acquisition was performed in an end-on configuration at a distance of 50 mm from the plasma jet nozzle. Emission spectra were collected over a wavelength range of 200–1100 nm. Characteristic emission peaks were quantified by determining the maximum emission intensity at the respective wavelength and normalizing it to the intensity of the argon emission peak at 763 nm. The primary species analyzed were hydroxyl radicals (OH, 309 nm), molecular nitrogen (N2, 337 nm), and atomic oxygen (O, 777 nm). Additional emission features were analyzed as indicated. Emission intensities were evaluated consistently for all spectra using identical acquisition parameters and analysis procedures. The resulting values were used for comparative assessment of optical emission signatures and were not intended for quantitative analysis or determination of plasma parameters.

2.3. Hydrogen Peroxide Quantification

H2O2 concentrations in 20–60 s plasma-treated phosphate-buffered saline (PBS) were quantified using the titanyl sulfate assay. Briefly, 300 µL of PBS was exposed to the plasma under the indicated treatment conditions with a nozzle-to-sample distance of 10 mm. Subsequently, 50 µL aliquots of the plasma-treated PBS were mixed with titanyl sulfate reagent, producing a yellow peroxotitanium complex. Absorbance was measured at 405 nm using a microplate reader (M200 Infinite Pro; Tecan, Männedorf, Switzerland). H2O2 concentrations were determined by comparison from standard curves prepared from serial dilutions of hydrogen peroxide.

2.4. Nitrite and Nitrate Quantification

NO2 and NO3 concentrations were quantified using a Griess assay-based approach. For each condition, 300 µL of PBS was treated with plasma for 20 s. at a nozzle-to-sample distance of 10 mm. Following this, 50 µL aliquots of the treated PBS were used for subsequent analysis. For NO2 determination, 20 s plasma-treated PBS was incubated with Griess reagents, and absorbance was measured at 540 nm using a microplate reader (M200 Infinite Pro; Tecan, Männedorf, Switzerland). Total NO2 plus NO3 concentrations were determined following enzymatic reduction of NO3 to NO2 prior to Griess reagent addition. NO3 concentrations were calculated by subtracting NO2 from total NO3 plus NO2 concentrations. Quantification was performed using NO2 and NO3 standard curves, respectively.

2.5. Statistical Analysis

Data were processed using Microsoft Excel (Microsoft, Redmond, WA, USA) and visualized using Prism 10.6 (GraphPad Software, Boston, MA, USA). Statistical analyses included linear and non-linear regression as well as Spearman correlation analyses, as appropriate. For families of related statistical tests, p-values were adjusted using the two-stage step-up procedure of Benjamini, Krieger, and Yekutieli to control the false discovery rate. Data are presented as mean ± standard error of the mean (SEM), unless stated otherwise. Details of the statistical analyses are provided in the corresponding figure legends where applicable. Statistical significance was defined as p > 0.05 (ns), p ≤ 0.05 (*), p < 0.01 (**), and p < 0.001 (***).

3. Results

3.1. OES Reveals Distinct Gas-Phase Plasma Profiles Under Varying Gas Conditions

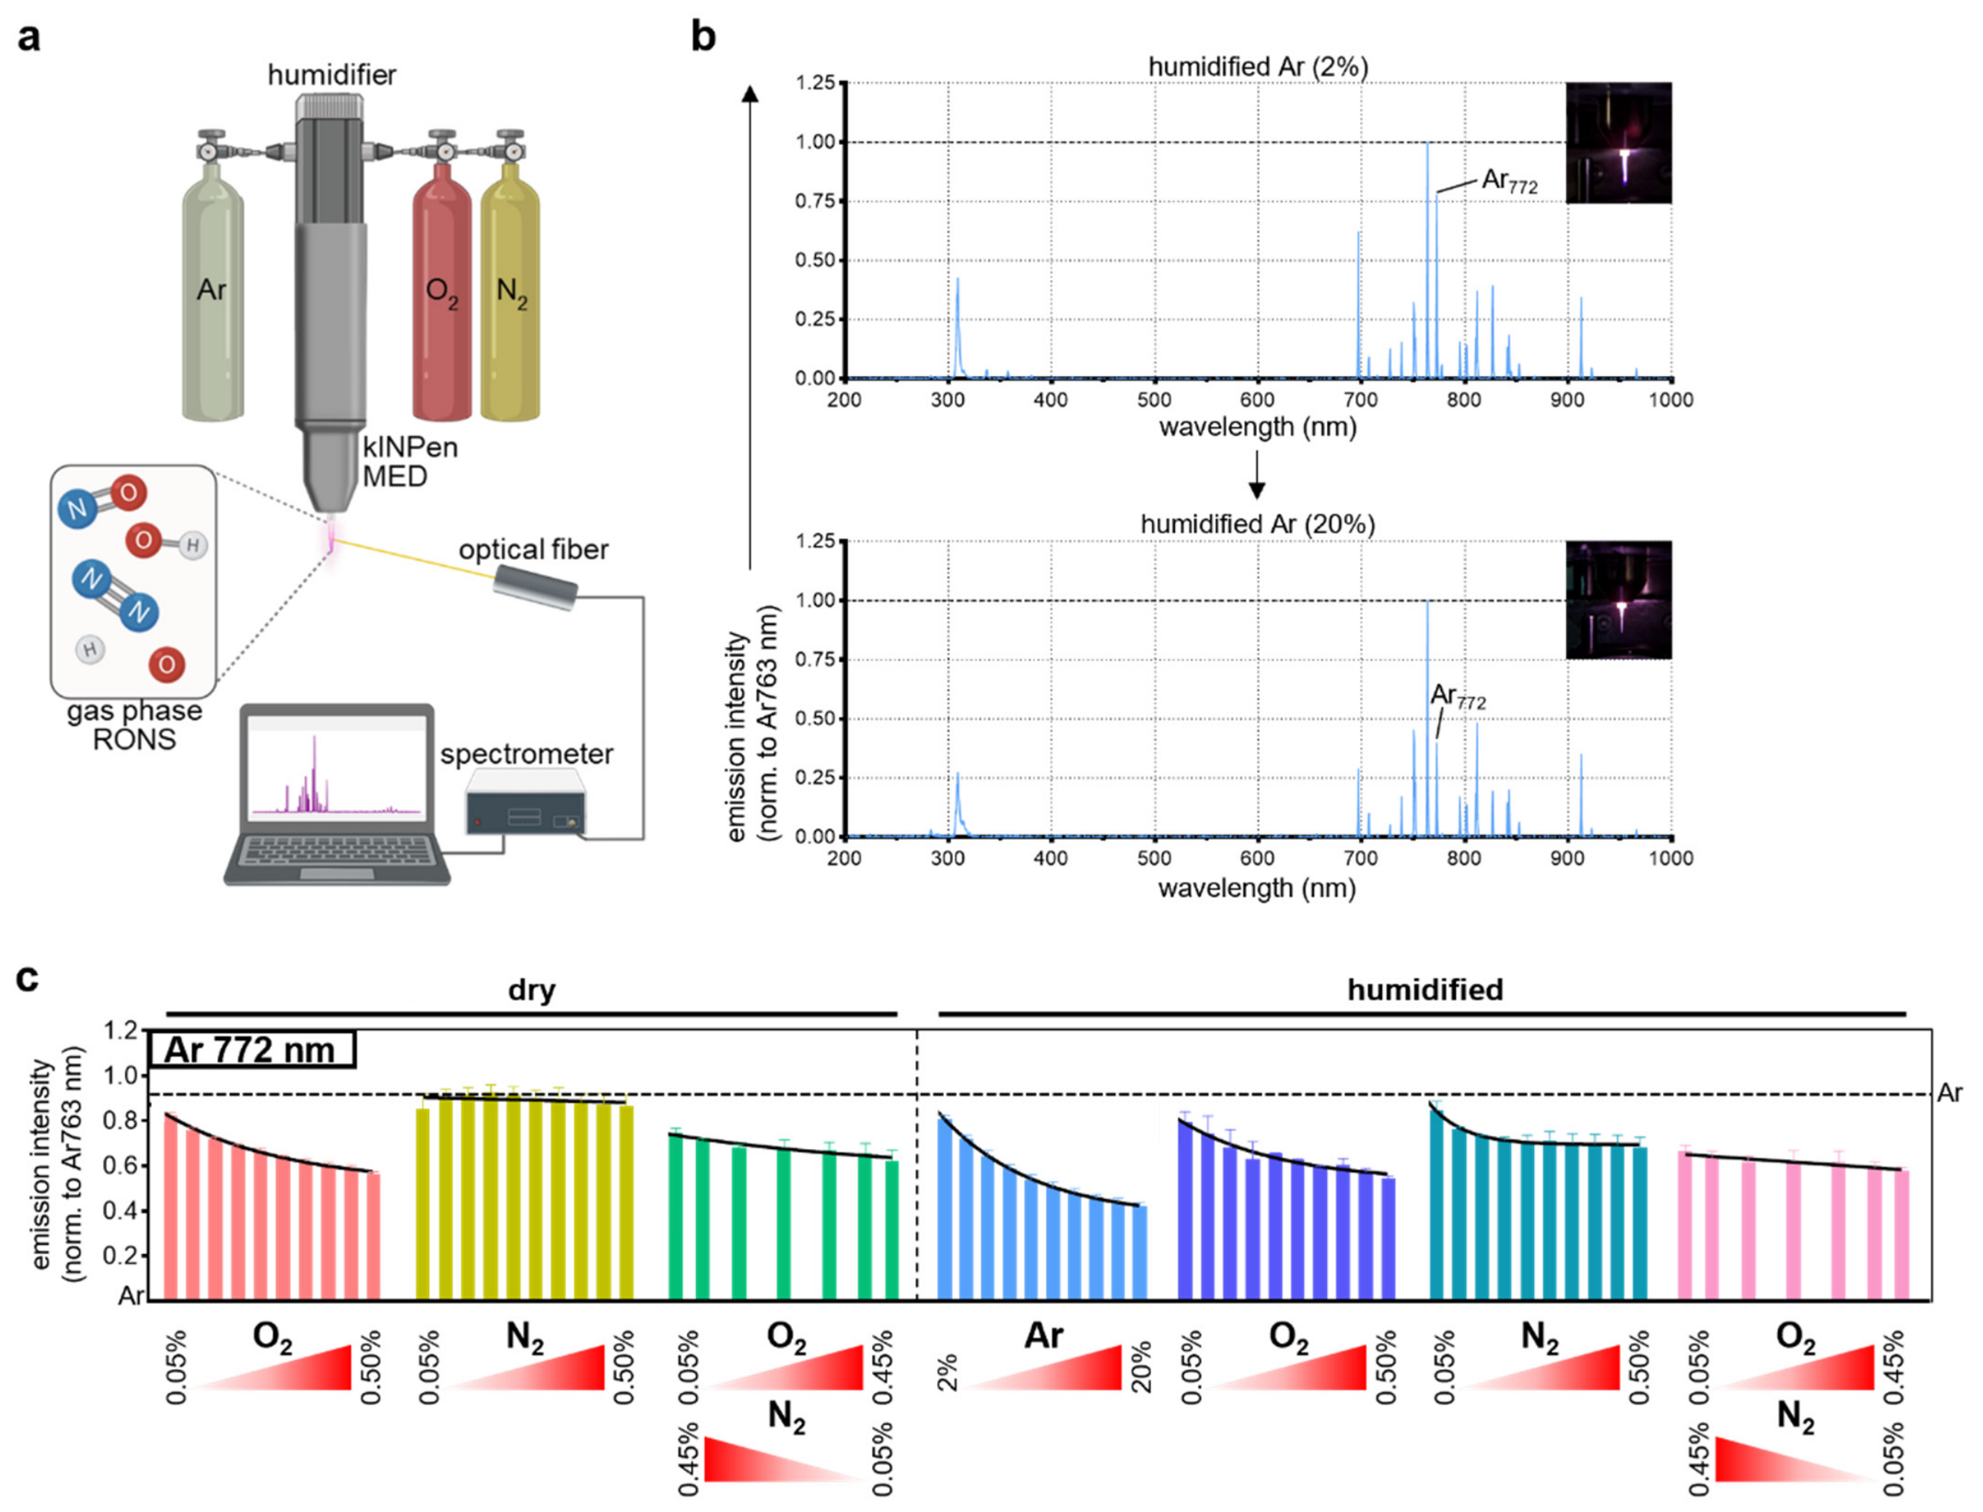
RONS are considered key mediators of cold plasma-derived biological effects, which are partially reflected in the plasma gas and liquid phase. Hence, the kINPen was characterized for increasing O2, N2, and O2 + N2 admixtures under dry and humidified conditions (Table 1). OES was used to assess feed gas-dependent changes in the plasma emission profile (Figure 1a). Representative emission spectra exhibited the characteristic argon emission peak at 772 nm, which served as a representative marker of changes in the overall plasma emission profile across the investigated feed gas conditions (Figure 1b). Increasing admixture concentrations generally reduced the normalized argon emission intensity compared with pure argon operation. This decrease was observed for all admixture groups except dry N2, which remained largely unchanged across the investigated concentration range. Regression analysis demonstrated significant concentration-dependent effects for most gas admixture conditions. At the highest admixture concentrations, argon emission intensities were reduced to 40–60% of the pure argon control (Figure 1c), indicating marked changes in the overall plasma emission profile following feed gas modification.
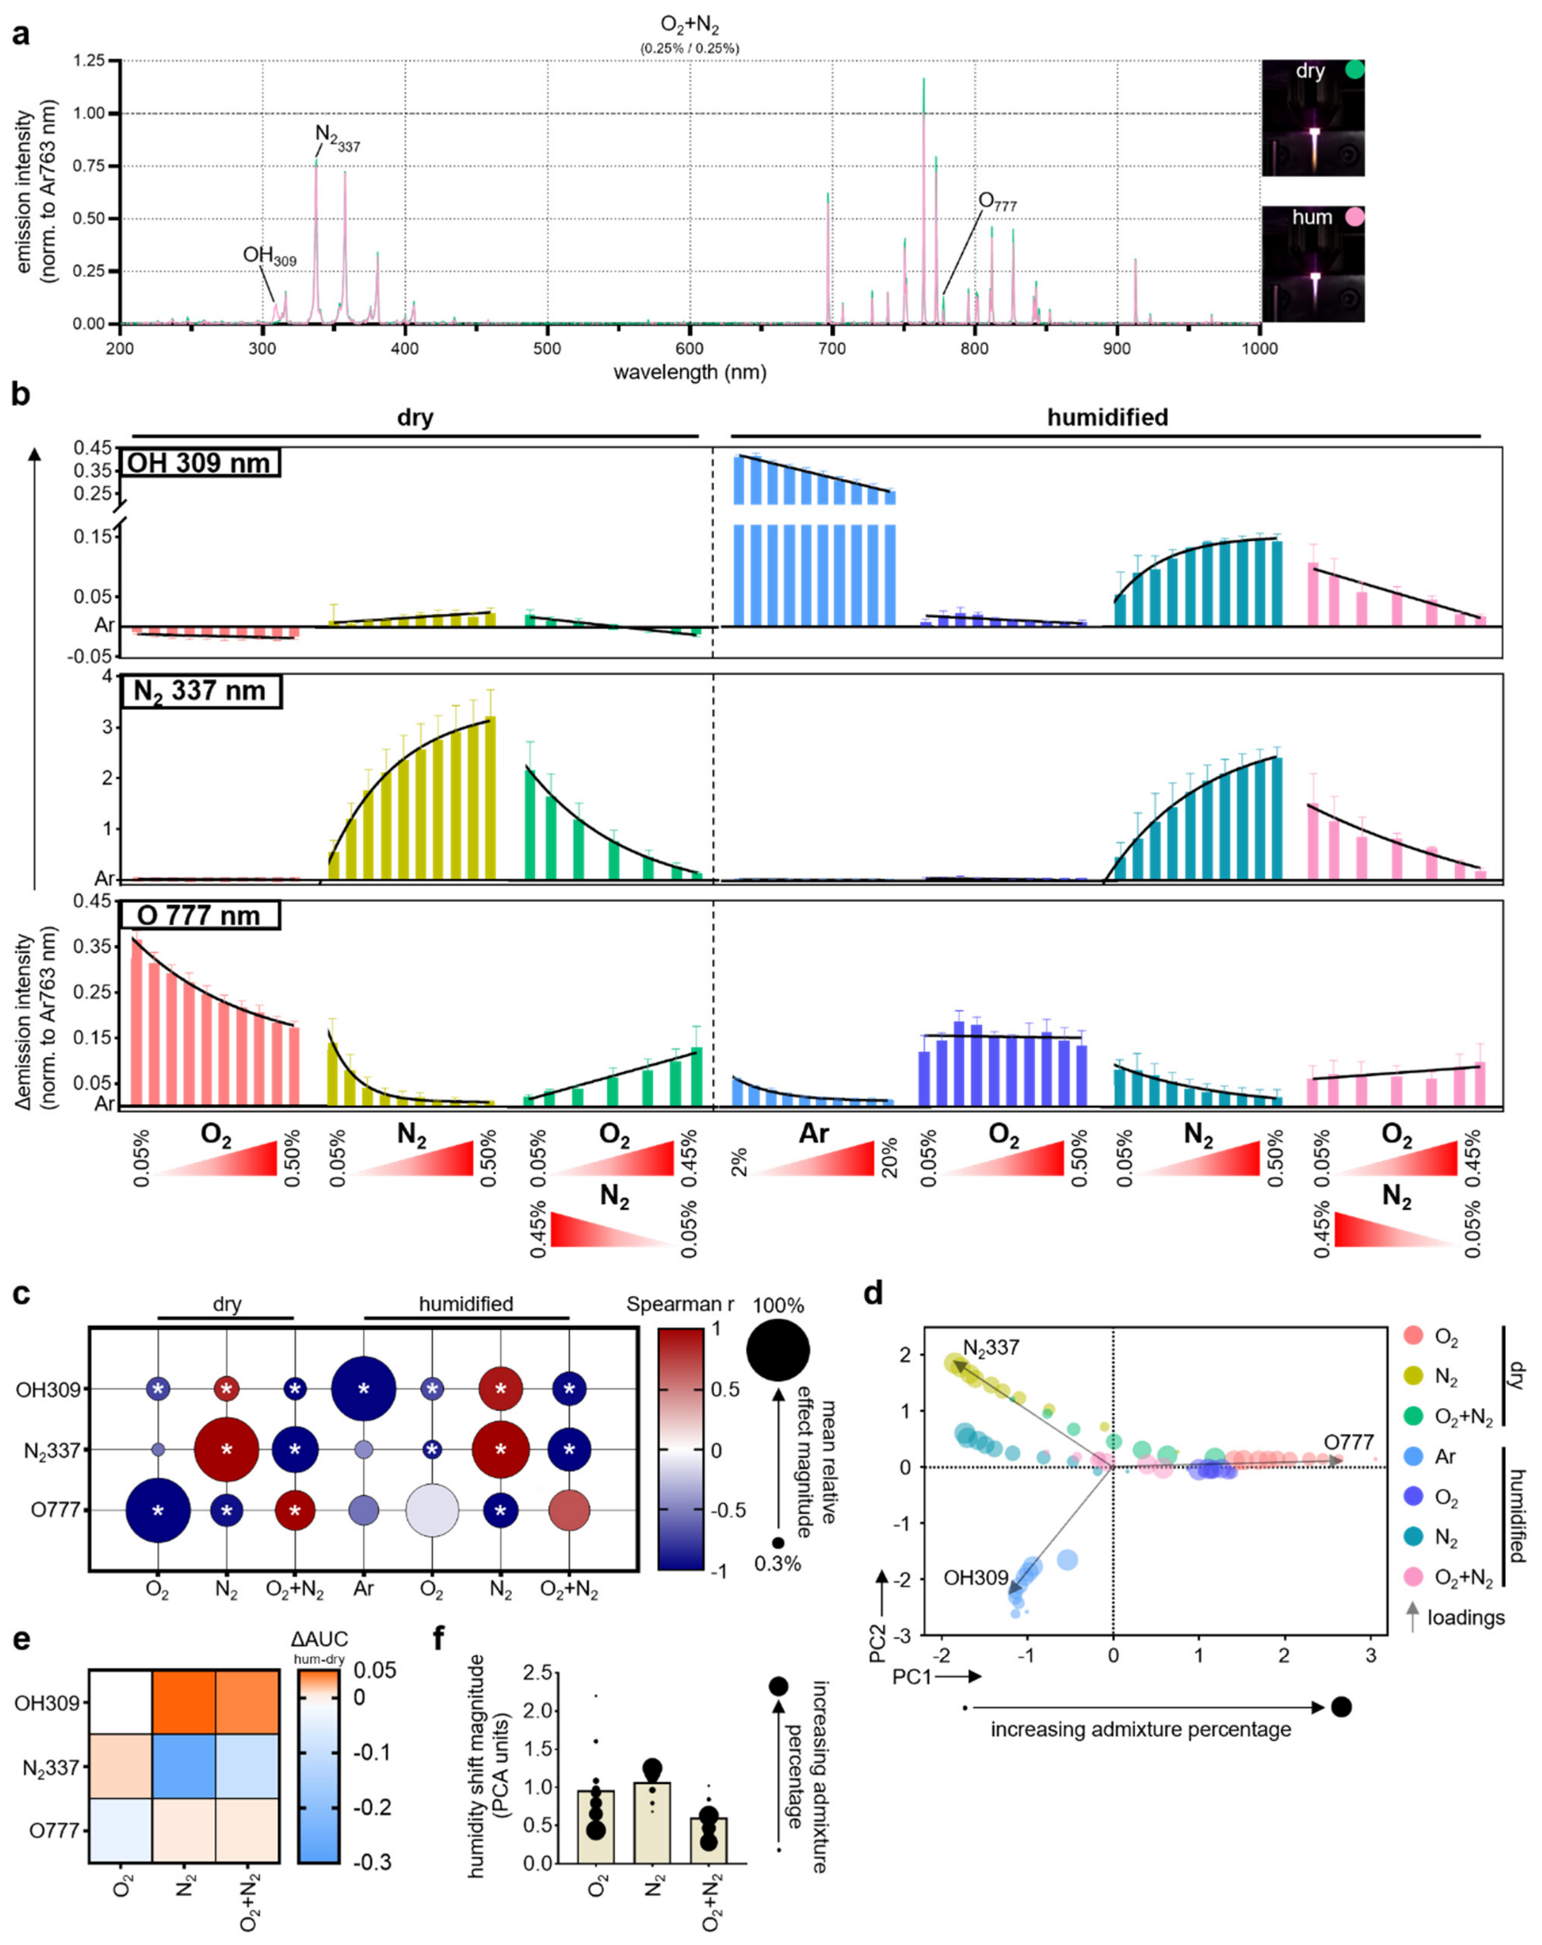
Detailed analysis of the three principal emission features, hydroxyl radicals (OH, 309 nm), second positive system of nitrogen (N2, 337 nm), and atomic oxygen (O, 777 nm), revealed distinct response patterns (Figure 2a).
OH emission decreased progressively with increasing O2-containing admixtures under both dry and humidified conditions, whereas increasing N2 admixtures resulted in slightly elevated OH emission compared with pure argon operation. N2 emission at 337 nm showed pronounced concentration-dependent increases under dry and humidified N2 admixtures, while remaining largely unchanged under O2-containing conditions and humidified argon. In contrast, mixed O2 + N2 admixtures showed progressively lower N2 emission as the proportion of O2 increased within the admixture. Atomic oxygen emission at 777 nm decreased under most feed gas conditions but increased in response to combined O2 + N2 admixtures. Humidified O2 conditions exhibited elevated O emission compared with pure argon; however, this response remained largely independent of admixture concentration (Figure 2b). Regression and correlation analyses confirmed significant concentration-dependent responses for most admixture conditions, with both positive and negative associations observed depending on species and feed gas composition.
Mean relative effect sizes were subsequently calculated to quantify the overall magnitude of admixture-induced changes. Humidified argon produced the strongest overall increase in OH emission, whereas dry and humidified O2 admixtures resulted in the smallest effects. N2 emission was most strongly enhanced by dry N2 admixtures followed by humidified N2 conditions, while O2-containing admixtures produced comparatively weak responses. For O emission, dry O2 admixtures produced the largest relative response magnitudes, whereas N2-containing conditions exhibited comparatively small changes (Figure 2c). Principal component analysis (PCA) of the normalized OES dataset revealed clear clustering according to gas admixture composition. The first two principal components explained 95% of the total variance (PC1: 57%, PC2: 38%). N2-containing admixtures formed a distinct cluster at positive PC1 values, whereas humidified argon conditions clustered separately at negative PC2 values. O2-containing admixtures exhibited comparatively tight clustering, while mixed O2 + N2 conditions occupied intermediate positions within the PCA space (Figure 2d). Importantly, PCA clustering patterns were consistent with the species-specific analyses, supporting specific feed gas-dependent plasma chemistry regimes in such a large data set of 65 feed gas conditions.
The effects of water vapor (humidification) were subsequently analyzed independently of the absolute emission intensities. Humidification moderately increased OH emission under N2 and O2 + N2 admixtures, whereas N2 emission generally decreased under the same conditions. In contrast, O emission at 777 nm was only marginally affected by humidification across all gas compositions (Figure 2e). Quantification of humidity-induced shifts revealed the strongest relative responses at low O2 admixture concentrations, with progressively smaller responses observed at higher O2 fractions. Conversely, N2 admixtures displayed increasing sensitivity to humidification across the investigated concentration range. Mixed O2 + N2 admixtures showed comparatively small but consistent humidity-induced shifts across all concentrations (Figure 2f).
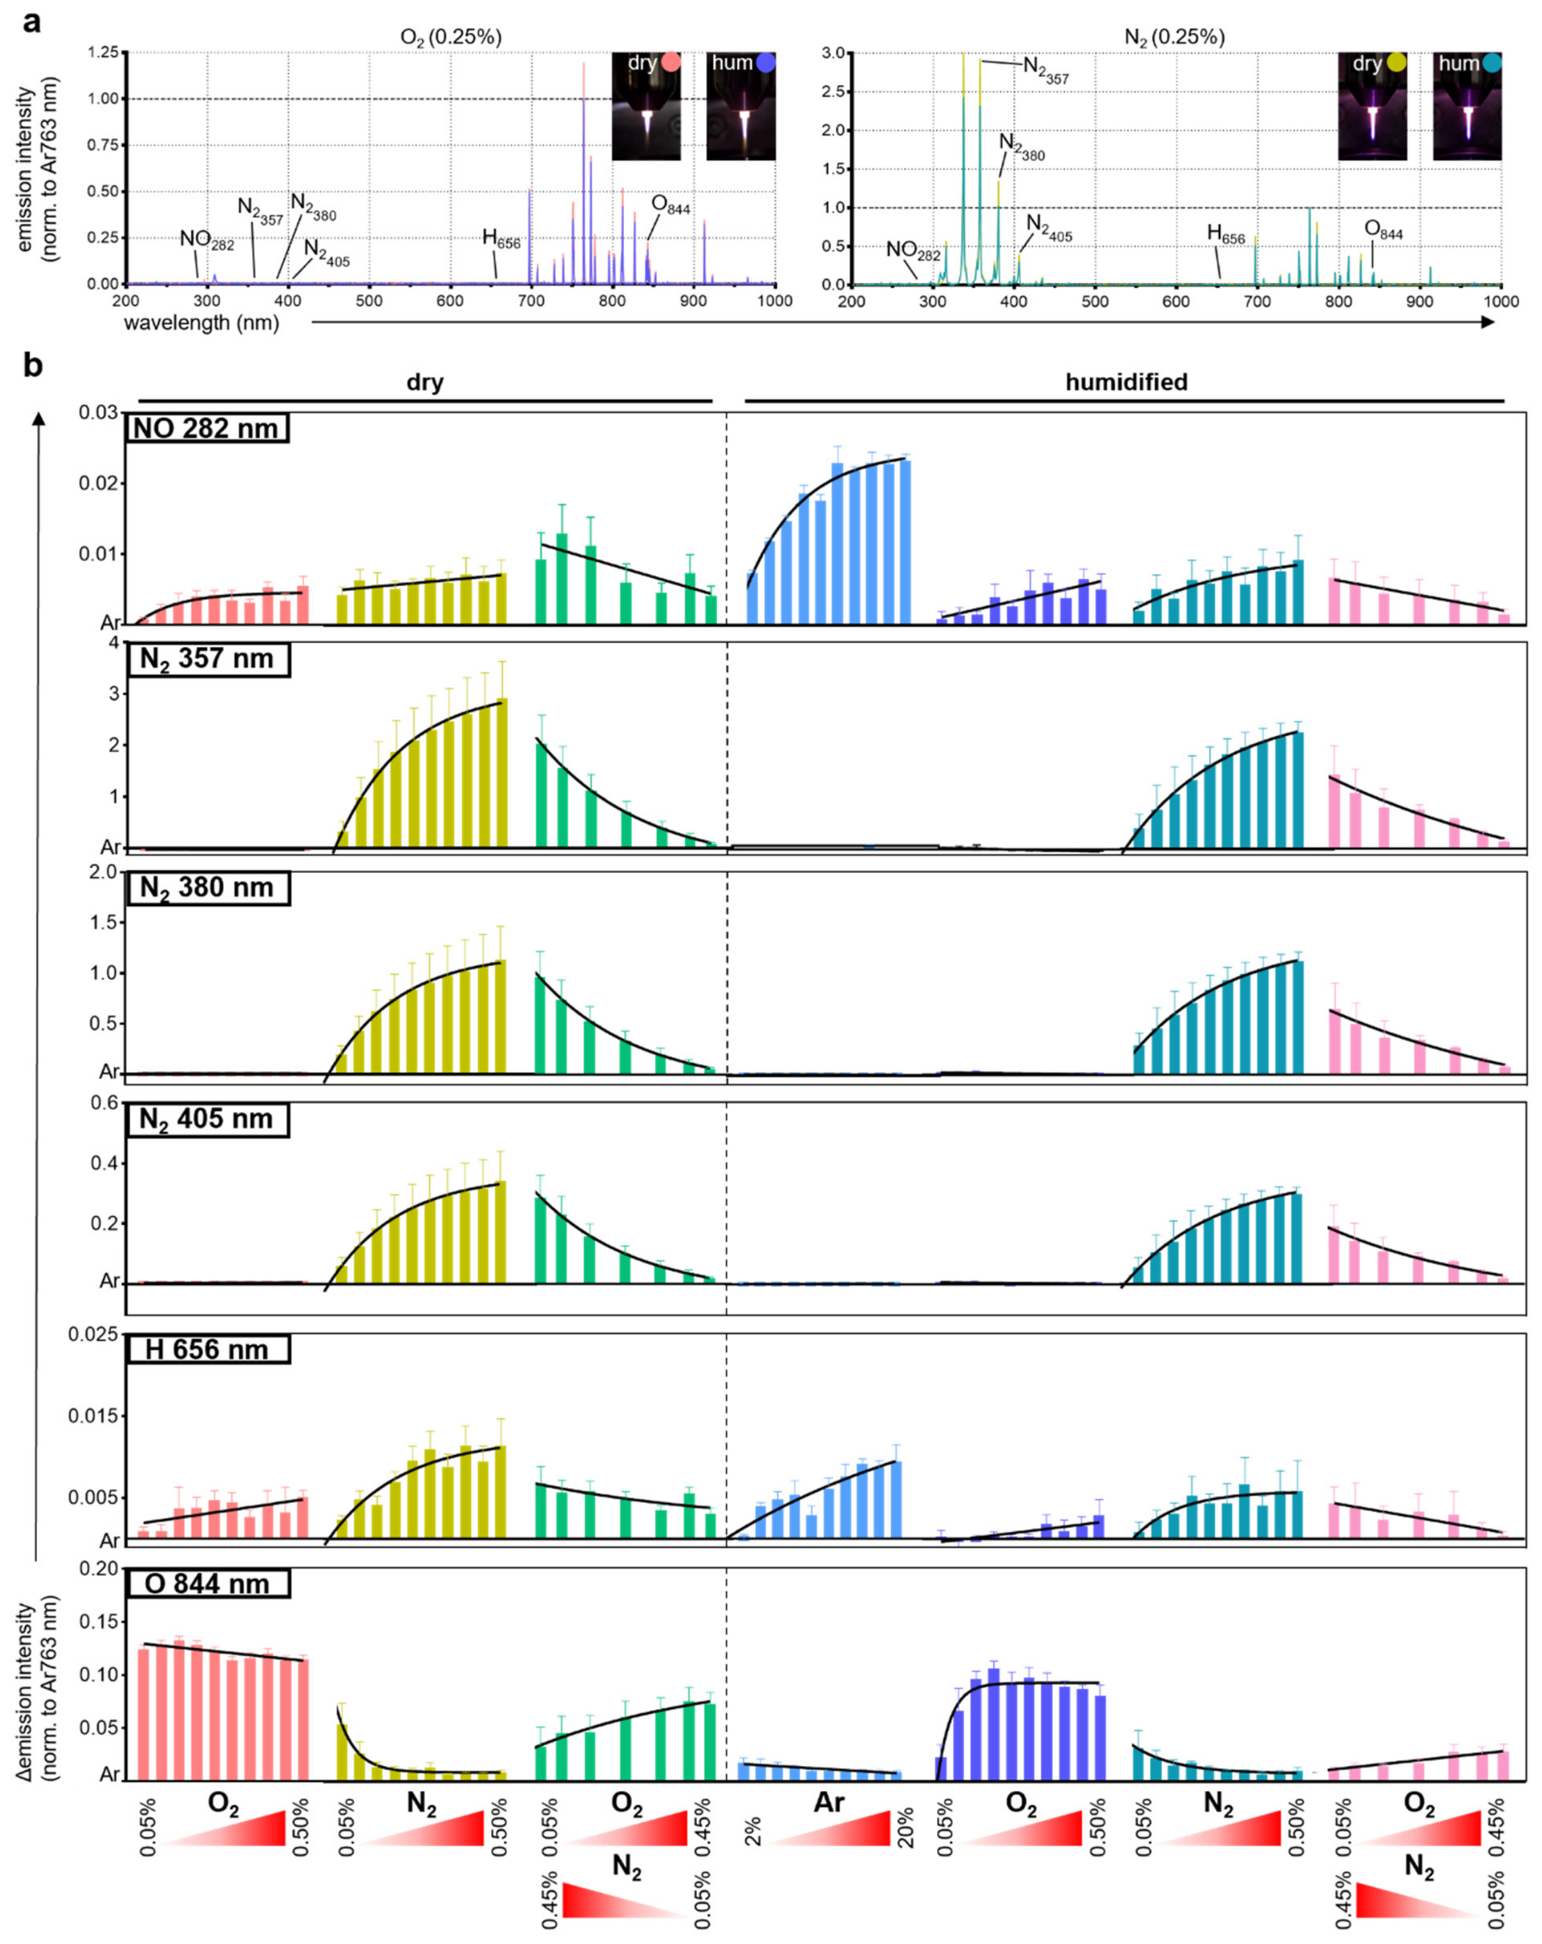
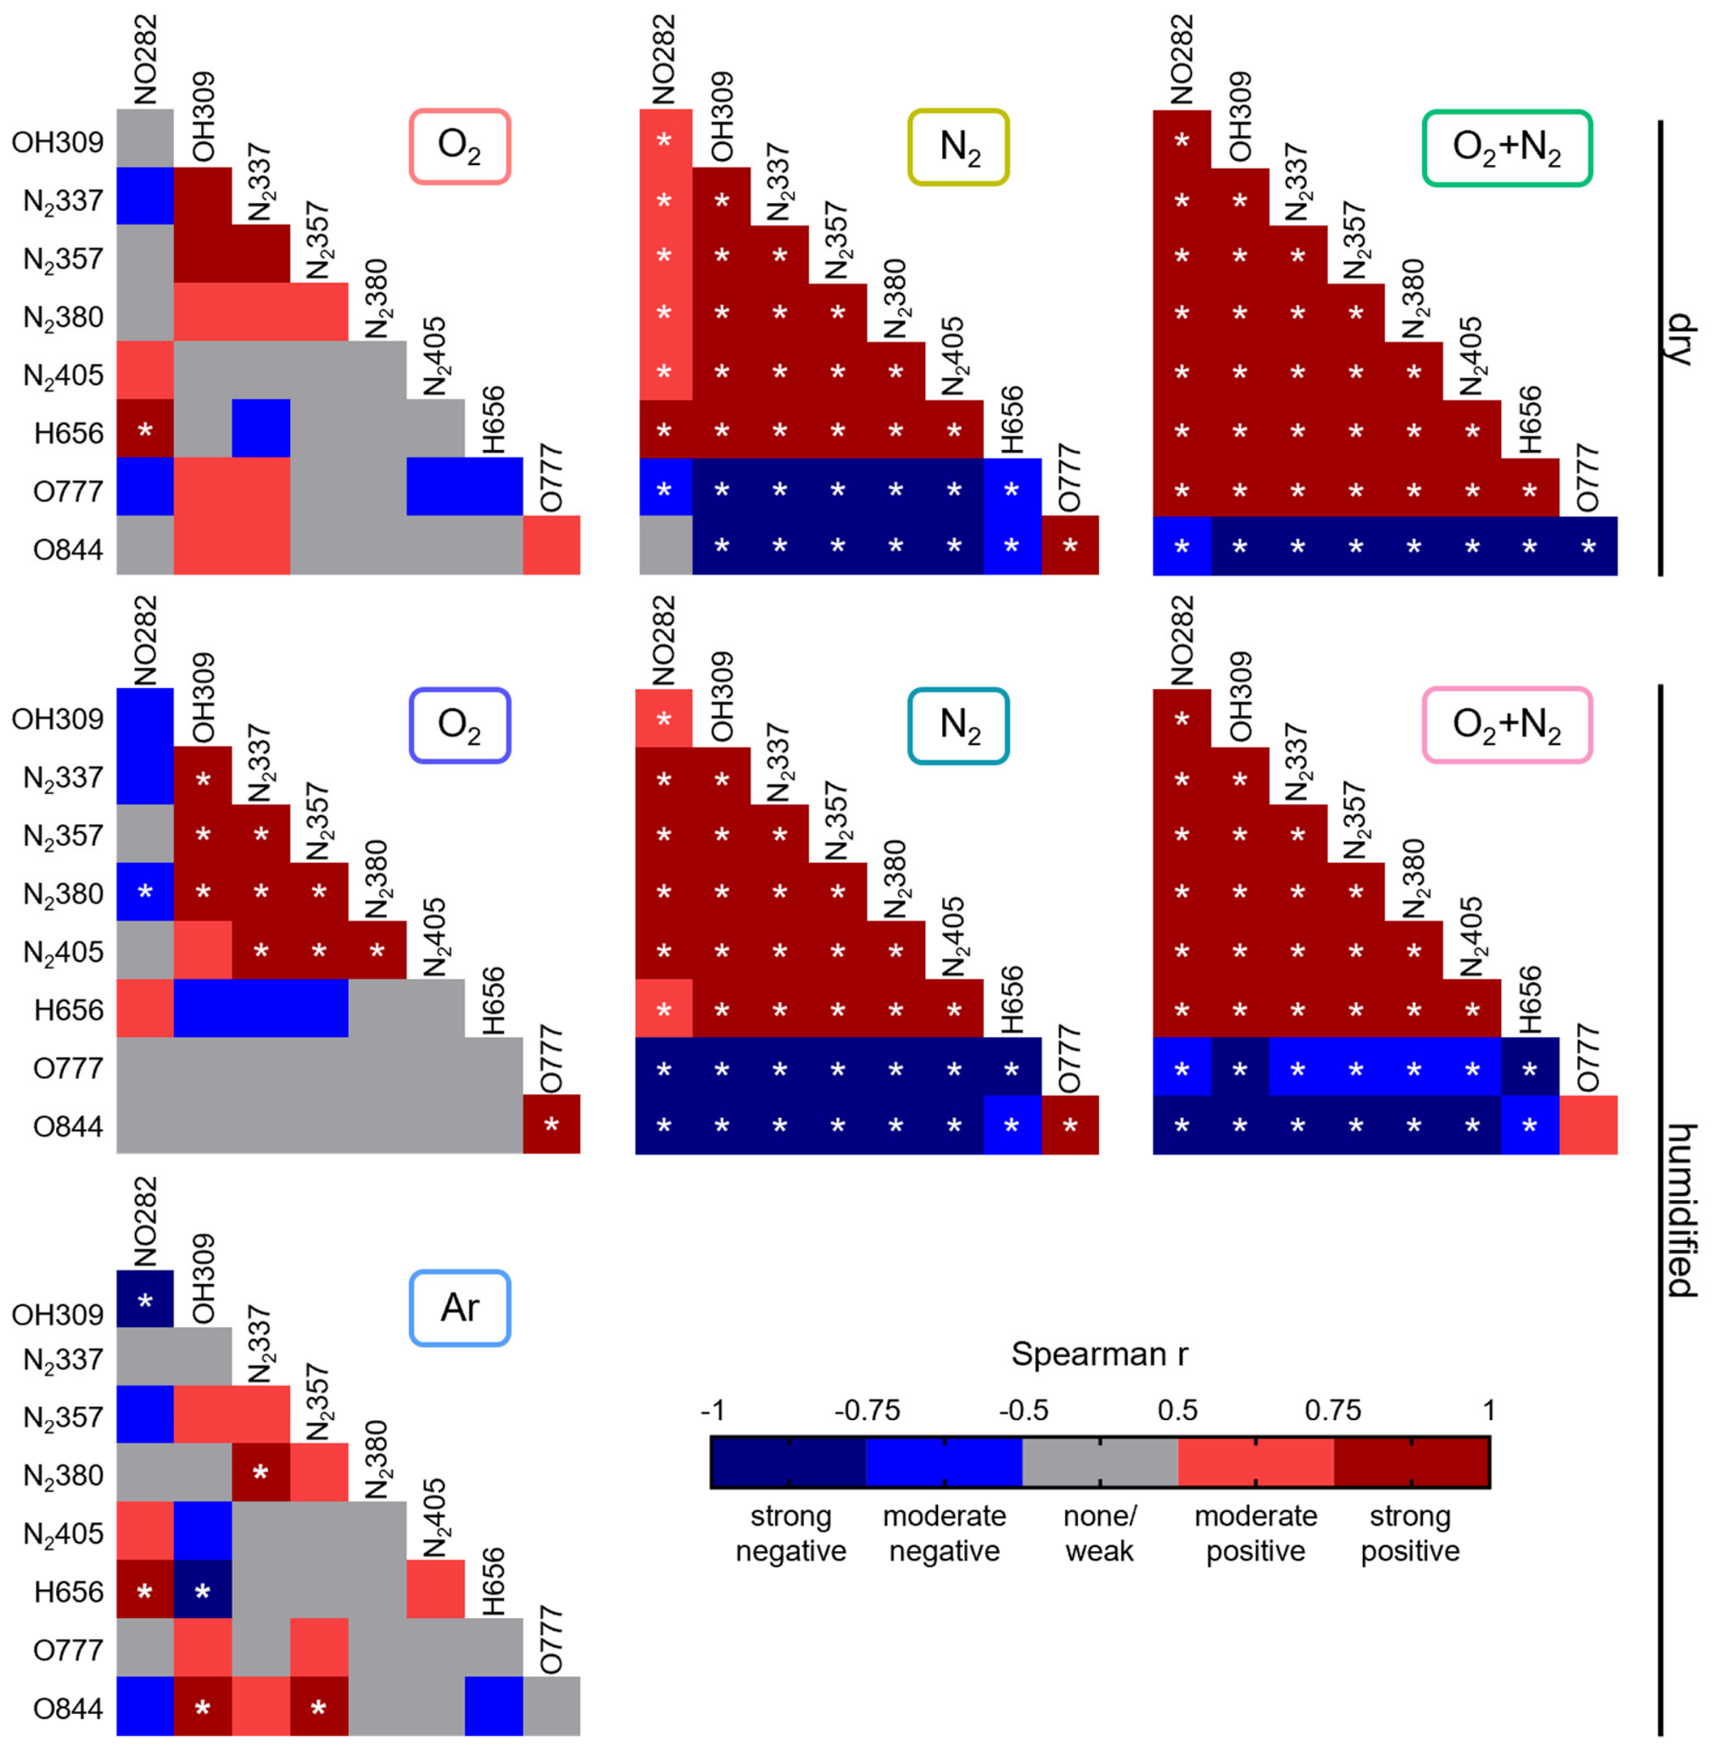
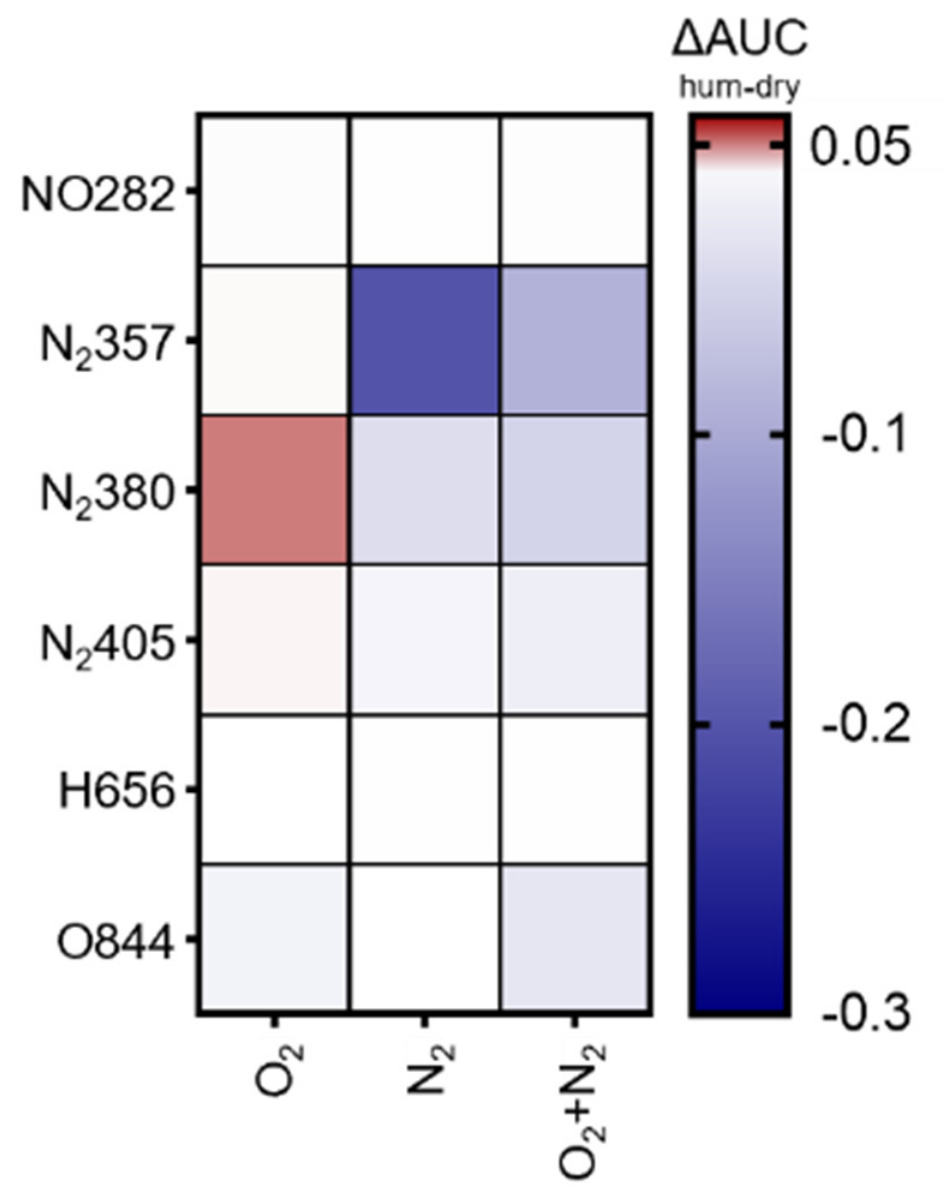
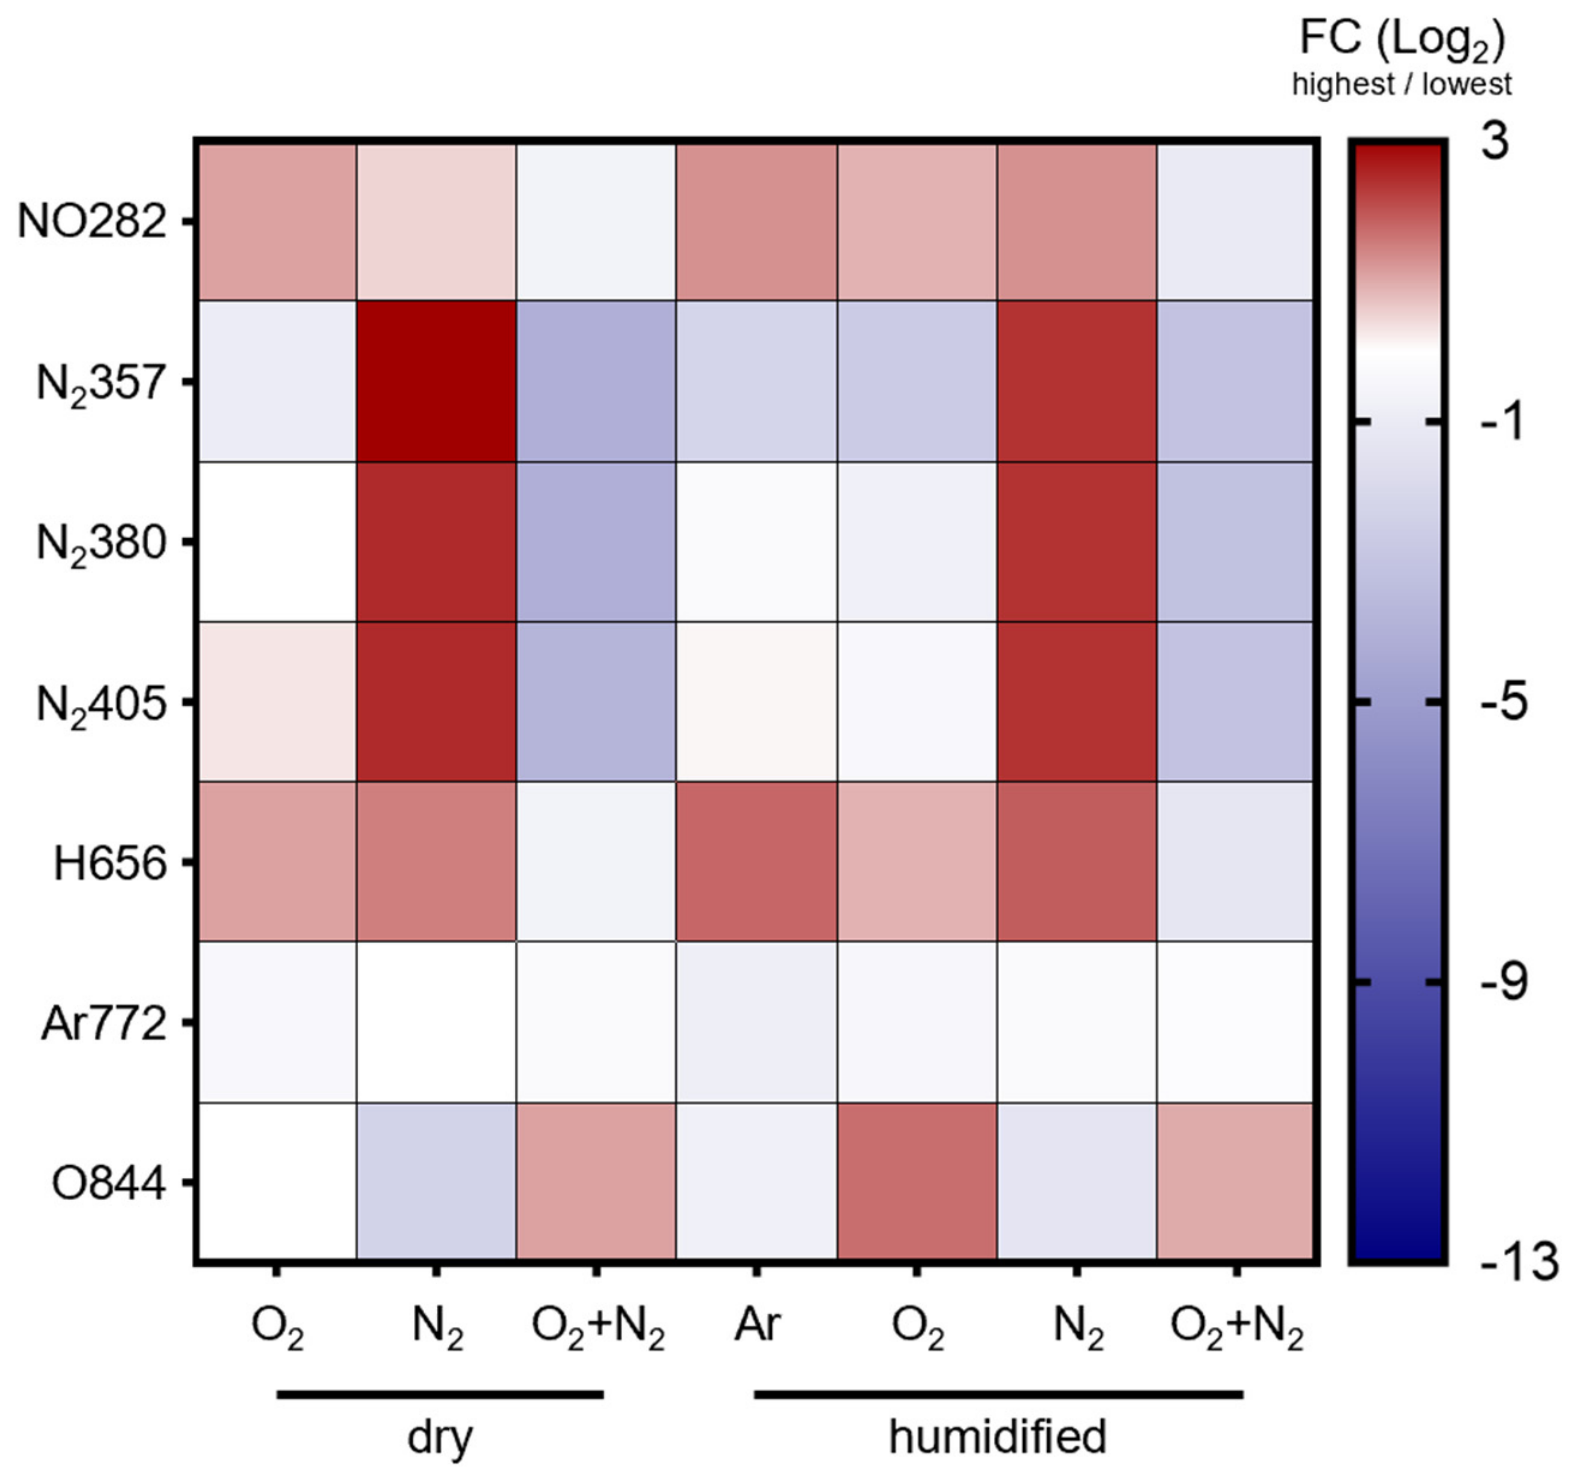
Beyond the principal plasma peaks related to OH (309 nm), N2 (337 nm), and O (777 nm), additional emission features associated with nitrogen-, oxygen-, and hydrogen-containing species, including nitric oxide (NO, 282 nm), more lines of the second positive system of nitrogen (N2, 357 nm, 380 nm, and 405 nm), hydrogen (H, 656 nm), and atomic oxygen (O, 844 nm), were evaluated (Figure A1a). Emissions of the second positive nitrogen system at 357 nm, 380 nm, and 405 nm largely mirrored the response pattern of N2 (337 nm), whereas O (844 nm) closely followed the trends observed for O (777 nm). In contrast, NO (282 nm) exhibited its strongest response under humidified argon conditions, while H (656 nm) was particularly sensitive to N2 admixtures (Figure A1b). Correlation analysis of all investigated emission features revealed largely comparable interaction patterns between dry and humidified conditions within each gas admixture group. Humidification increased the prevalence of strong positive and negative correlations under O2-containing conditions, whereas only minor changes were observed for N2 and O2 + N2 admixtures. Notably, humidification reversed the correlation pattern of O (777 nm) relative to several other emission features, shifting from predominantly positive to predominantly negative associations (Figure A2). Humidity-induced changes to other emission features were generally modest, with the strongest decrease observed for N2 (357 nm) under humidified N2 admixtures (Figure A3). Collectively, these findings demonstrate that the supplementary emission features largely recapitulate the trends observed for the principal plasma species and further support the influence of feed gas composition and humidification on gas-phase plasma chemistry.

3.2. Plasma Liquid Phase Chemistry Signatures Depended on Gas Admixture

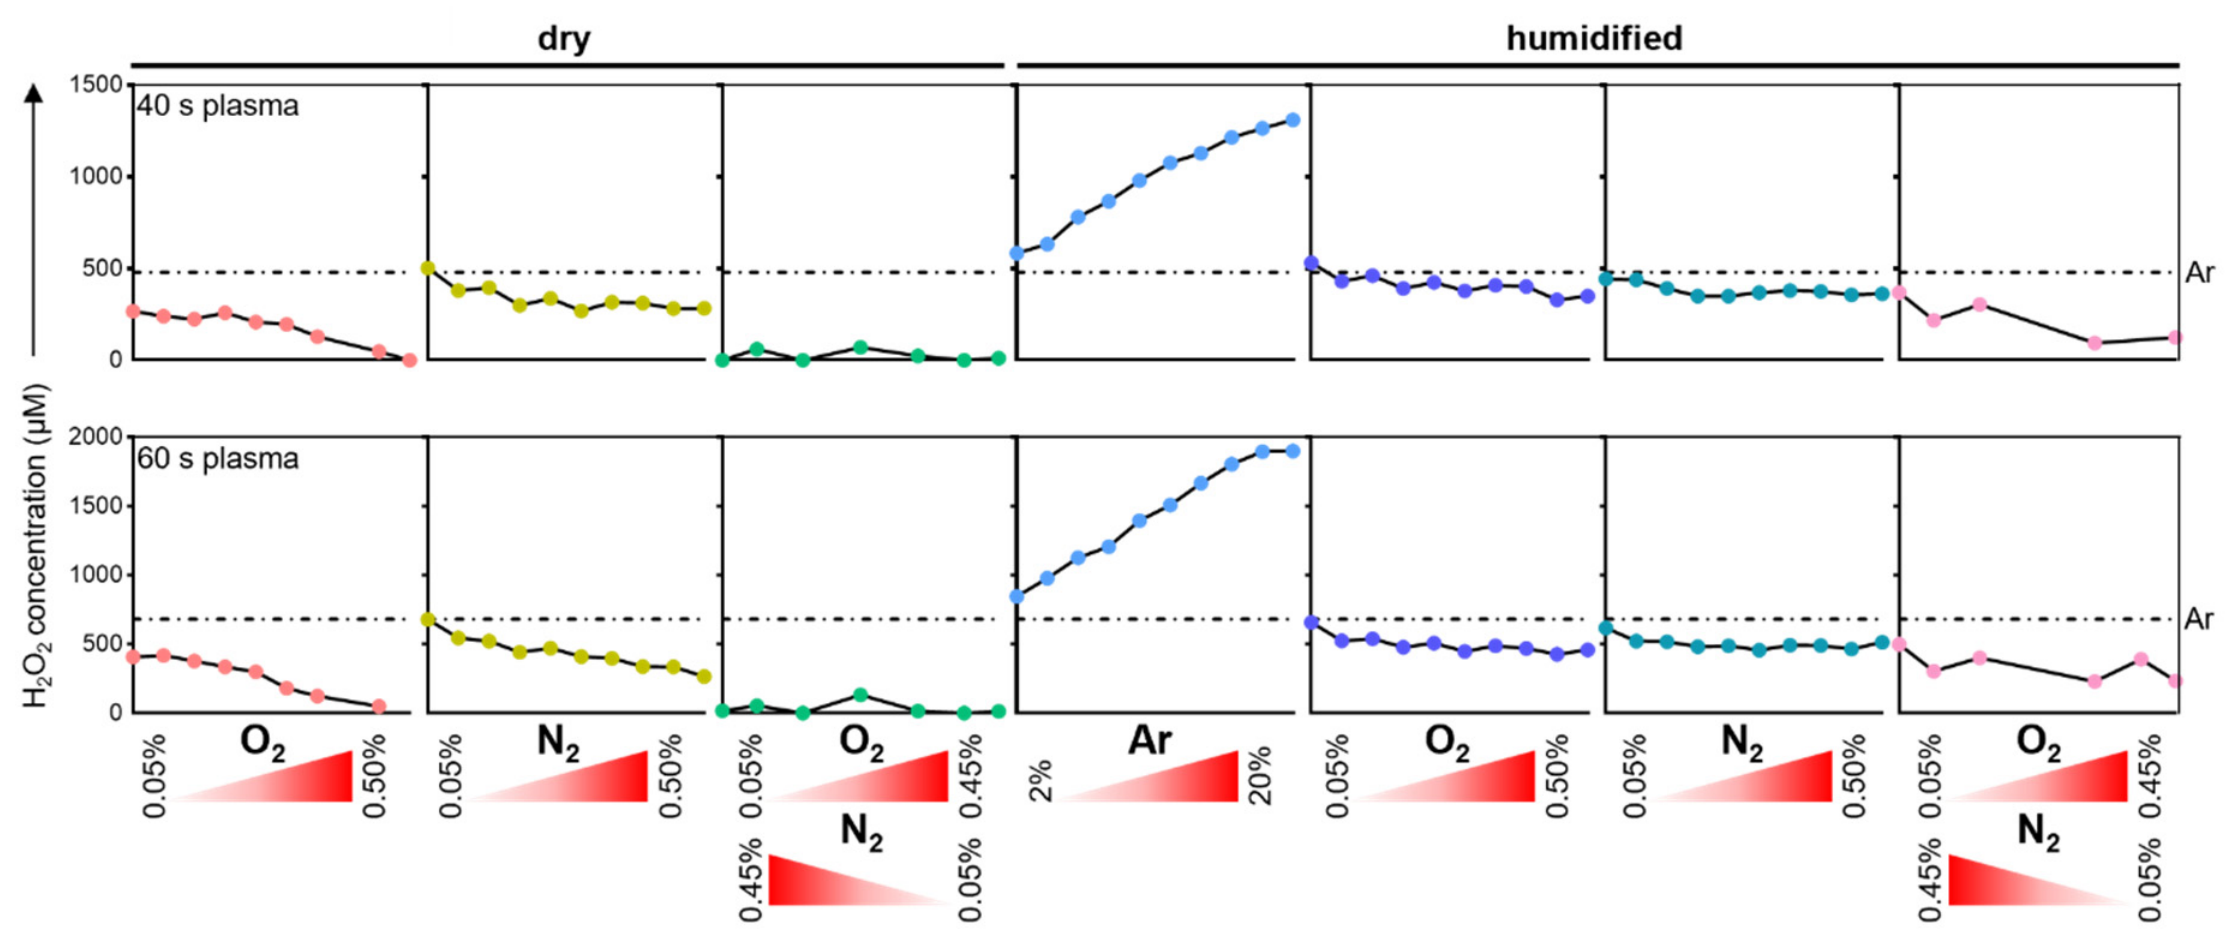
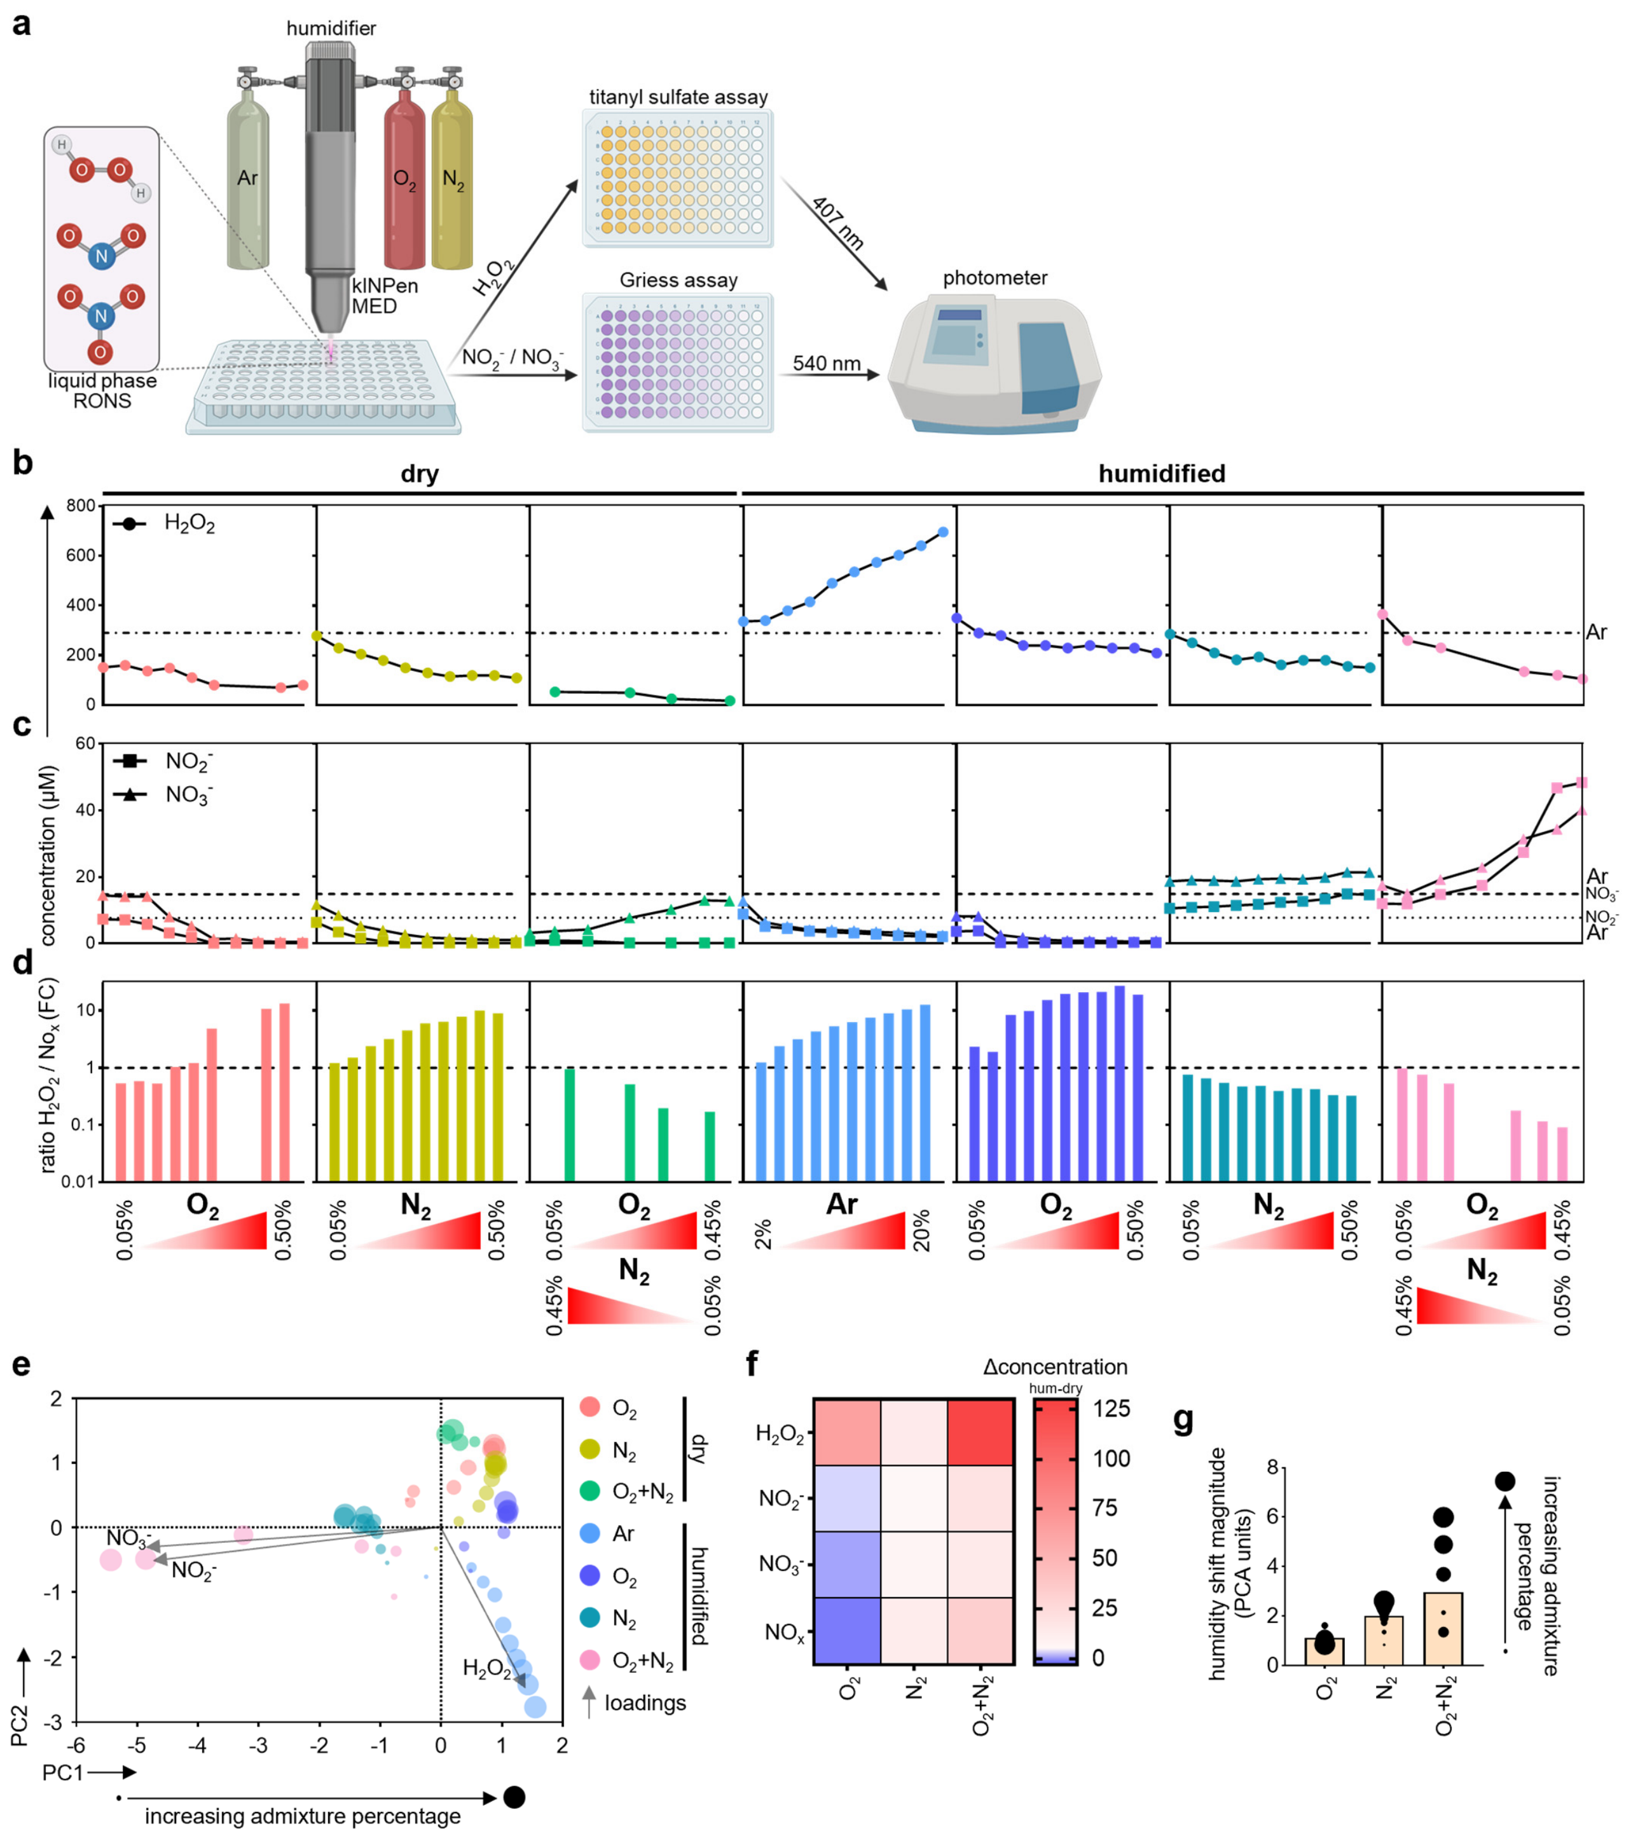
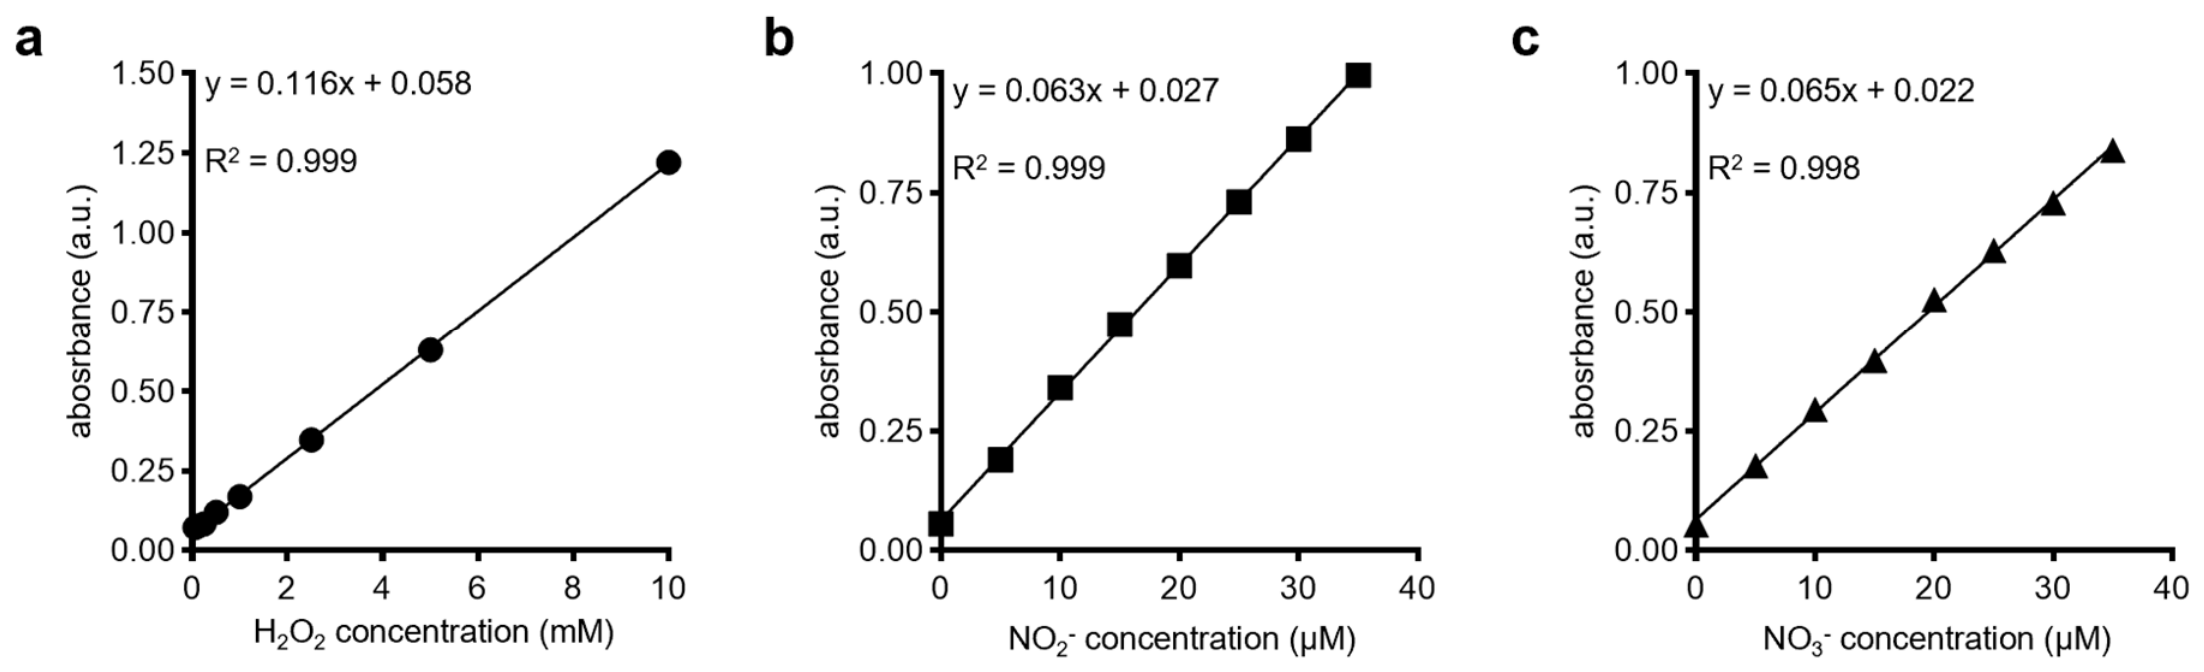
Feed gas modification consequences were subsequently examined by quantifying H2O2, NO2, and NO3 in 20 s-plasma-treated PBS (Figure 3a and Figure A4). H2O2 concentrations were strongly dependent on feed gas composition. Increasing admixture concentrations generally resulted in lower H2O2 concentrations compared with pure argon operation. This was particularly pronounced for O2-containing admixtures under both dry and humidified conditions. In contrast, humidified argon generated the highest H2O2 concentrations (Figure 3b). Increasing treatment durations to 40 s and 60 s preserved the overall response pattern, increasing absolute H2O2 concentrations in a plasma treatment time-dependent manner (Figure A5).
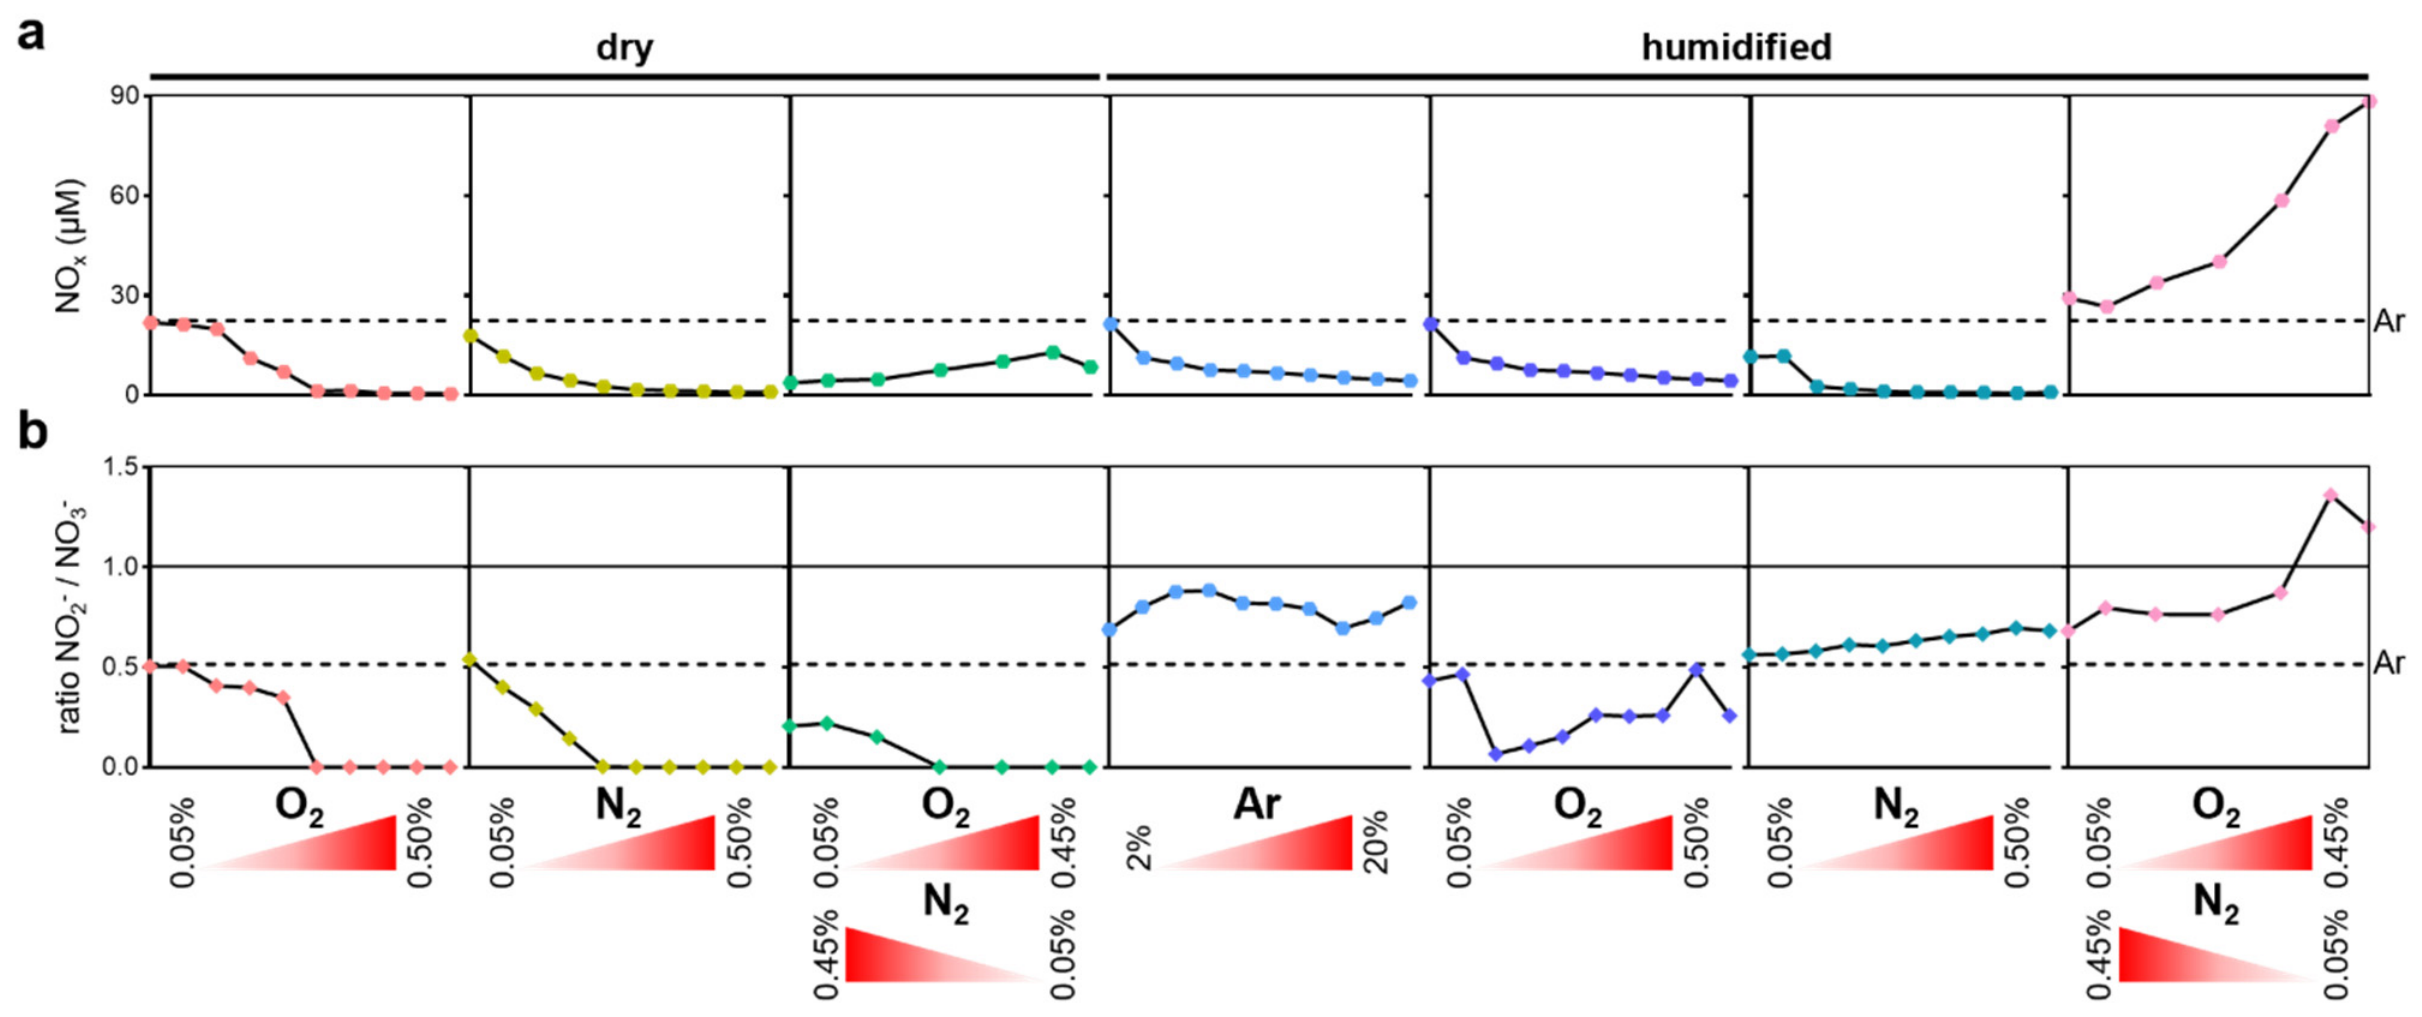
NO2 and NO3 concentrations exhibited markedly different response profiles compared with H2O2. Dry and humidified O2 admixtures caused concentration-dependent decreases in both species, resulting in minimal NO2 and NO3 accumulation at higher O2 fractions. Similarly, humidified argon and dry N2 admixtures decreased NO2 and NO3 concentrations, whereas humidified N2 conditions produced moderate increases. In contrast, mixed O2 + N2 admixtures enhanced NO2 and NO3 formation. Under dry conditions, increasing the O2 fraction within the O2 + N2 admixture primarily promoted NO3 accumulation, whereas humidified O2 + N2 conditions increased both NO2 and NO3 concentrations, reaching values exceeding 40 µM (Figure 3c). Analysis of total NOx concentrations further identified humidified O2 + N2 as the most effective condition for species generation (Figure A6a). The NO2/NO3 ratio indicated a predominance of NO3 formation across most conditions, whereas higher humidified O2 + N2 admixtures resulted in a relative increase in NO2 abundance (Figure A6b).
To compare relative changes in oxygen- and nitrogen-derived chemistry, a fold-change enrichment index was calculated by dividing the H2O2 fold change by the corresponding NOx fold change relative to the respective argon controls. Values greater than one indicate a comparatively stronger response of H2O2, whereas values below one indicate a stronger relative increase in NOx. Dry O2, dry N2, humidified argon, and humidified O2 conditions exhibited progressively increasing enrichment indices with increasing admixture concentration. Conversely, humidified N2 as well as dry and humidified O2 + N2 admixtures showed lower enrichment indices (Figure 3d). These findings suggest that feed gas modification differentially affects the relative balance between oxygen- and nitrogen-derived liquid-phase chemistry.
PCA of the liquid-phase species dataset revealed distinct clustering according to gas admixture composition (Figure 3e). Humidified argon conditions formed a clearly separated cluster characterized by negative PC2 values, whereas N2-containing admixtures clustered at positive PC1 values. O2-containing conditions occupied a distinct region with positive PC1 and negative PC2 scores, while O2 + N2 admixtures were shifted towards positive PC2 values. Notably, humidified O2 + N2 conditions exhibited the strongest separation along negative PC1 values, indicating that feed gas composition and humidification generate distinct liquid-phase signatures. To specifically assess the influence of water vapor addition, humidity-dependent response analyses were performed. Water vapor addition produced the strongest positive effects on H2O2 generation under O2 + N2 admixtures, whereas humidified O2 conditions reduced NO2 and NO3 concentrations relative to their dry counterparts. In contrast, humidification of N2 and O2 + N2 admixtures moderately increased both nitrogen species (Figure 3f). Quantification of humidity-induced response magnitudes further identified O2 + N2 admixtures as the most humidity-sensitive condition. The largest shifts were observed at higher admixture concentrations, whereas O2 admixtures exhibited the smallest overall response to humidification (Figure 3g). Collectively, these data identify humidification as a major determinant of liquid-phase chemistry.

3.3. Integrated Plasma and Species Analysis Reveals Their Distinct Relationships

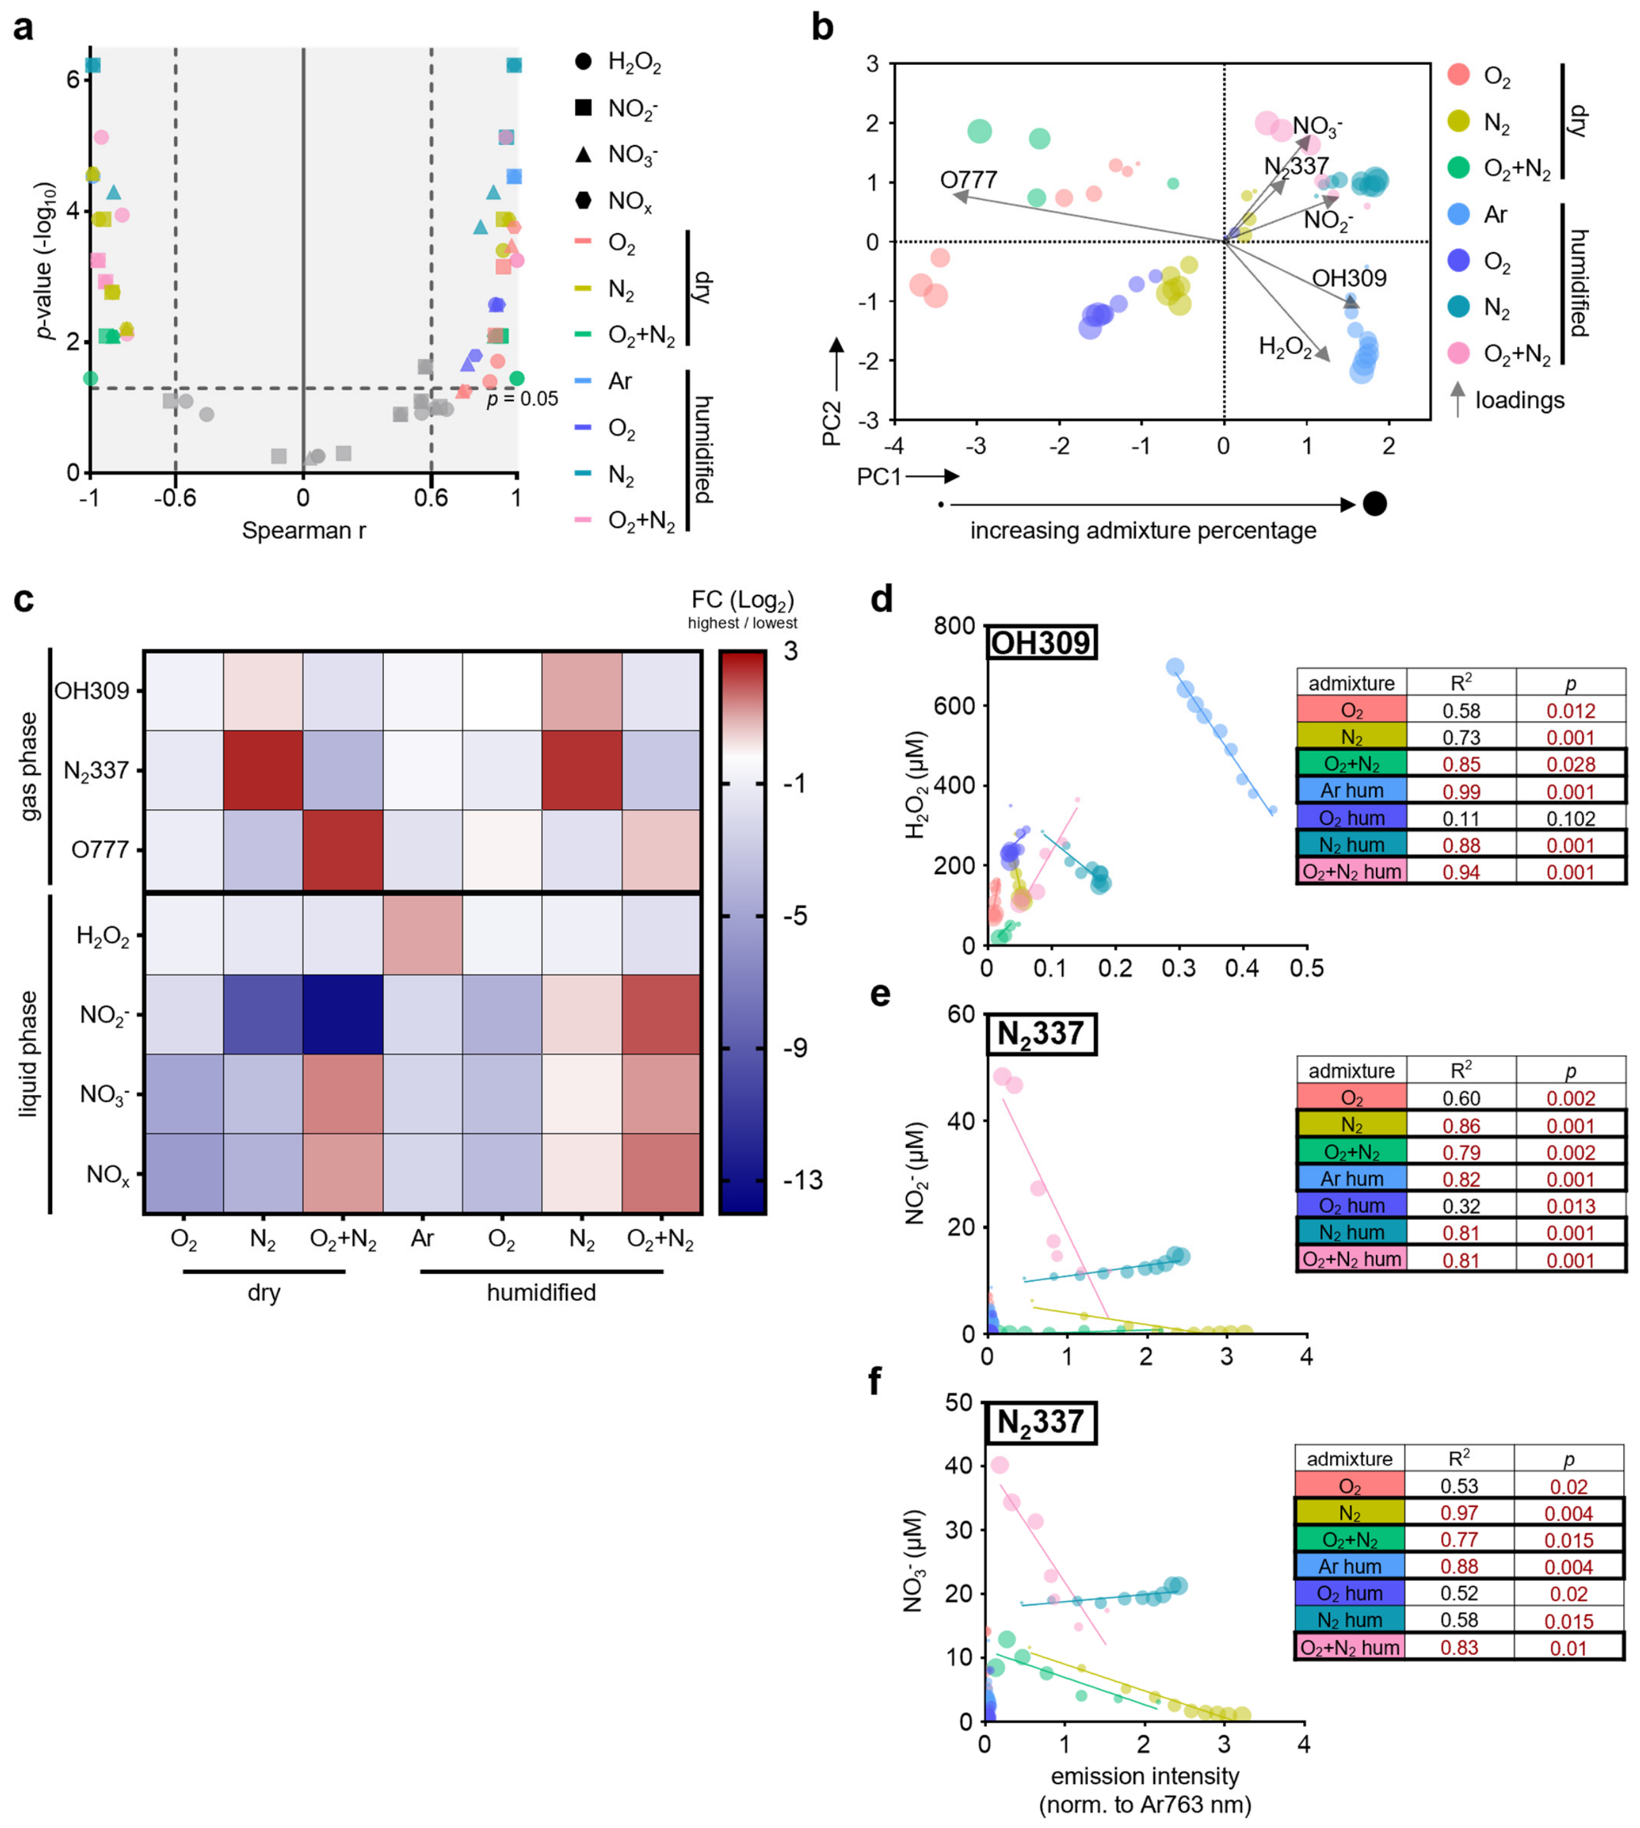
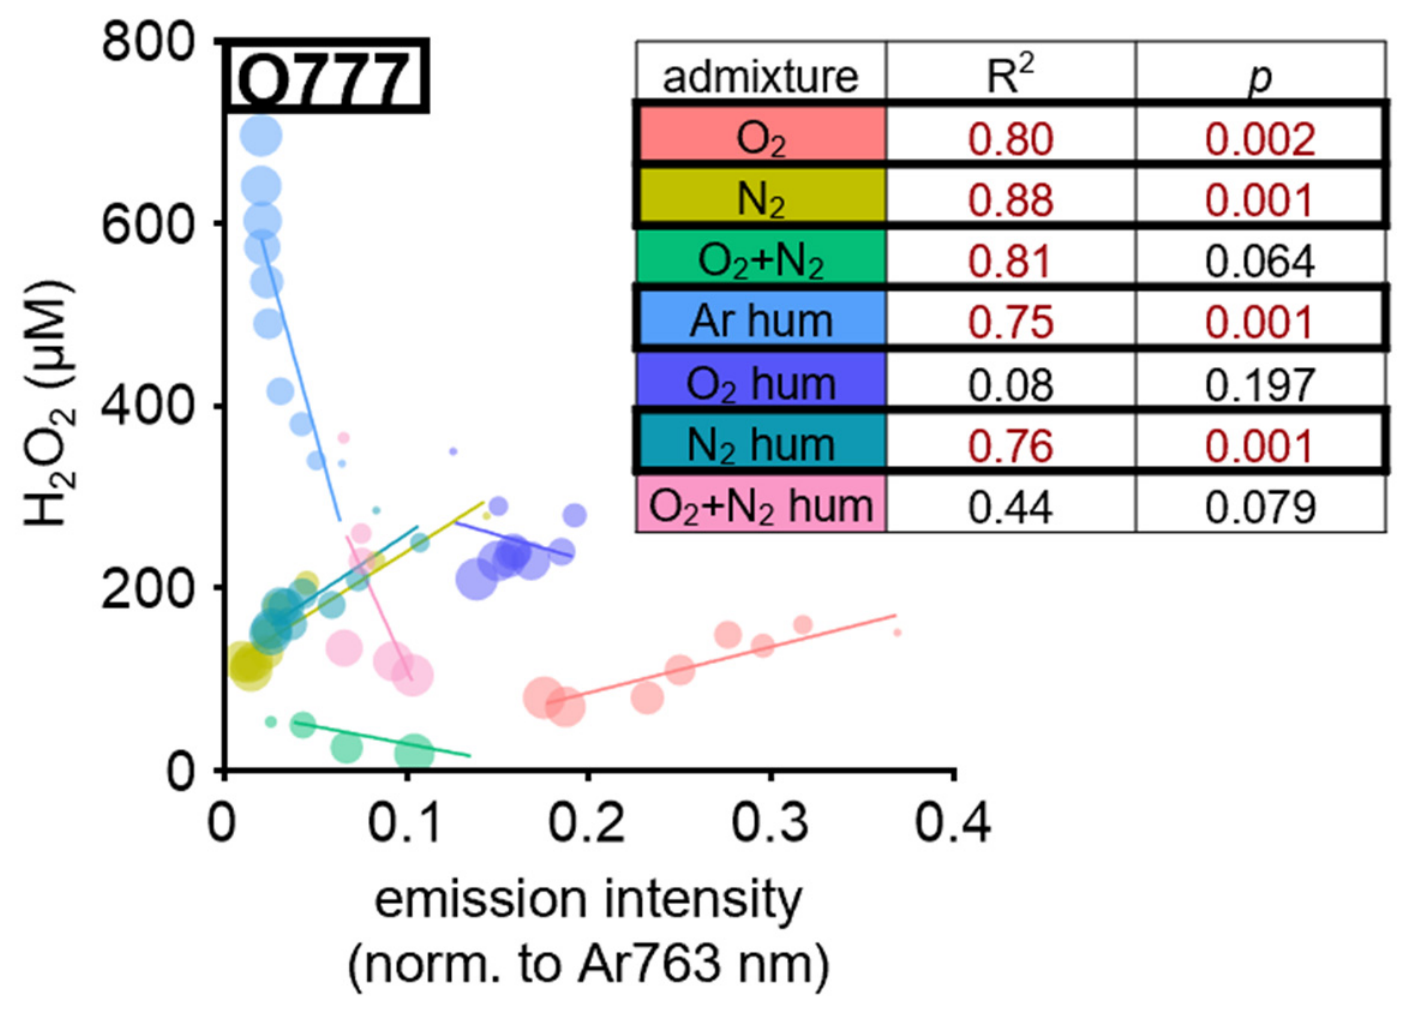
Relationships between gas- and liquid-phase results were examined by correlation analysis (Figure 4a). Several strong and statistically significant associations were identified. OH (309 nm) correlated with H2O2, NO2, and NO3 across most gas admixture conditions, whereas N2 (337 nm) exhibited particularly strong associations with liquid-phase nitrogen species under N2-containing feed gas conditions. O (777 nm) also showed significant correlations with several liquid-phase species, although these relationships were generally weaker under humidified conditions (Table 2). Second positive system (SPS) nitrogen emissions at 357 nm, 380 nm, and 405 nm largely mirrored the relationships observed for N2 (337 nm), while O (844 nm) exhibited correlation profiles similar to O (777 nm) (Table A1). Integration of gas-phase and liquid-phase datasets into PCA revealed that dry O2 and O2 + N2 admixtures clustered predominantly at negative PC1 values, whereas humidified argon conditions localized towards positive PC1 and negative PC2 values together with the H2O2 and OH (309 nm) loading vectors (Figure 4b). Humidified N2 and humidified O2 + N2 conditions clustered at positive PC1 and PC2 values. To compare concentration-dependent responses across datasets, the change between the lowest and highest admixture concentrations was visualized. O2-containing admixtures generally decreased the majority of OES emission features and liquid-phase species concentrations. In contrast, N2 admixtures increased nitrogen-associated gas-phase emission features while simultaneously reducing H2O2, NO2, and NO3 concentrations. Mixed O2 + N2 admixtures displayed heterogeneous response patterns, highlighting the distinct effects of varying the O2:N2 ratio on plasma chemistry (Figure 4c). Other gas-phase emission features exhibited similarly diverse concentration-dependent responses (Figure A7). Regression analyses of OH (309 nm) showed strong linear relationships with H2O2 under dry and humidified O2 + N2 conditions as well as humidified argon and humidified N2 conditions (Figure 4d). Likewise, N2 (337 nm) demonstrated robust relationships with both NO2 (Figure 4e) and NO3 (Figure 4f), particularly under N2-containing and humidified argon feed gas conditions. Similar relationships were observed between O (777 nm) and H2O2, with significant regressions identified for dry O2, dry N2, humidified N2, and humidified argon conditions (Figure A8). Notably, strength and significance of these relationships varied substantially between feed gas compositions, indicating condition-dependent correspondence between gas-phase and liquid-phase species.

4. Discussion

The present study systematically investigated how feed gas composition and humidification influence gas- and liquid-phase component generation in the kINPen. By integrating OES with liquid-phase quantification of H2O2, NO2, and NO3, distinct reactive species profiles were identified across increasing O2, N2, and combined O2 + N2 admixtures under dry and humidified conditions. Rather than resolving individual physicochemical reaction pathways, the primary objective was to establish a comparative plasma chemistry framework describing how operating conditions shape gas–liquid reactive species signatures exploitable in future biomedical plasma studies.
Recent theoretical and computational studies have further emphasized the complexity of plasma-liquid interactions by describing the coupled physical and chemical processes governing reactive species generation, transport, and conversion across the gas–liquid interface [45,46]. The present experimental study complements these mechanistic approaches by providing a systematic comparative dataset describing how practically relevant feed gas modifications shape the resulting plasma chemistry. We identified feed gas composition as major determinant of plasma chemistry, accounting for the largest share of variance across both gas-phase and liquid-phase datasets. This observation is consistent with previous studies demonstrating that relatively small modifications of plasma operating conditions can substantially alter excitation dynamics, reactive species generation, and downstream chemical transfer processes in atmospheric-pressure plasma jets [47,48,49,50]. Such chemistry changes have been associated with altered oxidative stress signaling, immunomodulatory responses, antimicrobial efficacy, and anticancer activity [42,43,51]. Within the present dataset, O2- and N2-containing admixtures produced clearly distinct and reproducible chemistry fingerprints, highlighting feed gas composition as the primary control parameter governing reactive species formation. O2-containing admixtures generally reduced optical emission intensities and suppressed accumulation of the investigated liquid-phase species, whereas N2-containing admixtures were associated with increased N2-related emission features. These trends are consistent with established feed gas-dependent effects on electron energy distributions, collisional quenching, and competition between oxygen- and nitrogen-derived reaction pathways in molecularly admixed argon plasmas [29,52]. Similar observations have been reported for the kINPen and related atmospheric-pressure plasma jets, where O2 admixtures altered O2-derived reactive species generation [53,54]. Notably, the observed reductions in gas-phase emission intensity were not uniformly reflected in liquid-phase chemistry, indicating that plasma excitation behavior alone cannot fully predict the composition of plasma-treated liquids. A particularly interesting observation was that combined O2 + N2 admixtures generated chemistry signatures that differed substantially from those produced by either gas alone. The response patterns observed under mixed-gas conditions could not be explained by a simple superposition of individual O2 and N2 effects, suggesting substantial coupling between oxygen- and nitrogen-derived reaction pathways. This behavior highlights the nonlinear nature of atmospheric pressure plasma chemistry and emphasizes that reactive species generation emerges from interconnected reaction networks rather than independent molecular processes.
Feed gas humidification represented a second major determinant of plasma chemistry. Humidification consistently altered both gas-phase emission profiles and liquid-phase reactive species formation, with the strongest effects observed under mixed O2 + N2 conditions. Water vapor is particularly relevant because it directly contributes to OH and H2O2 formation and modulates numerous plasma-liquid reaction pathways [49,53]. Previous studies have demonstrated that humidification influences reactive species generation, plasma-liquid transfer processes, and downstream biological responses [55,56]. For example, argon humidification substantially alters reactive species formation and antimicrobial efficacy [44]. Consistent with these reports, humidified argon generated the highest H2O2 concentrations in the present study, whereas the largest humidity-induced chemistry shifts were observed under mixed O2 + N2 conditions. These observations indicate substantial interactions between water-, oxygen-, and nitrogen-derived reaction pathways and support the view that humidity functions as an active plasma chemistry tuning parameter rather than merely an environmental variable. Notably, whereas most previous (kINPen) studies focused on humidification of the argon carrier gas, the present work demonstrates that humidity-associated effects remain highly relevant when combined with oxygen and nitrogen feed gas modification strategies. Although controlled humidification is not currently implemented as an adjustable treatment parameter in routine clinical plasma applications, it may represent a future strategy for tailoring plasma-generated reactive species. For example, plasma systems equipped with adjustable feed gas humidification or dedicated humidification modules could enable application-specific optimization of reactive species profiles. Such approaches may be particularly attractive for treatments performed in closed or semi-enclosed environments, where plasma operating conditions can be more precisely controlled.
The comparison of gas-phase and liquid-phase datasets further illustrates the complexity of plasma-liquid transfer processes. Increasing N2 admixtures were associated with several increased N2-related gas-phase emission features while simultaneously reducing liquid-phase concentrations of H2O2, NO2, and NO3. Similar discrepancies between gas-phase diagnostics and liquid-phase products have been reported for the kINPen and other atmospheric pressure plasma jets, where species transport, interfacial reactions, and secondary chemistry substantially influence the resulting liquid species composition [55,57]. These findings reinforce the notion that optical emission spectroscopy provides valuable information regarding plasma excitation processes but cannot be interpreted as a direct quantitative surrogate for liquid-phase reactive species concentrations. Despite this complexity, integrated analysis revealed several robust relationships between gas-phase and liquid-phase chemistry. In particular, OH emission intensity correlated with H2O2 accumulation, whereas N2 emission exhibited strong associations with liquid-phase N2 species. Similar relationships between OH-associated gas-phase chemistry and H2O2 formation have previously been reported for the kINPen and related plasma sources [12,53,58]. However, both the strength and significance of these relationships varied considerably between feed gas conditions in our study, indicating that the predictive value of individual optical emission features is strongly context-dependent. Moreover, the reported Spearman correlations represent empirical monotonic associations within the investigated operating conditions and should not be interpreted as evidence of direct causal or mechanistic relationships. Accordingly, exceptionally high correlation coefficients observed for individual operating conditions reflect the highly ordered concentration-dependent behavior of the investigated variables rather than perfect mechanistic coupling. Consequently, universal marker species for plasma chemistry characterization are unlikely to exist. Instead, the utility of specific gas-phase diagnostics appears to depend on the selected operating conditions and the targeted chemical output. Nevertheless, the identified correlations demonstrate that optical diagnostics can provide useful guidance for comparative assessment and for selecting operating conditions associated with desired liquid-phase reactive species profiles. Multivariate analyses further support the concept that plasma-generated chemistry is best interpreted as a reactive species network rather than a collection of isolated molecules. In this study, PCAs consistently separated conditions according to feed gas composition and humidification status and identified distinct chemistry clusters associated with humidified argon and humidified O2 + N2 operation. Although the variety of 65 conditions is unmatched compared to previous studies, multidimensional analytical approaches have gained increasing attention within the field, shifting from single-species analyses toward characterization of reactive species fingerprints and network behavior [43,47,59,60]. In this context, the present dataset provides a useful reference framework for future studies seeking to connect defined plasma chemistry fingerprints with specific to-be-explored biological outcomes.
Several methodological considerations should be noted when interpreting these findings. First, only a subset of gas- and liquid-phase plasma components was quantified here. This limitation is inherent to plasma chemistry studies, as many transient species are difficult to detect and quantify directly because of their short lifetimes and rapid conversion into secondary products [11,47,49]. Moreover, gas-phase characterization relied on optical emission spectroscopy, which detects radiation emitted by electronically excited species rather than absolute reactive species concentrations. Consequently, emission intensities should be interpreted as relative indicators of plasma excitation processes and feed gas-dependent chemistry changes rather than direct measures of reactive species densities. Furthermore, the OES analysis was based on relative peak intensities and did not include detailed spectroscopic line-shape fitting or background-corrected rotational analysis. Therefore, potential effects of spectral overlap and line broadening cannot be completely excluded, particularly for the OH emission band, and the reported gas-phase emission features should be regarded as comparative optical signatures rather than quantitative measures of individual reactive species. Second, measurements were performed in PBS, not fully recapitulating the complexity of biologically relevant fluid, in which plasma-induced chemistries can be altered. In addition, pH was not monitored following plasma treatment. Although PBS attenuates plasma-induced acidification, pH-dependent reaction pathways may nevertheless have influenced the observed liquid-phase nitrogen chemistry. In addition, pH was not monitored following plasma treatment. Although PBS attenuates plasma-induced acidification, pH-dependent reaction pathways may nevertheless have influenced the observed liquid-phase nitrogen chemistry. Finally, humidification was applied directly to the individual gas streams rather than standardized across all feed gas compositions. Consequently, the absolute water vapor content may have differed between humidified argon, O2-containing, and N2-containing conditions despite identical humidification settings. Therefore, the magnitude of humidity effects should be interpreted qualitatively within the investigated operating conditions rather than as resulting from identical absolute humidity levels across different feed gas compositions. Although dedicated humidity-control systems could provide more precise control of water vapor partial pressure, the objective of the present study was to compare practically achievable humidification strategies under clinically relevant feed gas conditions rather than to investigate the effects of precisely controlled humidity. The consistent trends observed across multiple independent analyses nevertheless support the robustness of the reported humidity-dependent chemistry shifts.

5. Conclusions

This study provides a systematic comparison of kINPen plasma-derived component generation across a never-reported width of 65 O2-, N2-, mixed-gas, and H2O-modulated operating feed gas conditions. Feed gas composition and humidification generated distinct gas- and liquid-phase reactive species profiles, with O2 and N2 compositions exerting the strongest overall influence and water vapor acting as an important secondary modulator. By defining how controlled feed gas modification shapes coupled gas–liquid chemistry, this work complements previous biologically oriented kINPen studies and provides a reference framework for future plasma medicine and plasma biology investigations seeking to tailor reactive species profiles for specific applications.

Author Contributions

Conceptualization, S.B.; methodology, L.Y. and A.M.; software, L.Y., A.M., and L.H.; validation, L.Y. and L.H.; formal analysis, L.Y., A.M., and L.H.; investigation, L.Y.; resources, S.B. and S.E.; data curation, L.Y., A.M., and L.H.; writing—original draft preparation, L.H.; writing—review and editing, L.H. and S.B.; visualization, L.H.; supervision, S.B., L.B., and S.E.; project administration, S.B.; funding acquisition, S.B. All authors have read and agreed to the published version of the manuscript.

Funding

Funding was received from the German Federal Ministry of Education and Research (BMBF, today: Federal Ministry of Education, Research and Space, BMFTR; grant numbers: 03Z22DN11 (to S.B.) and 03Z22Di1 (to S.B.)). L.Y. received support by the Chinese Research Council.

Institutional Review Board Statement

Not applicable.

Data Availability Statement

The raw data supporting the conclusions of this article will be made available by the authors on request.

Conflicts of Interest

The authors declare no conflicts of interest.

Appendix A

Table A1. Correlation of minor gas-phase reactive oxygen and nitrogen species (RONS) produced by the kINPen, determined by optical emission spectroscopy and liquid-phase RONS. Spearman correlation coefficients (r) and false discovery rate (FDR)-adjusted p-values are shown. Significant correlations were defined as |r| ≥ 0.6 and p ≤ 0.05 and are highlighted in red.
DryHumidified
Ar
+
O2
Ar
+
N2
Ar
+
O2 and N2
Ar
Ar
+
O2
Ar
+
N2
Ar
+
O2 and N2
rprprprprprprp
H2O2
NO282
−0.560.162−0.670.0441.000.0350.900.001−0.780.021−0.880.0011.000.001
NO2 NO282−0.670.091−0.690.0390.850.017−0.900.001−0.080.5450.820.001−0.960.001
NO3 NO282−0.750.055−0.660.046−0.640.053−0.900.001−0.840.0100.730.001−0.960.001
NOx
NO282
−0.760.055−0.660.046−0.640.053−0.900.001−0.830.0120.820.001−0.960.001
H2O2
N2357
0.720.095−0.960.0011.000.035−0.670.0410.780.021−0.950.0011.000.001
NO2 N23570.580.111−0.940.0010.930.0080.670.0410.150.5370.990.001−0.960.001
NO3 N23570.390.251−0.990.001−0.890.0080.670.0410.930.0030.890.001−0.960.001
NOx
N2357
0.410.244−0.990.001−0.890.0080.670.0410.940.0030.990.001−0.960.001
H2O2
N2380
0.630.121−0.960.0011.000.035−0.370.1720.750.025−0.950.0011.000.001
NO2 N23800.200.538−0.940.0010.930.0080.370.1720.120.5450.990.001−0.960.001
NO3 N23800.120.664−0.990.001−0.890.0080.370.1720.900.0030.890.001−0.960.001
NOx
N2380
0.150.614−0.990.001−0.890.0080.370.1720.920.0030.990.001−0.960.001
H2O2
N2405
−0.590.146−0.960.0011.000.0350.640.0480.620.079−0.950.0011.000.001
NO2 N2405−0.540.130−0.940.0010.930.008−0.640.0480.390.2450.990.001−0.960.001
NO3 N2405−0.590.106−0.990.001−0.890.008−0.640.0480.720.0320.890.001−0.960.001
NOx
N2405
−0.610.100−0.990.001−0.890.008−0.640.0480.750.0260.990.001−0.960.001
H2O2
H656
−0.550.165−0.810.0081.000.0350.920.001−0.390.245−0.810.0010.940.003
NO2 H656−0.550.123−0.850.0060.890.009−0.920.0010.240.4530.780.001−0.860.003
NO3 H656−0.600.105−0.810.009−0.710.035−0.920.001−0.520.1470.540.003−0.860.003
NOx
H656
−0.640.095−0.810.009−0.710.035−0.920.001−0.480.1750.780.001−0.860.003
H2O2
O844
0.750.0860.890.002−1.000.035−0.840.005−0.190.4960.830.001−0.890.004
NO2 O8440.700.0740.850.006−0.930.0080.840.005−0.420.233−0.900.0010.860.003
NO3 O8440.710.0740.880.0020.960.0080.840.005−0.100.545−0.880.0010.860.003
NOx
O844
0.700.0740.880.0020.960.0080.840.005−0.090.545−0.900.0010.860.003
Figure A1. Additional optical emission spectroscopy peak analysis of gas admixture-dependent plasma chemistry. (a) representative emission spectra of argon containing 0.25% dry and humidified O2 or N2 admixtures; (b) normalized emission intensities of NO (282 nm), N2 (357 nm), N2 (380 nm), N2 (405 nm), H (656 nm), and O (844 nm) across all gas admixture conditions with corresponding regression analyses.
Plasma 09 00027 g0a1
Figure A2. Correlation analysis of all plasma optical emission spectral peaks for each gas admixture condition (* p ≤ 0.05).
Plasma 09 00027 g0a2
Figure A3. Relative optical emission spectral intensities of humidified gas plasmas subtracted by analogous dry conditions for O2, N2, and O2 + N2 admixtures. (AUC: area under curve).
Plasma 09 00027 g0a3
Figure A4. Representative calibration curves of the titanyl sulfate and GRIESS assay. (a) H2O2; (b) NO2; (c) NO3.
Plasma 09 00027 g0a4
Figure A5. H2O2 concentrations following 40 s and 60 s gas plasma treatment in PBS.
Plasma 09 00027 g0a5
Figure A6. Analysis of nitrogen-derived species following gas plasma treatment under different gas admixture conditions. (a) total NOx concentrations determined as the sum of NO2 and NO3 following 20 s plasma treatment of PBS; (b) NO2-to-NO3 ratio.
Plasma 09 00027 g0a6
Figure A7. Overview heat map of intensity changes across several optical emission spectral peaks. (FC: fold change).
Plasma 09 00027 g0a7
Figure A8. Regression analysis of O (777 nm) emission intensities and H2O2 concentrations.
Plasma 09 00027 g0a8

References

  1. Talukdar, P.; Gohain, R.B.; Biswas, S.; Bala, A. Cold Atmospheric Plasma in Biomedicine and Pharmacology: Multidisciplinary Perspectives on Therapeutic Applications. ACS Pharmacol. Transl. Sci. 2026, 9, 859–879. [Google Scholar] [CrossRef] [PubMed]
  2. Mai-Prochnow, A.; Murphy, A.B.; McLean, K.M.; Kong, M.G.; Ostrikov, K.K. Atmospheric pressure plasmas: Infection control and bacterial responses. Int. J. Antimicrob. Agents 2014, 43, 508–517. [Google Scholar] [CrossRef] [PubMed]
  3. Laroussi, M. Low Temperature Plasma-Based Sterilization: Overview and State-of-the-Art. Plasma Process. Polym. 2005, 2, 391–400. [Google Scholar] [CrossRef]
  4. Wang, P.; Zhou, R.; Zhou, R.; Li, W.; Weerasinghe, J.; Chen, S.; Rehm, B.H.A.; Zhao, L.; Frentiu, F.D.; Zhang, Z.; et al. Cold atmospheric plasma for preventing infection of viruses that use ACE2 for entry. Theranostics 2022, 12, 2811–2832. [Google Scholar] [CrossRef] [PubMed]
  5. Tan, F.; Rui, X.; Xiang, X.; Yu, Z.; Al-Rubeai, M. Multimodal treatment combining cold atmospheric plasma and acidic fibroblast growth factor for multi-tissue regeneration. FASEB J. 2021, 35, e21442. [Google Scholar] [CrossRef] [PubMed]
  6. Smith, C.J.; Watkins, A.R.; Lucas, A.A.; Moniodes, A.J.; Ritchie, C.; Thompson, T.P.; Schaer, T.P.; Gilmore, B.F.; Hickok, N.J.; Freeman, T.A. Cold Plasma Generates a Localized Inflammatory Response and Promotes Muscle Repair. Adv. Ther. 2025, 8, e00097. [Google Scholar] [CrossRef]
  7. Bekeschus, S. Medical gas plasma technology: Roadmap on cancer treatment and immunotherapy. Redox Biol. 2023, 65, 102798. [Google Scholar] [CrossRef] [PubMed]
  8. Glory, A.; Patocskai, E.; Wong, P. Breast cancer PAINT: A first-in-human, dose-escalation study to determine the safety of Plasma Adjuvant INtra-operative Treatment in breast cancer patients. BMC Cancer 2025, 25, 748. [Google Scholar] [CrossRef] [PubMed]
  9. Isbary, G.; Morfill, G.; Schmidt, H.; Georgi, M.; Ramrath, K.; Heinlin, J.; Karrer, S.; Landthaler, M.; Shimizu, T.; Steffes, B.; et al. A first prospective randomized controlled trial to decrease bacterial load using cold atmospheric argon plasma on chronic wounds in patients. Br. J. Dermatol. 2010, 163, 78–82. [Google Scholar] [CrossRef] [PubMed]
  10. Keidar, M.; Walk, R.; Shashurin, A.; Srinivasan, P.; Sandler, A.; Dasgupta, S.; Ravi, R.; Guerrero-Preston, R.; Trink, B. Cold plasma selectivity and the possibility of a paradigm shift in cancer therapy. Br. J. Cancer 2011, 105, 1295–1301. [Google Scholar] [CrossRef] [PubMed]
  11. Graves, D.B. Reactive Species from Cold Atmospheric Plasma: Implications for Cancer Therapy. Plasma Process. Polym. 2014, 11, 1120–1127. [Google Scholar] [CrossRef]
  12. Lu, X.; Naidis, G.V.; Laroussi, M.; Reuter, S.; Graves, D.B.; Ostrikov, K. Reactive species in non-equilibrium atmospheric-pressure plasmas: Generation, transport, and biological effects. Phys. Rep. 2016, 630, 1–84. [Google Scholar] [CrossRef]
  13. Yan, D.; Talbot, A.; Nourmohammadi, N.; Sherman, J.H.; Cheng, X.; Keidar, M. Toward understanding the selective anticancer capacity of cold atmospheric plasma--a model based on aquaporins (Review). Biointerphases 2015, 10, 040801. [Google Scholar] [CrossRef] [PubMed]
  14. Graves, D.B. Low temperature plasma biomedicine: A tutorial review. Phys. Plasmas 2014, 21, 080901. [Google Scholar] [CrossRef]
  15. Gorbanev, Y.; Privat-Maldonado, A.; Bogaerts, A. Analysis of Short-Lived Reactive Species in Plasma-Air-Water Systems: The Dos and the Do Nots. Anal. Chem. 2018, 90, 13151–13158. [Google Scholar] [CrossRef] [PubMed]
  16. Takamatsu, T.; Uehara, K.; Sasaki, Y.; Miyahara, H.; Matsumura, Y.; Iwasawa, A.; Ito, N.; Azuma, T.; Kohno, M.; Okino, A. Investigation of reactive species using various gas plasmas. RSC Adv. 2014, 4, 39901–39905. [Google Scholar] [CrossRef]
  17. Abdo, A.I.; Kopecki, Z. Comparing Redox and Intracellular Signalling Responses to Cold Plasma in Wound Healing and Cancer. Curr. Issues Mol. Biol. 2024, 46, 4885–4923. [Google Scholar] [CrossRef] [PubMed]
  18. Laroussi, M. Cold Plasma in Medicine and Healthcare: The New Frontier in Low Temperature Plasma Applications. Front. Phys. 2020, 8, 74. [Google Scholar] [CrossRef]
  19. Fridman, G.; Friedman, G.; Gutsol, A.; Shekhter, A.B.; Vasilets, V.N.; Fridman, A. Applied Plasma Medicine. Plasma Process. Polym. 2008, 5, 503–533. [Google Scholar] [CrossRef]
  20. Armenise, V.; Veronico, V.; Cosmai, S.; Benedetti, D.; Gristina, R.; Favia, P.; Fracassi, F.; Sardella, E. The effect of different cold atmospheric plasma sources and treatment modalities on the generation of reactive oxygen and nitrogen species in water. Plasma Process. Polym. 2022, 20, 2200182. [Google Scholar] [CrossRef]
  21. Dai, X.; Li, J.; Nawaz, T.; Ding, C. A dual-index framework for cold atmospheric plasma dosing: A meta-analysis of parametric control from volumetric redox flux to redox homeostatic status. Redox Biol. 2026, 94, 104162. [Google Scholar] [CrossRef] [PubMed]
  22. Bekeschus, S.; Schmidt, A.; Weltmann, K.-D.; von Woedtke, T. The plasma jet kINPen—A powerful tool for wound healing. Clin. Plasma Med. 2016, 4, 19–28. [Google Scholar] [CrossRef]
  23. Gaens, W.V.; Iseni, S.; Schmidt-Bleker, A.; Weltmann, K.D.; Reuter, S.; Bogaerts, A. Numerical analysis of the effect of nitrogen and oxygen admixtures on the chemistry of an argon plasma jet operating at atmospheric pressure. New J. Phys. 2015, 17, 033003. [Google Scholar] [CrossRef]
  24. Reuter, S.; Tresp, H.; Wende, K.; Hammer, M.U.; Winter, J.; Masur, K.; Schmidt-Bleker, A.; Weltmann, K.-D. From RONS to ROS: Tailoring Plasma Jet Treatment of Skin Cells. IEEE Trans. Plasma Sci. 2012, 40, 2986–2993. [Google Scholar] [CrossRef]
  25. Hansen, L.; Schmidt-Bleker, A.; Bansemer, R.; Kersten, H.; Weltmann, K.-D.; Reuter, S. Influence of a liquid surface on the NOx production of a cold atmospheric pressure plasma jet. J. Phys. D Appl. Phys. 2018, 51, 474002. [Google Scholar] [CrossRef]
  26. Gianella, M.; Reuter, S.; Press, S.; Schmidt-Bleker, A.; van Helden, J.H.; Ritchie, G.A.D. HO2 reaction kinetics in an atmospheric pressure plasma jet determined by cavity ring-down spectroscopy. Plasma Sources Sci. Technol. 2018, 27, 095013. [Google Scholar] [CrossRef]
  27. Jablonowski, H.; Schmidt-Bleker, A.; Weltmann, K.D.; von Woedtke, T.; Wende, K. Non-touching plasma-liquid interaction—Where is aqueous nitric oxide generated? Phys. Chem. Chem. Phys. 2018, 20, 25387–25398. [Google Scholar] [CrossRef] [PubMed]
  28. Schmidt-Bleker, A.; Bansemer, R.; Reuter, S.; Weltmann, K.-D. How to produce an NOx- instead of Ox-based chemistry with a cold atmospheric plasma jet. Plasma Process. Polym. 2016, 13, 1120–1127. [Google Scholar] [CrossRef]
  29. Schmidt-Bleker, A.; Winter, J.; Bösel, A.; Reuter, S.; Weltmann, K.D. On the plasma chemistry of a cold atmospheric argon plasma jet with shielding gas device. Plasma Sources Sci. Technol. 2016, 25, 015005. [Google Scholar] [CrossRef]
  30. Schmidt-Bleker, A.; Reuter, S.; Weltmann, K.D. Quantitative schlieren diagnostics for the determination of ambient species density, gas temperature and calorimetric power of cold atmospheric plasma jets. J. Phys. D Appl. Phys. 2015, 48, 175202. [Google Scholar] [CrossRef]
  31. Schmidt-Bleker, A.; Norberg, S.A.; Winter, J.; Johnsen, E.; Reuter, S.; Weltmann, K.D.; Kushner, M.J. Propagation mechanisms of guided streamers in plasma jets: The influence of electronegativity of the surrounding gas. Plasma Sources Sci. Technol. 2015, 24, 035022. [Google Scholar] [CrossRef]
  32. Reuter, S.; Winter, J.; Iseni, S.; Schmidt-Bleker, A.; Dunnbier, M.; Masur, K.; Wende, K.; Weltmann, K.-D. The Influence of Feed Gas Humidity Versus Ambient Humidity on Atmospheric Pressure Plasma Jet-Effluent Chemistry and Skin Cell Viability. IEEE Trans. Plasma Sci. 2015, 43, 3185–3192. [Google Scholar] [CrossRef]
  33. Winter, J.; Sousa, J.S.; Sadeghi, N.; Schmidt-Bleker, A.; Reuter, S.; Puech, V. The spatio-temporal distribution of He (23S1) metastable atoms in a MHz-driven helium plasma jet is influenced by the oxygen/nitrogen ratio of the surrounding atmosphere. Plasma Sources Sci. Technol. 2015, 24, 25015–25025. [Google Scholar] [CrossRef]
  34. Iseni, S.; Schmidt-Bleker, A.; Winter, J.; Weltmann, K.D.; Reuter, S. Atmospheric pressure streamer follows the turbulent argon air boundary in a MHz argon plasma jet investigated by OH-tracer PLIF spectroscopy. J. Phys. D Appl. Phys. 2014, 47, 152001. [Google Scholar] [CrossRef]
  35. Schmidt-Bleker, A.; Winter, J.; Iseni, S.; Dünnbier, M.; Weltmann, K.-D.; Reuter, S. Reactive species output of a plasma jet with a shielding gas device-combination of FTIR absorption spectroscopy and gas phase modelling. J. Phys. D Appl. Phys. 2014, 47, 145201. [Google Scholar] [CrossRef]
  36. Iseni, S.; Reuter, S.; Schmidt-Bleker, A.; Weltmann, K.D. Flow and Discharge Development in an Argon Atmospheric Pressure Plasma Jet Observed by ICCD and PLIF Imaging. IEEE Trans. Plasma Sci. 2014, 42, 2458–2459. [Google Scholar] [CrossRef]
  37. Schmidt-Bleker, A.; Reuter, S.; Weltmann, K.D. Non-dispersive path mapping approximation for the analysis of ambient species diffusion in laminar jets. Phys. Fluids 2014, 26, 083603. [Google Scholar] [CrossRef]
  38. Winter, J.; Tresp, H.; Hammer, M.U.; Iseni, S.; Kupsch, S.; Schmidt-Bleker, A.; Wende, K.; Dünnbier, M.; Masur, K.; Weltmann, K.-D.; et al. Tracking plasma generated H2O2 from gas into liquid phase and revealing its dominant impact on human skin cells. J. Phys. D Appl. Phys. 2014, 47, 285401. [Google Scholar] [CrossRef]
  39. Dunnbier, M.; Schmidt-Bleker, A.; Winter, J.; Wolfram, M.; Hippler, R.; Weltmann, K.-D.; Reuter, S. Ambient air particle transport into the effluent of a cold atmospheric-pressure argon plasma jet investigated by molecular beam mass spectrometry. J. Phys. D Appl. Phys. 2013, 46, 435203. [Google Scholar] [CrossRef]
  40. Bruno, G.; Wenske, S.; Mahdikia, H.; Gerling, T.; von Woedtke, T.; Wende, K. Radiation Driven Chemistry in Biomolecules—Is (V)UV Involved in the Bioactivity of Argon Jet Plasmas? Front. Phys. 2021, 9, 759005. [Google Scholar] [CrossRef]
  41. Iseni, S.; Zhang, S.; van Gessel, A.F.H.; Hofmann, S.; van Ham, B.T.J.; Reuter, S.; Weltmann, K.-D.; Bruggeman, P.J. Nitric oxide density distributions in the effluent of an RF argon APPJ: Effect of gas flow rate and substrate. New J. Phys. 2014, 16, 123011. [Google Scholar] [CrossRef]
  42. Bekeschus, S.; Clemen, R.; Nießner, F.; Sagwal, S.K.; Freund, E.; Schmidt, A. Medical Gas Plasma Jet Technology Targets Murine Melanoma in an Immunogenic Fashion. Adv. Sci. 2020, 7, 1903438. [Google Scholar] [CrossRef] [PubMed]
  43. Berner, J.; Herold, L.; Martinet, A.; Miebach, L.; von Woedke, T.; Weltmann, K.-D.; Emmert, S.; Boeckmann, L.; Bekeschus, S. Reactive Species Risk Assessment Using Optimized HET-CAM Safety Evaluation of Feed Gas-Modified Gas Plasma Technology and Anticancer Drugs. ACS Appl. Mater. Interfaces 2024, 16, 34480–34495. [Google Scholar] [CrossRef] [PubMed]
  44. Clemen, R.; Singer, D.; Skowski, H.; Bekeschus, S. Argon Humidification Exacerbates Antimicrobial and Anti-MRSA kINPen Plasma Activity. Life 2023, 13, 257. [Google Scholar] [CrossRef] [PubMed]
  45. Dias, T.C.; Jeon, J.; Olson, S.; Qiu, X.; Thagard, S.M.; Kushner, M.J. Controlling Reactivity at the Plasma-Liquid Interface: Applications to Remediation of PFAS in Water. Plasma Chem. Plasma Process. 2026, 46, 84. [Google Scholar] [CrossRef]
  46. Saifutdinov, A.I.; Purin, V.V.; Saifutdinova, A.A. Towards a Unified Model of the Low-Current Glow Discharge with a Liquid-Phase Anode. Plasma Phys. Rep. 2026, 51, 1521–1541. [Google Scholar] [CrossRef]
  47. Wende, K.; von Woedtke, T.; Weltmann, K.D.; Bekeschus, S. Chemistry and biochemistry of cold physical plasma derived reactive species in liquids. Biol. Chem. 2018, 400, 19–38. [Google Scholar] [CrossRef] [PubMed]
  48. Lietz, A.M.; Kushner, M.J. Molecular admixtures and impurities in atmospheric pressure plasma jets. J. Appl. Phys. 2018, 124, 153303. [Google Scholar] [CrossRef]
  49. Bruggeman, P.J.; Kushner, M.J.; Locke, B.R.; Gardeniers, J.G.E.; Graham, W.G.; Graves, D.B.; Hofman-Caris, R.C.H.M.; Maric, D.; Reid, J.P.; Ceriani, E.; et al. Plasma-liquid interactions: A review and roadmap. Plasma Sources Sci. Technol. 2016, 25, 053002. [Google Scholar] [CrossRef]
  50. Gorbanev, Y.; Verlackt, C.C.W.; Tinck, S.; Tuenter, E.; Foubert, K.; Cos, P.; Bogaerts, A. Combining experimental and modelling approaches to study the sources of reactive species induced in water by the COST RF plasma jet. Phys. Chem. Chem. Phys. 2018, 20, 2797–2808. [Google Scholar] [CrossRef] [PubMed]
  51. Harris, B.; Krös, L.; C Nave, A.S.; Wagenaars, E.; van Helden, J.H. The spatial density distribution of H2O2 in the effluent of the COST-Jet and the kINPen-sci operated with a humidified helium feed gas. Plasma Sources Sci. Technol. 2023, 32, 115010. [Google Scholar] [CrossRef]
  52. Bruno, G.; Wenske, S.; Lackmann, J.-W.; Lalk, M.; von Woedtke, T.; Wende, K. On the Liquid Chemistry of the Reactive Nitrogen Species Peroxynitrite and Nitrogen Dioxide Generated by Physical Plasmas. Biomolecules 2020, 10, 1687. [Google Scholar] [CrossRef] [PubMed]
  53. Winter, J.; Wende, K.; Masur, K.; Iseni, S.; Dünnbier, M.; Hammer, M.U.; Tresp, H.; Weltmann, K.-D.; Reuter, S. Feed gas humidity: A vital parameter affecting a cold atmospheric-pressure plasma jet and plasma-treated human skin cells. J. Phys. D Appl. Phys. 2013, 46, 295401. [Google Scholar] [CrossRef]
  54. Reuter, S.; Winter, J.; Schmidt-Bleker, A.; Tresp, H.; Hammer, M.U.; Weltmann, K.-D. Controlling the Ambient Air Affected Reactive Species Composition in the Effluent of an Argon Plasma Jet. IEEE Trans. Plasma Sci. 2012, 40, 2788–2794. [Google Scholar] [CrossRef]
  55. Reuter, S.; von Woedtke, T.; Weltmann, K.D. The kINPen-a review on physics and chemistry of the atmospheric pressure plasma jet and its applications. J. Phys. D Appl. Phys. 2018, 51, 233001. [Google Scholar] [CrossRef]
  56. Wende, K.; Williams, P.; Dalluge, J.; Van Gaens, W.; Aboubakr, H.; Bischof, J.; von Woedtke, T.; Goyal, S.M.; Weltmann, K.-D.; Bogaerts, A.; et al. Identification of the biologically active liquid chemistry induced by a nonthermal atmospheric pressure plasma jet. Biointerphases 2015, 10, 029518. [Google Scholar] [CrossRef] [PubMed]
  57. Kaushik, N.K.; Ghimire, B.; Li, Y.; Adhikari, M.; Veerana, M.; Kaushik, N.; Jha, N.; Adhikari, B.; Lee, S.-J.; Masur, K.; et al. Biological and medical applications of plasma-activated media, water and solutions. Biol. Chem. 2018, 400, 39–62. [Google Scholar] [CrossRef] [PubMed]
  58. Graves, D.B. The emerging role of reactive oxygen and nitrogen species in redox biology and some implications for plasma applications to medicine and biology. J. Phys. D Appl. Phys. 2012, 45, 263001. [Google Scholar] [CrossRef]
  59. Babaeva, N.Y.; Naidis, G.V. Modeling of Plasmas for Biomedicine. Trends Biotechnol. 2018, 36, 603–614. [Google Scholar] [CrossRef] [PubMed]
  60. Bonzanini, A.D.; Shao, K.; Stancampiano, A.; Graves, D.B.; Mesbah, A. Perspectives on Machine Learning-Assisted Plasma Medicine: Toward Automated Plasma Treatment. IEEE Trans. Radiat. Plasma Med. Sci. 2022, 6, 16–32. [Google Scholar] [CrossRef]
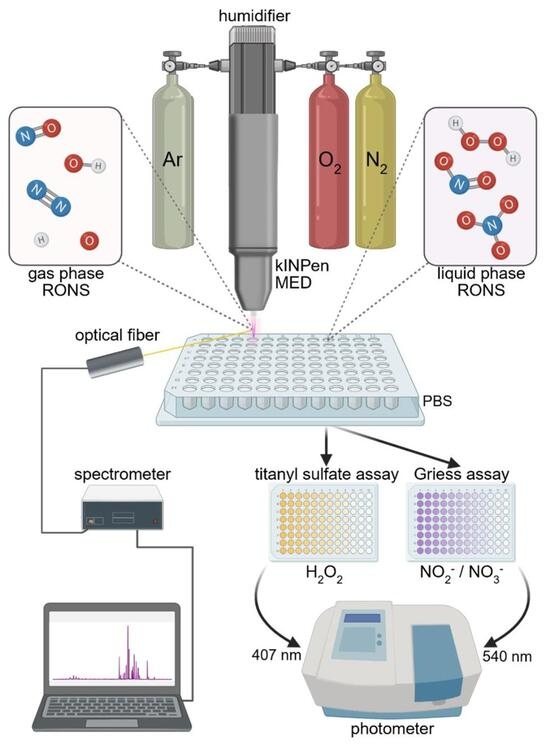
Figure 1. Gas admixtures reduce argon emission intensity in a composition-dependent manner. (a) overview of the kINPen gas plasma jet, optical emission spectroscopy (OES) setup, and spectrometric workflow; (b) representative emission spectra of 2% and 20% humidified argon; (c) emission intensity of the argon peak at 772 nm for all gas admixture conditions tested (RONS: reactive oxygen and nitrogen species).
Plasma 09 00027 g001
Figure 2. Gas admixtures differentially modulate gas-phase reactive oxygen and nitrogen species. (a) representative emission spectra of argon containing 0.25% dry and humidified O2 + N2 admixtures; (b) normalized emission intensities of OH (309 nm), N2 (337 nm), and O (777 nm) across all gas admixture conditions with corresponding regression analyses; (c) summary bubble plot depicting Spearman correlation coefficients (* p ≤ 0.05) and mean relative effect magnitudes for the three major species; (d) principal component analysis (PCA) of condition-dependent clustering patterns; (e) response to admixture gas humidification heat map for O2, N2, and O2 + N2 admixtures (AUC: area under curve); (f) response to admixture gas humidification magnitude across individual admixture concentrations.
Plasma 09 00027 g002
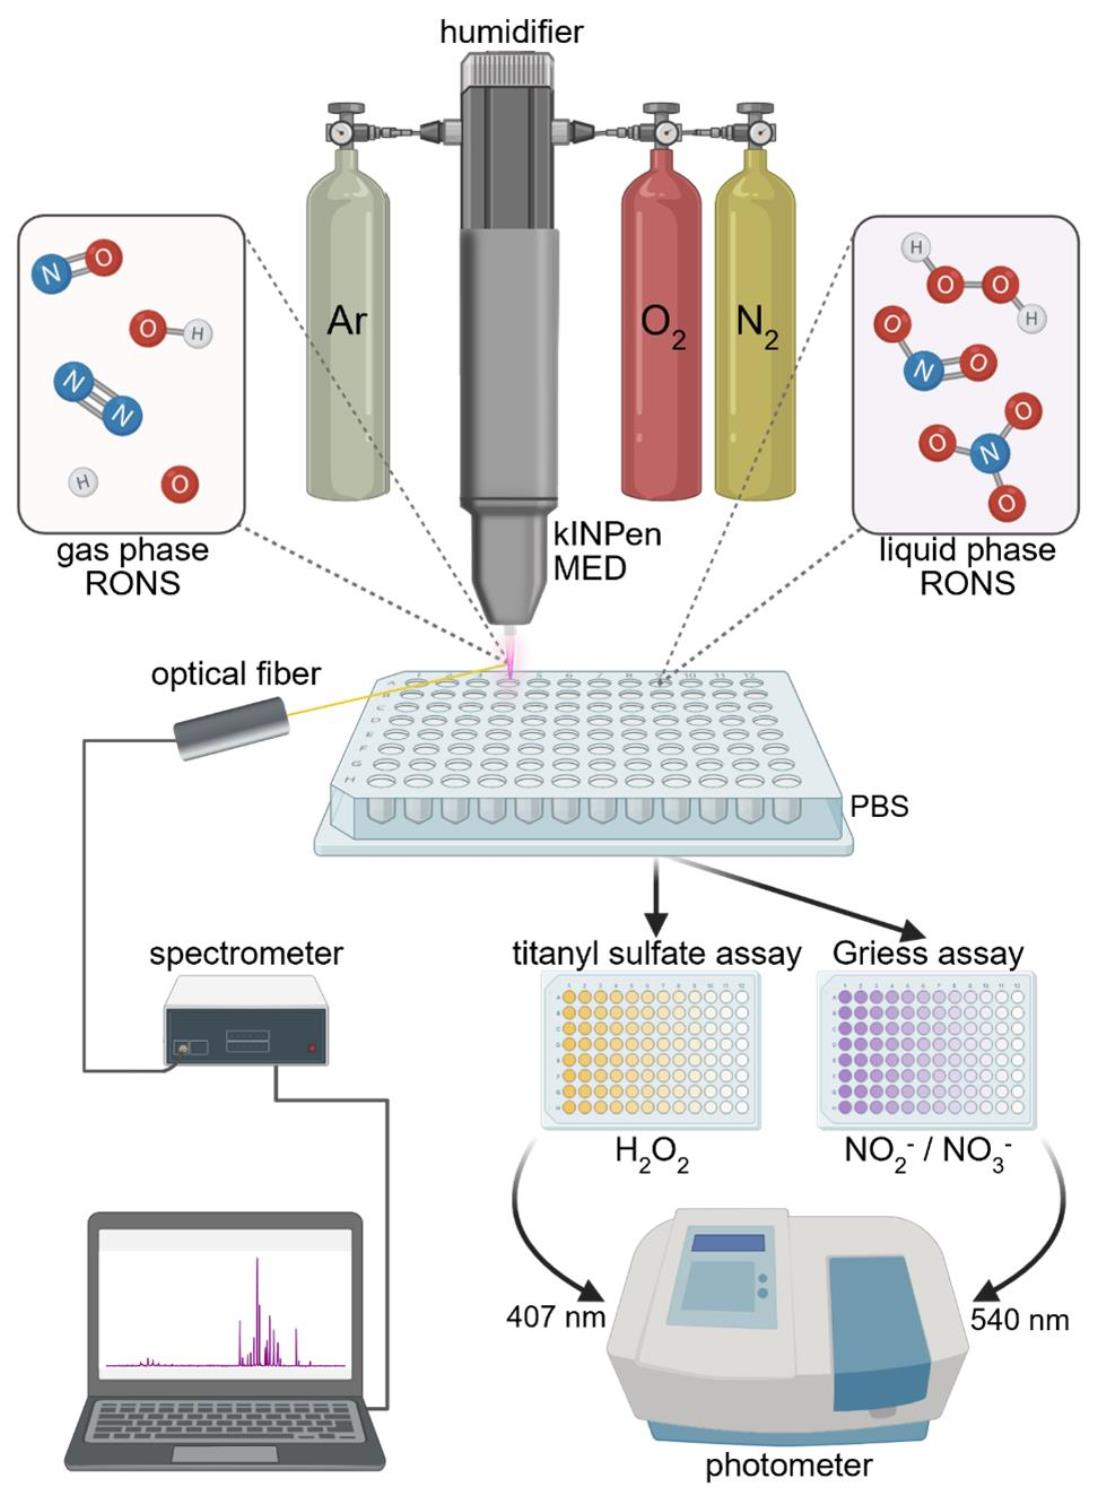
Figure 3. Gas admixtures induce distinct liquid-phase reactive oxygen and nitrogen species (RONS) signatures. (a) overview of the kINPen gas plasma jet setup and liquid species quantification in PBS using the titanyl sulfate and Griess assays; (b) H2O2 concentrations following 20 s gas plasma treatment of PBS; (c) NO2 and NO3 concentrations following 20 s gas plasma treatment of PBS; (d) fold-change ratio of H2O2 to NOx; (e) principal component analysis (PCA) of condition-dependent clustering patterns; (f) response to admixture gas humidification heat map for O2, N2, and O2 + N2 admixtures; (g) response to admixture gas humidification magnitude across individual admixture concentrations.
Plasma 09 00027 g003
Figure 4. Integrated gas-phase and liquid-phase reactive oxygen and nitrogen species (RONS) analysis reveals condition-dependent plasma chemistry. (a) volcano plot of correlations between gas-phase and liquid-phase RONS; (b) principal component analysis (PCA) integrating optical emission spectroscopy and liquid chemistry datasets; (c) overview heat map of concentration changes across gas-phase and liquid-phase RONS (FC: fold change); (df) regression analyses of OH (309 nm) versus H2O2 (d), N2 (337 nm) versus NO2 (e), and N2 (337 nm) versus NO3 (f).
Plasma 09 00027 g004
Table 1. Overview of the 65 gas admixture conditions tested in this study (slm: standard liters per minute).
DryHumidified
Ar Ar
+
O2
Ar
+
N2
Ar
+
O2 and N2
Ar Ar
+
O2
Ar
+
N2
Ar
+
O2 and N2
1 slm0.05% O20.05% N20.05% O2
+
0.45% N2
2% humidification0.05% O20.05% N20.05% O2
+
0.45% N2
0.10% O20.10% N20.10% O2
+
0.40% N2
4% humidification0.10% O20.10% N20.10% O2
+
0.40% N2
0.15% O20.15% N20.16% O2
+
0.33% N2
6% humidification0.15% O20.15% N20.16% O2
+
0.33% N2
0.20% O20.20% N20.25% O2
+
0.25% N2
8% humidification0.20% O20.20% N20.25% O2
+
0.25% N2
0.25% O20.25% N20.33% O2
+
0.16% N2
10% humidification0.25% O20.25% N20.33% O2
+
0.16% N2
0.30% O20.30% N20.40% O2
+
0.10% N2
12% humidification0.30% O20.30% N20.40% O2
+
0.10% N2
0.35% O20.35% N20.45% O2
+
0.05% N2
14% humidification0.35% O20.35% N20.45% O2
+
0.05% N2
0.40% O20.40% N2 16% humidification0.40% O20.40% N2
0.45% O20.45% N2 18% humidification0.45% O20.45% N2
0.50% O20.50% N2 20% humidification0.50% O20.50% N2
Table 2. Correlation of major gas-phase reactive oxygen and nitrogen species (RONS) produced by the kINPen, determined by optical emission spectroscopy (OES) and liquid-phase RONS. Spearman correlation coefficients (r) and false discovery rate (FDR)-adjusted p-values are shown. Significant correlations were defined as |r| ≥ 0.6 and p ≤ 0.05 and are highlighted in red.
DryHumidified
Ar
+
O2
Ar
+
N2
Ar
+
O2 and N2
ArAr
+
O2
Ar
+
N2
Ar
+
O2 and N2
rprprprprprprp
H2O2
OH309
0.870.040−0.890.0021.000.035−0.990.0010.550.121−0.850.0011.000.001
NO2
OH309
0.900.008−0.900.0020.930.0080.990.001−0.120.5450.950.001−0.930.001
NO3
OH309
0.750.050−0.830.006−0.890.0080.990.0010.770.0210.830.001−0.930.001
NOx
OH309
0.760.050−0.830.006−0.890.0080.990.0010.810.0160.950.001−0.930.001
H2O2
N2337
0.670.105−0.960.0011.000.035−0.450.1260.900.003−0.950.0011.000.001
NO2 N23370.640.095−0.940.0010.930.0080.450.1260.190.4960.990.001−0.960.001
NO3 N23370.620.100−0.990.001−0.890.0080.450.1260.900.0030.890.001−0.960.001
NOx
N2337
0.610.100−0.990.001−0.890.0080.450.1260.920.0030.990.001−0.960.001
H2O2
O777
0.910.0190.940.001−1.000.035−0.550.0790.070.5450.950.001−0.830.007
NO2
O777
0.940.0010.940.001−0.930.0080.550.079−0.620.078−0.990.0010.570.023
NO3
O777
0.980.0010.960.0010.890.0080.550.0790.030.579−0.890.0010.570.023
NOx
O777
0.990.0010.960.0010.890.0080.550.0790.070.545−0.990.0010.570.023
Disclaimer/Publisher’s Note: The statements, opinions and data contained in all publications are solely those of the individual author(s) and contributor(s) and not of MDPI and/or the editor(s). MDPI and/or the editor(s) disclaim responsibility for any injury to people or property resulting from any ideas, methods, instructions or products referred to in the content.