Abstract
Time- and space-resolved radiation emitted by the plasma produced by a 0.8 ns duration at full width half maximum, ~600 MW maximum power microwave (~9.6 GHz) pulse traversing a hydrogen-, helium-, or air-filled circular waveguide, is studied. Gas ionization by microwaves is an old subject but the regime investigated in the present experimental research, of very high-power microwaves and very short pulses using modern diagnostic tools, is new and follows a series of new studies performed so far only in our laboratory, revealing non-linear phenomena never observed before. In the present research, plasma radiation is observed along a slit made in a circular waveguide wall by either an intensified fast frame camera or a streak camera. Using calibrated input and output couplers, the transmission and reflection coefficients of the high-power microwaves were determined over a broad range of gas pressures, 0.1 kPa < P < 90 kPa. It was found that the intensity of the plasma light emission increases significantly after the high-power microwave pulse has left the waveguide. Depending on pressure, the radiation is either uniform along the slit, while the front of the emitted light follows the microwave pulse at a velocity close to its group velocity, or it remains in the vicinity of the input window, indicating that the plasma density is above critical density. It was also found that the radial distribution of radiation depends on pressure. At pressures <10 kPa, when the electron oscillatory energy reaches 20 keV close to the waveguide axis, light emission forms faster near the waveguide walls, where the ionization rate is maximal. Otherwise, when pressure is >80 kPa, light emission is most intense on the axis where the electron oscillatory energy is ~100 eV and the ionization rate is maximal. We also studied the UV radiation from the plasma, the duration of which was found to be longer than the duration of visible light emission. This indicates the existence of energetic electrons for tens of ns after the high-power microwave pulse has left the observation region. Considering that the emitted light intensity depends on the plasma density and temperature, the observed data may be used for a comparison with the results of collisional radiative models if the electron time and spatial energy distribution is known.
1. Introduction
Gas ionization by microwaves (MW) has been intensively studied during the last 50 years, resulting in numerous publications [1,2,3,4] and textbooks [5,6,7,8,9] in which the main phenomena governing plasma formation are described; namely, gas discharge, accompanied by quasi-neutral plasma formation, which is governed by avalanching by initial electrons which exist in the gas due to random cosmic ray ionization of neutrals. To obtain avalanches, electrons should acquire energy along their mean free path to ionize neutrals. Here, is the density of neutrals, is the ionization cross-section, and is the ionization energy of neutrals. For ideal gas, this value is given by where is the Boltzmann constant and T is the gas temperature. Using this law, one can obtain that an external electric field should be larger than to cause avalanching, where e is the electron charge. Thus, depending on the type, temperature, and pressure of gas; the microwaves’ frequency (which determines the effective time of electron acceleration); and the duration of the microwaves (which should be long enough to produce plasma), different thresholds were determined for the electric field amplitude sufficient for initiating an electron avalanche in the gas followed by plasma formation [10,11,12,13].
This subject of microwave gas ionization is of primary importance for different applications such as plasma chemistry [14,15], microelectronics [16,17], and microwave propagation in the atmosphere [18]. This research was carried out with either continuous waves (DC) microwaves of up to several hundreds of kW [19,20] power or with short, pulsed microwaves with a pulse duration in the range of 10−7–10−5 s and up to several tens of MW in power [21,22].
Advances in high-voltage pulse generators and microwave sources during recent years have made it possible to generate high-power microwave (HPM) pulses of ns timescale duration and a peak power of P ≥ 109 W [23,24]. This has enabled the study of the interaction of such HPM pulses with gases and plasma, such as gas breakdown when the high-frequency electric fields exceed 105 V/cm [25], runaway electrons generation [26,27], dependence of the breakdown electric field on gas pressure [7,28], and interface insulator breakdown [29,30,31,32,33] accompanied by fast dense plasma formation followed by microwave pulse shortening [34,35]. Also, the efficiency of HPM compressors [36] depends on the ns timescale formation of critical density plasma in the pressurized gas-filled interference switch.
The interaction of HPM beams with a peak electric field of E0 ≤ 100 kV/cm and a pulse duration of >30 ns [19,37] and >10 µs [38,39] was studied with different gases. It was found that for tens of ns-long pulses, at gas pressures P ≤ 15 Pa, a diffused discharge plasma is formed. However, at larger pressures, this diffused discharge transforms into discrete streamer-like plasma. Experiments described in Ref. [40] show the generation of a positively charged plasma and high-energy (up to 25 keV) electrons by a focused HPM pulse (E0 ≈ 100 kV/cm, 50 ns duration, 10 GHz). In experiments carried out by Yalandin et al. [22], results on the breakdown electric field thresholds in air for ns and sub-ns-time-duration HPM beams with power up to 500 MW (Ka-band) were reported.
Let us note that there are other phenomena which can be realized when ns- or sub-ns-long HPM beams interact with gas. Namely, frequency upshifting when the plasma density increases almost simultaneously at a scale exceeding the electromagnetic wavelength [41,42,43]. Another example is the experimental realization of the theoretically predicted self-channeling of a very intense HPM beam [44], with Gaussian radial distribution of the power, due to the generation of over-dense plasma at its periphery and under-dense plasma in its central region. This becomes possible when the oscillatory energy of the plasma electrons considerably exceeds the ionization energy of neutral atoms at the beam axis and the impact ionization rate at the beam periphery becomes larger than that at the axis.
Research on the non-linear interaction of HPM beams with gas or plasma in such ultra-intense and ultra-short microwave regimes were never explored until they were conducted at the Plasma Physics and Pulsed Power Laboratory, Physics Department, Technion in a study of the interaction of 0.8 ns full-width half maximum duration (FWHM) HPM pulses with an average power of ~300 MW (peak instantaneous power of ~600 MW) at ~9.6 GHz, and ~600 GW average (peak instantaneous power of ~1.2 GW) at ~26.4 GHz, with neutral gas and plasma was started ten years ago. Several novel phenomena were observed: self-channeling of the microwave pulse in the ionized gas [25,45], non-linear complete absorption of microwaves [46], HPM frequency up-shift accompanied by super-luminal pulse propagation and compression [34], wake field formation [25], generation of high-energy electrons [26,47], and generation of stationary striations in plasma [48].
In recent experimental studies [28] with a ~300 MW, ~0.8 ns, and ~9.6 GHz HPM pulse, the pressure thresholds for the ionization of different gases were determined. Additionally, it was shown that the type of microwave plasma discharge, whether diffused or streamer-like, depends on gas pressure. Using visible spectroscopy [26], the temporal evolution of the plasma density produced by this HPM pulse in a gas-filled waveguide was determined. It was found that the plasma density reaches ~1015 cm−3, which is much higher than the critical plasma density [(0.2–2) × 1013 cm−3, depending on gas density], ~2 ns after pulse termination. The plasma does not decay before ~100 ns, because electrons of up to 8 keV energy continue to ionize the gas. This is because part of the electrons escapes from the plasma to the waveguide walls by the pondermotive force during the HPM pulse propagation, leaving a positive charge potential well attracting electrons; this causes further ionization. Higher-energy electrons (up to ~100 keV) emitted from plasma were also detected [47]. These were the first experimentally obtained data of the parameters of the plasma produced by gas ionization by extremely powerful and short-duration HPM pulses.
The main purposes of the present research can be outlined as follows: (a) to find dependencies of the transmission, absorption, and reflection coefficients of the HPM propagating in the circular waveguide when filled by different gases (helium, hydrogen, and air) in a broad range of pressures (P = 0.1–90 kPa); (b) to obtain the time- and space-resolved distribution of the light emitted from the plasma formed by the HPM ionization of these gases in this range of pressures. Additionally, the characteristics of the light emission from the flashover plasma formed on the surface of the Mylar window separating the microwave source (in vacuum) from the gas-filled waveguide are also studied. The transmission, absorption, and reflection coefficients were studied using calibrated couplers installed in front and behind the waveguide. The time- and space-resolved light emission from the plasma was studied using an intensified framing camera and a streak camera combined with optical filters and UV radiation measurements using a fast photo-multiplier tube (PMT). The remainder of this manuscript is organized as follows. Section 2 presents the experimental setup and diagnostics used in this research, Section 3 summarizes and discusses the experimental results, and Section 4 presents the conclusions.
2. Experimental Setup
We used the same experimental setup as that used in our earlier studies of the interaction of an HPM pulse with neutral gas during its propagation in a circular waveguide [26,34,47,48]. The HPM pulse (peak mean power of ~300 MW, ~0.8 ns (FWHM), 9.6 GHz) is generated by a super-radiant backward wave oscillator (SR-BWO) [49] driven by a high-voltage (HV) generator based on semiconductor opening switches and magnetic compression stages [23]. The generator produces a ~5 ns long pulse, with a rise time of ~0.5 ns and a voltage amplitude of ~300 kV. This pulse, when applied to a graphite explosive emission cone-shaped cathode of the magnetically insulated diode [50,51] produces explosive emission plasma at the sharp cathode edges where the largest electric field enhancement exists. This plasma serves as a source of electrons which are extracted from the plasma boundary and accelerated towards the anode as a ~2 kA hollow electron beam. The beam current, electron energy, and hollow structure of the beam were reported in an earlier article [52]. The beam propagates through a slow-wave structure (SWS) guided by a ~3 T magnetic field to generate an HPM pulse in the TM01 waveguide mode. The 60 cm long SWS was assembled using 29 ring-type cavities with increasing outer diameter in the direction of the electron beam propagation, which increases the beam wave coupling impedance. The external 3 ms half-period magnetic field is produced by an external solenoid powered by the thyristor-controlled discharge of a 4.6 mF capacitor which is preliminarily charged to ~1.2 kV.
A 28 mm inner diameter tube connects the SR-BWO output to a waveguide of the same diameter installed along the axis of an experimental chamber [see Figure 1a]. Both the experimental chamber and the SR-BWO are evacuated to a pressure of ~10−3 Pa using turbo-molecular and scroll pumps. Calibrated loop-type couplers [53,54], installed between the SR-BWO output and the waveguide entrance (coupler #1) and between the waveguide exit and an impedance matched horn antenna (coupler #2), are used to measure the incident and reflected (coupler #1) and transmitted (coupler #2) HPM signals. The waveguide, installed inside the larger diameter experimental chamber, is separated from the SR–BWO and antenna by two 0.4 mm thick Mylar windows, which are transparent to the propagation of the sub-nanosecond HPM pulse [29,48]. The waveguide, coupler #2, and horn antenna are evacuated to a pressure of ~10−3 Pa by an additional turbo-molecular pump backed by a scroll pump. The experimental chamber containing the waveguide is filled with dry air, H2, or He gas in the pressure range of 2 × 10²–1 × 10⁵ Pa using precise pressure controlling vents monitored by calibrated pressure gauges. The gas pressure inside the experimental chamber and waveguide is considered uniform due to gradual filling by the gas. We chose these gases according to their different ionization potentials and molecular and atomic composition. Particularly, we chose air because of its importance for HPM pulse propagation in it and hydrogen as it is appropriate for filling high-voltage gas switches operating in the ns timescale and high-power microwave compressors [20,36].
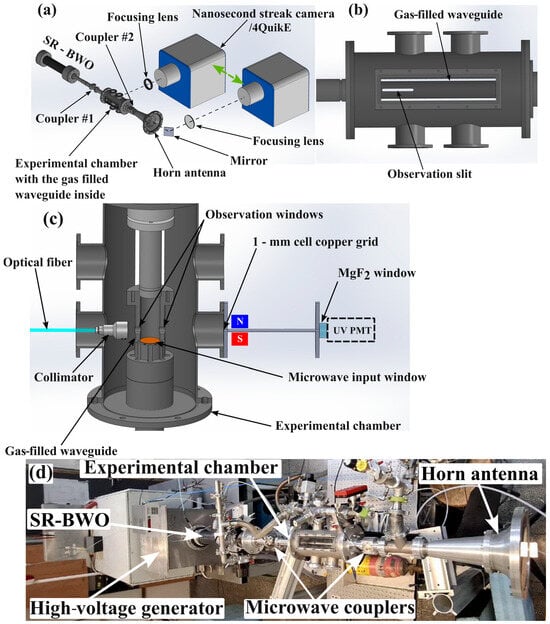
Figure 1.
(a) The experimental setup. (b) The gas-filled waveguide installed inside the experimental chamber. (c) The experimental setup for visible and UV emission measurements. (d) The picture of the experimental setup.
The time evolution of the light emitted from the plasma formed by the HPM pulse is obtained using a streak camera Optronics Optoscope SC–10, Optronics GMBH, Kehl, Germany [see Figure 1a], operating with the full MCP gain of ~104 and at 1 ns/mm sweeping speed which corresponds to a resolution of ~14 ps/pixel. The plasma light exiting the waveguide through a 5 cm long, 0.5 cm wide open slit is focused by a lens of 5 cm diameter and 20 cm focal length on a 1.5 cm long, 10 μm wide slit at the entrance to the camera [see Figure 1]. Our earlier experiments [48] showed that the attenuation of the HPM pulse propagating in the waveguide made of 2 mm diameter wires azimuthally uniformly distributed 5 mm apart from each other gives almost the same results as a solid stainless-steel waveguide. Thus, the slit made in the waveguide should not influence the HPM propagation. The distances between the slit and the lens and the lens and the camera slit were 70 cm and 28 cm, respectively.
For an empty waveguide (vacuum, 0.02 Pa), the time and radial space evolution of the emitted light from the plasma produced on the input Mylar window is viewed from beyond the horn antenna frontally [Figure 1a]. In these experiments, the light is focused on the slit of the streak camera by a 15 cm diameter lens of 65 cm focal length. The distances between the input Mylar window and the lens and the lens and the streak camera were 190 cm and 100 cm, respectively. When the waveguide is filled with gas, the evolution of the radial light is observed also from the plasma formed along the waveguide in a region between the input window and up to 10 cm from it.
The spatial distribution of the plasma light emission was observed through the waveguide slit and the horn antenna using the nanosecond-intensified camera 4QuikE (Stanford Computer Optics, Munich, Germany). The camera operates with a frame duration of ≥1 ns and at different delay times relative to the time when the HPM pulse crosses the input Mylar window.
In the experiments, we registered the waveforms of the forward current through the SOS of the last compression stage of the HV generator, and of the voltage applied to the magnetically insulated diode. The current was registered using a homemade self-integrated Rogowski coil (RC), and the voltage was registered by the capacitive voltage divider (VD). The latter was placed at the entrance of the diode. A time delay of ~195 ns between these two signals was measured in separate experiments using an InfiniVision DSOX6004A (KEYSIGHT) digital oscilloscope, Keysight Technologies, Colorado Springs, CO, USA.
A pulse generator (Model 575-8C, Berkeley Nucleonics Corporation, San Rafael, CA, USA) was used to synchronize the SR-BWO’s operation and the timing of the Optoscope SC–10 and the 4QuikE cameras. The waveforms of the HPM pulse obtained by the couplers were synchronized with the output pulses of the camera and registered by an Agilent DSO81204B (12 GHz, 40 Gs/s) digital oscilloscope, Santa Clara, CA, USA. The waveforms registered by the VD and RC were also acquired by this oscilloscope. Time delays between the operation of the camera and the HPM pulse’s crossing time at the input window were adjusted by considering the lengths of the coaxial cables connecting coupler #1, the output of cameras with the oscilloscope, the internal delays of the camera, the time of the HPM pulse propagation between coupler #1, and the input Mylar window and the time delays related to the light propagation along the distance to the camera. Furthermore, in the text we will define the time td = 0 as the time when the peak of the HPM pulse crosses the Mylar window.
The signal from the RC was divided by a 50 Ω matched splitter. One of the signals was used to control the operation of the SOS-based generator by adjusting it to appear at the maximum of the magnetic field using signals produced by a 575-8C pulse generator. The latter were used to trigger electrical schemes driving the operation of the magnetic field power supply and the power supply of the HV generator. The current through the solenoid was measured by a Pearson current monitor model 3025. The 575-8C pulse generator was used also to trigger the imaging setup (either the 4QuikE fast framing camera or the streak camera) using the cameras’ internal delays to adjust the frame timings with respect to the operation of the SOS-based generator.
The temporal evolution of the light emission intensity was measured by two Hamamatsu photo-multiplier tubes (PMT) [see Figure 1c]. A R9880U PMT was used for measurements of light intensity in the visible range 300–700 nm (rise time of 0.57 ns). The light emitted from the plasma seen through observation windows was collected to an optical fiber (Custom Fiber Optic Patch Cable FP1000VRT, Thorlabs, Newton, NJ, USA) coupled with a collimator (CFCS5-A, Thorlabs) and transferred to the Faraday room, where this PMT with its power supply was located. UV light emission was measured using a R1081 PMT (115–200 nm, 1.8 ns rise time, maximal sensitivity at 130 nm). The latter was mounted on a circular magnesium fluoride (MgF2) window (Thorlabs part number WG60530). This PMT was connected to the DC voltage source and a Keysight DSOX6004A (6 GHz, 20 Gs/s) digital oscilloscope which were in the Faraday room. A 3 mm inner diameter and 12 cm long stainless-steel tube was placed between the experimental chamber and this PMT to decrease the electromagnetic noise from the HPM pulse. Additionally, two permanent SmCo magnets creating a ~200 G magnetic field perpendicularly to the cylinder axis measured by a Gaussmeter model 915T (Magnetic Instrumentation Inc., Indianapolis, IN, USA) were placed to prevent high-energy electrons from reaching the MgF2 window. The waveforms from the PMTs were registered by a DSOX6004A oscilloscope together with the waveform of the RC. This allows for synchronization of the PMT signals with the HPM pulse crossing the Mylar window using time delays obtained by the Agilent DSO81204B oscilloscope, where HPM signals from coupler #1 and the RC were acquired.
3. Results and Discussion
3.1. Transmission, Reflection, and Absorption of the HPM Pulse for Different Gases and Pressures
As the gas pressure increases, it is expected that the ionization rate of the gas increases and the absorbed HPM energy increases, but because the propagating HPM pulse is short, a critical density plasma can form at the leading part of the HPM pulse, resulting in the reflection of its rear part. The result of this is increased reflection and decreasing transmission to a point of cutoff. At even higher pressures, the electrons mean free path decreases, resulting in a decrease in ionization rates with less plasma formation, which consequently increases transmission of the HPM. The pressures at which these transitions occur depend on the different ionization energy of the different gases. Thus, it is important to determine the transmission, , and reflection, , coefficients of the HPM pulse as function of pressure for the gases studied.
We measured the values of and coefficients of the HPM pulse in the pressure range 1–100 kPa for He, H2, and air. These coefficients were determined as and , where the incident , transmitted , and reflected energy of the HPM pulse were calculated by integrating the incident, transmitted, and reflected power signal measured by couplers #1 and #2, respectively. In Figure 2 the measured transmission T, reflection R, and absorption D = 1 − (T + R) coefficients for different gases for increasing gas pressure are presented. In the range 0.1–133 Pa, the values of T ≈ 0.9 and R ≈ 0.05 are approximately constant, the result of negligibly small HPM energy losses to gas ionization. For P > 133 Pa, the value of T decreases and the value of R increases, reaching maximal HPM absorption of up to 35% at pressures of 0.2 kPa, 1 kPa, and 2.1 kPa for air, hydrogen, and helium, respectively. Beyond these pressures, cutoff appeared followed by transmission at ≥40 kPa for air and ≥80 kPa for hydrogen and helium. The dependencies seen in Figure 2 allow one to determine the pressure range for these gases for which the most efficient HPM pulse propagation can be obtained or the most efficient energy of the HPM pulse can be delivered to the plasma.
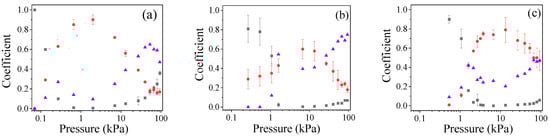
Figure 2.
Transmission (black squares), reflection (red circles), and absorption (violet triangles) coefficients vs. gas pressure. (a) Air, (b) hydrogen, and (c) helium.
The value of T determines the part of the total energy of the HPM pulse which is transmitted through the waveguide. The energy loss of the HPM pulse can be associated with ionization of gas molecules and atoms and due to reflections from the plasma. A rough estimate of the energy losses for ionization, assuming a plasma density of ≤1012 cm−3, ~200 cm−3 waveguide volume, and energy loss for ionization for He atoms of ~24 eV, gives ≤1.3 mJ, which is significantly smaller than the total energy of ~200 mJ of the HPM pulse. This means that the decrease in the transmitted microwave energy is caused by the reflection of the HPM pulse from the plasma–gas interfaces, which can be associated with the plasma formed in the vicinity of the Mylar input window and plasma formed in the frame of the propagating HPM pulse. In general, the reflection coefficient is defined by the mismatch between the wave impedances. For the plasma-filled waveguide, the wave impedance depends on the plasma density evolution, reaching T = 1 when the plasma density approaches its critical value. In our future research, we plan to use these experimentally obtained dependencies T = f(P) to calculate the plasma density evolution corresponding to the experimental results.
Based on these results, the experimental conditions for time and space evolution studies of the plasma light emission were chosen to be in the range of gas pressures where intense plasma formation due to gas ionization by the HPM pulse is expected.
3.2. Longitudinal and Radial Distribution of the Emitted Plasma Light Obtained by 4QuikE Camera
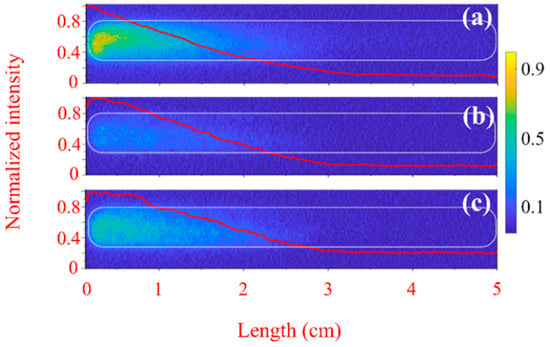
The images of the plasma light emission obtained by the 4QuikE camera through the waveguide slit are shown in Figure 3 for He and Figure 4 for air at different pressures and various time delays td between the camera operation and the HPM pulse’s crossing time of the input Mylar window. Similar images were obtained for hydrogen. In Figure 3a, for He at td = 0, a ~2 cm long weak light segment exists at the upstream end of the slit (5 mm downstream from the Mylar window). The same but stronger light forms in air [Figure 4a]. At longer times, for He at P = 1 kPa [Figure 3b] and air at P = 0.07 kPa [Figure 4a,b], when the transmission coefficient is T ≈ 0.9, the HPM pulse produces plasma light along the entire length of the 5 cm long observation slit. This indicates uniform plasma formation and that during the HPM pulse propagation along the slit length, the plasma density is smaller than the critical density for collisionless plasma × 1012 cm−3. The stronger light emission closer to the input window could be related to additional gas ionization by electrons emission from the flashover plasma formed at the surface of the Mylar window. This surface flashover plasma emission will be discussed later. So, one can conclude that the HPM pulse propagation in He, H2, and air at pressure < 1 kPa is accompanied by the formation of a diffuse and uniform plasma with a density smaller than its critical value.
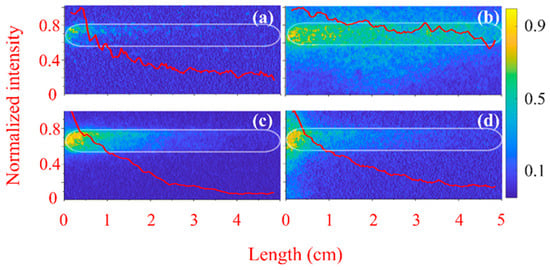
Figure 3.
Images of He plasma light emission recorded along the waveguide slit overlayed with the calculated integrated longitudinal light intensity (red curves) normalized to its maximum value. Camera exposure time is tex 1 ns, P ≈ 1 kPa in (a,b), and P ≈ 3.2 kPa in (c,d). td ≈ 0 ns in (a,c) and td ≈ 15 ns in (b,d). The outline of the boundary of the slit is depicted by the white dashed line. The HPM pulse propagates from left to right.
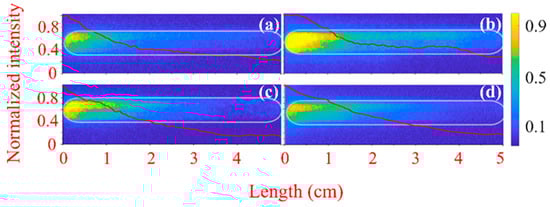
Figure 4.
The same as Figure 3 but for air. Camera exposure time is tex 2 ns, P ≈ 0.07 kPa in (a,b) and P ≈ 0.26 kPa in (c,d). td ≈ 0 in (a,c) and td ≈ 5 ns in (b,d).
In Figure 5, we present the distribution of the plasma light intensity along the axis obtained by the 4QuikE camera (see Figure 3) at different He pressures and time delays relative to the HPM pulse crossing the input Mylar window. One can see that at the low pressure (T > 90%) during the first 3 ns, the HPM pulse produces the most intense plasma emission along the distance of ~3 cm from the input window. Also, for higher-pressure (when most of the HPM is reflected, R > 80%) plasma, light emission occurs mainly near the microwave input. This indicates denser plasma formation near the input window where the HPM pulse energy is deposited into the formation and heating of the dense plasma with a density close to its critical value and pulse reflection due to the mismatch between vacuum and plasma-filled wave impedances. In the respective figure inserts, the light intensity is normalized to the largest value for each pressure. One can see that for td = 0–3 ns, the longitudinal distribution of the normalized intensities is similar for P = 1–3.2 kPa, while for td = 15–23 ns, for P = 1 kPa, the normalized distribution becomes almost uniform in contrast to larger pressures. The latter can be related to faster diffusion processes at lower gas pressures leading to smearing gradients in the plasma density.

Figure 5.
Normalized plasma light intensities vs. the distance from the input Mylar window at two different time delays td varied in the range td = 0–3 ns (a) and td = 15–23 ns (b) and different He pressures of P = 1 kPa (black), 1.6 kPa (red), 2 kPa (blue), 3.2 kPa (green). In the corresponding inserts, the light intensity is normalized to the largest value for each pressure.
At higher pressure, when T ≈ 0.1, [Figure 3c,d] for He at P = 1 kPa, and for air at P = 0.26 kPa [Figure 4c,d], the light is more intense along the ~2.5 cm upstream slit region and almost no plasma light develops downstream. This indicates that the generated plasma density within the frame of the HPM pulse is higher than the critical density of ~2 × 1013 cm−3 for collisional plasma. This allows us to estimate the ionization rate [7] as s−1, where cm−3 is the initial density of free electrons and 1.5 × 10⁻¹⁰ s, l = 3 cm is the distance the pulse propagates with group velocity 1.7 × 1010 cm/s [26,28]. This value of significantly exceeds the ionization frequency typical to moderate-power microwave gas ionization [37]. This value also exceeds data presented in Ref. [37], where the ns time-scale plasma interference switch of the microwave compressor was studied.
In Figure 6, one can see images of the plasma light emission at pressures close to atmospheric pressure, when reflection of the microwaves slightly decreases and transmission increases (see Figure 2). Namely, at P = 90 Pa, the transmission coefficient increases to 35%, 10%, and 13% for air, H2, and He gases, respectively. At this pressure, the most intense plasma formation occurs within the first 3 cm of the waveguide (relative to the input window), where the plasma is formed with the density close to its critical value. The latter leads to the reflection of most of the HPM pulse. The remaining part of the pulse, with a much lower intensity, continues propagation without significant gas ionization. This typical distance of ~3 cm, where light emission is most intense, will be discussed later.
In Figure 7a–c, one can see frontal images of the plasma light emission for He at different pressures and delay times td. Because of the way the lens is focused (see Section 2), the light emitted by the flashover plasma on the upstream window is not seen in Figure 7. At low pressure P = 0.5 kPa, the light emission is more intense close to the waveguide wall [Figure 7a,b]. This is related to the electron’s oscillatory energy which is smaller at the periphery due to smaller microwave radial electric field close to the waveguide wall. This results in larger ionization cross-section and more efficient gas ionization at the periphery than on the waveguide axis. On the axis, the electric field, and consequently the electrons’ oscillatory energy, is maximal, reaching ~400 kV/cm and several tens of keV energy [28,47]. The latter leads to decreased ionization cross-section and less density of the plasma. Such non-linear effect was observed in our earlier studies with a microwave pulse focused on axis of a gas-filled chamber, creating a low-density plasma channel with high-density cylindrical walls, a self-channeling effect [25,44]. For high pressures, P = 90 kPa [Figure 7c and for air in Figure 7d], and in contrast to the light distribution observed for low pressure, the plasma light becomes more intense on the axis, where the microwave axial electric field is maximal. At that pressure, due to the high rate of collisions, only in the vicinity of the axis electrons have significant energy for ionization.
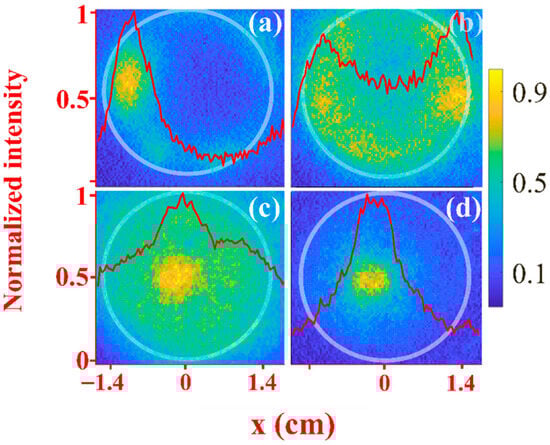
Figure 7.
Frontal images [see Figure 1a] of the plasma light emission overlayed with the light intensity distribution integrated over axis x (red curves) for He pressure of P = 0.5 kPa (a) td = 0 ns, (b) td = 0.5 ns, (c) td = 1 ns, and (d) for air pressure of P = 90 kPa and td = 1 ns. Camera exposure time tex ≈ 1 ns. The waveguide boundary is marked by the white circle.
In the case of such powerful HPM pulse extraction from waveguide, a flashover plasma which can form on the surface of the interface insulator can shorten the microwave pulse when the plasma density exceeds its critical value. Because of this, we studied this plasma formation by observing the evolution of the light emission intensity from the plasma formed on the surface of the Mylar input window. These experiments were carried out at residual air pressure of P ~ 1 Pa and typical images of the light emission are shown in Figure 8. One can see that light emission starts from the waveguide wall and propagates toward the axis. At the periphery, triple points (intersection between metal–vacuum–dielectric) are where surface discharges starts [55]. At these points, electric field enhancement is realized due to different dielectric constants of metal, vacuum, and Mylar. This enhanced electric field leads to initiation of the surface discharge which propagates along the surface of the Mylar forming a flashover plasma. However, the length of the HPM pulse is too short to produced plasma of sufficient density to affect its propagation. Nonetheless, this plasma can be the source of electrons which accelerate towards the plasma formed by the HPM pulse and which is of a positive potential. Thus, these electrons will produce more ionization when the gas pressure is high. This leads to denser plasma formation and an increase in the reflection coefficient due to a mismatch between vacuum and plasma-filled waveguide impedances.
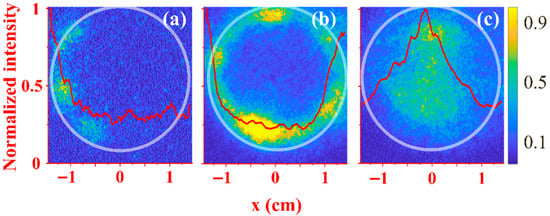
Figure 8.
Same as Figure 7 but observing the light emitted from the flashover plasma formed on the input Mylar window. P ~ 1 Pa. The time delay is td ≈ 0 ns. Camera exposure times are (a) tex ≈ 5 ns, (b) tex ≈ 7 ns, and (c) tex ≈ 9 ns. The weak light seen outside the wall in (b) is reflected wall light.
3.3. Longitudinal and Radial Distribution of the Emitted Plasma Light Observed by a Streak Camera
The light emission frame images described in Section 3.2 displayed the space-resolved intensity of the radiation at certain instances relative to the timeline of the HPM pulse propagation in the waveguide. To obtain the time-resolved evolution of the radiation, we used streak camera. In Figure 9, Figure 10, Figure 11 and Figure 12, we present images of the light emission intensity obtained with the streak camera’s time sweep of 14 fs/pixel (vertical axis) and spatial resolution of ~37 μm/pixel (horizontal axis), for different pressures of air, He, and H2. Here, the light emission intensity is normalized to the highest value observed for each case. The total size of the image is 1392 × 1040 pixels. The HPM pulse propagates from left to right along the waveguide. Additionally, the intensity was averaged over 0.5 ns × 1 mm which allows the time duration of the light emission and its longitudinal intensity distribution along the slit to be calculated.
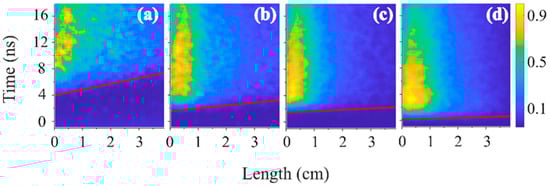
Figure 9.
Images of the light emission obtained at an air pressure of (a) 0.07 kPa, (b) 0.14 kPa, (c) 0.2 kPa, and (d) 0.28 kPa. The time t = 0 corresponds to the HPM pulse’s maximum crossing the entrance point to the waveguide slit.
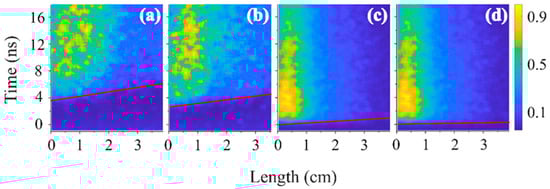
Figure 10.
Same as Figure 9 for a He pressure of (a) 0.53 kPa, (b) 0.8 kPa, (c) 1 kPa, and (d) 2.1 kPa.
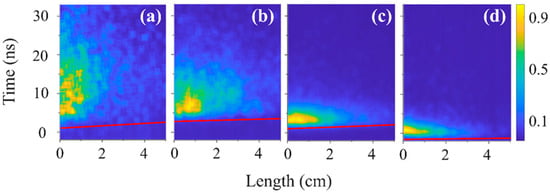
Figure 11.
Streak images of the hydrogen plasma emission at pressures (a) 0.28 kPa, (b) 0.53 kPa, (c) 1 kPa, and (d) 2.1 kPa. Streak camera sweeping speed is 35 fs/pixel.
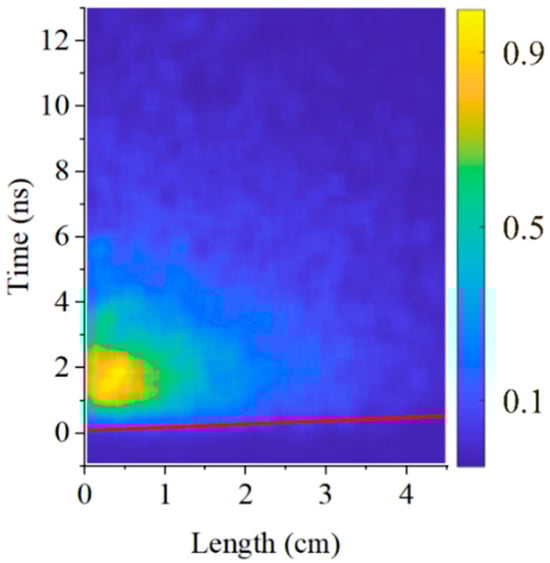
Figure 12.
Streak image of the hydrogen plasma light emission at P = 1 kPa. The streak camera sweeping speed is 14 fs/pixel.
The onset of the light emission along the slit is marked by a red line. This was defined by digitizing the light intensity and defining this line 5% above background intensity. The slope of this line was used to estimate the propagation velocity of the front of the plasma light presented in Table 1 and Table 2. The velocity of the emission front at P = 0.53 kPa for He (T < 10%) and P = 0.07 kPa for air is ~2.5 × 10⁷ m/s. This is ~8 times slower than the group velocity of the HPM pulse propagation in vacuum Vgr ≈ 1.7 × 10⁸ m/s. The meaning of these results is that the HPM pulse produces only dilute plasma. Due to the escape of plasma electrons by the ponderomotive force of the HPM pulse, the plasma acquires a positive potential [25]. Thus, after the HPM pulse has left the slit (the HPM pulse travels along the slit in ~0.25 ns), the plasma density increases due to continuous ionization of the gas by the high-energy electrons left in this plasma. At high pressures, P = 1 kPa for He and P = 0.28 kPa for air, this velocity increases up to 1.3 × 10⁸ m/s. Due to continuing gas ionization, the plasma density increases even after the HPM pulse has left the slit. Our recent spectroscopic studies showed that the plasma density can increase up to 1015 cm−3 within a few nanoseconds due to this additional ionization process [26]. This qualitatively agrees with the intense light which appears at the slit entrance (Figure 9, Figure 10 and Figure 11) and to the light distribution seen in the single-frame images (Figure 3, Figure 4 and Figure 5). Qualitatively, the difference in transmission coefficients of the HPM pulse propagation and velocity of the propagation of the front of the plasma light at different pressures in air and He (see Table 1 and Table 2) is related to different ionization energies of these gases, collision frequencies of electrons, and, consequently, the different times required for electron avalanching and plasma formation.

Table 1.
Velocity of the propagation of the front of the plasma light at different air pressures.
Table 2.
Same as Table 1, for He.
The increase in the time delay between the appearance of light emission and HPM pulse propagation (see Figure 9, Figure 10 and Figure 11) with decreasing gas pressure can be explained by the decrease in the ionization rate. This leads to less dense plasma formation and unresolvable light emission for the given magnification of the streak camera. Additionally, the Einstein coefficient, which is of the order of 10−9 s even for strong transitions, results in relaxation times of the excited levels ≥ 10−9 s.
One can see that for air and He plasma, the light duration is >12 ns and the front propagation length is ~3 cm at P < 1 kPa. For H2 plasma, the length is also ~3 cm, but the duration of light emission decreases significantly from ~30 ns to ~2 ns with the pressure increasing from 0.28 kPa to 1 kPa. This can be explained by the quenching of exited states of hydrogen atoms by H2 molecules. The typical quenching time at P = 1 kPa is ≤3 ns, which is consistent with the data obtained [26,56]. The intense plasma light emission, which is only seen in the first few cm of the waveguide after the HPM pulse’s passage, can be reasonably associated with denser plasma formation along the surface of the Mylar window and additional gas ionization by electrons emitted from this surface plasma into the positive plasma potential [55]. Indeed, the CSDA (continuous slow down approximation) [57] range of electrons with energy < 10 keV in He, H2, and air at pressure >1 kPa does not exceed 1 cm, so the injection of these electrons into positively charged plasma leads to additional ionization and plasma ions’ space charge neutralization.
For hydrogen (Figure 11), compared to air and He, light emission was less intense and lasted for a shorter time. To obtain reliable plasma light emission for hydrogen, the streak camera was operated at a sweeping speed of 35 fs/pixel at pressures of 0.28 kPa and 0.53 kPa (Figure 11) and only at 1 kPa and 2.1 kPa when the plasma light intensity was maximal; a sweeping speed of 14 fs/pixel (Figure 12) was sufficient to resolve light emission. One can see that the duration of resolvable plasma light emission does not exceed a few nanoseconds, and the length of the light emitting region is <2 cm. Using these streak images, the velocity of the light emission front propagation at different H2 pressures was estimated and is presented in Table 3.
Table 3.
Velocity of plasma light front propagation at different hydrogen pressures.
3.4. Spectrally Resolved Images of the Evolution of the Plasma Light Emission
The plasma radiation spectrum depends strongly on the electron temperature. We used different optical filters to obtain the spectrally resolved dependence of the light distribution in space and time. These filters were calibrated using a SPEX-750M, 2400 g/mm grating spectrometer (750 M Research Spectrometer, Instruments S. A., Inc. JOBIN YVON/SPEX Division, Edison, NJ, USA) with a 4QuikE camera attached at its output and a calibrated black body radiation lamp.
In Figure 13, the temporal and spatial distributions of the plasma light intensity for He at a pressure of 2.1 kPa in different wavelength ranges are shown. In this experiment, either a long-pass or a high-pass filter was installed in front of the streak camera. One can see that at λ < 4700 Å (blue filter), the light duration is ~12 ns [Figure 13a], while at λ > 6100 Å (red filter), the duration decreases to ~6 ns [Figure 13c]. This indicates the presence of relatively long living electrons of sufficient energy to excite high energy He atomic levels. In Figure 13b, the light distribution is shown within the narrow wavelength range 5000 ± 100 Å (green filter), which contains the intense He I spectral lines 5016 Å and 4922 Å, here with a duration of ≤3 ns.
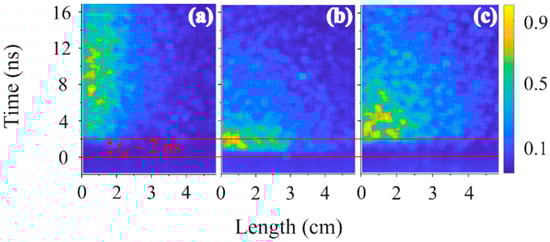
Figure 13.
Normalized light intensity at He pressure of 2.1 kPa at the wavelength range (a) 3300 ± 1400 Å, (b) 5000 ± 100 Å, and (c) >6100 Å.
One can see that with a blue filter, light emission is delayed by td ~2 ns, whereas with the red and green filters, light emission starts at td ≤ 1.5 ns. Additionally, emission at UV wavelengths has a much longer duration than visible and IR emission. This agrees with our results of light measurements in the UV regime (see Section 3.5). At present, we do not know the explanation for this different emission behavior which is related to the excitation rates and lifetimes of different electronic states of the He atom. Nevertheless, this data can be used for fitting to results of collision radiative modeling with known time and space dependent electron energy distribution function which is out of the scope of the present article.
In Figure 14, the distribution of the plasma light intensity for hydrogen at P = 1 kPa with the blue [Figure 14a] and red [Figure 14b] filters are presented. One can see that the intense plasma light emission duration is ≤3 ns and its advance does not exceed ~1.5 cm from the Mylar window. The latter agrees with the denser plasma formation in the vicinity of the Mylar window, obtained by the framing and streak imaging of the plasma’s visible light emission.
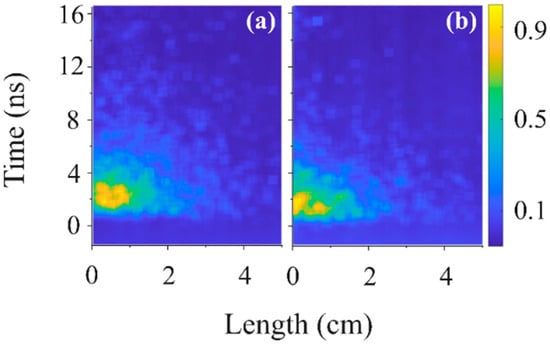
Figure 14.
Normalized light intensity at H2 gas P = 1 kPa at the wavelengths (a) 4070 ± 1040 Å and (b) >6100 Å.
In Figure 15, the temporal and spatial distributions of the Hα (6563 Å) and Hβ (4861 Å) light intensity are shown for hydrogen at P ≈ 1 kPa using corresponding interference (10 nm) filters. The duration of the intense light emitted at Hα, ~2 ns, is shorter than that at Hβ, ~4 ns. Additionally, the longitudinal range of intense emission at Hβ is significantly larger than that for Hα. This also indicates the presence of high-energy electrons in the plasma.
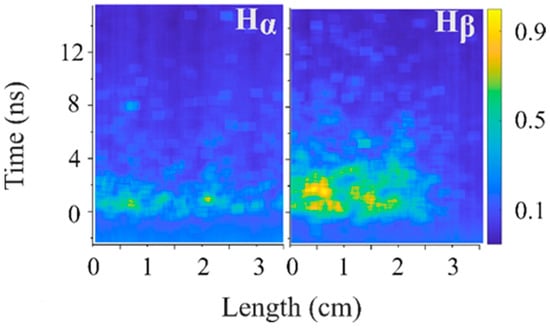
Figure 15.
Normalized light intensity of Hα (6563 Å) and Hβ (4861 Å) spectral lines at hydrogen pressure of 1 kPa. Camera slit width is ~50 μm; temporal resolution is ~0.7 ns.
In Figure 16, the temporal and spatial distributions of the plasma light intensity along the length of the slit are shown at high pressures (>50 kPa) of air, He, and H2. Here, the plasma light reaches ~3.5 cm and the emitted light front velocity is almost equal to the group velocity of the propagating HPM pulse Vgr = 1.7 × 10⁸ m/s. The duration of the plasma light emission for He is >8 ns and for air, and H2 plasmas it is <2 ns. In Figure 17, streak images are shown for the same conditions as in Figure 16 for He but with band filters. Again, one can see that the duration of light emission at wavelengths <5000 Å is ~8 ns, while with the >5000 Å filter, it is only ~1 ns.
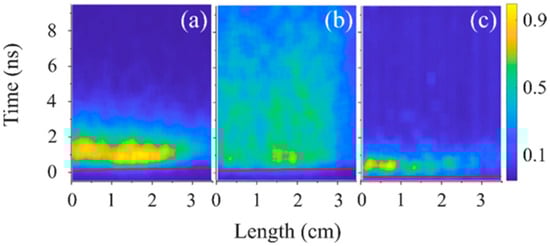
Figure 16.
Normalized light intensity of plasma light emission: (a) air, P = 50 kPa; (b) He, P = 90 kPa; and (c) H2, P = 90 kPa.
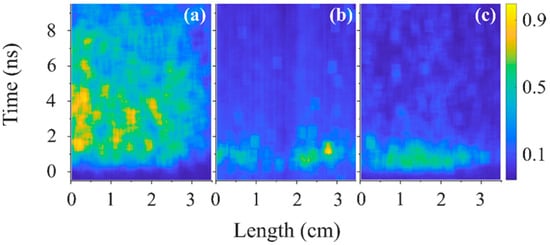
Figure 17.
Normalized light intensity at He, P = 90 kPa at the wavelengths (a) 3300 ± 1400 Å, (b) 5000 ± 100 Å, and (c) >6100 Å.
At high pressures, P > 90 kPa, the reflection coefficient is ~0.2 for air and He and 0.45 for H2 (see Figure 2). This means that the plasma density reaches its critical value, ncr, close to the end of the microwave pulse [τpulse ~0.8 ns (FWHM)]. The critical plasma density for collisional plasma is given as [7]
where [17] νc > 2 × 10¹¹ s−1 is the electron-neutral collision frequency. Thus, the ionization rate can be estimated as
where ~108 cm−3 is the seed electron density [26,28], gas density is ng ~1019 cm−3, and the electron energy is assumed to be ~70 eV.
The data presented in Figure 9, Figure 10, Figure 11, Figure 12, Figure 13, Figure 14, Figure 15, Figure 16 and Figure 17 can be considered as a benchmark for comparisons with collisional radiative modeling of the plasma formation by such HPM pulses.
The temporal and spatial evolution of the light emission data associated with plasma formation along vacuum/gas interface insulators is very important to the extraction of HPM pulses from microwave vacuum devices. In Figure 18, the temporal evolution of the radial distribution of the plasma light emission close to the input Mylar window is shown at different pressures for air, He, and H2. The time delay of the beginning of the resolvable plasma light emission relative to the HPM pulse decreases with an increase in the pressure. For example, for air and P = 0.16 kPa, the time delay is ~4 ns, and at P = 0.27 kPa, light emission starts together with the HPM pulse crossing the input window. For example, in Figure 6, at high pressures (~90 kPa), the plasma emission is strongest near the waveguide center where the largest value of the electric field exists. At lower pressures (<2 kPa), the light emission is almost radially uniform, which is consistent with uniform plasma formation due to fast electron avalanching and diffusion.
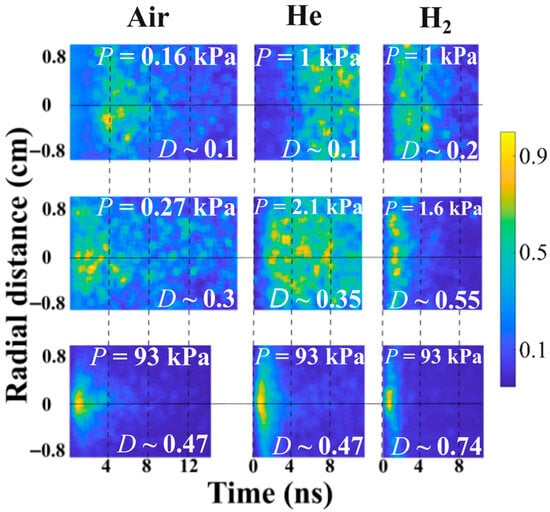
Figure 18.
Time evolution of the radial distribution of the normalized light intensity at different pressures of air, He, and H2.
For high pressures of 93 kPa, a plasma front can be seen and the velocity of plasma expansion over the Mylar window was calculated from the streak camera images as follows: for air, (1.3 ± 0.2) × 107 m/s; for He, (2.3 ± 0.5) × 107 m/s; and for H2, (1.9 ± 0.3) × 107 m/s. This flashover plasma covers the window surface within ≤1 ns. However, this plasma does not affect the HPM pulse propagation. Indeed, thermal expansion of this plasma in the axial direction during 1 ns cannot be considered larger than 10 µm. This thickness of the plasma, even though its density is ~1016 cm−3 and its temperature is of few eV, is less than a skin layer. For lower pressures, the plasma front is not resolvable because either ionization on the window happens too fast, or, simultaneously, at more than one location.
The oscillatory energy of an electron εosc can be estimated as [7]
where ω is the circular frequency of the microwave. The distribution of oscillatory energy and ionization rate at He pressure of P ~ 0.5 kPa over the waveguide for the TM01 waveguide mode for a power of ~300 MW is shown in Figure 19a for ω = 6 × 10¹⁰ rad/s >> νc ≈ 109 s−1. The total electric field radial distribution in shown in Figure 19b. One can see that the ionization rate near the waveguide wall is almost twice as large as in the center. This is in good agreement with the experiment (see Figure 7a,b and Figure 8), where the plasma light emission is most intense near the waveguide wall.
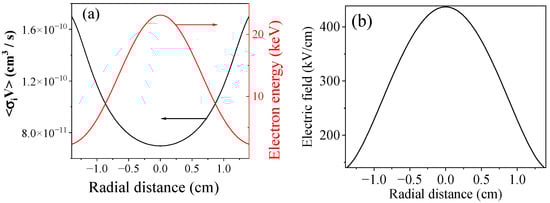
Figure 19.
(a) Radial distribution of electron oscillatory energy and ionization rate; (b) electric field distribution of TM01 waveguide mode at the power of ~300 MW.
For a vacuum of ~10−2 Pa, there was not enough light emission to determine whether there is a front of the flashover plasma. Although, using 10 ns/mm sweep speed (i.e., 0.144 ns/pix resolution) and averaging three images, we can see in Figure 20 that flashover does occur on the Mylar window. The main light emission lasts for ~25 ns and weak light emission persists for up to ~80 ns (for optimal resolution this image was averaged over 20 × 20 pixels which corresponds 538 µm × 2.88 ns).
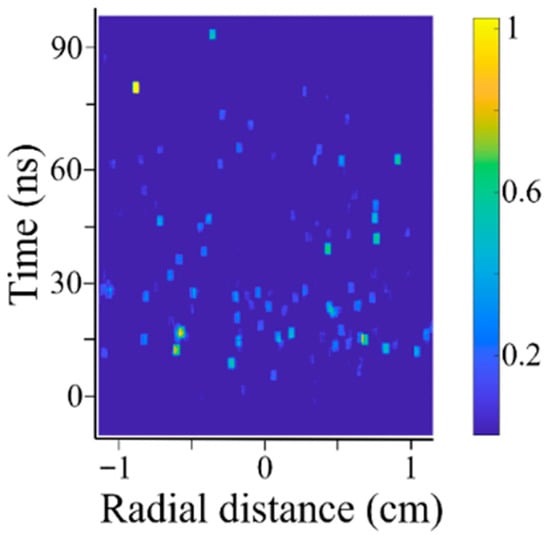
Figure 20.
Normalized radial light emission distribution for a vacuum of ~10−5 kPa; HPM transmission coefficient ~1.
3.5. UV Plasma Light Emission for He and H2
In our earlier studies, we obtained high-energy (up to 100 keV) electrons because of HPM interaction and ionization of the gas [26]. Thus, it was intriguing for us to search for UV emission from the plasma resulting from high energy (10–100 eV) electron impact excitation of neutrals. Thus, based on this knowledge, we performed plasma light intensity measurements in the UV spectral range (115–200 nm) for He and H2 gases in a wide range of pressures, using a Hamamatsu R1081 UV PMT, as described in Section 2. The PMT sensitivity allows to detect photons with energy in the range 6.2–10.78 eV. Here, let us note that we measured the absorption coefficient for H2 [see Figure 2b] in the pressure range 0.1–100 kPa. For the pressure range 0.1–1 kPa, this coefficient changes drastically from 0 to 0.6. Further increase in pressure up to 100 kPa leads to gradual increase in this coefficient up to 0.7. Thus, for the measurement of plasma UV light intensity at high pressures we choose only single pressure P ~ 90 kPa, where the absorption coefficient is maximal, ~0.7.
In Figure 21a, one can see that UV emission for H2 at P = 1 kPa continues up to 70 ns after the HPM pulse has left, much longer than visible emission the intensity of which becomes negligibly small after ~20 ns. This strongly indicates the existence of long living high-energy electrons in the plasma. In Figure 21b we present UV emission intensities for H2 obtained at different pressures. Here, the light intensity is normalized to the maximum intensity obtained at P = 1 kPa. One can see that an increase in pressure from 0.28 kPa up to 1 kPa leads to an increase in intensity and decrease in the time delay of the appearance of detectable emission. Further increase in pressure leads to a decrease in the intensity of UV radiation which starts after the HPM pulse has left.
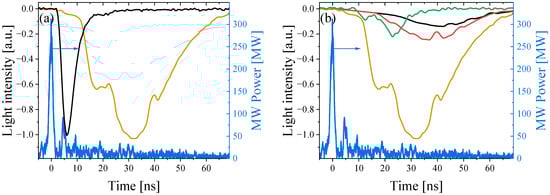
Figure 21.
(a) The power of the HPM (blue), visible (black), and UV (brown) emission for H2, at P = 1 kPa. (b) The power of the HPM (blue) and waveforms of UV emission for different H2 pressures: P = 0.28 kPa (black), P = 0.53 kPa (red), P = 1 kPa (brown), and P = 93 kPa (green).
The microwave coupler #1 (see Figure 1) measures the incident HPM pulse and the reflected microwaves from the plasma generated by the pulse itself. When the leading front of the HMP produces plasma of critical density (~1012 cm3), then the tail of the pulse is reflected backward. This reflected pulse is detected by coupler #1 at a later time from when the incident pulse crossed this coupler (see Figure 21).
For He, we performed similar measurements, and in Figure 22a, one can see the UV plasma light measurement for P = 2.1 kPa compared with the time evolution of the visible light intensity. Again, one observes much longer UV radiation than the duration of visible light emission. In Figure 22b, we present UV plasma light emission of He in a range of pressures 1–93 kPa. The light intensity and its duration decrease with increasing pressure but even for 93 kPa the duration is up to 100 ns.
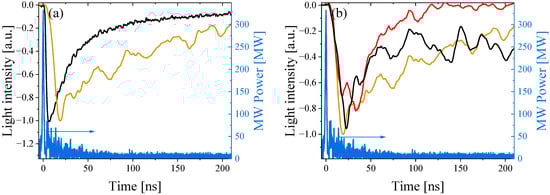
Figure 22.
(a) The power of the HPM (blue), visible (black), and UV (brown) emission for He at P = 2.1 kPa. (b) Waveforms of UV emissions obtained for He at different pressures: P = 1 kPa (black), P = 2.1 kPa (brown), and P = 93 kPa (red).
The reason for the long duration of the UV emission is not clear yet and requires collisional radiative modeling with the known energy spectrum of electrons, which is out of the frame of the present study. Nevertheless, we can suggest the following qualitative explanation based on the results of our earlier research [26,47]. In these studies, we registered electrons emitted from the plasma generated by HPM pulse, with energy up to 100 keV [26]. These electrons escape from the plasma to the waveguide wall, forming a positive potential well of ~8 kV due to uncompensated ion charge. Then, the remaining electrons in the plasma oscillate in this potential well and continue to ionize and excite the gas atoms [47]. Additionally, notice that the visible plasma light intensity also continues for several tens of nanoseconds [see Figure 21a] but with significantly smaller intensity.
3.6. Summary and Conclusions
The main novel results and conclusions presented in this section can be summarized as follows:
- For all studied gases, the most intense light emission was obtained at a distance < 3 cm from the Mylar input window. This is in agreement with framing images of the light emission presented in Section 3.2 and indicates dense plasma formation at this location. We explain this observation by gas ionization by electrons emitted and accelerated from the flashover plasma towards the positively charged plasma formed by gas ionization by HPM pulse.
- For all studied gases, the intensity of the plasma light emission increases significantly after the HPM pulse has left the observation region which agrees with the data presented in Section 3.2. This continuous gas ionization is explained by high-energy electrons which are held by positively charged plasma.
- The duration of the He plasma light intensity at P = 2 kPa is ~16 ns [Figure 10d] and the detectable light emission starts ≤ 2 ns after the HPM pulse crosses the input window. The duration of the light emission at λ > 6100 Å is ~6 ns [Figure 13c] and increases to ~14 ns at λ < 4700 Å [Figure 13a]. This result can be used for comparisons with results of radiation collisional modeling in future research.
- For hydrogen plasma, at P ≈ 1 kPa, the duration of the light emission is >4 ns [Figure 11d] and at P ≈ 0.28 kPa [Figure 11a], the duration is up to 30 ns. This can be related to the quenching of exited states of hydrogen atoms by molecules observed in our previous experiments [26,56]. Additionally, at P ≈ 1 kPa, the duration of the intense light emitted at Hα, ~2 ns, is shorter than that at Hβ, ~4 ns (see Figure 15), which also indicates the presence of high-energy electrons in the plasma.
- At the higher-pressure of P ≈ 90 kPa (see Figure 16), the plasma light emission also starts < 1 ns after HPM crosses the input window. At this pressure, the plasma light emission is stronger on axis than at the waveguide periphery. On the axis, the plasma light forms earlier than at the periphery (see Figure 18). This can be explained by different ionization rates at the center and the periphery. The oscillatory energy of electrons can vary over the radius in the range from ionization threshold ~24 eV at the periphery and up to ~100 eV at the center, where the cross-section of ionization is maximal [14].
- The obtained temporal and spatial evolution of the light emission from the flashover plasma could be of great importance for the extraction of such HPM pulses from microwave vacuum devices.
- There is intense UV radiation from the plasma formed by the HPM pulse. The duration of this radiation is several tens of ns, which is a strong indication of the existence of long-living energetic electrons in the plasma.
4. Conclusions
In this paper, we report for the first time the temporal and spatial evolution of the light intensity of the plasma produced by a propagating ultra-short and extremely powerful microwave pulse in a gas-filled waveguide at different pressures and gases. It was found that the intensity of the plasma light emission increases significantly after the HPM pulse has left the observation region. This is related to the formation of a positively charged plasma due to the escape of a part of the electrons to the walls while affected by the pondermotive force of HPM pulse. High-energy electrons left in the plasma continue gas ionization after the HPM pulse has left. Depending on pressure, the plasma forms either along the entire observed length, while the front of the emitted light follows the microwave pulse along the waveguide at a velocity close to the group velocity of the pulse, or remains near the microwave input region along a distance of ~3 cm. This indicates that above critical density plasma forms within the timeframe of the pulse which leads to strong HPM reflections.
It was also found that the radial distribution of plasma light emission depends on pressure. When ω >> νc, corresponding to P < 10 kPa, and when the electron oscillatory energy reaches 20 keV close to the axis, light emission forms faster near the waveguide walls, where the ionization rate is maximal. Otherwise, when ω << νc which corresponds to P > 80 kPa, light emission is most intense on axis where the electron oscillatory energy is ~100 eV and the ionization rate is maximal leading to denser plasma formation.
Intense UV radiation from the plasma, lasting considerably longer than the duration of visible emission was observed. At present, we do not have a precise explanation for this long duration of UV radiation. We suggest that this indicates the existence of energetic electrons over tens of ns after the HPM pulse has left the observation region.
The evolution of the light emitted by the surface flashover plasma of the Mylar input window was also observed. The dense plasma formation in the vicinity of the window can be explained by additional gas ionization. The latter occurs by the electrons which are emitted from the flashover plasma and are accelerated into the positively charged plasma formed by the HPM pulse as it propagates and causes additional gas ionization.
The observed spatial and temporal distribution of light emission from the plasma produced by ionization of different gases at different pressures can be considered as benchmarks for comparison with numerical simulations of gas ionization by such powerful and short-duration HPM pulses. From the practical point of view, one can consider that these results can be useful in research where such HPM pulses will be applied for plasma generation in different plasma-chemistry applications. Additionally, these results can be used in applications such as high-power microwave compressors and high-voltage gas switches.
Author Contributions
Conceptualization, V.M., A.H. and Y.E.K.; methodology, V.M. and A.H.; formal analysis, V.M. and A.H.; investigation, V.M., A.H. and R.G.; resources, A.K. and Y.E.K.; data curation, V.M. and A.H.; writing—original draft preparation, Y.E.K., V.M. and A.H.; writing—review and editing, J.G.L. and A.K.; visualization, V.M. and A.H.; supervision, Y.E.K.; project administration, V.M., A.H. and R.G.; funding acquisition, Y.E.K. and E.M. All authors have read and agreed to the published version of the manuscript.
Funding
This study was supported by the PAZY Foundation Grant No. 2032056.
Institutional Review Board Statement
Not Applicable.
Informed Consent Statement
Not Applicable.
Data Availability Statement
Data can be obtained from the corresponding author.
Acknowledgments
The authors are grateful to Yu. Bliokh for fruitful discussions and critical comments and V. Akhmetzianov for substantial technical support. This study was supported by the PAZY Foundation Grant No. 2032056.
Conflicts of Interest
The authors declare no conflicts of interest.
References
- Herlin, M.A.; Brown, S.C. Breakdown of a Gas at Microwave Frequencies. Phys. Rev. 1948, 74, 291. [Google Scholar] [CrossRef]
- Felsenthal, P. Nanosecond-pulse microwave breakdown in air. J. Appl. Phys. 1966, 37, 4557–4560. [Google Scholar] [CrossRef]
- Felsenthal, P.; Proud, J.M. Nanosecond-pulse breakdown in gases. Phys. Rev. 1956, 139, 1796. [Google Scholar] [CrossRef]
- Leopold, J.G.; Percival, I.C. Microwave Ionization and Excitation of Rydberg Atoms. Phys. Rev. Lett. 1978, 41, 944. [Google Scholar] [CrossRef]
- Litvak, A.G. Strong Microwaves in Plasmas; Institute of Applied Physics: Jena, Duitsland, 1991. [Google Scholar]
- Stix, T.H. Waves in Plasmas; American Institute of Physics: New York, NY, USA, 1992. [Google Scholar]
- Raizer, Y.P. Gas Discharge Physics; Springer: Berlin/Heidelberg, Germany, 1991. [Google Scholar]
- Piel, A. Plasma Physics: An Introduction to Laboratory, Space, and Fusion Plasmas; Springer: Berlin/Heidelberg, Germany, 2010. [Google Scholar] [CrossRef]
- Llewellyn Jones, F. Ionization and Breakdown in Gases; Methuen Publishing: London, UK, 1957. [Google Scholar]
- Macdonald, A.D.; Gaskzll, D.U.; Grrrznman, H.N. Microwave Breakdown in Air, Oxygen, and Nitrogen*. Phys. Rev. 1963, 130, 1841. [Google Scholar] [CrossRef]
- Mesyats, G.A. Similarity laws for pulsed gas discharge. Physics-Uspekhi 2006, 49, 1045. [Google Scholar] [CrossRef]
- Bollen, W.M.; Yee, C.L.; Ali, A.W.; Nagurney, M.J.; Read, M.E. High-power microwave energy coupling to nitrogen during breakdown. J. Appl. Phys. 1983, 54, 101–106. [Google Scholar] [CrossRef]
- Liu, G.; Liu, J.; Huang, W.; Zhou, J.; Song, X.; Ning, H. A Study of High Power Microwave Air Breakdown. Chin. Phys. 2000, 9, 757. [Google Scholar] [CrossRef]
- Ecker, G. Springer Series on Elementary Processes in Hydrogen-Helium Plasmas; Springer: Berlin/Heidelberg, Germany, 1987. [Google Scholar]
- Rusanov, V.D.; Fridman, A.A.; Sholin, G.V. The physics of a chemically active plasma with nonequilibrium vibrational excitation of molecules. Sov. Phys. Uspekhi 1981, 24, 447–474. [Google Scholar] [CrossRef]
- Mesyats, G.A.; Yalandin, M.I. High-power picosecond electronics. Physics-Uspekhi 2005, 48, 211–229. [Google Scholar] [CrossRef]
- Barker, R.J.; Barker, R.J. Modern Microwave and Millimeter-Wave Power Electronics; IEEE Press: Hoboken, NJ, USA, 2005. [Google Scholar] [CrossRef]
- Sullivan, C.A.; Destler, W.W.; Rodgers, J.; Segalov, Z. Short-pulse high-power microwave propagation in the atmosphere. J. Appl. Phys. 1988, 63, 5228–5232. [Google Scholar] [CrossRef]
- Vikharev, A.L.; Ivanov, O.A.; Litvak, A.G. Nonequilibrium Plasma Produced by Microwave Nanosecond Radiation: Parameters, Kinetics, and Practical Applications. IEEE Trans. Plasma Sci. 1996, 24, 460. [Google Scholar] [CrossRef]
- Shlapakovski, A.S.; Beilin, L.; Hadas, Y.; Schamiloglu, E.; Krasik, Y.E. Self-consistent evolution of plasma discharge and electromagnetic fields in a microwave pulse compressor. Phys. Plasmas 2015, 22, 073111. [Google Scholar] [CrossRef]
- Eltchaninov, A.A.; Korovin, S.D.; Mesyats, G.A.; Pegel, I.V.; Rostov, V.V.; Shpak, V.G.; Yalandin, M.I. Review of studies of superradiative microwave generation in X band and Ka band relativistic BWOs. IEEE Trans. Plasma Sci. 2004, 32, 1093–1099. [Google Scholar] [CrossRef]
- Yalandin, M.I.; Reutova, A.G.; Sharypov, K.A.; Shpak, V.G.; Shunailov, S.A.; Ul’masculov, M.R.; Mesyats, G.A. Microwave breakdown of air by nanosecond and subnanosecond Ka-Band pulses. IEEE Trans. Plasma Sci. 2010, 38, 1398–1402. [Google Scholar] [CrossRef]
- Rukin, S.N. Pulsed power technology based on semiconductor opening switches: A review. Rev. Sci. Instrum. 2020, 91, 011501. [Google Scholar] [CrossRef]
- Yalandin, M.I.; Shpak, V.G.; Shunailov, S.A.; Oulmaskoulov, M.R.; Ginzburg, N.S.; Zotova, I.V.; Novozhilova, Y.V.; Sergeev, A.S.; Phelps, A.D.R.; Cross, A.W.; et al. Generation of Powerful Subnanosecond Microwave Pulses in the Range of 38–150 GHz. IEEE Trans. Plasma Sci. 2000, 28, 1615. [Google Scholar] [CrossRef]
- Cao, Y.; Bliokh, Y.P.; Leopold, J.G.; Krasik, Y.E. Wakes and Other Non-linear Effects Observed When Ultra-Short Ultra-High-Power Microwave Pulses Interact with Neutral Gas and Plasma. In Springer Series in Plasma Science and Technology; Springer Nature: Berlin/Heidelberg, Germany, 2023; pp. 217–268. [Google Scholar] [CrossRef]
- Maksimov, V.; Haim, A.; Kostinskiy, A.; Cao, Y.; Leopold, J.G.; Krasik, Y.E. Helium and hydrogen gas ionization by a sub-nanosecond high-power microwave pulse. Phys. Plasmas 2025, 32, 053303. [Google Scholar] [CrossRef]
- Tarasenko, V. Runaway electrons in diffuse gas discharges. Plasma Sources Sci. Technol. 2020, 29, 034001. [Google Scholar] [CrossRef]
- Maksimov, V.; Cao, Y.; Haim, A.; Asmedianov, N.; Kostinskiy, A.; Leopold, J.G.; Krasik, Y.E. Studies of gas ionization by high-power, sub-nanosecond microwave pulses. Phys. Plasmas 2024, 31, 122109. [Google Scholar] [CrossRef]
- Chang, C.; Zhu, M.; Verboncoeur, J.; Li, S.; Xie, J.; Yan, K.; Luo, T.; Zhu, X. Enhanced window breakdown dynamics in a nanosecond microwave tail pulse. Appl. Phys. Lett. 2014, 104, 253504. [Google Scholar] [CrossRef]
- Chang, C.; Liu, G.; Tang, C.; Chen, C.; Qiu, S.; Fang, J.; Hou, Q. The influence of desorption gas to high power microwave window multipactor. Phys. Plasmas 2008, 15, 093508. [Google Scholar] [CrossRef]
- Chang, C.; Liu, G.; Tang, C.; Chen, C.; Fang, J. Review of recent theories and experiments for improving high-power microwave window breakdown thresholds. Phys. Plasmas 2011, 18, 055702. [Google Scholar] [CrossRef]
- Chang, C.; Verboncoeur, J.; Guo, M.N.; Zhu, M.; Song, W.; Li, S.; Chen, C.H.; Bai, X.C.; Xie, J.L. Ultrafast high-power microwave window breakdown: Nonlinear and postpulse effects. Phys. Rev. E 2014, 90, 063107. [Google Scholar] [CrossRef] [PubMed]
- Neuber, A.A.; Edmiston, G.F.; Krile, J.T.; Krompholz, H.; Dickens, J.C.; Kristiansen, M. Interface breakdown during high-power microwave transmission. IEEE Trans. Magn. 2007, 43, 496–500. [Google Scholar] [CrossRef]
- Cao, Y.; Bliokh, Y.P.; Maksimov, V.; Leopold, J.G.; Krasik, Y.E. Frequency conversion, ‘superluminal’ propagation, and compression of a powerful microwave pulse in propagating ionization front. Phys. Rev. E 2023, 107, 045203. [Google Scholar] [CrossRef]
- Benford, J.; Benford, G. Survey of Pulse Shortening in High-Power Microwave Sources. IEEE Trans. Plasma Sci. 1997, 25, 311. [Google Scholar] [CrossRef]
- Lin, S.; Beeson, S.; Liu, C.; Dickens, J.; Neuber, A. Self-induced gaseous plasma as high power microwave opening switch medium. Phys. Plasmas 2015, 22, 043509. [Google Scholar] [CrossRef]
- Brizhinev, M.P.; Vikharev, A.L.; Golubyatnikov, G.Y.; Eremin, B.G.; Ivanov, A.; Litvak, A.G.; Lirin, S.F.; Plotnikov, I.V.; Soluyanov, E.I.; Sernenov, V.E.; et al. Ionization of a Low-Pressure Gas in a Very Intense Microwave Field. JETP 1990, 71, 434–445. [Google Scholar]
- Hidaka, Y.; Choi, E.M.; Mastovsky, I.; Shapiro, M.A.; Sirigiri, J.R.; Temkin, R.J. Observation of Large Arrays of Plasma Filaments in Air Breakdown by 1.5-MW 110-GHz Gyrotron PulsesPhys. Rev. Lett. 2008, 100, 035003. [Google Scholar] [CrossRef]
- Hidaka, Y.; Choi, E.M.; Mastovsky, I.; Shapiro, M.A.; Sirigiri, J.R.; Temkin, R.J.; Edmiston, G.F.; Neuber, A.A.; Oda, Y. Plasma structures observed in gas breakdown using a 1.5 MW, 110 GHz pulsed gyrotron. Phys. Plasmas 2009, 16, 055702. [Google Scholar] [CrossRef]
- Batanov, M.; Ivanov, V.A.; Konyzhev, M.E.; Ravaev, A.A.; Selesnev, V.D.; Khomenko, A.I. Generation of high potentials in the plasma by the interaction with intense microwave radiation. In Proceedings of the International Workshop on “Strong Microwaves Plasmas”, Suzdal, Russia, 18–23 September 1990; Volume 2, pp. 553–558. [Google Scholar]
- Wilks, S.C.; Dawson, J.M.; Mori, W.B. Frequency Up-Conversion of Electromagnetic Radiation with Use of an Overdense Plasma. Phys. Rev. Lett. 1988, 61, 337–341. [Google Scholar] [CrossRef]
- Gildenburg, V.B.; Kim, A.V.; Krupnov, V.A.; Semenov, V.E.; Sergeev, A.M.; Zharova, N.A. Adiabatic Frequency Up-Conversion of a Powerful Electromagnetic Pulse Producing Gas Ionization. IEEE Trans. Plasma Sci. 1993, 21, 34–44. [Google Scholar] [CrossRef]
- Kuo, S.P. Frequency up-conversion of microwave pulse in a rapidly growing plasma, Frequency Up-Conversion of Microwave Pulse in a Rapidly Growing Plasma. Phys. Rev. Lett. 1990, 65, 1000–1005. [Google Scholar] [CrossRef]
- Bogomolov, Y.L.; Lirin, S.F.; Semenov, V.E.; Sergeev, A.M. Ionization self-channeling of extremely intense electromagnetic waves in a plasma. JETP Lett. 1987, 45, 532. [Google Scholar]
- Shafir, G.; Krasik, Y.E.; Bliokh, Y.P.; Levko, D.; Cao, Y.; Leopold, J.G.; Gad, R.; Bernshtam, V.; Fisher, A. Ionization-Induced Self-Channeling of an Ultrahigh-Power Subnanosecond Microwave Beam in a Neutral Gas. Phys. Rev. Lett. 2018, 120, 135003. [Google Scholar] [CrossRef] [PubMed]
- Cao, Y.; Leopold, J.G.; Bliokh, Y.P.; Leibovitch, G.; Krasik, Y.E. Nonlinear absorption of high-power microwave pulses in a plasma filled waveguide. Phys. Plasmas 2021, 28, 062307. [Google Scholar] [CrossRef]
- Bliokh, Y.; Maksimov, V.; Haim, A.; Kostinskiy, A.; Leopold, J.G.; Krasik, Y.E. Evolution of the electron distribution function during gas ionization by a sub-nanosecond microwave pulse of hundreds MW power. Phys. Plasmas 2025, 32, 012108. [Google Scholar] [CrossRef]
- Bliokh, Y.; Cao, Y.; Maksimov, V.; Haim, A.; Leopold, J.G.; Kostinsky, A.; Krasik, Y.E. Stationary striations in plasma, created by a short microwave pulse in a waveguide filled with a neutral gas. Phys. Rev. E 2024, 109, 025208. [Google Scholar] [CrossRef]
- Gold, S.H.; Nusinovich, G.S. Review of high-power microwave source research. Rev. Sci. Instrum. 1997, 68, 3945–3974. [Google Scholar] [CrossRef]
- Miller, R.B. An introduction to the physics of intense charged particle beams. Albuq. New Mex. 1984, 6, 306–308. [Google Scholar] [CrossRef]
- Chen, J.; Lovelave, R.V. Beam generation in foil-less diodes. Phys. Fluids 1978, 21, 1623–1633. [Google Scholar] [CrossRef]
- Shafir, G.; Kreif, M.; Gleizer, J.Z.; Gleizer, S.; Krasik, Y.E.; Gunin, A.V.; Kutenkov, O.P.; Pegel, I.V.; Rostov, V.V. Experimental research of different plasma cathodes for generation of high-current electron beams. J. Appl. Phys. 2015, 118, 193302. [Google Scholar] [CrossRef]
- Earley, L.M.; Ballard, W.P. New Directional Couplers for Multimode Circular Waveguides Applied to Intense Pulsed Microwave Systems. IEEE Trans. Nucl. Sci. 1985, 32, 2921. [Google Scholar] [CrossRef]
- Cao, Y.; Sun, J.; Zhang, Y.; Song, Z.; Wu, P.; Fan, Z.; Teng, Y.; He, T.; Chen, C. RF Breakdown of the Resonant Reflector in a Relativistic Backward Wave Oscillator. IEEE Trans. Plasma Sci. 2018, 46, 900–908. [Google Scholar] [CrossRef]
- Neuber, A.A.; Laurent, L.; Lau, Y.Y.; Krompholz, H.C. 10 Windows and RF Breakdown. In High-Power Microwave Sources and Technologies; Wiley-IEEE Press: Piscataway, NJ, USA, 2001; pp. 325–375. [Google Scholar]
- Bittner, J.; Kohse-Hginghaus, I.L.; Meier, U.; Just, T. Quenching of Two-Photon-Excited H(3s, 3d) and O(3p 3P2,1,0) Atoms by Rare Gases and Small Molecules. Chem. Phys. Lett. 1988, 143, 571–576. [Google Scholar] [CrossRef]
- Berger, M.J.; Coursey, J.S.; Zucker, M.A.; Chang, J. Stopping-Power & Range Tables for Electrons, Protons, and Helium Ions. NIST Stand. Ref. Database 2017, 124, 4999. [Google Scholar]
Disclaimer/Publisher’s Note: The statements, opinions and data contained in all publications are solely those of the individual author(s) and contributor(s) and not of MDPI and/or the editor(s). MDPI and/or the editor(s) disclaim responsibility for any injury to people or property resulting from any ideas, methods, instructions or products referred to in the content. |
© 2025 by the authors. Licensee MDPI, Basel, Switzerland. This article is an open access article distributed under the terms and conditions of the Creative Commons Attribution (CC BY) license (https://creativecommons.org/licenses/by/4.0/).