Article

Non-Thermal Plasma-Assisted Synthesis of ZnO for Enhanced Photocatalytic Performance

by
Harshini Mohan
1,
Subash Mohandoss
1,
Natarajan Balasubramaniyan
1 and
Sivachandiran Loganathan
2,*
1
Laboratory of Plasma Chemistry and Physics (LPCP), Department of Chemistry, SRM Institute of Science and Technology, Kattankulathur, Chennai 603203, India
2
Department of Civil and Environmental Engineering, University of Nevada, Reno, NV 89557-0258, USA
*
Author to whom correspondence should be addressed.
Plasma 2025, 8(2), 25; https://doi.org/10.3390/plasma8020025
Submission received: 2 April 2025 / Revised: 11 June 2025 / Accepted: 16 June 2025 / Published: 18 June 2025
(This article belongs to the Special Issue Feature Papers in Plasma Sciences 2025)

Abstract

:
Non-thermal plasma (NTP)-assisted material synthesis and surface modification provide a promising approach in various applications, particularly in wastewater treatment. In this study, we reported the synthesis of photocatalytic zinc oxide (ZnO) from zinc hydroxide (Zn(OH)2) utilizing NTP discharge generated by dielectric barrier discharge (DBD). The results demonstrated that the 40 min plasma treatment at 200 °C (ZnO-P) with a voltage of 20 kV significantly improved the material’s physicochemical properties compared to conventional calcination at 600 °C (ZnO-600). ZnO-P exhibited better crystallinity, a significantly reduced particle size of 41 nm, and a narrower band gap of 3.1 eV compared to ZnO-600. Photocatalytic performance was evaluated through crystal violet degradation, where ZnO-P achieved an 60% degradation rate after 90 min of UV exposure, whereas ZnO-600 exhibited only a 50% degradation rate under identical conditions. These findings underscore the effectiveness of NTP synthesis in enhancing the surface properties of ZnO, leading to superior photocatalytic performance.

Graphical Abstract

1. Introduction

The discharge of hazardous wastes, such as pesticides, dyes, and medications into water bodies has serious effects on entire ecosystems. These pollutants pose significant risks to the environment as well as human beings [1]. There is greater emphasis on effective methods to remove or reduce the presence of these pollutants [2]. Numerous researchers have found that non-thermal plasma (NTP), in particular dielectric barrier discharge (DBD), in combination with a catalyst, provides a very efficient and practical approach for surface modification, synthesis, and pollution removal [3].
Plasma, often called the fourth state of matter, is an ionized gas that exhibits a significant temperature difference between electrons, which are much hotter, and ions and neutrals, which remain relatively cool [4]. Various low-temperature plasma [5] and the synergistic effects of reactive plasma species, their nonequilibrium state, and low-temperature operation make NTPs a unique tool for catalyst preparation, enhancing surface reactivity in contact with the plasma [6,7]. Consequently, NTPs offer superior characteristics, allowing for the controlled and efficient production of structures and the induction of surface processes, avoiding the limitations of traditional thermal methods. Similarly, NTP has shown great promise in solving environmental issues, and photocatalysis has proved to be an excellent technique for decomposing organic dyes [8]. This technique uses semiconductor materials as catalysts to degrade organic pollutants under different light sources, resulting in harmless inorganic molecules. Various photocatalysts have been studied, including metal oxides (TiO2, ZnO, SnO2, WO3), metal sulfides (CdS, PbS, ZnS), nitrides (C3N4, GaN), and phosphides (InP, GaP), among others [9].
Among these, zinc oxide (ZnO) has shown promise in photocatalytic activity for pollutant degradation because it has desirable features such as a broad band gap, very high exciton binding energy, non-toxicity, and increased stability [10,11]. While various ZnO synthesis methods (e.g., co-precipitation, hydrothermal, green synthesis) [12] and surface modification techniques (doping, composites) [13] exist, they often suffer from drawbacks like complex preparation, long processing time, and high temperatures. Therefore, NTP offers a promising alternative to traditional synthesis and surface modification methods for ZnO, potentially overcoming many of their limitations. Despite its promising photocatalytic activity, the synthesized ZnO has disadvantages such as fast charge recombination. The recombination nature can be rectified through mechanisms such as surface defect modification, introduction of specific trapping defects, surface cleaning, and even doping. As a result, simpler, quicker, and less costly synthesis approaches are required to improve its performance in practical applications [14].
Therefore, the combination of NTP and a catalyst provides an ecologically friendly and low-cost method for oxidative full dye degradation [15]. For practical application study, degradation experiments were conducted on crystal violet (CV), a synthetic dye that poses severe dangers to humans, the environment, and aquatic life. CV is frequently employed in a variety of sectors owing to its vibrant color [16].
To address this, we report an NTP or cold plasma-assisted synthesis specifically utilizing a dielectric barrier discharge (DBD) reactor, for the synthesis of ZnO. By systematically varying parameters such as voltage, temperature, and plasma exposure duration, we investigated the impact of NTP treatment on ZnO properties. The primary objective of this study was to elucidate how NTP treatment influences the structural, morphological, and optical characteristics of ZnO and, consequently, its photocatalytic activity. We aimed to synthesize ZnO using plasma and to analyze the modifications induced by the plasma process. Also, we compared these results with those obtained through the traditional synthesized method. Furthermore, we explored the photocatalytic activity of the resulting ZnO for efficient and sustainable dye wastewater treatment.

2. Materials and Methods

2.1. Materials

Analytical-grade chemicals were purchased from Sisco Research Laboratory, India, and used without further purification. Zinc oxide (ZnO), zinc nitrate hexahydrate (Zn (NO3)2·6H2O), and sodium hydroxide (NaOH) of analytical reagent (AR) grade with a purity of 98% were used. Distilled (DI) water was used to prepare the solution and for washing the prepared materials.

2.2. Characterization

The X-ray diffraction (XRD) profiles of the catalysts were analyzed using a PANalytical Xpert3 X-ray diffractometer, Almelo, The Netherlands (XRD, 40 kV, 40 mA, Cu-K (1.54 Å) radiation, scan rate of 1°/min and a time of 0.5 s/step). TEM images and particle size were determined through High-Resolution Transmission Electron Microscopy (HR-TEM, JEOL Japan JEM-2100 Plus instrument, Akishima, Tokyo, Japan). The morphology was analyzed using high-resolution scanning electron microscopy (HR-SEM, ThermoFisher Scientific Apreo S instrument, Waltham, MA, USA), and the composition was assessed using energy-dispersive spectroscopy (EDS). Surface elemental composition and the electronic state of surface elements were examined using X-ray Photoelectron Spectroscopy (XPS, PHI Versaprobe III/Physical Electronics systems, Chanhassen, MN, USA). Ultraviolet–visible (UV-Vis) spectrophotometer (SHIMADZU, Kyoto, Japan, UV 3600 PLUS) was employed to measure material absorbance and understand its optical properties. UV irradiation experiment was performed using a mercury vapor lamp (type TUV 16W: Philips, Roosendal, Poland).

2.3. Synthesis of Catalyst

About 0.04 M of Zn (NO3)2·6H2O was dissolved in 100 mL of DI water and homogenized for 25 min at room temperature. To this solution, 3.2 g of NaOH in 30 mL DI water was prepared and the solution was added dropwise and stirred for 3 h. After the precipitation reaction was complete, the solution was allowed to settle for 2 h and then filtered through Whatman filter paper. The precipitate was washed with DI water until the pH of the supernatant solution reached neutral [17]. Afterward, the sample was filtered and dried in an oven at 80 °C overnight. After drying, the sample was labeled as (Zn(OH)2) and divided into two portions for different treatments. First, about 0.5 g of the Zn(OH)2 was subjected to plasma treatment and labeled as (ZnO-P). Second, the portion of the dried sample was calcined at 600 °C (ZnO-600). The resulting samples were ground using a mortar and pestle and were collected in an airtight container at room temperature for subsequent analysis.

2.4. Plasma Synthesis

The Zn(OH)2 underwent plasma treatment with various parameters. Approximately 0.5 g of the Zn(OH)2 was loaded and positioned at the center of a quartz tube. The Zn(OH)2 was packed in a sandwich configuration between layers of quartz wool (QW). The plasma treatment lasted 40 min at a voltage of 20 kV and a flow rate of N2 at 200 mL/min, as the carrier gas (ultra-pure gases (N2, 99.999%, Rana Industrial, Chennai, India)). The total flow rate was fixed at 200 mL/min using calibrated mass flow controllers (MFC, KOFLOC, Nagoya, Japan). Before igniting plasma discharge, the furnace was pre-set at 200 °C and maintained for 40 min. It is worth noting that the furnace was switched off during the plasma treatment to prevent electrical disruptions. The temperature fluctuation before and after plasma treatment was around ±10 °C. The material (ZnO-P) was ground after treatment to allow for further examination.

2.5. Thermal Synthesis
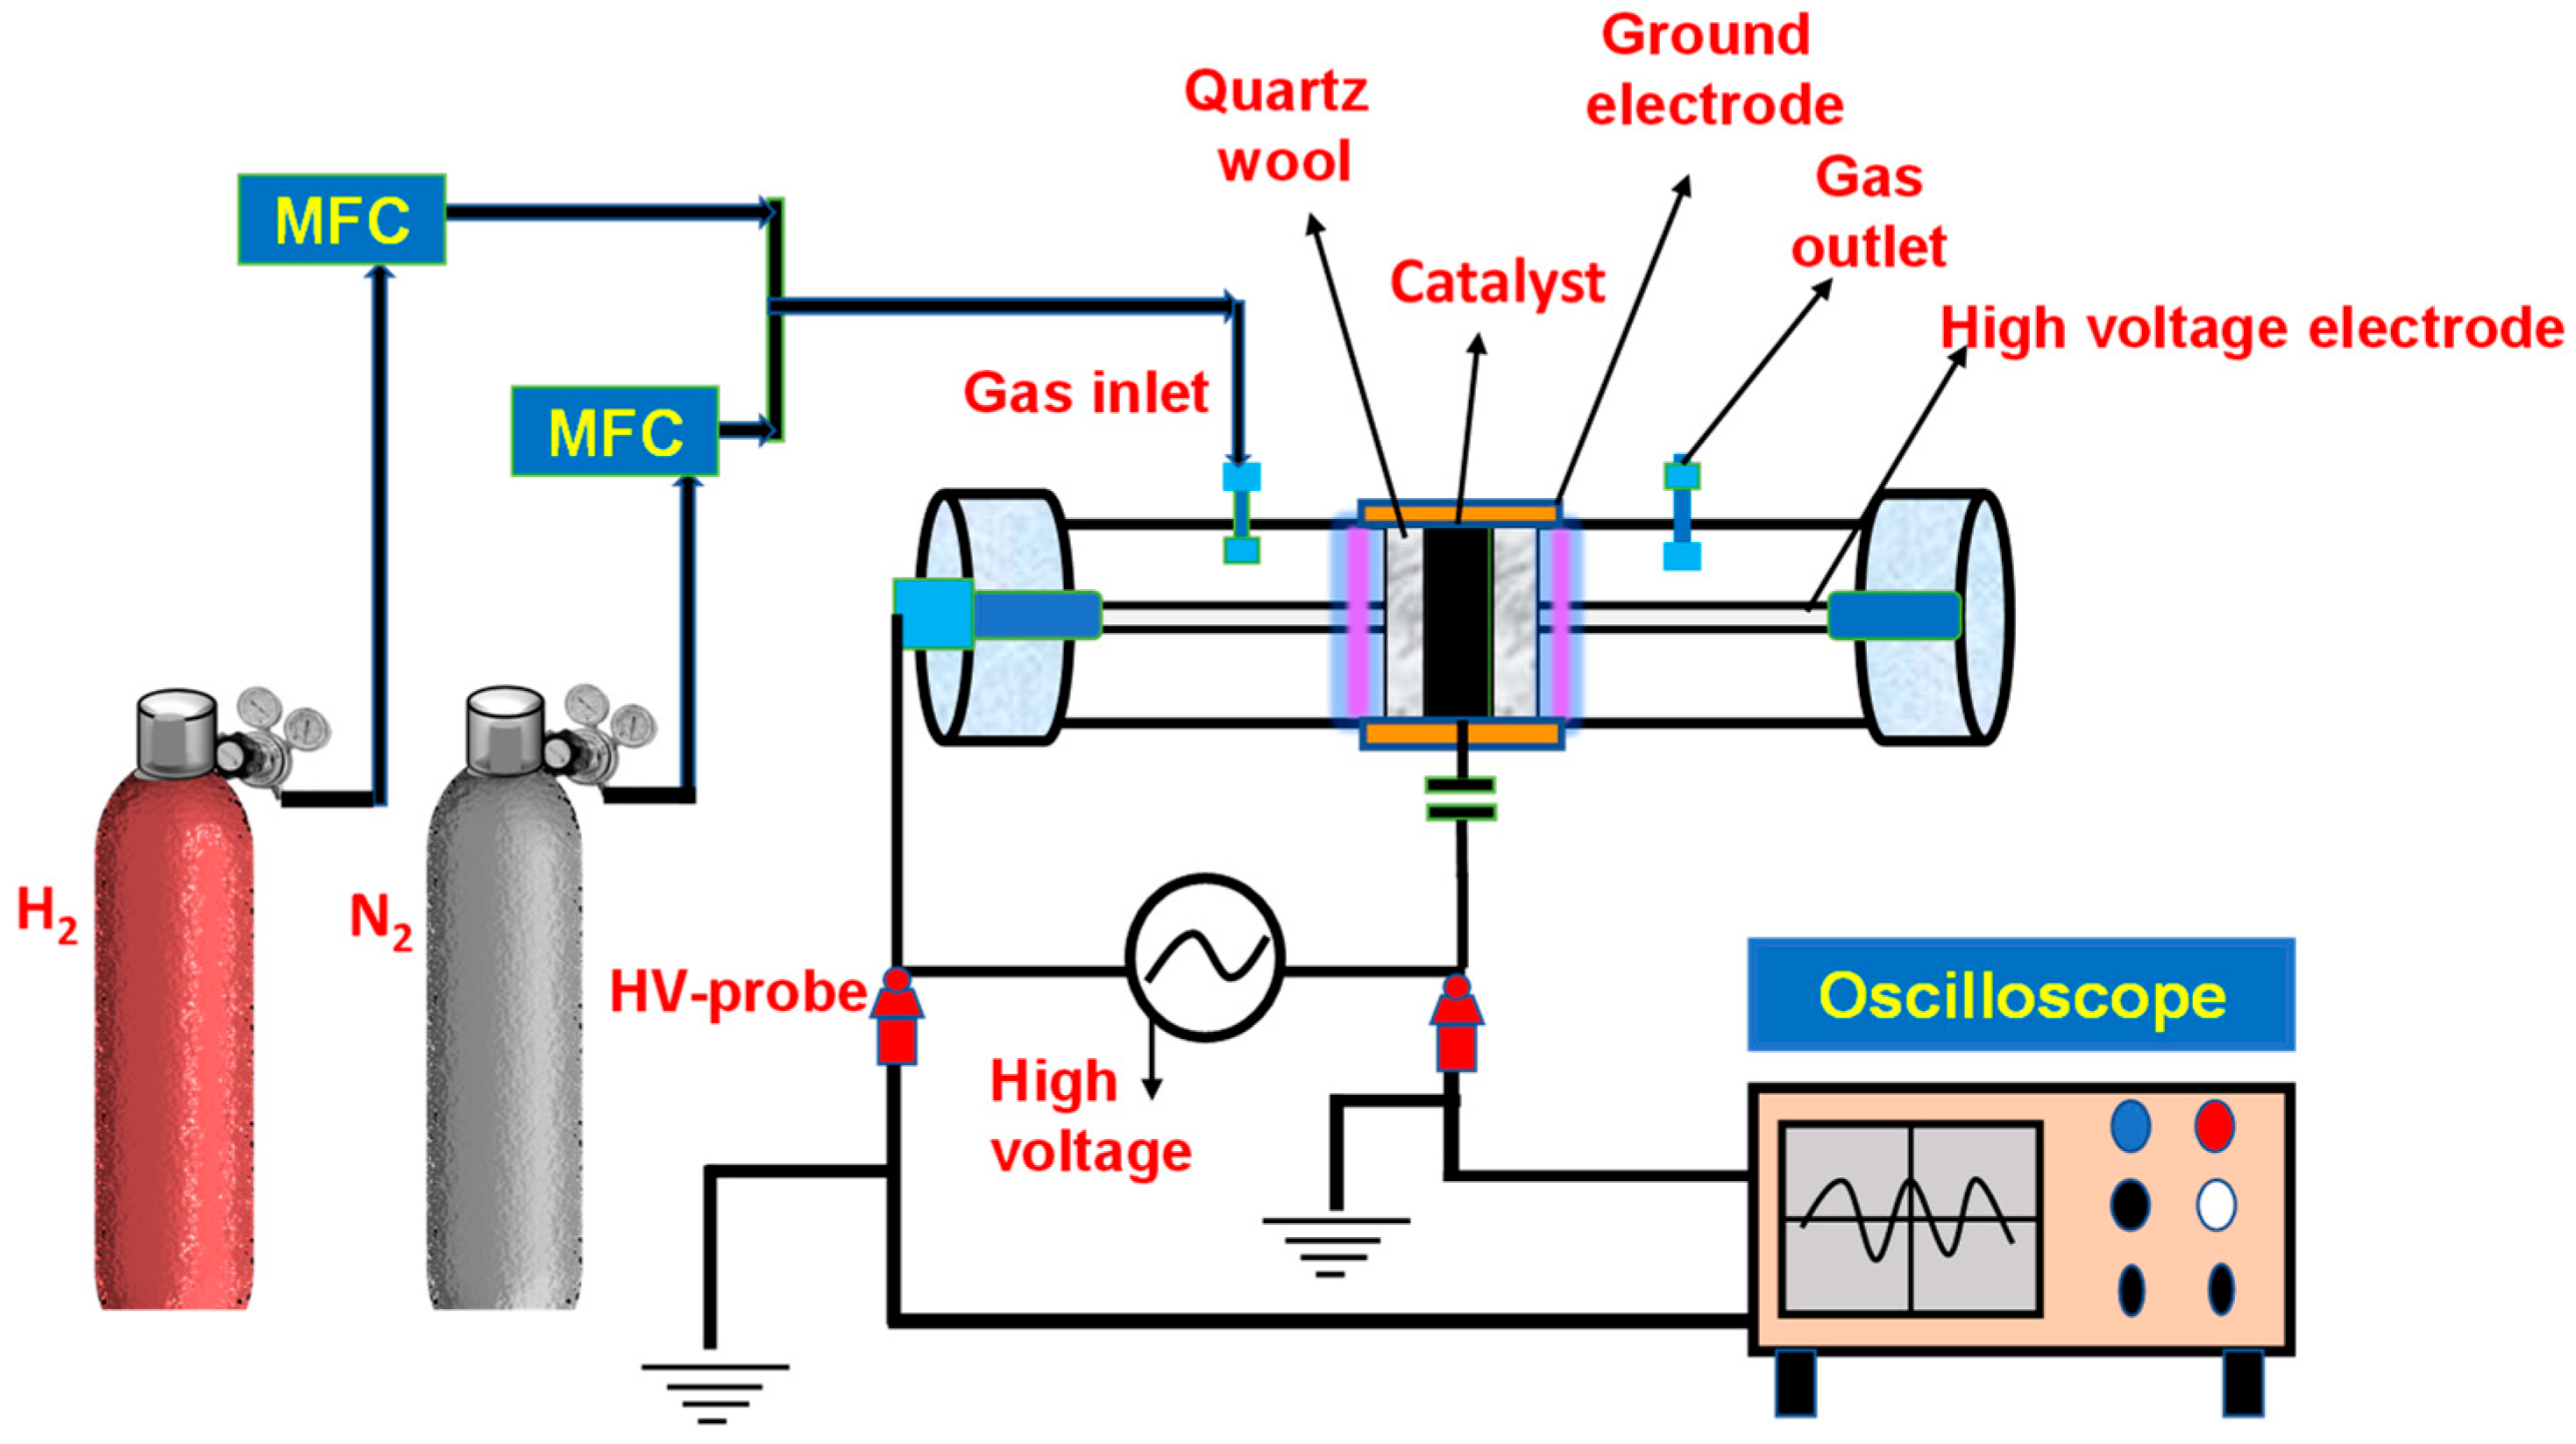
The second part of the dried sample, i.e., Zn(OH)2, underwent a calcination process. It was taken and calcined in the tubular furnace, which is carefully set with a ramp rate of 10 °C/min and maintained at a constant temperature of 600 °C for 5 h [17]. Following this calcination step, the furnace was allowed to cool down, after which the sample was retrieved (ZnO-600) and used for subsequent characterization and analysis.

2.6. Plasma Reactor

All plasma treatments performed in this work were performed using the DBD reactor presented in Figure 1. A detailed description of the quartz tubular reactor and plasma discharge ignition conditions was reported in previous work [4]. A cylindrical quartz reactor consists of a 60 cm length, outer diameter (OD) of 2.5 cm, wall thickness of 0.3 cm, and an inner diameter of 1.9 cm. A high-voltage electrode made of stainless steel with 1.2 cm OD was fixed in the middle of the quartz tube, which led to a 0.35 cm discharge gap. The discharge length was fixed at 10 cm by wrapping stainless steel mesh around the quartz tube. The step-up transformer was used to generate the plasma discharge (Jayanti Transformer, Chennai, India). Electrical parameters were determined using two high-voltage probes with a 1:100 attenuation ratio (Zeal Manufacturing Service Limited, Pune, India) and were linked to an oscilloscope (Keysight, Santa Rosa, CA, USA, 70 MHz 2 Ga s−1) following Figure 1.

2.7. Photocatalytic Studies

The photocatalytic activity of ZnO-600 and ZnO-P was evaluated using a synthetic azo dye solution of crystal violet (CV). To examine photocatalytic activity, a light apparatus that contained LP mercury vapor lamps (type TUV 16W: Philips, Roosendal, Poland) was used. The synthesized samples were added at a dose of 10 mg/50 mL of a 5 ppm dye solution. To ensure equilibrium between the adsorption and desorption of dye molecules on the catalyst surface, the solution was continuously stirred in dark conditions for 60 min. Subsequently, the reaction mixture was exposed to UV light for 90 min. To determine the dye concentration using a UV-vis spectrophotometer, a 3 mL sample of the dye solution was collected every 15 min. The following formula was used to calculate the percentage (%) of dye degradation when exposed to UV light.
Dye   degradation   ( % ) = C o C t C o
where Co denotes the initial dye concentration and Ct denotes the dye concentration at a given time.

3. Results and Discussion

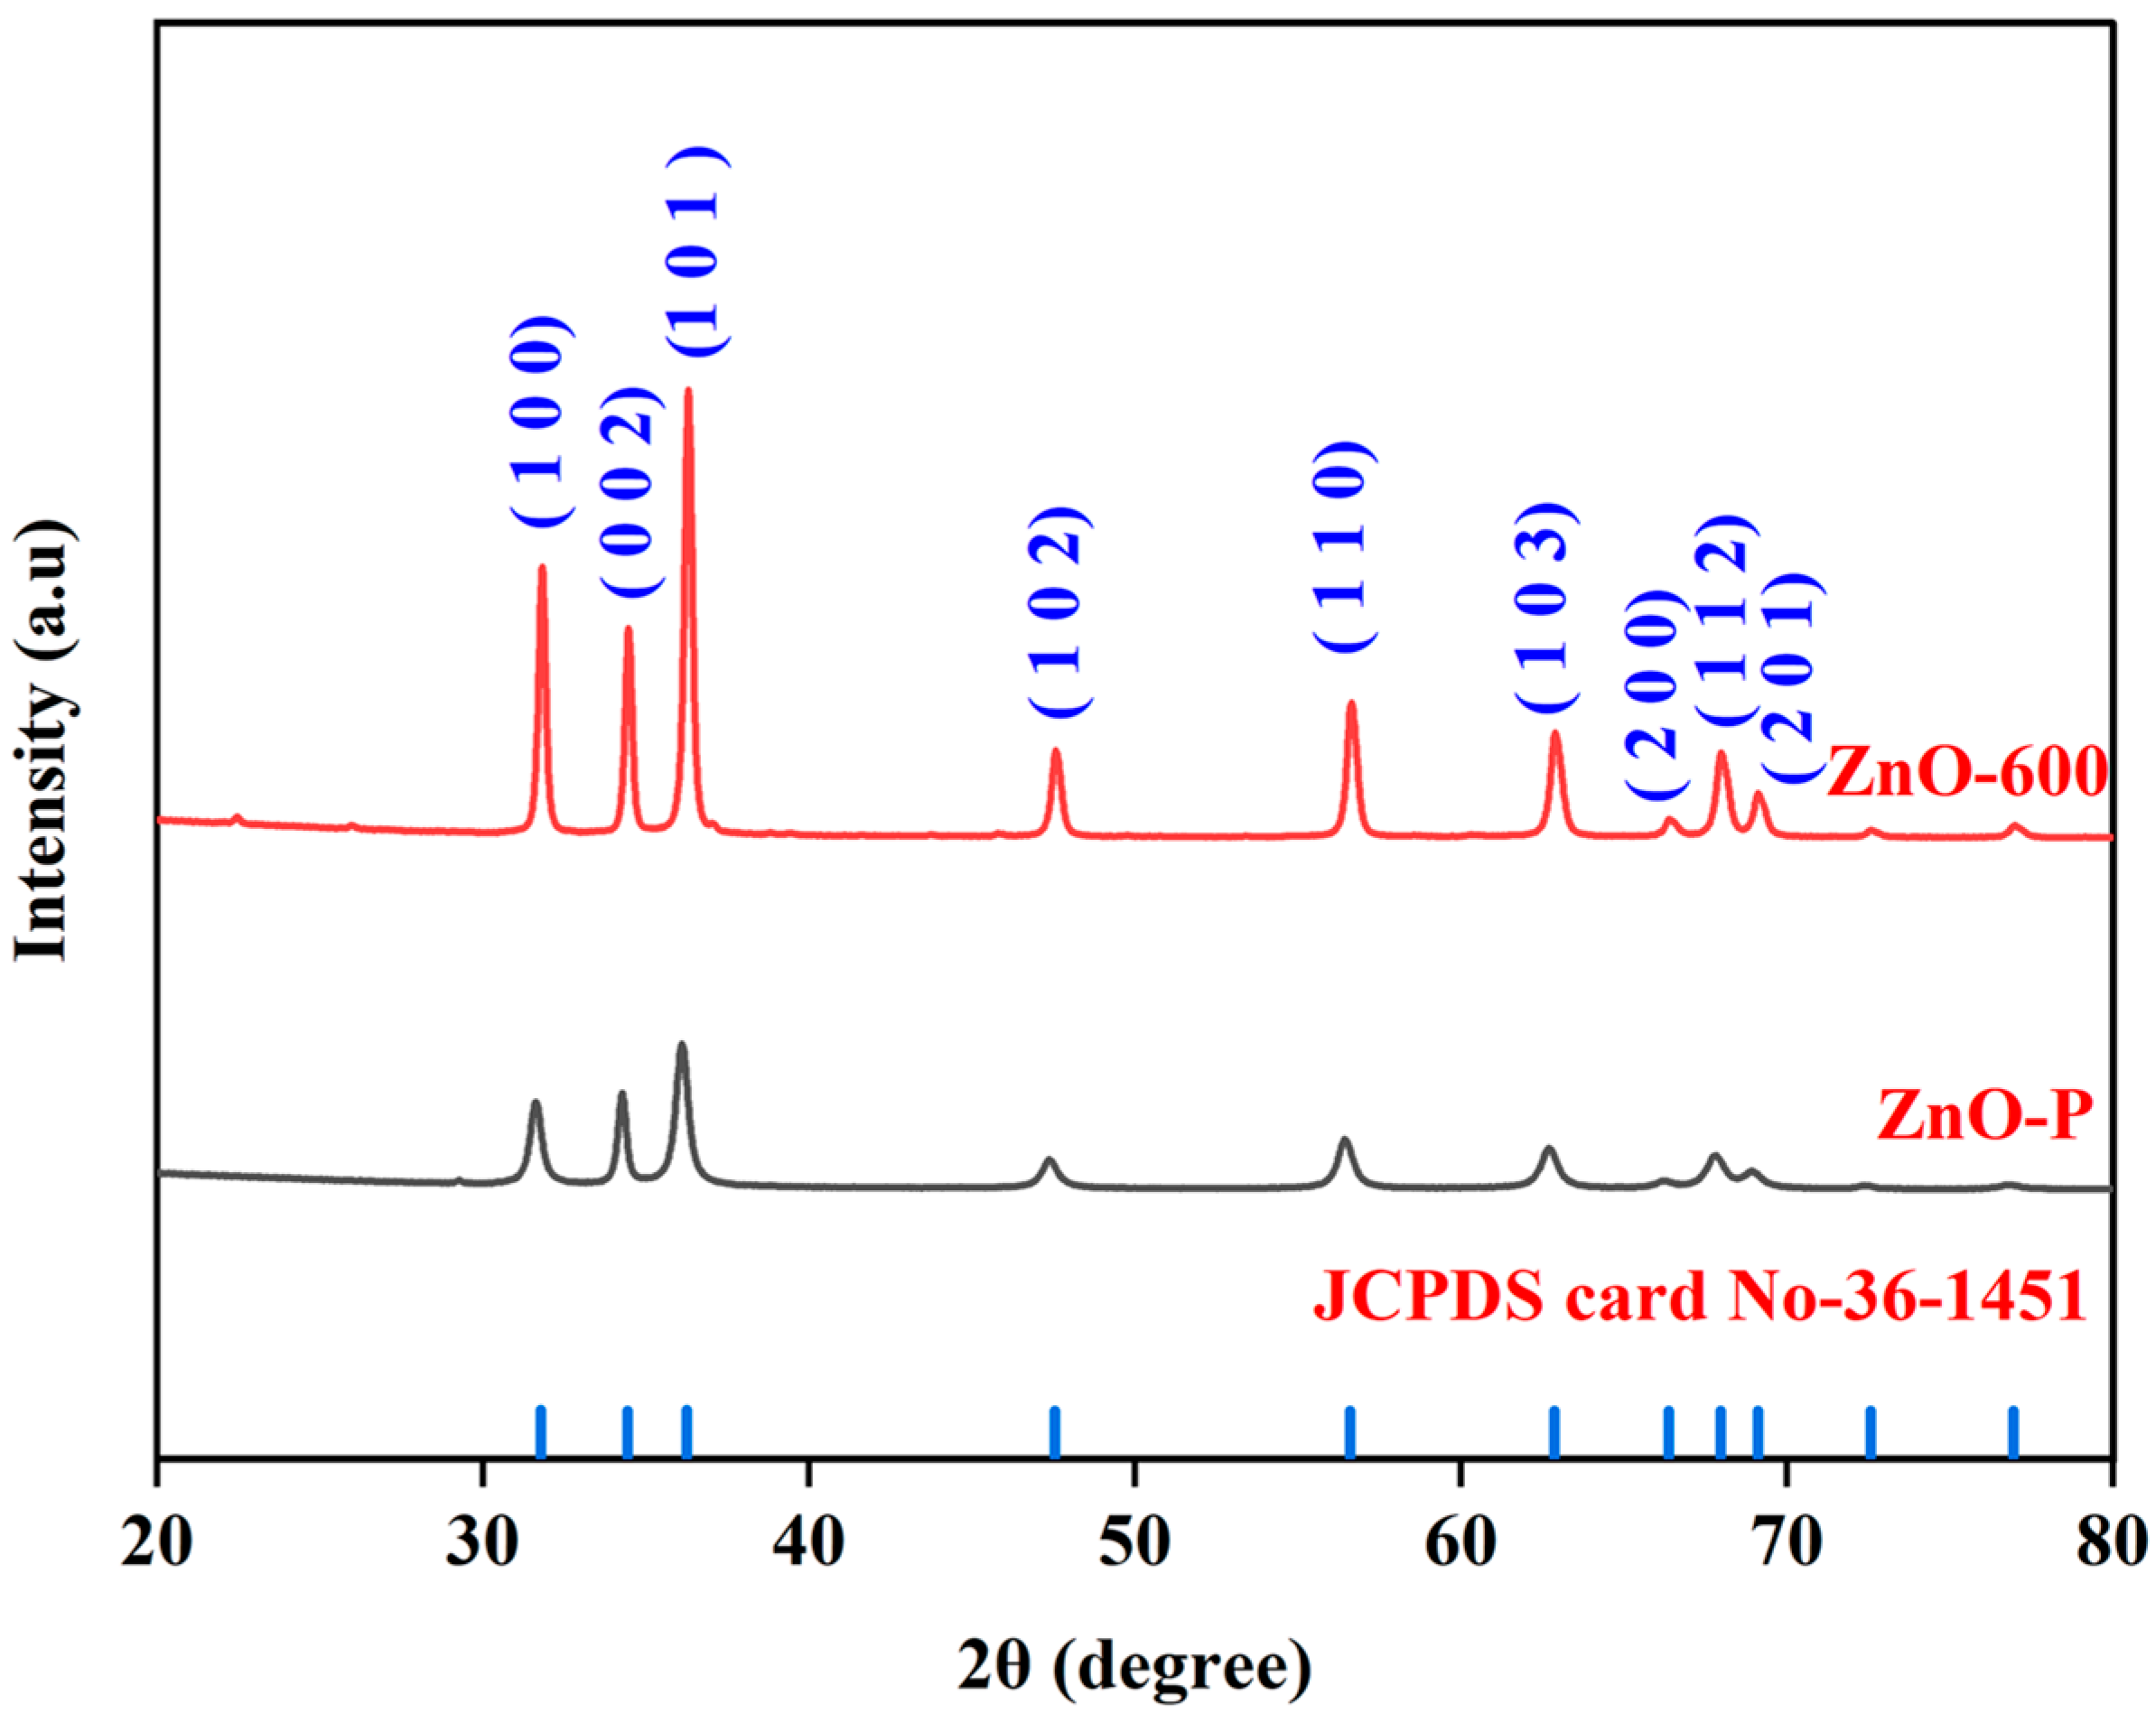
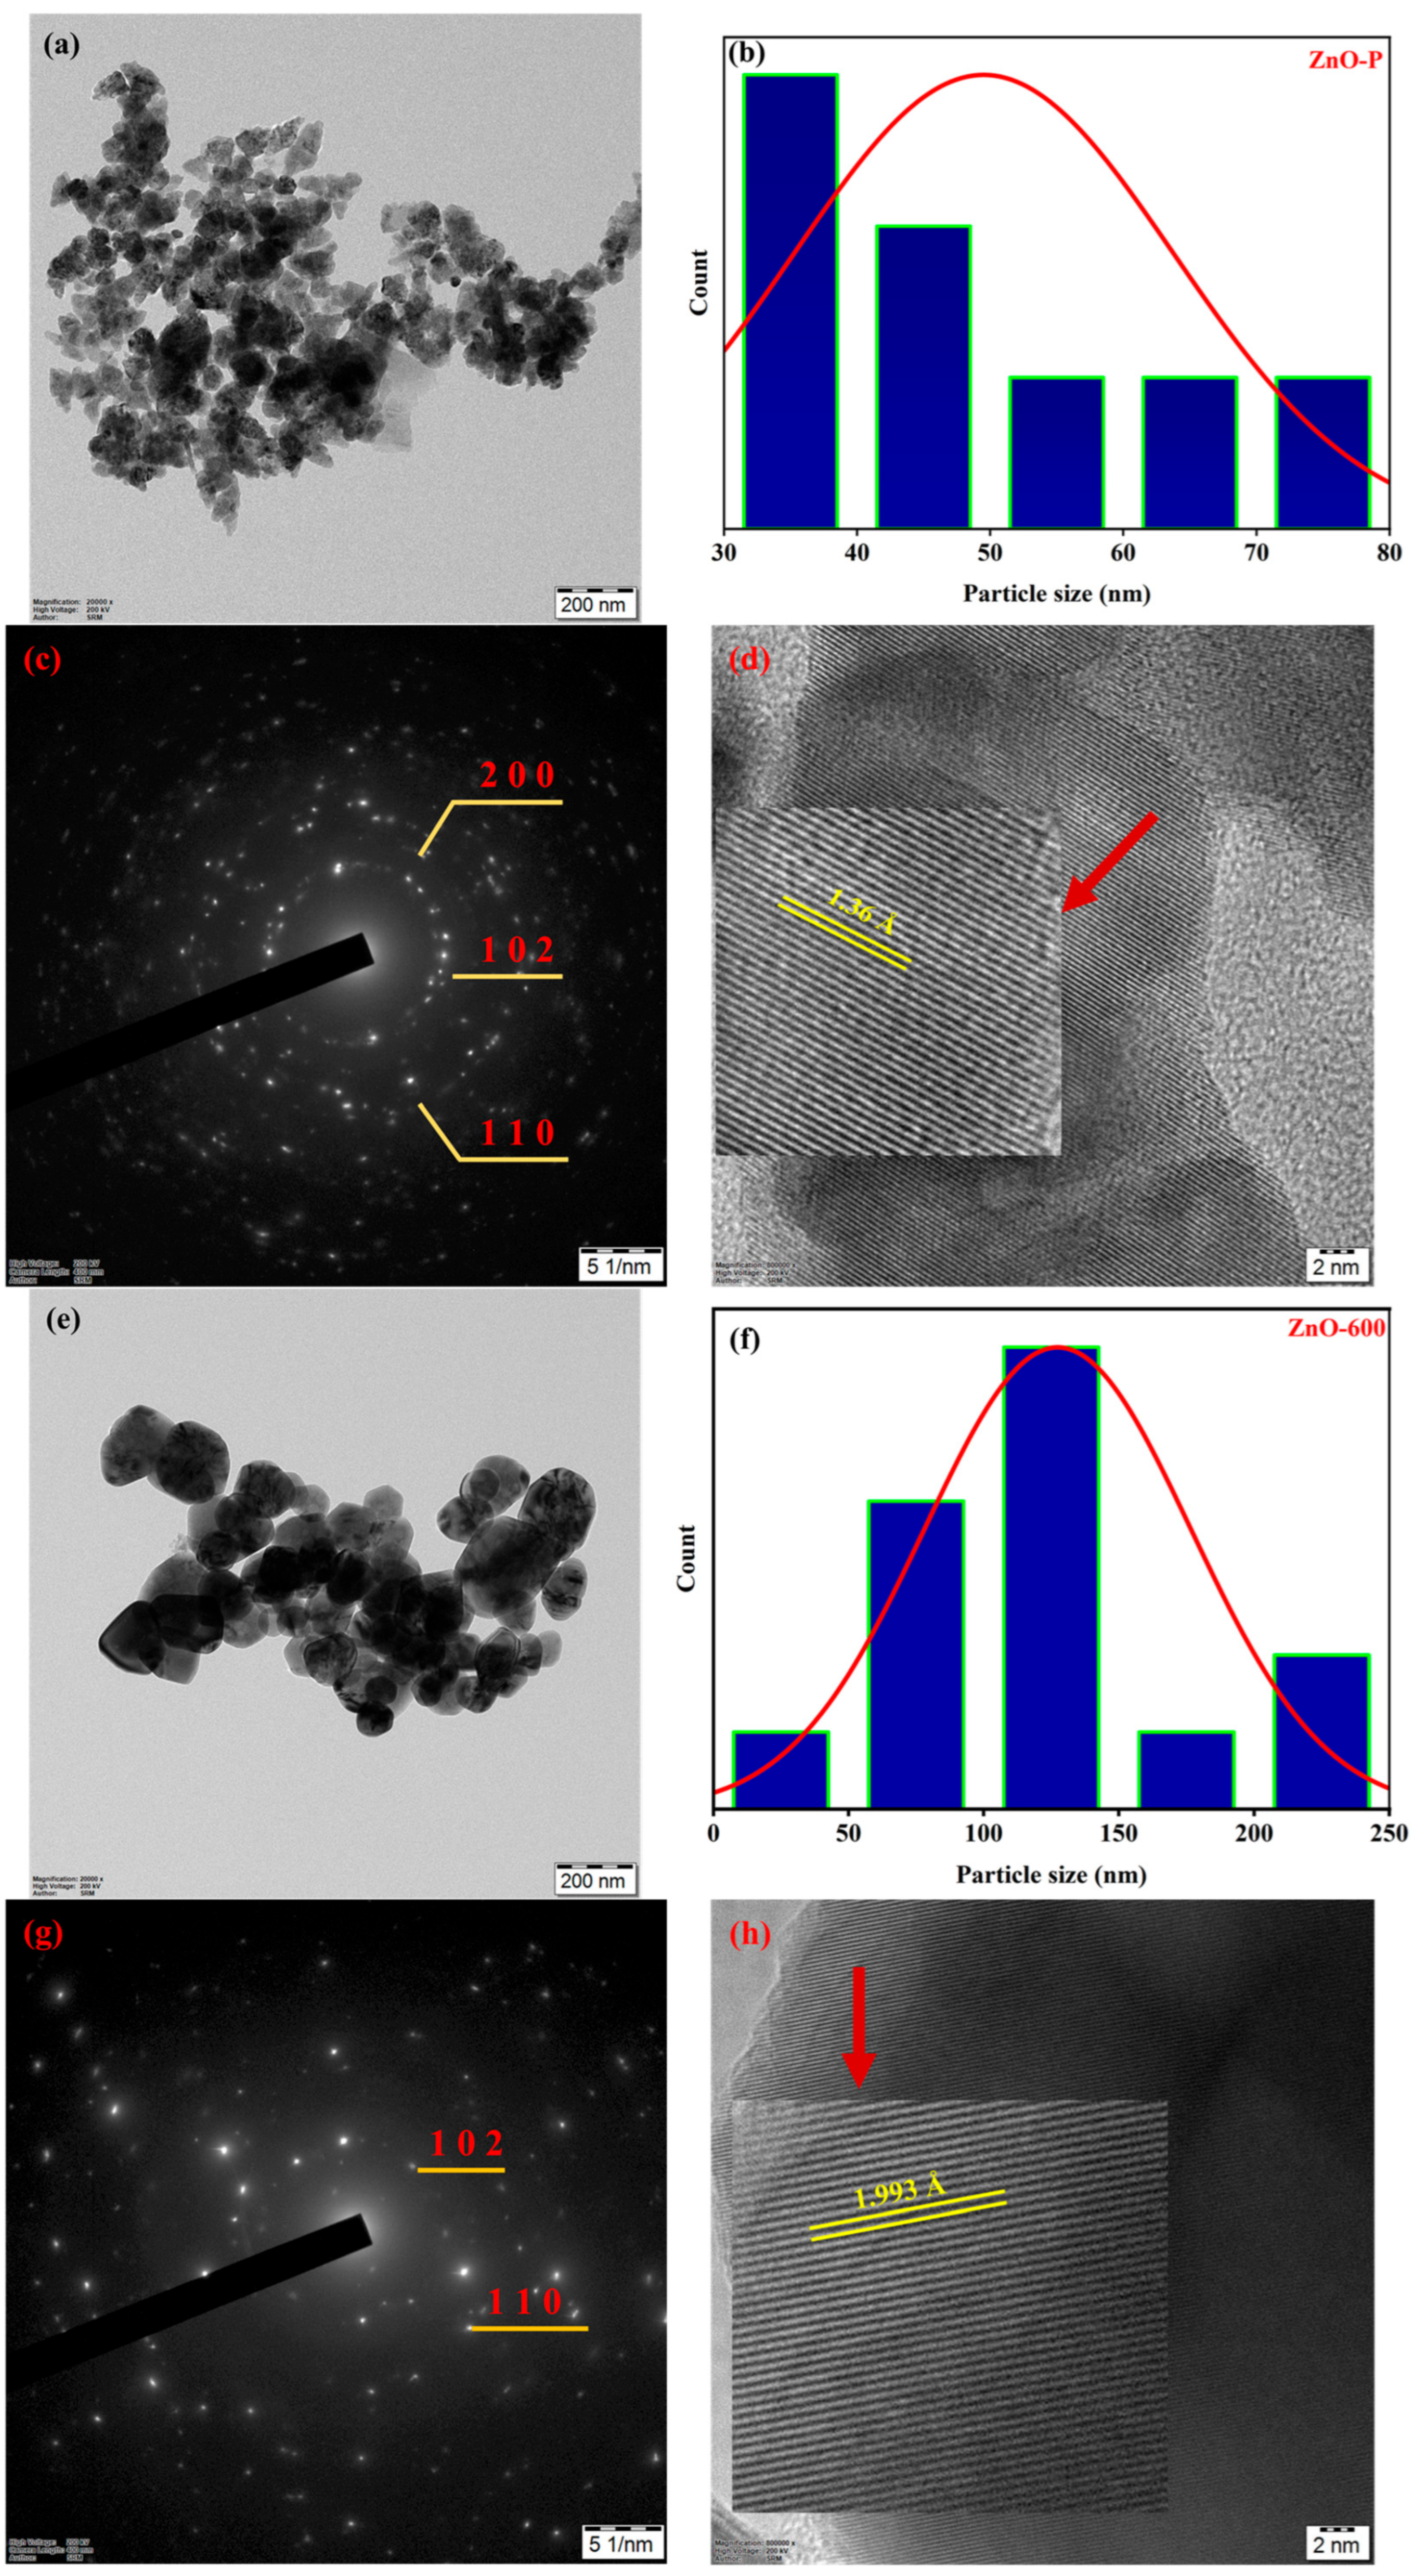
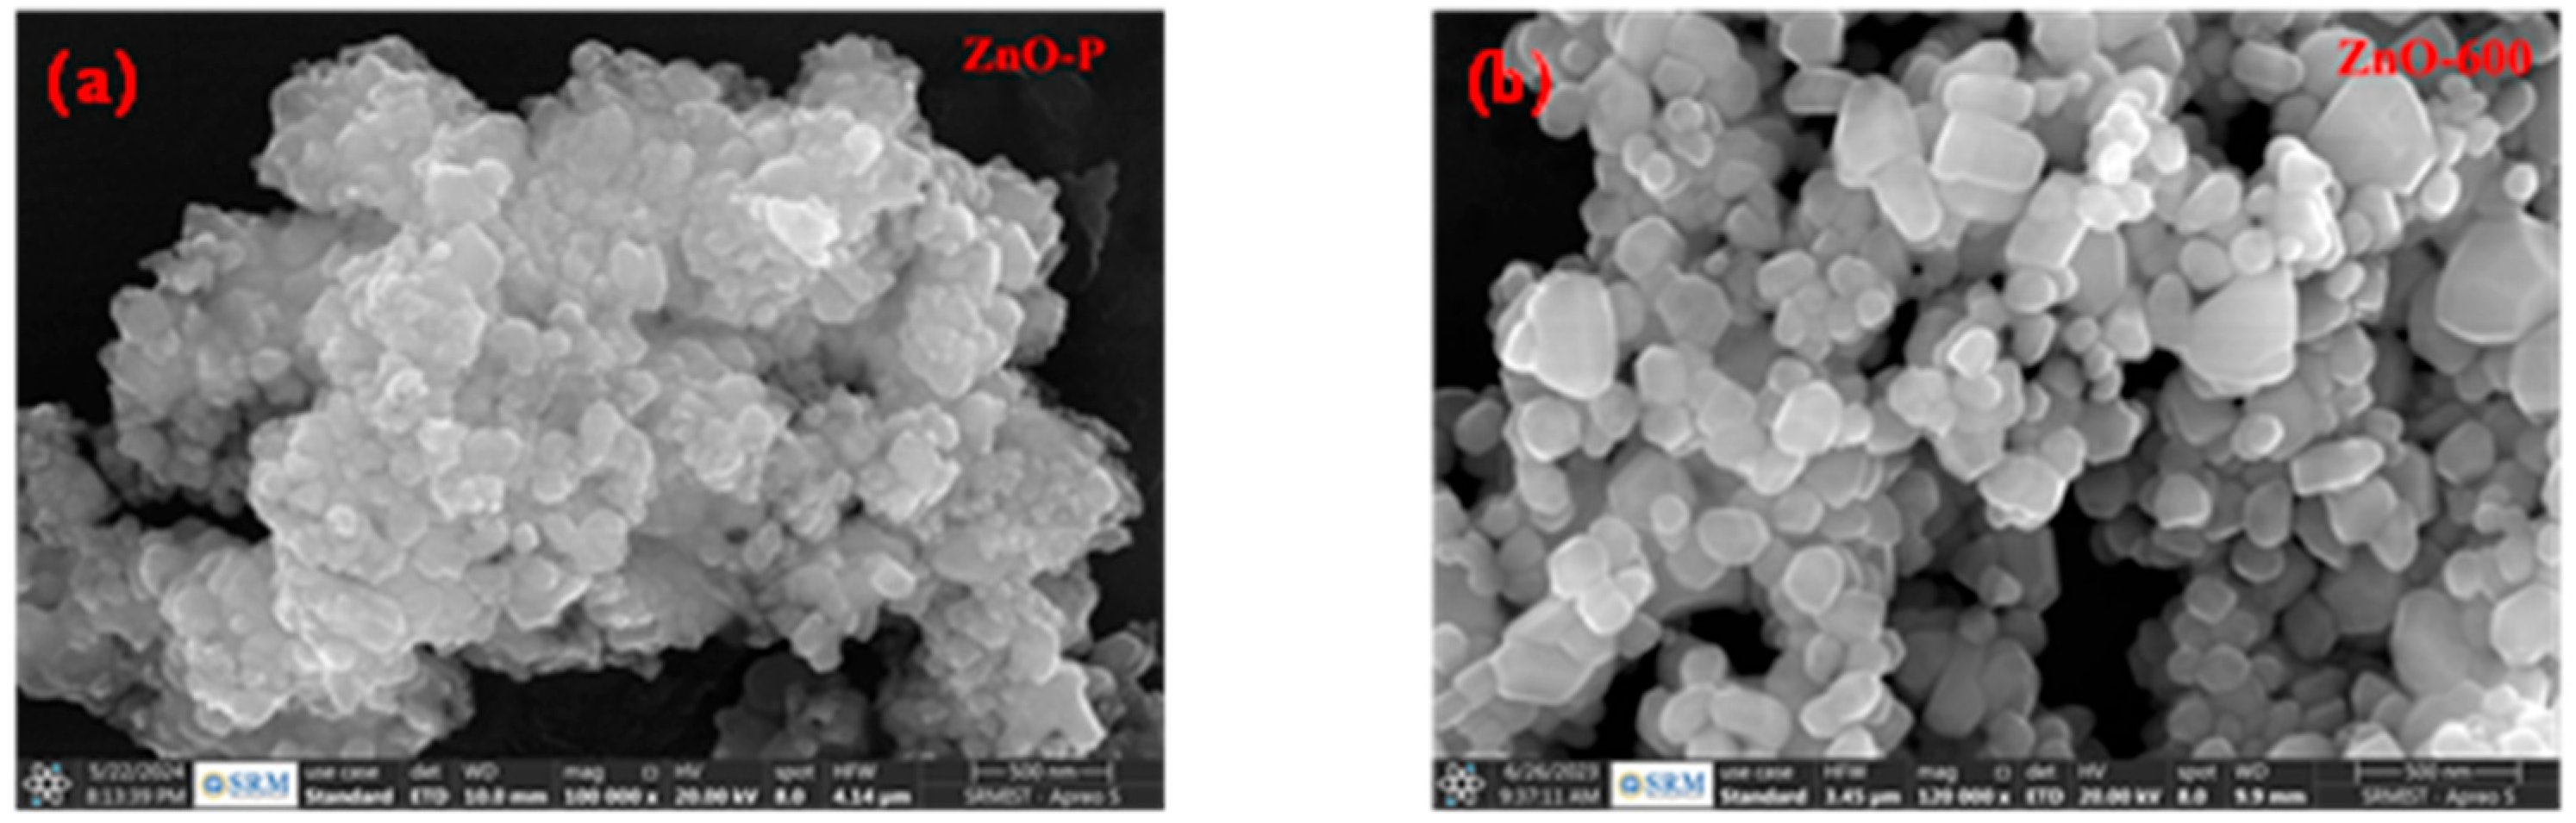
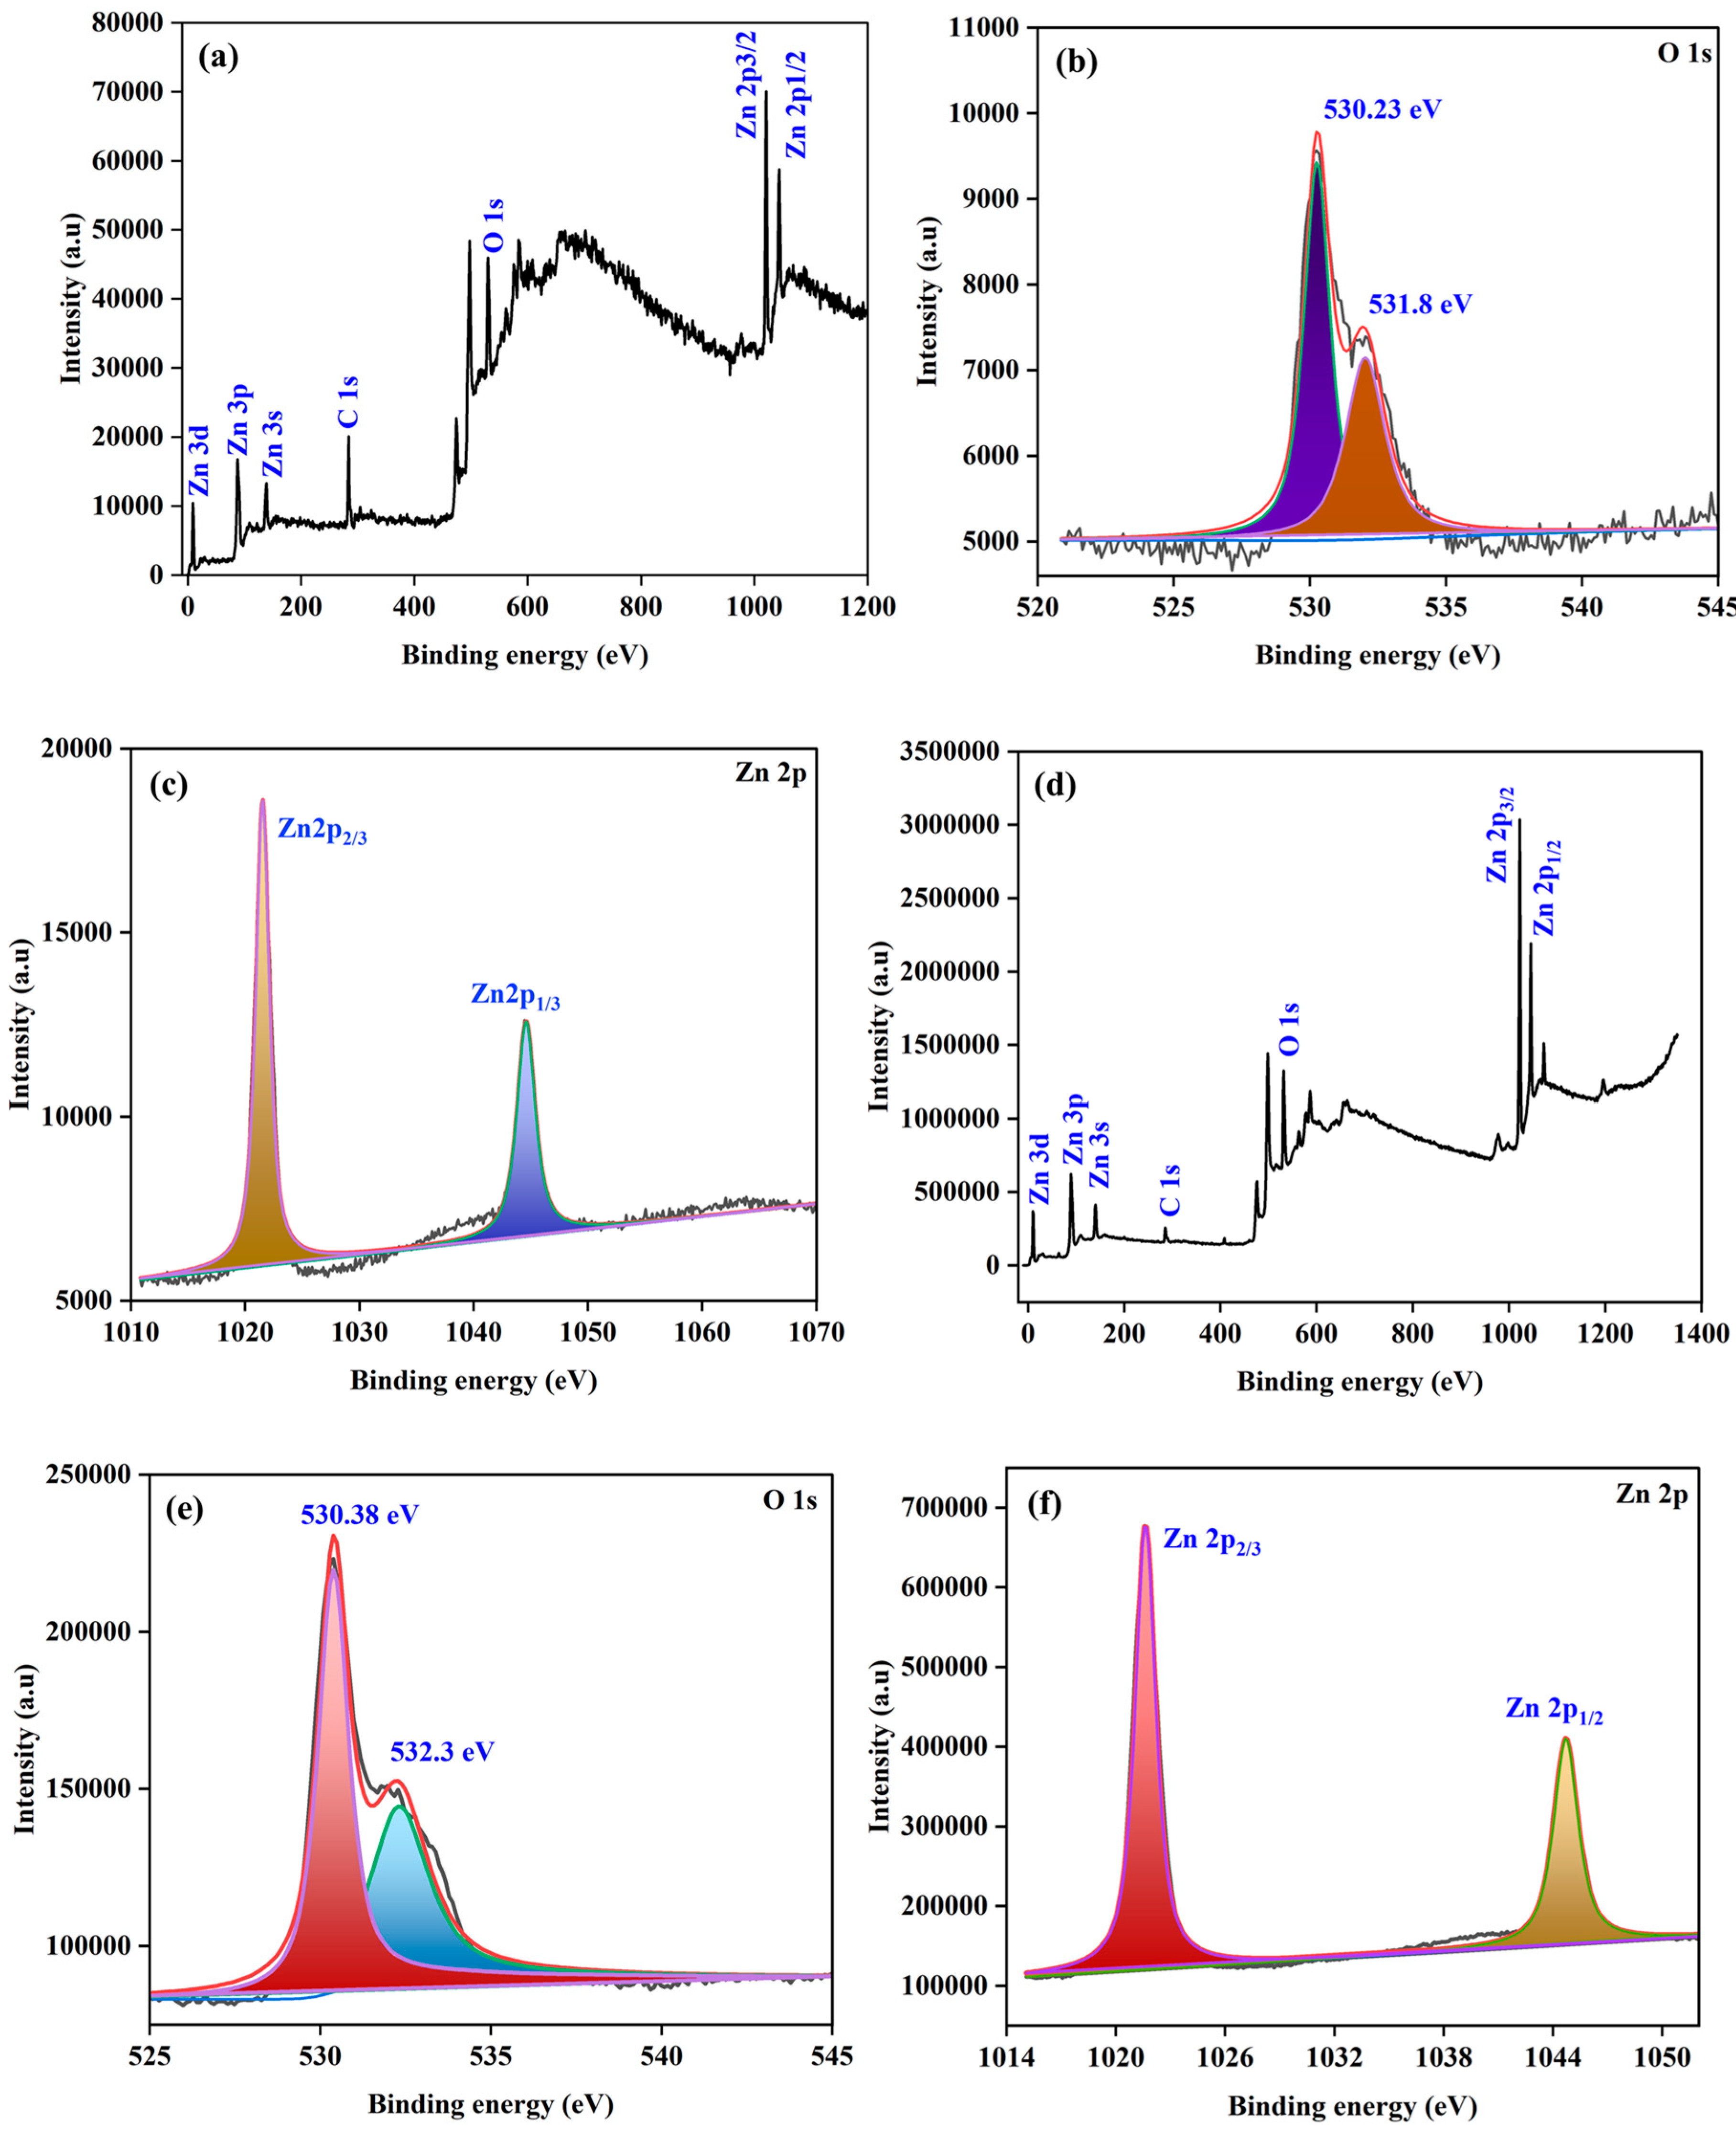
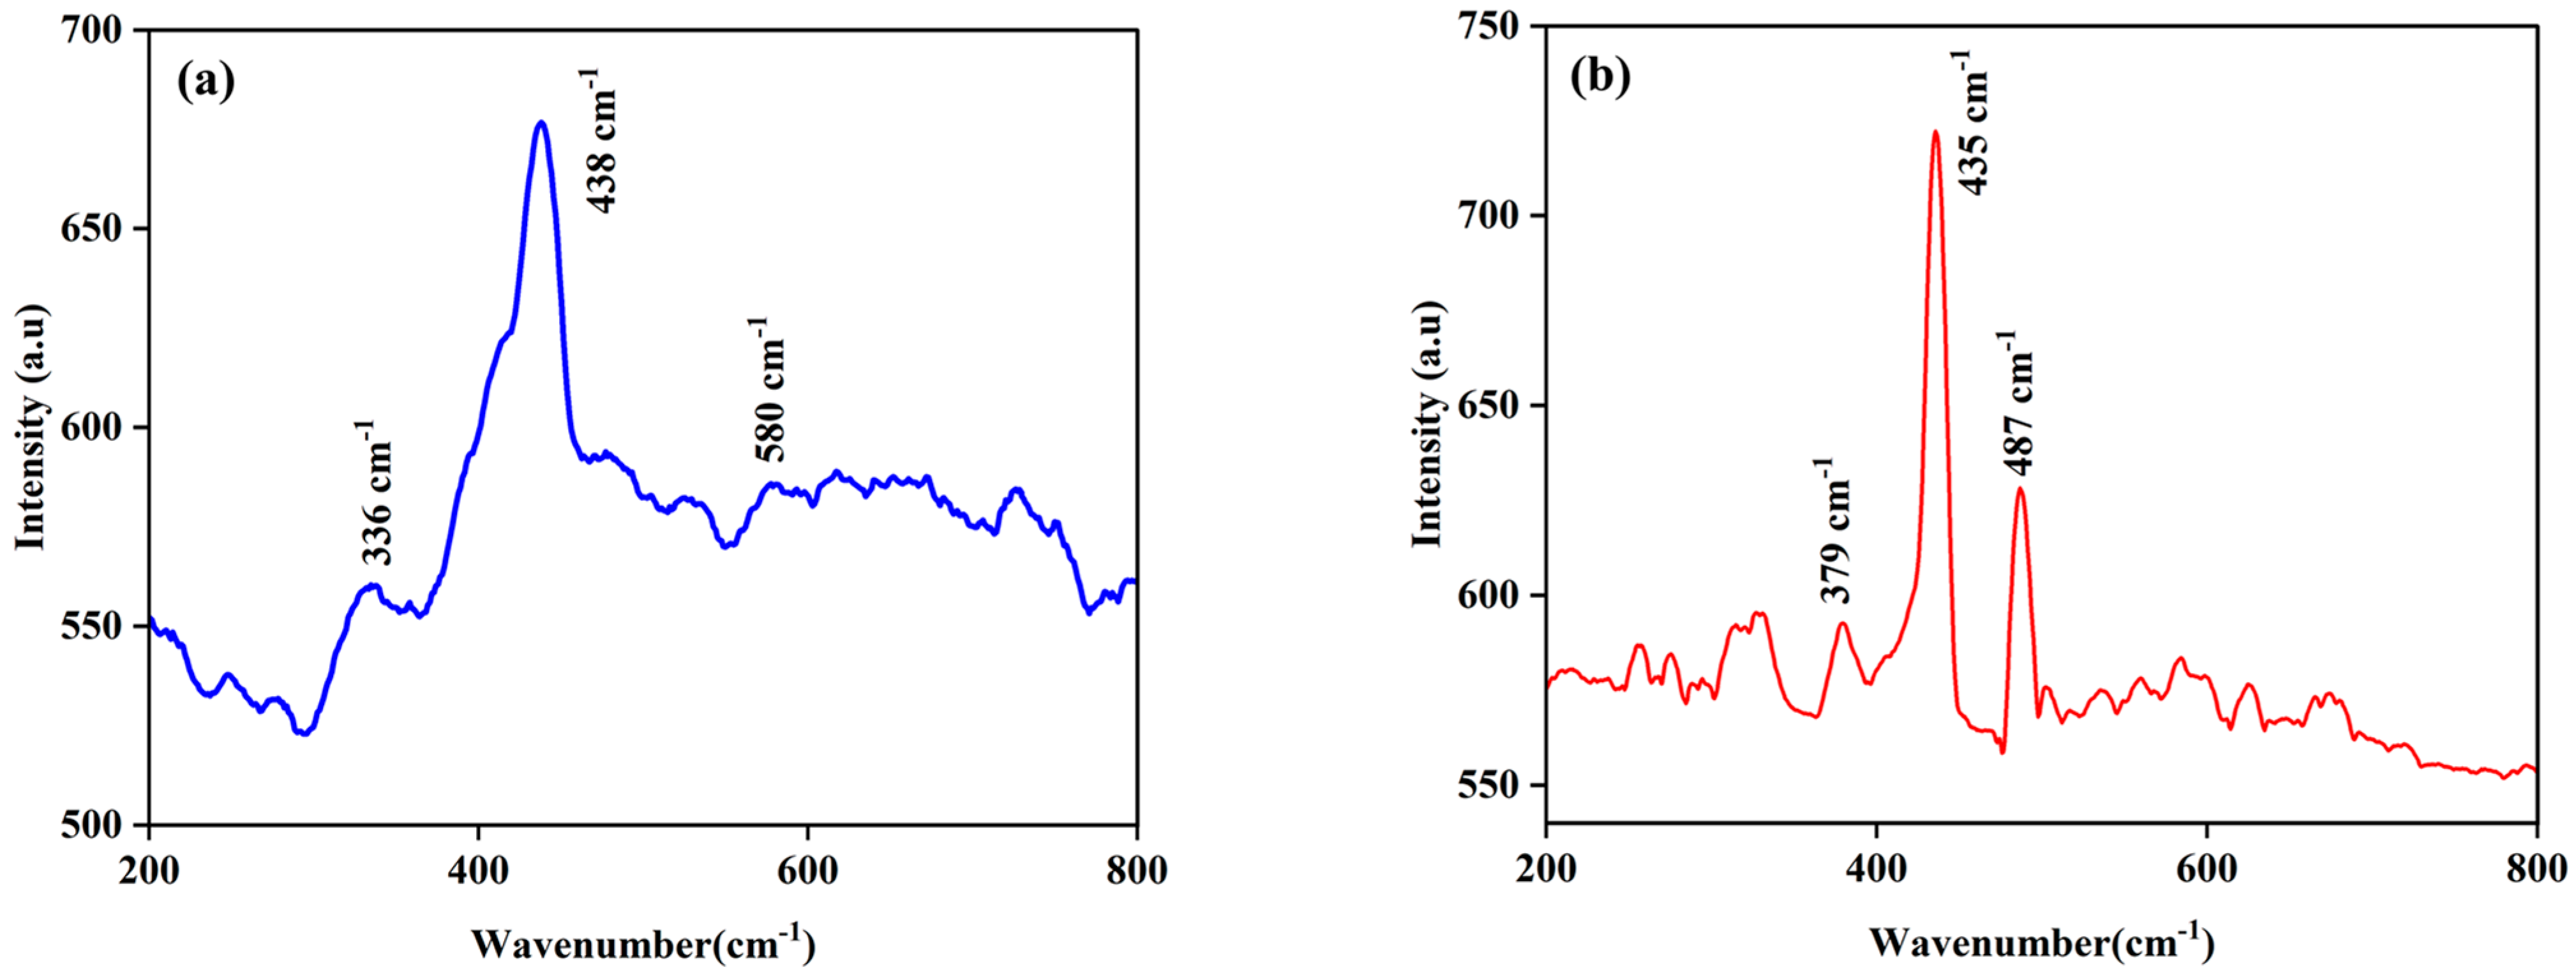
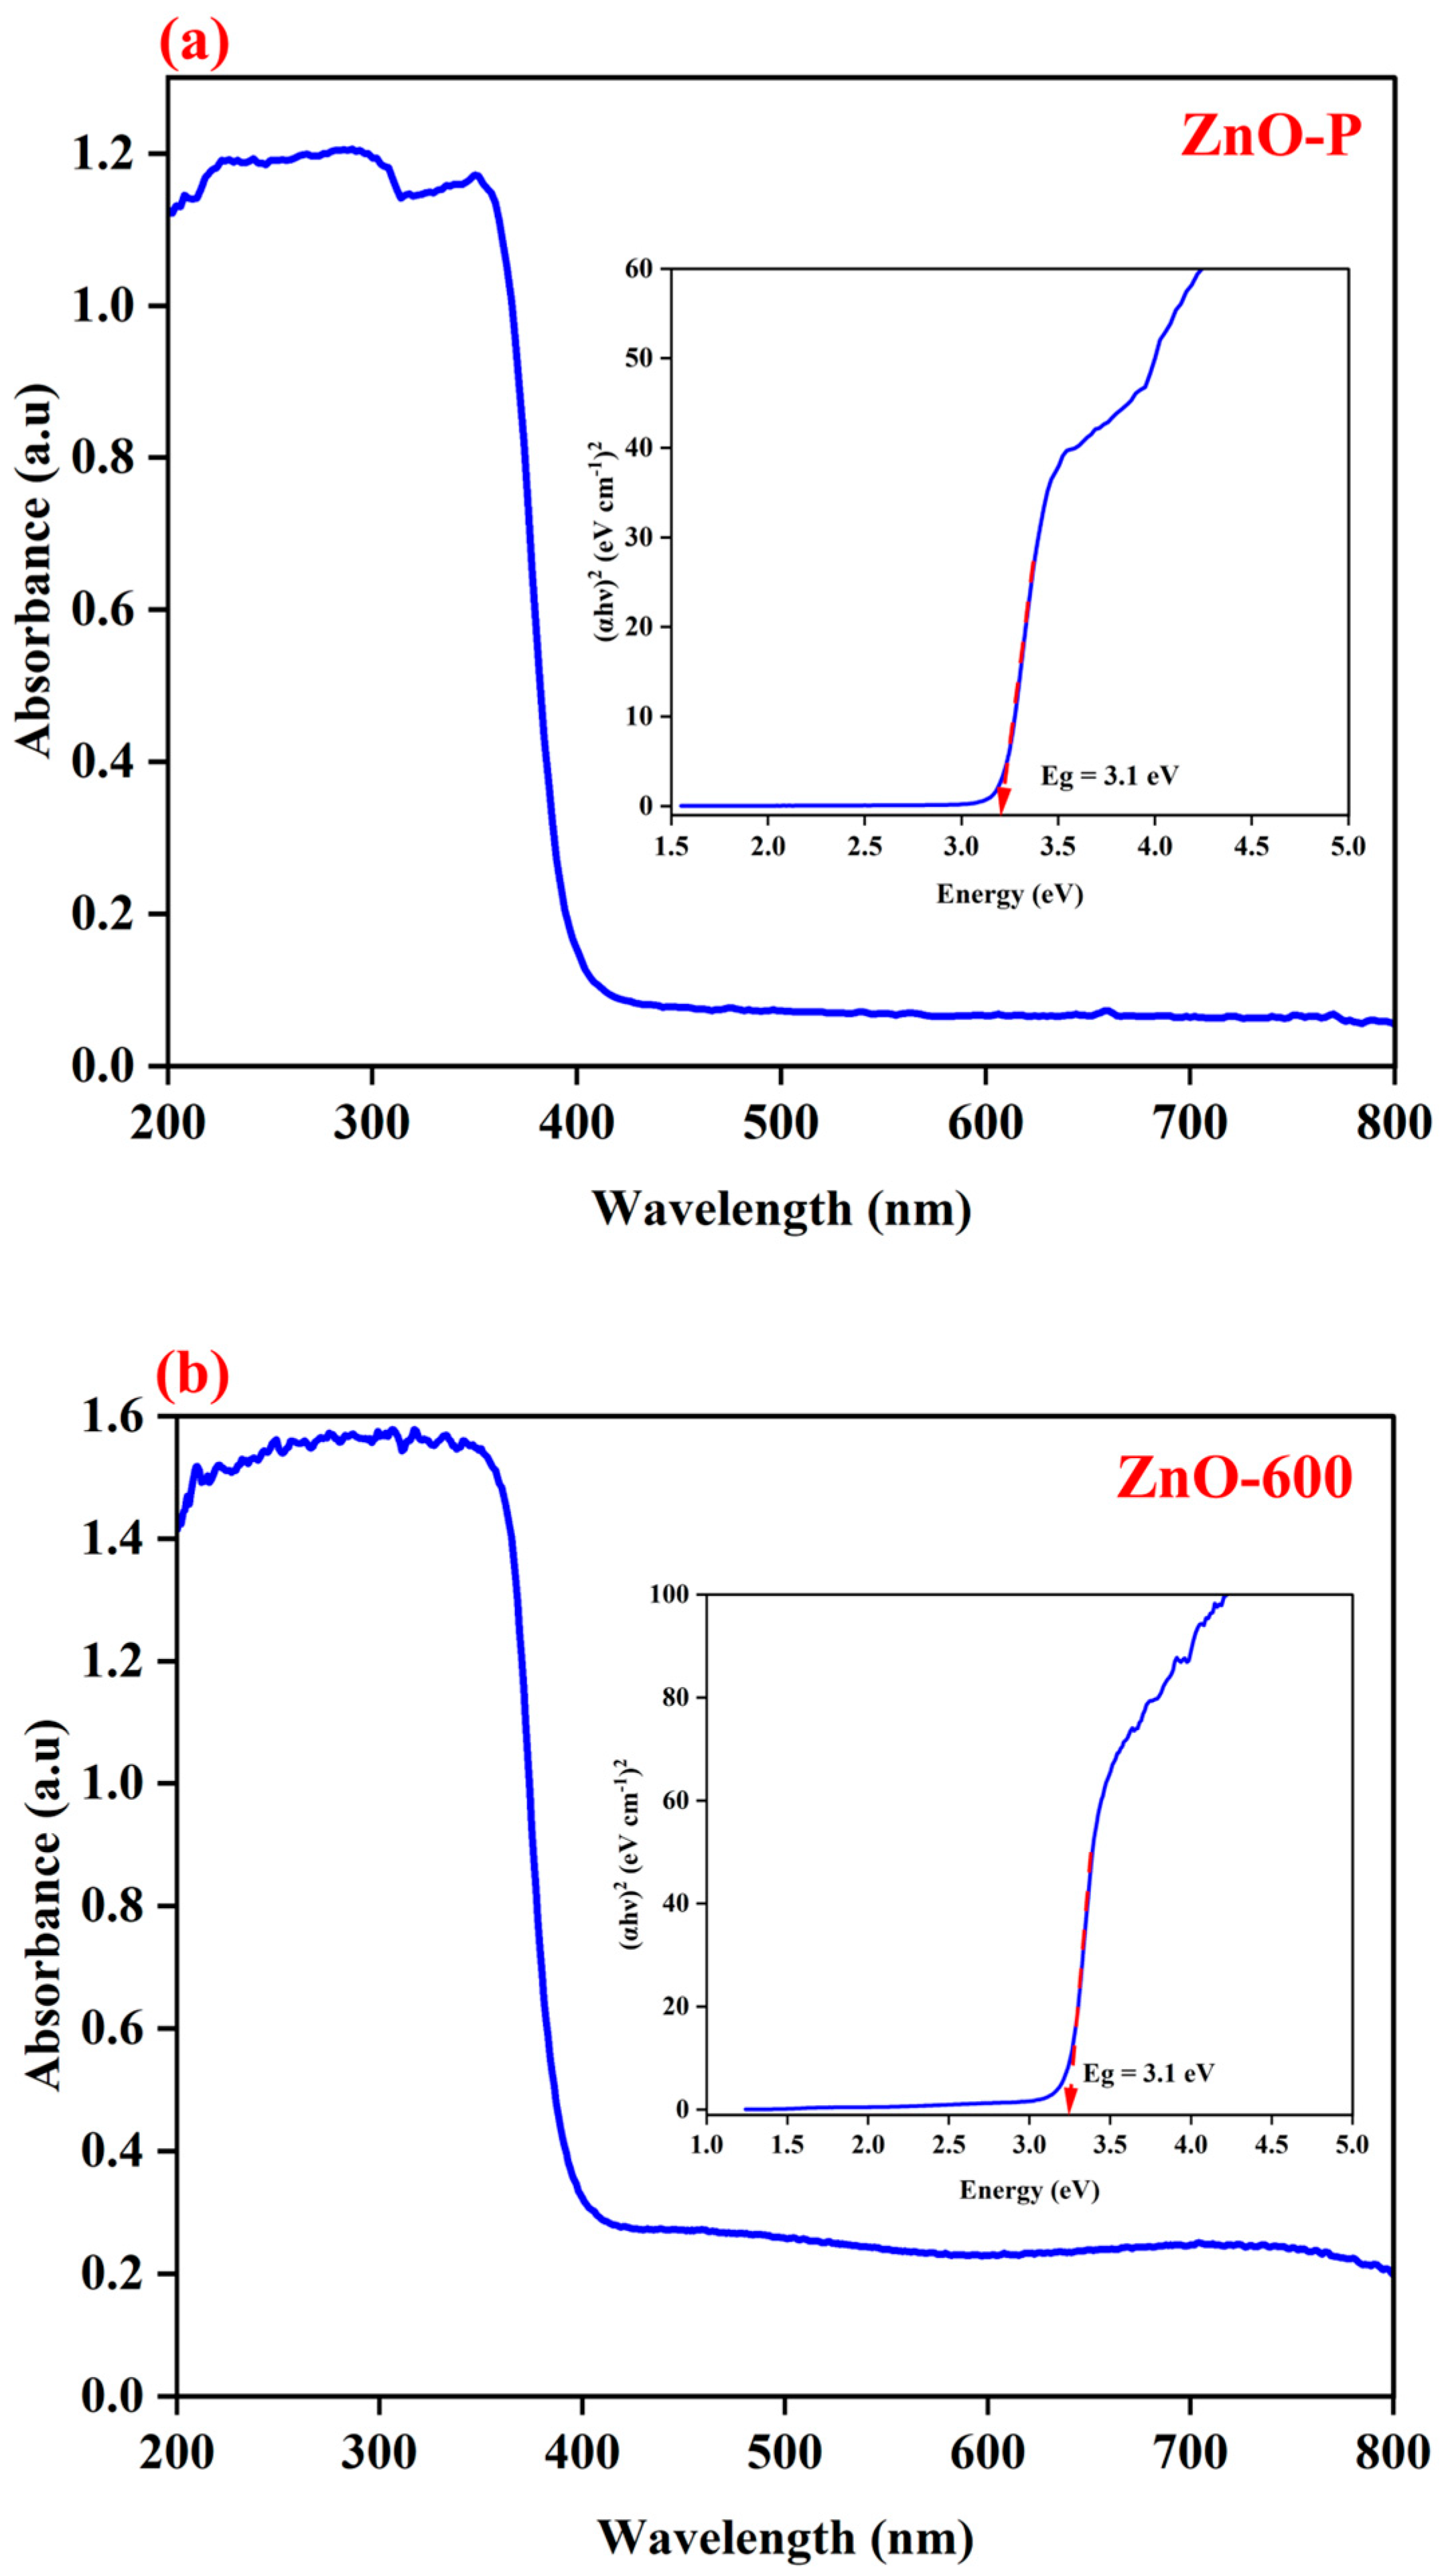
3.1. Structural Analysis

XRD analysis was employed to examine the crystal structure of the synthesized ZnO. As shown in Figure 2 the XRD pattern for ZnO-P and ZnO-600 material confirmed the presence of ZnO, consistent with JCPDS card No. 36-1451. The diffraction pattern corresponds to the characteristic reflections, such as the (1 0 0), (0 0 2), (1 0 1), (1 0 2), (1 1 0), (1 0 3), (2 0 0), (1 1 2), and (2 0 1) at their 2θ planes. The observed diffraction patterns matched the hexagonal wurtzite structure, characterized by the P63mc space group [18]. The XRD peaks confirm the formation of ZnO. Furthermore, it can be concluded that 40 min plasma treatment at 200 °C efficiently converted zinc hydroxide to zinc oxide.
The crystallite size was estimated from the high-intensity peak from ZnO-P, and ZnO-600 using the Debye–Scherrer formula [3]. Interestingly, the crystallite size increases from 17 nm (ZnO-P) to 29 nm (ZnO-600). XRD analysis reveals that plasma treatment at 200 °C for 40 min results in smaller crystallite size compared to ZnO formed through high-temperature calcination [19]. ZnO-P exhibits wider peaks than ZnO-600, indicating the presence of a lower crystalline phase, but has a smaller crystallite size. This reduction in crystallite size is expected to enhance the optical and catalytic properties [18]. The peak at 22° can be attributed to the low score N2, possibly arising from NH4+, which was used as the precipitating agent during synthesis. The peak at 26° corresponds to a low-intensity oxygen-related peak, which matches with the ZnO JCPDS card number (00-021-1486).
The material’s surface morphology and particle size were examined using HR-TEM, and the findings are illustrated in Figure 3. The ZnO-600 shows a sphere-like shape with an approximate particle size of 131 nm, as shown in Figure 3f. Nevertheless, the plasma treatment significantly reduces the particle size, yielding an average size of 49 nm, as mentioned in Figure 3b, which is approximately 2.6 times smaller than ZnO-600. This size reduction can be attributed to the surface defects that occurred during plasma, including vacancies, dangling bonds, and structural rearrangement. NTP treatment reduced the ZnO particle size as compared to calcined ZnO-600. This can be attributed to the electrostatic charging of nanoparticles by plasma discharge, which prevents agglomeration and growth. In addition to that, the reactive species (e.g., electrons, radicals)-produced by plasma discharge could further passivate the surfaces and prevent aggregation [20,21]. Therefore, these defects and changes occur during plasma, leading to the formation of smaller particle sizes [3,22]. Both ZnO-P and ZnO-600 exhibit high crystallinity, as indicated by the bright and sharp rings in their SEAD pattern, as shown in Figure 3c and 3g, respectively. ZnO-P shows the interplanar distance of 1.36 Å calculated in Figure 3d and corresponding crystalline planes (1 0 2), (2 0 0) and (1 1 0). Similarly, for ZnO-600 the interplanar distance is 1.99 Å, as mentioned in Figure 3h, with planes (1 0 2) and (1 1 0).
Furthermore, to analyze the surface morphology of both materials, SEM and EDX were used and are illustrated in Figure 4. In Figure 4a, the SEM image of ZnO-P shows a sphere-like structure along with slight agglomeration. Similarly, ZnO-600 exhibits the sphere-like shape in Figure 4b [23,24]. The morphology variations and agglomeration can be attributable to the different synthesis methods used. The observed agglomeration in ZnO-P is most likely owing to van der Waals interaction between the ZnO particles [25].
The elemental composition of the material was determined by EDX spectroscopy, and the findings are shown in Figure 5 and summarized in Table 1. Both materials exhibited constant elemental compositions. As shown in Table 1, ZnO-P and ZnO-600 have nearly identical elemental compositions. However, the plasma-treated material exhibits a slightly higher surface oxygen content. This increase is attributed to the plasma treatment under a nitrogen atmosphere, which incorporates nitrogen atoms into the ZnO lattice through two primary mechanisms. First, nitrogen atoms can occupy interstitial sites, neutralizing surface defects. Second, they may substitute for oxygen atoms, potentially leading to the formation of oxygen interstitial defects [26]. These processes can result in more surface dangling oxygen atoms and the formation of additional functional groups, thereby contributing to enhanced surface oxygen concentration. This hypothesis could be further investigated and verified through XPS analysis of the plasma-synthesized material.
X-ray photoelectron spectra of sample ZnO-P are reported in Figure 6. The survey spectrum is reported in Figure 6a, revealing the presence of all fundamental elements indicating the formation of ZnO by plasma treatment. The high-resolution O 1s spectrum was deconvoluted into two distinct peaks, observed at binding energies of 530.1 eV and 531.8 eV in Figure 6b. As a result, the peak at 530.1 eV belongs to oxygen (O2−) within the ZnO crystal structure. In contrast, the 531.6 eV corresponds to surface oxygen defects, which may arise due to oxygen vacancies or chemisorbed oxygen species (weakly bound). Chemisorbed oxygen species (such as O2−, O, or O22−) can form on the surface of ZnO, especially in the presence of plasma treatment. The increase in oxygen content as evidenced in the EDX spectra may be due to the adsorption of these reactive oxygen species (ROS) on the surface, which can further enhance photocatalytic performance by providing additional active sites. This also has a significant impact on the electronic properties of ZnO, facilitating the separation and migration of photogenerated charge carriers (electrons and holes). This decreases recombination rates while increasing the material’s capacity to be broken down into organic pollutants [27]. Notably, the absence of peaks related to adsorbed water or OH species indicates that the plasma treatment effectively transformed the metal hydroxide into a well-defined metal oxide [28,29]. This verifies the complete removal of hydroxyl impurities, resulting in high-purity ZnO formation after 40 min of plasma treatment.
The Zn 2p spectrum, illustrated in Figure 6c, shows two distinct peaks at 1021.2 eV (Zn 2p3/2) and 1044.4 eV (Zn 2p1/2). These peaks correspond to the Zn2+ oxidation state, confirming the presence of Zn-O bonds in the ZnO lattice [30]. Furthermore, the energy gap of about 23.2 eV between these two peaks is a well-established fingerprint of Zn2+ ions in ZnO, showing that Zn maintains its predicted oxidation state without major modifications due to plasma treatment. In summary, ZnO-P exhibits a significant amount of defect states, which could be due to oxygen/zinc vacancies, antisite defects, or interstitial zinc/oxygen atoms. The presence of these defects is likely influenced by plasma treatment [31].
XPS spectra of ZnO-600 shows two O 1s peaks in the dominant lattice oxygen peak at 530.38 eV (wurtzite ZnO’s O2−) and at 532.3 eV associated with oxygen vacancies and adsorbed species. It suggests that ZnO has defect sites. The Zn 2p XPS spectrum of ZnO-600 has typical peaks at 1021.5 eV (Zn 2p3/2) and 1044.6 eV (Zn 2p1/2) with a 23.1 eV spin–orbit splitting, establishing the presence of Zn2+ in the wurtzite ZnO structure. These values are consistent with standard ZnO references, confirming phase purity and show the absence of other impurities [32].
The µRaman spectra of the plasma-treated ZnO and calcined ZnO are presented in Figure 7a. In ZnO-P, Raman peaks observed at 336 cm−1, 438 cm−1, and 580 cm−1 correspond to E2(2), E2(2)-E2(1), and A1(LO) modes of ZnO in wurtzite structure, respectively [33]. The peak at 336 cm−1 is associated with the E2(2) mode of ZnO and is related to the vibration of the Zn sublattice. This mode in ZnO-P is typically less sensitive to defects and is used as an indicator of the crystalline nature of ZnO. Its presence in the ZnO-P confirms that the wurtzite structure is preserved. The peak at 438 cm−1 corresponds to the E2(2)-E2(1) mode, which is the Raman active mode of ZnO. The vibration of oxygen atoms in the lattice is linked to this high-frequency E2 mode, which is usually the strongest peak in the ZnO Raman spectrum. The presence of this peak after plasma treatment confirms the retention of the wurtzite phase. The peak at 580 cm−1 is associated with the A1(LO) mode of ZnO-P. The A1(LO) mode is highly sensitive to defects, particularly oxygen vacancies and zinc interstitials, which are common intrinsic defects in ZnO. The peak shift was observed compared to the reported work, and it indicates the defect concentration or stress in the material due to plasma treatment [34]. The intensity of the A1(LO) mode is often enhanced in defective ZnO, as defects break the symmetry of the lattice and increase the scattering cross-section of this mode. The observed peak shift may reflect changes in the distribution of Zn interstitial defects. Plasma treatment may lead to the formation of defect complexes, such as Vo-Zni pairs, observed by the Raman spectra peaks [35,36].
Figure 7b reports the Raman spectra of ZnO-600, and the peaks observed at 379 cm−1, 435 cm−1, and 487 cm−1 correspond to A1(TO), E2(High), and E1(LO) modes of ZnO in wurtzite structure, respectively. The A1(TO) mode at 379 cm−1 indicates the presence of residual compressive strain in the crystal lattice. The intense E2(High) mode at 435 cm−1, the characteristic fingerprint of wurtzite ZnO, confirms the high phase purity and crystallinity of the material. Interestingly, the E1(LO) mode at 487 cm−1 indicates the presence of intrinsic defects, such as zinc interstitials, which are normally created during high-temperature processing [37,38].
The UV-DRS analysis was used to determine the optical band gap of the material, as shown in Figure 8. The energy band gap (Eg) of the material was calculated using the Kubelka–Munk model [3]. ZnO-P was discovered to have a band gap of 3.1 eV, which is smaller and consistent with bare ZnO. Similarly, there was an evident reduction in the band gap for ZnO-600, consistent with prior studies. This shows that raising the calcination temperature can shrink the band gap [39]. For ZnO-P, although quantum confinement effects (expected to increase the band gap owing to nanoscale electron confinement) were predicted for ZnO-P, the band gap was found to be reduced. This drop might be caused by surface oxygen defects [30,40]. These also act as intermediate energy levels, allowing visible light to be absorbed and enhancing the catalyst degradation activity over a wider range of wavelengths. Plasma treatment effectively modifies materials by reducing particle size and band gap energies. This low-temperature plasma approach is a viable, energy-efficient alternative to standard high-temperature procedures for producing optically active materials. This can lead to a significant improvement in its photocatalytic activity, allowing it to degrade pollutants more effectively.

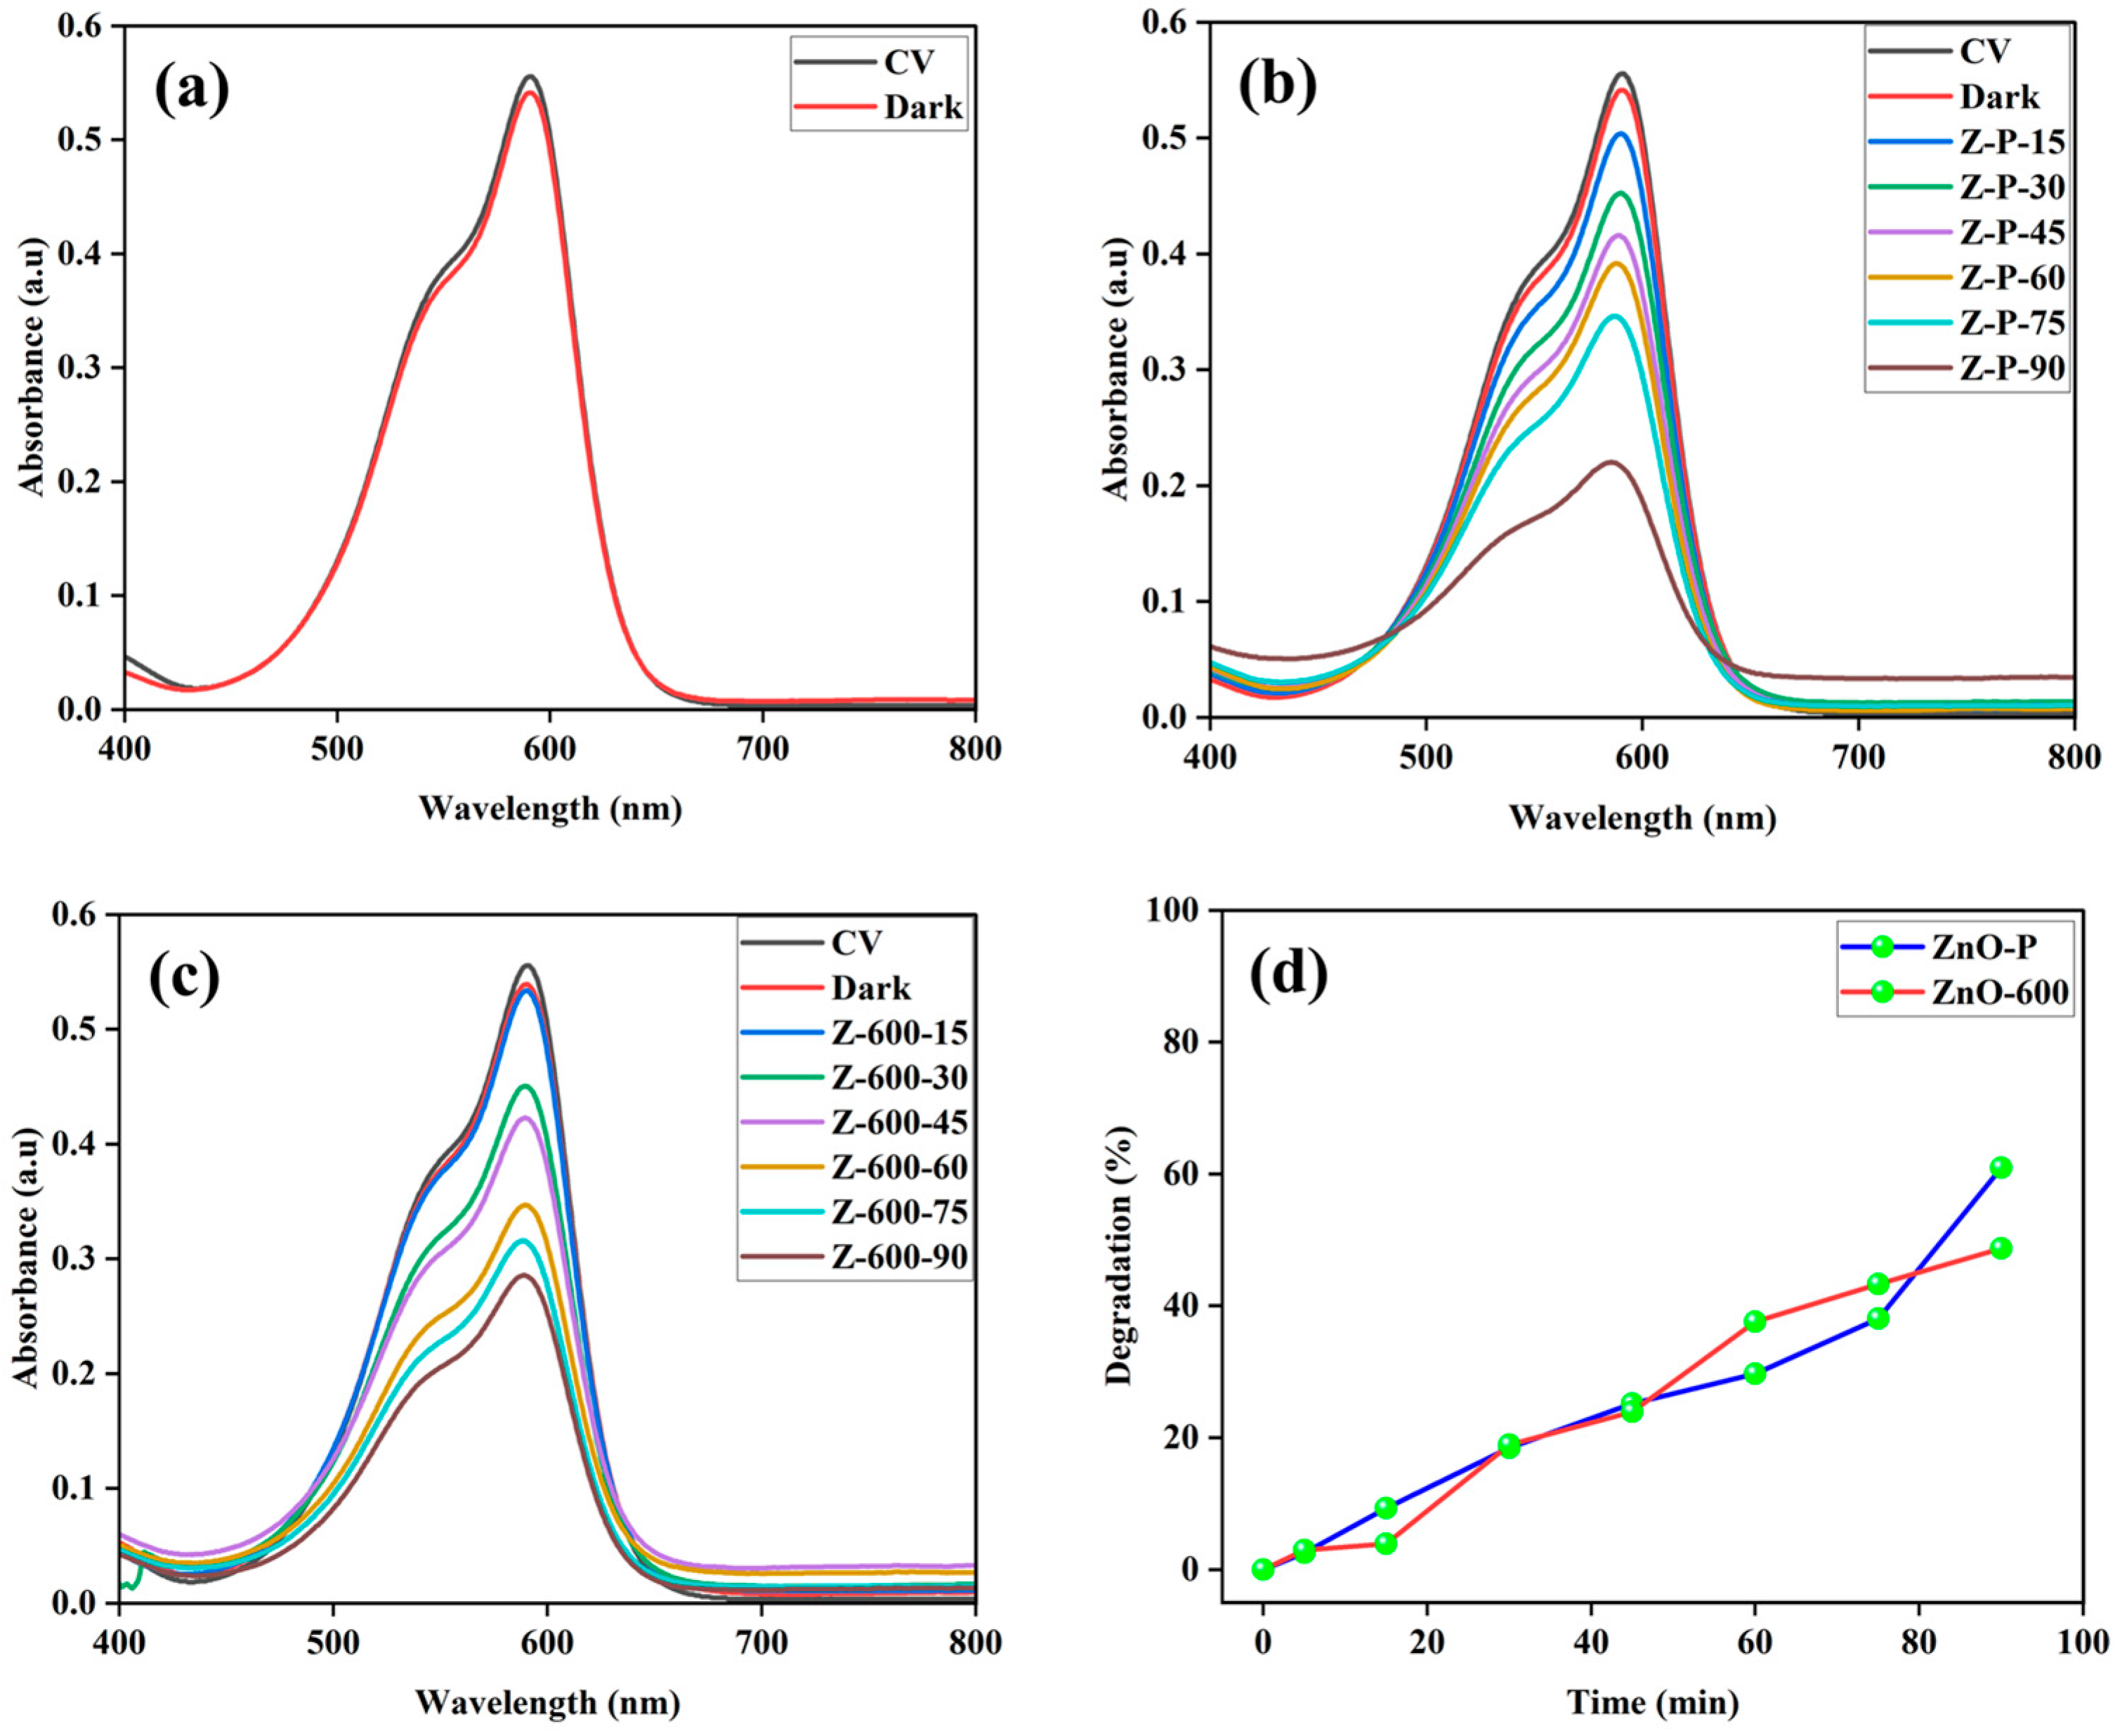
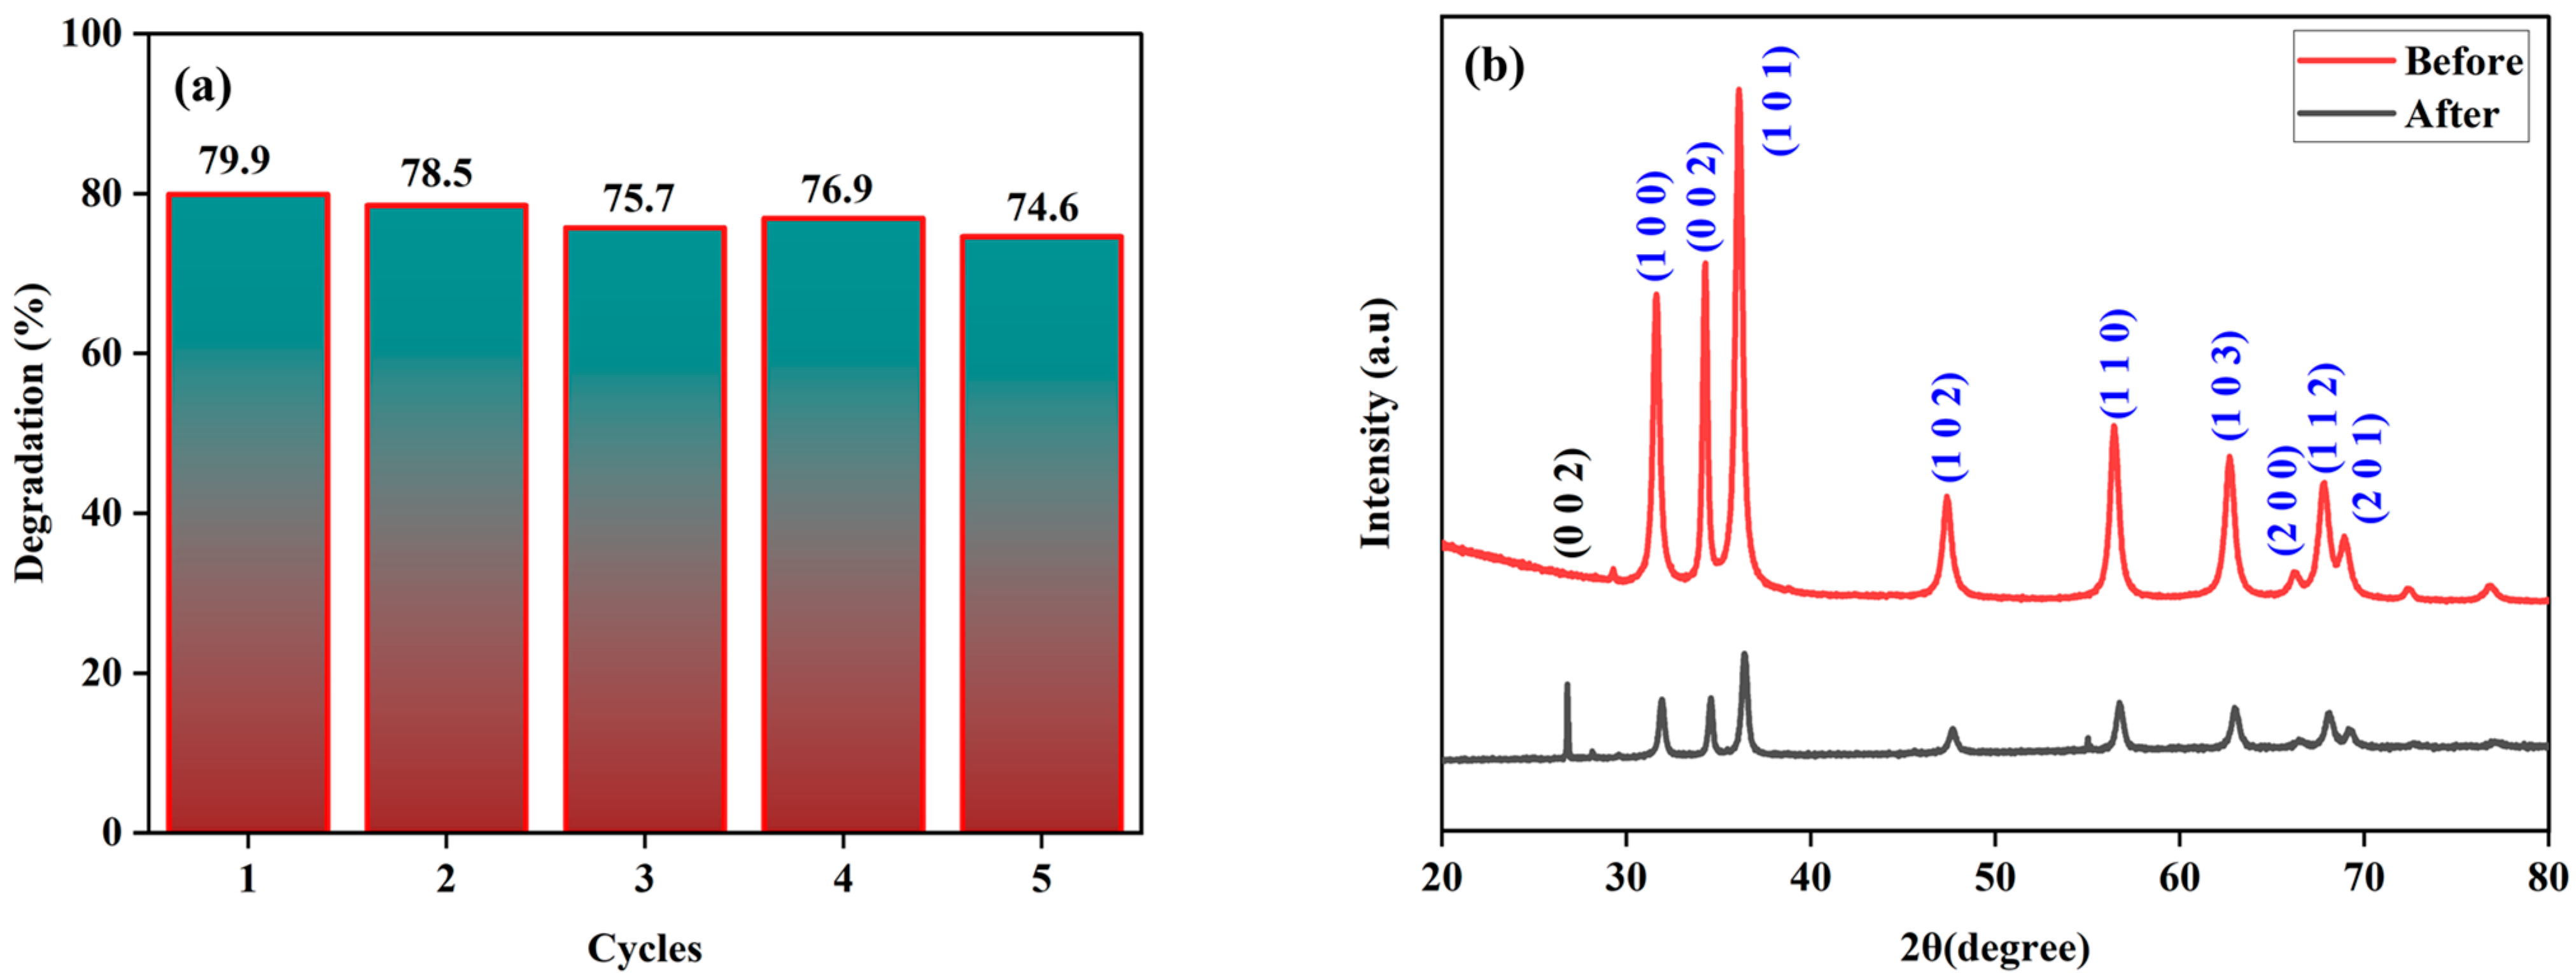
3.2. Catalytic Activity

The photocatalytic activity of ZnO-P and ZnO-600 photocatalysts was assessed by measuring the degradation of the cationic dye CV under UV light irradiation. CV is a prevalent water contaminant released by textile companies. Two preliminary experiments were performed to establish baseline conditions. First, the self-degradation for CV was tested by exposing the dye to UV light for 90 min. There was no color change observed indicating that the dye’s self-degradation under UV light was low, as mentioned in CV in (Figure 9a). Second, the effect of the catalyst under dark conditions was analyzed. The catalysts were combined with dye, which was left in the dark for 60 min. The dye degradation was minimal which was ascribed to the dye’s low degree of adsorption on the catalyst surface, as mentioned in Figure 9a. This adsorption was deemed insignificant.
The prepared ZnO-P and ZnO-600 were utilized to degrade CV. UV treatment led to a reduction in CV distinct absorption peak intensity at 590 nm, indicating degradation. This peak was eventually low, confirming the dye’s degradation.
Plasma-synthesized catalyst (ZnO-P) degrades CV with slightly better efficiency under UV light irradiation. For both catalysts, the experiment was repeated three times, and the average degradation efficiency is reported in Figure 9b–d. Our findings show that ZnO-P (60%) and ZnO-600 (50%) have shown similar CV degradation efficiency after 90 min of irradiation. However, it should be noted that 40 min plasma treated at 200 °C has exhibited similar catalytic activity as that calcined at 600 °C for 5 h. These findings emphasize the fact that plasma synthesis can be used for material synthesis with low energy consumption. This improved performance can be attributed to the lower band gap and smaller particle size. When compared to conventionally synthesized ZnO-600, plasma-synthesized ZnO-P exhibits improved photocatalytic degradation mainly because of the distinct defects introduced by plasma treatment on the catalyst surface. Oxygen vacancies and zinc interstitials are examples of defects that improve light absorption, charge carrier separation, and ROS generation by increasing surface area, improving crystallinity, lowering the band gap, and reducing particle size. When combined, these surface modifications in ZnO-P cause organic dyes like CV to degrade more effectively in the presence of UV radiation. On the other hand, ZnO-600 shows less photocatalytic activity because of its greater particle size and fewer surface defects.
Figure 10a exhibits the catalyst’s reusability in the synergistic degradation process. After five consecutive trials, the degradation rate of CV in an aqueous solution remained at 74.6%, with a slight decrease detected. These results imply that the synthesized ZnO-P catalyst is stable.
To test the catalyst’s stability, XRD analysis was performed on the ZnO-P catalyst after five cycles of degradation, as shown in Figure 10b. The XRD patterns demonstrated that the distinctive peaks of ZnO were constant, showing that the catalyst’s crystalline structure was converted despite the repeated degrading processes. While the ZnO peaks stayed steady, other peaks emerged, most likely representing byproducts of less harmful compounds after the CV breakdown. These extra peaks suggest the presence of reaction products rather than the breakdown of the catalyst.
The ZnO-P catalyst was recovered after centrifugation and filtration. The filtrate solid was washed with ethanol followed by DI water, then dried at 60 °C overnight. Despite these cleaning steps, a sharp peak was observed in XRD at 26°, which could be attributed to the ZnO (JCPDS card number 00-021-1486). However, the ZnO crystal structure was retained even after five catalytic cycles.

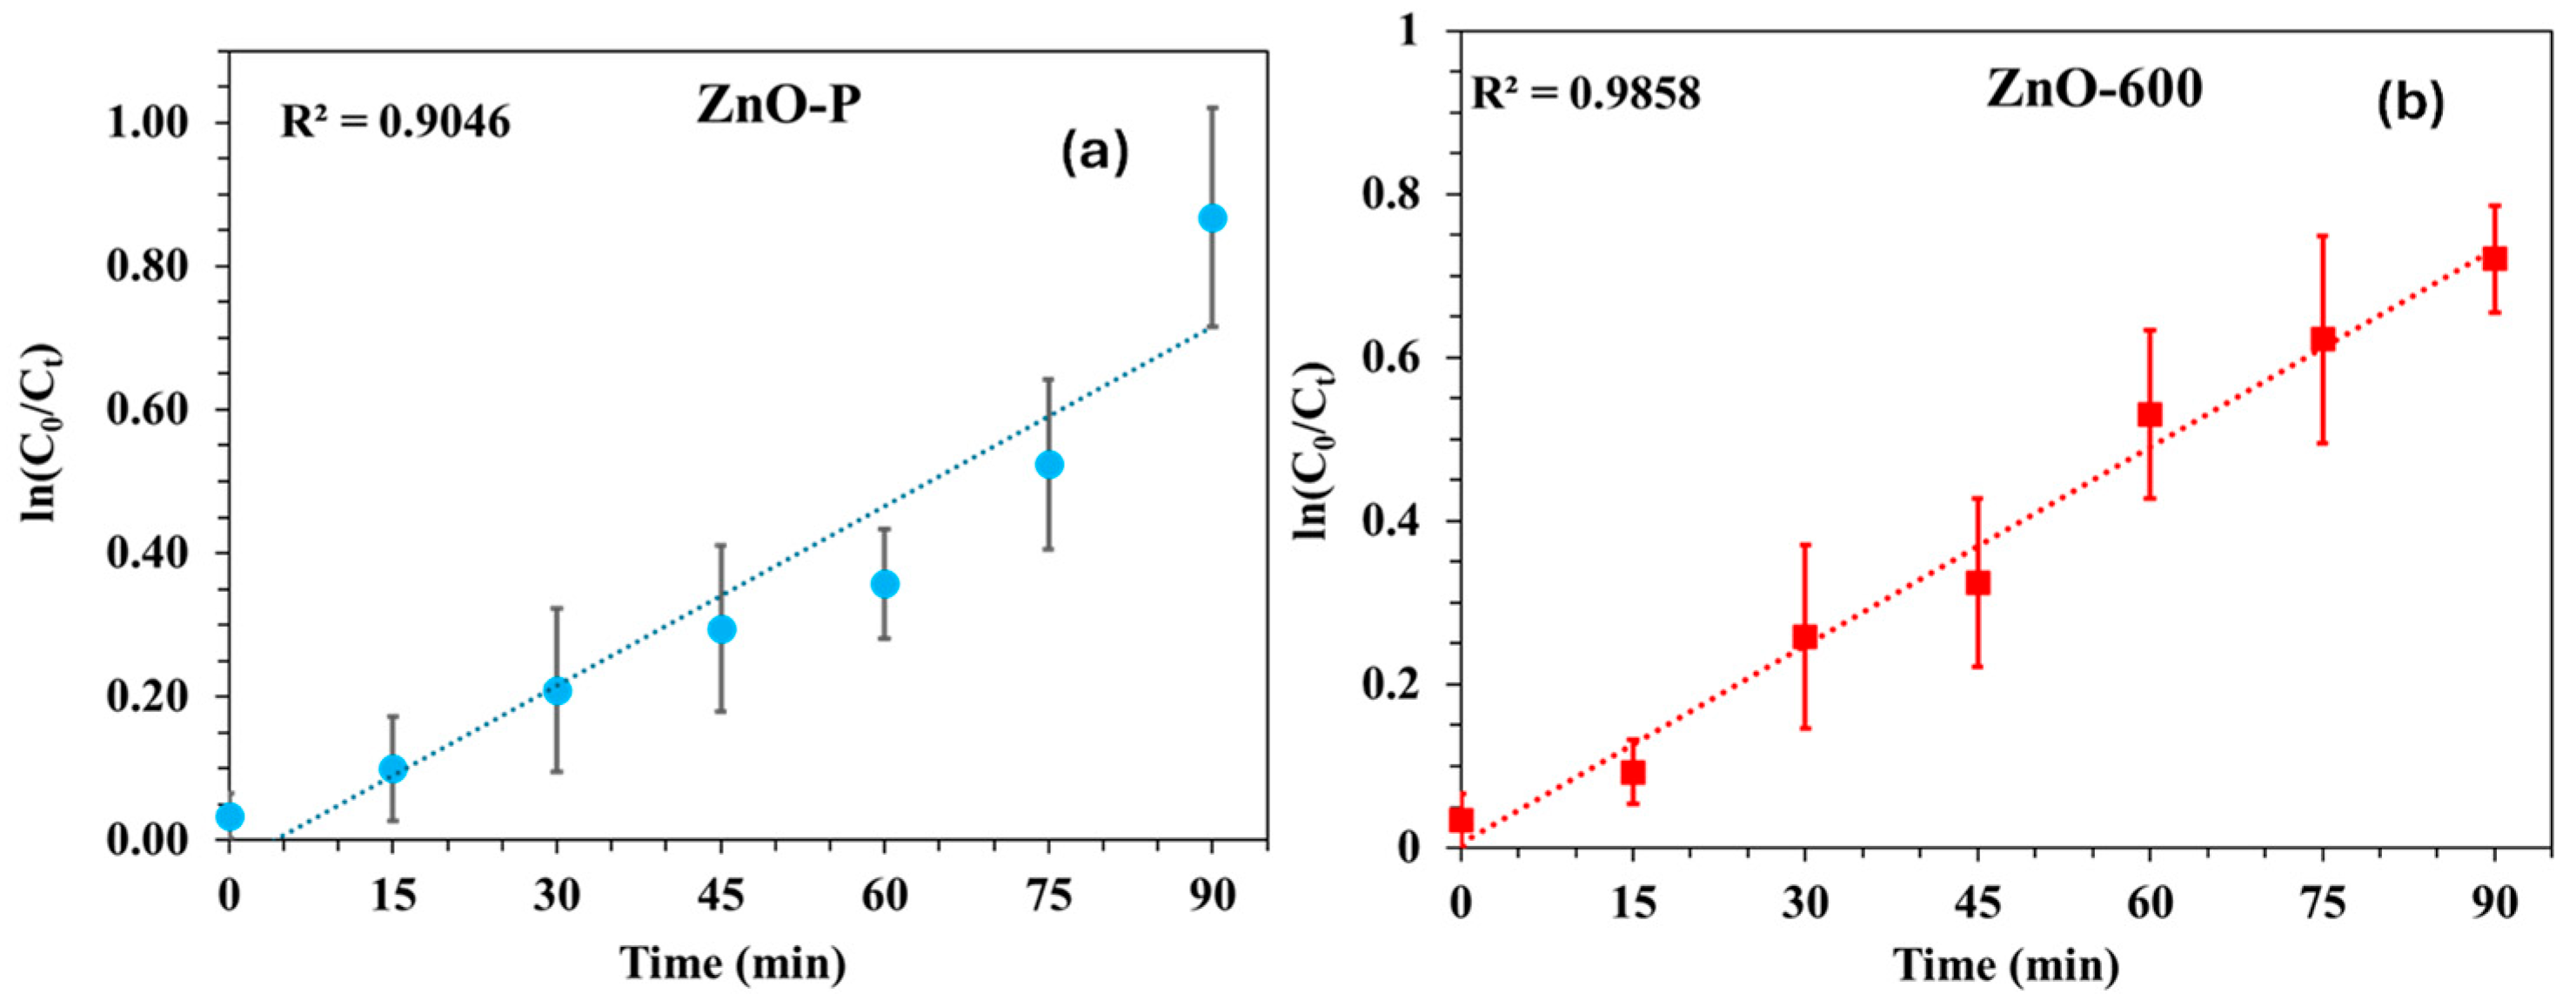
3.3. Kinetics Studies

The reaction kinetics were analyzed for both ZnO-P and ZnO-600, as shown in Figure 11. The kinetic plots of the dyes display linear trends, indicating that the degradation follows pseudo-first-order kinetics. Notably, ZnO-P exhibited superior degradation performance, with a rate constant (k) of 0.011 min−1—significantly higher than that of ZnO-600, which was 0.008 min−1. Since the rate constant reflects the speed of degradation, a higher value of k indicates faster dye degradation [41]. This enhancement in performance is attributed to plasma-induced surface defects in ZnO-P, which promote more efficient charge carrier separation and increase the number of active sites. While ZnO-P achieved faster degradation, ZnO-600 demonstrated better kinetic consistency and fitting, suggesting greater stability in its photocatalytic behavior.
These results clearly demonstrate that synthesis conditions critically influence photocatalytic performance: plasma treatment enhances reaction rates, whereas calcination improves kinetic reliability. Despite ZnO-P’s slightly poorer kinetic fitting, its significantly higher rate constant makes it more effective for crystal violet (CV) degradation—highlighting the advantage of plasma surface modification in wastewater treatment applications [42].

4. Conclusions

ZnO synthesized via a plasma-assisted method was shown to have greater photocatalytic activity in degrading organic contaminants than conventional ZnO. The improved performance was attributed to the action of plasma, which resulted in ZnO with greater crystallinity, a reduced band gap, controlled particle development, and smaller particle size. Several variables contributed to the enhanced degradation of CV dye by plasma-synthesized ZnO (ZnO-P), including a greater density of surface hydroxyl groups, the formation of reactive species by plasma discharge on the material surface, and nitrogen incorporation into the ZnO lattice. Furthermore, the degradation of CV by ZnO-P provided insight into the recombination behavior of charge carriers in the plasma-synthesized material. ZnO-P showed better removal efficiency even after five cycles of degradation. These findings demonstrate that the non-thermal plasma discharge can be utilized to synthesize a ZnO catalyst and could be used for water treatment and various environmental applications.

Author Contributions

H.M.: writing—original draft, investigation. S.M.: formal analysis, review and editing. N.B.: writing—review and editing. S.L.: writing—review and editing, supervision, project administration, methodology, funding acquisition, conceptualization. All authors have read and agreed to the published version of the manuscript.

Funding

The authors greatly acknowledge the financial support of the Science & Engineering Research Board, Department of Science & Technology, Government of India (SERB, File No. ECR/2016/001457).

Institutional Review Board Statement

Not applicable.

Informed Consent Statement

Not applicable.

Data Availability Statement

The original contributions presented in this study are included in the article. Further inquiries can be directed to the corresponding author.

Acknowledgments

We acknowledge SRMIST for the high-resolution scanning electron microscope (HRSEM) facility. We acknowledge Nanotechnology Research Centre (NRC) and SRMIST for providing the research facilities.

Conflicts of Interest

The authors declare that they have no competing financial interests or personal relationships that could have appeared to influence the work reported in this paper.

References

  1. da Silva, G.T.; Carvalho, K.T.; Lopes, O.F.; Gomes, E.S.; Malagutti, A.R.; Mastelaro, V.R.; Mourão, H.A. Synthesis of ZnO nanoparticles assisted by N sources and their application in the photodegradation of organic contaminants. ChemCatChem 2017, 9, 3795–3804. [Google Scholar]
  2. Carvalho, K.T.; Fidelis, S.C.; Lopes, O.F.; Ribeiro, C. Effect of processing variables on the photocatalytic properties of ZnO thin films prepared using the polymeric precursor method. Ceram. Int. 2015, 41, 10587–10594. [Google Scholar]
  3. Russo, M.; Iervolino, G.; Vaiano, V.; Palma, V. Non-thermal plasma coupled with catalyst for the degradation of water pollutants: A review. Catalysts 2020, 10, 1438. [Google Scholar] [CrossRef]
  4. Mohan, H.; Mohandoss, S.; Prakash, A.; Balasubramaniyan, N.; Loganathan, S.; Assadi, A.A.; Khacef, A. Cold plasma assisted synthesis of spinel-CoFe2O4 nanoparticle with narrow bandgap and high magnetic activity. Inorg. Chem. Commun. 2024, 167, 112754. [Google Scholar]
  5. Mohandoss, S.; Mohan, H.; Balasubramaniyan, N.; Assadi, A.A.; Loganathan, S. Pearl Millet seed surface modification and improved germination by non-thermal plasma discharge: Understanding the role of reactive species. Plasma Chem. Plasma Process. 2024, 44, 1031–1051. [Google Scholar]
  6. Chen, H.; Mu, Y.; Shao, Y.; Chansai, S.; Xu, S.; Stere, C.E.; Xiang, H.; Zhang, R.; Jiao, Y.; Hardacre, C.; et al. Coupling non-thermal plasma with Ni catalysts supported on BETA zeolite for catalytic CO2 methanation. Catal. Sci. Technol. 2019, 9, 4135–4145. [Google Scholar]
  7. Joshi, N.; Loganathan, S. Cold Plasma Techniques for Sustainable Material Synthesis and Climate Change Mitigation: A Review. Catalysts 2024, 14, 802. [Google Scholar] [CrossRef]
  8. Bjelajac, A.; Petrovic, R.; Stefanovic, M.; Phillipe, A.M.; Fleming, Y.; Guillot, J.; Chemin, J.-B.; Choquet, P.; Kadok, J.; Bulou, S. Au nanoparticle decoration of nanoparticular and nanotubular TiO2 using atmospheric pressure cold plasma for photocatalytic applications. Catal. Sci. Technol. 2024, 14, 5342–5351. [Google Scholar]
  9. Qi, X.F.; Zhang, F.; Chen, Z.P.; Chen, X.; Jia, M.C.; Ji, H.F.; Shi, Z.F. Hydrothermal synthesis of stable lead-free Cs4MnBi2Cl12 perovskite single crystals for efficient photocatalytic degradation of organic pollutants. J. Mater. Chem. C 2023, 11, 3715–3725. [Google Scholar]
  10. Bhat, S.V.; Deepak, F.L. Tuning the bandgap of ZnO by substitution with Mn2+, Co2+ and Ni2+. Solid State Commun. 2005, 135, 345–347. [Google Scholar]
  11. Raha, S.; Ahmaruzzaman, M. ZnO nanostructured materials and their potential applications: Progress, challenges and perspectives. Nanoscale Adv. 2022, 4, 1868–1925. [Google Scholar] [PubMed]
  12. Noman, M.T.; Amor, N.; Petru, M. Synthesis and applications of ZnO nanostructures (ZONSs): A review. Crit. Rev. Solid State Mater. Sci. 2022, 47, 99–141. [Google Scholar] [CrossRef]
  13. Hewlett, R.M.; McLachlan, M.A. Surface structure modification of ZnO and the impact on electronic properties. Adv. Mater. 2016, 28, 3893–3921. [Google Scholar] [PubMed]
  14. Sedaghat, S.; Kasi, V.; Nejati, S.; Krishnakumar, A.; Rahimi, R. Improved performance of printed electrochemical sensors via cold atmospheric plasma surface modification. J. Mater. Chem. C 2022, 10, 10562–10573. [Google Scholar]
  15. Yadawa, Y.; Jha, D.; Joshi, N. Cost-effective efficient materials for dye degradation using non-aqueous sol–gel route. Environ. Sci. Pollut. Res. 2024, 31, 740–756. [Google Scholar]
  16. Puneetha, J.; Kottam, N.; Rathna, A. Investigation of photocatalytic degradation of crystal violet and its correlation with bandgap in ZnO and ZnO/GO nanohybrid. Inorg. Chem. Commun. 2021, 125, 108460. [Google Scholar]
  17. Kotresh, M.G.; Patil, M.K.; Inamdar, S.R. Reaction temperature-based synthesis of ZnO nanoparticles using co-precipitation method: Detailed structural and optical characterization. Optik 2021, 243, 167506. [Google Scholar] [CrossRef]
  18. Tzvetkov, G.; Tsvetkov, M.; Mihaylov, L.; Spassov, T. Ultrasound-assisted vs traditional wet-chemical method to fabricate ZnO/ε-Zn (OH)2 nanocomposites. Compos. Commun. 2024, 49, 101983. [Google Scholar]
  19. Wang, Z.; Zhang, Y.; Neyts, E.C.; Cao, X.; Zhang, X.; Jang, B.W.L.; Liu, C.J. Catalyst preparation with plasmas: How does it work? ACS Catal. 2018, 8, 2093–2110. [Google Scholar]
  20. Vekselman, V.; Raitses, Y.; Shneider, M.N. Growth of nanoparticles in dynamic plasma. Phys. Rev. E 2019, 99, 063205. [Google Scholar]
  21. Zhou, J.; Wei, T.; An, X. Combining non-thermal plasma technology with photocatalysis: A critical review. Phys. Chem. Chem. Phys. 2023, 25, 1538–1545. [Google Scholar] [CrossRef] [PubMed]
  22. Nunomura, S. A review of plasma-induced defects: Detection, kinetics and advanced management. J. Phys. D Appl. Phys. 2023, 56, 363002. [Google Scholar] [CrossRef]
  23. Liu, H.; Hu, Y.; Zhang, Z.; Liu, X.; Jia, H.; Xu, B. Synthesis of spherical Ag/ZnO heterostructural composites with excellent photocatalytic activity under visible light and UV irradiation. Appl. Surf. Sci. 2015, 355, 644–652. [Google Scholar] [CrossRef]
  24. Sone, B.T.; Makamu, E.; Mohamed, H.E.A.; Oputu, O.; Fester, V. Green-synthesized ZnO via Hyphaene thebaica fruit extracts: Structure & catalytic effect on the Ozonation of Coralene Rubine-S2G azo disperse dye. Environ. Nanotechnol. Monit. Manag. 2021, 16, 100515. [Google Scholar]
  25. Messai, R.; Ferhat, M.F.; Belmekki, B.; Alam, M.W.; Al-Othoum, M.A.S.; Sadaf, S. GAD plasma-assisted synthesis of ZnO nanoparticles and their photocatalytic activity. Mater. Res. Express 2024, 11, 015006. [Google Scholar] [CrossRef]
  26. Reddy, N.K.; Devika, M.; Hahn, Y.B. Excellent enhancement in the device performance of nitrogen plasma treated ZnO nanorods based diodes. Nano Converg. 2014, 1, 26. [Google Scholar] [CrossRef]
  27. Di, L.; Zhang, J.; Zhang, X.; Wang, H.; Li, H.; Li, Y.; Bu, D. Cold plasma treatment of catalytic materials: A review. J. Phys. D Appl. Phys. 2021, 54, 333001. [Google Scholar] [CrossRef]
  28. Liu, Y.; Zhang, Q.; Xu, M.; Yuan, H.; Chen, Y.; Zhang, J.; Luo, K.; Zhang, J.; You, B. Novel and efficient synthesis of Ag-ZnO nanoparticles for the sunlight-induced photocatalytic degradation. Appl. Surf. Sci. 2019, 476, 632–640. [Google Scholar] [CrossRef]
  29. Klok, L.A.; Steffen, T.T.; Sabedra, H.R.; Fontana, L.C.; Hammer, P.; Marega, F.M.; Costa, L.C.; Pessan, L.A.; Becker, D. ZnO surface modification with maleic anhydride using plasma treatment. Plasma Process. Polym. 2024, 21, 2300165. [Google Scholar] [CrossRef]
  30. Muhammad, B.L.; Cummings, F. Nitrogen plasma irradiation of Fe doped ZnO nanowire arrays for improved optical properties. Mater. Today Proc. 2021, 36, 383–389. [Google Scholar] [CrossRef]
  31. Ananth, A.; Dharaneedharan, S.; Seo, H.J.; Heo, M.S.; Boo, J.H. Soft jet plasma-assisted synthesis of Zinc oxide nanomaterials: Morphology controls and antibacterial activity of ZnO. Chem. Eng. J. 2017, 322, 742–751. [Google Scholar] [CrossRef]
  32. Zhang, Y.; Xia, Y.; Wang, L.; Cheng, B.; Yu, J. Influence of calcination temperature on photocatalytic H2O2 productivity of hierarchical porous ZnO microspheres. Nanotechnology 2021, 32, 415402. [Google Scholar] [CrossRef] [PubMed]
  33. Camarda, P.; Messina, F.; Vaccaro, L.; Agnello, S.; Buscarino, G.; Schneider, R.; Popescu, R.; Gerthsen, D.; Lorenzi, R.; Gelardi, F.M.; et al. Luminescence mechanisms of defective ZnO nanoparticles. Phys. Chem. Chem. Phys. 2016, 18, 16237–16244. [Google Scholar] [CrossRef]
  34. Knust, S.; Ruhm, L.; Kuhlmann, A.; Meinderink, D.; Bürger, J.; Lindner, J.K.; de los Arcos de Pedro, M.T.; Grundmeier, G. In situ backside Raman spectroscopy of zinc oxide nanorods in an atmospheric-pressure dielectric barrier discharge plasma. J. Raman Spectrosc. 2021, 52, 1237–1245. [Google Scholar] [CrossRef]
  35. Dong, J.J.; Zhang, X.W.; You, J.B.; Cai, P.F.; Yin, Z.G.; An, Q.; Ma, X.B.; Jin, P.; Wang, Z.G.; Chu, P.K. Effects of hydrogen plasma treatment on the electrical and optical properties of ZnO films: Identification of hydrogen donors in ZnO. ACS Appl. Mater. Interfaces 2010, 2, 1780–1784. [Google Scholar] [CrossRef]
  36. Wang, D.; Zhao, D.; Wang, F.; Yao, B.; Shen, D. Nitrogen-doped ZnO obtained by nitrogen plasma treatment. Phys. Status Solidi a 2015, 212, 846–850. [Google Scholar] [CrossRef]
  37. Nandi, P.; Das, D. Photocatalytic degradation of Rhodamine-B dye by stable ZnO nanostructures with different calcination temperature induced defects. Appl. Surf. Sci. 2019, 465, 546–556. [Google Scholar] [CrossRef]
  38. Cuscó, R.; Alarcón-Lladó, E.; Ibáñez, J.; Artús, L.; Jiménez, J.; Wang, B.; Callahan, M.J. Temperature dependence of Raman scattering in ZnO. Phys. Rev. B—Condens. Matter Mater. Phys. 2007, 75, 165202. [Google Scholar] [CrossRef]
  39. Al-Hada, N.M.; Saion, E.B.; Shaari, A.H.; Kamarudin, M.A.; Flaifel, M.H.; Ahmad, S.H.; Gene, S.A. A facile thermal-treatment route to synthesize ZnO nanosheets and effect of calcination temperature. PLoS ONE 2014, 9, e103134. [Google Scholar] [CrossRef]
  40. Lee, H.U.; Lee, Y.C.; Lee, S.C.; Park, S.Y.; Son, B.; Lee, J.W.; Lim, C.-H.; Choi, C.-J.; Choi, M.-H.; Lee, S.Y.; et al. Visible-light-responsive bicrystalline (anatase/brookite) nanoporous nitrogen-doped TiO2 photocatalysts by plasma treatment. Chem. Eng. J. 2014, 254, 268–275. [Google Scholar] [CrossRef]
  41. Bhat, A.H.; Chopan, N.A.; Chisti, H.-T.-N. Enhanced photocatalytic degradation of crystal violet dye and high-performance electrochemical supercapacitor applications of hydrothermally synthesised magnetic bifunctional nanocomposite (Fe3O4/ZnO). Nanotechnology 2023, 34, 495604. [Google Scholar] [CrossRef] [PubMed]
  42. Wang, Y.; Yang, C.; Liu, Y.; Fan, Y.; Dang, F.; Qiu, Y.; Zhou, H.; Wang, W.; Liu, Y. Solvothermal synthesis of ZnO nanoparticles for photocatalytic degradation of methyl orange and p-nitrophenol. Water 2021, 13, 3224. [Google Scholar] [CrossRef]
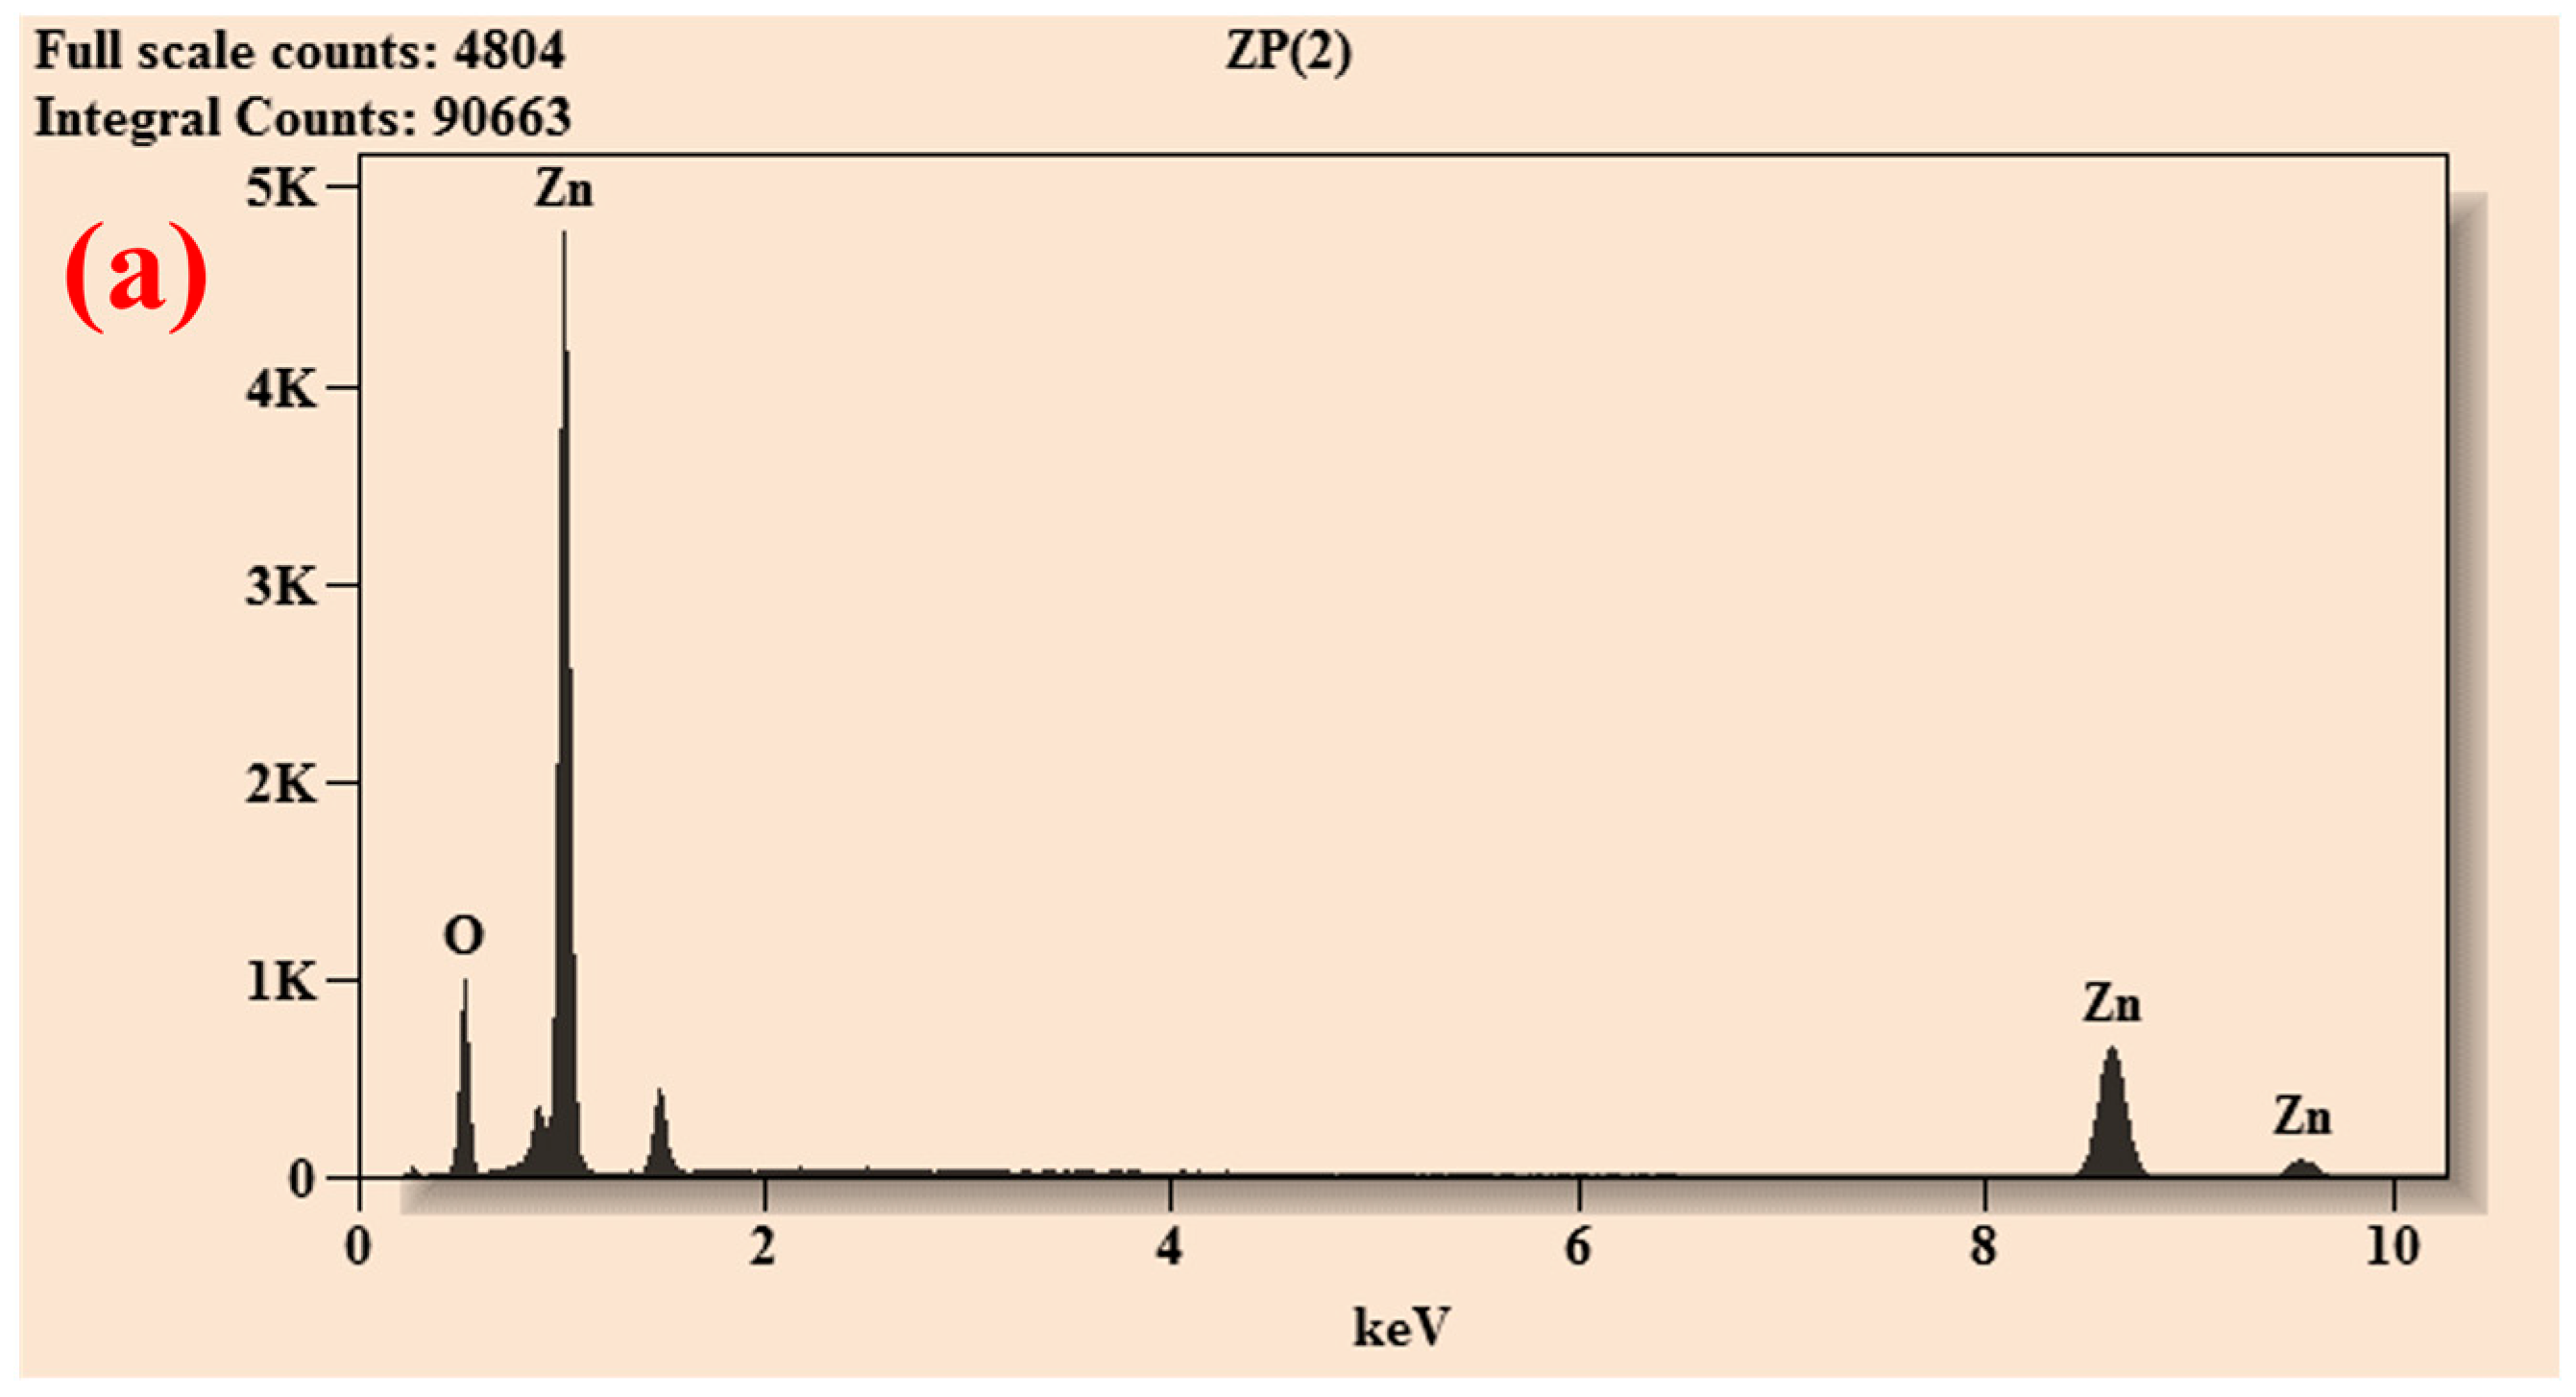
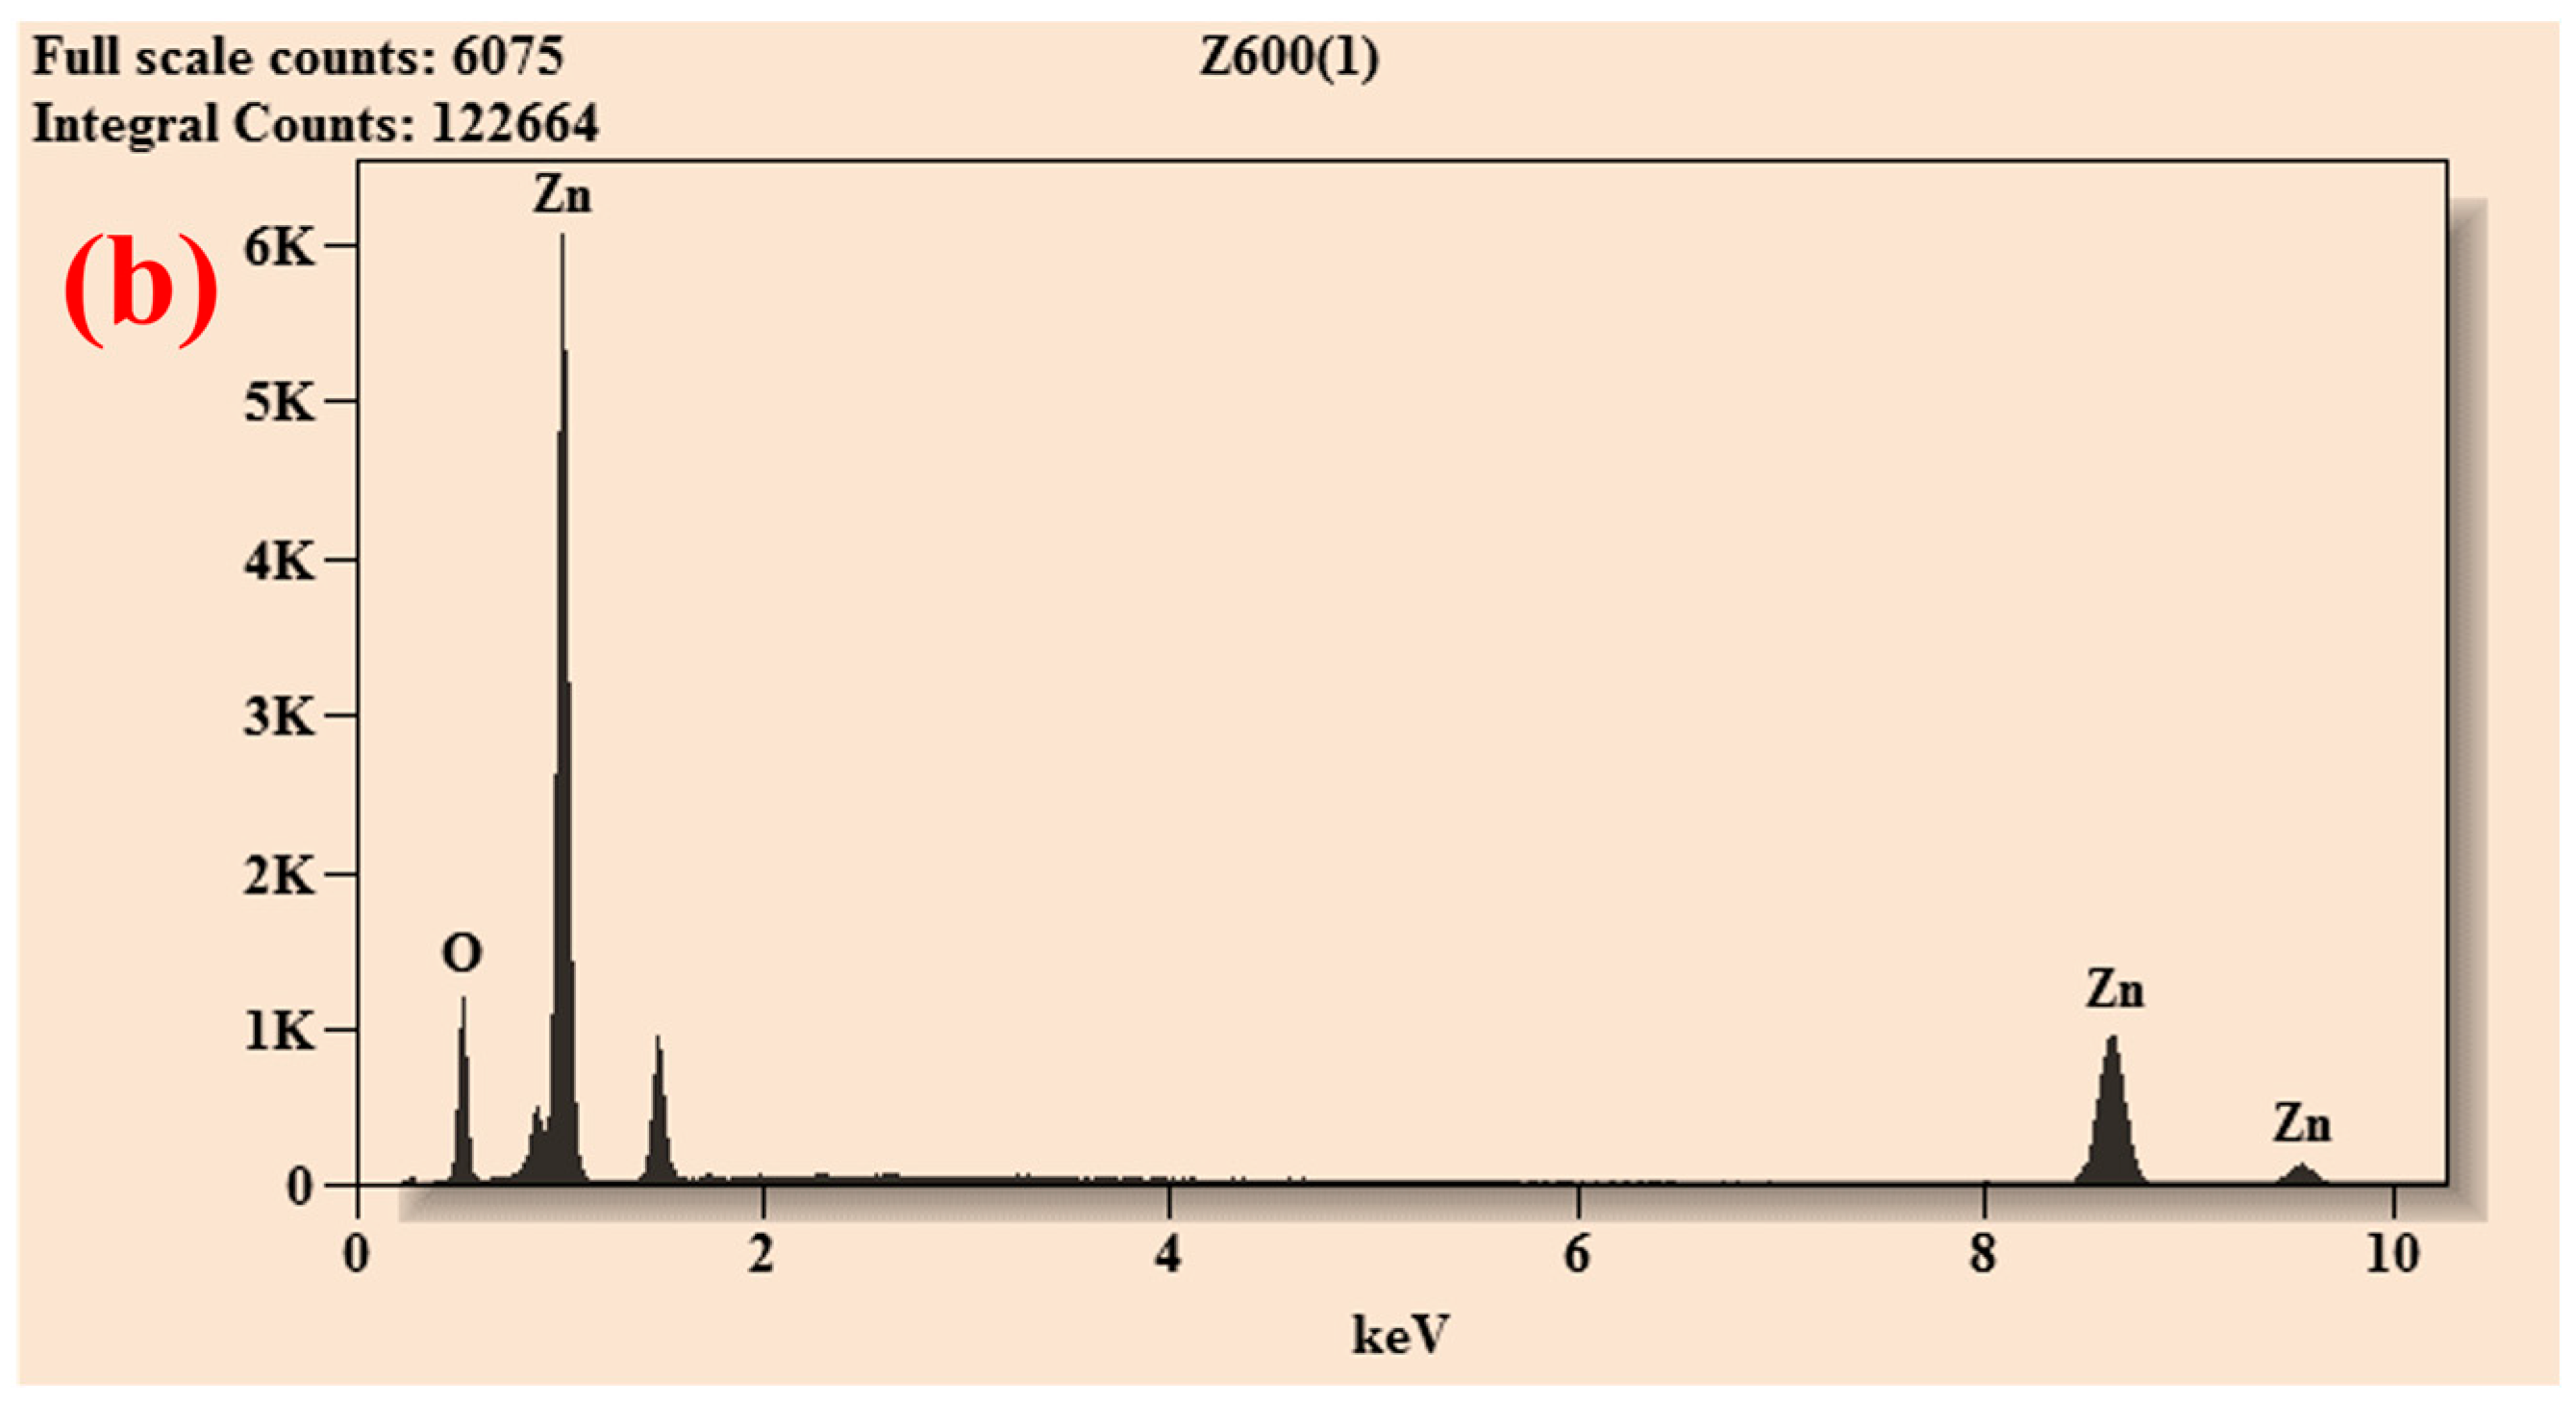
Figure 1. Schematic diagram of the experimental setup.
Plasma 08 00025 g001
Figure 2. XRD analysis of ZnO-P and ZnO-600.
Plasma 08 00025 g002
Figure 3. Surface morphology of the plasma synthesized and calcined materials: plasma-treated material (a) TEM image, (b) particle size distribution, (c) SEAD pattern, and (d) interplanar spacing, and (e) TEM image for ZnO-600, (f) ZnO-600 particle size distribution, (g) ZnO-600 SEAD pattern, and (h) ZnO-600 interplanar spacing.
Plasma 08 00025 g003
Figure 4. SEM images of (a) plasma synthesized material (ZnO-P) and (b) calcined material (ZnO-600).
Plasma 08 00025 g004
Figure 5. EDX analysis of (a) ZnO-P and (b) ZnO-600.
Plasma 08 00025 g05aPlasma 08 00025 g05b
Figure 6. XPS spectra of plasma treatment material (ZnO-P)—(a) full scan, (b) spectra for surface oxygen, and (c) Zn 2p—and for calcined material (ZnO-600)—(d) full scan, (e) surface oxygen spectra, and (f) Zn 2p spectra.
Plasma 08 00025 g006
Figure 7. Raman spectra of ZnO-P (a) and ZnO-600 (b).
Plasma 08 00025 g007
Figure 8. UV-vis DRS and band gap energy (insert) of plasma-treated/synthesized material (a) ZnO-P and thermal calcined (b) ZnO-600.
Plasma 08 00025 g008
Figure 9. Degradation analysis of CV under dark conditions (a), using calcined material ZnO-600 (b), using plasma-treated material ZnO-P (c), and CV removal efficiency (d).
Plasma 08 00025 g009
Figure 10. ZnO-P catalyst reusability: (a) degradation efficiency over five cycles and (b) XRD of ZnO-P after five cycles.
Plasma 08 00025 g010
Figure 11. Pseudo-first-order reaction kinetic linear relationship curves for degradation of CV plot: (a) ZnO-P and (b) ZnO-600.
Plasma 08 00025 g011
Table 1. Chemical composition of ZnO-600 and ZnO-P.
ElementNet CountsWeight%Atom%Atom%
ZnO-600O640520.0150.55±0.66
Zn17,45579.9949.45±0.71
Total100.00100.00
ZnO-PO544122.6854.52±0.76
Zn12,32577.3245.48±0.78
Total100.00100.00
Disclaimer/Publisher’s Note: The statements, opinions and data contained in all publications are solely those of the individual author(s) and contributor(s) and not of MDPI and/or the editor(s). MDPI and/or the editor(s) disclaim responsibility for any injury to people or property resulting from any ideas, methods, instructions or products referred to in the content.

