1. Introduction
Plasma is classified as the fourth state of matter after solid, liquid, and gas. Plasma excitation occurs when sufficient energy is supplied to a gas. Ionized gas is the most abundant observable form of matter in the universe, occurring mostly within stars and nebulas. Its energy is provided by a single source or a combination of electrical, radiation, thermal, or chemical means [
1]. Although, the excitation of plasma mostly occurs due to electrical and thermal energy, plasma is primarily categorized as thermal or non-thermal based on the relative temperatures of its electrons, ions, and neutrals [
2]. In thermal plasma, the electrons, ions, and neutral species are in thermal equilibrium with each other, reaching a temperature of thousands of kelvins or more. It has applications in electronics and heavy industries for welding and cutting, among others [
3]. However, in non-thermal plasma, the energy of the electrons is much higher than that of ions and neutral species, which are close to ambient temperature [
4,
5]. The high temperature of thermal plasma limits its biomedical application. As such, there is a need for non-thermal plasma, cold plasma, or low-temperature plasma (LTP) that is generated within an ambient temperature by the partial ionization of gas. These LTP discharges are generated by the application of a potential difference between a pair of electrodes. LTP has gained increasing attention in the biomedical field due to its potential wide application [
6,
7,
8]. It has the ability to interact with biological systems in a controlled and non-thermal manner [
9].
There are several techniques for generating LTP. Amongst these is dielectric barrier discharge (DBD) plasma, known for its ease of operation [
10,
11,
12]. DBDs are typically operated at atmospheric pressure, and they often occur in air, though they can be operated in other gases as well. The breakdown of atmospheric-pressured gas by an electric field usually occurs in the gap between two metallic conductors separated by a dielectric barrier [
10,
13]. Insulating one of the electrodes (usually the high voltage one) with a dielectric material prevents current build-up, thus creating an electrically safe plasma that can be applied on living tissues without causing thermal damage [
14,
15]. At low-gas heating, DBD plasma produces several chemically active species, including electrons, ions, and radicals, which can influence cellular functions by interacting with biological molecules to induce changes in cellular processes. DBD plasma has been widely studied for its potential application in gas cleaning [
11,
16], surface modification [
17], surface decontamination [
18], and bacterial sterilization [
19]. Additionally, the plasma’s interactions with biological tissues at relatively low temperatures make it suitable for applications involving cell proliferation [
20], wound healing [
21], sterilization [
22], drug delivery [
6], nose-to-brain drug delivery [
23], and cancer treatment [
24] without causing significant tissue damage. DBD plasma has also seen numerous evolving novel applications in the medical field [
25,
26,
27,
28]. In recent years, DBD plasma has been explored for enhancing the delivery of high-molecule drugs across cell membranes by creating temporary pores [
29]. This technique enables drugs to penetrate more easily through a normally impermeable membrane [
30]. However, optimizing plasma parameters to attain a balance between enhancing membrane permeability and maintaining cellular integrity remains a critical challenge, particularly regarding voltage-dependent plasma exposure.
In this study, we introduced a novel spiral-wound DBD plasma device with a unique electrode configuration, designed to enhance interactions between plasma and olfactory dark basal cells (DBC1.2). The DBC1.2 is a nasal cell line. The present study aimed at generating a uniform and efficient plasma discharge to enhance cellular drug uptake while maintaining cellular integrity. The voltage-dependent effects of the plasma discharge generated on the cultured cells were investigated by measuring the membrane permeation of fluorescein isothiocyanate-dextran 70 (FD-70). The molecular weight of this permeation marker is 70 kDa. Cellular integrity based on mitochondria activity, percentages of viable cells, and percentages of early and late apoptotic cells were also investigated. We demonstrated that increasing plasma discharge resulted in an increased permeation of the drug into the cell. In addition, at moderate plasma exposure, the mitochondrial activity and percentages of viable cells increased while those of apoptotic cells decreased. Meanwhile, at higher plasma exposure, viable cells decreased, and apoptotic cells increased in number.
2. Results
2.1. Characteristics of the Spiral-Wound Plasma Electrode
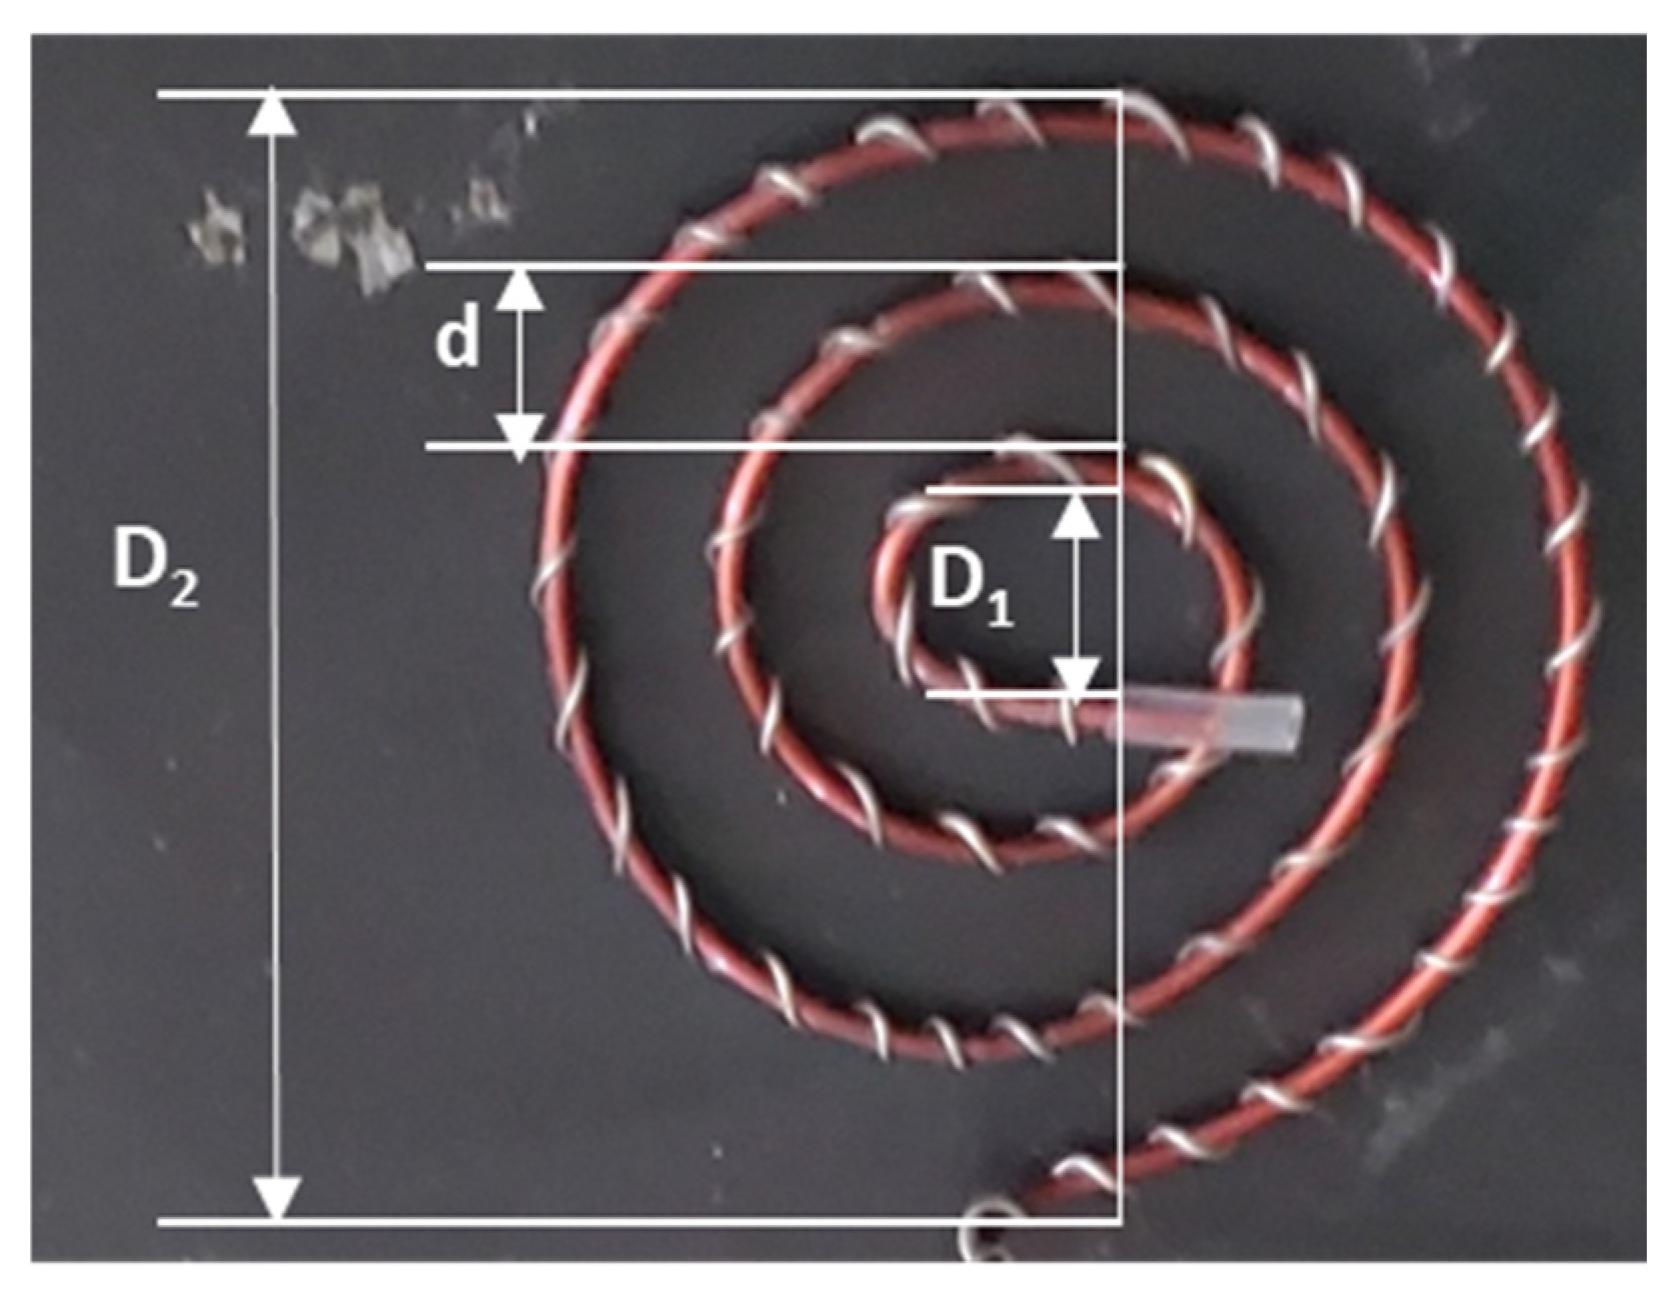
As shown in
Figure 1, the surface area of the spiral-wound plasma device was determined using the following formular for a spiral line:
L= nπ (D1 + D2)/2. According to Y. Hou et al. [
31], outer diameter
D2 of a spiral line is given by
D2 =
D1 + (2
n + 1)
d, where
D1 is the inner diameter (0.7 cm),
n is the number of turns (3 turns), and
d is the distance between two circles (0.7 cm). Substituting these values,
D2 was calculated as 5.6 cm. The DBD plasma device total roll length (
L), calculated from the formular for a spiral line, was 29.688 cm. Consequently, the surface area of the spiral-wound plasma device, calculated by multiplying the total roll length (29.688 cm) by the electrode’s thickness (1.5 mm), was estimated to be 4.453 cm
2.
2.2. Plasma Discharge Characteristics: Voltage-Dependent Variables
For a treatment time of 2 minutes and discharge voltages of 2 kVp-p, 3 kVp-p, and 4 kVp-p, three plasma discharge parameters—discharge power, discharge power density, and plasma dose—were analyzed. The plasma discharge powers obtained using Equation (2) were 2.28 Watts, 5.18 Watts, and 8.68 Watts, respectively. The discharge power density was determined by dividing the plasma discharge power by the plasma device surface area, resulting in values of 0.5 Watts/cm2, 1.1 Watts/cm2, 1.9 Watts/cm2, respectively. The plasma treatment doses, calculated as the product of plasma discharge density and the plasma exposure time, were 61 J/cm2, 139 J/cm2, and 234 J/cm2. These increasing values indicated a higher plasma concentration as the discharge voltage increased.
During plasma treatment, the surface of the culture medium was exposed to plasma discharges consisting of charged species (electrons and ions), uncharged gas species with varying half-life, ultraviolet light, thermal energy, and other reactive components. These plasma species subsequently interacted with the cells in the medium.
2.3. Cell Membrane Permeation of FD-70
Fluorescein isothiocyanate-dextran 70 (FD-70) was used as a model drug to assess the suitability of these techniques for delivering molecules into the cell protoplasts.
Figure 2 shows the permeation of FD-70 through the cell membrane 1–2 h post treatment. The results indicates that FD-70 permeability increased with an increase in discharge voltage.
In the 2 kVp-p treated groups, the permeation of FD-70 was comparable to that of the control groups, indicating an insufficient plasma discharge to enhance drug delivery. However, a noticeable increase in FD-70 uptake was observed at 3 kVp-p, with the highest permeation observed in 4 kVp-p. The increasing trend indicated that increased plasma exposure induced greater membrane distortion, creating pores that facilitated drug uptake. The higher fluorescence intensity in the plasma-treated groups indicated a higher concentration of FD-70 in the cell protoplasts.
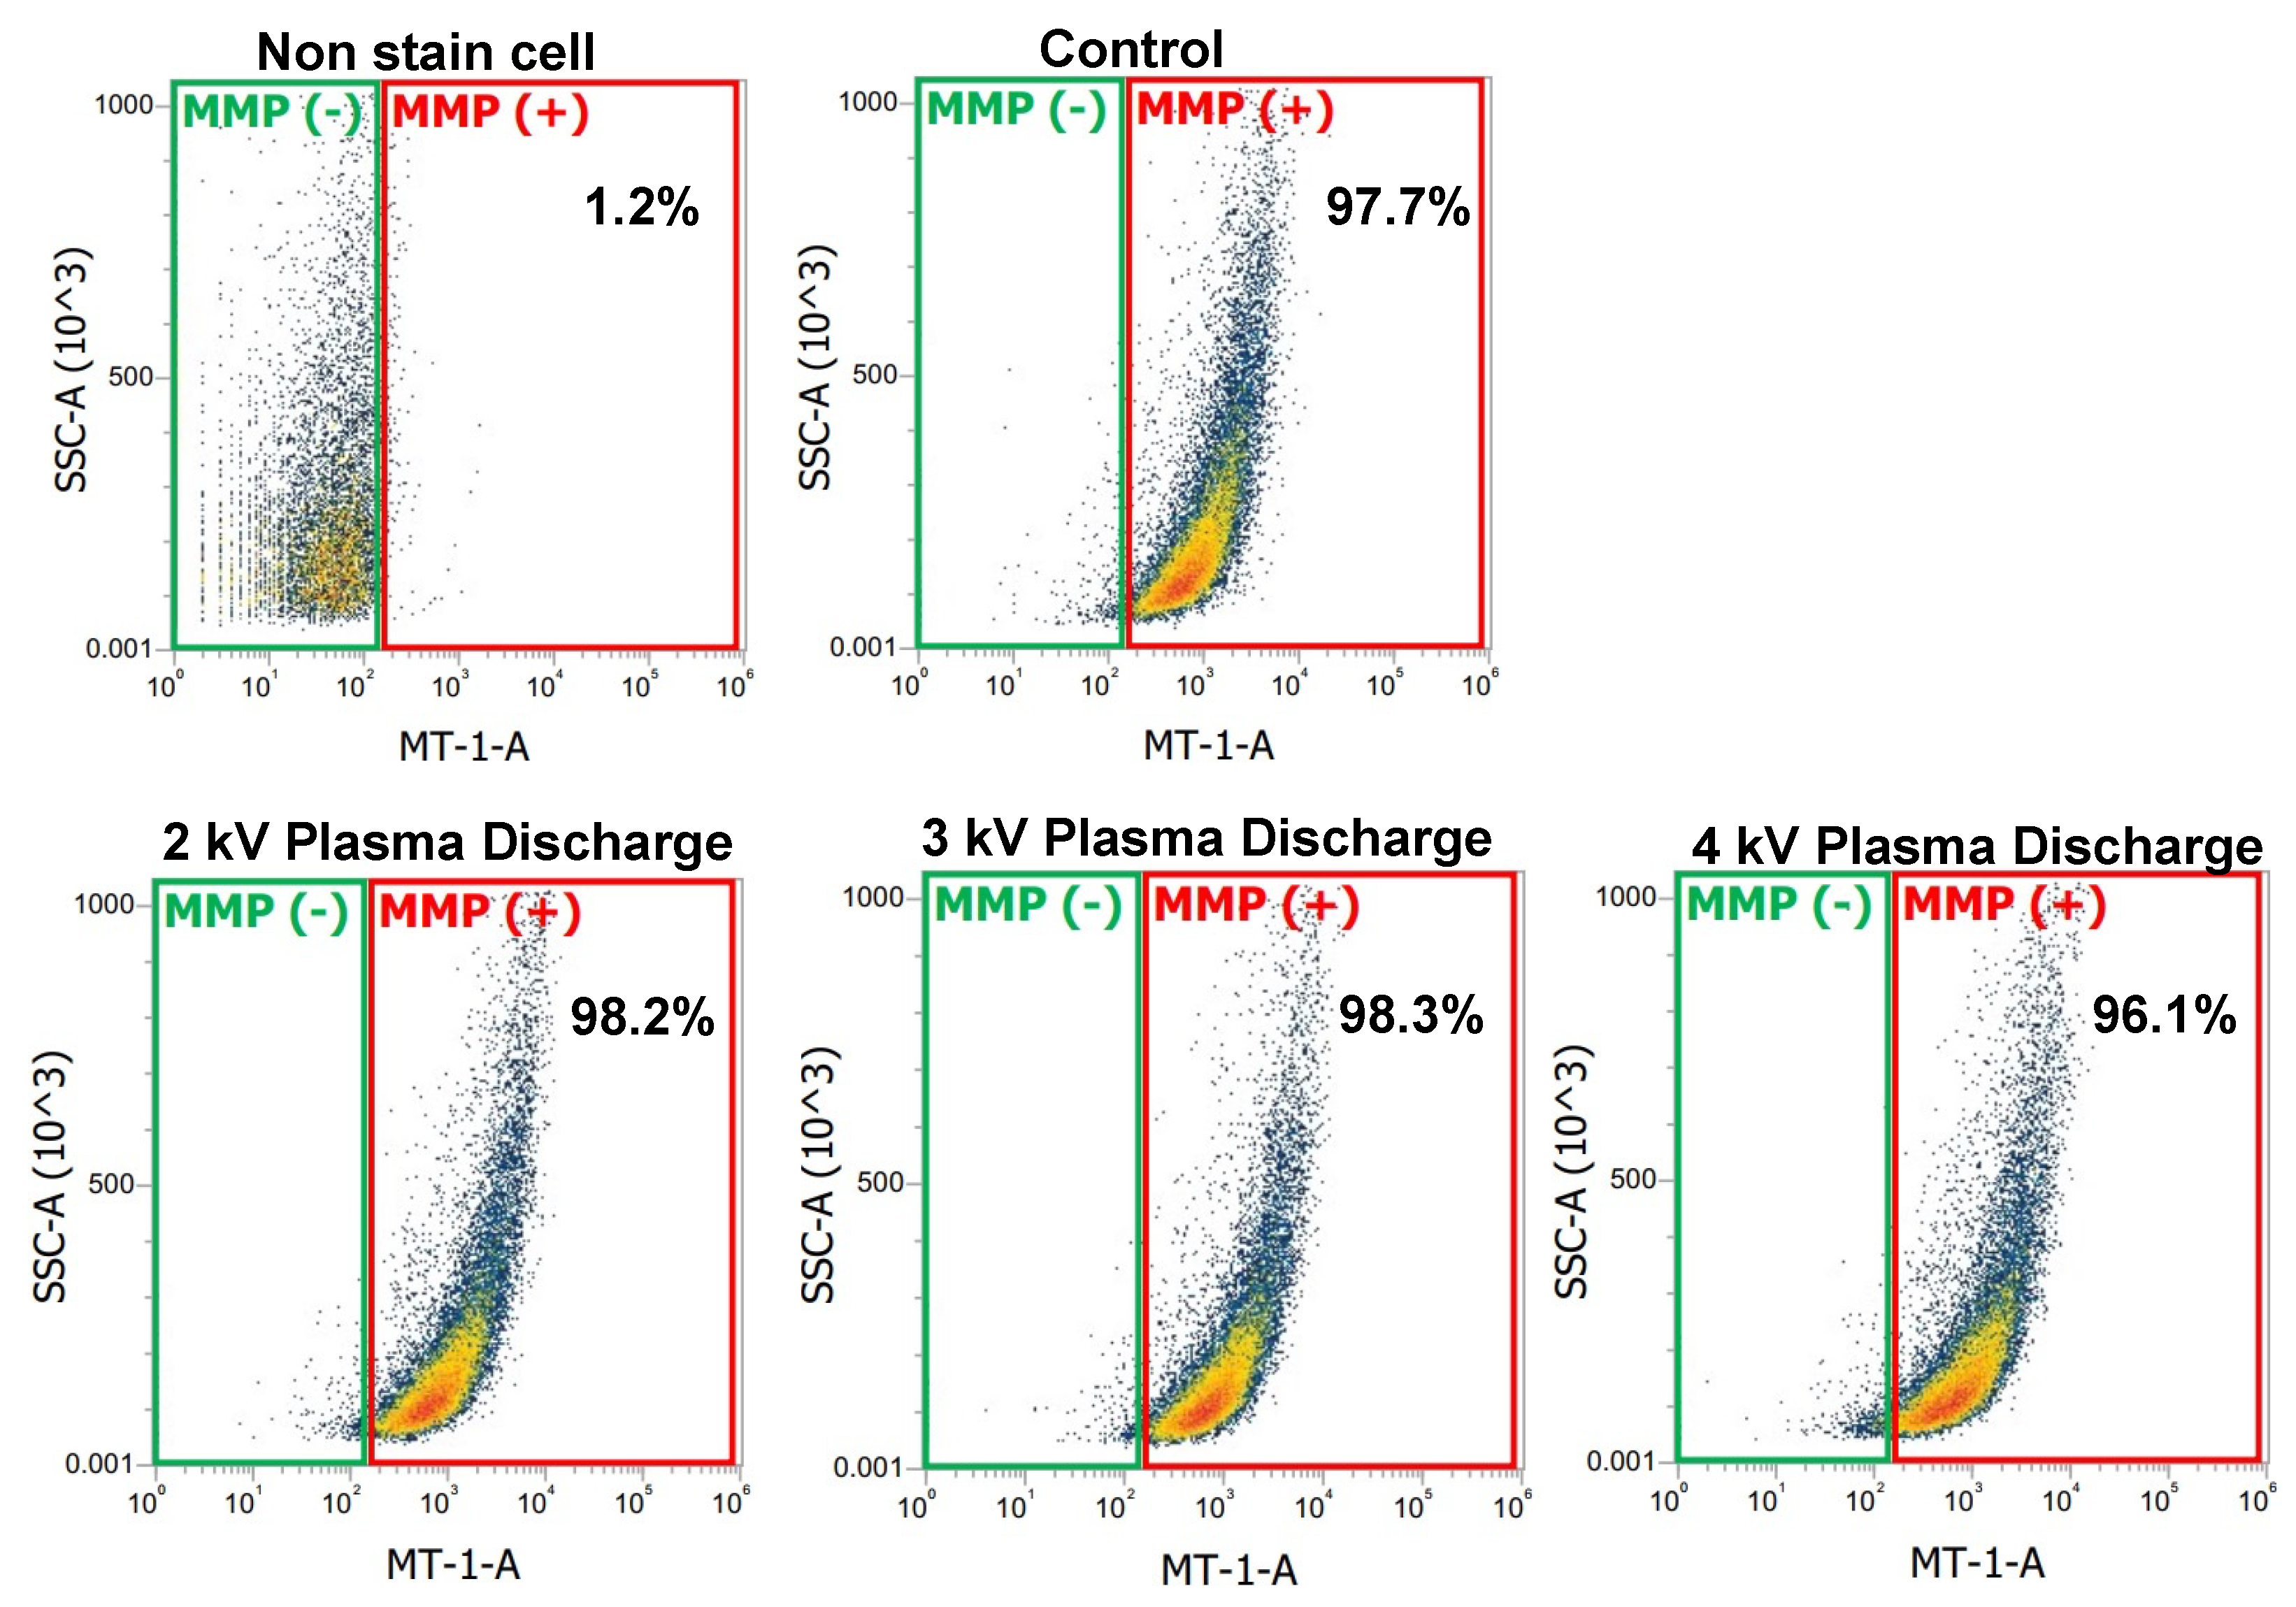
2.4. Mitochondria Membrane Potential (MMP) Detection
Research findings indicates that Mitochondria Membrane Potential (MMP) is a key indicator of mitochondrial health. An increase in MMP signifies a healthy cell with proper cellular function and ATP production, whereas a decrease in MMP often signifies cellular stress, damage, or dysfunction. To evaluate mitochondrial activity, we assessed the DBC1.2 cell line treated with and without plasma discharge.
At 1 hour after incubation and post treatment, cells were measured with flow cytometer.
Figure 3 showed a plot with green and red gates. The red gate represents the percentage of cells stained with the MMP detection kit, indicating mitochondrial activity (MMP+). The higher the percentages in the red gate, the greater the number of cells with mitochondrial activity. The green gate represents the percentage of cells without MMP dye, indicating reduced or inactive mitochondrial activity (MMP−).
In
Figure 3, the negative control (non-stained cells) shows that 1.2% of cells presented mitochondrial activity. In contrast, the control and plasma-treated samples stained with the MMP detection kit showed a significant shift in cell population, confirming successful mitochondrial staining. The control sample had 97.7% cells with active mitochondrial activity, while the plasma-treated samples at 2 kV
p-p and 3 kV
p-p showed a slight increase to 98.2% and 98.3% respectively, signifying metabolically active and healthy cells. However, at 4 kV
p-p, mitochondrial activity decreased to 96.1%, signifying cellular stress.
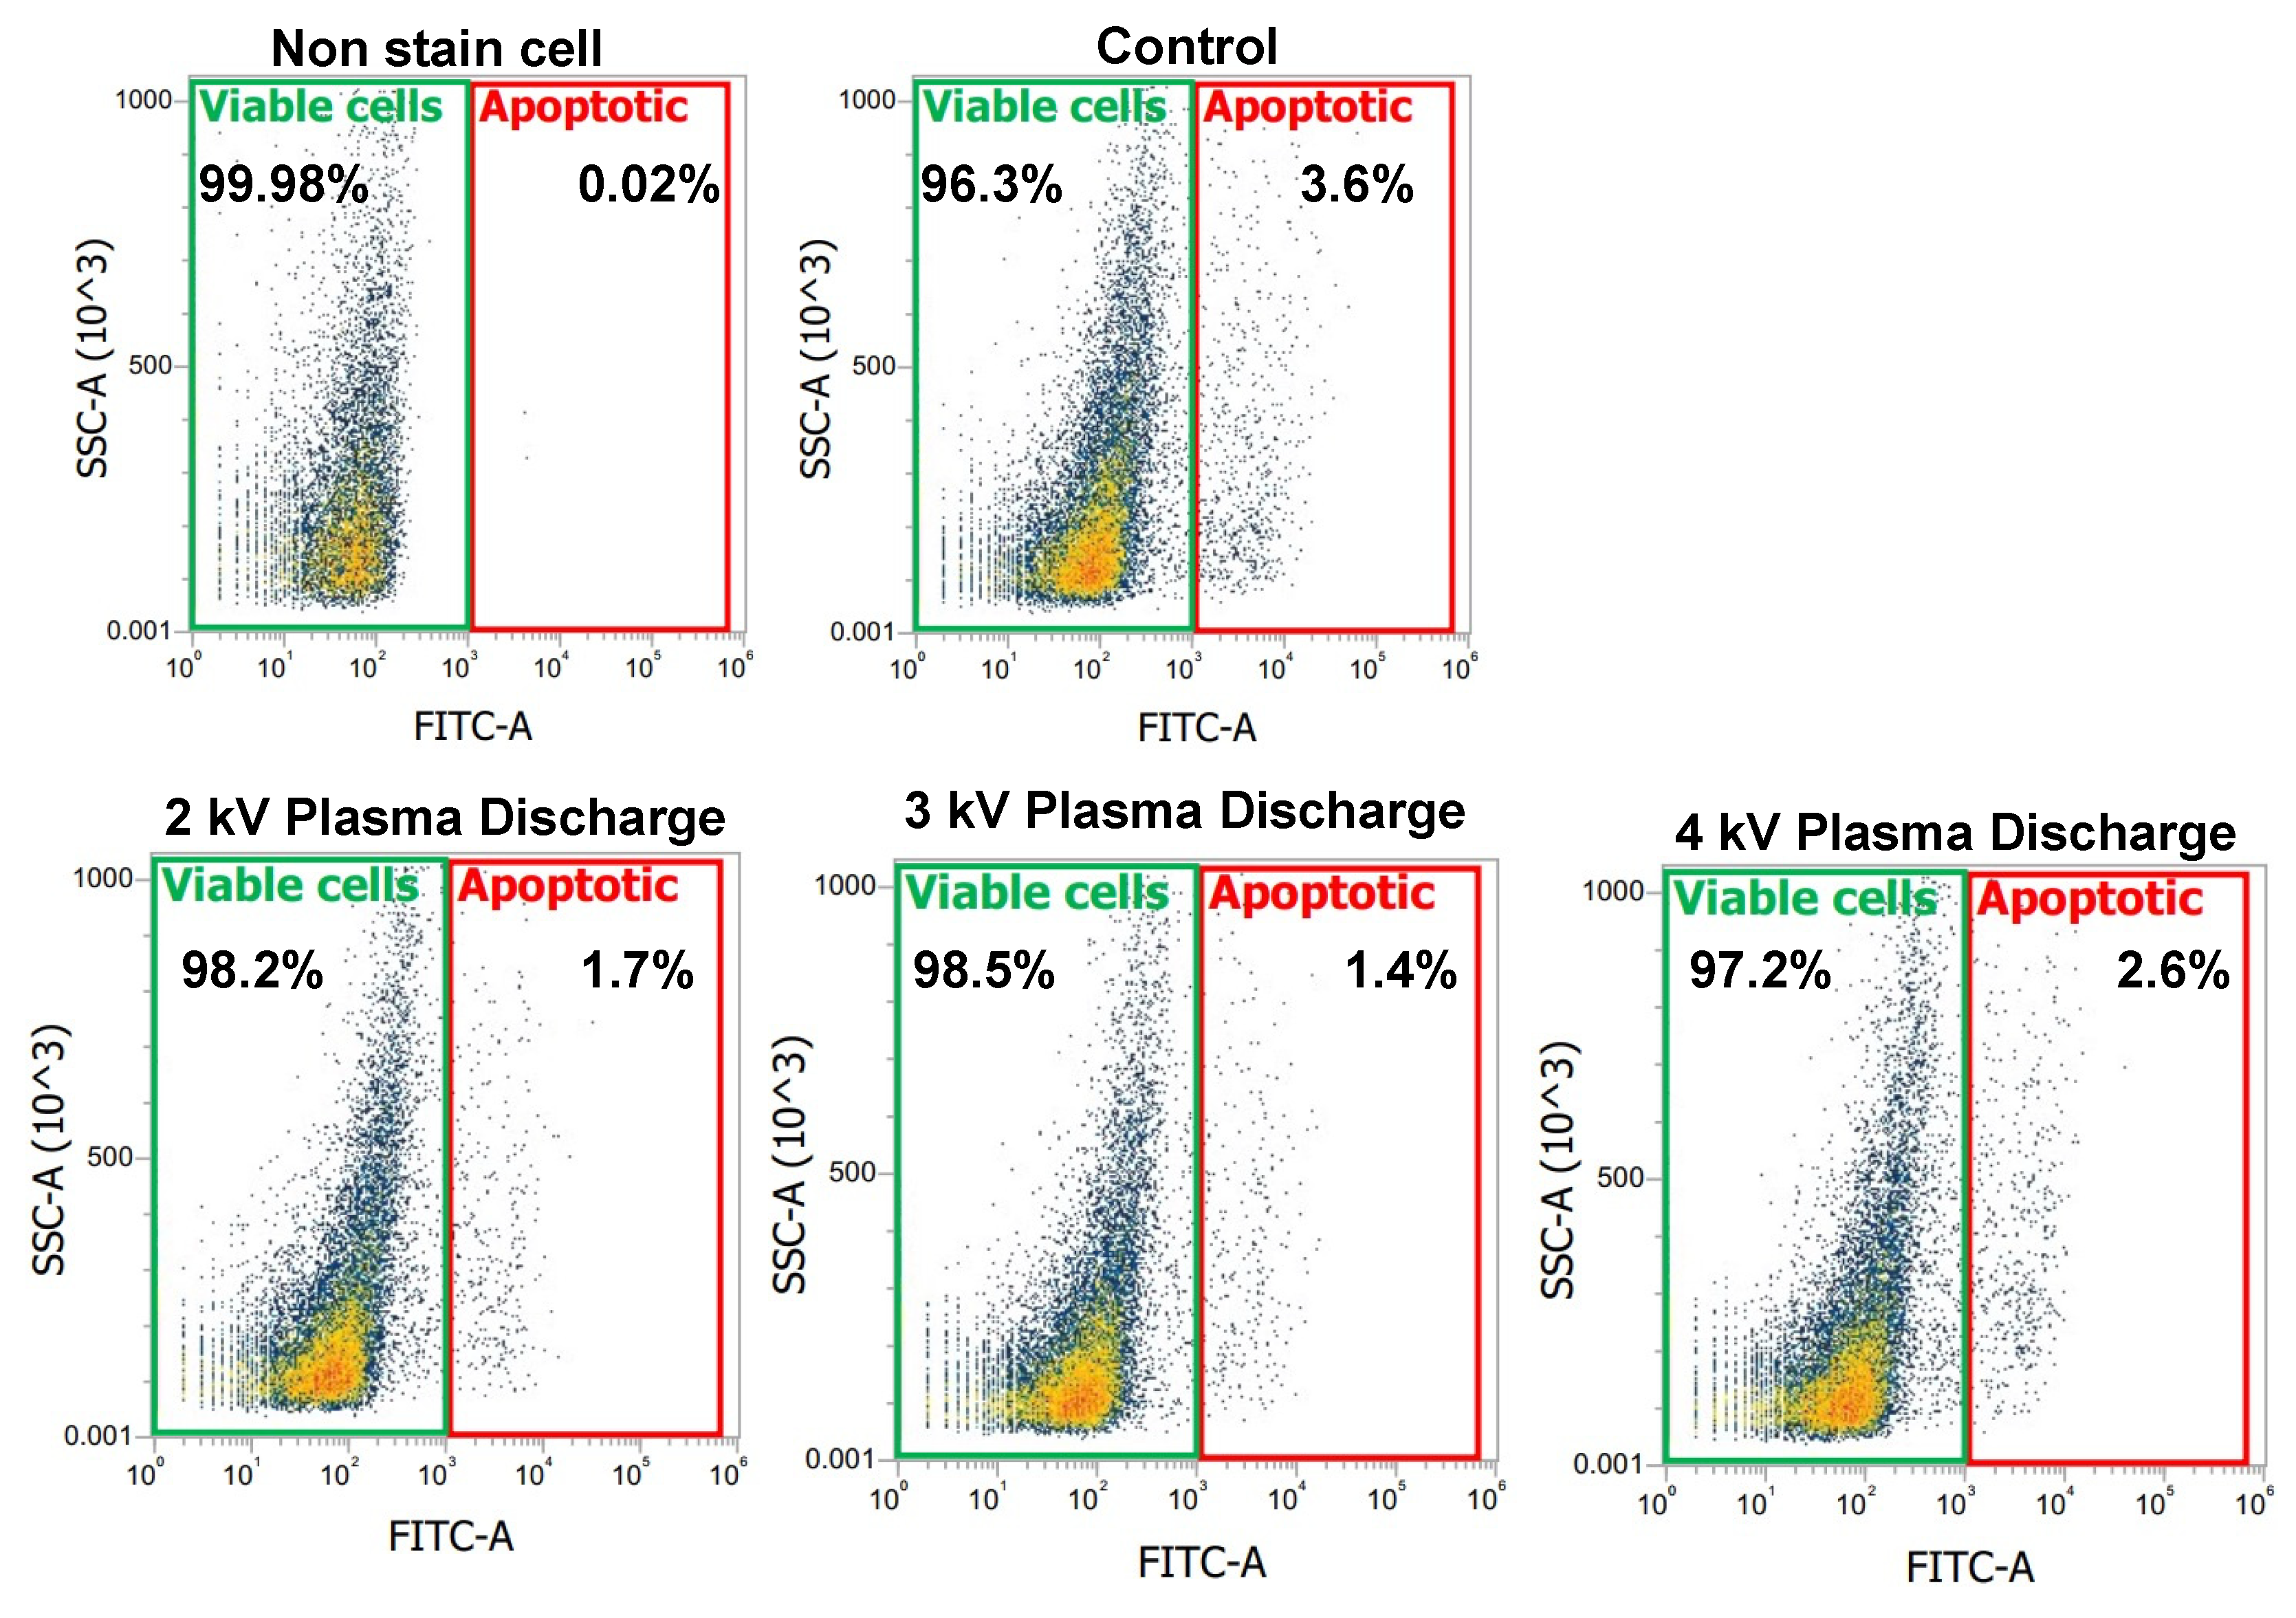
2.5. Measurement of Early Apoptosis by Flow Cytometer
FITC Annexin-V is widely used in flow cytometry to assess membrane integrity and identify early apoptotic cells. Annexin-V binds to phosphatidylserine (PS), which is translocated to the exposed area on the outer leaflet of the cell membrane during early apoptosis, the initial phase of programmed cell death. We assessed the cell membrane integrity by identifying cells undergoing early apoptosis after 1 h incubation post-treatment. Cells were stained with Annexin-V and detected with a flow cytometer.
Figure 4 shows a plot with gates identifying changes in the scattered properties of the cells. The green gate identifies viable cells while the red gate identifies early apoptotic cells. In
Figure 4, the negative control (non-stained cell) showed 0.02% apoptotic cells and 99.98% viable cells. However, in the control and plasma-treated samples stained with Annexin-V, we observed a shift in the cell population. The control samples showed an increase in early apoptotic cells to 3.6%, with a corresponding decrease in viable cells to 96.4%. Comparing the plasma-treated samples to the control, we observed a decrease in apoptotic cells, particularly at 2 kV
p-p (1.7) and 3 kV
p-p (1.4), with viable cells increasing to 98.2% and 98.5% respectively, suggesting that moderate plasma exposure may help maintain cell viability. However, at 4 kV
p-p, early apoptotic cells increased to 2.6%, while viable cells decreased (97.2%), suggesting a threshold beyond which plasma exposure may induce apoptosis rather than promoting cellular integrity.
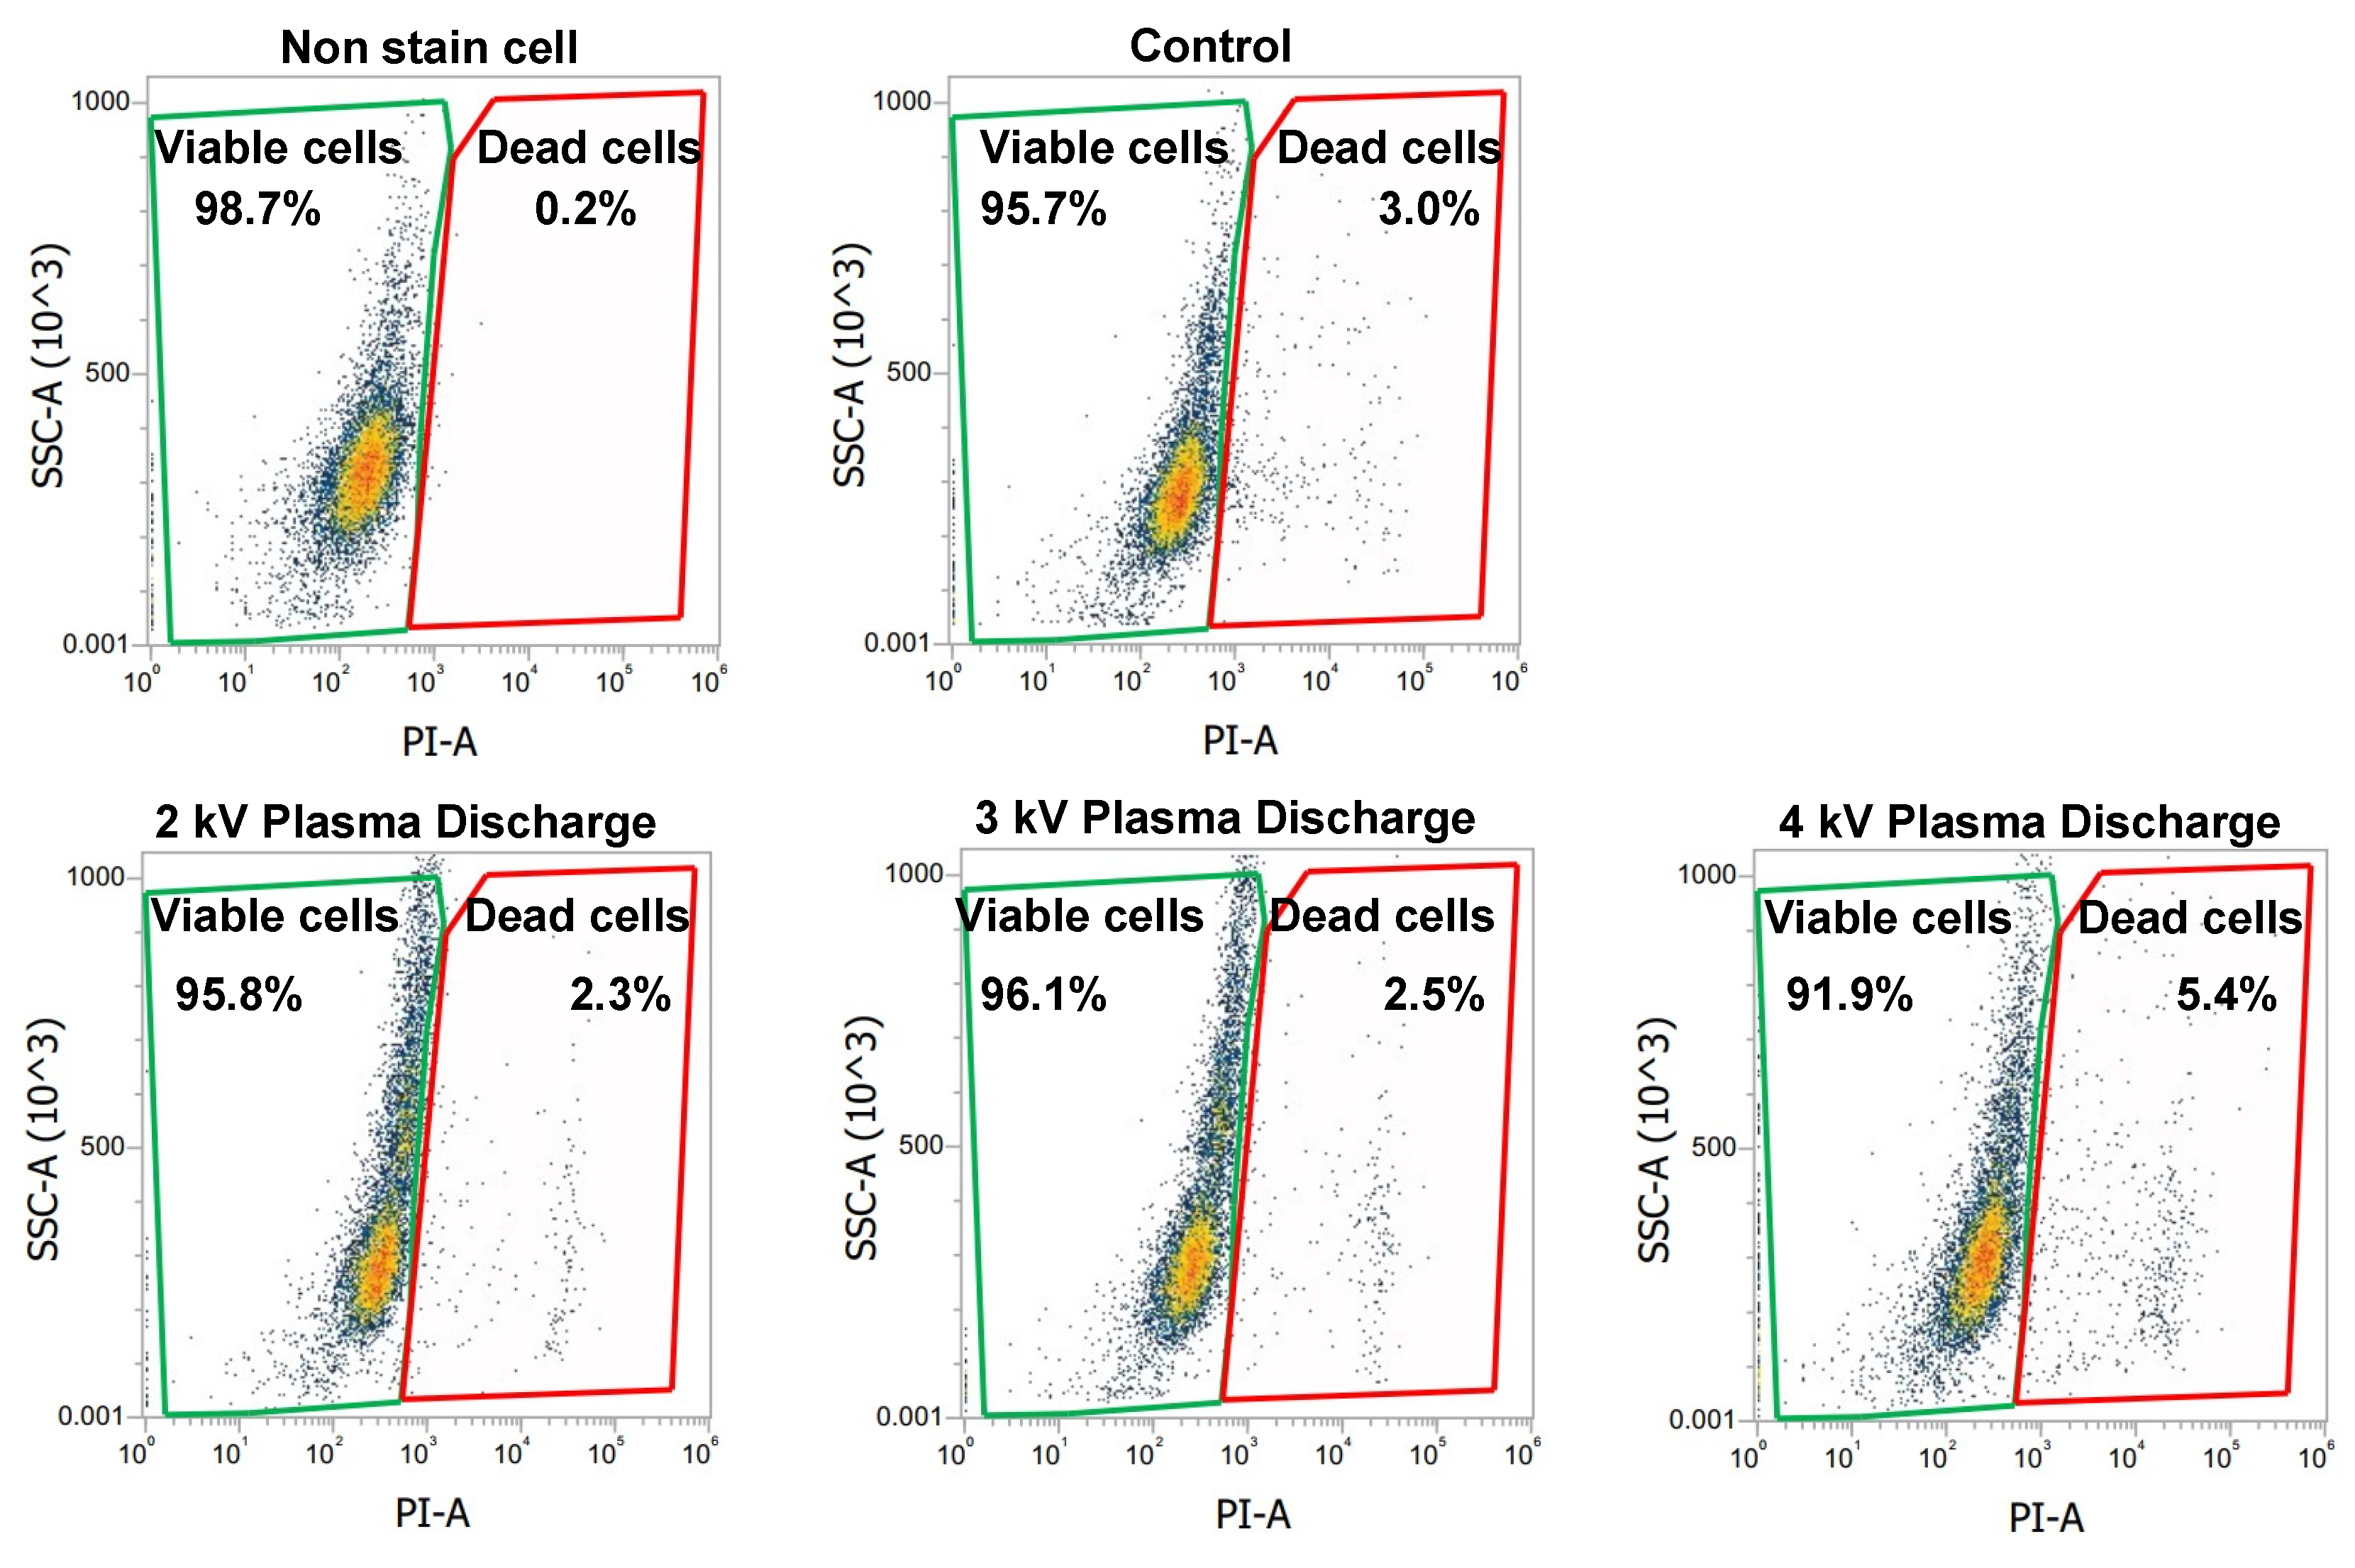
2.6. Measurement of Late Apoptosis by Flow Cytometer, Microplate Reader, and Microscope
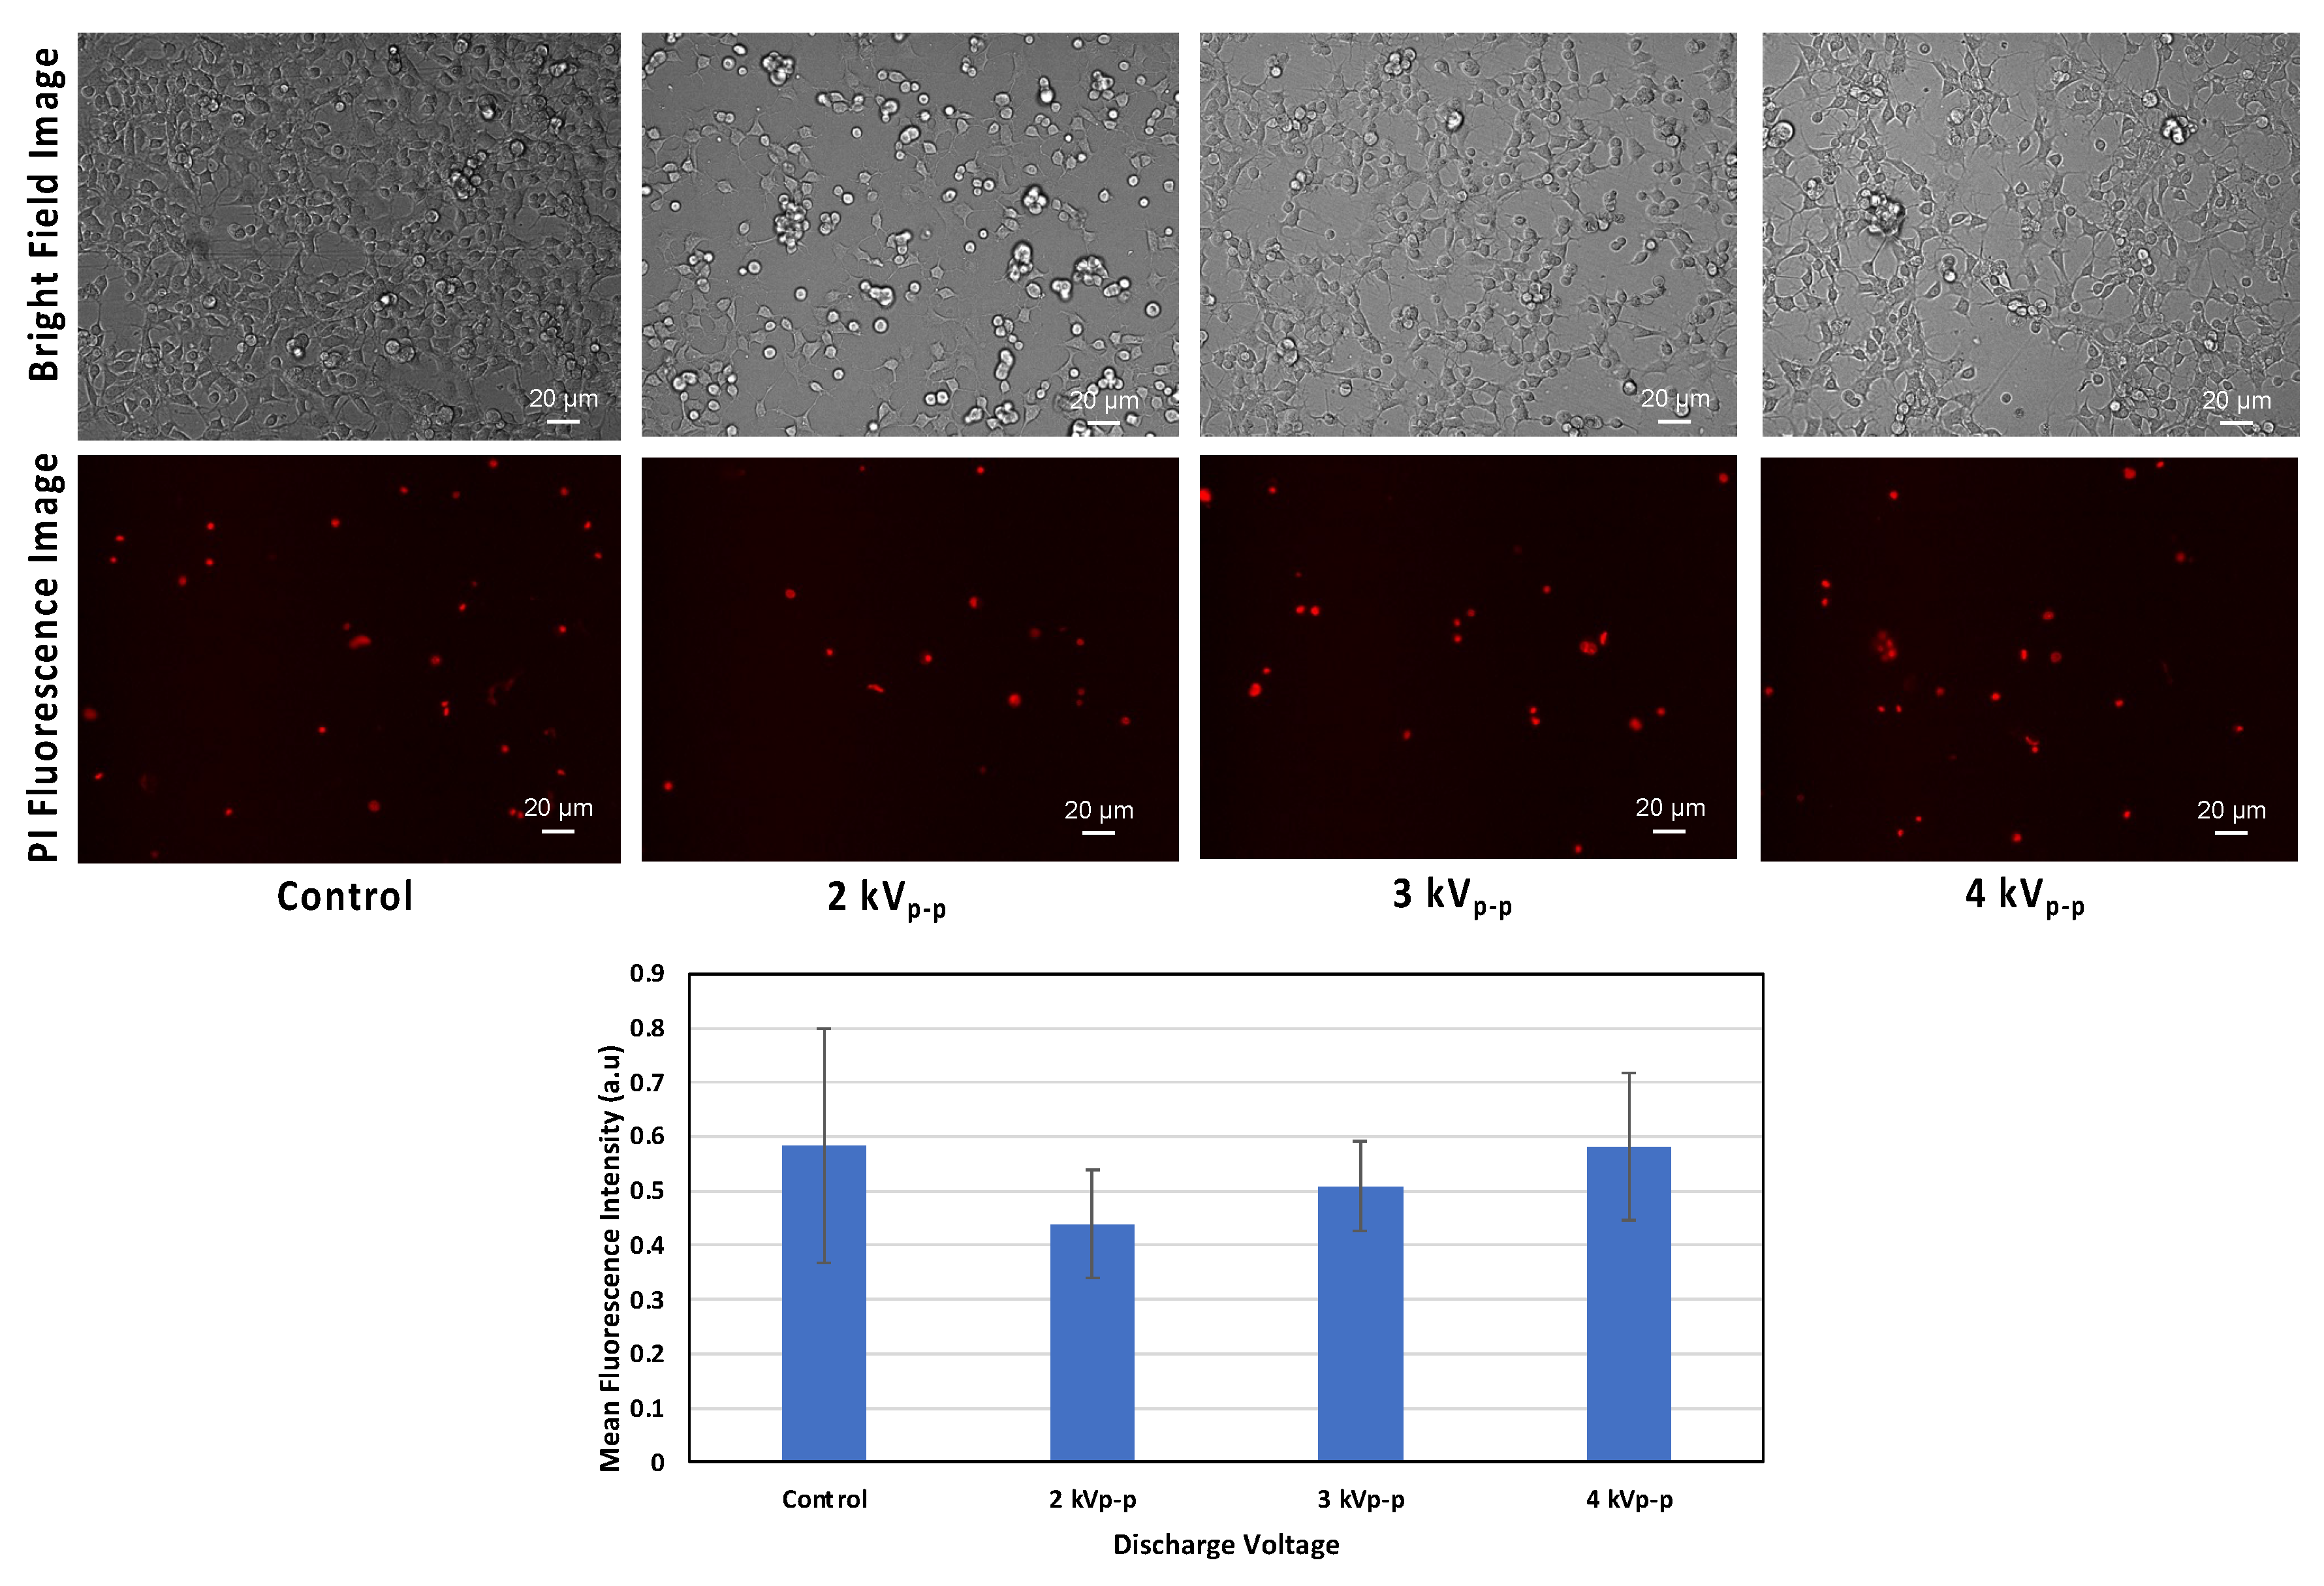
To evaluate the proportion of dead cells across all groups, propidium iodide (PI) was used. PI is impermeable to living cells. It only penetrates cells with compromised membranes, binding to DNA and indicating cell death.
Figure 5 shows our flow cytometric evaluation using PI staining, with green and red gates corresponding to the percentage of viable and dead cells, respectively. In
Figure 5, the analysis includes five experimental groups. Non-stained cells (negative control), PI stained cells (control), and PI stained cells with plasma treatment at 2 kV
p-p, 3 kV
p-p, and 4 kV
p-p. The non-stained cells represent the cell baseline, showing minimal background signal and only a 0.2% level of dead cells. The PI-stained control cells (without plasma) showed a 3.0% level of dead cells. The plasma-treated cells at 2 kV
p-p and 3 kV
p-p showed reduced levels of dead cells, at 2.3% and 2.5% respectively. Compared to the control groups, these percentages were lower, indicating fewer cells with compromised membranes. In contrast, cell exposure to 4 kV
p-p showed a higher percentage of dead cells at 5.4%, exceeding the control level. This indicated that higher plasma exposure can lead to significant membrane damage and increased cell death.
Figure 6 shows the fluorescence intensity measurement obtained using a microplate reader to further evaluate PI staining. Similar to
Figure 5, there were five groups. As expected, the fluorescence signal of non-stained cells was much lower than those of the PI-stained groups. Among the PI-stained groups, the control group (without plasma) showed a higher fluorescence signal compared to plasma-treated cells at 2 kV
p-p and 3 kV
p-p (
Figure 6), indicating a higher number of cells with compromised membranes. The lower fluorescence signal observed at 2 kV
p-p and 3 kV
p-p indicated a lower PI uptake, suggesting fewer cells with compromised membranes and, consequently, better membrane integrity. However, at 4 kV
p-p, the fluorescence signal exceeded those of the control groups, indicating increased PI uptake due to extensive membrane damage and a high proportion of dead cells.
Figure 7 provides fluorescence images that visually confirm the findings from
Figure 5 and
Figure 6. Plasma-treated cells at 2 kV
p-p and 3 kV
p-p show a decrease in the numbers of cells taking up PI compared to both the control and 4 kV
p-p groups. The visual results of
Figure 7 strengthen the conclusion of
Figure 5 and
Figure 6, i.e., that membrane integrity can be preserved within a certain plasma dose, but beyond this dose, membrane damage begins.
3. Discussion
This study focused on observing the effect of a spiral-wound DBD plasma discharge on the DBC1.2 cell, focusing on the relationships among discharge voltage, drug permeation, and cellular integrity. Discharge voltages were varied to observe the plasma conditions at which the drug could permeate the cell and still retain viability and membrane integrity.
FD-70, with a high molecular weight (70 kDa), was the model drug used as a fluorescent tracer to assess membrane permeation. According to Ikeda et al. [
32], the molecular weights of compounds are fundamental in determining the plasma condition for delivering molecules into cells. Plasma-assisted drug delivery typically occurs via direct and indirect treatment methods. In this study, a direct plasma treatment was employed, where reactive plasma species directly interacted with a culture medium to affect the cells [
19]. As shown in
Figure 2, the uptake of FD-70 increased with increasing discharge voltage, indicating voltage-dependent permeation. The plasma treatment induced a localized electric field and reactive species that could disrupt the lipid bilayer and cytoskeletal structure [
33], creating temporary pores in the membrane [
34]. These temporary pores facilitated the easy penetration of FD-70 into the cell cytoplasm. There was no significant difference between the control group and 2 kV
p-p, indicating insufficient plasma discharge to induce effective membrane disruption. However, plasma exposure at 3 kV
p-p and especially 4 kV
p-p had significantly higher fluorescence signal, indicating high FD-70 internalization. These findings suggest that the concentration of plasma deposited on the cells had an impact on the extent of drug permeation.
While enhanced drug permeation is crucial, maintaining cellular integrity is also important. The mitochondrial activity of the cells was assessed by evaluating the mitochondria membrane potential (MMP). As shown in
Figure 3, we observed an increased membrane potential at 2 kV
p-p and 3 kV
p-p, suggesting enhanced mitochondrial function. This could have been due to the action of reactive oxygen and nitrogen species (RONS), which, at moderate exposure, act as a secondary messenger to promote mild oxidative stress and boost ATP production [
35]. The increased MMP showed that mitochondria respond to maintain energy homeostasis, supporting energy production. Meanwhile, at 4 kV
p-p, a decreased MMP was observed, suggesting that the RONS level had surpassed the cell’s antioxidant capacity, leading to possible oxidative damage to mitochondrial proteins, lipids, and DNA. The loss of MMP suggested that the cells were transitioning to apoptosis [
36].
A further evaluation of early apoptosis using Annexin-V staining, as shown in
Figure 4, revealed that plasma treatment at 2 kV
p-p and 3 kV
p-p reduced the proportion of early apoptotic cells compared to the control. The introduction of external factors by the plasma treatment would be expected to have a neutral or detrimental effect. However, this finding aligned with previous studies indicating that non-thermal plasma at controlled doses can activate cellular stress responses that enhance survival pathways, including increased antioxidant enzyme activity [
37]. The enhancement of cell viability at 2 kV
p-p and 3 kV
p-p and its decline at 4 kV
p-p, as shown in
Figure 4, can be attributed to a balance between the beneficial and harmful effects of plasma-generated reactive species. At moderate doses, RONS can stimulate mild oxidative stress responses. The mild oxidative stress from RONS could also activate pro-survival pathways that promote cell survival and proliferation [
38]. The increased MMP shown in
Figure 3 indicated enhanced energy production, which, in turn, may have led to the increased cell viability and reduced apoptosis observed in
Figure 4. These results align with previous studies, where low plasma doses promoted wound healing and tissue regeneration [
38,
39,
40]. However, at 4 kV
p-p, the percentage of early apoptotic cells increased compared to those at 2 kV
p-p and 3 kV
p-p. The increase suggested that oxidative stress overwhelmed the cellular defense mechanisms, leading to more cells transitioning into apoptosis. The excessive plasma exposure induced oxidative stress, mitochondrial dysfunction, and apoptotic cell death.
Additionally, PI, a popular red-fluorescent nuclear and chromosome counterstain that only penetrates cells with compromised membranes, was used to evaluate late apoptotic cells, as shown in
Figure 5,
Figure 6 and
Figure 7. PI selectively stains cells with compromised membranes, making it a reliable marker for late apoptosis or necrosis [
41]. This phenomenon makes PI a valuable tool in distinguishing between live and dead cells.
Figure 5,
Figure 6 and
Figure 7 show the proportions of cells with compromised membranes, evaluated using flow cytometry, a microplate reader, and a fluorescence microscope. Across all three evaluation platforms, cells treated at 2 kV
p-p and 3 kV
p-p consistently showed lower level of PI-positive cells compared to the control, and levels of viable cells were also high under these plasma conditions. Meanwhile, plasma exposure at 4 kV
p-p had the highest level of PI-positive cells and the lowest level of viable cells. When compared to the control group, the results suggest that moderate plasma exposure not only preserved but may have enhanced membrane integrity. The similarity of trends across all measurement platforms (
Figure 5,
Figure 6 and
Figure 7) confirmed the reliability of this result. Ideally, a PI signal should be minimal in an untreated control group. However, a possible explanation for the observed high signal could be the natural occurrence of cell turnover and spontaneous apoptosis in cell culture. Even under optimal conditions, a fraction of a cell population undergoes natural cell death, leading to PI uptake in control groups. The plasma treated group was an indication that membrane repair occurred at a certain plasma dose, but beyond this dose, membranes are compromised and DNA damaged occurred.
Overall, these findings support the idea that a moderate plasma dose is beneficial in enhancing molecular delivery while maintaining cell integrity and possibly stimulating cellular repair mechanisms, as well as activating protective signaling pathways that reduce cell death and membrane damage.
4. Materials and Methods
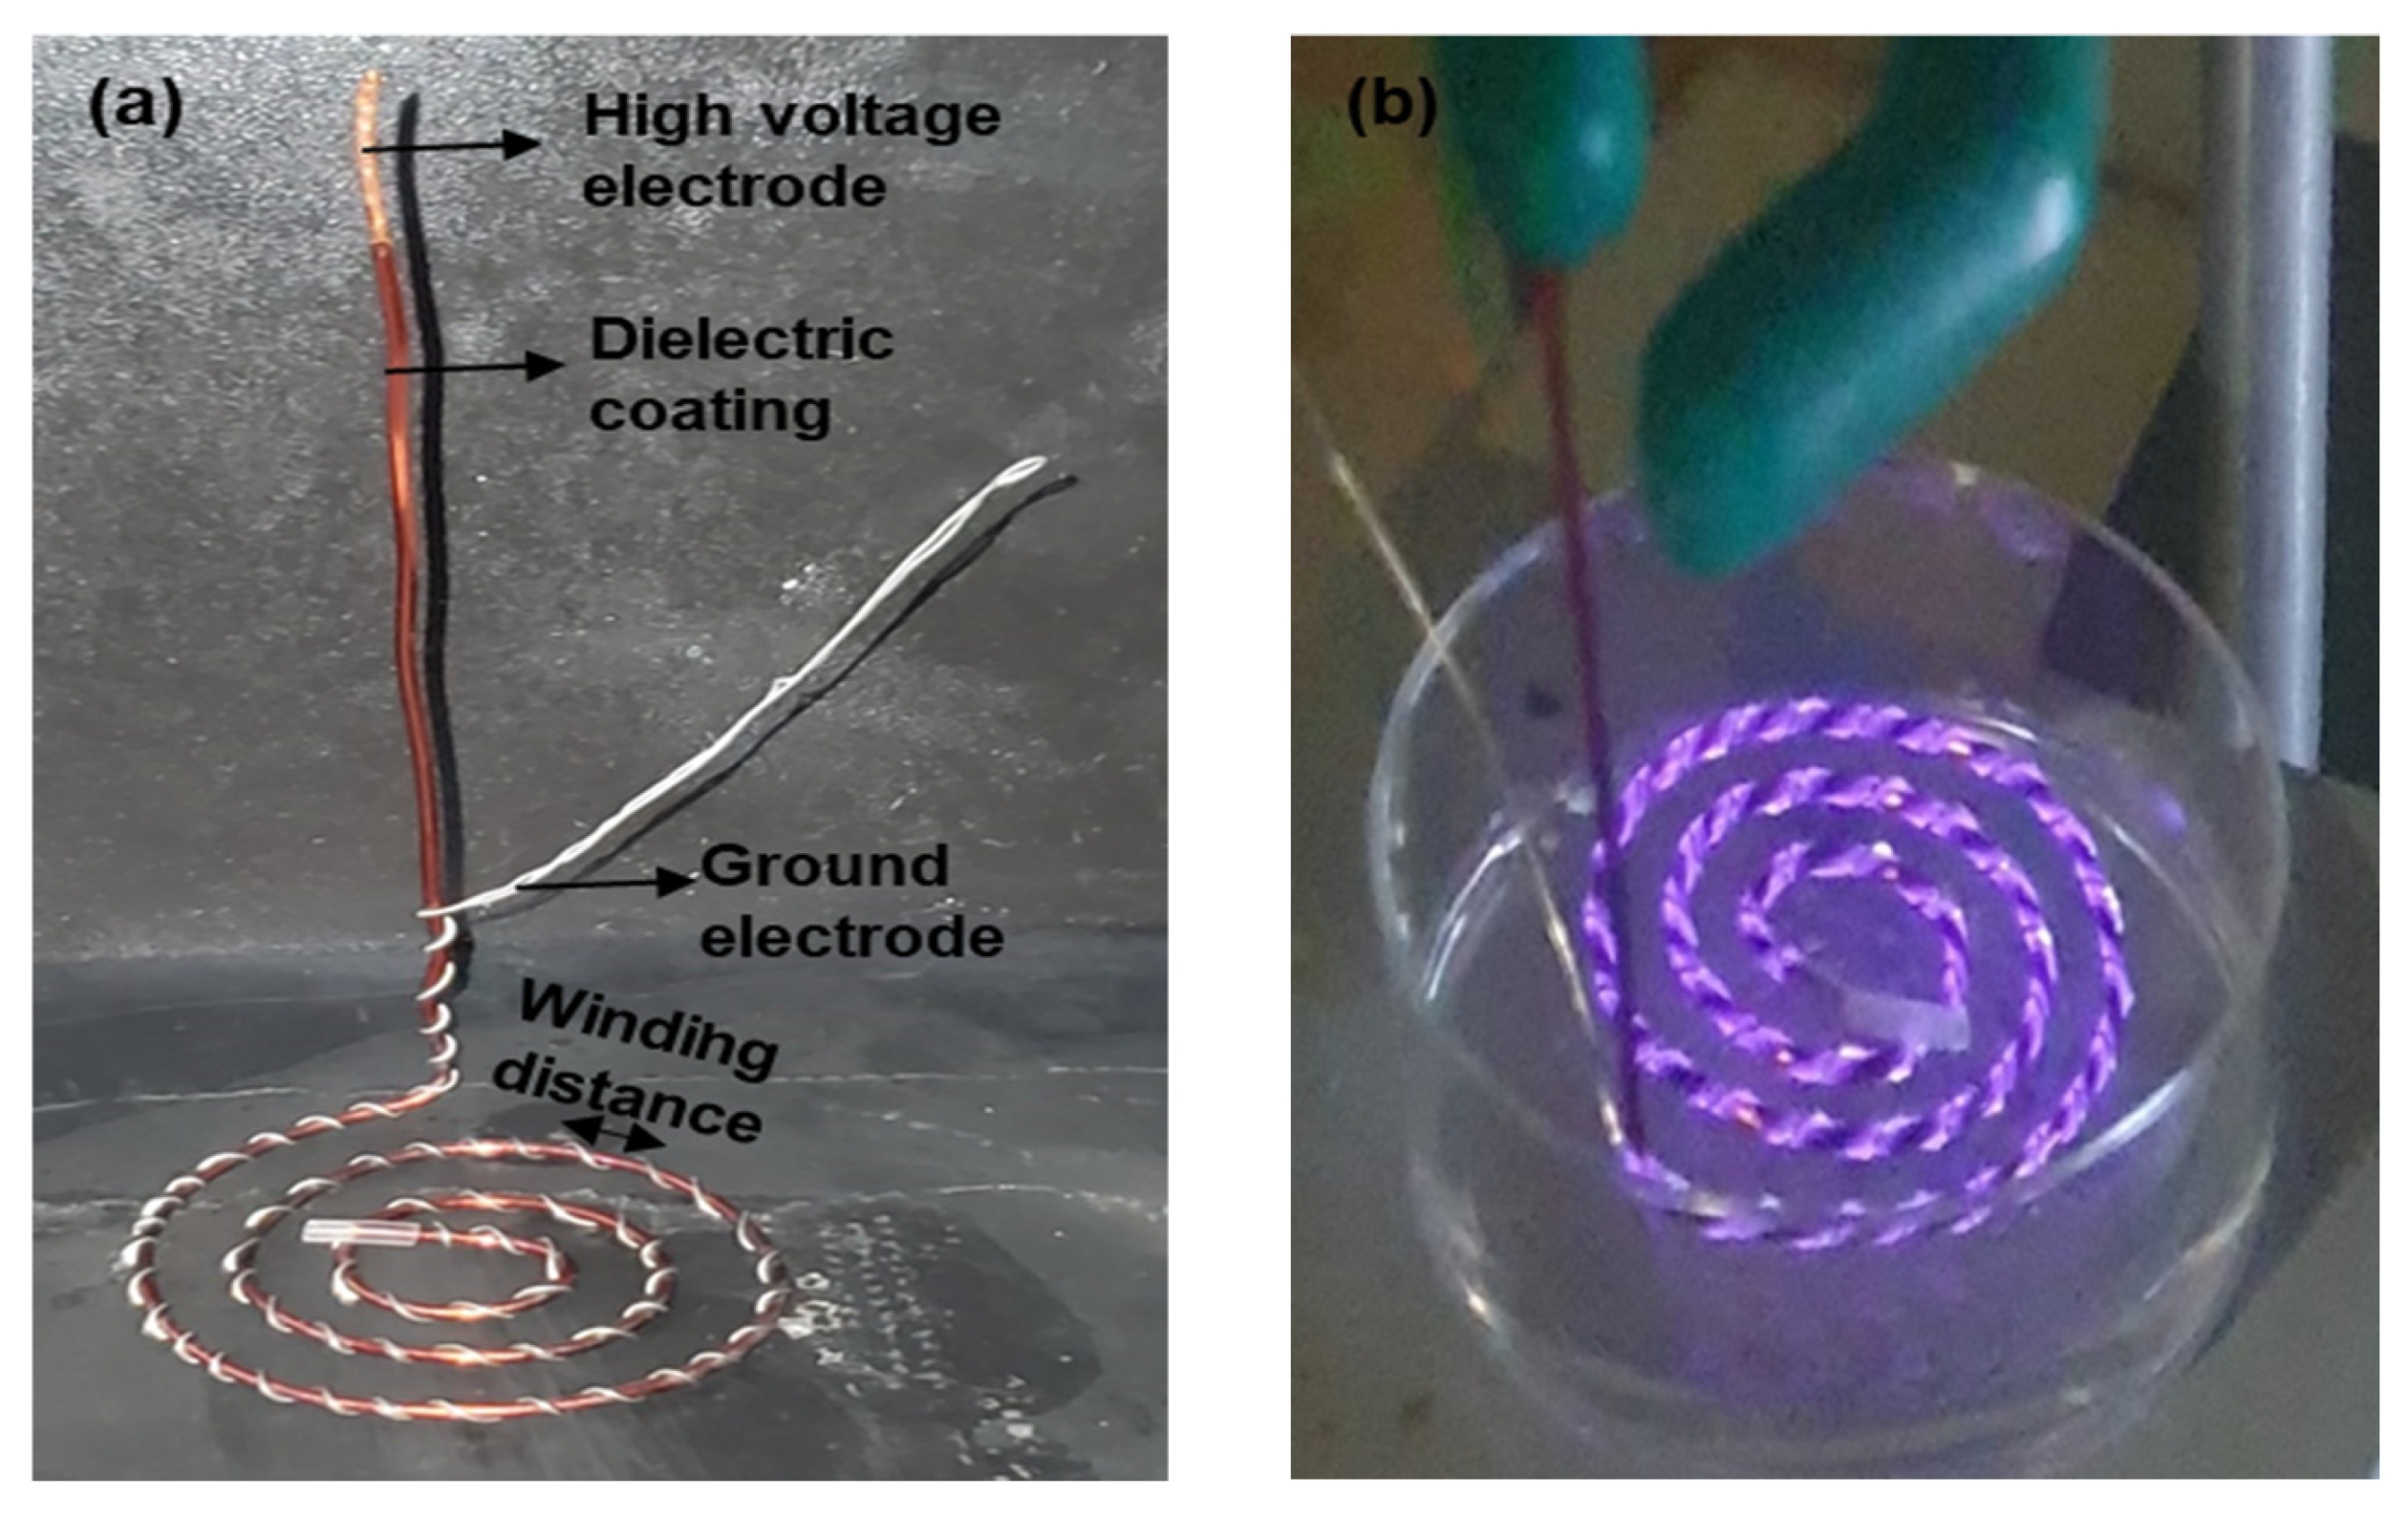
4.1. Spiral-Wound DBD Plasma Design
A spiral-wound DBD plasma device was constructed using two copper electrodes (a high voltage electrode and a ground electrode) with differing thickness (
Figure 8a). The HV electrode with a thickness of 1.049 mm was coated with a dielectric barrier whose thickness was 31 µm. The dielectric barrier was composed of a nanocomposite material that combined fillers and resins to ensure electrical insulation and controlled discharge characteristics. The ground electrode, with a thickness of 0.4 mm, was spirally wound around the surface of the dielectric-coated HV electrode. The spiral winding extended to a length of 20 cm on the HV electrode. The winding distance between adjacent turns on the HV electrode was approximately 4 mm (
Figure 1 and
Figure 8a). The total thickness of the spiral-wound electrode assembly was 1.5 mm. The final plasma device assembly was further rolled into a spiral structure, as shown in
Figure 1 and
Figure 8. The plasma device outer diameter was approximately 5.6 cm.
4.2. Cell Culture
The Olfactory Dark (horizontal) Basal Cell (DBC1.2) line was used in this study. The cell line was purchased from the National Institute of Biomedical Innovation, Health, and Nutrition (NIBIOHN) via the Japanese Collection of Research Bioresources (JCRB) cell bank. The cell culture was maintained in 500 mL Dulbecco’s Modified Eagle Medium (DMEM) (Shimadzu Diagnostics Corporation, Tokyo, Japan) and supplemented with 25 mL fetal bovine serum (SERANA, Brandenburg, Germany), 5 mL L-glutamine solutions, 5 mL penicillin-streptomycin solution, 8 mL of 10% NaHCO3, and 200 µL insulin, all of which were purchased from Fujifilm Wako Pure Chemical corporation, Osaka, Japan. The cells were grown in a 60 × 15 mm Violamo tissue culture dish (As One Corporation, Osaka, Japan) containing 3 mL of complete DMEM. Cells were incubated at 37 °C and 5% CO2, in a humidified cell culture incubator (E-22, As One Corporation, Osaka, Japan). After 24 h of incubation, the cells adhered to the culture dish, and the DMEM was replaced. To sustain cell growth, DMEM was replaced every 48 h until cell confluency. Following treatment, cells were washed twice with 2 mL of phosphate buffer saline (PBS) (Shimadzu Diagnostics Corporation, Tokyo, Japan) before and after treatment to remove cellular debris from the culture dish. Afterwards, cells were detached with 0.5 mL of 0.25 w/v% Trypsin–1 mmol/l EDTA·4Na solution with Phenol Red (Fujifilm Wako Pure Chemical corporation, Osaka, Japan). Once the cells were detached, 3 mL of DMEM was immediately added to neutralize the effect of trypsin, and the cell solution was gently mixed with a micropipette to ensure homogeneity.
4.3. Plasma Discharge
The region of plasma discharge on the spiral-wound plasma device corresponded to the total length covered by winding the ground electrode on the HV electrode (
Figure 8b). Plasma discharge was generated in room air at atmospheric pressure using the experimental set-up shown in
Figure 9. The discharge was produced from a peak-to-peak sinusoidal waveform that was set by a function generator (Tektronix, AFG3102, Tektronix Inc., Beaverton, OR., USA) and amplified by a high-voltage amplifier (Trek Model 5/80, Trek Inc., NY, USA). Discharge voltages were varied between 2 kV
p-p, 3 kV
p-p, and 4 kV
p-p. The frequency, treatment time, and discharge gap (between the plasma device and culture medium) were fixed at 5 kHz, 2 minutes, and 2–3 mm respectively. The discharge voltage was measured using a high-voltage probe (Tektronix, P6105A, Tektronix Inc., Beaverton, OR., USA) connected to an oscilloscope (Tektronic TDS 2014B, Tektronix Inc., Beaverton, OR., USA). The discharge current was measured using a Pearson current monitor connected to the same oscilloscope. The discharge power was estimated by multiplying the discharge voltage and discharge current waveforms recorded by the oscilloscope. For every voltage cycle, the dissipated energy,
W, was calculated using Equation (1) [
42]. To determine the discharge power,
P, the energy consumed in one cycle of discharge was multiplied by the frequency,
f, of the applied voltage, as shown in Equation (2).
where
V(
t) is the voltage applied to the plasma electrode,
I(
t) is the current flowing through the electrodes, and
f is the frequency of the applied voltage.
4.4. Measurement of Membrane Permeation of Drug
FD-70 (a high molecular weight fluorescence tracer, 70kDa) was used to measure the permeation of molecules into the cells under different plasma discharge voltages. Prior to plasma treatment, confluent DBC1.2 cells were washed twice with 2 mL PBS to remove cellular debris and dead cells. After washing, 3 mL of fresh DMEM containing 300 μL (300 μg/mL) FD-70 was added to the culture dish and treated with direct plasma, followed by 1–2 h incubation to allow for intracellular uptake. Post-incubation, the cells were further washed twice with 2 mL PBS to remove unbound FD-70 and then detached with 0.5 mL trypsin. Fresh DMEM was added, homogenously mixed, and distributed into 96 well plates for measurement with a TECAN microplate reader. The fluorescence intensity was measured at an excitation/emission wavelength of 485/495 nm.
4.5. Measurement of MMP
Mitochondria Membrane Potential (MMP) was measured using a MT-1 MitoMP detection kit (Dojindo Laboratories, Kumamoto, Japan). In this assay, healthy mitochondria with intact MMPs emit bright red fluorescence; a loss of MMP is indicated by a decrease in red fluorescence. Cells were cultured in petri dishes and incubated with an MT-1 dye working solution for 30 min. After staining, the MT-1 dye was discarded and cells were washed twice with PBS. Subsequently, 3 mL culture medium was added and treated, followed by 1 h incubation. Afterwards, the culture medium was discarded, washed twice with PBS, and detached into Eppendorf tubes. To further assess apoptosis, 10 µL of annexin V reagent was added and incubated for an additional 20 min, followed by the addition of 400 µL imaging buffer.
The measurements and analysis were done with an Invitrogen Attune NxT flow cytometer (Thermofisher Scientific, Waltham, MA, USA). The boundaries with green and red gates were created in the workspace of the flow cytometer. We used the non-stained cell samples as a baseline. The gates automatically calculated the percentage of cells within the bounds, and this gate was automatically applied to all measurements. The green gate represented the cell population without MMP dye, indicative of inactive mitochondria (MMP−). Therefore, any shift in cell population from the green gate to the red gate was classified as part of the cell population with active mitochondria (MMP+). The control and plasma-treated samples stained with MMP dye showed a huge shift of cell population from the green gate to the red gate.
4.6. Measurements of Apoptosis
FITC Annexin-V was used to assess early apoptosis. In early apoptosis, phosphatidylserine (PS) residues are translocated from the inner leaflet of the plasma membrane to the surface, allowing Annexin-V staining to occur [
43]. Meanwhile, in viable cells, the PS are confined to the inner layer of the plasma membrane, preventing annexin-V binding.
Propidium iodide (PI) was used to assess late apoptotic cells. PI is a popular red fluorescent nuclear and chromosome counterstain that stains the DNA and RNA of damaged or membrane compromised cells [
41]. The PI dye has excitation/emission maxima of 493/636 nm in an aqueous solution. Once the dye is bound to a nucleic acid, it shifts to 535 nm (excitation) and 617 nm (emission) due to a red and blue shift in its fluorescence spectrum [
44]. After treatments, cells were incubated for 1–2 h. The control and plasma-treated cells were washed twice with 2 mL PBS and detached with trypsin, and 3 mL DMEM was added. The cell suspension was centrifuged at 1000 rpm for 3 min and supernatant was discarded. The cells were washed again with PBS and centrifuged under the same conditions; the supernatant was discarded, and the cells were resuspended in 3 mL DMEM. Next, 500 µL cell solution was transferred into a 1.5 mL Eppendorf tube, followed by the addition of 5 µL PI and incubation for 25 min in the absence of light. Samples were measured and analyzed with Invitrogen Attune NxT flow cytometer (Thermofisher Scientific, Waltham, MA, U.S.A.). The boundaries with green and red gates were created in the flow cytometer workspace, using the non-stained cell samples as a baseline. The gates automatically calculated the percentage of cells within the bounds, and the gate was automatically applied to all measurements. The green gate indicated viable cells. Therefore, any shift in cell population from the green gate to the red gate was classified as apoptotic. The control and plasma treated samples stained with Annexin-V or PI showed a distinct shift of the cell population toward the red gate, confirming apoptosis.
4.7. Statistical Analysis
Three independent experiments were performed to obtain triplicate data. The results are presented as an arithmetic mean ± standard deviation (SD). The IBM SPSS statistics software (version 23) package was used for statistical analysis. The differences among groups were determined by one-way ANOVA (Analysis of Variance), followed by Dunnett’s two-sided post hoc multiple comparison test to compare treated groups against the control. Differences were considered significant when p ≤ 0.05 (*), p ≤ 0.01 (**), p ≤ 0.001 (***), p ≤ 0.0001 (****). Otherwise, they were considered non-significant (n.s).
Due to the nature of figure representation in the flow cytometry scatter plots, standard deviations were not shown directly but were included in our numerical data analyses.
5. Conclusions
This study developed a novel spiral-wound DBD plasma device and investigated its effect on membrane permeation, mitochondrial activity, viability and apoptosis using DBC1.2 olfactory basal cells. Our results showed that plasma discharge at 2 kVp-p, 3 kVp-p, and 4 kVp-p influenced cellular response.
The plasma treatment created temporary pores that allowed the uptake of FD-70 in cells, which increased with an increase in the discharge voltage. The maximum uptake was observed at 4 kVp-p. Additionally, plasma treatment at 2 kVp-p and 3 kVp-p led to an increase in mitochondrial activity and cell viability and a decrease in apoptosis. This effect suggested that moderate plasma exposure may promote mitochondrial activity and cellular proliferation, likely by activating growth signaling pathways and exerting mild oxidative stress that stimulates adaptive survival responses. However, plasma treatment at 4 kVp-p led to a reduced viability and increased apoptosis, likely due to compromised membranes that initiated DNA damage. This was accompanied by a decrease in mitochondrial activity, marking the transition to cellular apoptosis.
These findings demonstrate that a spiral-wound plasma device at moderate plasma discharge can enhance drug absorption and still maintain cellular membrane integrity. While our findings suggest a potential cellular repair response, further investigation of the direct molecular evidence like the expression of repair-related genes or proteins is required to validate this study. This novel plasma device has potential for biomedical application including drug delivery and wound healing.


 ,
, 