Article

Tailoring the Chemistry of Plasma-Activated Water Using a DC-Pulse-Driven Non-Thermal Atmospheric-Pressure Helium Plasma Jet

1
Department of Physical Electronics and Informatics, Osaka City University, Osaka 558-8585, Japan
2
BioMedical Engineering Center (BMEC), Graduate School of Engineering, Osaka City University, Osaka 558-8585, Japan
3
Future Industries Institute, University of South Australia, Adelaide, SA 5095, Australia
4
Department of Electronic and Photonic Systems Engineering, Kochi University of Technology, Kami, Kochi 782-8502, Japan
5
Center for Nanotechnology, Research Institute of Kochi University of Technology, Kami, Kochi 782-8502, Japan
6
Department of Electrical and Electronic Engineering, Meijo University, Nagoya 468-8502, Japan
*
Author to whom correspondence should be addressed.
Plasma 2019, 2(2), 127-137; https://doi.org/10.3390/plasma2020010
Submission received: 29 January 2019 / Revised: 17 April 2019 / Accepted: 17 April 2019 / Published: 23 April 2019
(This article belongs to the Special Issue Latest Developments in Pulsed Low-Temperature Plasmas)

Abstract

:
We investigate the use of a DC-pulse-driven non-thermal atmospheric-pressure He plasma jet in the regulation of hydrogen peroxide (H2O2), nitrite (NO2), nitrate (NO3), and oxygen (O2) in deionized (DI) water. The production of these molecules is measured by in situ UV absorption spectroscopy of the plasma-activated water (PAW). Variations in the pulse polarity and pulse width have a significant influence on the resultant PAW chemistry. However, the trends in the concentrations of H2O2, NO2, NO3, and O2 are variable, pointing to the possibility that changes in the pulse polarity and pulse width might influence other plasma variables that also impact on the PAW chemistry. Overall, the results presented in this study highlight the possibility of using DC-pulse-driven plasma jets to tailor the chemistry of PAW, which opens new opportunities for the future development of optimal PAW formulations across diverse applications ranging from agriculture to medicine.

1. Introduction

Plasma-activated water (PAW) is receiving much attention in biomedical applications because of its potential bactericidal properties. The bactericidal properties of PAW are thought to arise from the reactive oxygen species (ROS) and reactive nitrogen species (RNS), collectively referred to as RONS, as well as other less-reactive molecules that act in synergy in the destruction of bacteria [1,2,3,4,5,6,7,8,9,10,11,12,13,14,15]. In order to improve the bactericidal efficacy of PAW, it is important to understand how the plasma jet generates the key reactive species in both short- and long-term reactions in water. Obtaining control over the RONS chemistry in PAW would enable the possibility of tailoring the optimal RONS chemistry for specific applications (e.g., from decontaminating food products to the decontamination of infected chronic wounds, as well as many other applications in biology, medicine, and food and agriculture).
Arguably, the non-thermal atmospheric-pressure plasma jet (herein referred to as plasma jet) has been the most commonly investigated plasma source used for producing PAW. A plasma jet can be operated with various (usually inert) gases with the RONS mainly generated in the plasma effluent as it impinges with the ambient air, activating the oxygen and nitrogen atmospheric molecules [16,17,18]. When a plasma jet is aimed at a water surface, the RONS in the plasma effluent of the flowing gas can dissolve into the water and participate in chemical reactions or interact with biological molecules and micro-organisms. It is particularly important to control the plasma jet-ambient air interactions because, during these interactions, the plasma jet activates oxygen and nitrogen molecules in the air, which subsequently dissolve in the water and are thought to have a major role in influencing the final PAW chemistry [19,20,21,22,23]. In order to obtain control over these plasma jet-air interactions, it is essential to develop methods of regulating (1) the ambient gases and (2) the main plasma species in the generation of PAW.
A time-resolved atmospheric mass spectrometry study of a sinusoidal excited dielectric barrier discharge (DBD) plasma jet revealed that the generation of positive and negative ionic species correlates to the positive and negative discharge current peaks of the plasma jet [16,17]. During operation of the DBD plasma jet, the positive and negative current peaks were observed twice per discharge period with an interval of around half a period. The interval slightly varies when the amplitude of the applied high voltage is changed. Furthermore, the negative ions from the plasma jet had a longer lifetime compared to the positive ions; e.g., the decay time constants for the negative and positive ions were τ ~ 20 µs and ~10 µs, respectively. Monopolar direct current (DC) high-voltage pulses can be used to generate the positive and negative current peaks on the rising and falling edges, respectively [24]. By varying the duty cycle of the pulsed waveform and pulse width, it is possible to control the time delay between the positive and negative current peaks, providing a route to modulate the ionic content of the discharge. A time-resolved mass spectrometry study indicated that large duty cycles (>75%) favor the generation of NO+ ions accompanied by a significant reduction in negative ion formation [24]; this demonstrates the opportunity to use pulsed plasma technology to control the chemical composition in the gas phase, and subsequently also in the generation of PAW.
There are a few reports regarding the use of pulse plasma technology for regulating RONS and other molecules that are short-lived in aqueous solution (less than 1 min half-life) and longer-lived (greater than 1 min half-life) [25,26,27]. Liu et al. reported on RONS generation with various pulse widths using an electrode configuration with an insulated tungsten electrode and an external ground electrode [26]. Uchida et al. used a pulsed radio frequency with external ring electrodes to modulate the plasma production of RONS [27]. These initial studies show how plasma jets operated with different voltage waveforms and/or pulse widths can potentially be used to regulate RONS.
In this study, we investigate how varying the polarity of the DC-pulse and pulse widths of a He plasma jet might influence the resultant chemistry in PAW. The chemistry of PAW was monitored by in situ UV absorption spectroscopy. Although plasma generates a variety of neutral and ionic species in water, near the water surface, most of the more highly reactive molecules, such as the hydroxyl radical (∙OH), are rapidly converted into longer-lived molecules, such as hydrogen peroxide (H2O2), nitrite (NO2), nitrate (NO3), and oxygen (O2) [28], which are thought to act in synergy in regulating cellular processes important for biomedical applications. Therefore, in this study, we focus on measuring the concentrations of the main longer-lived molecules generated by plasma in deionized (DI) water (H2O2, NO2, NO3, and O2).

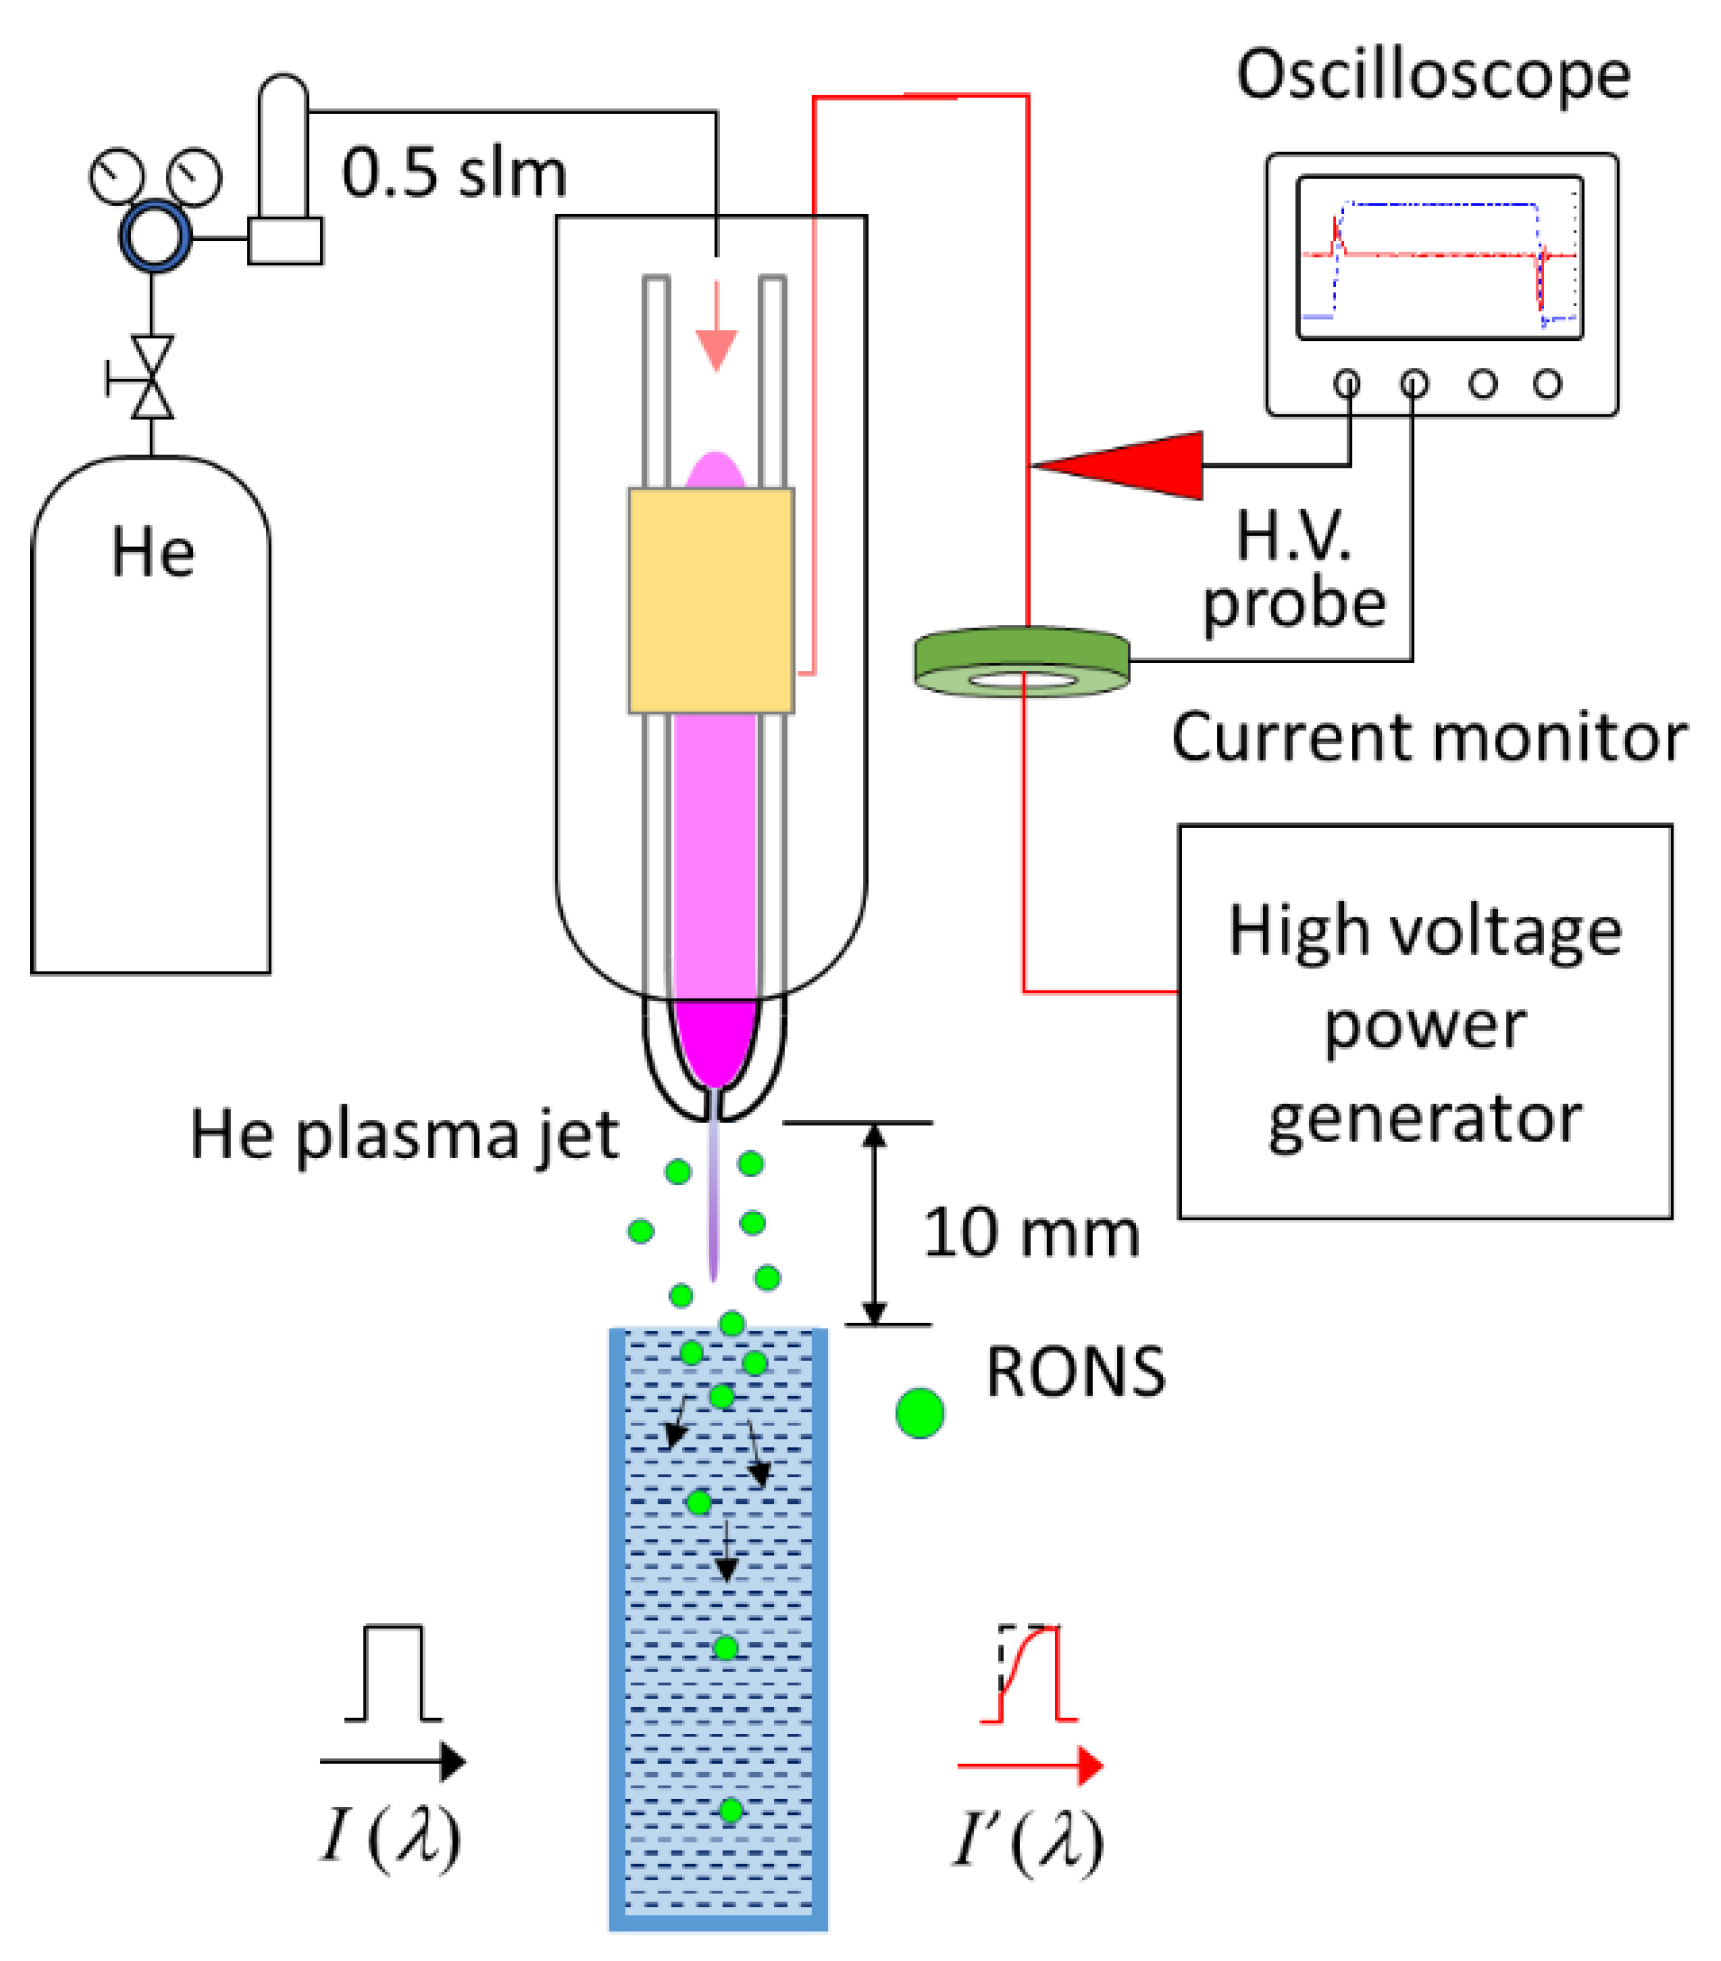
2. Experimental Setup

Figure 1 shows the experimental configuration used to generate PAW, the in situ UV absorption spectroscopy to measure the generation of H2O2, NO2, NO3, and O2 in DI water, and the locations of the voltage probe and current monitor [22,23]. The DBD plasma jet configuration was described in detail elsewhere [29,30,31]. Briefly, the plasma jet assembly consists of a 150 mm long, 4 mm inner diameter glass tube tapered to 600 µm at the nozzle. A single 15 mm long external ring copper electrode was wound onto the glass tube at a distance of 50 mm from the nozzle. The flow rate of He through the glass tube was fixed at 0.5 standard liters per minute (slpm). A high-voltage DC-pulse of 6 kVp-p (peak-to-peak) at 10 kHz was applied to the external electrode with a commercial power supply (Haiden-SBP-10K-HF, Haiden Lab, Akashi, Japan). The pulse width of the monopolar high-voltage DC-pulse was individually varied between 1.5 and 45 µs. The high-voltage DC-pulse and discharge current were measured as previously reported [16,18,32,33,34,35,36], employing a high-voltage probe (PPE 20 kV, LeCroy, Chestnut Ridge, NY, USA) and a conventional current monitor (Pearson 2877, Pearson Electronics, Palo Alto, CA, USA), respectively. The voltage and current waveforms were recorded with a digital oscilloscope (WaveJet 300A, LeCroy, Chestnut Ridge, NY, USA). A 10-mm-thick polytetrafluoroethylene (PTFE) housing was used to shield the high-voltage electrode for safety. The length of the free stream plasma jet, as seen with the unaided eye and measured with a ruler, was varied between 5 and 10 mm, and was determined to be dependent on the polarity of the pulse and pulse width.
The optical emission spectrum of the plasma jet was measured by a fiber optic spectrometer (OceanOptics, Flame-TX-R1-ES, Largo, USA) associated with a collimating lens. For plasma parameters, electron temperature (Te) and gas temperature (Tg) were estimated by a spectrum simulator of the N2* second positive system, which was kindly provided by professor Hiroshi Akatsuka at the Tokyo Institute of Technology [37].
A conventional double-beam UV-vis spectrophotometer (U-1900, Shimadzu, Kyōto, Japan) was used to measure the UV absorbance of 4.1 mL DI water inside a quartz cuvette (100-QS, Hellma Analytics, Plainview, NY, USA) with a standard optical path of 10 mm. The plasma jet was mounted onto an x-y-z positioning stage, including an optical rail and laboratory jack, and the assembly was placed beside the spectrophotometer. The nozzle of the plasma jet assembly was held 10 mm from the top of the DI water. The plasma jet was aimed downward onto the DI water and real-time changes in the UV absorption profile were recorded in situ. The UV absorbance was used to calculate the concentrations of H2O2, NO2, NO3, and O2 according to an established curve-fitting routine (full practical and theoretical details are provided in [22]). Further, we established in a previous study that the UV absorbance technique and associated curve-fitting routine are suitable for accurately determining the concentrations of the said molecules generated by plasma in solution [34].

3. Results and Discussion

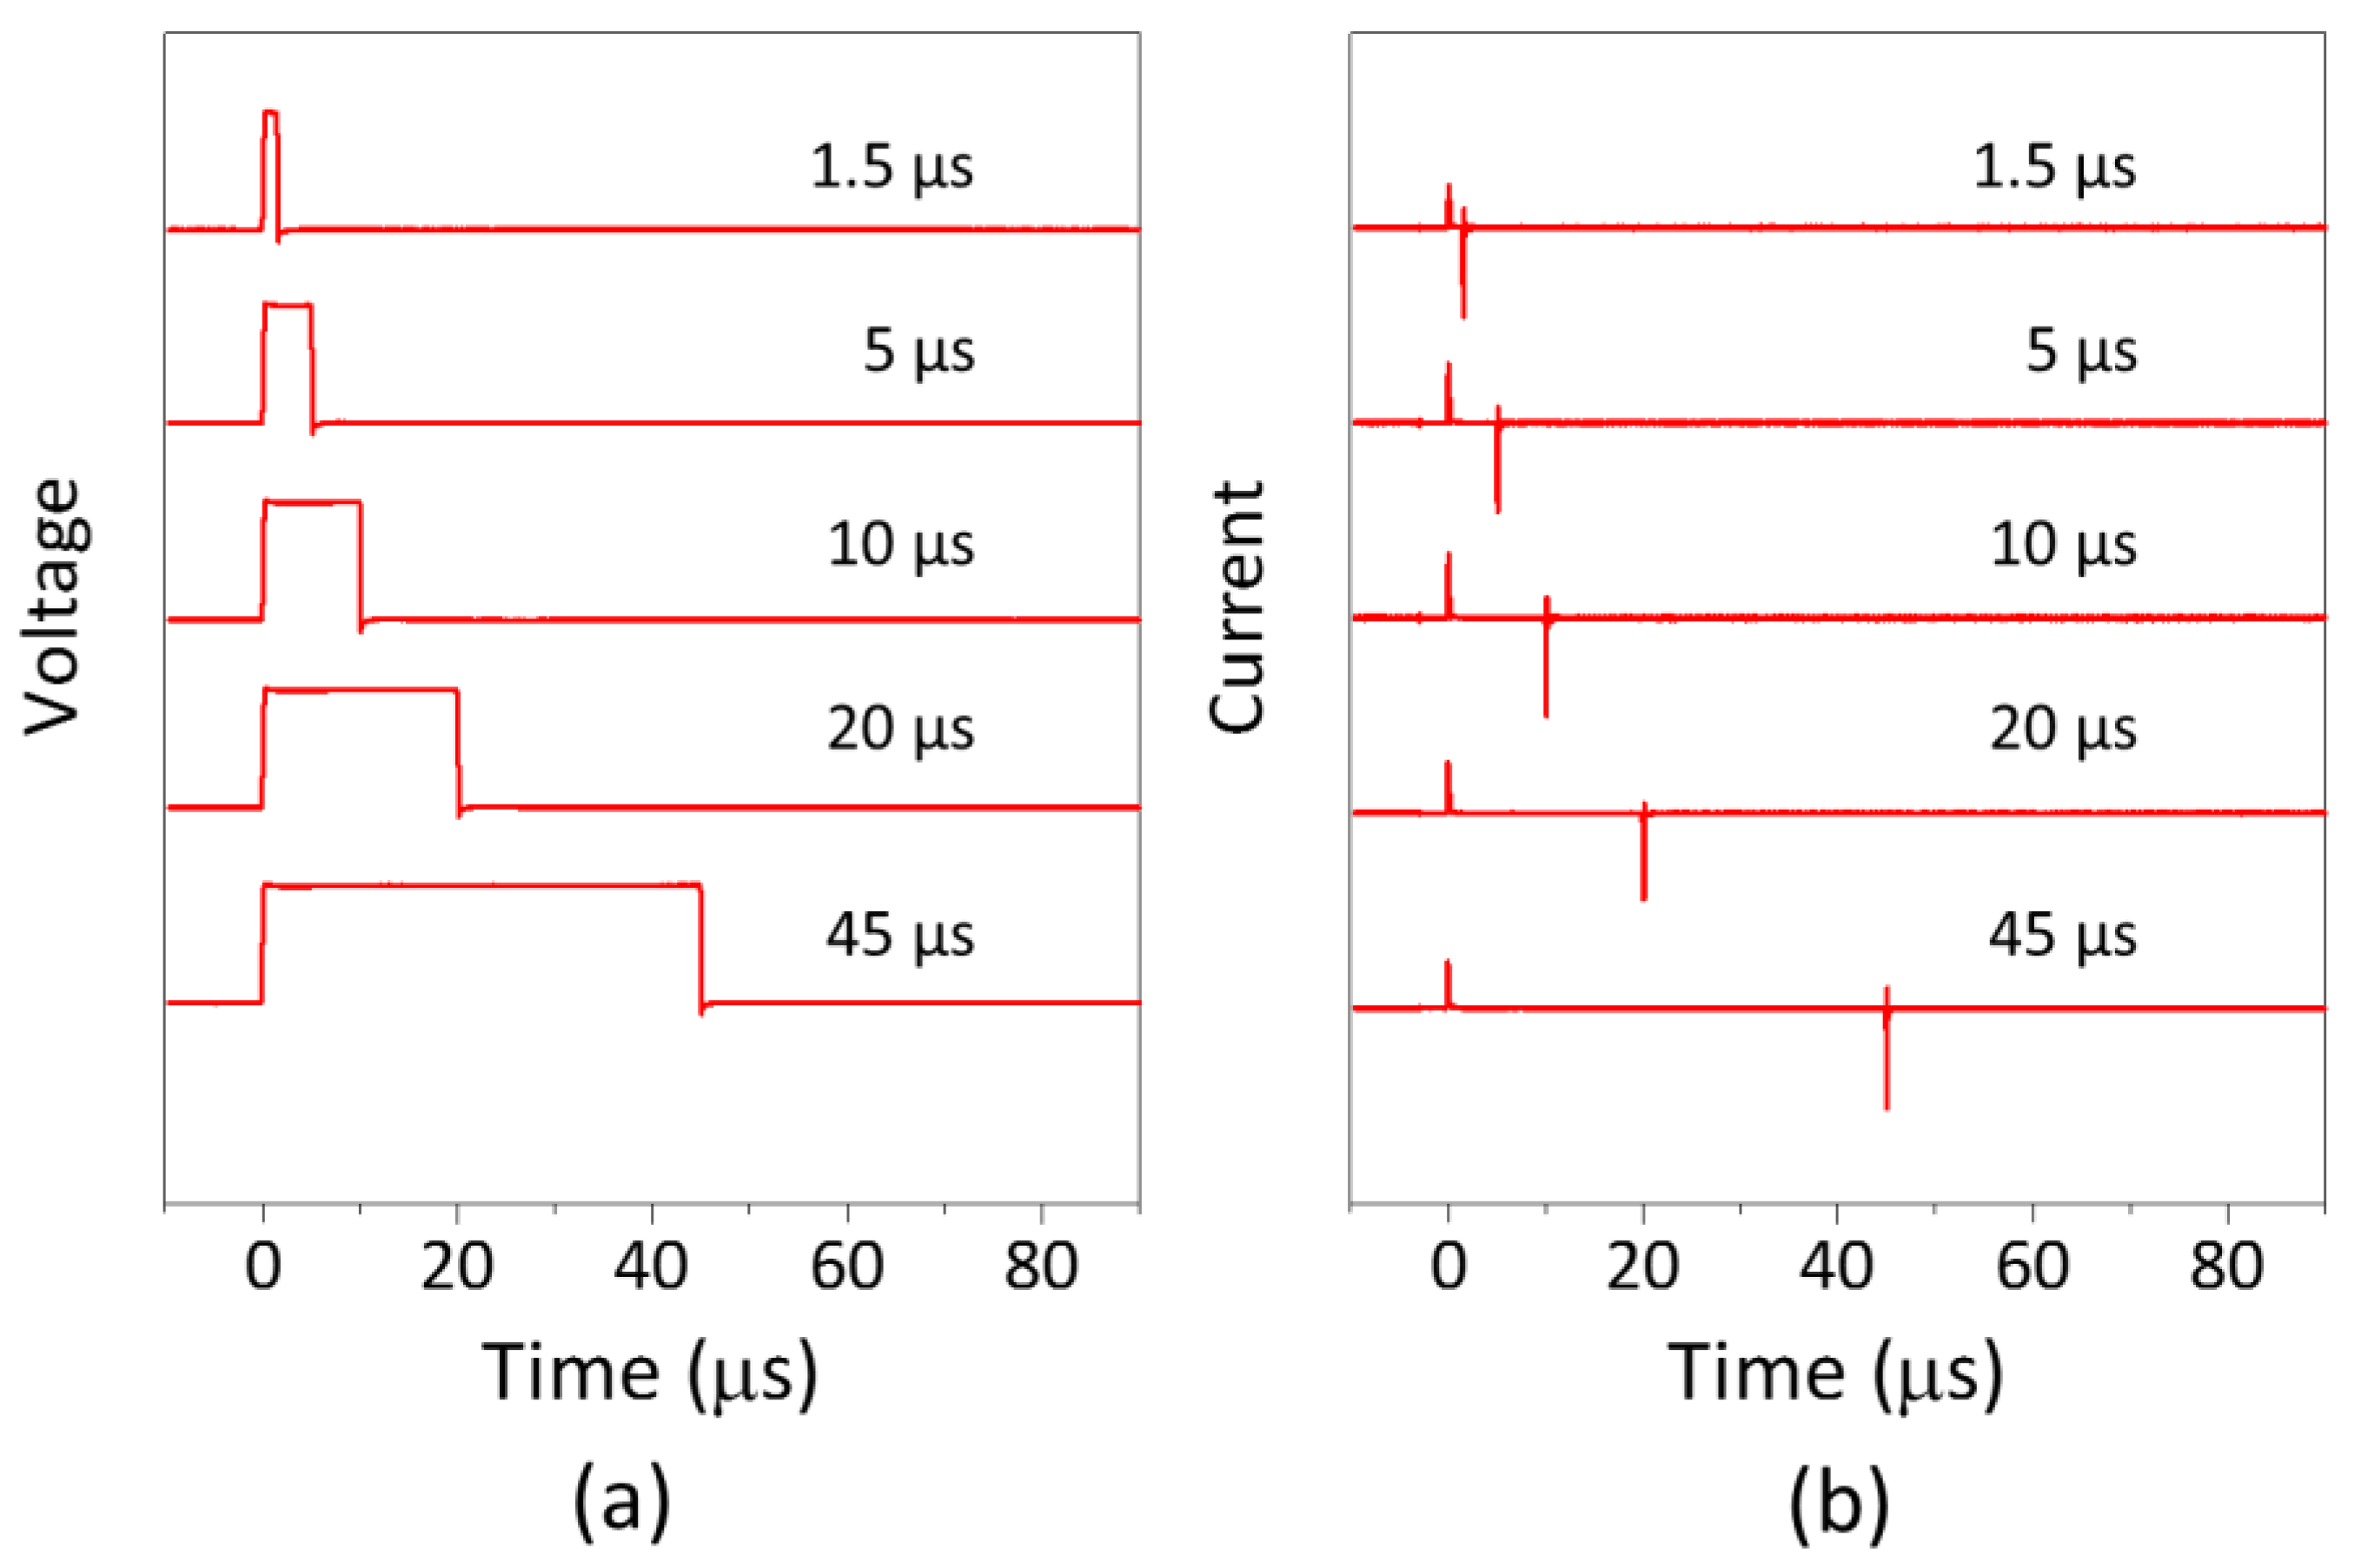
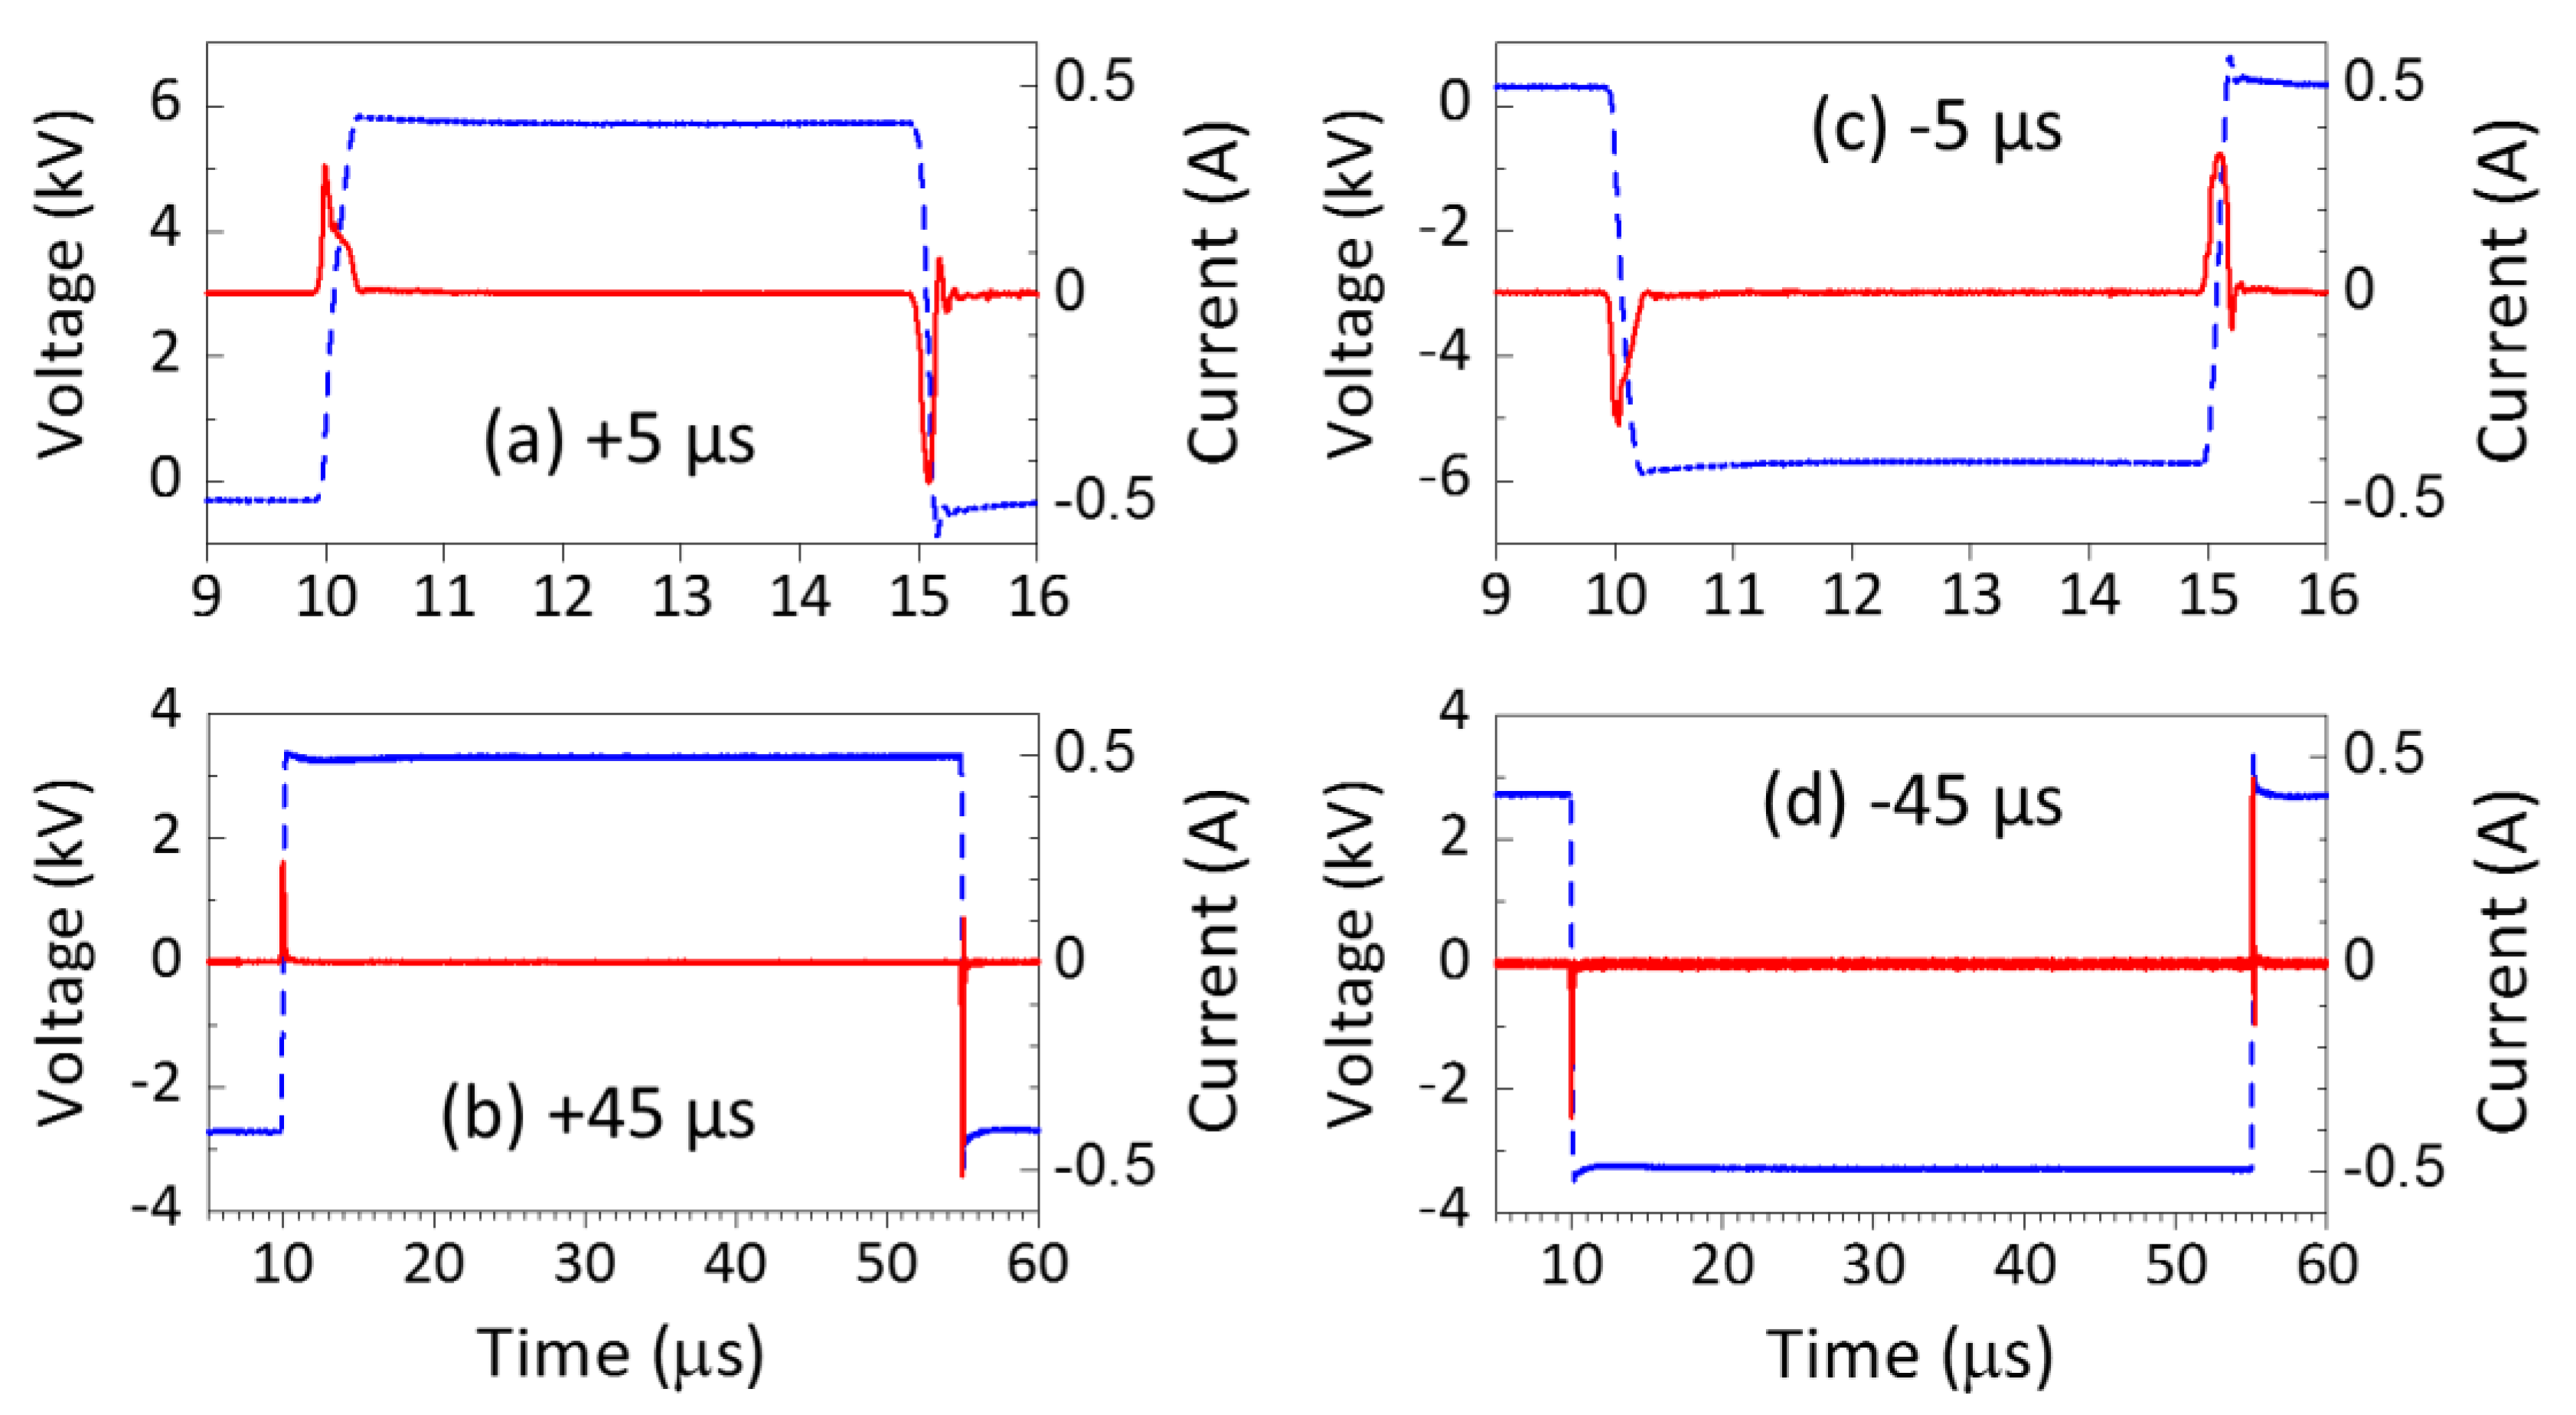
3.1. Voltage and Current Measurements

Figure 2a shows high-voltage waveforms and Figure 2b the corresponding current waveforms using a combination of both positive and negative DC-pulses, with the pulse width varied between 1.5 and 45 µs. The “spikes” in Figure 2b correspond to positive and negative discharge currents, which were regulated by the polarity of the pulse width. We hypothesized that regulation of the positive and negative discharge currents, which influence the temporal production of ionic species in the gas phase, can be an effective means of controlling the chemistry of PAW. Here, the voltage and current are synchronized by triggering at the voltage rise time. It is seen in Figure 2a,b that the positive discharge current pulse corresponds to the voltage rise time of 0 µs and the negative discharge current pulse was at the voltage fall time, respectively. Upon closer inspection of the voltage and current waveforms, each current pulse shows a single and narrow peak: the width of the discharge current pulses was around 100 ns, which is similar to the voltage rise and fall times. The discharge current pulses are very narrow as compared to the conventional discharge current pulse of continuous wave DBD plasma jets, which is typically in the order of a few µs [16], and other pulsed plasma jets typically operate with wide current pulse widths of ~10 µs with slower voltage rise and fall times [25]. The plasma jet used in this study produced narrower discharge current pulses because of the shorter pulse rise and fall times in the order of tens of ns.
Figure 3 shows more detail of the Figure 2a voltage and Figure 2b current waveforms. Figure 3 was obtained by applying positive DC pulses with pulse widths of 5 µs and 45 µs, respectively. In the use of monopolar pulses, the offset voltage level decreases with increasing pulse width for the positive pulse, and vice versa for the negative pulse, as shown in Figure 3. In the operation of DBD plasma jets, the amplitude of the applied voltage is perhaps a more important operating parameter than the absolute DC value (offset voltage) because the dielectric acts as a capacitor. Figure 3a–d show that the discharge current pulses are observed at the voltage rise and fall for the two pulse widths (5 µs and 45 µs). Overall, these results show that the monopolar pulses controlled the ignition of the positive and negative discharges, and therefore by inference, should also control the production of the positive and negative ionic species generated in the gas phase [24]. The next part of the study was performed to assess if the observed differences in the temporal electrical discharge characteristics of the plasma jet influenced the chemistry of PAW.

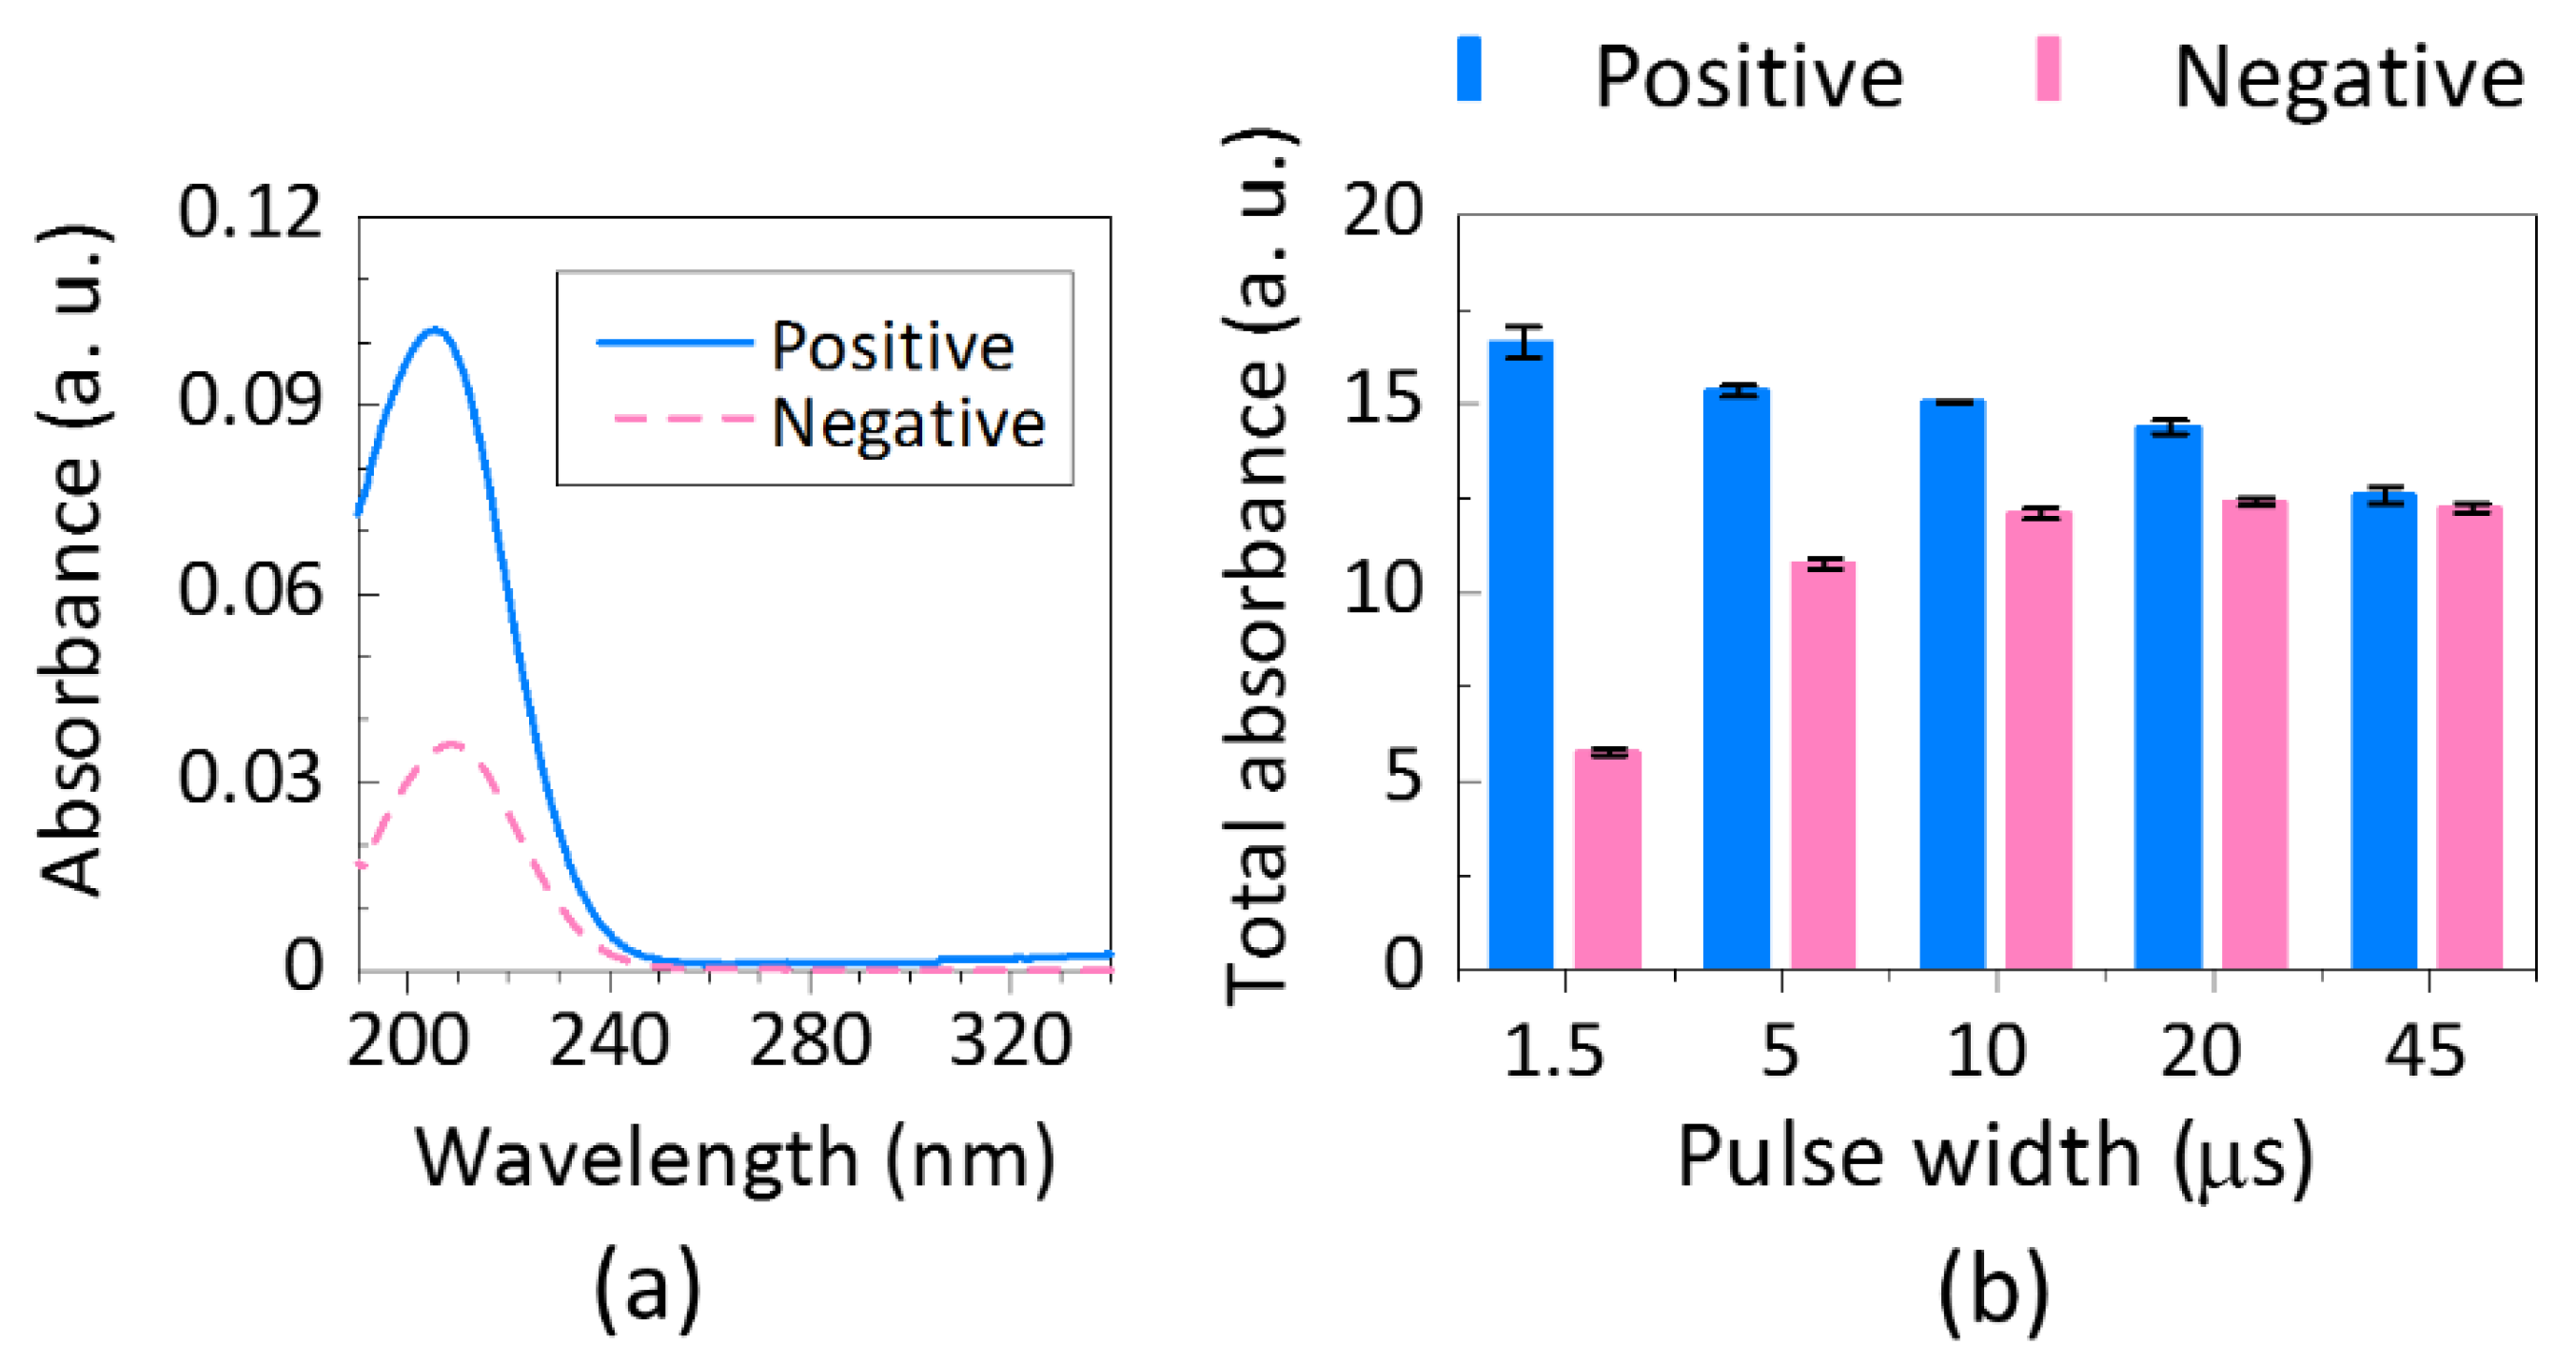
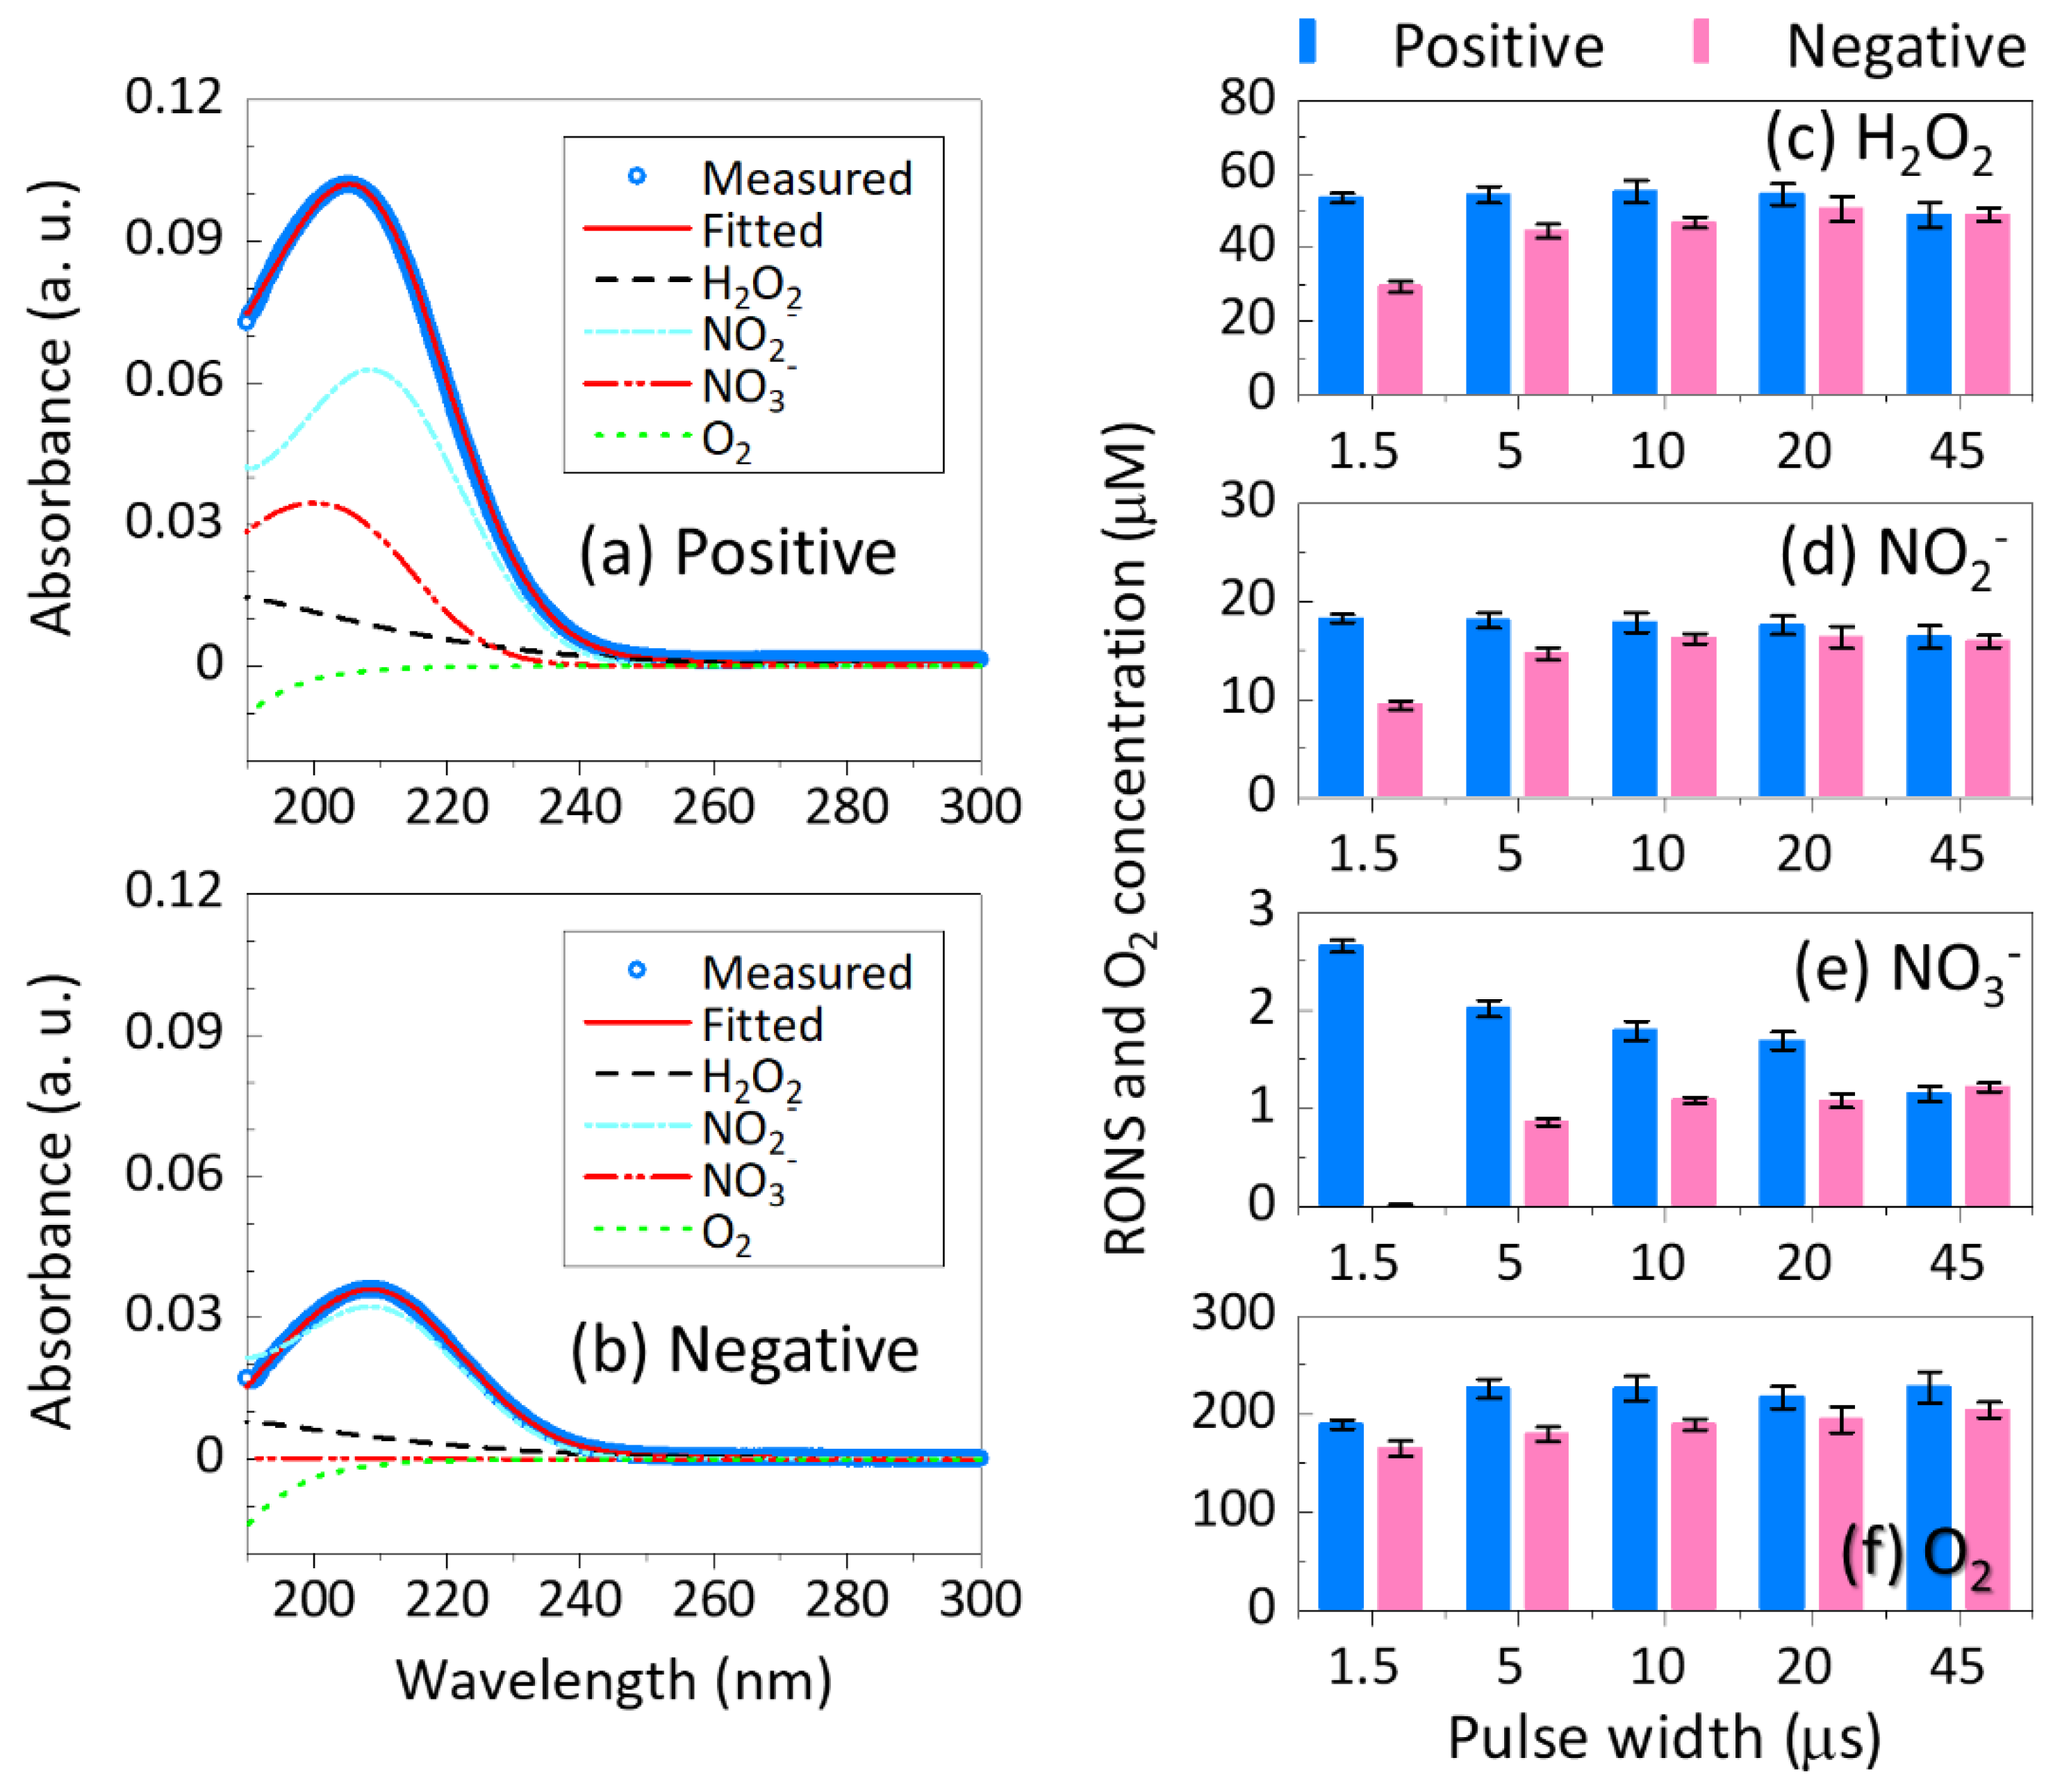
3.2. UV Absorption Spectroscopy

Figure 4a shows typical UV absorption spectra of PAW prepared with positive and negative pulses at a fixed voltage amplitude of 6 kVp-p, a pulse width of 5 µs, a treatment time of 10 min, a He flow rate of 0.5 slpm, and a treatment distance of 10 mm. The UV spectrum can be used to ascertain the chemistry of the major longer-lived molecules in PAW [22,23]. The UV absorption spectra for PAW obtained with the positive and negative pulsed plasma jets appear to be similar, but there are important subtle differences between the spectra that reveal differences in chemistry (that will be discussed below). Also, the peak intensity of the UV absorption spectrum was 3-fold for the PAW obtained with the positive pulsed polarity compared to the negative pulsed polarity.
The total UV absorbance in the range of 190–340 nm gives an indication of the total combined concentrations of H2O2, NO2, NO3, and O2, as well as other molecules in PAW [32,36]. Figure 4b shows the total absorbance plotted with increasing pulse width for both the positive and negative polarity plasma jets. The trend in total absorbance is opposite between the polarities: for the positive pulsed plasma jet, the total UV absorbance decreased with increasing pulse width, and vice versa for the negative pulsed plasma jet. We note that, under the parameters tested in this study, the positive pulsed plasma jet produced higher total UV absorbance values compared to the negative pulsed plasma jet; however, extrapolating from the trends in Figure 4b, it is likely that the UV absorbance would be higher for the negative pulsed plasma jet at pulse widths greater than 45 µs.
The opposing trends can be explained by the relative UV absorptivity of the major long-lived molecules (H2O2, NO2, NO3, and O2) in PAW. In previous studies, compared to H2O2, NO2, and O2, it was shown that the UV absorbance is most sensitive to changes in NO3, due to it having the highest UV absorptivity out of the four molecules [22,33]. This is the reason why in this study, the trends in total absorbance closely follow the trends in the concentration of NO3, despite the concentration of NO3 being much lower compared to the other molecules (Figure 5c–f; Figure 5 is discussed directly below).
An automated curve fitting routine, previously described in [22], was used to quantify the concentrations of H2O2, NO2, NO3, and O2 in PAW from the UV absorbance spectra. Figure 5a,b show examples of curve-fitted UV absorbance spectra of PAW produced with the positive and negative polarity plasma jets, respectively. Prominent positive peaks (above 0) were fitted for H2O2, NO2, and NO3, and were attributed to the plasma jets generating these molecules in the DI water. Negative peaks were fitted for O2, and were attributed to a decrease of the O2 concentration in the DI water caused by the He gas flow from the plasma jets purging O2 out of the DI water [34,38]. From the curve fitting results, we determined that the He plasma jet mainly produced H2O2 in the range of 48.9–55.3 µM and 29.4–50.6 µM for the positive and negative polarity plasma jets, respectively (Figure 5c). The next highest was NO2 in the range of 16.4–18.3 µM and 9.4–16.3 µM for the positive and negative polarity plasma jets, respectively (Figure 5d). The concentration of NO3 was much lower, in the order of 1.2–2.7 µM and 0.02–1.2 µM for the positive and negative polarity plasma jets, respectively (Figure 5d). The O2 concentration increased with increasing pulse width for both the positive and negative pulse plasma jets (Figure 5e). The trends in the concentrations of all four molecules as a function of pulse width were different. The concentration of H2O2 increased with increasing pulse width for PAW produced with the positive and negative polarity plasma jets up to 20 µs, but decreased between 20 and 45 µs. The concentration of NO2 remained constant between 1.5 and 20 µs and then decreased between 20 and 45 µs for the positive polarity plasma jet; whereas, for the negative polarity plasma jet, it increased from 1.5 to 10 µs and then remained relatively constant between 10 and 45 µs. The concentration of NO3 decreased with increasing pulse width for the positive pulse plasma jet but increased with increasing pulse width for the negative pulse plasma jet. The variability in the trends in these data suggest that other factors (apart from the pulse regime) are also influencing the chemistry of PAW, which could include temporal changes in the plasma jet (e.g., the length and intensity of the plume) and temporal changes in the DI water, including temperature and pH, which ultimately influence the longer-term PAW chemistry.

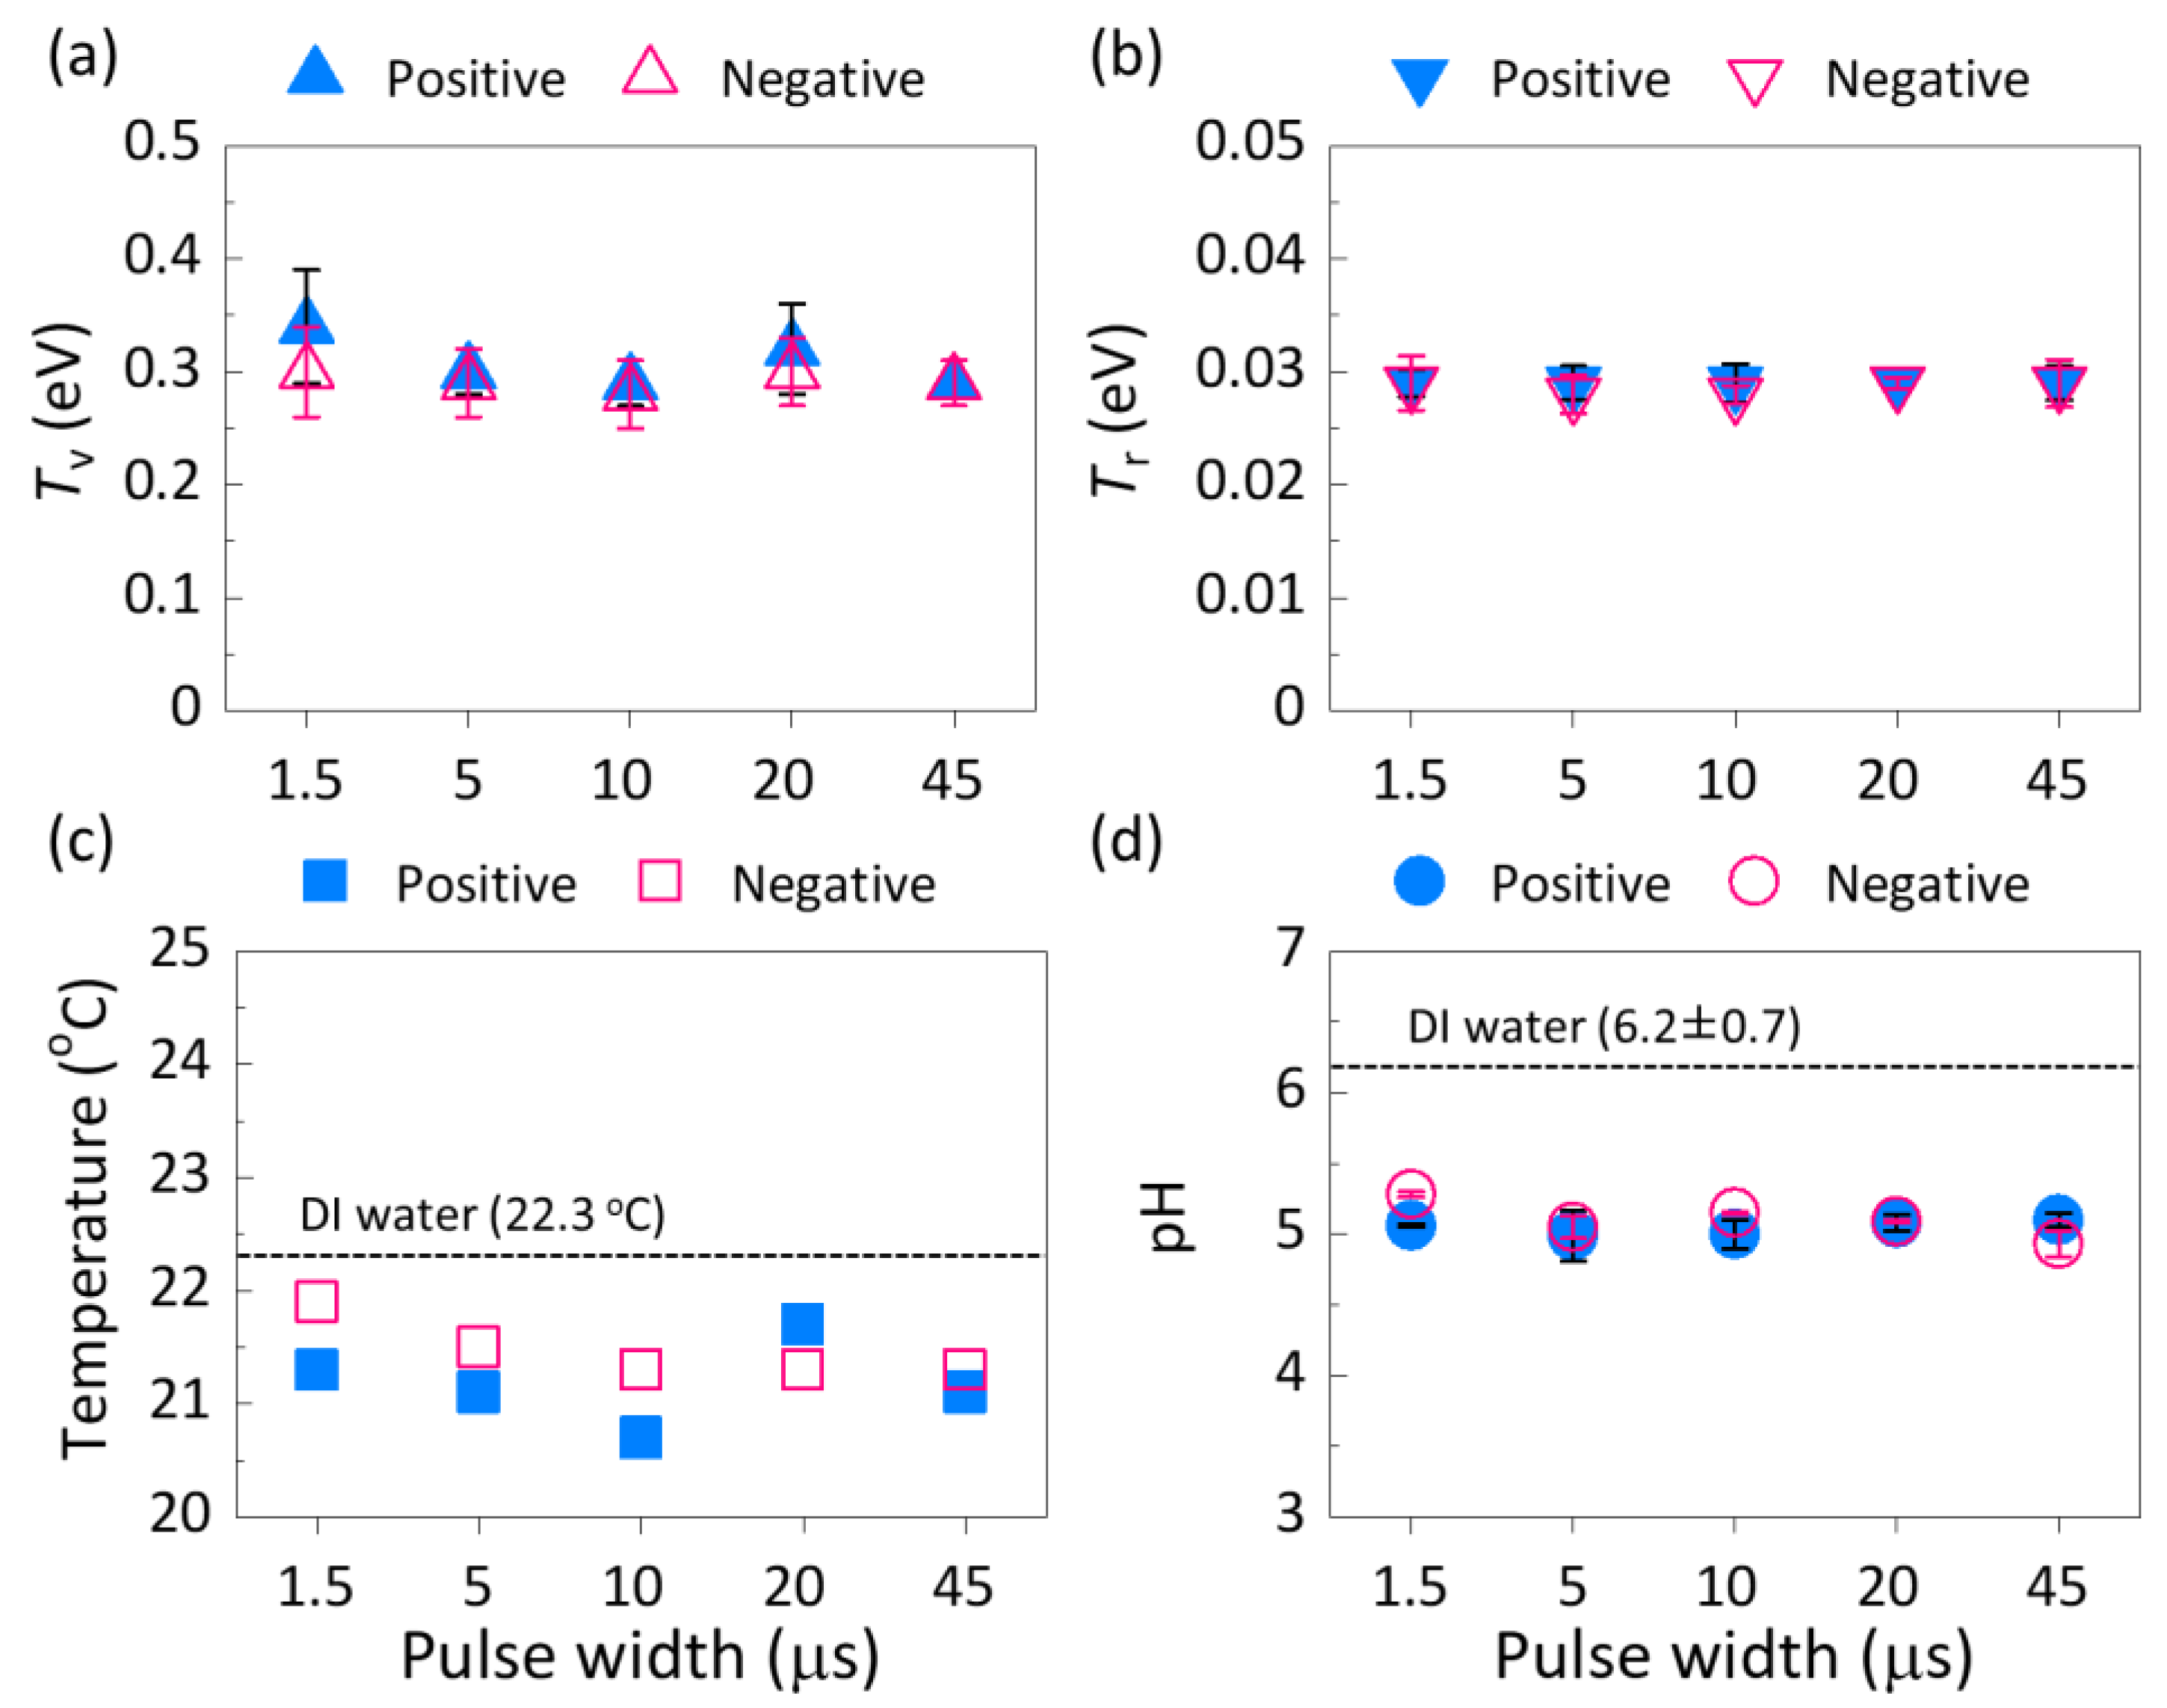
3.3. Plasma Parameters and pH

We measured the electron temperature (Te) of the plasma jets, as well as the final temperature and pH of the DI water, which were measured directly after completion of each plasma jet treatment (discussed directly below). In order to derive further insights into how the positive and negative pulsed plasma jets influence the DI water chemistry, we also measured the changes in the vibrational and rotational electron energy for both plasma jets (Tv and Tr, respectively), as well as changes in the temperature and pH of the DI water. Figure 6a,b show the results of the Tv and Tr, respectively [as determined by optical emission spectroscopy (OES)]. It is seen that the Tv and Tr values are similar for the positive and negative pulsed plasma jets and did not significantly vary with pulse width, with values of approximately 0.3 eV and 0.03 eV, respectively. The Tv and Tr values are higher than we recently measured for similar plasma jet configurations operated with a high-voltage bipolar square wave pulse in two separate studies [34,39]; this is despite a lower applied voltage used in this present study compared to the previous two studies. The reason for the higher Tv and Tr values in this study is because of an increase in the population of higher energetic electrons with a rapid change in the voltage amplitude. We attributed the higher Te in this study, compared to our previous studies, to the pulsed conditions employed here that increase the inelastic collisions between electrons with ambient air molecules (oxygen and nitrogen), which may have also facilitated the resultant chemistry observed in the plasma-treated DI water [40]. The Tr is considered as the Tg, which we calculated to be ~300 K, and therefore we did not expect the plasma jet treatments to result in appreciable heating of the DI water. In fact, as seen in Figure 6c, the plasma jet treatments resulted in a slight cooling of the DI water, which was caused by the helium gas flow from the plasma jets evaporating a small amount of the DI water during treatment (i.e., an evaporative cooling effect). As expected from previous studies [10,15,41], the plasma jet treatments resulted in a slight decrease in the pH of the DI water, with similar trends observed for the positive and negative pulse plasma jets (Figure 6d). It is likely that the pH of the DI water decreases during and post plasma jet treatment, due to the generation of nitric/peroxynitric acid [13,42].
Overall, the data presented in this study highlight the opportunity of being able to tune the PAW chemistry by alteration of the polarity and pulse width of a plasma jet. In previous studies, other parameters that have been shown to significantly impact the PAW chemistry include the process gas [34], surrounding gas [19,20,21,23,43], and treatment distance [22,33,44]. By considering all of these parameters, it should be possible to fine-tune each of the processing parameters in order to achieve precise control over the PAW chemistry. This will enable the future development of highly reproducible and precise PAW formulations that can be tailored for use across a wide variety of applications (e.g., from developing specific PAW formulations for enhancing plant growth to destroying diseased cells in cancer therapy).

4. Conclusions

The results presented in this study show that the concentrations of H2O2, NO2, NO3, and O2, generated in DI water with a DC-pulse-driven non-thermal atmospheric-pressure plasma jet, are sensitive to changes in the pulse polarity and pulse width of the plasma jet. When the plasma jet was operated with a positive pulse, higher concentrations of H2O2, NO2, and NO3 were generated at the shorter pulse widths, with the opposite trend observed for the negative pulsed plasma jet. For both the positive and negative pulsed plasma jets, the O2 concentration increased with increasing pulse width. Overall, these results indicate that it is possible to control the PAW chemistry produced with a DC-pulse-driven non-thermal atmospheric-pressure He plasma jet by adjusting the pulse polarity and pulse width.

Author Contributions

Conceptualization, J.-S.O., E.J.S., and M.I.; methodology, J.-S.O. and T.S.; formal analysis, A.H.; investigation, J.-S.O.; writing—original draft preparation, J.-S.O. and E.J.S.; writing—review and editing, J.-S.O. and E.J.S.; supervision, M.I., A.H., and T.S.

Funding

This research was funded by JSPS KAKENHI (Grant Number JP17K05099), the MEXT-Supported Program for the Strategic Research Foundation at Private Universities (Grant Number S1511021), and the Australian Research Council (Discovery Project Number DP16010498).

Acknowledgments

J.-S.O. acknowledges a JSPS KAKENHI (Grant Number JP17K05099). J.-S.O. and M.I. acknowledge the MEXT-Supported Program for the Strategic Research Foundation at Private Universities (S1511021) and the Project for Promoting Research Center in Meijo University. E.J.S. acknowledges the Australian Research Council for financial support of this study through Discovery Project Number DP16010498.

Conflicts of Interest

The authors declare no conflict of interest.

References

  1. Ikawa, S.; Kitano, K.; Hamaguchi, S. Effects of pH on bacterial inactivation in aqueous solutions due to low-temperature atmospheric pressure plasma application. Plasma Process. Polym. 2010, 7, 33–42. [Google Scholar] [CrossRef]
  2. Foster, J.; Sommers, B.S.; Gucker, S.N.; Blankson, I.M.; Adamovsky, G. Perspectives on the interaction of plasmas with liquid water for water purification. IEEE Trans. Plasma Sci. 2012, 40, 1311. [Google Scholar] [CrossRef]
  3. Jung, S.; Kim, H.J.; Park, S.; Yong, H.I.; Choe, J.H.; Jeon, H.-J.; Choe, W.; Jo, C. The use of atmospheric pressure plasma-treated water as a source of nitrite for emulsion-type sausage. Meat Sci. 2015, 108, 132–137. [Google Scholar] [CrossRef] [PubMed]
  4. Tasaki, T.; Ohshima, T.; Usui, E.; Ikawa, S.; Kitano, K.; Maeda, N.; Momo, Y. Plasma-treated water eliminates Streptococcus mutans in infected dentin model. Dent. Mater. J. 2016, 36, 422. [Google Scholar] [CrossRef]
  5. Oehmigen, K.; Hähnel, M.; Brandenburg, R.; Wilke, C.; Weltmann, K.-D.; von Woedtke, T. The role of acidification for antimicrobial activity of atmospheric pressure plasma in liquids. Plasma Process. Polym. 2010, 7, 250–257. [Google Scholar] [CrossRef]
  6. Oehmigen, K.; Winter, J.; Hähnel, M.; Brandenburg, R.; Wilke, C.; Weltmann, K.-D.; von Woedtke, T. Estimation of possible mechanisms of Escherichia coli inactivation by plasma treated sodium chloride solution. Plasma Process. Polym. 2011, 8, 904–913. [Google Scholar] [CrossRef]
  7. Traylor, M.J.; Pavlovich, M.J.; Karim, S.; Hait, P.; Sakiyama, Y.; Clark, D.S.; Graves, D.B. Long-term antibacterial efficacy of air plasma-activated water. J. Phys. D Appl. Phys. 2011, 44, 472001. [Google Scholar] [CrossRef]
  8. Takai, E.; Kitano, K.; Kuwabara, J.; Shiraki, K. Protein inactivation by low-temperature atmospheric pressure plasma in aqueous solution. Plasma Processes Polym. 2012, 9, 77–82. [Google Scholar] [CrossRef]
  9. Burlica, R.; Grim, R.G.; Shih, K.-Y.; Balkwill, D.; Locke, B.R. Bacteria inactivation using low power pulsed gliding arc discharges with water spray. Plasma Process. Polym. 2012, 7, 640–649. [Google Scholar] [CrossRef]
  10. Julák, J.; Scholtz, V.; Kotúčová, S.; Janoušková, O. The persistent microbicidal effect in water exposed to the corona discharge. Phys. Med. 2012, 28, 230–239. [Google Scholar] [CrossRef]
  11. Kitano, K.; Ikawa, S.; Tani, A.; Nakashima, Y.; Yamazaki, H.; Ohshima, T.; Kaneko, K.; Ito, M.; Kuwata, T.; Yagishita, A. Freezing preservation of the plasma treated water for disinfection treatment in dental and surgical therapies based on the reduced pH method. In Proceedings of the 21st International Symposium Plasma Chemistry, Cairns, Australia, 4–9 August 2013; Cairns Convention Centre: Cairns City, Australia. [Google Scholar]
  12. Takai, E.; Kitamura, T.; Kuwabara, J.; Ikawa, S.; Yoshzawa, S.; Shiraki, K.; Kawasaki, H.; Arakawa, R.; Kitano, K. Chemical modification of amino acids by atmospheric-pressure cold plasma in aqueous solution. J. Phys. D Appl. Phys. 2014, 47, 285403. [Google Scholar] [CrossRef]
  13. Lukes, P.; Dolezalova, E.; Sisrova, I.; Clupek, M. Aqueous-phase chemistry and bactericidal effects from an air discharge plasma in contact with water: Evidence for the formation of peroxynitrite through a pseudo-second-order post-discharge reaction of H2O2 and HNO2. Plasma Sour. Sci. Technol. 2014, 23, 015019. [Google Scholar] [CrossRef]
  14. Kobayashi, T.; Iwata, N.; Oh, J.-S.; Hashizume, H.; Ohta, T.; Takeda, K.; Ishikawa, K.; Hori, M.; Ito, M. Bactericidal pathway of Escherichia coli in buffered saline treated with oxygen radicals. J. Phys. D Appl. Phys. 2017, 50, 155208. [Google Scholar] [CrossRef]
  15. Naïtali, M.; Kamgang-Youbi, G.; Herry, J.-M.; Bellon-Fontaine, M.-N.; Brisset, J.-L. Combined effects of long-living chemical species during microbial inactivation using atmospheric plasma-treated water. Appl. Environ. Microbiol. 2010, 76, 7662. [Google Scholar] [CrossRef] [PubMed]
  16. Oh, J.-S.; Aranda-Gonzalvo, Y.; Bradley, J.W. Time-resolved mass spectroscopic studies of an atmospheric-pressure helium microplasma jet. J. Phys. D Appl. Phys. 2011, 44, 365202. [Google Scholar] [CrossRef]
  17. McKay, K.; Oh, J.-S.; Walsh, J.L.; Bradley, J.W. Mass spectrometric diagnosis of an atmospheric pressure helium microplasma jet. J. Phys. D Appl. Phys. 2013, 46, 464018. [Google Scholar] [CrossRef]
  18. Oh, J.-S.; Furuta, H.; Hatta, A.; Bradley, J.W. Investigating the effect of additional gases in an atmospheric-pressure helium plasma jet using ambient mass spectrometry. Jpn. J. Appl. Phys. 2015, 54, 01AA03. [Google Scholar] [CrossRef]
  19. Tani, A.; Ono, Y.; Fukui, S.; Ikawa, S.; Kitano, K. Free radicals induced in aqueous solution by non-contact atmospheric-pressure cold plasma. Appl. Phys. Lett. 2012, 100, 254103. [Google Scholar] [CrossRef]
  20. Uchida, G.; Nakajima, A.; Ito, T.; Takenaka, K.; Kawasaki, T.; Koga, K.; Shiratani, M.; Setsuhara, Y. Effects of nonthermal plasma jet irradiation on the selective production of H2O2 and NO2 in liquid water. J. Appl. Phys. 2016, 120, 203302. [Google Scholar] [CrossRef]
  21. Ito, T.; Uchida, G.; Nakajima, A.; Takenaka, K.; Setsuhara, Y. Control of reactive oxygen and nitrogen species production in liquid by nonthermal plasma jet with controlled surrounding gas. Jpn. J. Appl. Phys. 2017, 56, 01A06. [Google Scholar] [CrossRef]
  22. Oh, J.-S.; Szili, E.J.; Ogawa, K.; Short, R.D.; Ito, M.; Furuta, H.; Hatta, A. UV–vis spectroscopy study of plasma-activated water: Dependence of the chemical composition on plasma exposure time and treatment distance. Jpn. J. Appl. Phys. 2018, 57, 0102B9. [Google Scholar] [CrossRef]
  23. Ogawa, K.; Yajima, H.; Oh, J.-S.; Furuta, H.; Hatta, A. Effects of sheath gas flow on He atmospheric pressure plasma jet. Appl. Phys. Express. 2019, 12, 036001. [Google Scholar] [CrossRef]
  24. Oh, J.-S.; Walsh, J.L.; Bradley, J.W. Influence of pulse width on the creation of ions in an atmospheric-pressure plasma jet. In Proceedings of the 2012 IEEE International Conference on Plasma Science, Edinburgh, UK, 8–13 July 2012. [Google Scholar]
  25. Uchida, G.; Takenaka, K.; Setsuhara, Y. Influence of voltage pulse width on the discharge characteristics in an atmospheric dielectric-barrier-discharge plasma jet. Jpn. J. Appl. Phys. 2016, 55, 01AH03. [Google Scholar] [CrossRef]
  26. Liu, Z.; Zhou, C.; Liu, D.; Xu, D.; Xia, W.; Cui, Q.; Wang, B.; Kong, M.G. Production and correlation of reactive oxygen and nitrogen species in gas- and liquid-phase generated by helium plasma jets under different pulse widths. Phys. Plasmas 2018, 25, 013528. [Google Scholar] [CrossRef]
  27. Uchida, G.; Takenaka, K.; Takeda, K.; Ishikawa, K.; Hori, M.; Setsuhara, Y. Selective production of reactive oxygen and nitrogen species in the plasma-treated water by using a nonthermal high-frequency plasma jet. Jpn. J. Appl. Phys. 2018, 57, 0102B4. [Google Scholar] [CrossRef]
  28. Bruggeman, P.J.; Kushner, M.J.; Locke, B.R.; Gardeniers, J.G.E.; Graham, W.G.; Graves, D.B.; Hofman-Caris, R.C.H.M.; Maric, D.; Reid, J.P.; Ceriani, E.; et al. Plasma–liquid interactions: A review and roadmap. Plasma Sour. Sci. Technol. 2016, 25, 053002. [Google Scholar] [CrossRef]
  29. Tachibana, K. Current status of microplasma research. IEEJ Trans. Electr. Electron. Eng. 2006, 1, 145–155. [Google Scholar] [CrossRef]
  30. Ito, Y.; Urabe, K.; Takano, N.; Tachibana, K. High speed deposition of SiO2 films with plasma jet based on capillary dielectric barrier discharge at atmospheric pressure. Appl. Phys. Express 2008, 1, 067009. [Google Scholar] [CrossRef]
  31. Oh, J.-S.; Olabanji, O.T.; Hale, C.; Mariani, R.; Kontis, K.; Bradley, J.W. Imaging gas and plasma interactions in the surface-chemical modification of polymers using micro-plasma jets. J. Phys. D Appl. Phys. 2011, 44, 155206. [Google Scholar] [CrossRef]
  32. Kitano, K.; Hamaguchi, S.; Aoki, H.U.S. Plasma Producing Apparatus and Method of Plasma Production. U.S. Patent 8,232,729 B2, 2012. [Google Scholar]
  33. Oh, J.-S.; Kakuta, M.; Furuta, H.; Akatsuka, H.; Hatta, A. Effect of plasma jet diameter on the efficiency of reactive oxygen and nitrogen species generation in water. Jpn. J. Appl. Phys. 2016, 55, 06HD01. [Google Scholar] [CrossRef]
  34. Oh, J.-S.; Szili, E.J.; Gaur, N.; Hong, S.-H.; Furuta, H.; Kurita, H.; Mizuno, A.; Hatta, A.; Short, R.D. How to assess the plasma delivery of RONS into tissue fluid and tissue. J. Phys. D Appl. Phys. 2016, 49, 304005. [Google Scholar] [CrossRef]
  35. Szili, E.J.; Gaur, N.; Hong, S.-H.; Kurita, H.; Oh, J.-S.; Ito, M.; Mizuno, A.; Hatta, A.; Cowin, A.J.; Graves, D.B.; et al. The assessment of cold atmospheric plasma treatment of DNA in synthetic models of tissue fluid, tissue and cells. J. Phys. D Appl. Phys. 2017, 50, 274001. [Google Scholar] [CrossRef]
  36. Oh, J.-S.; Walsh, J.L.; Bradley, J.W. Plasma bullet current measurements in a free-stream helium capillary jet. Plasma Sour. Sci. Technol. 2012, 21, 034020. [Google Scholar] [CrossRef]
  37. Koike, S.; Sakamoto, T.; Kobori, S.; Matsuura, H.; Akatsuka, H. Spectroscopic study on vibrational nonequilibrium of a microwave discharge nitrogen plasma. Jpn. J. Appl. Phys. 2004, 43, 5550–5557. [Google Scholar] [CrossRef]
  38. Oh, J.-S.; Strudwick, X.; Short, R.D.; Ogawa, K.; Hatta, A.; Furuta, H.; Gaur, N.; Hong, S.-H.; Cowin, A.J.; Fukuhara, H.; et al. How plasma induced oxidation, oxygenation, and de-oxygenation influences viability of skin cells. Appl. Phys. Lett. 2016, 109, 203701. [Google Scholar] [CrossRef]
  39. Szili, E.J.; Oh, J.-S.; Fukuhara, H.; Bhatia, R.; Gaur, N.; Nguyen, C.K.; Hong, S.-H.; Ito, S.; Ogawa, K.; Kawada, C.; et al. Modelling the helium plasma jet delivery of reactive species into a 3D cancer tumour. Plasma Sour. Sci. Technol. 2018, 27, 014001. [Google Scholar]
  40. Kurihara, J.; Iwagami, N.; Oyama, K.-I. N2 temperature of vibration instrument for sounding rocket observation in the lower thermosphere. In An Introduction to Space Instrumentation; Terrapub: Tokyo, Japan, 2003. [Google Scholar]
  41. Ogawa, K.; Oh, J.-S.; Gaur, N.; Hong, S.-H.; Kurita, H.; Mizuno, A.; Hatta, A.; Short, R.D.; Szili, E.J. Modulating the concentrations of reactive oxygen and nitrogen species and oxygen in water with helium and argon gas and plasma jets. Jpn. J. Appl. Phys. 2019, 58, SAAB01. [Google Scholar] [CrossRef]
  42. Ikawa, S.; Tani, A.; Nakashima, Y.; Kitano, K. Physicochemical properties of bactericidal plasma-treated water. J. Phys. D Appl. Phys. 2016, 49, 425401. [Google Scholar] [CrossRef]
  43. Reuter, S.; Tresp, H.; Wende, K.; Hammer, M.U.; Winter, J.; Masur, K.; Schmidt-Bleker, A.; Weltmann, K. From RONS to ROS: Tailoring plasma jet treatment of skin cells. IEEE Trans. Plasma Sci. 2012, 40, 2986. [Google Scholar] [CrossRef]
  44. Szili, E.J.; Oh, J.-S.; Hong, S.-H.; Hatta, A.; Short, R.D. Probing the transport of plasma-generated RONS in an agarose target as surrogate for real tissue: Dependency on time, distance and material composition. J. Phys. D Appl. Phys. 2015, 48, 202001. [Google Scholar] [CrossRef]
Figure 1. A diagrammatical representation of the experimental setup used to generate plasma-activated water (PAW) whilst monitoring the evolution of the PAW chemistry and voltage and current characteristics of the He plasma jet.
Plasma 02 00010 g001
Figure 2. (a) Voltage and (b) current waveforms of monopolar pulses with pulse widths varied between 1.5 and 45 µs (from top-to-bottom) with a fixed a voltage amplitude of 6 kVp-p and a frequency at 10 kHz.
Plasma 02 00010 g002
Figure 3. Overlay of the voltage and current waveforms. (a,b) are results obtained with the positive pulse using 5 µs and 45 µs pulse widths, respectively; and (c,d) are results obtained with the negative pulse using 5 µs and 45 µs pulse widths, respectively.
Plasma 02 00010 g003
Figure 4. (a) Typical UV absorption spectra between 190 and 340 nm of PAW prepared using the pulsed He plasma jet operated with positive or negative polarity at the same pulse width of 1.5 µs. (b) Total UV absorbance plotted with increasing pulse width, with all other parameters fixed: voltage amplitude = 6 kVp-p; He flow rate = 0.5 standard liters per minute (slpm); treatment distance = 10 mm; and treatment time = 10 min.
Plasma 02 00010 g004
Figure 5. The curve fitting results of H2O2, NO2, NO3, and O2 from the UV absorption spectra of PAW produced with the (a) positive and (b) negative pulsed plasma jets. Concentrations of H2O2, NO2, NO3, and O2 in PAW with various pulse widths for positive and negative pulsed plasma jets are shown in (cf).
Plasma 02 00010 g005
Figure 6. The results of (a) Tv and (b) Tr calculated from the optical emission spectroscopy (OES) spectrum for both the positive and negative pulse plasma jets with increasing pulse width. Measurements of changes in the (c) temperature and (d) pH of the deionized (DI) water after treatment with the positive and negative pulsed plasma jets.
Plasma 02 00010 g006

