Influence of the On-time on the Ozone Production in Pulsed Dielectric Barrier Discharges

 ,
,  ,
,  and
and 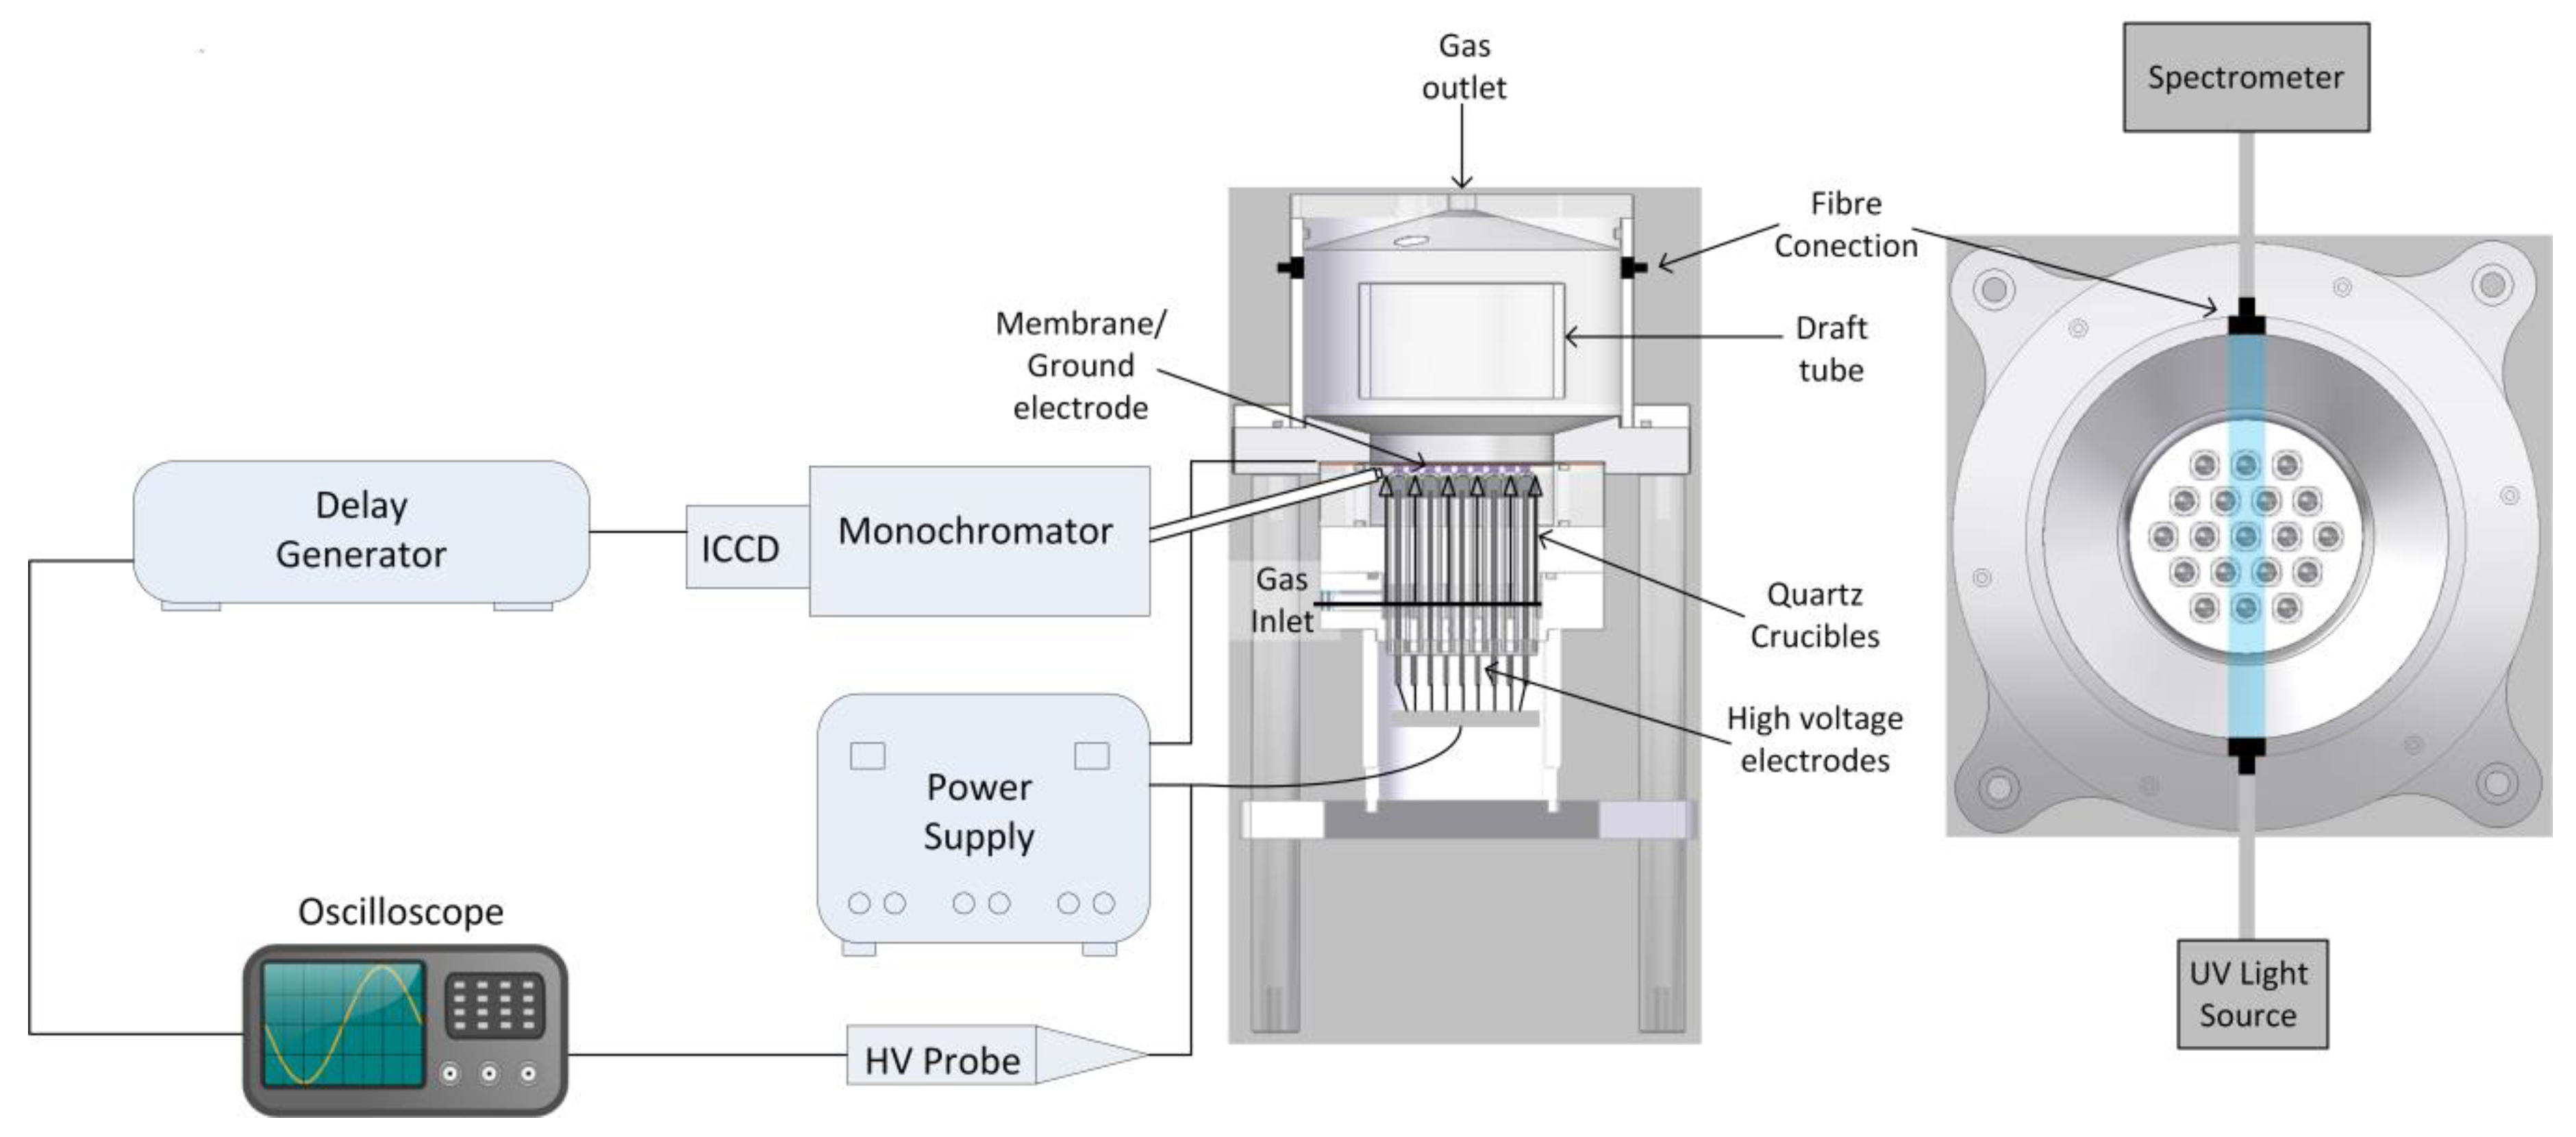
Abstract
:1. Introduction
2. Materials and Methods
2.1. Microbubble Dielectric Barrier Discharges (DBD) Plasma Reactor
2.2. Power Supply
2.3. Ozone Measurements
2.4. Temperature Measurements
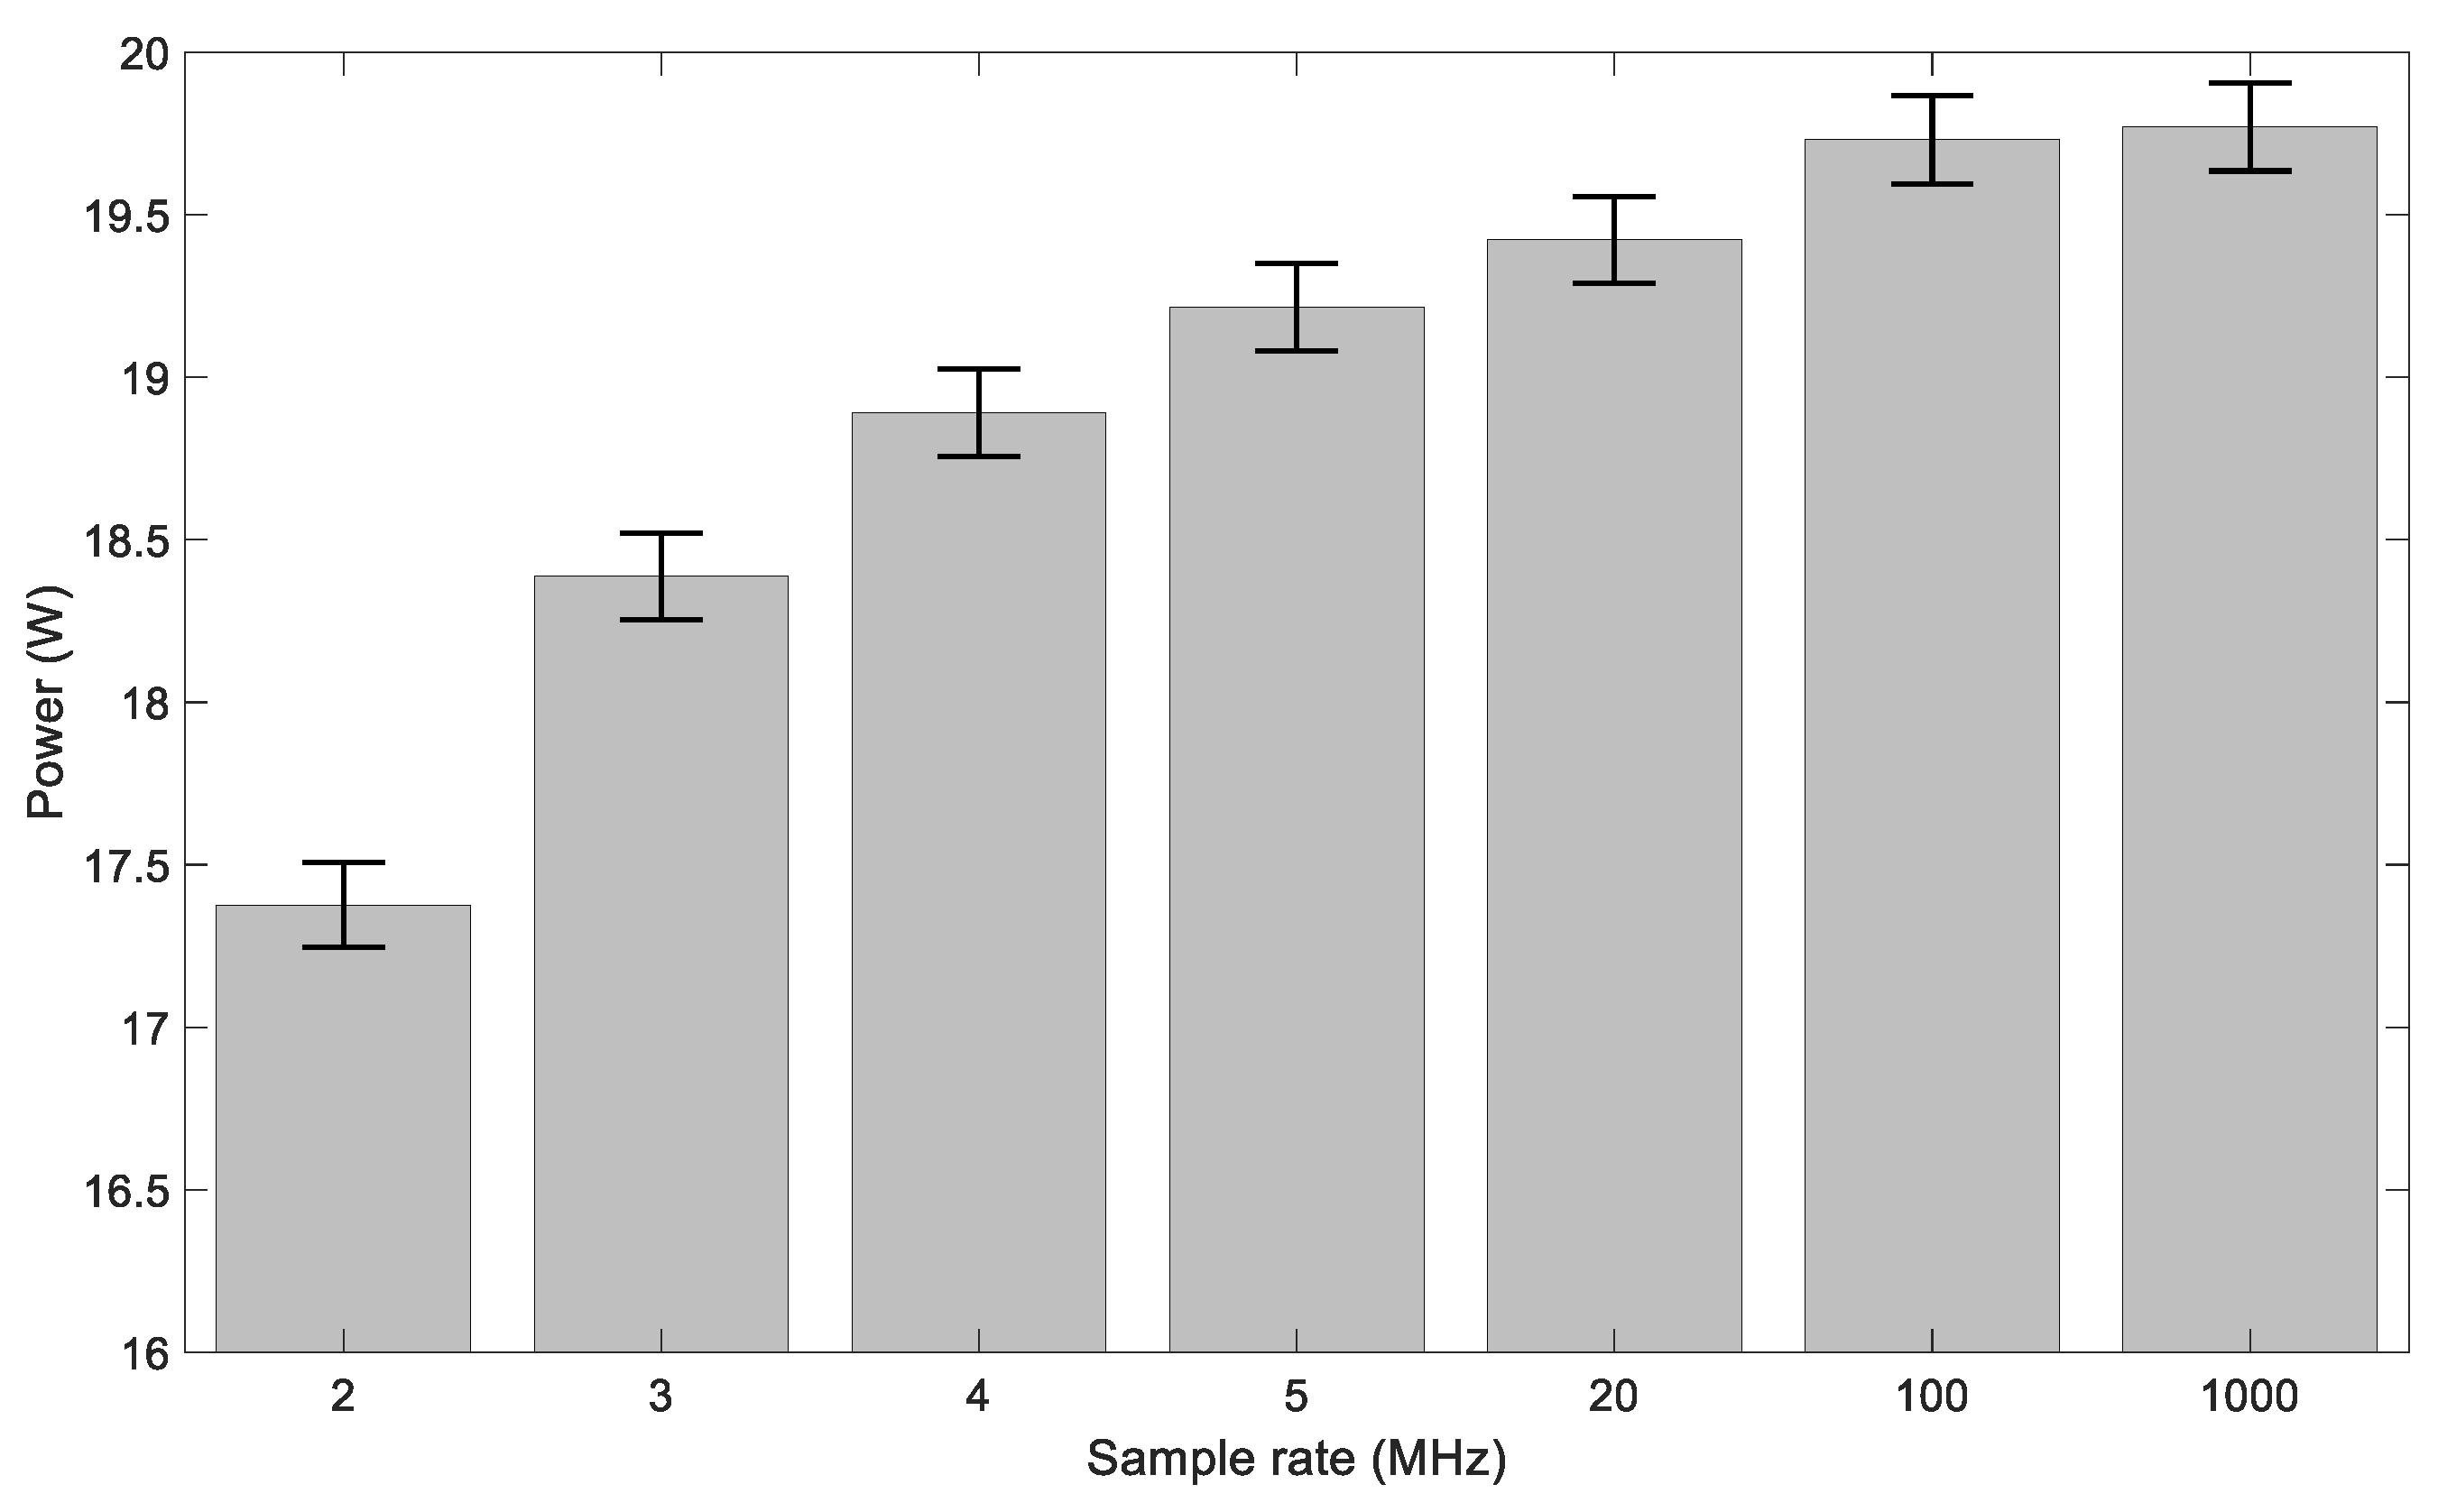
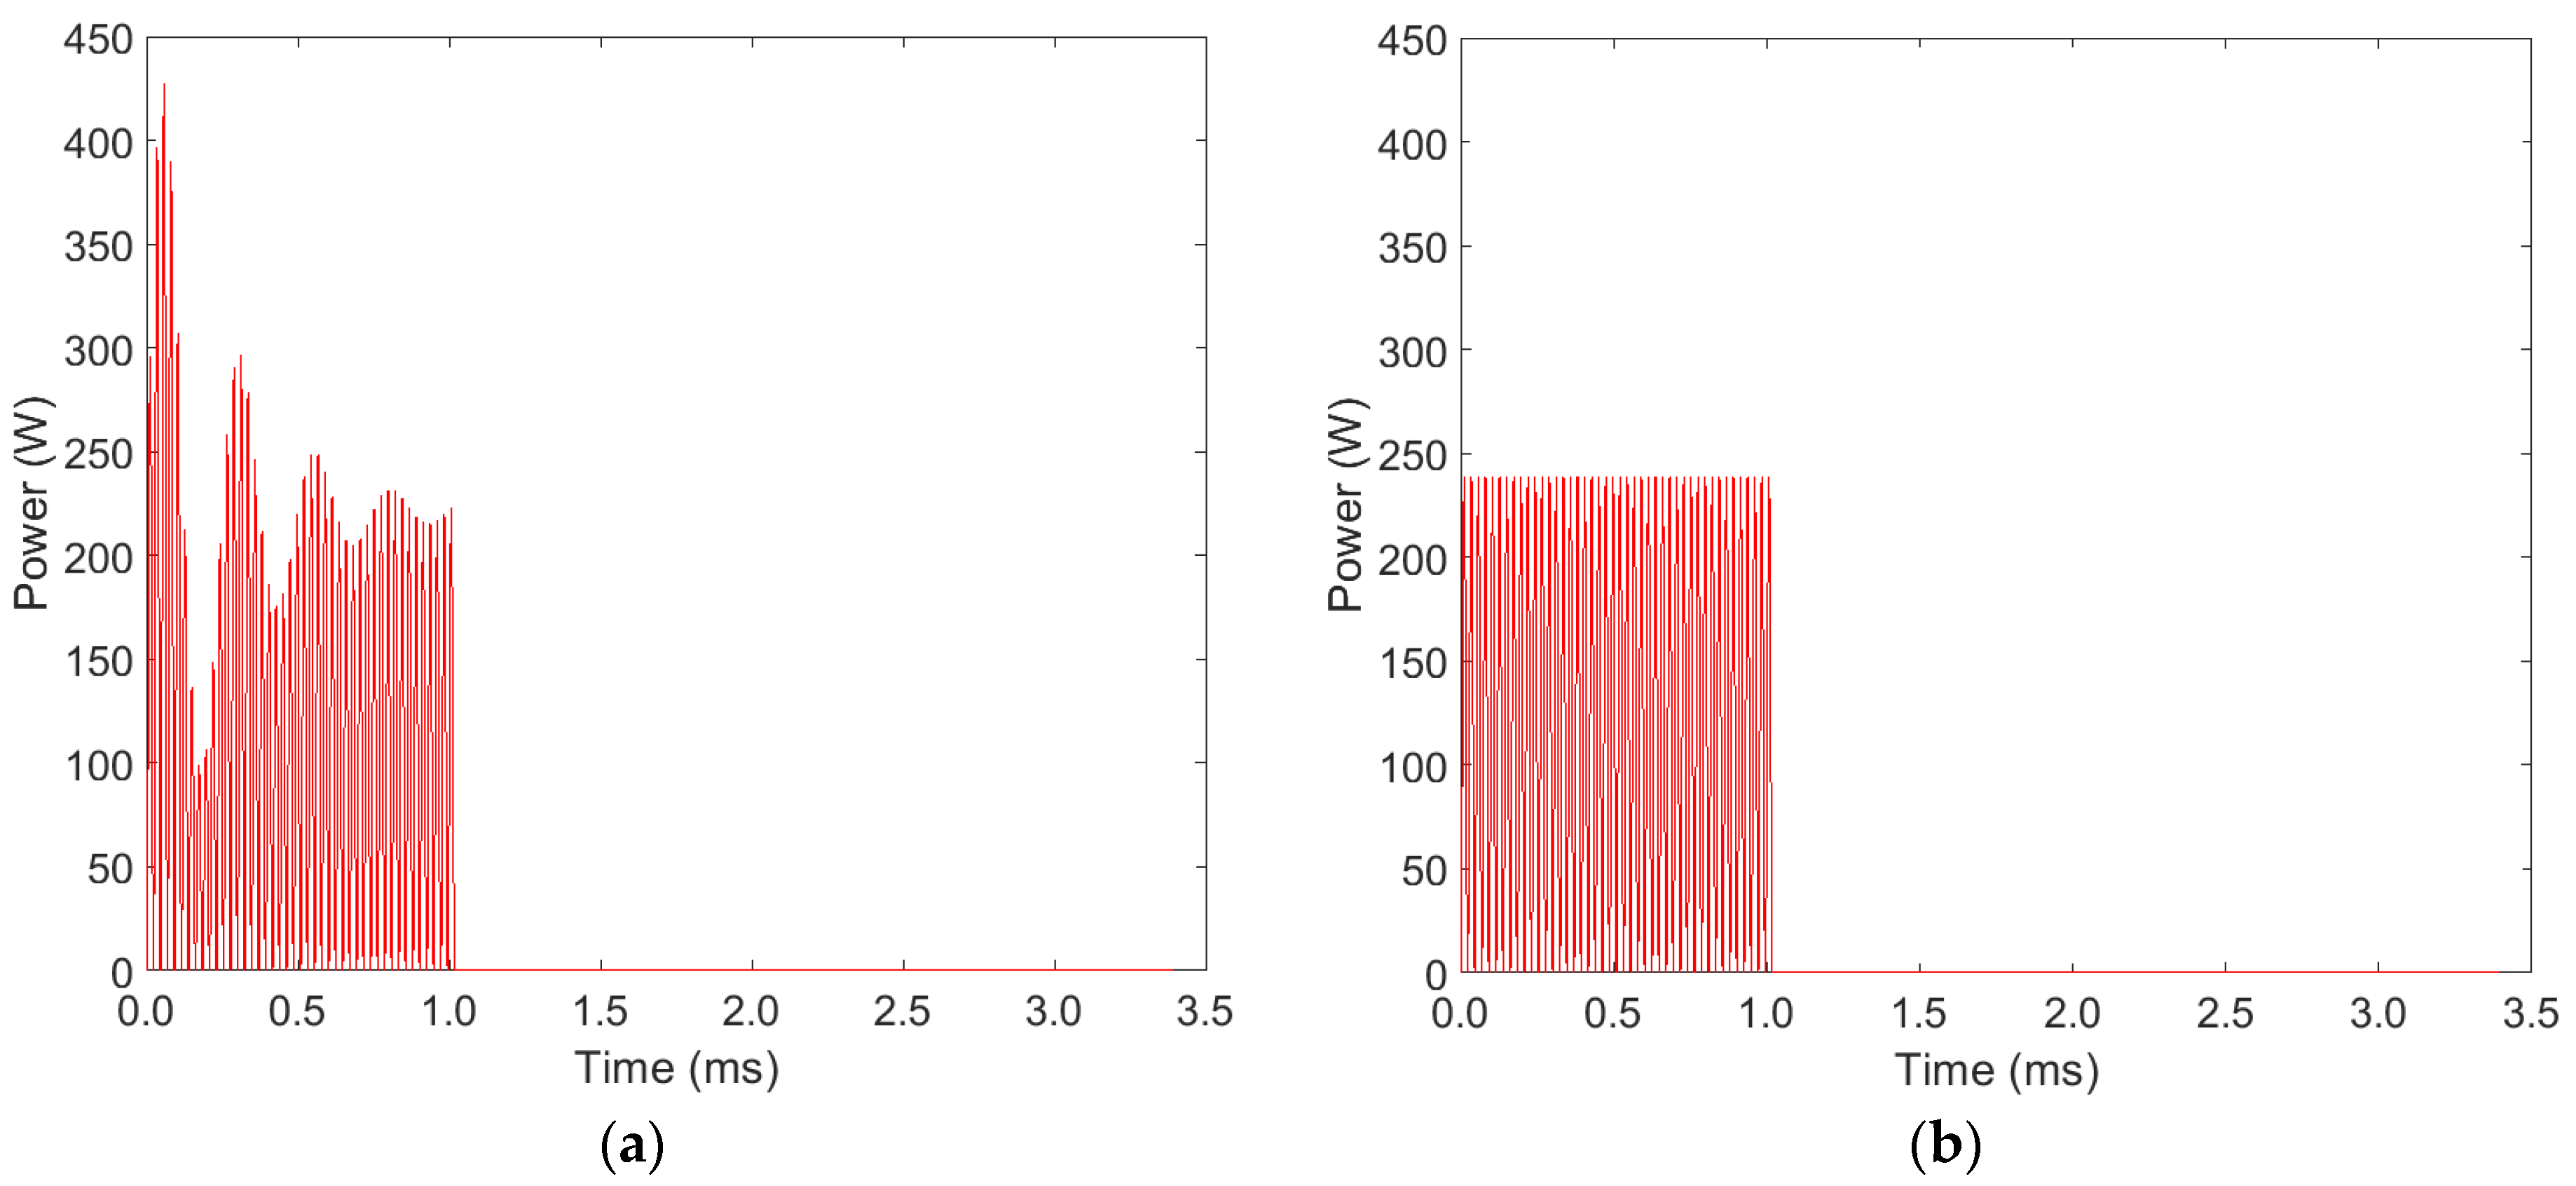
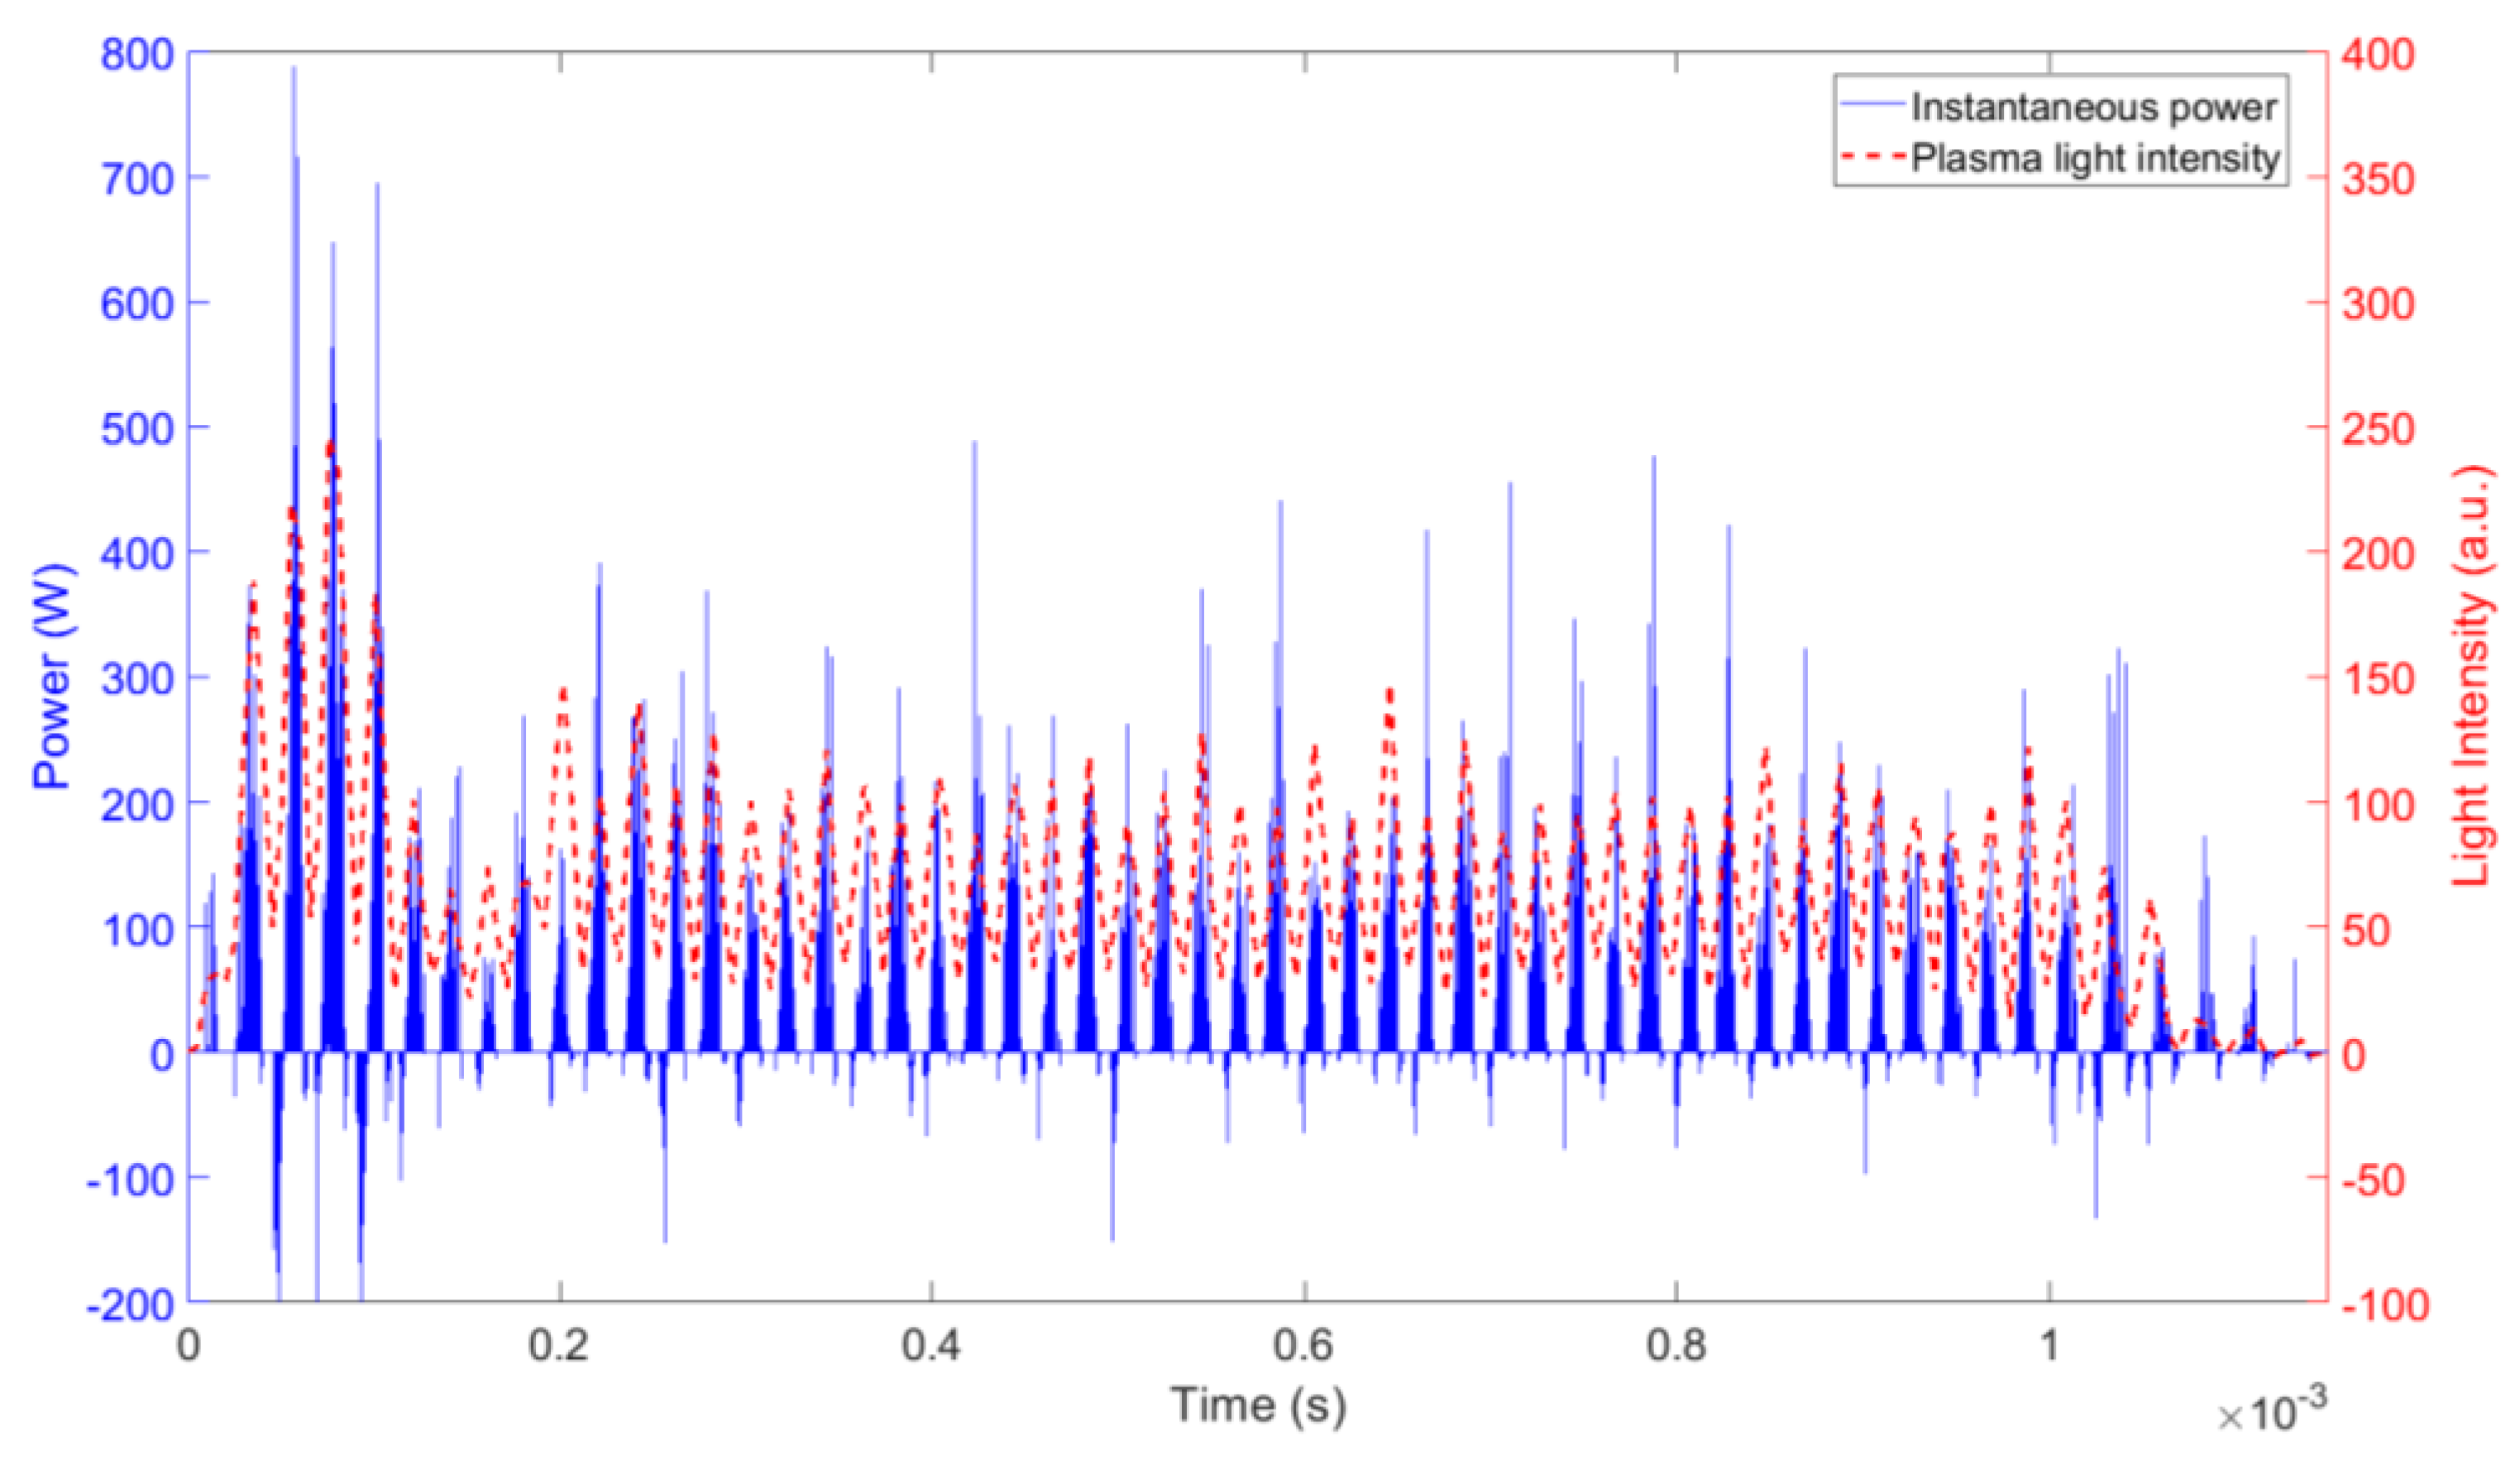
2.5. Electrical Measurements
2.6. Computational Model
3. Results and Discussion
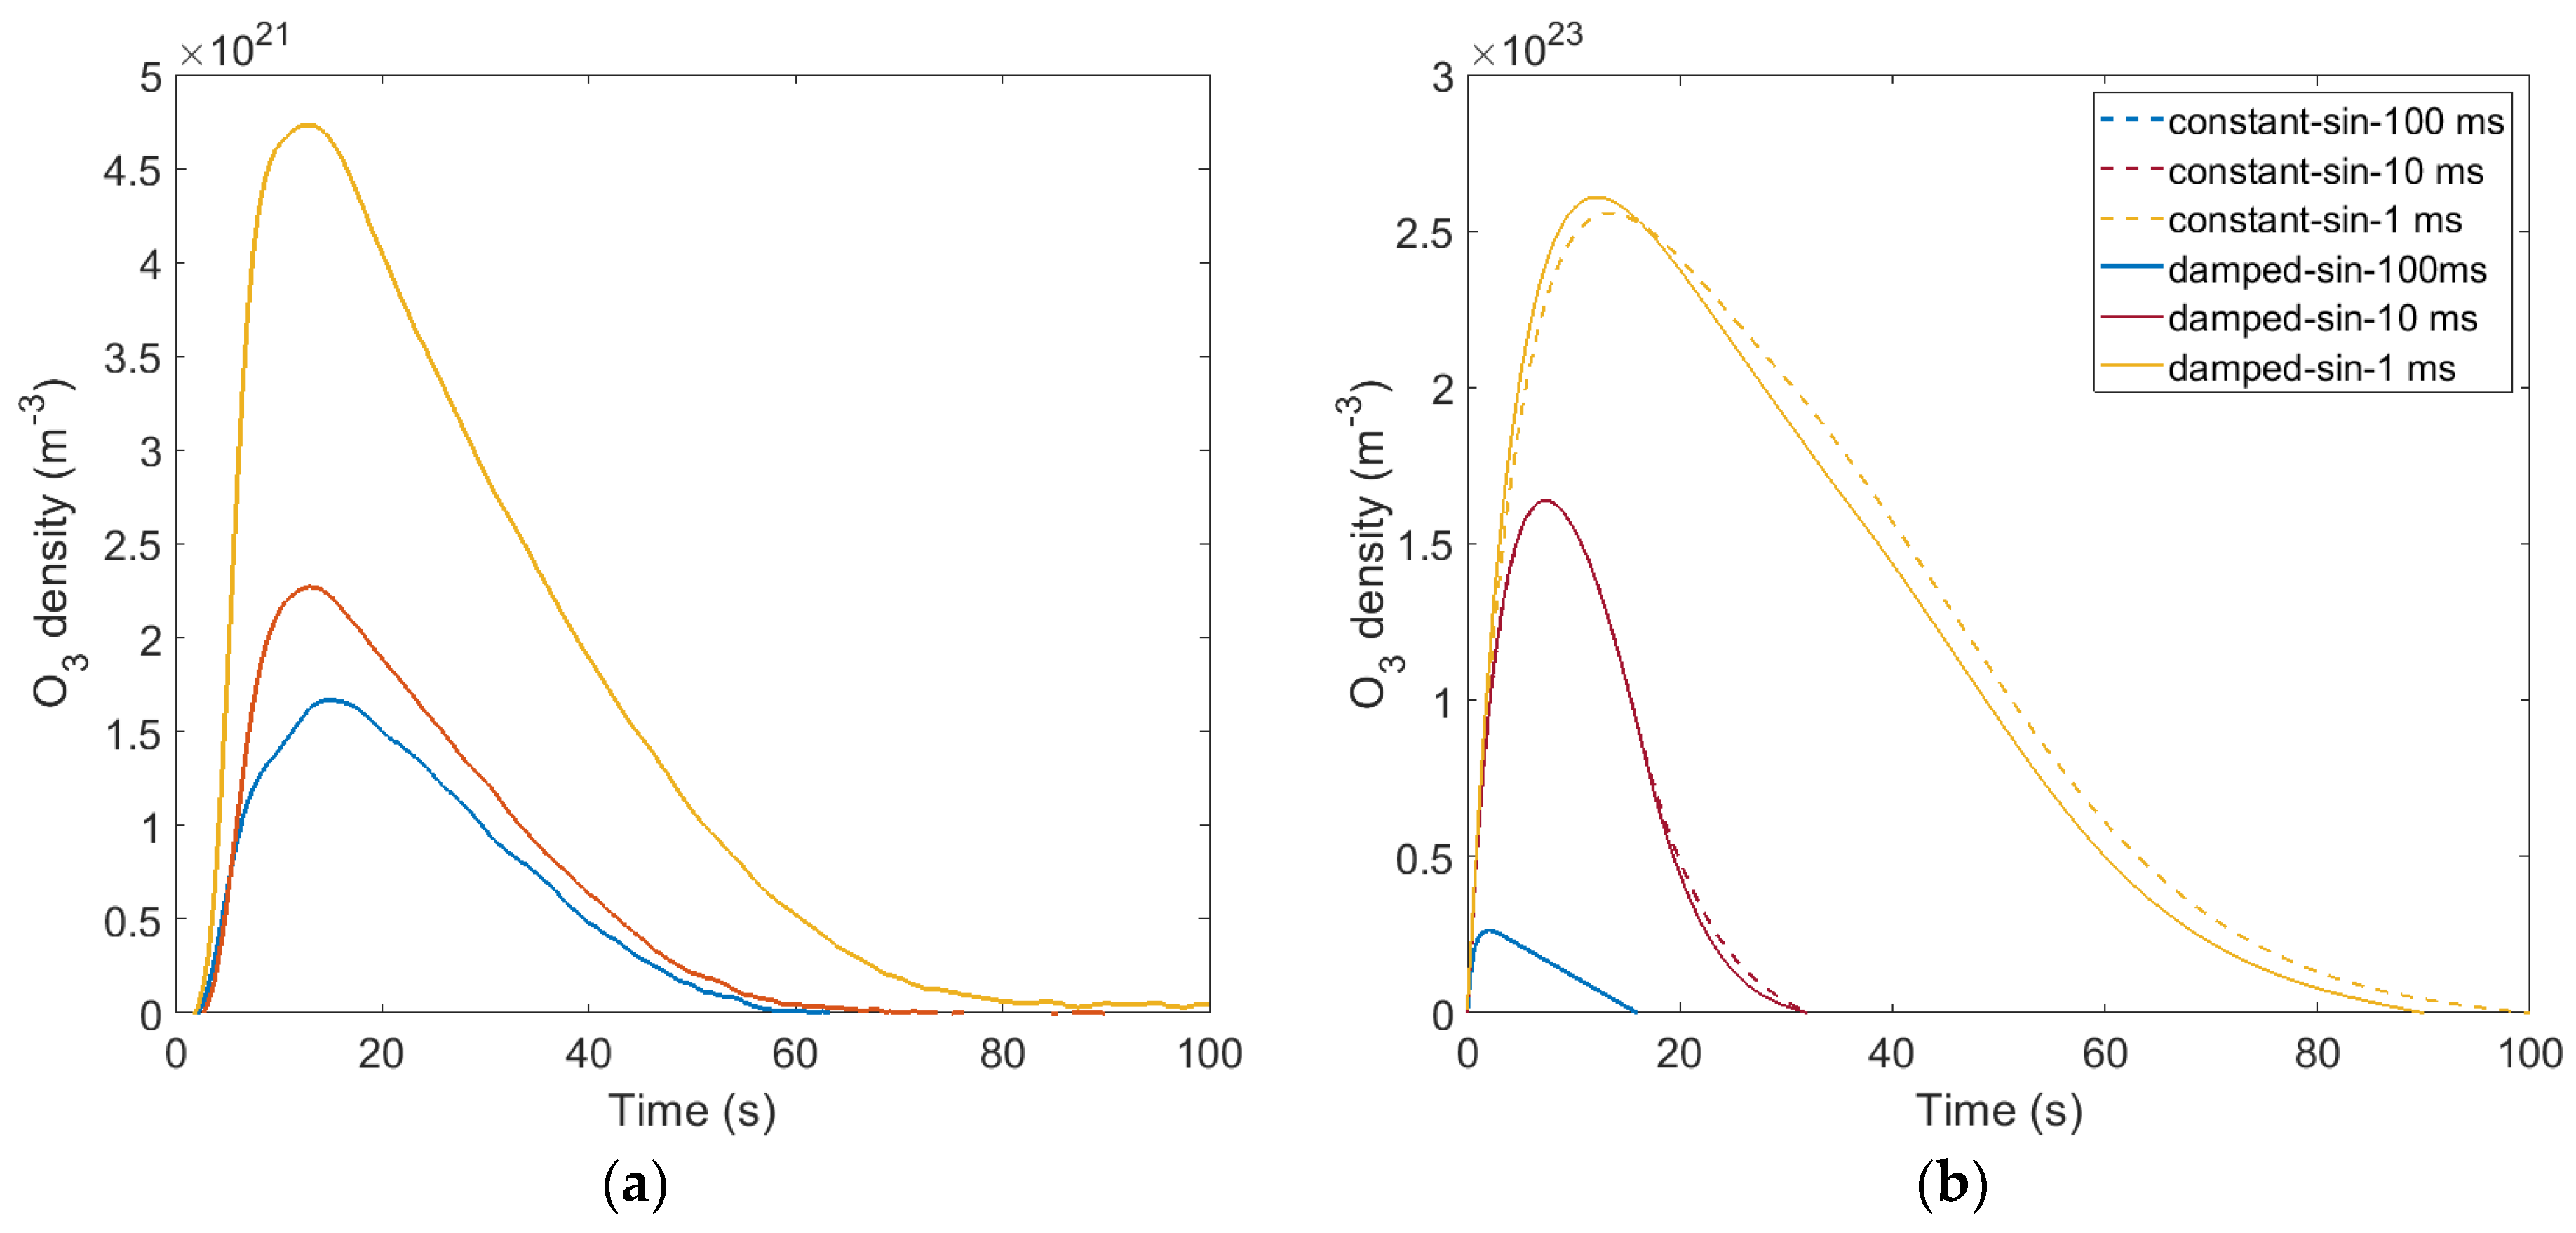
3.1. Ozone Concentration
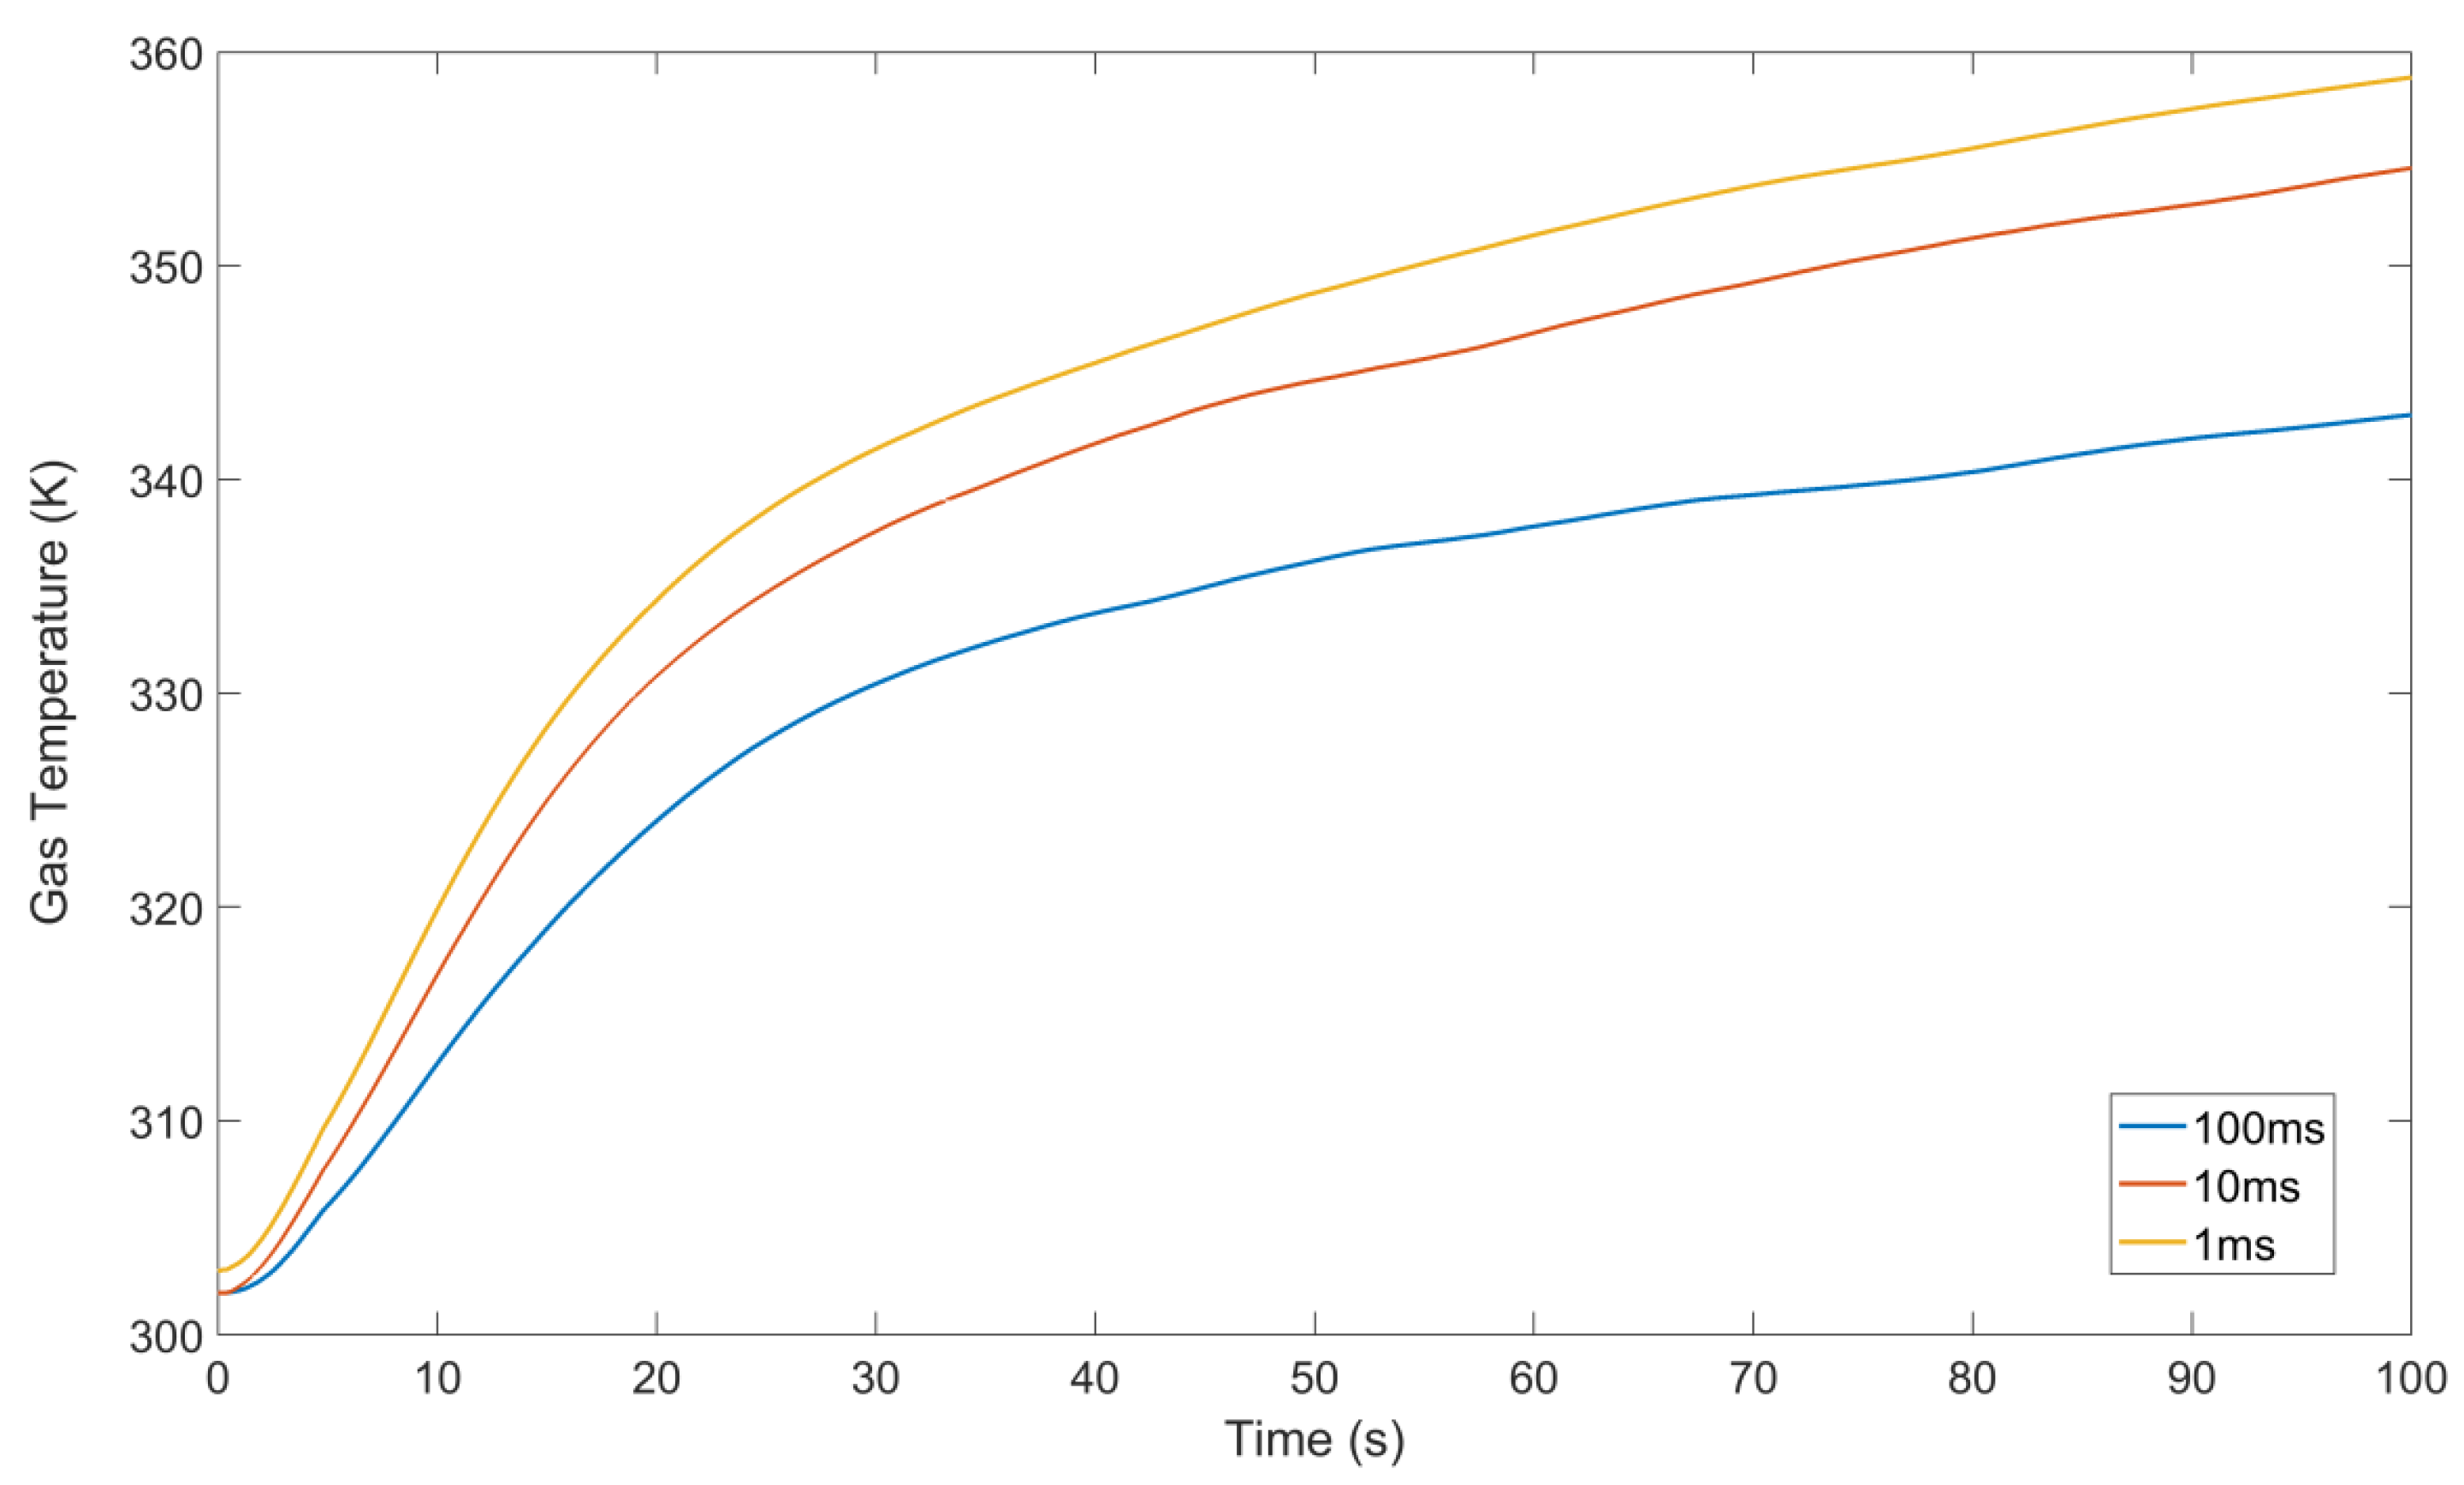
3.2. Temperature Evolution
3.3. Plasma Chemistry
4. Conclusions
Author Contributions
Funding
Acknowledgments
Conflicts of Interest
References
- Lu, X.; Naidis, G.V.; Laroussi, M.; Reuter, S.; Graves, D.B.; Ostrikov, K. Reactive Species in Non-Equilibrium Atmospheric-Pressure Plasmas: Generation, Transport, and Biological Effects. Phys. Rep. 2016, 630, 1–84. [Google Scholar] [CrossRef]
- Park, D.P.; Davis, K.; Gilani, S.; Alonzo, C.A.; Dobrynin, D.; Friedman, G.; Fridman, A.; Rabinovich, A.; Fridman, G. Reactive Nitrogen Species Produced in Water by Non-Equilibrium Plasma Increase Plant Growth Rate and Nutritional Yield. Curr. Appl. Phys. 2013, 13 (Suppl. 1), S19–S29. [Google Scholar] [CrossRef]
- Shaw, A.; Shama, G.; Iza, F. Emerging Applications of Low Temperature Gas Plasmas in the Food Industry. Biointerphases 2015, 10, 029402. [Google Scholar] [CrossRef] [PubMed]
- Bruggeman, P.J.; Kushner, M.J.; Locke, B.R.; Gardeniers, J.G.E.; Graham, W.G.; Graves, D.B.; Hofman-Caris, R.C.H.M.; Maric, D.; Reid, J.P.; Ceriani, E.; et al. Plasma–liquid Interactions: A Review and Roadmap. Plasma Sources Sci. Technol. 2016, 25, 053002. [Google Scholar] [CrossRef]
- Xu, S.; Chansai, S.; Stere, C.; Inceesungvorn, B.; Goguet, A.; Wangkawong, K.; Taylor, S.F.R.; Al-Janabi, N.; Hardacre, C.; Martin, P.A.; et al. Sustaining Metal–organic Frameworks for Water–gas Shift Catalysis by Non-Thermal Plasma. Nat. Catal. 2019, 2, 142–148. [Google Scholar] [CrossRef]
- Tou, A.; Kim, H.H.; Einaga, H.; Teramoto, Y.; Ogata, A. Ozone-Assisted Catalysis of CO: In Situ Fourier Transform IR Evidence of the Cooperative Effect of a Bimetallic Ag-Pd Catalyst. Chem. Eng. J. 2019, 355, 380–389. [Google Scholar] [CrossRef]
- Jia, Z.; Ben Amar, M.; Yang, D.; Brinza, O.; Kanaev, A.; Duten, X.; Vega-González, A. Plasma Catalysis Application of Gold Nanoparticles for Acetaldehyde Decomposition. Chem. Eng. J. 2018, 347, 913–922. [Google Scholar] [CrossRef]
- Mariotti, D.; Sankaran, R.M. Microplasmas for Nanomaterials Synthesis. J. Phys. D Appl. Phys. 2010, 43, 323001. [Google Scholar] [CrossRef]
- Lisco, F.; Shaw, A.; Wright, A.; Walls, J.M.; Iza, F. Atmospheric-Pressure Plasma Surface Activation for Solution Processed Photovoltaic Devices. Sol. Energy 2017, 146, 287–297. [Google Scholar] [CrossRef]
- Vandenbossche, M.; Hegemann, D. Recent Approaches to Reduce Aging Phenomena in Oxygen- and Nitrogen-Containing Plasma Polymer Films: An Overview. Curr. Opin. Solid State Mater. Sci. 2018, 22, 26–38. [Google Scholar] [CrossRef]
- Kogelschatz, U. Dielectric-Barrier Discharges: Their History, Discharge Physics, and Industrial Applications. Plasma Chem. Plasma Process. 2003, 23, 1–46. [Google Scholar] [CrossRef]
- Langlain, B.; Reckhow, D.; Brink, D. Ozone in Water Treatment: Application and Engineering; CRC Press: Boca Raton, FL, USA, 1991. [Google Scholar]
- Vezzu, G.; Lopez, J.L.; Freilich, A.; Becker, K.H. Optimization of Large-Scale Ozone Generators. IEEE Trans. Plasma Sci. 2009, 37, 890–896. [Google Scholar] [CrossRef]
- Brueggemann, N.; Puehmeier, T.; Fiekens, R.; Richardt, F.J.; Salvermoser, M. Cooling Conditions of Ozone Generators. Ozone Sci. Eng. 2017, 39, 196–201. [Google Scholar] [CrossRef]
- Murata, T.; Okita, Y.; Noguchi, M.; Takase, I. Basic Parameters of Coplanar Discharge Ozone Generator. Ozone Sci. Eng. 2004, 26, 429–442. [Google Scholar] [CrossRef]
- Panjeshahi, M.H.; Ataei, A. Application of an Environmentally Optimum Cooling Water System Design in Water and Energy Conservation. Int. J. Environ. Sci. Technol. 2008, 5, 251–262. [Google Scholar] [CrossRef]
- Suksri, A.; Karnchanalekha, K.; Tonmitra, K.; Apiratikul, P. A Comparative Study on Suitable High Voltage Sources for Ozone Generation. In Proceedings of the 2009 6th International Conference on Electrical Engineering/Electronics, Computer, Telecommunications and Information Technology, Pattaya, Thailand, 6–9 May 2009; pp. 296–299. [Google Scholar] [CrossRef]
- Šimek, M.; Pekárek, S.; Prukner, V. Influence of Power Modulation on Ozone Production Using an AC Surface Dielectric Barrier Discharge in Oxygen. Plasma Chem. Plasma Process. 2010, 30, 607–617. [Google Scholar] [CrossRef]
- Zhang, S.; Sobota, A.; van Veldhuizen, E.M.; Bruggeman, P.J. Temporally Resolved Ozone Distribution of a Time Modulated RF Atmospheric Pressure Argon Plasma Jet: Flow, Chemical Reaction, and Transient Vortex. Plasma Sources Sci. Technol. 2015, 24, 045015. [Google Scholar] [CrossRef]
- Park, J.; Henins, I.; Herrmann, H.W.; Selwyn, G.S.; Jeong, J.Y.; Hicks, R.F.; Shim, D.; Chang, C.S. An Atmospheric Pressure Plasma Source. Appl. Phys. Lett. 2000, 76, 288–290. [Google Scholar] [CrossRef]
- Sung, Y.-M.; Sakoda, T. Optimum Conditions for Ozone Formation in a Micro Dielectric Barrier Discharge. Surf. Coat. Technol. 2005, 197, 148–153. [Google Scholar] [CrossRef]
- Chirokov, A.; Gutsol, A.; Fridman, A. Atmospheric Pressure Plasma of Dielectric Barrier Discharges. Pure Appl. Chem. 2005, 77, 487–495. [Google Scholar] [CrossRef]
- Ma, T.; Jiang, H.; Liu, J.; Zhong, F. Decomposition of Benzene Using a Pulse-Modulated DBD Plasma. Plasma Chem. Plasma Process. 2016, 36, 1533–1543. [Google Scholar] [CrossRef]
- Díaz, R.; Márquez, A.; Menéndez, D.; Pérez, R. Medium Frequency Pulse Train Ozone Generation. Ozone Sci. Eng. 1999, 21, 635–642. [Google Scholar] [CrossRef]
- Olszewski, P.; Li, J.F.; Liu, D.X.; Walsh, J.L. Optimizing the Electrical Excitation of an Atmospheric Pressure Plasma Advanced Oxidation Process. J. Hazard. Mater. 2014, 279, 60–66. [Google Scholar] [CrossRef] [PubMed]
- Barni, R.; Biganzoli, I.; Dell’Orto, E.C.; Riccardi, C. Effect of Duty-Cycles on the Air Plasma Gas-Phase of Dielectric Barrier Discharges. J. Appl. Phys. 2015, 118. [Google Scholar] [CrossRef]
- Seri, P.; Wright, A.; Shaw, A.; Iza, F.; Bandulasena, H.; Borghi, C.A.; Neretti1, G. Influence of the Shape and On-Time Duration of the Voltage Waveform on the Performance of a DBD Micro-Bubble Reactor. Plasma Sources Sci. Technol. 2018. under review. [Google Scholar]
- Ying, K.; Al-mashhadani, M.K.H.; Hanotu, J.O.; Gilmour, D.J.; Zimmerman, W.B. Enhanced Mass Transfer in Microbubble Driven Airlift Bioreactor for Microalgal Culture. Engineering 2013, 5, 735–743. [Google Scholar] [CrossRef]
- Wright, A.; Ibenegbu, C.; Holmes, T.; Shaw, A.; Zimmerman, W.; Iza, F.; Leak, D.; Bandulasena, H. Dielectric Barrier Discharge Plasma Microbubble Reactor for Pretreatment of Lignocellulosic Biomass. AIChE J. 2018, 64, 3803–3816. [Google Scholar] [CrossRef]
- Wright, A.; Marsh, A.; Ricciotti, F.; Shaw, A.; Iza, F.; Holdich, R.; Bandulasena, H.C.H. Microbubble-Enhanced Dielectric Barrier Discharge Pretreatment of Micro Crystalline Cellulose. Biomass Bioenergy 2018, 118, 46–54. [Google Scholar] [CrossRef]
- Wright, A.; Uprety, B.; Shaw, A.; Shama, G.; Iza, F.; Bandulasena, H.C.H. Effect of Humic Acid on E. coli Disinfection Using a Microbubble-Gas Plasma Reactor. J. Water Process Eng. 2019. under review. [Google Scholar]
- Wright, A.; Taglioli, M.; Montazersadgh, F.; Shaw, A.; Iza, F.; Bandulasena, H.C.H. Microbubble-Enhanced DBD Plasma Reactor: Design, Characterisation and Modelling. Chem. Eng. Res. Des. 2019, 144, 159–173. [Google Scholar] [CrossRef]
- Manley, T.C. The Electric Characteristics of the Ozonator Discharge. Trans. Electrochem. Soc. 1943, 84, 83–96. [Google Scholar] [CrossRef]
- Jeong, S.Y.; Nam, W.J.; Lee, J.K.; Yun, G.S. Dependence of Reactive Species Generation on Microwave Pulse Parameters in Atmospheric Argon/Oxygen Plasma. J. Phys. D Appl. Phys. 2018, 51. [Google Scholar] [CrossRef]
- Lieberman, M.; Lichtenberg, A. Discharges and Materials Processing Principles of Plasma Discharges and Materials; John Wiley & Sons: Hoboken, NJ, USA, 2005. [Google Scholar]
- Liu, D.-X.; Iza, F.; Wang, X.-H.; Ma, Z.-Z.; Rong, M.-Z.; Kong, M.G. A Theoretical Insight into Low-Temperature Atmospheric-Pressure He+H2 Plasmas. Plasma Sources Sci. Technol. 2013, 22, 055016. [Google Scholar] [CrossRef]
- Lietz, A.M.; Kushner, M.J. Air Plasma Treatment of Liquid Covered Tissue: Long Timescale Chemistry. J. Phys. D Appl. Phys. 2016, 49. [Google Scholar] [CrossRef]
- Khoramabadi, M.; Ghomi, H.; Shukla, P.K. The Bohm-sheath Criterion in Plasmas Containing Electrons and Multiply Charged Ions. J. Plasma Phys. 2013, 79, 267–271. [Google Scholar] [CrossRef]
- Sakiyama, Y.; Graves, D.B.; Chang, H.-W.; Shimizu, T.; Morfill, G.E. Plasma Chemistry Model of Surface Microdischarge in Humid Air and Dynamics of Reactive Neutral Species. J. Phys. D Appl. Phys. 2012, 45, 425201. [Google Scholar] [CrossRef]
- Hagelaar, G.J.M.; Pitchford, L.C. Solving the Boltzmann Equation to Obtain Electron Transport Coefficients and Rate Coefficients for Fluid Models. Plasma Sources Sci. Technol. 2005, 14, 722–733. [Google Scholar] [CrossRef]
- Plasma Data Exchange Project. Available online: www.lxcat.net (accessed on 17 June 2018).
- Phelps, A.V.; Pitchford, L.C. Anisotropic Scattering of Electrons by N2 and Its Effect on Electron Transport. Phys. Rev. A 1985, 31, 2932–2949. [Google Scholar] [CrossRef]
- Ionin, A.A.; Kochetov, I.V.; Napartovich, A.P.; Yuryshev, N.N. Physics and Engineering of Singlet Delta Oxygen Production in Low-Temperature Plasma. J. Phys. D Appl. Phys. 2007, 40, R25–R61. [Google Scholar] [CrossRef]
- Wang, Y.; Zatsarinny, O.; Bartschat, K. B-Spline R-Matrix-with-Pseudostates Calculations for Electron-Impact Excitation and Ionization of Nitrogen. Phys. Rev. A 2014, 89, 062714. [Google Scholar] [CrossRef]
- Alves, L.L.; Coche, P.; Ridenti, M.A.; Guerra, V. Electron Scattering Cross Sections for the Modelling of Oxygen-Containing Plasmas. Eur. Phys. J. D 2016, 70. [Google Scholar] [CrossRef]
- Laher, R.R.; Gilmore, F.R. Updated Excitation and Ionization Cross Sections for Electron Impact on Atomic Oxygen. J. Phys. Chem. Ref. Data 1990, 19, 277–305. [Google Scholar] [CrossRef]
- Itikawa, Y. Cross Sections for Electron Collisions with Nitric Oxide. J. Phys. Chem. Ref. Data 2016, 45, 033106. [Google Scholar] [CrossRef]
- Shimizu, T.; Sakiyama, Y.; Graves, D.B.; Zimmermann, J.L.; Morfill, G.E. The Dynamics of Ozone Generation and Mode Transition in Air Surface Micro-Discharge Plasma at Atmospheric Pressure. New J. Phys. 2012, 14, 103028. [Google Scholar] [CrossRef]
- Gardoni, D.; Vailati, A.; Canziani, R. Decay of Ozone in Water: A Review. Ozone Sci. Eng. 2012, 34, 233–242. [Google Scholar] [CrossRef]


© 2019 by the authors. Licensee MDPI, Basel, Switzerland. This article is an open access article distributed under the terms and conditions of the Creative Commons Attribution (CC BY) license (http://creativecommons.org/licenses/by/4.0/).
Share and Cite
Montazersadgh, F.; Wright, A.; Ren, J.; Shaw, A.; Neretti, G.; Bandulasena, H.; Iza, F. Influence of the On-time on the Ozone Production in Pulsed Dielectric Barrier Discharges. Plasma 2019, 2, 39-50. https://doi.org/10.3390/plasma2010005
Montazersadgh F, Wright A, Ren J, Shaw A, Neretti G, Bandulasena H, Iza F. Influence of the On-time on the Ozone Production in Pulsed Dielectric Barrier Discharges. Plasma. 2019; 2(1):39-50. https://doi.org/10.3390/plasma2010005
Chicago/Turabian StyleMontazersadgh, Faraz, Alexander Wright, Junchen Ren, Alexander Shaw, Gabriele Neretti, Hemaka Bandulasena, and Felipe Iza. 2019. "Influence of the On-time on the Ozone Production in Pulsed Dielectric Barrier Discharges" Plasma 2, no. 1: 39-50. https://doi.org/10.3390/plasma2010005
APA StyleMontazersadgh, F., Wright, A., Ren, J., Shaw, A., Neretti, G., Bandulasena, H., & Iza, F. (2019). Influence of the On-time on the Ozone Production in Pulsed Dielectric Barrier Discharges. Plasma, 2(1), 39-50. https://doi.org/10.3390/plasma2010005