1. Introduction
One challenge of magnetically confined fusion reactors is maintaining the plasma core at the high temperatures required for fusion to occur. The temperature gradient between the hot central plasma and the cooler edge is expected to be unstable, resulting in turbulent motions that carry heat toward the outside of the plasma. The ability to model the turbulence and its effect on plasma reactors accurately in a predictive way would accelerate the progress of fusion research. One challenge with quantitatively predicting the overall behavior is the enormous complexity of plasma turbulence and the large span of spatio-temporal scales in this process. These scales are often categorized as turbulence and slower transport.
Modeling the effect of turbulence on transport often occurs through transport equations, based on a scale separation. ‘Transport solvers’ numerically solve the transport equations, which are essentially local conservation equations, for macroscopic plasma profiles such as density and temperature. These transport equations are coarse-grained such that the macroscopic profiles have slow variation in time and space compared to the turbulent fluctuations that are the source of the transport. On the slow transport timescale and long length scales, the macroscopic profiles are constant on magnetic flux surfaces. Hence, transport equations for these profiles are one-dimensional (1D) in space. The transport equations will include terms, such as the flux of heat across a magnetic surface, which involve quantities arising due to turbulence, but that are presumed to be smoothly varying after averaging over the fast timescales and short length scales. Other effects besides turbulent transport can be included in the transport equations, such as neoclassical transport or plasma heating or fueling. The transport equation can be used to predict the spatiotemporal evolution of the temperature profile and other quantities (for example, [
1]). The decomposition into turbulence and transport should be valid as long as there is a strong scale separation, which is believed to often be the case in the core of a tokamak.
Presently, a common approach for modeling the effect of turbulence on transport is to calculate the turbulent fluxes using a
surrogate model in lieu of directly simulating the turbulence itself. The use of surrogate models allows modeling plasma transport in a computationally reasonable manner. Entire tokamak discharges can be modeled, from start-up to flat-top to shut-down. Of course, surrogate models exist on a spectrum with more and less elaborate models. Very simple analytic models are used sometimes [
2,
3,
4]. A method closer to the fundamental physics, which is in widespread use now, is that of quasilinear transport models [
5,
6]. This approach assumes certain phase relationships based on linear eigenmodes, along with estimates of the turbulent amplitudes, to predict a turbulent flux. Even this approach can be time consuming, and so, one method of providing a faster surrogate model to the quasilinear transport models is through the fitting of neural networks [
7,
8]. The tradeoff for the speed of surrogate models is their uncertain accuracy, particularly when trying to predict new physics or regimes.
As computers become more powerful, another option is becoming feasible: coupling direct numerical simulations (DNS) of turbulence directly to the transport equations. Rather than invoking a simplified formula to capture what the turbulent heat flux should be, one can instead simulate it. Turbulence simulations are more computationally demanding than the surrogate models by many orders of magnitude. Yet, with increasing computational resources, the promise of more realistic modeling may be attractive enough to bear the costs. A high-level schematic diagram of how the computational coupling occurs is shown in
Figure 1. A few attempts have been made along this path aimed at plasma turbulence simulations, including some attempts with gyrokinetic simulations [
9,
10,
11,
12,
13]. However, the problem is far from solved, and many challenges remain for this ambitious program.
A consideration that arises when coupling a transport solver to a turbulence simulation is how to confront the inherent turbulent fluctuations. Because of the timescale separation between the slow timescale and the turbulence, the quantities of interest relevant to the slow timescale involve only the time average of turbulent quantities. A concrete example is the heat flux. In turbulence simulations, the surface-averaged heat flux is a primary quantity of interest. To evolve the pressure profile on the slow timescale, a transport solver needs only the time average of this flux. From that perspective, fluctuations of the flux about its true mean value are undesirable, as they introduce an error. The effect of these fluctuations and the error they cause in the solution of the transport equations must be understood and managed. One cannot allow the effect of the fluctuations to be so large that the error in the solution is unacceptably large, yet one does not want to spend more effort than necessary minimizing the effect of the fluctuations, which almost invariably requires additional computational expense. Understanding such tradeoffs is the first step in determining how to achieve a manageable balance between a reliable transport solver and overall computational cost.
The purpose of this paper is to study the behavior of a transport solver in the presence of fluctuations in the surface-averaged flux. The considerations we introduce apply equally to any algorithm used in a transport solver with implicit time steps, although we will focus our numerical investigation on the method described in [
9,
12].
It should be noted that the entire issue of fluctuations does not exist in the surrogate methods previously described, such as quasilinear models or machine-learning-based fits. Those models for calculating turbulent flux have the property that for a given input (typically macroscopic profiles), they always yield the same output. In contrast, a turbulence simulation yields different values of the heat flux when sampled at different times, even in a statistically steady state. The problem of dealing with fluctuations in the transport solver arises only when coupling to actual turbulence simulations.
We adopt the mindset that from the point of view of the slow timescale, a statistical framework is useful for analyzing the turbulent fluctuations. To investigate and characterize the behavior of the transport solver, a conceptual simplification is to consider the turbulent fluctuations as random signals about their true mean. True randomness is merely a convenient assumption, because the gyrokinetic equations describing the turbulence are nonrandom and deterministic; however, turbulent fluctuations are typically chaotic with sensitive dependence on initial conditions.
We study the behavior of a transport solver in a simple problem with added random fluctuations. For a systematic study, trying to generate many independent samples from the turbulence simulation would be extremely computationally costly. Instead, we use an autoregressive-moving-average model to generate random signals efficiently.
The outline of this paper is as follows. In
Section 2, we will describe the problem of interest, which is to solve a transport equation coupled with gyrokinetic turbulence simulations in a multiple-timescale framework. Then, in
Section 3, we will describe one numerical coupling method that has been used to solve this problem.
Section 4 introduces some basic mathematical considerations for characterizing fluctuations within a statistical framework. In
Section 5, we analyze a simple analytic model to gain intuition about convergence in the presence of fluctuations. In
Section 6, we describe a technique for efficiently generating fluctuations with certain desired statistical properties. Then, in
Section 7, we investigate the behavior of the numerical coupling method in the presence of fluctuations. Finally, we summarize our findings in
Section 8.
2. Theoretical Background: Multiple-Scale Turbulence and Transport Framework
Our motivating model is the coupled set of gyrokinetic turbulence and transport equations appropriate for tokamaks [
14,
15,
16]. For full details, the reader is referred to the literature; a simplified overview is given here. The description of the fast, small-scale turbulence consists of a gyrokinetic equation for each species and Maxwell’s equations. The gyrokinetic equation evolves the gyrocenter distribution of each species in a 5D phase space (three space and two velocity dimensions). The description of the slow, macroscopic transport evolution consists of local conservation equations for the surface-averaged density, momentum, and energy, which depend on only one spatial dimension, the flux coordinate.
However, for the purposes of this paper, we use a simplified paradigm model, which suffices to allow us to explore aspects of the numerical coupling method. This simplified problem eliminates the toroidal geometry and focuses on a single transport equation. We take a generic transport equation in a Cartesian geometry:
where
is a macroscopic profile,
is the surface-averaged flux of quantity
p and
includes all local sources. The turbulent flux
q is to be computed from some independent model, and it is assumed that
q is a functional of the profile
p, i.e.,
.
In this paper, q will be computed from an analytic model with added fluctuations rather than from DNS.
3. A Numerical Method for Multiple-Timescale Turbulence and Transport
We briefly review a numerical method for coupling a turbulence simulation and transport solver. The method was introduced by Shestakov et al. for coupling transport to Hasegawa–Wakatani fluid turbulence [
9] and was later used by Parker et al. for coupling transport to gyrokinetic turbulence in a tokamak [
12]. Essentially, the method prescribes a procedure for iterating to convergence the nonlinear equation arising from an implicit time step of Equation (
1), and in particular for handling the turbulent flux, which depends nonlinearly on the profile
p.
We introduce the subscript
m to denote the time index and
l to denote the iteration index within a time step. With a backward-Euler time step, the iteration scheme is given by:
where
is the converged (in
l) profile of the previous time step and:
Here,
is a relaxation parameter with
. The notation
indicates that the simulation that calculates
q is to be performed with the relaxed profile
. In Equation (
2),
q has been represented in terms of diffusive and convective contributions.
D and
c are artificial transport coefficients, chosen in a way such that if the iteration converges, the sum from the diffusive and convective fluxes is exactly equal to
q.
is a parameter to control the diffusive-convective split, and various strategies for choosing it are possible. Within this paper, we choose
to be 1 or close to 1.
Space is discretized through second-order finite differences. Equation (
2) becomes a matrix equation, schematically in the form:
where
is a vector,
g includes the source and
terms, and
M is a matrix that depends on the values of the transport coefficients
. The
m subscript has been suppressed here for simplicity. We emphasize that
M in this equation is determined only by known, past iterates of
p, as indicated by the subscript
. This matrix equation can be solved for the new iterate by inverting, which amounts to solving a tridiagonal system. This method has been implemented in the open-source Python code
Tango [
17].
4. Review of Relevant Mathematical Considerations in a Statistical Framework
Inherent to turbulence are the chaotic, unpredictable fluctuations occurring on a fast timescale. These fluctuations are a nuisance from the practical perspective of converging an implicit time step in a transport solver. This section reviews some statistical considerations relevant to a transport solver. The concepts here underpin the rest of this article.
From the point of view of the macroscopic dynamics, the turbulent fluctuations can for some purposes be modeled as random because the timescale of the fluctuations is much shorter than the macroscopic timescale. Henceforth, we will sometimes refer to the fluctuations as noise.
The turbulent quantity of interest for the transport solver is the flux, such as the heat flux. We will assume that the turbulence possesses a steady state where the statistical moments of all quantities are stationary. Statistical moments of the heat flux, such as the mean, variance, skewness, and kurtosis, can be used to characterize the distribution of the flux. Although the mean of the heat flux is small (changes to the macroscopic profile in our multiscale physics problem are slow by assumption), there is no restriction on the variance of the heat flux. That is, the fluctuations in the heat flux about its mean value can be comparable to its mean value. Indeed, large fluctuations are often observed in gyrokinetic simulations, as seen later in Figure 4a. Turbulent fluctuations, including the heat flux, are generated from nonlinear processes and so will not in general be normally distributed.
In the computational framework of coupling a turbulence simulation to a transport solver, the natural strategy is to pass the time average of the heat flux to the transport solver. The heat flux, averaged over a time
T, is given by:
In discrete form, is a sum over many realizations of the turbulent fluctuations. If the averaging time is sufficiently long, one expects to approach a normal distribution, even though q at different times are not independent.
In statistical parlance, let
be a stationary process with expected value
and variance
. We do not assume the
are independent. In addition to the statistical moments, another important statistical quantity is the autocorrelation time
τ. On an intuitive level,
τ is the time it takes for the process to “forget” its state. Measured discretely in number of samples, the autocorrelation time is defined as:
where the autocovariance function
and autocorrelation function
are defined as:
and
is the covariance of
X and
Y.
The autocorrelation time is important because it emerges naturally in the central limit theorem for correlated sequences [
18]. That theorem can be stated as follows: let
be the sample mean of
, and suppose certain technical niceness conditions on the
are satisfied. Then, as
,
where
and
is a normally distributed random variable with mean
a and variance
b. In other words, the distribution of
converges to
as
.
The theorem provides a theoretical basis for recognizing the importance of the parameter
for determining the variance. The number of samples is naturally measured in terms of the autocorrelation time. Because the sequence is correlated, it takes approximately
draws to obtain an independent sample, and so,
is the number of effective independent samples. Physically,
is probably on the order of a turbulent eddy time. Estimating
τ from data is discussed in
Appendix A.
5. Simple Iteration Problem with Relaxation and Noise
We consider a simple mathematical model that contains some of the key features of the transport iteration described in
Section 3, including the feature of fixed-point iteration plus relaxation. The model will illustrate some of the expected behavior and scalings in the presence of random noise.
The classic fixed-point iteration is:
which has solutions
satisfying
. Here, we consider a variation on this iteration, given by:
This system is reminiscent of Equations (
2)–(6) with
,
and
. We again seek solutions satisfying
. Equation (
14) states that at each iteration, a random component
is added to the basic functional response
to give
. We motivate Equation (
14) in the following way. Consider the quantity
to be like the turbulent flux, in that it depends on the input
x and fluctuates in time. In a statistically steady state, let
denote the time average of
, and let
. Then,
. For simplicity, we assume that the statistical properties of
do not depend on
x. We further collapse the time dependence to a random variable,
, yielding Equation (
14). We take
to be a centered normal random variable,
, with each
independent. The normality of
may be justified in some situations by invoking the central limit theorem. Equation (
15) represents a relaxation, and Equation (
16) represents the functional iteration using the relaxed
.
We define the error
and the residual
:
As an example, we take
. In the absence of noise,
is a stable fixed point when
. One realization using
and
is shown in
Figure 2a, which depicts
and
as
is iterated toward the solution
.
Linearizing Equation (
17) about the solution
, we find the error behaves as:
where
,
and
. We assume
. Note that
and
are independent. We now examine the stationary limit
, where statistics do not depend on
n. This limit defines the
noise floor, where the iteration process cannot converge closer to
due to the random noise. Taking the mean and variance of Equation (
19), we find:
Observe that
. One may choose
small enough such that
. We call this the “small-
regime” and use
. In this regime,
Hence, the standard deviation or root mean square (rms) of the error scales as
in the small
regime.
The behavior of the residual at the noise floor differs in its scaling. Returning to Equation (
18) and linearizing, we obtain
. We take the variance of this expression, again using the independence of
and
and obtain:
So far, the noise floor limit has not been taken. We take that now and find:
Here, the dominant contribution to
arises from noise at the current iterate. The contribution to
from
(which indirectly contains contributions from previous iterates of noise) is subdominant in the small-
regime. An interesting consequence is that the rms residual at the noise floor scales as
, which is different than the
scaling of the rms error. The different scalings are depicted in
Figure 2b.
Using the linearized equations, one can also solve for the
n dependence of
or
, rather than just the statistics in the
limit. Until
is small, it decreases exponentially, following the convergence rate as if there were no noise. However, when
becomes small enough and hits the noise floor, it fluctuates around zero with variance
, as depicted in
Figure 2a.
The residual
will similarly decrease exponentially and hit a noise floor. However, the noise floor for the residual is encountered at an earlier iteration than when the noise floor for the error is encountered.
reaches its noise floor when, on the right-hand-side of Equation (
23), the first term becomes smaller than the second term. However, at this iteration number,
is still decreasing. This behavior can be seen in
Figure 2a.
One conclusion is that even when the residual has hit a noise floor and is not decreasing further, the iterates may still be getting better, measured by a reduction in . However, one cannot evaluate in practice without knowledge of . On the other hand, the residual is easy to compute, making it tempting to monitor the residual to determine convergence. However, as we have seen, the residual is not a perfect proxy for the solution error. One possible way to improve the use of the residual as a proxy, which is not explored here, is to average the residual over several iterates, which could reduce the direct contribution of the random noise to a subdominant level.
6. Generating Fluctuations with Certain Properties for Testing Purposes
Investigating our turbulence-transport coupling method with added fluctuations requires the ability to efficiently generate time traces of fluxes with random noise, in a controlled fashion. Such a capability facilitates more rapid exploration and testing than relying only on expensive turbulence simulations. Here, we describe a method to generate random noise with certain properties, which can then be combined with some externally given signal that represents the mean value of the heat flux.
We will consider two possibilities. First, we consider Gaussian noise with a finite spatial correlation length, but white in time. Second, we consider non-Gaussian noise that has finite correlation in time and is perfectly correlated in space.
6.1. Generating Spatially Correlated Gaussian Noise
To generate noise with a finite spatial correlation length, we use a discrete Langevin equation. This model has the form:
where
,
is a centered, normally distributed variable, and
n is a spatial grid index. The correlation length (using the same definition as in Equation (
9)), measured in discrete samples, is
.
In this way, at each time step, we construct a signal
z of length
N, where
N is the number of spatial grid points, to be combined with an analytic signal. If the analytic signal is
, then our combined signal is:
As a practical matter, to adhere to the boundary conditions, we have applied a tapering window
to
z that is equal to one in the interior and falls smoothly to zero at the boundaries. The expected value of
is
. Two example realizations are shown in
Figure 3.
6.2. Generating Temporally Correlated Non-Gaussian Noise
As we turn to the generation of fluctuations with a finite correlation in time, it is instructive to first examine an actual time trace of heat flux from a gyrokinetic simulation. Clearly, it is desirable for artificial fluctuations to resemble the fluctuations occurring in practice.
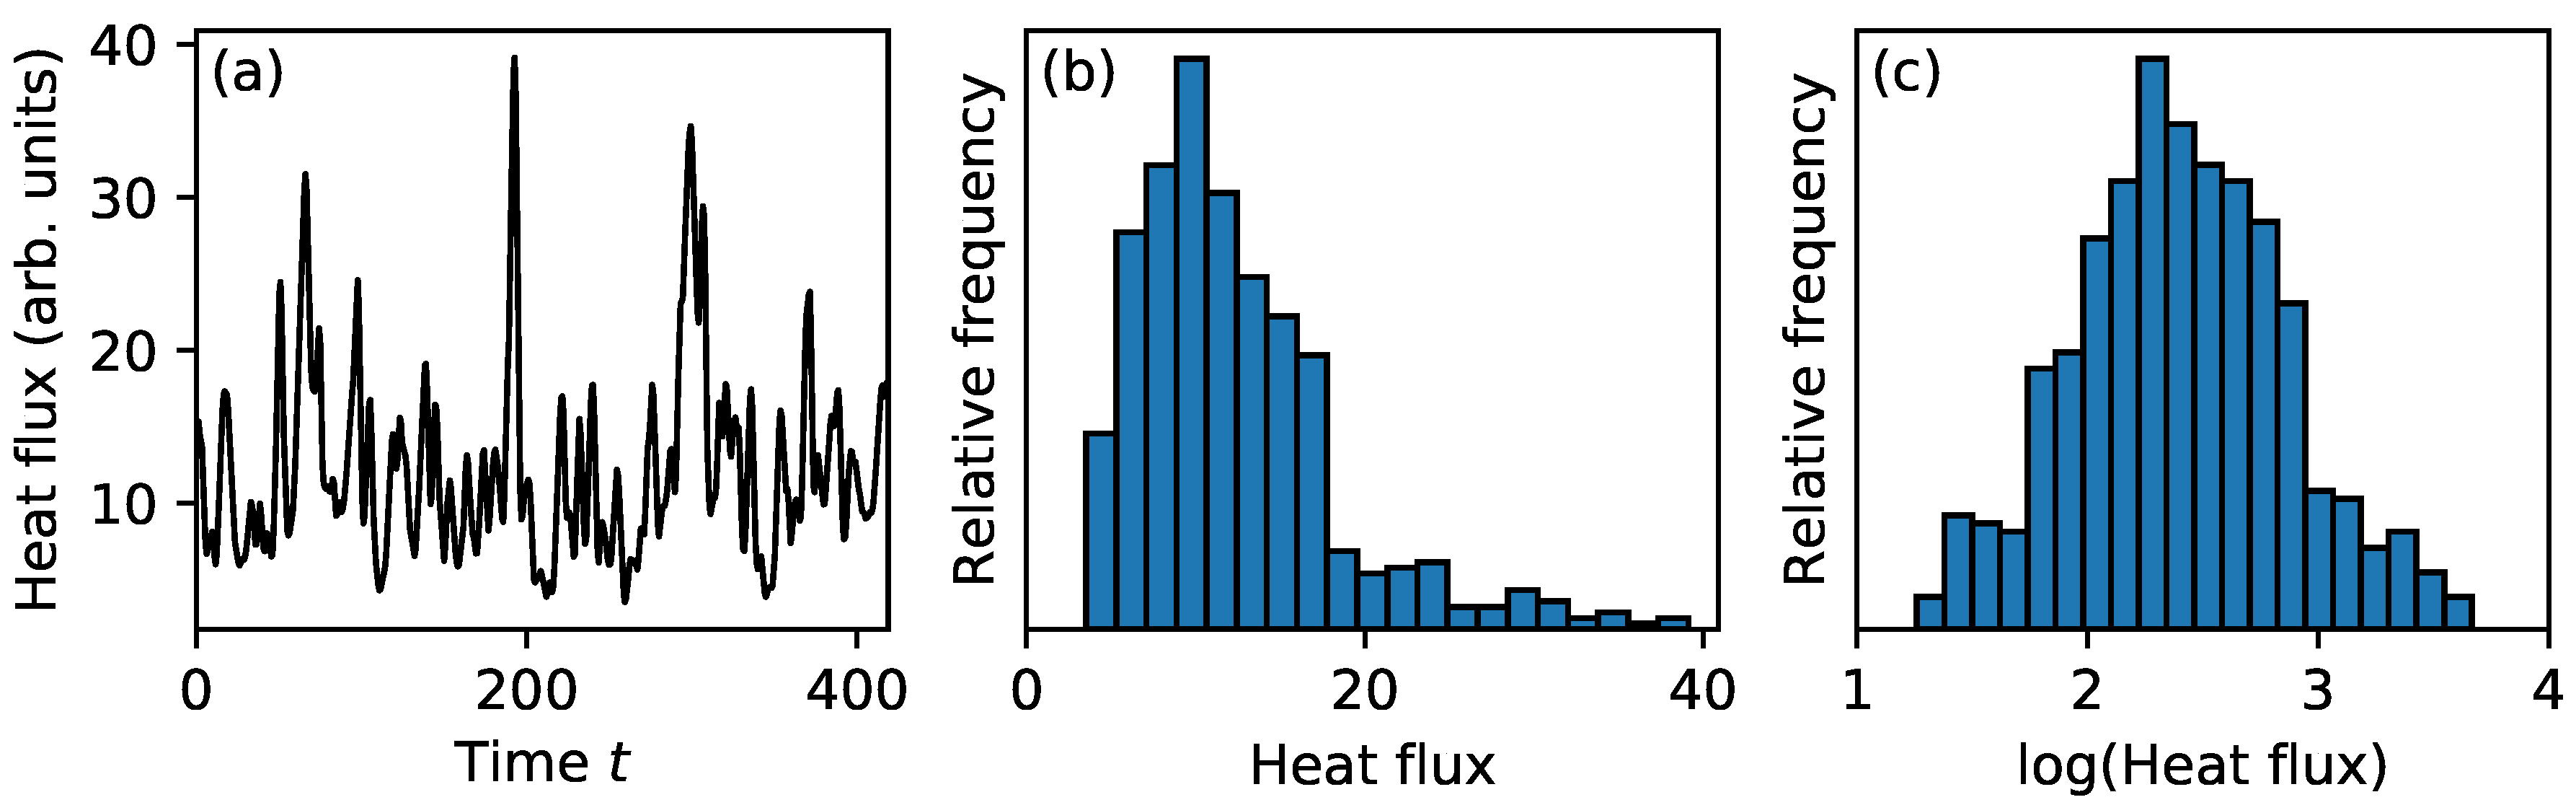
Figure 4a shows a typical time trace of the ion heat flux from a gyrokinetic simulation; the heat flux has been surface-averaged and also averaged over a small radial window with a width of several gyroradii. This simulation was performed with the GENE code [
19,
20,
21,
22]. In the arbitrary units used in the figure, the heat flux has a mean value of about 12.3, although bursts up to several times larger than the mean can be observed. The right-tailed nature of the distribution of the heat flux can be visualized in a histogram, as in
Figure 4b. Using the batch means method described in
Appendix A, we estimate the autocorrelation time to be
samples. The interval between samples is
, where
is the major radius and
is the ion thermal velocity.
For generating fluctuations correlated in time similar to those in
Figure 4a, we use the autoregressive-moving-average models ARMA(
) from the field of time-series analysis [
23,
24]. The ARMA(
) model is written as:
where
is the signal at time
j,
c is the mean value,
p are the number of autoregressive (AR) terms,
q are the number of moving-average (MA) terms,
are the AR parameters,
are the MA parameters and the
are independent and identically distributed centered Gaussian variables. Equation (
25) is, in this framework, just the ARMA(1,0) or AR(1) model.
Given a finite sequence, there are established procedures to estimate optimal parameters
, as well as the parameters
and
[
23,
25,
26]. We use the ARMASA software package [
27] for MATLAB to perform the estimation on the heat flux in
Figure 4a.
Fitting an ARMA(
) model directly to the time trace in
Figure 4a provides a less-than-ideal representation. The reason is that ARMA models produce a Gaussian signal
, while the ion heat flux is non-Gaussian, as seen in
Figure 4b. The ARMA parameters fit directly to this time trace are
,
,
,
,
,
and
. Using the method of estimating
τ directly from the ARMA parameters, described in
Appendix A, gives
, somewhat close to the estimate from batch means. A realization of this ARMA model is shown in
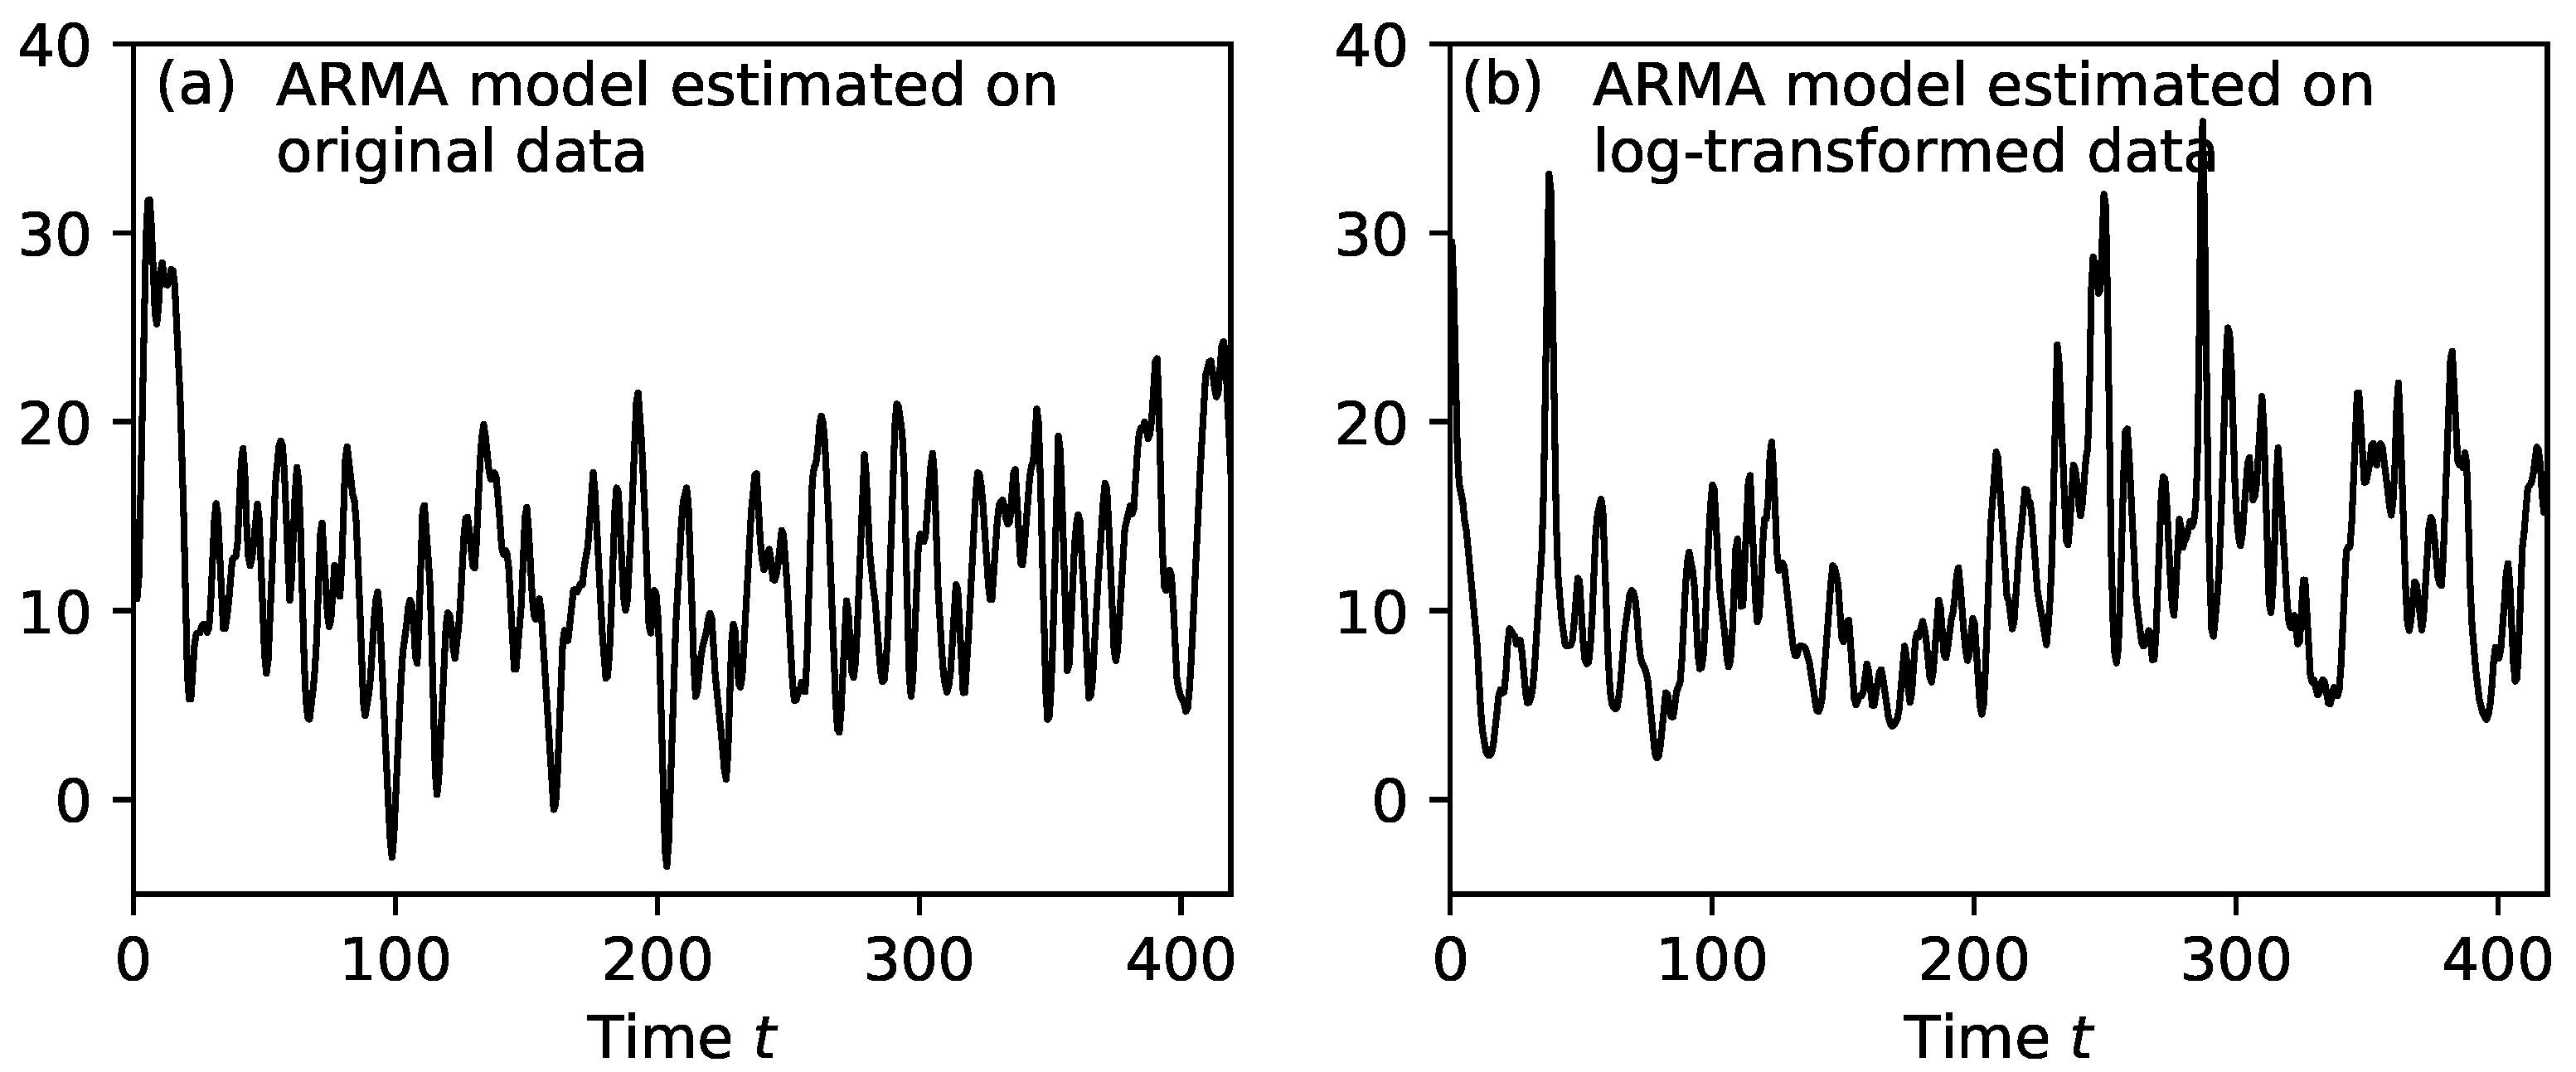
Figure 5a, with mean and variance chosen to match that of the original data. This realization is not totally satisfactory because it is Gaussian without large bursts, and the signal sometimes is negative, while the original signal is positive.
A better strategy for this data involves the log transform. A histogram of the logarithm of the original heat flux is shown in
Figure 4c. This histogram is approximately centered and much closer to normally distributed. Hence, the logarithm of the heat flux is more appropriate for modeling with a Gaussian process. Therefore, our strategy will be to estimate the ARMA(
) parameters on the log of the heat flux, generate a signal
and then perform the inverse transform by exponentiation. The log transform requires that the data be positive. However, this turns out to not be that restrictive an assumption, because if the data were negative, one could add a constant beforehand. The ARMA parameters estimated from the logarithm of the heat flux are
,
,
,
,
,
and
.
Given the ARMA-generated signal, we can combine it with an analytic model to represent a noisy flux signal. The variance
of the generated signal can be scaled to match the variance of the original (log-transformed) data, or increased or decreased as desired. If the externally-given value is
s, then the naive way to represent the noisy signal is
. However, this formula has the undesirable feature of setting
, because
as a result of
being centered, the convexity of the exponential, and Jensen’s inequality. More precisely, if
, then
. We incorporate this convexity correction and instead use the noisy signal:
Then,
will be log-normally distributed with an expected value of
s.
A realization of the logarithm-based ARMA model is shown in
Figure 5b. This model is clearly improved as compared to the ARMA model of the original data in several respects. Compare with
Figure 4a and
Figure 5a. Because of the logarithm and exponentiation, the generated signal has no negative values, just as in the original signal. Second, the data have a long tail, with large bursts occurring regularly. Because using the logarithm-based model is clearly superior to the non-logarithm-based model for generating fluctuations more closely resembling those from the turbulent simulation and has almost no extra complexity in practice, we will use it for further studies. This ARMA-based method enables the very efficient generation of arbitrarily long sequences of noise and will be used heavily in
Section 7.
This method for generating fluctuations to incorporate into an analytic heat flux is useful for some purposes, but cannot model all possible effects. We have assumed stationarity of the fluctuations, so one behavior not captured is when the properties of the fluctuations, such as their amplitude or time between bursts, depend strongly on the transport solution. Furthermore, for simplicity, the methods described here involve either finite spatial or temporal correlation, but not both simultaneously.
7. Behavior of the Multiple-Timescale Coupling Method in the Presence of Fluctuations
7.1. Statement of the Problem
We have described both the coupling method and a way to generate fluctuations. In this section, we combine these elements and apply them to a solvable problem in which the flux is specified analytically. By so doing, we can characterize the behavior of the coupling method in the presence of fluctuations, including the convergence of the residual and the error. The example problem is taken from [
9]. Equation (
1) is to be solved for the steady state solution, where for this example, we choose the flux
to be:
where:
This flux is nonlinear and diffusive. With a source and boundary conditions of
the steady-state solution is given by:
The Neumann boundary condition at
reflects the geometric no-flux condition at the magnetic axis of a tokamak. We use
,
and
. The convergence results we present are not that sensitive to the initial condition. We use a single time step with
, so we are looking for a steady-state solution, and we therefore suppress the
m subscript used in Equation (
2). The
l subscript remains for the Picard-like iteration to converge to the self-consistent solution of Equation (
2). We take the problem as specified, except now, we add fluctuations to the heat flux to examine the convergence of the residual and the error.
With
M and
g defined as in Equation (
7), we define the residual at iteration
l as:
where the maximum and rms are taken over the spatial index. Before defining the numerical error, we observe that if we compared
to the analytic solution in Equation (
34), an additional source of error besides the random noise would be the discretization error. We use 500 spatial points so that the discretization error here is small, but we wish to eliminate that error entirely from current consideration. Therefore, we define
as the exact steady state solution of the discretized version of the transport problem in Equation (
1), solved numerically to high precision. We compute the error by comparing
with
, rather than with the analytic solution, so we define:
7.2. Gaussian Noise: Spatially Correlated, Temporally White
First, we add Gaussian fluctuations in the manner described by Equation (
26). At each iteration, the spatial dependence of the heat flux is modified as:
The Gaussian noise
is chosen to have a spatial correlation length of 0.2. It is temporally white, so that at each iteration step in the transport solver, a new realization of
is used. We solve Equation (
1) with the modified flux for the steady solution.
Figure 6 shows the residual and error for this system. Panel (a) shows two realizations with different amplitudes of the noise
z and fixed relaxation parameter
. At a lower level of noise, the residual and the error both decrease to lower levels, as expected. Panel (b) shows two realizations with different values of
and a fixed amplitude of the noise. At the smaller value of
, the residual and error have reached a noise floor at a small level, as expected.
Observe that in all four realizations shown, the residual has reached a noise floor at an earlier iteration number than the error reaches a noise floor. For example, in Panel (a) with noise level of 0.01, the residual flattens around iteration 70, and the error decreases until iteration 150 or so. This behavior is as predicted by the simple model in
Section 5 and underscores the point that the behavior of the residual does not necessarily reflect the behavior of the error in the presence of fluctuations.
7.3. Non-Gaussian Noise: Temporally Correlated, Spatially Uniform
For the second method, we use added non-Gaussian, temporally correlated noise. Given
as in Equation (
29), we first create a time series
to mimic the flux from a turbulence simulation. This time series is created using the method described in
Section 6.2. Due to boundary conditions, the noisy flux signal used here involves a slight modification of Equation (
28) to apply a windowing function and is given by:
is generated using the same procedure and ARMA(
) coefficients as in
Figure 5b, except the variance
of
may be scaled from the original value.
We remark on having time-dependent noise
while simultaneously looking for a time-independent steady-state solution,
(although the following considerations apply even for finite
). Within the context of the multiple-timescale approach, there is no contradiction. The
t in
is formally a fast-turbulent-timescale variable, and the
t of the transport equation, to which
is related, is formally an independent, slow timescale variable. However,
in practice, a transport solver must deal with the time dependence of the turbulent heat flux
. As alluded to in
Section 5, in coupling turbulence simulations with transport, it is natural for the flux that is passed from the turbulence simulation to the transport solver to be averaged over a time
T to yield
, as in Equation (
8). We use
as the heat flux at each
l iteration of Equations (
2)–(6); that is,
is taken to be
. The time dependence in Equation (
38) mimics the time dependence on the turbulent timescale, which is then time-averaged to obtain
.
The averaging time
T is a free parameter. Given the discussion in
Section 4 and the central limit theorem, one is motivated to choose an averaging
T of at least a few autocorrelation times. A larger
T reduces the variance of
and also, because of the central limit theorem, brings its distribution closer to Gaussian. In our numerical experiments, we will explore the effect of the averaging time
T in addition to the amplitude of the fluctuations. We remark that as long as
, the correlation between subsequent samples of
is negligible. However, this would not be the case for small
T, and furthermore, the bursty, non-Gaussian behavior remains.
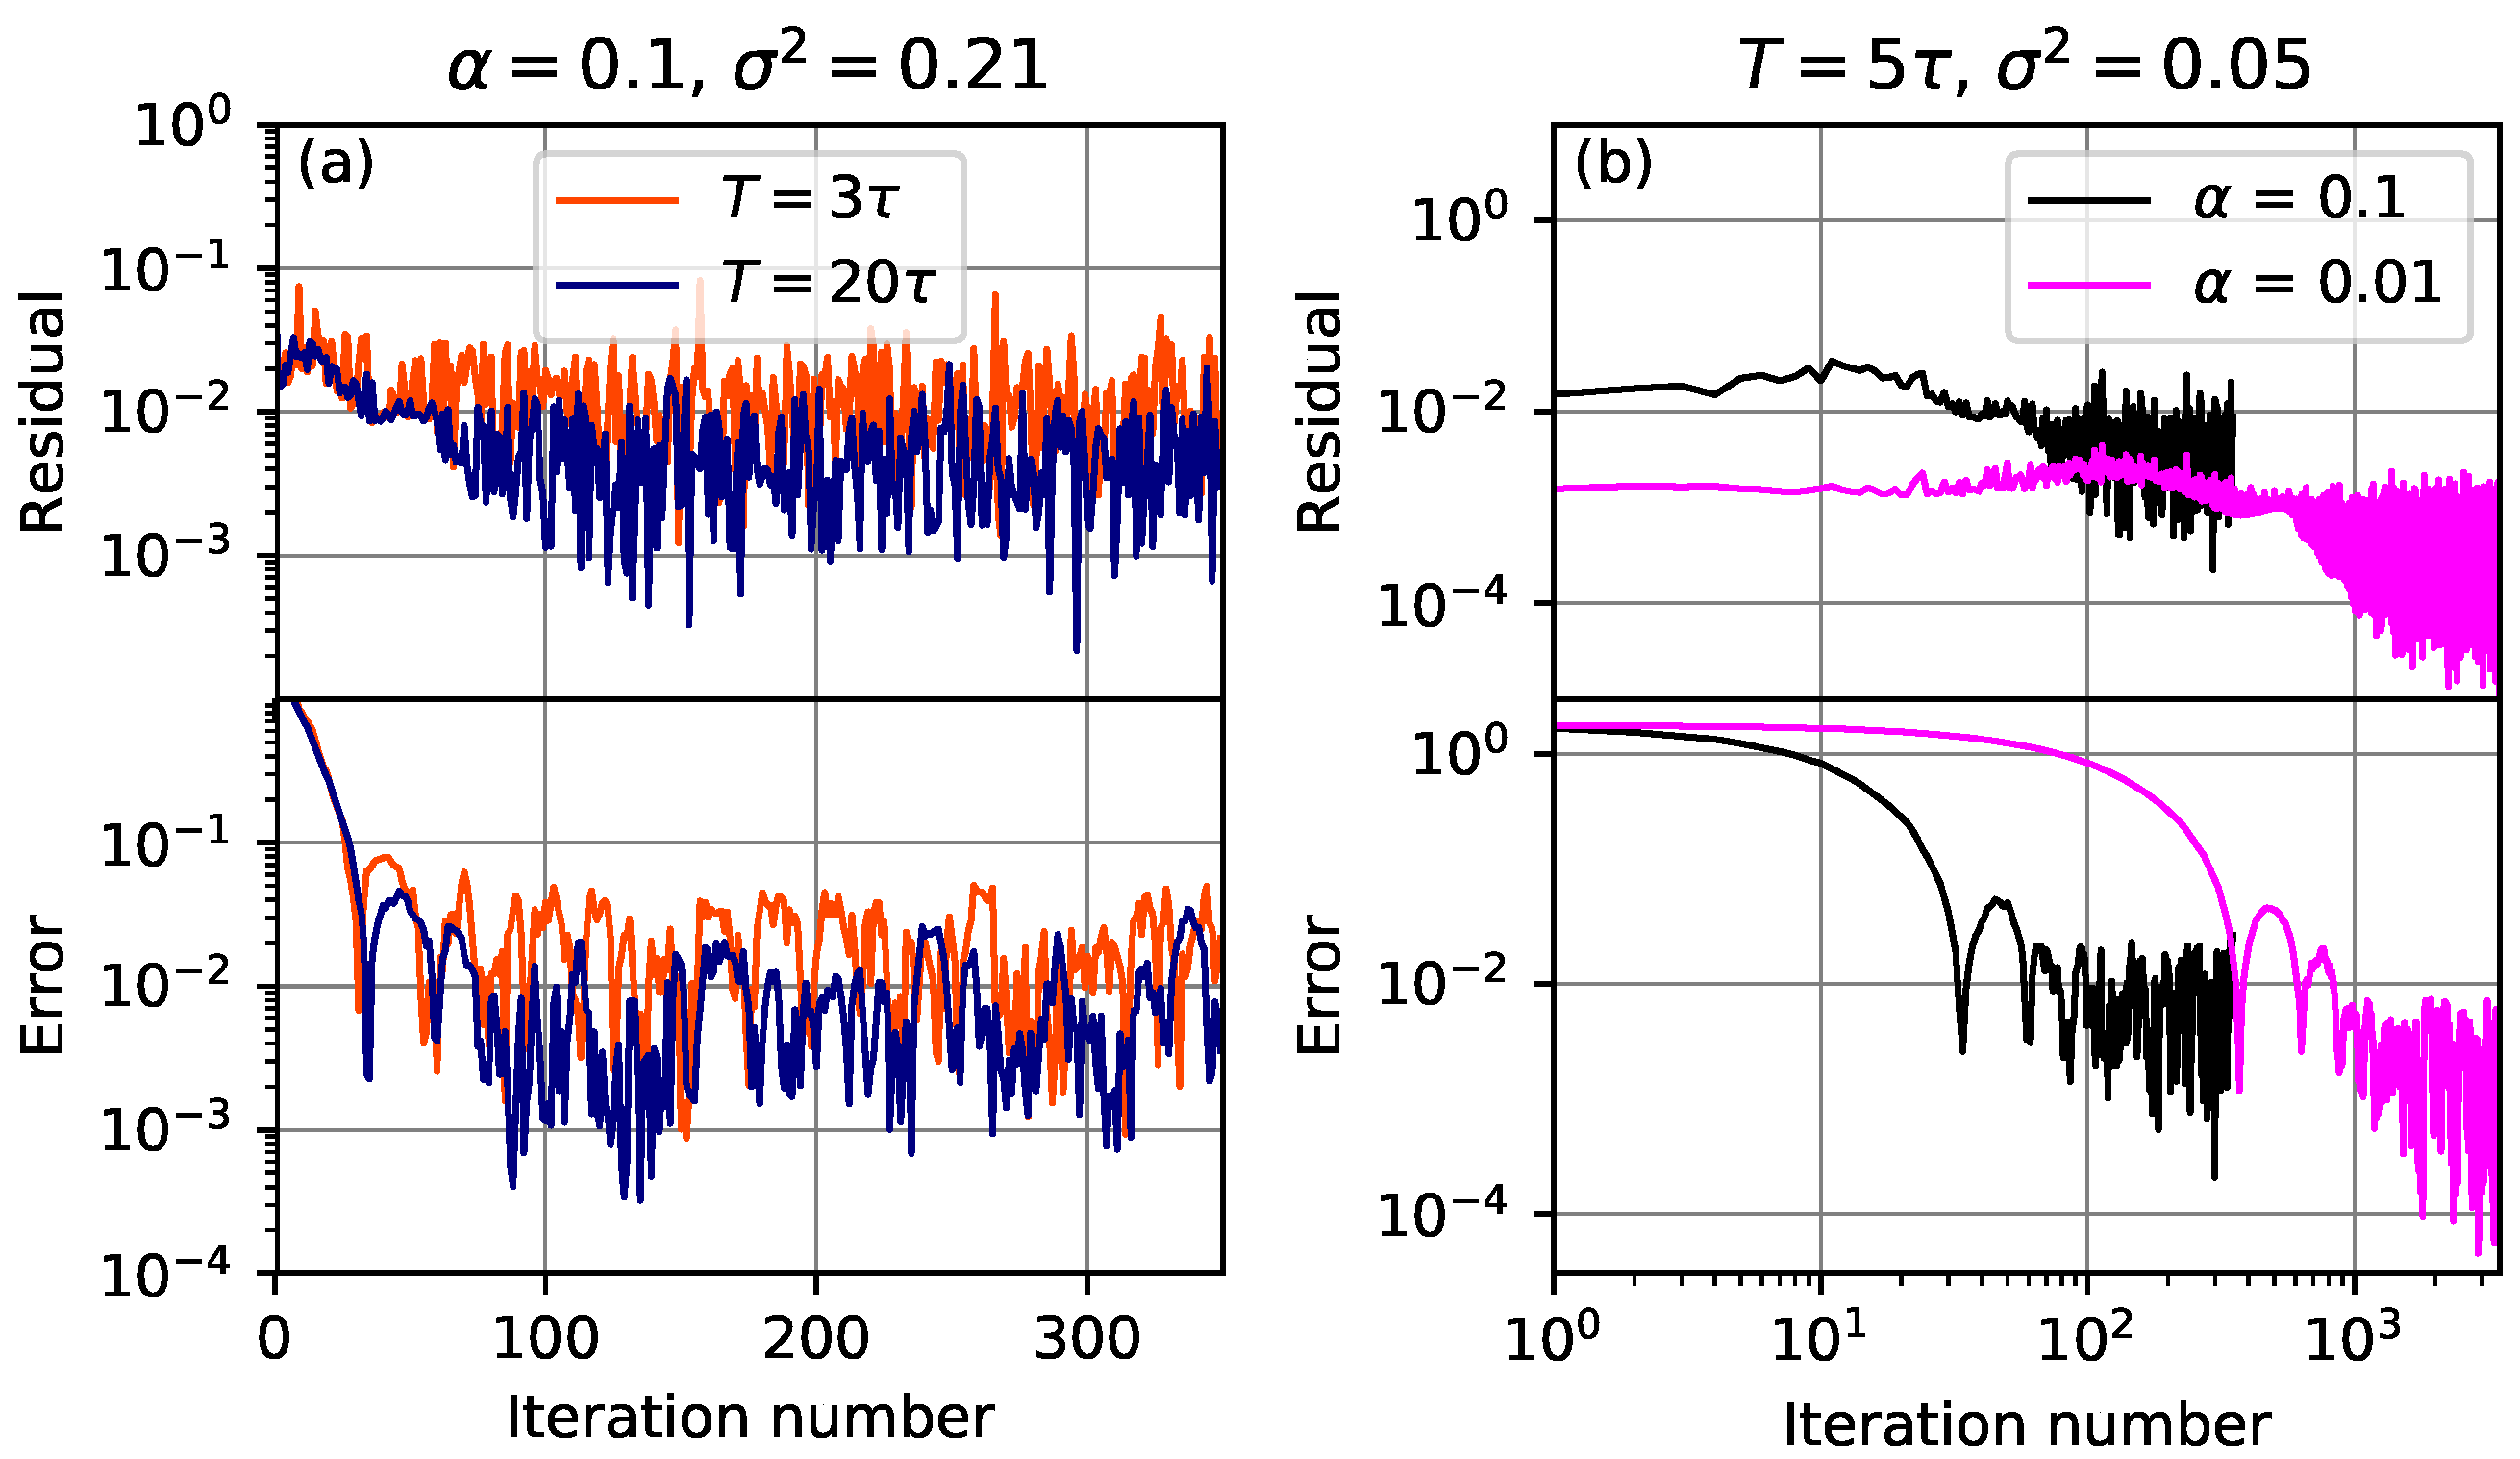
Figure 7 shows the convergence of the residual and error in realizations of the system with added non-Gaussian noise. Panel (a) shows two realizations for different averaging times,
and
. At larger
T, the error and residual at the noise floor are reduced. Panel (b) shows two realizations with different values of the relaxation parameter
. The same behavior as in
Figure 6 is observed, where at smaller values of
, the system takes longer to converge, but eventually reaches a smaller residual and error. We also observe that at
, the residual reaches a noise floor at iteration ≈700, while the error continues to decrease until it reaches a noise floor at iteration ≈1200. This behavior where the error can continue to decrease even when the residual does not is consistent with the simple model in
Section 5.
In
Figure 8, we show the residual and the error at the noise floor and their scaling with the averaging time and the relaxation parameter. The residual and the error at the noise floor scale as
, which is expected because the standard deviation of the fluctuations also scales as
. As the relaxation parameter varies, the residual is proportional to
, while the error is proportional to
. Again, this behavior is as predicted by the model in
Section 5. For these plots, we have averaged the error of each iteration over the final 10% of iterations, after the noise floor has been reached. This definition gives a measure of the instantaneous error and allows us to make contact with the scaling found from our earlier analytic model. In practice, averaging the solution over many iterations will provide a better answer, with a smaller error.
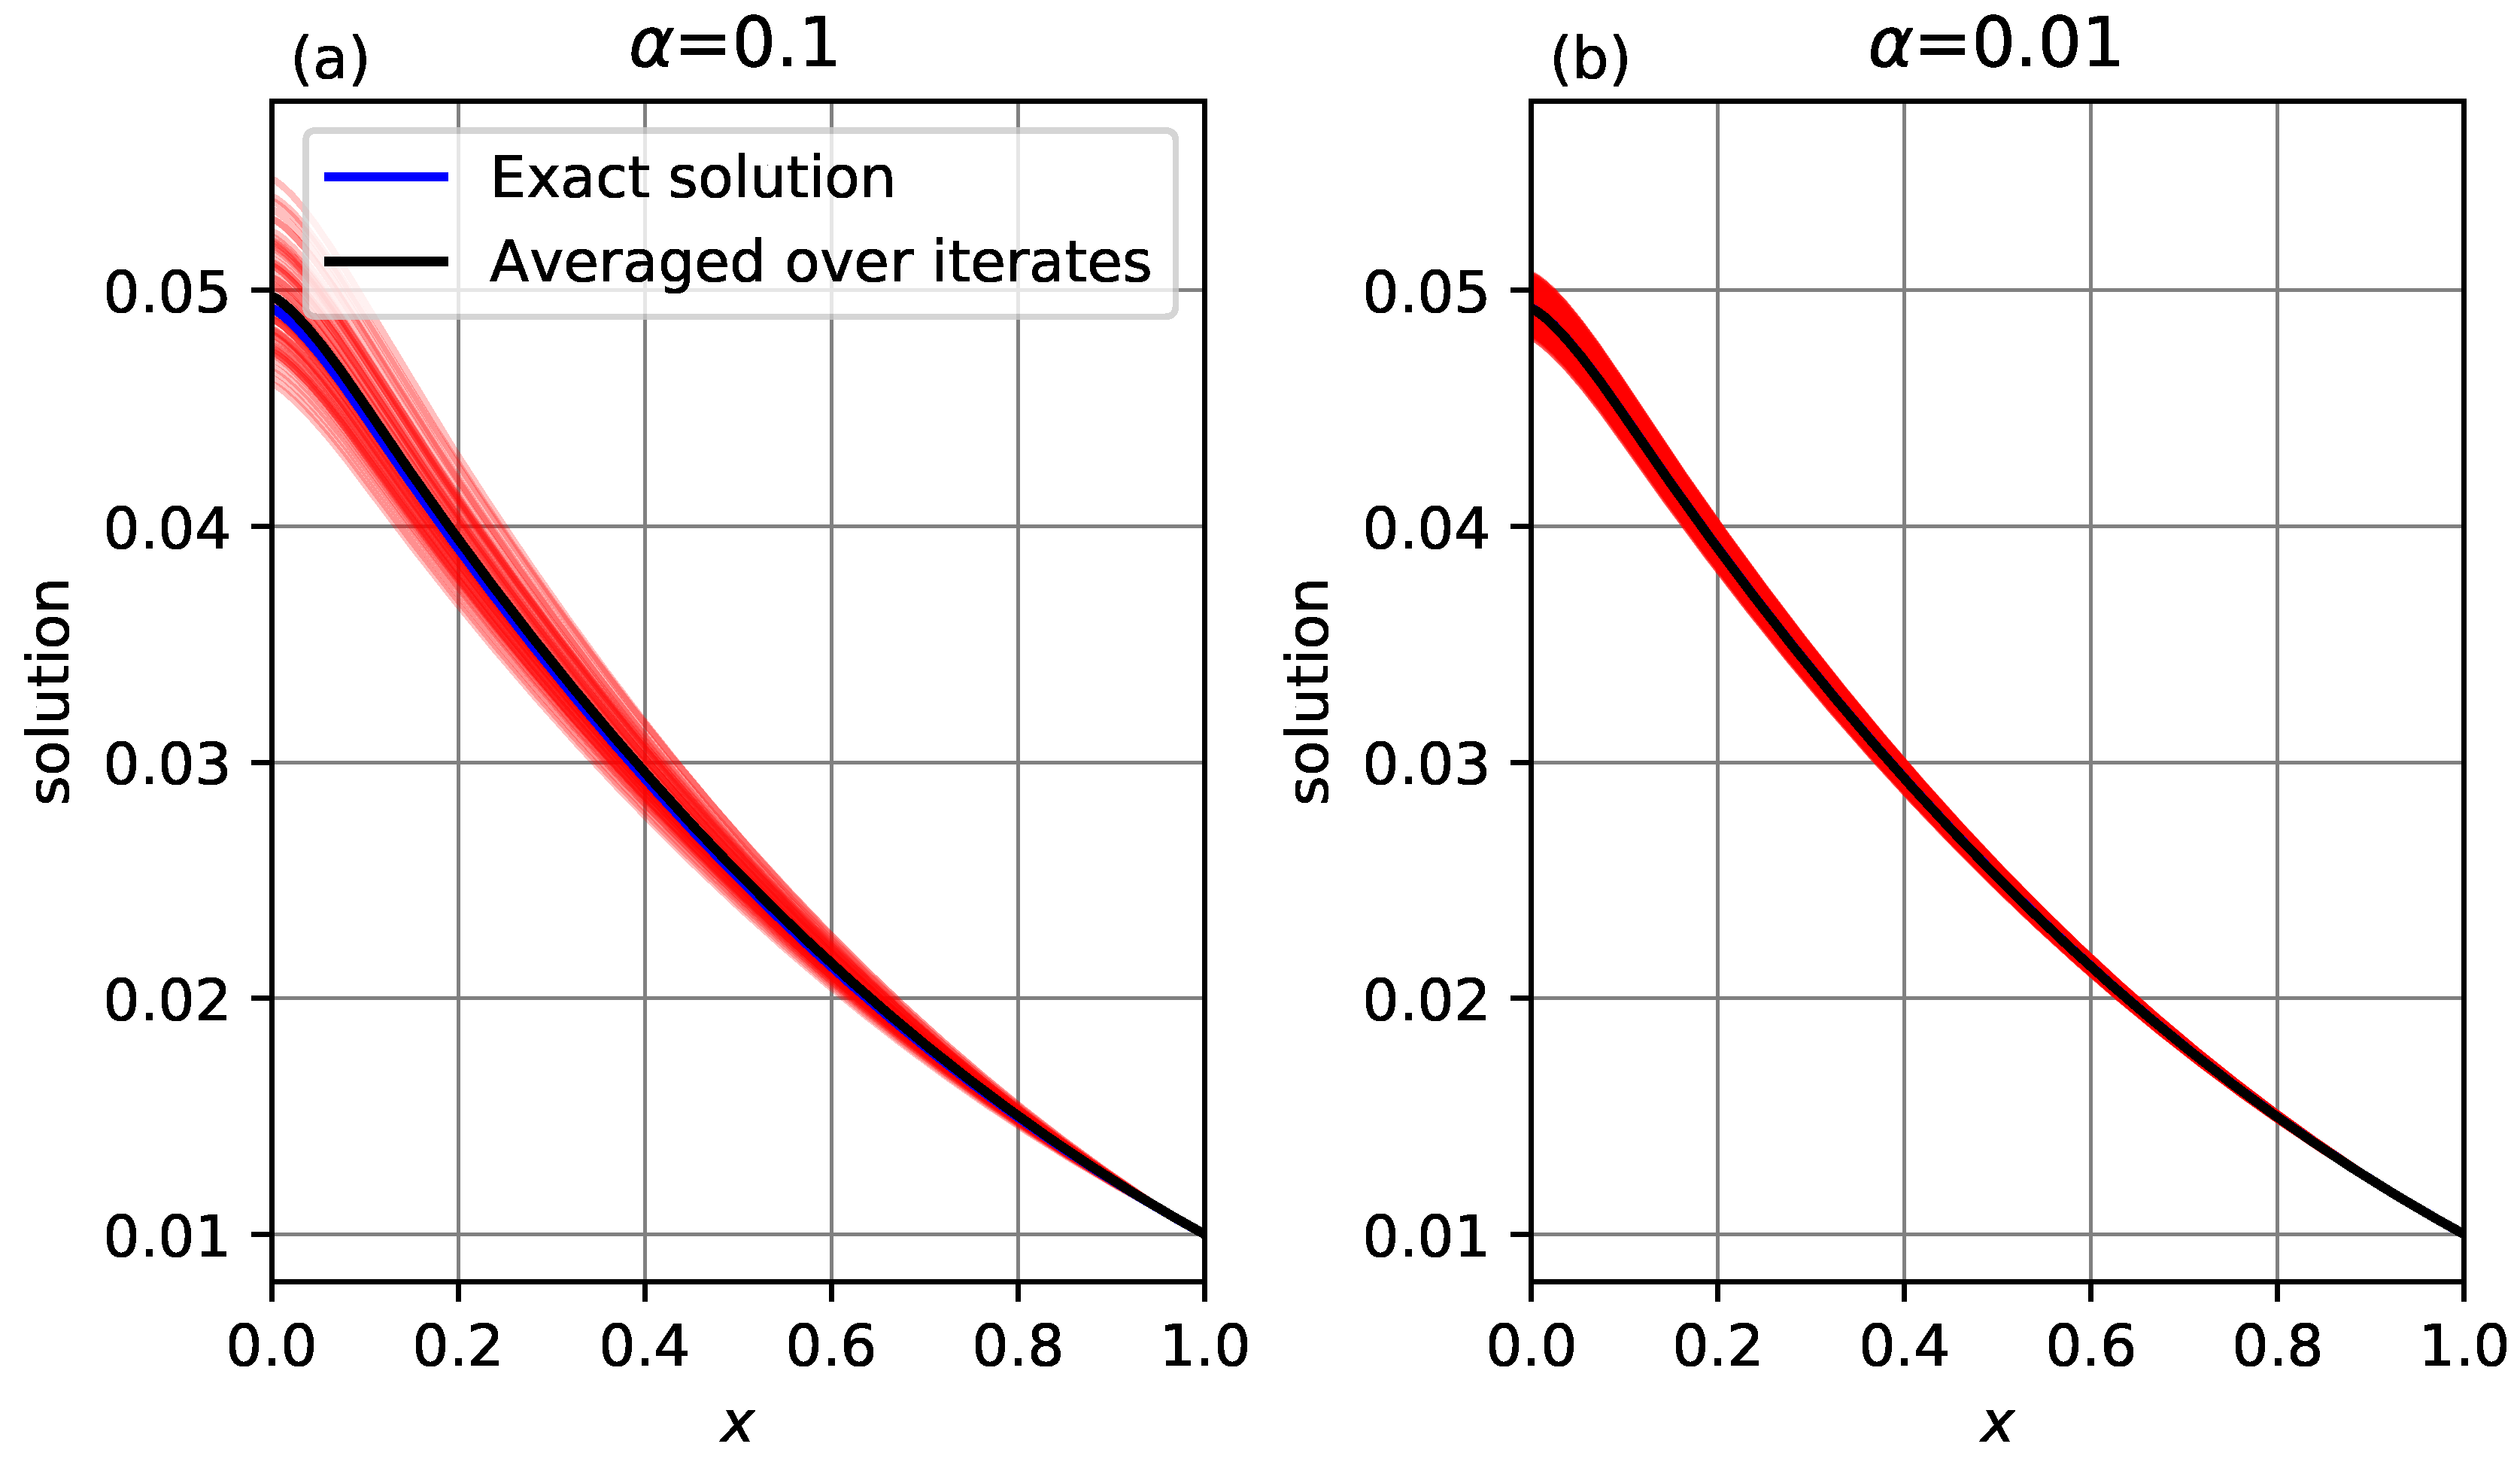
Figure 9 presents an illustration of this averaging, showing the profile at several individual iterates (red lines), the profile averaged over those iterates (black line) and the exact solution (blue line). For
, 60 iterates are shown, and the averaged profile is almost indistinguishable from the exact solution. For
, 600 iterates are shown, which have a narrower spread than at
, and the averaged profile is visually indistinguishable from the exact solution.
8. Discussion
We have explored the effect of fluctuations on the convergence of a coupled turbulence-transport simulation. Our motivation is the transport caused by gyrokinetic turbulence in the core of a tokamak. The fluctuations inherent in direct numerical simulations (DNS) of turbulence present a challenge for the convergence of transport solvers, and the error induced by the fluctuations must be understood and managed. To study this problem, we set up a simpler model of a transport solver with flux computed not by a turbulence simulation, but by an analytic formula plus artificially generated noise.
In treating turbulent fluctuations within a statistical framework, we have identified the autocorrelation time τ of the fluctuations as a key parameter. A coupled turbulence-transport simulation will pass the turbulent flux, averaged over a time T, to the transport solver. T is naturally measured in terms of τ. Furthermore, the central limit theorem for correlated sequences shows that in a stationary process, the averaged flux becomes normally distributed as .
To investigate the effect of fluctuations on convergence without the computational expense of full turbulence DNS, we have proposed a method for generating random noise to be combined with prescribed fluxes. We have used classic autoregressive-moving-average (ARMA) modeling from time-series analysis, which is simple, well understood, and easily implemented with available software packages. With appropriate transforms, non-Gaussian signals can be represented.
Adding these fluctuations to a solvable transport problem enables us to examine the behavior of a numerical method for solving the coupled turbulence-transport system. Using either spatially correlated or temporally correlated noise, we have explored the convergence of the residual and the error as we vary the amplitude of the noise, T, and the relaxation parameter, . One conclusion is that when relaxation is used, the residual may not be a good proxy for the error of the solution. The residual can reach a noise floor when further iterations decrease the error. Moreover, at the noise floor, the amplitude of the residual scales as , whereas the amplitude of the error scales as . The behaviors can be understood through a simple, one-degree-of-freedom analytic model.
For actual turbulence-transport simulations, both
and
T are control knobs. Smaller
and larger
T provide more effective averaging, and the error at the noise floor scales as
and
. On the other hand, the total computational time to converge scales as
. Hence, in terms of scaling alone, neither parameter is a clearly superior control knob. In practice,
will have to be small enough to stabilize the iterations [
9].
This sort of testing with artificial fluctuations allows us to predict approximately how much averaging is required to achieve a given accuracy in the real problem of transport-turbulence simulations. Assuming the fluctuations in DNS remain comparable to those in the ARMA training data, our results here suggest that for
and
, the error at the noise floor is about a few percent. The analogous prediction for
was borne out in the coupled turbulence-transport simulations in [
12]. Hence, these approximate predictions with simple models can provide a very useful guide. On the other hand, gyrokinetic simulations in some situations, such as close to marginal stability, have been known to be bursty and intermittent, with long periods of quiescence followed by short-duration bursts that dominate the total flux. Such a regime, consisting of fluctuations qualitatively different from those used in this study, would be challenging for any multiple-timescale method. It remains to be seen how well the method here would fare in that regime.
In summary, one challenge of coupling turbulence simulations directly to a transport solver is how fluctuations in the simulated turbulent flux affect convergence. At least some of the effect of the fluctuations can be understood through relatively simple models and artificially generated noise, as we have done here. For characterizing the behavior of a transport solver in the presence of fluctuations, such simple models provide an efficient alternative to using computationally intensive turbulence simulations.


