
Review

Thermal Transformation of Clay Minerals with Increasing Temperature: A Comprehensive Review of Infrared and Raman Spectroscopic Methods

by
J. Theo Kloprogge
Department of Chemistry, College of Arts and Sciences, The University of the Philippines Visayas, Miagao 5023, Philippines
Ceramics 2026, 9(8), 74; https://doi.org/10.3390/ceramics9080074
Submission received: 18 June 2026 / Revised: 21 July 2026 / Accepted: 22 July 2026 / Published: 24 July 2026
(This article belongs to the Special Issue Advances in Ceramics, 3rd Edition)

Abstract

Thermal treatment of clay minerals induces a sequence of dehydration, dehydroxylation, and recrystallization reactions that control the properties of ceramic materials, calcined clays, and other high-temperature products. This review examines how vibrational spectroscopic techniques, particularly Fourier-transform infrared (FTIR), Raman, and infrared emission spectroscopy (IES), have advanced the molecular-level understanding of these transformations. Unlike conventional thermal analysis methods, these techniques directly monitor changes in hydroxyl groups, interlayer water, silicate frameworks, and newly formed phases during heating, providing real-time insight into reaction pathways and intermediate structures. The thermal behavior of major clay mineral groups, including kaolinite-group minerals, serpentines, smectites, illite, palygorskite, sepiolite, and mixed-layer clays, is compared in terms of their characteristic spectroscopic responses to increasing temperature. Particular attention is given to band shifts, intensity variations, band disappearance, and the appearance of new vibrational features associated with structural reorganization and phase development. The reviewed studies demonstrate that thermal stability is primarily governed by octahedral composition, cation–OH bond strength, vacancy distribution, and crystallinity. Integration of spectroscopic observations with complementary diffraction and thermal analysis data provides a unified framework for understanding clay mineral transformations and for optimizing thermal processing in ceramic manufacture and calcined clay applications.

1. Introduction

Clay minerals are among the most abundant and technologically important aluminosilicates on Earth and constitute essential raw materials for ceramics, refractories, catalysts, adsorbents, environmental remediation technologies, and, more recently, supplementary cementitious materials for low-carbon construction applications [1,2,3,4]. Their industrial performance is governed not only by chemical composition and crystal structure but also by the structural transformations that occur during thermal treatment. Heating induces a sequence of dehydration, dehydroxylation, and recrystallization reactions that progressively modify interlayer water, structural hydroxyl groups, octahedral sheets, and silicate frameworks, ultimately leading to the formation of new mineral and ceramic phases [5,6,7,8].
For decades, thermal transformations of clay minerals have been investigated using thermogravimetry (TG), differential thermal analysis (DTA), differential scanning calorimetry (DSC), and high-temperature X-ray diffraction (HT-XRD) [5,7,9]. These techniques provide valuable information on mass loss, reaction temperatures, thermal stability, and phase evolution, but they offer only limited insight into the molecular-scale processes responsible for structural reorganization. In contrast, vibrational spectroscopic techniques directly probe hydroxyl groups, molecular water, silicate frameworks, cation environments, and newly formed phases, making them particularly well suited for investigating thermal transformations in clay minerals [10,11,12,13].
Fourier-transform infrared (FTIR) spectroscopy has long been used to identify OH-stretching, OH-bending, H–O–H deformation, Si–O stretching, and lattice vibrational modes in clay minerals and related phyllosilicates [10,13,14]. Temperature-dependent FTIR studies reveal systematic changes in band position, intensity, width, and shape associated with dehydration and dehydroxylation reactions and provide direct evidence for modifications in local structural environments [15,16,17,18]. Raman spectroscopy provides complementary information and is particularly sensitive to short-range structural order, cation substitutions, framework distortions, and the formation of recrystallization products during heating [11,12,19]. Together, FTIR and Raman spectroscopy permit detailed characterization of both molecular-scale transformations and phase evolution and provide information that is often inaccessible through thermal analysis alone.
A particularly important development has been the application of infrared emission spectroscopy (IES) to the study of clay mineral thermal behavior. Unlike conventional ex situ methods, IES allows spectra to be collected directly from samples at elevated temperatures and therefore follows structural transformations as they occur. This capability enables real-time observation of dehydration, dehydroxylation, recrystallization, and the evolution of hydroxyl environments, often revealing intermediate states that are difficult or impossible to observe using conventional thermal techniques alone [20,21]. Applications to kaolinite-group minerals, serpentines, smectites, illite, palygorskite, sepiolite, and mixed-layer clay minerals have demonstrated the unique value of IES for elucidating reaction pathways and mechanisms during thermal treatment.
Over the past three decades, the combined application of FTIR, Raman, and IES has transformed our understanding of clay mineral thermal behavior. These studies have shown that thermal stability is controlled by factors such as octahedral cation composition, cation–OH bond strength, crystallinity, particle size, and interlayer chemistry, all of which are reflected in characteristic spectroscopic responses [10,11,12,20,21].
This comprehensive review synthesizes recent advances in in situ infrared emission spectroscopy (IES), FTIR and Raman spectroscopy applied to clay mineral thermal transformations, with particular emphasis on the implications for ceramic production and other high-temperature applications. The molecular-level understanding derived from these spectroscopic methods directly addresses practical challenges in ceramic manufacturing, where precise knowledge of dehydration kinetics, dehydroxylation mechanisms, and phase evolution pathways is essential for optimizing firing temperatures, minimizing defects, and achieving superior mechanical properties [22,23]. Particular emphasis is placed on spectroscopic indicators of dehydration, dehydroxylation, and recrystallization, including band shifts, intensity variations, band broadening, band disappearance, and the emergence of new vibrational features. By comparing the thermal behavior of the major clay mineral groups within a common spectroscopic framework, this review highlights the molecular mechanisms governing thermal transformation. By organizing thermal data across all major clay mineral families—from simple 1:1 layer silicates like kaolinite through complex 2:1 smectites to mixed-layer and fibrous minerals—this review establishes a unified framework for predicting how any natural clay assemblage will respond to thermal treatment. The systematic application of spectroscopic findings to ceramic processing represents a significant advance in moving beyond empirical kiln management toward scientifically informed optimization of ceramic material properties. Furthermore, this knowledge has broader implications for calcined clay applications such as supplementary cementitious materials, environmental remediation systems, and other high-temperature technologies where controlled thermal activation is critical to performance. Beyond their traditional importance in ceramic manufacture, individual clay mineral groups are used in a wide variety of industrial applications including catalysts, adsorbents, drilling fluids, foundry binders, environmental remediation, nanocomposites and supplementary cementitious materials. Because the performance of these materials is often governed by thermally induced structural transformations, understanding their dehydration, dehydroxylation and recrystallization behavior is of importance across a broad range of scientific and engineering disciplines. Unless otherwise stated, the vibrational spectroscopic studies discussed throughout this review were performed on well-characterized reference clay minerals obtained from internationally recognized reference collections (e.g., the Clay Minerals Society Source Clays Repository) or from thoroughly characterized geological reference materials reported in the original publications (Appendix A, Table A1).

2. Advanced Spectroscopic Characterization Methods

Infrared (IR) and Raman spectroscopy are crucial techniques for investigating the thermal transformations of clay minerals, providing in situ insights into their structural and chemical changes upon heating [20,21]. These methods allow researchers to monitor dynamic processes like dehydration and dehydroxylation by observing shifts and alterations in vibrational bands associated with water and hydroxyl groups.

2.1. Infrared Emission Spectroscopy at Elevated Temperatures

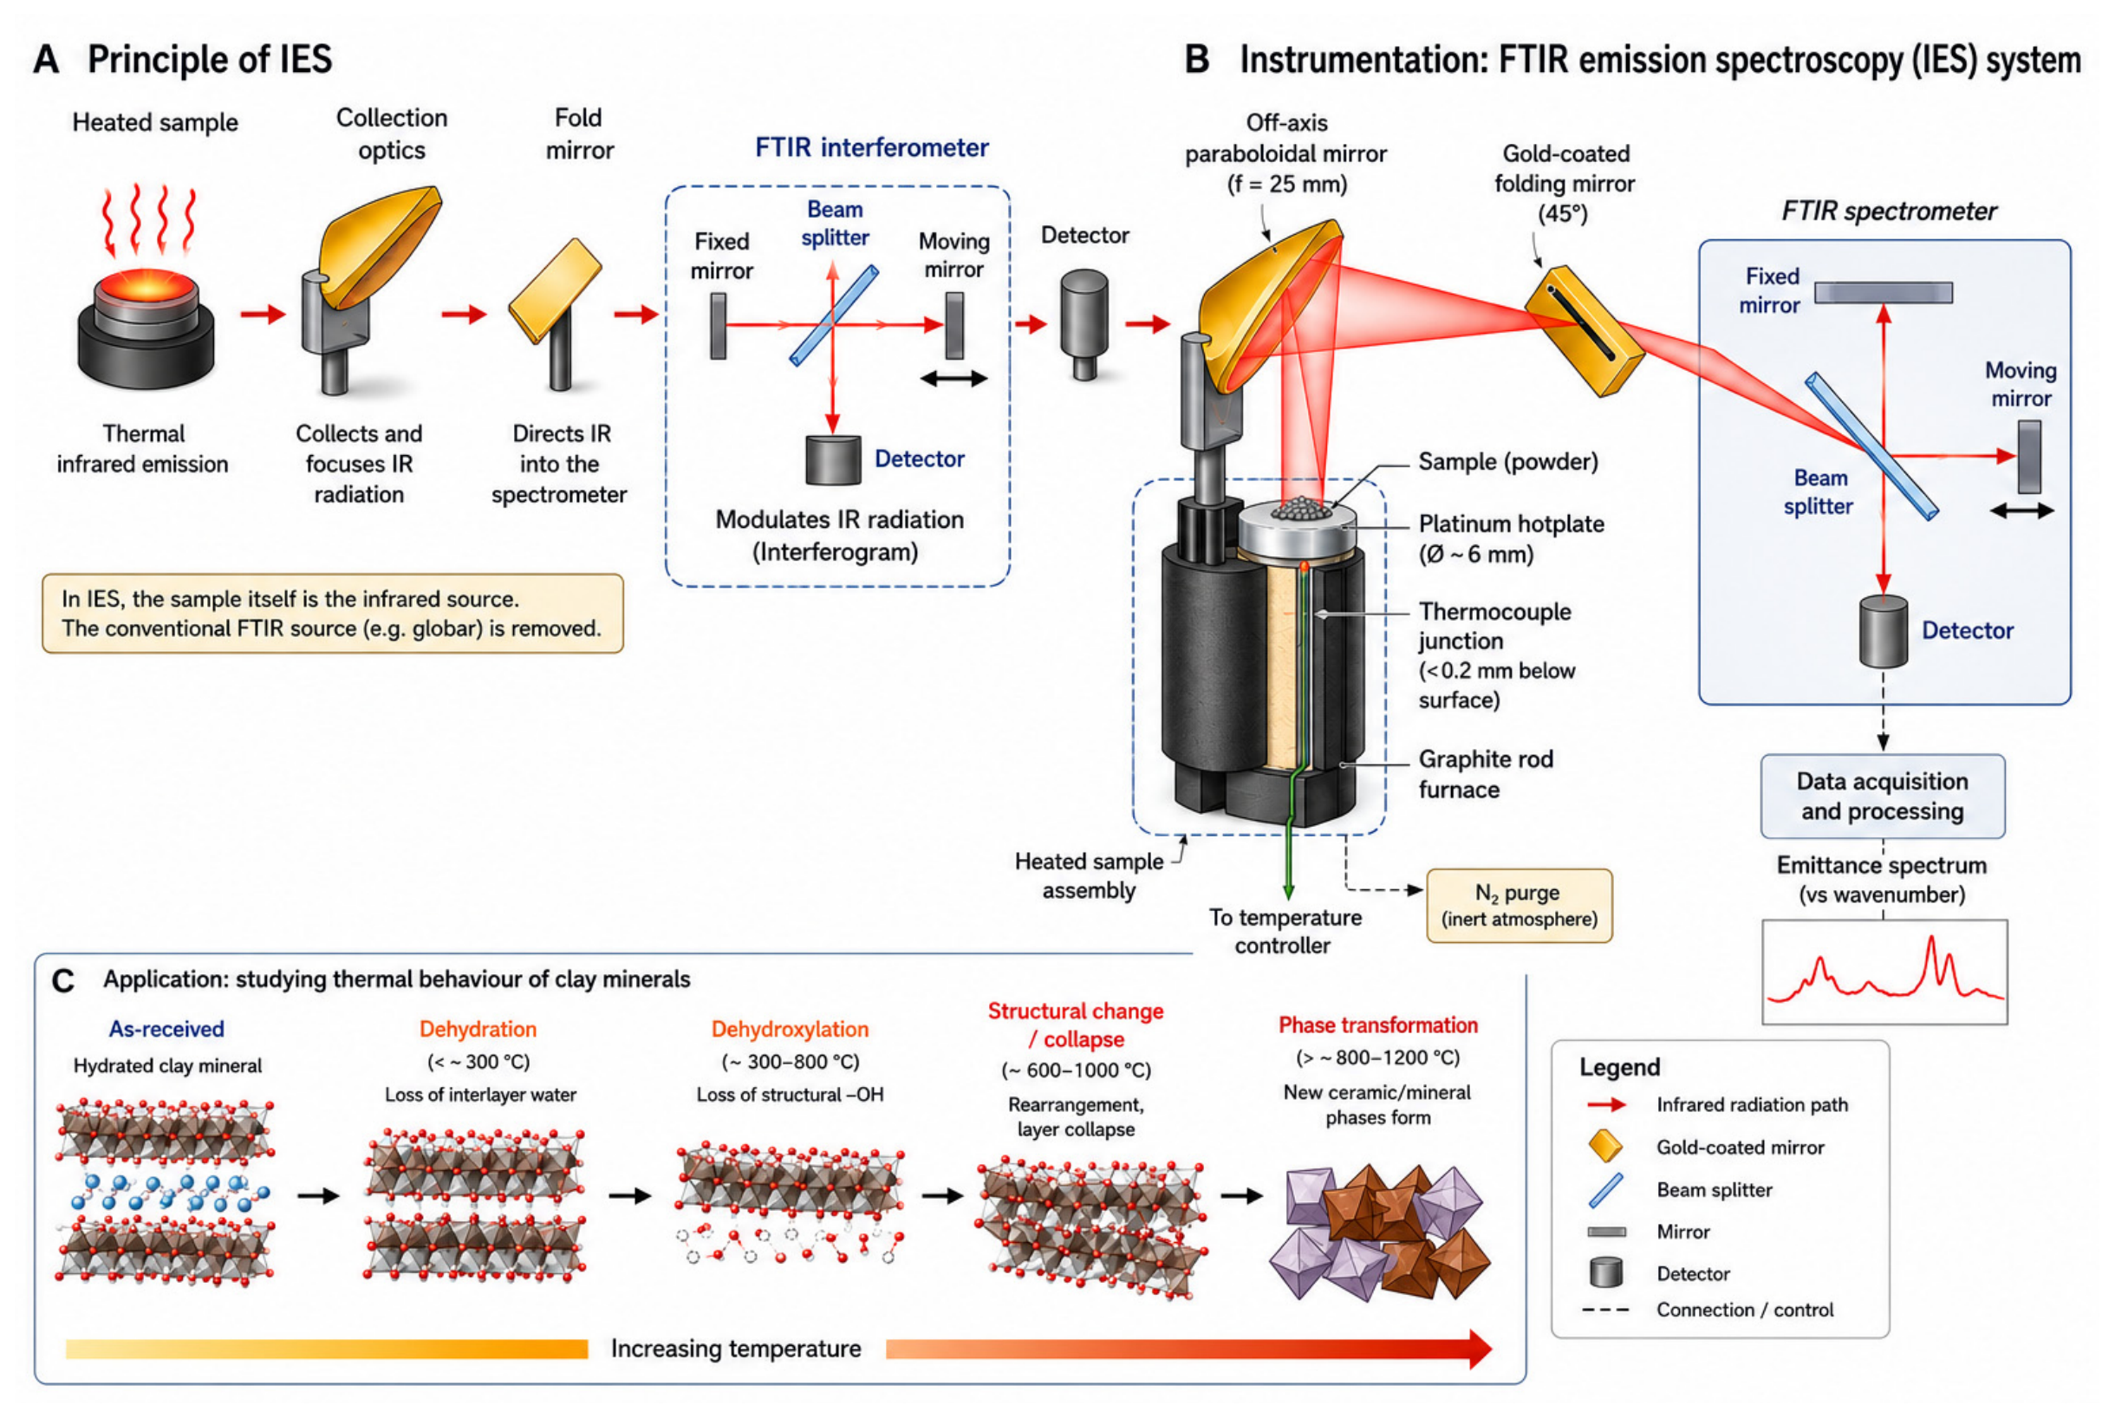
Infrared emission spectroscopy (IES) has emerged as a powerful technique for studying clay mineral transformations in real-time at elevated temperatures [20,21]. In situ spectroscopic methods such as heating stage Raman spectroscopy and infrared emission spectroscopy have expanded our ability to study thermal transformations, with infrared emission spectroscopy forming a valuable technique that can be applied in situ during heat treatment. This approach provides real-time data on dehydroxylation as it occurs, which is difficult with traditional methods.
Infrared Emission Spectroscopy (IES) is particularly advantageous for studying thermal behavior because samples can be analyzed directly at elevated temperatures, eliminating the need for quenching [20,21]. IES involves measuring discrete vibrational frequencies emitted by thermally excited molecules, and its development, particularly with Fourier Transform Infrared Spectroscopy (FTIR), has significantly advanced its application in mineral studies (Figure 1). The technique ensures good quality spectra when using thin samples, which also minimizes reflectance effects and excessive temperature gradients that can lead to re-absorption of intense frequencies by cooler outer layers.
Despite these significant advantages, infrared emission spectroscopy also has several limitations. The technique requires specialized instrumentation that is available in relatively few laboratories and is therefore much less widely applied than conventional FTIR or Raman spectroscopy. Reliable measurements depend on the use of thin, homogeneous samples to minimize self-absorption, reflectance effects and temperature gradients across the specimen. In addition, the relatively weak infrared emission at low temperatures results in lower signal-to-noise ratios than at elevated temperatures. Furthermore, IES primarily provides information on changes in vibrational modes and therefore benefits greatly from complementary techniques such as thermogravimetry, differential scanning calorimetry and high-temperature X-ray diffraction, which provide quantitative information on mass loss, thermal events and crystallographic phase evolution. Consequently, IES should be regarded as a complementary technique that provides unique in situ molecular-level information rather than a replacement for established thermal and diffraction methods.

2.2. Raman Spectroscopy for Thermal Transformations

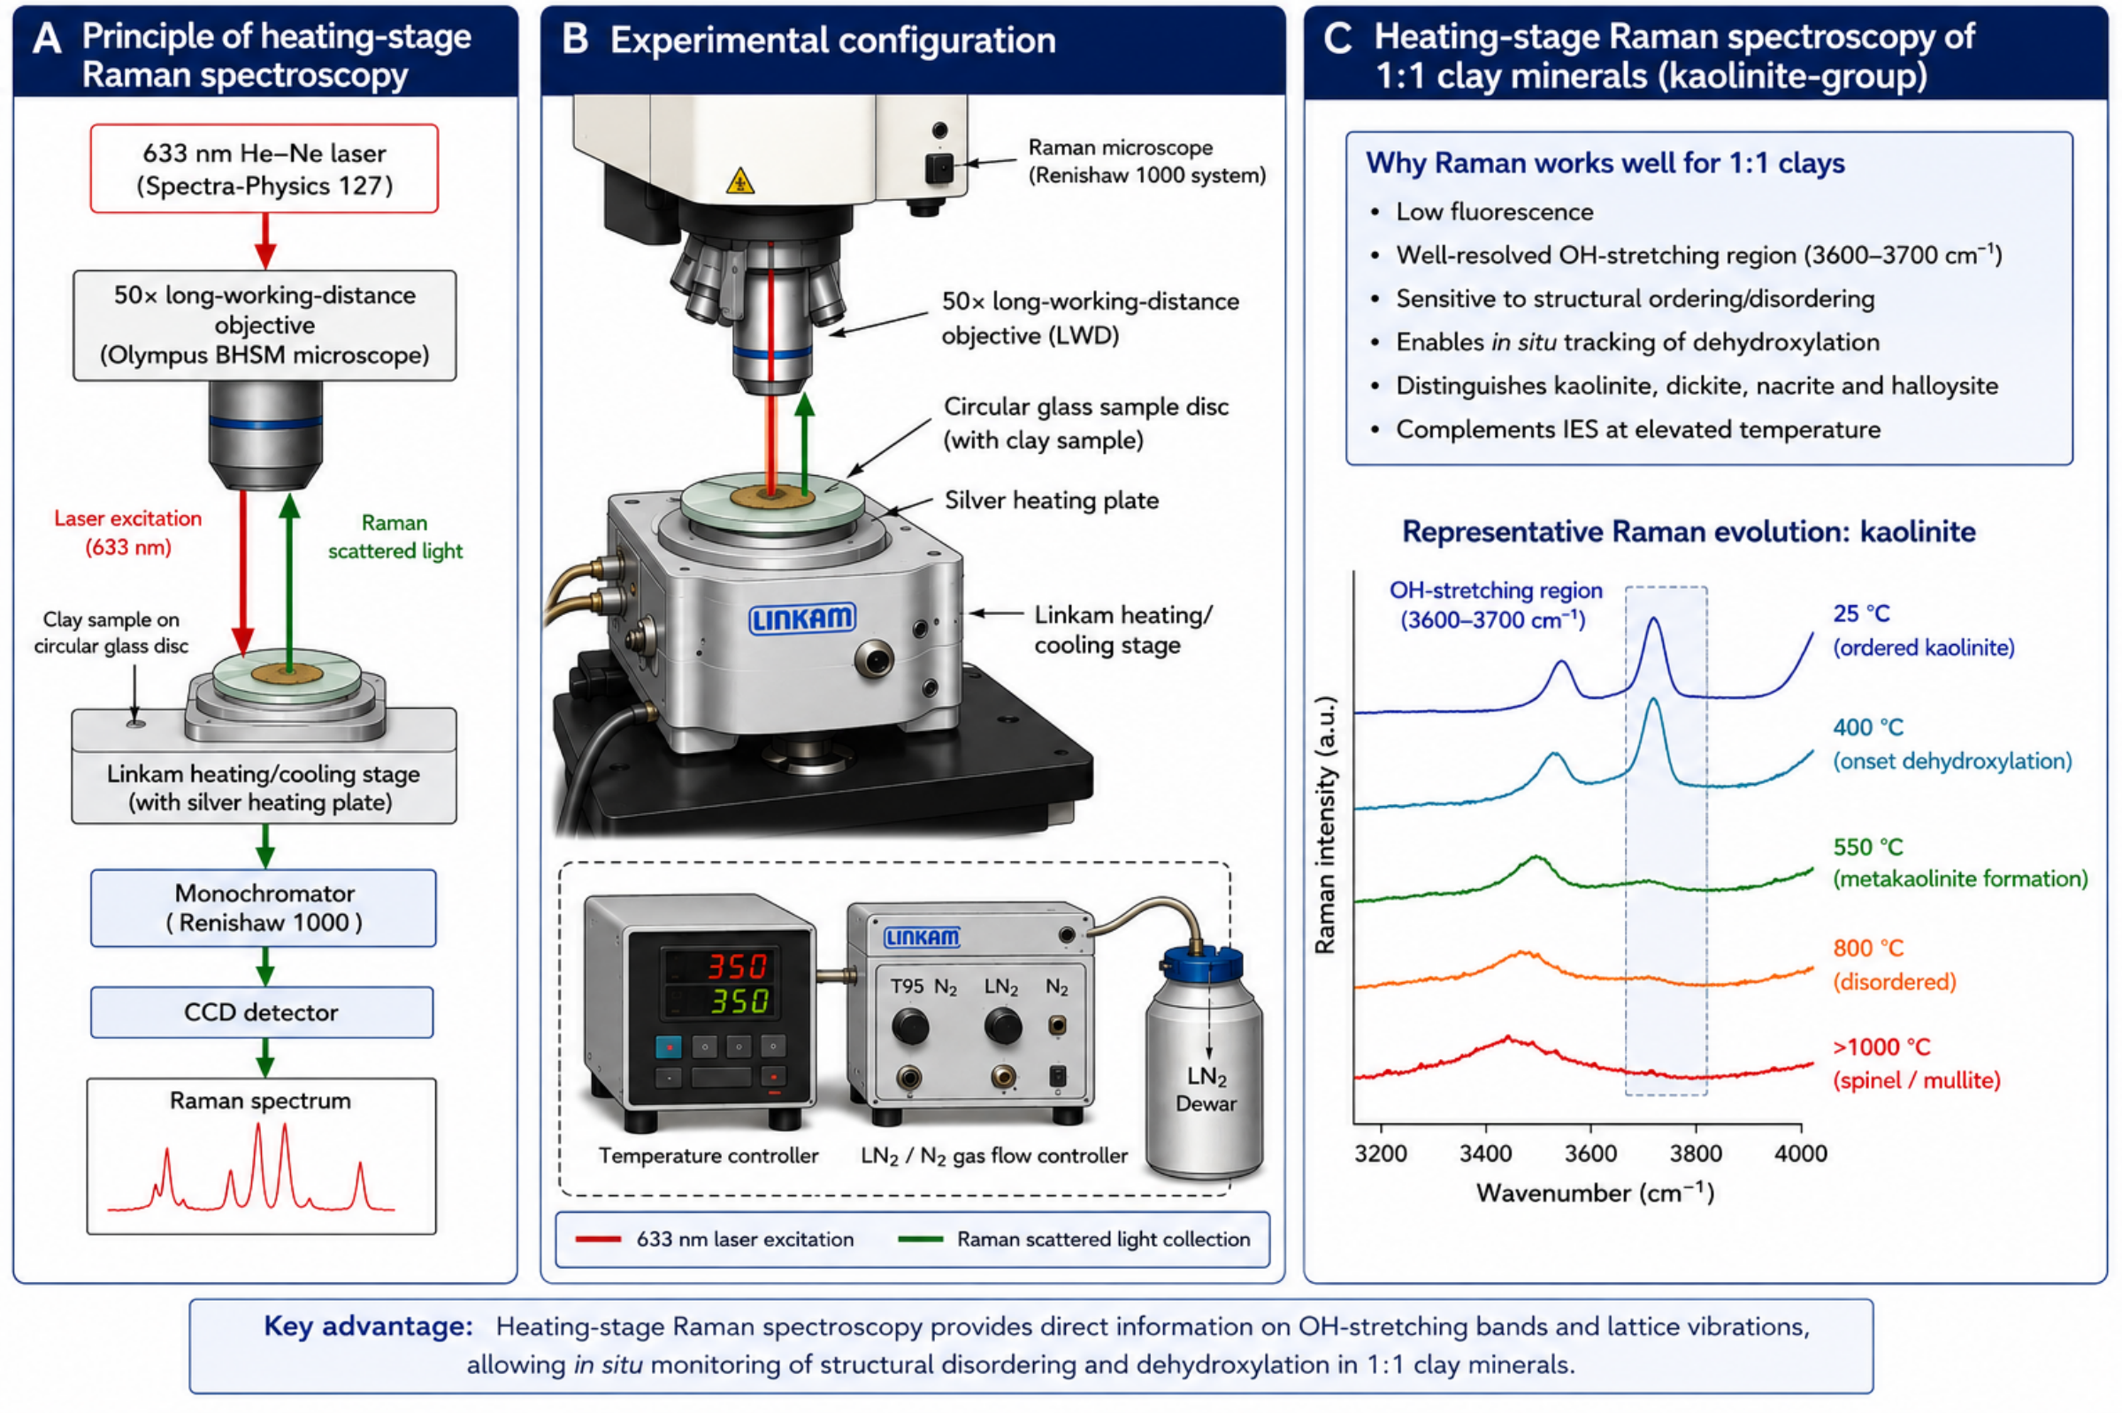
Raman spectroscopy serves as a valuable complementary tool for monitoring phase changes and structural transformations in minerals upon thermal treatment [20]. Raman spectroscopy is highly sensitive to molecular symmetry and changes in polarizability during vibrations, making it suitable for characterizing vibrational modes of symmetric molecules. The use of heating stages with Raman microscopes allows for in situ observation of these changes, although increased optical path and lower numerical aperture of long working distance objectives can lead to noisier spectra and longer accumulation times (Figure 2). The principle of detecting shifts in wavelength due to interaction between vibrating molecules and incoming photons allows for the identification of changes in bond properties and molecular structure during heating.

2.3. Complementary Spectroscopic Techniques

Multiple spectroscopic techniques are often employed in combination to provide a comprehensive understanding of clay thermal behavior [24]. In situ attenuated total reflectance Fourier-transform infrared (ATR-FTIR) spectroscopy can be used to quantitatively describe thermal transformations through a linear least-squares (LLS) spectral decomposition approach applied to temperature-resolved ATR-FTIR data sets to extract the degree of conversion (α) across multiple heating rates. Complementarily, in situ X-ray diffraction (XRD), thermogravimetric analysis, and ex situ Raman spectromicroscopy provide structural and compositional validation of the chemical and crystalline transformations. Variable-temperature diffuse reflectance infrared Fourier transform spectroscopy (VT-DRIFTS) combined with thermogravimetry–mass spectrometry (TG-MS) has proven particularly valuable for understanding rehydroxylation mechanisms in fired clays. These coupled studies reveal that physisorbed water is removed at approximately 105 °C, while strongly bound water and structural hydroxyl groups persist to temperatures ≤ 500 °C. A marked ceramic contraction occurs between 200 and 330 °C, corresponding to loss of strongly bound water, demonstrating that moisture–clay interactions govern rehydroxylation behavior. Additionally, steam-treatment experiments on homoionic cis-vacant montmorillonites reveal that dehydroxylation behavior after rehydroxylation differs markedly depending on interlayer cation composition, with the resulting structures showing celadonite-like characteristics. These findings emphasize that rehydroxylation is not a simple reversal of dehydroxylation but involves complex solid-state reactions governed by moisture availability and clay mineral composition.
The principal characteristics, strengths, limitations and applications of FTIR, Raman spectroscopy and infrared emission spectroscopy for investigating thermal transformations of clay minerals are summarized in Table 1.

2.4. Kinetic Analysis from Spectroscopic Data

Modern approaches to analyzing clay thermal behavior combine spectroscopic observations with detailed kinetic analysis [25]. By conducting heating experiments on carbonaceous chondrites containing clay minerals and evaluating their dehydration/dehydroxylation kinetics using in situ infrared spectroscopy equipped with a heating stage, the rate constants can be determined by fitting the decrease in the OH band using kinetic models such as first-order reactions, two-dimensional diffusion, and three-dimensional diffusion. The apparent activation energies and frequency factors can be determined using the Arrhenius equation, and time–temperature transformation diagrams can be drawn to represent the decrease in OH-band intensity as a function of temperature and heating duration. A methodological advance for quantitative FTIR analysis involves measuring the absorptivity ratio of the Si–O–Si stretching band rather than relying solely on peak position shifts. Since peak position in many clays (initially around 1030 cm−1) remains stable between 500 and 800 °C but shifts abruptly to 1080–1090 cm−1 above 800 °C, traditional peak-position methods produce firing temperature estimates too imprecise for archeological applications. The absorptivity-based approach using an internal standard (potassium ferricyanide) overcomes this limitation by directly quantifying temperature-dependent changes in molecular structure, providing a more continuous and reliable indicator across the entire thermal range.

2.5. Application of Vibrational Spectroscopy to Natural Clay Materials

The preceding sections have primarily discussed the application of FTIR, Raman spectroscopy and infrared emission spectroscopy (IES) to well-characterized clay minerals in order to illustrate the characteristic spectral changes associated with dehydration, dehydroxylation and recrystallization. In practice, however, natural clay deposits used for ceramic manufacture and other industrial applications rarely consist of single mineral phases. Instead, they typically comprise heterogeneous assemblages of clay minerals together with quartz, feldspars, carbonates, iron oxides, hydroxides, amorphous materials and variable amounts of organic matter [1]. Furthermore, natural clay minerals commonly exhibit isomorphous substitution, variable crystallinity, interstratification, particle-size effects and differences in exchangeable interlayer cations, all of which may influence band positions, widths and relative intensities [1,12]. Consequently, the interpretation of vibrational spectra obtained from natural clay materials is generally more complex than for well-defined reference minerals.
Fourier-transform infrared spectroscopy remains one of the most widely applied techniques for characterizing natural clay materials because of its high sensitivity to hydroxyl groups, molecular water and silicate vibrations. However, overlapping absorption bands arising from mixed mineral assemblages, together with contributions from quartz, feldspars and carbonates, may complicate mineral identification and quantitative interpretation. Despite these limitations, FTIR remains highly effective for monitoring dehydration, dehydroxylation and structural reorganization during thermal treatment, particularly when combined with reference spectra and complementary mineralogical analyses.
Raman spectroscopy provides highly specific structural information and is particularly valuable for identifying crystalline accessory phases and high-temperature recrystallization products [26]. However, the technique is frequently limited in natural clay materials by fluorescence arising from organic matter or transition-metal impurities, especially Fe3+-bearing phases, which may obscure weak Raman bands. In addition, local laser heating may influence spectra obtained from thermally sensitive materials if inappropriate laser powers are used. Nevertheless, the high spatial resolution achievable by Raman microscopy makes it particularly useful for investigating mineralogical heterogeneity within complex ceramic raw materials.
Infrared emission spectroscopy offers the unique advantage of monitoring thermal transformations directly at elevated temperatures without cooling the sample between measurements, thereby avoiding rehydration and allowing transient structural changes to be followed in situ [21]. Interpretation of spectra obtained from natural clay assemblages may, however, be complicated by overlapping emission bands from multiple mineral phases. Consequently, the greatest value of IES lies in following the evolution of the overall clay assemblage during heating rather than identifying individual mineral species in complex mixtures. As discussed previously, successful application of IES also requires thin, homogeneous samples to minimize self-absorption, reflectance effects and temperature gradients [21].
For natural clay materials, the most reliable interpretation is therefore obtained by combining vibrational spectroscopy with complementary analytical techniques, including X-ray diffraction, thermogravimetric analysis, differential scanning calorimetry and, where appropriate, electron microscopy and chemical analysis [1]. While X-ray diffraction provides definitive phase identification and thermal analysis quantifies mass-loss events and reaction temperatures, FTIR, Raman spectroscopy and IES provide complementary molecular-level information concerning changes in hydroxyl groups, molecular water and silicate structures during thermal transformation. The integration of these techniques therefore provides the most comprehensive understanding of the behavior of natural clay materials during ceramic processing.

3. Comparative Analysis of Clay Mineral Families: Thermal Transformations by Infrared Emission, FTIR and Raman Spectroscopy

3.1. One-to-One (1:1) Layer Silicates

The 1:1 layer silicates represent a fundamental group of clay minerals and include kaolinite, the principal raw material for whitewares, porcelain, paper coatings and many advanced ceramic products [3]. Their thermal behavior largely determines the development of metakaolin, mullite and other high-temperature phases important in ceramic manufacturing (Table 2). These minerals consist of alternating tetrahedral and octahedral sheets bound by hydrogen bonds between the layers that control their dehydroxylation behavior.

3.1.1. Kaolinite and Dickite

Recent work has clarified the mechanisms of kaolinite dehydroxylation through comprehensive experimental and theoretical investigations. Heating experiments with simultaneous thermal analysis followed by characterization using nuclear magnetic resonance spectroscopy and scanning electron microscopy found that local changes in crystal structure correlate with experimental results showing increasing dehydroxylation temperature in the order: kaolinite, dickite [27]. Intermediate phases found to be thermodynamically stable at partial dehydroxylation of 75%, 25%, and 50% dickite contain Al(V), while metakaolinite and metadickite contain only Al(IV) with strongly distorted coordination shells.
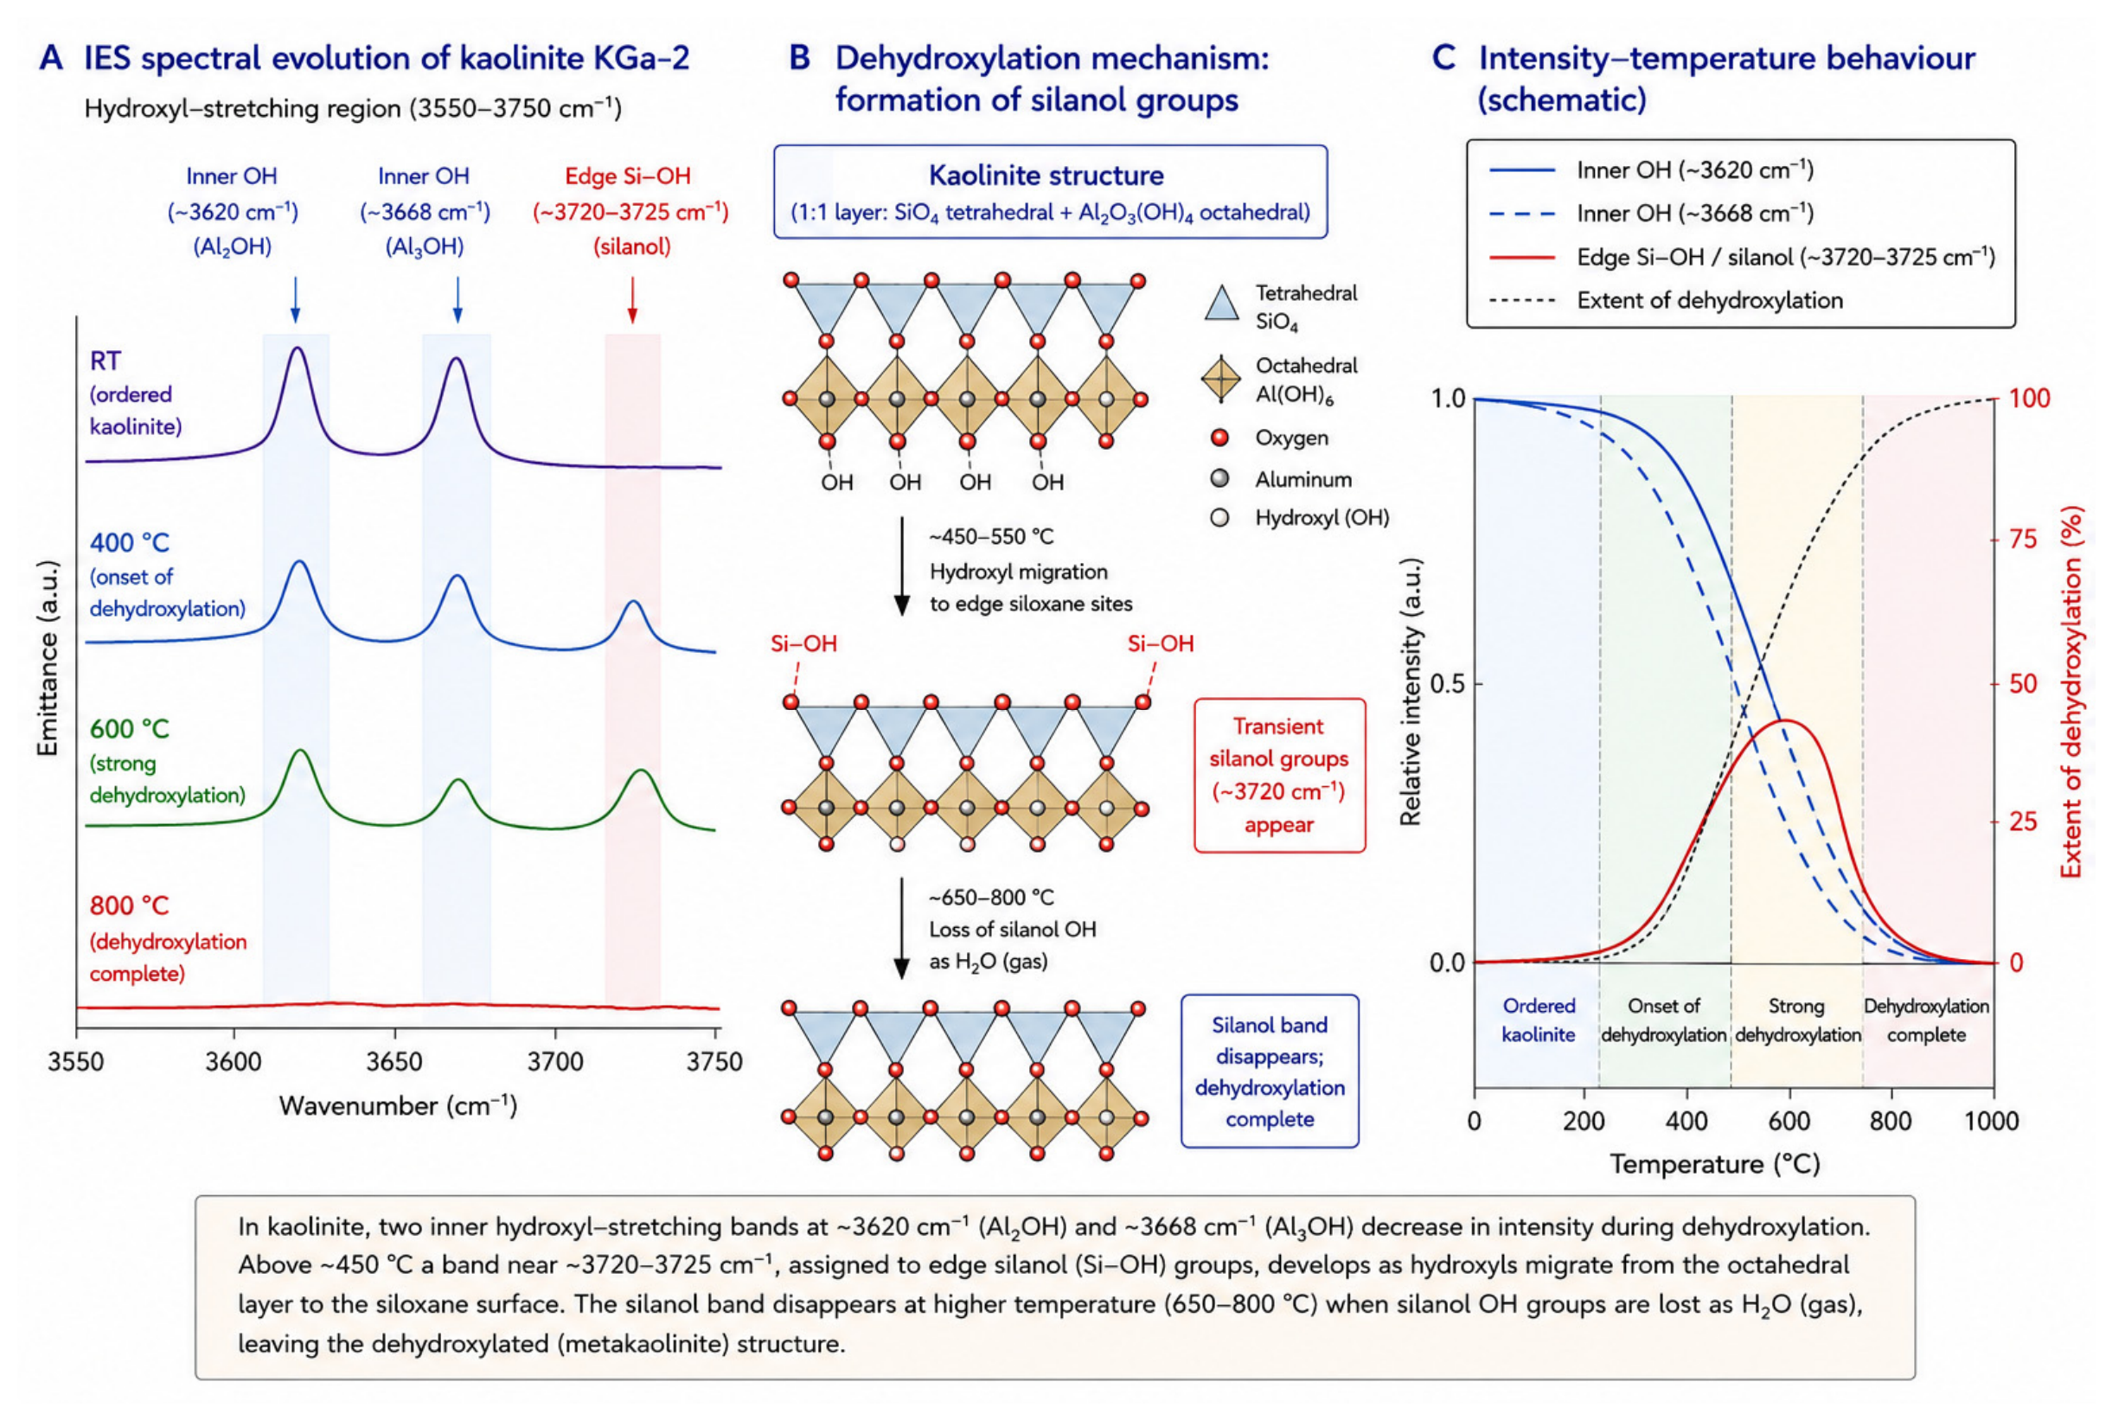
A critical comparative study using infrared emission spectroscopy has revealed important structural differences among kaolinite group polymorphs. While kaolinite loses both inner and outer hydroxyl groups simultaneously in a homogeneous dehydroxylation process involving two mechanisms (Figure 3), dickite and halloysite exhibit stepwise dehydroxylation. In dickite and halloysite, the outer hydroxyl groups (marked by the ~3684 cm−1 peak) are lost first, followed by the inner groups (3620 cm−1), with a characteristic silanol band at 3730 cm−1 appearing during the process. This polymorph-dependent behavior highlights how crystal structure fundamentally controls dehydroxylation mechanisms in the 1:1 layer silicates [28,29].
Raman spectroscopy provides complementary insights into the thermal transformations of kaolinite through direct observation of hydroxyl group dynamics at elevated temperatures [28]. Temperature-resolved Raman spectroscopy of kaolinite hydroxyls between 25 °C and 500 °C reveals systematic changes in the vibrational characteristics of both inner and outer hydroxyl groups as the mineral undergoes progressive heating. The OH-stretching region exhibits progressive band broadening and intensity reduction with increasing temperature, reflecting the gradual disruption of hydrogen bonding networks and interlayer interactions [30]. The Raman technique proves particularly valuable for distinguishing between the two distinct hydroxyl populations in kaolinite (inner and outer sheet OH groups), providing real-time spectroscopic evidence of the homogeneous dehydroxylation mechanism. This detailed molecular-level understanding complements infrared emission spectroscopy data by elucidating the vibrational dynamics preceding complete hydroxyl group loss, thereby clarifying the sequence and kinetics of bond rupture during thermal treatment.
The in situ infrared emission spectroscopy (IES) experimental approach for studying kaolinite dehydroxylation involves heating samples from 100 to 800 °C at 5-degree intervals. This methodology eliminates quenching artifacts by allowing direct measurement of vibrational spectra at the elevated temperature [20,31]. The advantage lies in the ability to obtain real-time vibrational spectroscopic information as dehydroxylation occurs [32]. Dehydroxylation is determined by the loss of intensity of the hydroxyl bands in the 3550–3750 cm−1 emission spectra. The kaolinite layers lose their outer and inner hydroxyl groups simultaneously, indicating a homogeneous dehydroxylation process involving two distinct mechanisms [29,33].
Dickite exhibits distinctive thermal behavior when studied by infrared and micro-Raman spectroscopy using curve-fitting techniques [34,35]. The products of dickite heated in air at 1000 to 1300 °C show characteristic bands that identify crystalline phases including mullite, Al-spinel, corundum, and amorphous silica, with mullite formation becoming prominent above 1100 °C. The curve-fitting approach provides enhanced identification of high-temperature phases by resolving overlapping spectral features, demonstrating the advantage of this technique for analyzing thermal treatment products in ceramic applications [34].
Comprehensive spectroscopic investigations of thermal transformation products reveal complex phase evolution during dickite heating. The combination of infrared emission spectroscopy and micro-Raman spectroscopy with curve-fitting analysis reveals the sequential thermal pathways of kaolin polymorphs [34,35]. Infrared emission spectroscopy tracks the sequential loss of hydroxyl-related bands in the spectral region 3600–3700 cm−1, while curve-fitting enables quantitative analysis of overlapping bands to identify cristobalite, mullite, and amorphous silica that form during high-temperature transformations [36]. The infrared emission spectroscopy data reveal characteristic evolution of the dickite structure at temperatures above 1000 °C, with band intensity ratios providing precise identification of crystalline phases that coexist in the thermal products.
Understanding the thermokinetics of clay mineral decomposition is essential for optimizing thermal processing conditions in various industrial applications [37]. The thermokinetics of thermal conversion of kaolin to metakaolin can be elucidated using model-free methods such as the Kissinger–Akahira–Sunose (KAS) and Flynn–Wall–Ozawa (FWO) methods. Thermogravimetric analysis shows a total mass loss of approximately 12.5% in two steps related to dehydration and dehydroxylation, with average activation energy values of 88.44/88.58 kJ mol−1 for step 1 and 261.85/261.91 kJ mol−1 for step 2 [37]. Analysis of thermal behavior demonstrates that understanding dehydroxylation characteristics across different kaolin sources is critical for industrial optimization [23].
Table 2. Comparison of the thermal transformations of kaolin-group minerals observed by vibrational spectroscopy.
PropertyKaoliniteDickiteHalloysite (10 Å)Halloysite (7 Å)
Typical formulaAl2Si2O5(OH)4Al2Si2O5(OH)4Al2Si2O5(OH)4·2H2OAl2Si2O5(OH)4
Structure1:1 dioctahedral1:1 dioctahedral1:1 tubular1:1 tubular
Interlayer waterNoneNonePresentAbsent
Initial dehydrationNoneNone30–150 °C (loss of interlayer H2O)None
Dehydroxylation~450–650 °C~500–700 °C~450–650 °C~450–650 °C
FTIR diagnostic observationsLoss of OH stretching and Al–OH bending bands; Si–O bands broadenSimilar to kaolinite but shifted owing to higher structural orderInitial disappearance of H2O bands followed by kaolinite-like dehydroxylationSimilar to kaolinite
Raman diagnostic observationsProgressive loss of OH bands and lattice modes; amorphizationSimilar changes but generally sharper bandsLoss of H2O bands followed by disappearance of OH vibrationsSimilar to kaolinite
IES diagnostic observationsStrong decrease in structural OH emission bands during dehydroxylationSimilar behaviorH2O emission lost during dehydration followed by OH emission during dehydroxylationSimilar to kaolinite
Intermediate phaseMetakaoliniteMetadickiteMetahalloysiteMetahalloysite
High-temperature productsSpinel-type phase → mullite + cristobaliteSpinel-type phase → mulliteSpinel-type phase → mulliteSpinel-type phase → mullite
Distinguishing featureMost extensively studied reference clayGreater structural order than kaoliniteOnly kaolin mineral exhibiting a distinct dehydration stageSimilar to kaolinite after dehydration
Representative references[10,12,21,28,29][10,29,34][12,16][12,16]
Footnote: Approximate temperature ranges are reported because transition temperatures depend on heating rate, atmosphere, particle size, crystallinity and chemical composition.

3.1.2. Halloysite

Halloysite exhibits distinctive thermal properties related to its tubular morphology and 10 Å hydrated form. Infrared emission spectroscopy (IES) studies of 10 Å halloysite reveal progressive loss of OH-stretching modes between 3600 and 3700 cm−1, with slow intensity decrease up to approximately 500 °C, followed by rapid decrease between 500 and 550 °C [16]. The characteristic IES bands at 920 and 938 cm−1, attributed to inner and outer sheet Al-OH libration modes, disappear at the same temperature as the OH-stretching bands, providing direct spectroscopic evidence of coordinated dehydroxylation in the halloysite structure.
The infrared and infrared emission spectroscopic study of typical Chinese kaolinite and halloysite reveals that these two 1:1 layer silicates exhibit both similarities and important differences in their thermal transformations [33]. Halloysite demonstrates more complex spectroscopic behavior than kaolinite due to its tubular morphology and associated water content, producing additional absorption features in the infrared region related to water vibrations. Comparative analysis using both transmission and emission infrared spectroscopy shows that halloysite undergoes progressive loss of water-related bands at lower temperatures than structural hydroxyl groups, reflecting the distinct locations and binding strengths of these water types [33]. The infrared emission spectroscopy data on Chinese halloysite samples show characteristic evolution of spectral features with temperature, providing detailed insight into its progressive dehydration and dehydroxylation processes. Furthermore, the comparison between natural halloysite and thermally treated samples demonstrate that infrared spectroscopy can effectively track the formation of high-temperature phases, with the emergence of characteristic bands of mullite and cristobalite at temperatures above 900 °C.
The structure of tubular halloysite (10 Å) undergoes progressive transformation during thermal treatment, with detailed infrared spectroscopy and X-ray diffraction data revealing the sequential structural changes occurring during heating [38]. The thermal characteristics of halloysite selected from geographically distinct regions exhibit marked variations attributed to differences in mineral purity, crystallinity, and water content [39].
Comprehensive thermal behavior analysis of halloysite from the Inner Mongolia Autonomous Region in China demonstrates that the thermal decomposition process occurs in multiple distinct stages [39]. The initial dehydration of interlayer water occurs below 200 °C, with subsequent dehydroxylation proceeding through 200–550 °C, and final high-temperature phase transformations continuing above 550 °C. These regional variations in halloysite thermal profiles underscore the importance of characterizing mineral sources before thermal processing, as local geological conditions and mineral genesis pathways influence the final thermal response of halloysite deposits.
Recent advanced characterization studies employing combined experimental–computational approaches have revealed that thermal treatment of halloysite nanotubes induces profound structural modifications beyond simple hydroxyl group loss [40]. The impact of thermal treatment on halloysite nanotubes, elucidated through integrated experimental analysis and molecular dynamics simulations, demonstrates that heating above 500 °C produces significant changes in nanostructure geometry, with progressive collapse of the tubular structure occurring between 500 and 700 °C. These computational–experimental studies reveal that the interlayer spacing progressively decreases with increasing temperature, and the characteristic tubular morphology gradually transforms into more compact structures.
Characterization studies of heat-treated halloysite nanotubes using combined thermal analysis, X-ray diffraction, and electron microscopy techniques have established that the thermal transformations exhibit distinct temperature-dependent phases [41]. At temperatures below 400 °C, the mineral retains its characteristic nanotube structure with only physisorbed water removal. Between 400 and 550 °C, structural water removal proceeds, accompanied by progressive nanostructure degradation. Above 550 °C, complete structural reorganization occurs, producing high-temperature phases including metahalloysite and eventually amorphous silica–alumina products. The degree of crystallinity and purity of the starting halloysite material significantly influences the temperature at which each transformation stage occurs.

3.1.3. Serpentine Minerals: Lizardite and Chrysotile

Serpentine minerals represent an important group of 1:1 silicates with distinctive thermal transformation behaviors and complex infrared and Raman spectroscopic signatures that reveal their structural reorganization during heating [42]. Serpentine minerals are important constituents of many ultramafic rocks and have attracted increasing interest for high-temperature ceramic materials and mineral carbonation processes. Their thermal decomposition has therefore been studied extensively [43]. Lizardite and chrysotile, two major serpentine polymorphs, undergo progressive dehydroxylation in the 400–700 °C temperature range with formation of intermediate spinel-type phases, with these transformations being directly traceable through characteristic changes in vibrational spectra. High-pressure Raman spectroscopic studies of serpentine minerals reveal fundamental structural sensitivities that establish the foundation for understanding their thermal behavior at elevated temperatures. Raman spectroscopy demonstrates the sensitivity of serpentine structures to external conditions and provides real-time spectroscopic evidence of the sequential structural changes occurring during progressive heating.
The thermal decomposition of chrysotile has been extensively characterized using combined micro-Raman and micro-FTIR spectroscopy, providing detailed molecular-level insights into its sequential thermal transformation and band position changes [44]. In situ micro-Raman spectra of chrysotile reveal that the characteristic absorption bands generated by the mineral are progressively diminished and ultimately disappear at high temperatures, with these spectral changes directly correlating to the formation of newly formed olivine (Mg2SiO4) and enstatite phases identified in the core of former chrysotile fibers. During the initial stages of chrysotile heating, the most prominent IR absorption bands associated with chrysotile structure are observed in the OH-stretching region around 3700 cm−1 and in the Si-O stretching regions around 1000–1100 cm−1. As temperature increases, progressive intensity decreases are observed in the 3650–3700 cm−1 region corresponding to Mg-OH stretching vibrations, reflecting the gradual loss of structural hydroxyl groups. Simultaneously, the Si-O stretching bands shift and broaden due to distortion of the silicate tetrahedral framework as water is progressively released from the structure. The micro-FTIR results corroborate the Raman observations, confirming the systematic loss of chrysotile absorption features and revealing complementary information about changes in the Si-O-Si asymmetric stretching vibrations characteristic of the dehydroxylated products.
The Mössbauer absorption spectra of raw chrysotile reveal that iron is contained in paramagnetic phases (40%) as well as in accessory magnetite (60%), reflecting the complex iron chemistry inherent to natural chrysotile samples [45]. Upon thermal treatment, the spectrum of thermally treated chrysotile shows dramatic intensity changes and band position shifts, revealing that the magnetic phases are now oxidized magnetite/maghemite and hematite. The thermal decomposition of chrysotile at 1200 °C produces olivine and enstatite phases, representing the complete structural reorganization of the 1:1 silicate structure [46]. The Raman spectroscopic signature of these high-temperature products is fundamentally different from the parent chrysotile, displaying characteristic vibrational modes unique to olivine and enstatite structures. Specifically, olivine displays its characteristic Raman bands in the 800–900 cm−1 region (M-O stretching modes) and around 300–400 cm−1 (lattice modes), while enstatite exhibits distinctive Si-O stretching features around 1000 cm−1 and characteristic lattice modes reflecting its orthorhombic pyroxene structure. The appearance and intensity growth of these new Raman bands directly track the degree of structural reorganization and the relative abundance of newly formed phases.
Lizardite shows characteristic OH-stretching modes in the 3650–3700 cm−1 region in its initial state, reflecting the presence of Mg-OH groups in its octahedral layer [47]. In situ high-temperature Raman and FTIR spectroscopy of the phase transformation of lizardite reveals systematic and sequential changes in both band positions and intensities as temperature increases. Progressive heating through the 400–700 °C temperature range leads to progressive intensity reduction in the Mg-OH stretching bands at 3650–3700 cm−1, with the band profile becoming increasingly broadened due to increasing disorder and disruption of hydrogen-bonding networks. The intensity of these OH-stretching features gradually diminishes as water is liberated from the structure, and eventually these bands are nearly absent at temperatures approaching 700 °C. Complementary to the OH-stretching region behavior, the Si-O stretching bands around 1000–1100 cm−1 undergo progressive band position shifts to lower wavenumbers, reflecting changes in Si-O bond strengths and average Si-O bond lengths as the structure distorts during dehydroxylation. The appearance of new Raman bands in the 600–800 cm−1 region during heating reflects the formation of intermediate spinel-type phases, with these new features appearing at characteristic temperatures that vary depending on heating rate and local chemical composition. Progressive heating to above 700 °C leads to the formation of forsterite (Mg2SiO4) through intermediate spinel phases, a transition clearly manifested in dramatic changes in the Raman spectroscopic signature [48]. The characteristic Raman bands of forsterite appear distinctly in the 820–880 cm−1 region (Mg-O stretching modes in the olivine structure) and persist to higher temperatures, while the intermediate spinel-phase bands progressively diminish in intensity. In situ FTIR spectroscopy confirms this phase evolution through the appearance of absorption features diagnostic of olivine structure and the disappearance of features associated with the layered serpentine geometry. The spectroscopic evolution demonstrates that the phase transformation occurs progressively rather than instantaneously, with coexistence of multiple phases over defined temperature intervals observable through the simultaneous presence of multiple diagnostic Raman and FTIR bands.
The thermal behavior of both lizardite and chrysotile is influenced by trace elements such as Fe2+ and Ni2+, which modify thermal stability and decomposition pathways through substitution in the octahedral layers and consequent changes in crystal chemistry and bond strengths [49]. Pressure–temperature estimates of the lizardite/antigorite transition in high-pressure serpentinites reveal that these phase transformations are sensitive to both temperature and pressure conditions, with increased pressure generally stabilizing the denser antigorite phase relative to the more open lizardite structure. The fibrous morphology of chrysotile contributes to enhanced thermal stability compared to the massive lizardite form, reflecting the importance of crystal structure and morphology in controlling thermal transformations of serpentine minerals. This morphological effect is manifested spectrally through the observation that chrysotile samples often show different dehydroxylation temperature profiles compared to lizardite, with chrysotile displaying somewhat higher thermal stability, reflected in band position shifts occurring at higher temperatures. In situ studies on dehydration and phase transformation of antigorite provide a detailed mechanistic understanding of serpentine thermal behavior, clarifying the sequence of structural changes occurring during progressive heating and establishing the temperatures at which distinct phase transitions occur through systematic monitoring of spectroscopic signatures. The Raman and FTIR spectroscopic monitoring of these phase transitions provides real-time evidence of the sequential hydroxyl group loss, layer rearrangement, and eventual recrystallization into olivine and pyroxene phases, demonstrating how modern spectroscopic techniques enable unprecedented insight into the molecular-level mechanisms driving serpentine mineral thermal transformations.

3.2. Two-to-One (2:1) Layer Silicates

The 2:1 layer silicates represent a major group of clay minerals characterized by central octahedral sheets sandwiched between two tetrahedral sheets. These minerals exhibit variable thermal stability controlled by interlayer cations and octahedral composition [21]. Smectites are widely used as binders in foundry sands and iron ore palletization, drilling muds, adsorbents, catalysts and barrier materials [1,3]. Understanding their dehydration and dehydroxylation behavior is important because these transformations strongly influence dimensional stability, reactivity and thermal performance.

3.2.1. Montmorillonite

Montmorillonite exhibits distinctive thermal behavior controlled by interlayer water removal and subsequent structural reorganization, observable through infrared spectroscopy. In Cu-exchanged montmorillonites, infrared emission spectroscopy (IES) experiments reveal two principal dehydration stages [50]. The first stage involves the loss of surface-adsorbed moisture below 150 °C, characterized by the progressive decrease in intensity of OH-stretching bands and water-related absorption features in the 3200–3600 cm−1 region. The second stage occurs between 150 and 300 °C, where water from the cation hydration shell is progressively removed, producing marked intensity reductions in water bending modes around 1630 cm−1. A third dehydration stage, sometimes observed between 300 and 600 °C, is attributed to additional hydration shells surrounding more polarizable cations, with continued but diminished band intensity loss before complete water removal occurs [51]. The infrared spectroscopic monitoring of these stages reveals systematic shifts in band positions and progressive broadening of the water-related features, reflecting disruption of hydrogen bonding networks within the interlayer space.
The dehydroxylation of montmorillonite proceeds through sequential loss of structural hydroxyl groups, observable through characteristic changes in infrared and IES band positions and intensities. FTIR spectroscopy of Ca-montmorillonite reveals dehydroxylation occurring in the temperature range of 400–600 °C [52], with the OH-stretching region (3400–3700 cm−1) exhibiting progressive intensity reductions as temperature increases. The characteristic band at approximately 3620 cm−1 and the band near 3700 cm−1 both decrease systematically with increasing temperature, with their relative intensities providing diagnostic evidence of the dehydroxylation mechanism [53]. Isothermal FTIR studies of montmorillonite dehydroxylation demonstrate that structural hydroxyl loss is accompanied by shifts in the Si–O stretching region (950–1100 cm−1) and progressive changes in the Al–OH deformation modes around 900–920 cm−1 [54]. The appearance of new absorption features in the 3300–3400 cm−1 region, attributed to intermediate silanol (Si–OH) groups, indicates the transfer of hydroxyl groups from the octahedral layer to the tetrahedral layer edges during dehydroxylation [55]. These intermediate species persist until temperatures exceed 600 °C, at which point final hydroxyl loss and structural reorganization occur [56].
Mid-infrared and infrared emission spectroscopy of Cu-exchanged montmorillonite specifically reveal shifts in non-lattice bands during both the dehydration and dehydroxylation stages [50]. The differential behavior between various cation-exchanged forms demonstrates that cation type fundamentally controls the temperature-dependent band position shifts and intensity changes during thermal treatment. The spectroscopic evolution shows that band-position shifts in the Si–O stretching region correlate directly with octahedral layer distortion and eventual collapse, providing quantitative measures of structural disruption during heating [57].
Above 700 °C, montmorillonite undergoes major structural reorganization with recrystallization into new phases, accompanied by dramatic changes in the infrared absorption spectrum. The development of cristobalite and mullite phases above 800 °C is characterized by the appearance of new absorption bands diagnostic of these crystalline products, while the montmorillonite-related features disappear [58]. Spectroscopic study of the dehydration and dehydroxylation of phyllosilicate minerals demonstrates that high-temperature phase formation produces characteristic band patterns distinct from the parent montmorillonite structure [36]. Reactive force field molecular dynamics simulations provide mechanistic insight into these dehydroxylation reactions, revealing that hydroxyl loss creates vacant coordination sites that promote layer reorganization and eventual structural collapse, with these processes directly reflected in the infrared spectroscopic signatures [59].
Iron-containing bentonites exhibit distinctive thermal behavior with complex spectroscopic evolution. For bentonite containing significant amounts of Fe-bearing minerals (montmorillonite 47%, magnesioferrite 30%, orthoclase 11%, and goethite 8%), thermal stability testing at temperatures between 100 °C and 800 °C combined with Mössbauer spectroscopy reveals various phases of decomposition reflecting changes in iron oxidation state and coordination [57]. At 400 °C, dehydroxylation of montmorillonite initiates and continues to 700 °C, with infrared spectroscopy tracking the intensity loss of OH-stretching and OH-bending modes during this temperature interval. Above 700 °C, recrystallization of montmorillonite with the disappearance of montmorillonite-related FTIR features. The concurrent conversion of goethite to hematite in the 400–500 °C range produces additional band-position changes in the iron oxide absorption regions [53]. The thermal behavior and spectroscopic evolution of thermally modified bentonite clay demonstrate the complexity of multi-phase systems, where the interaction between different mineral components controls the overall thermal response and recrystallization pathways [60].

3.2.2. Beidellite

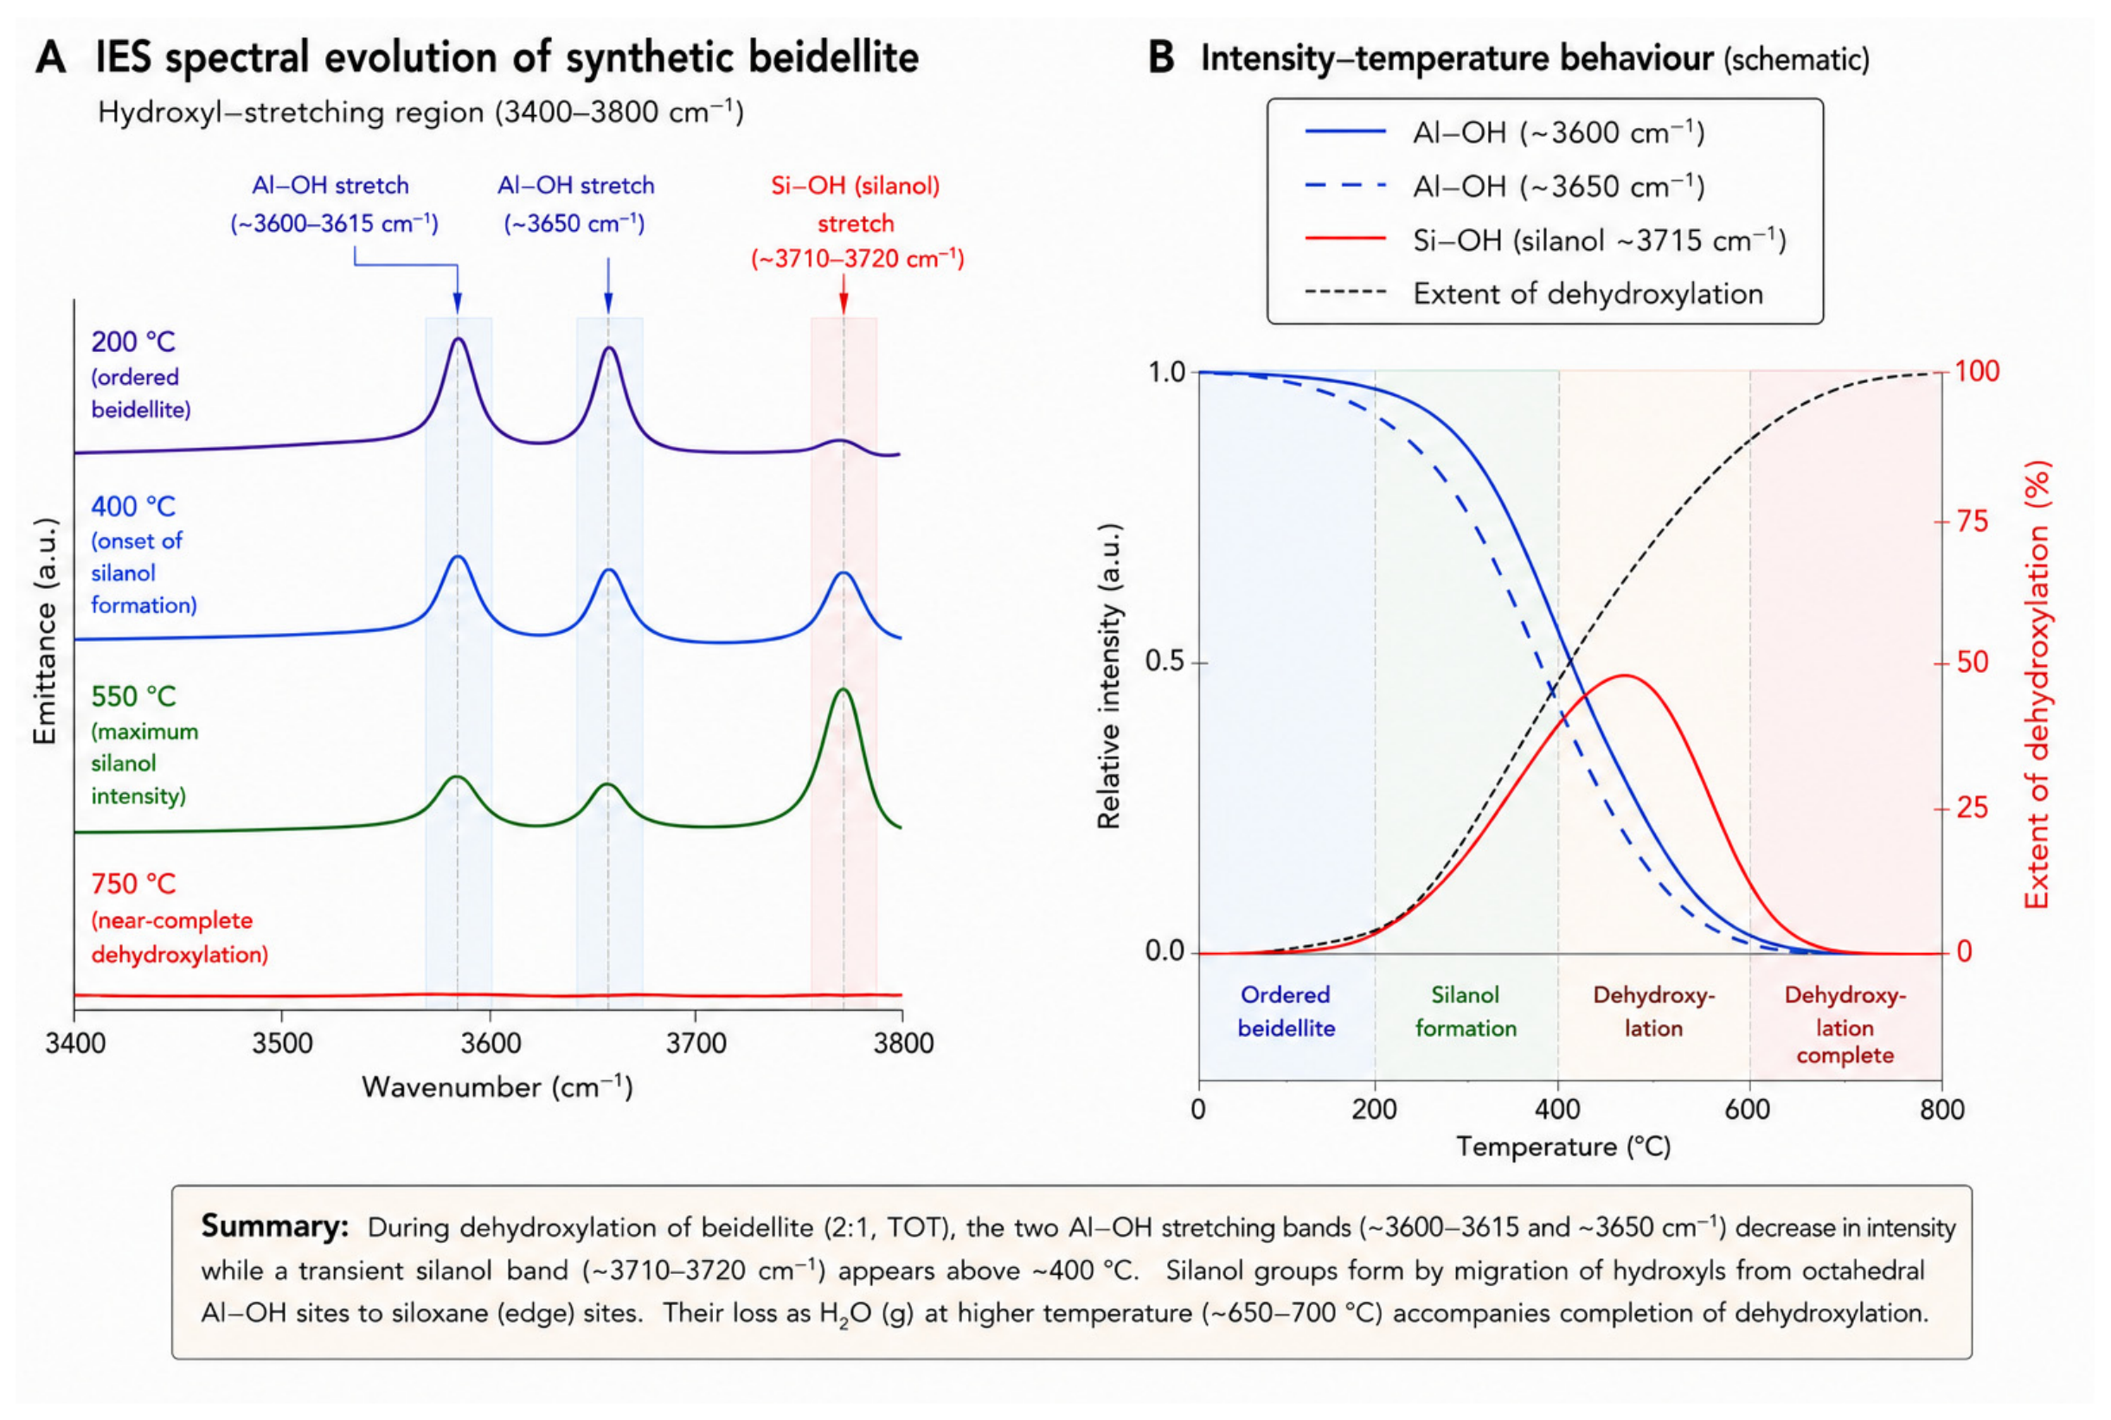
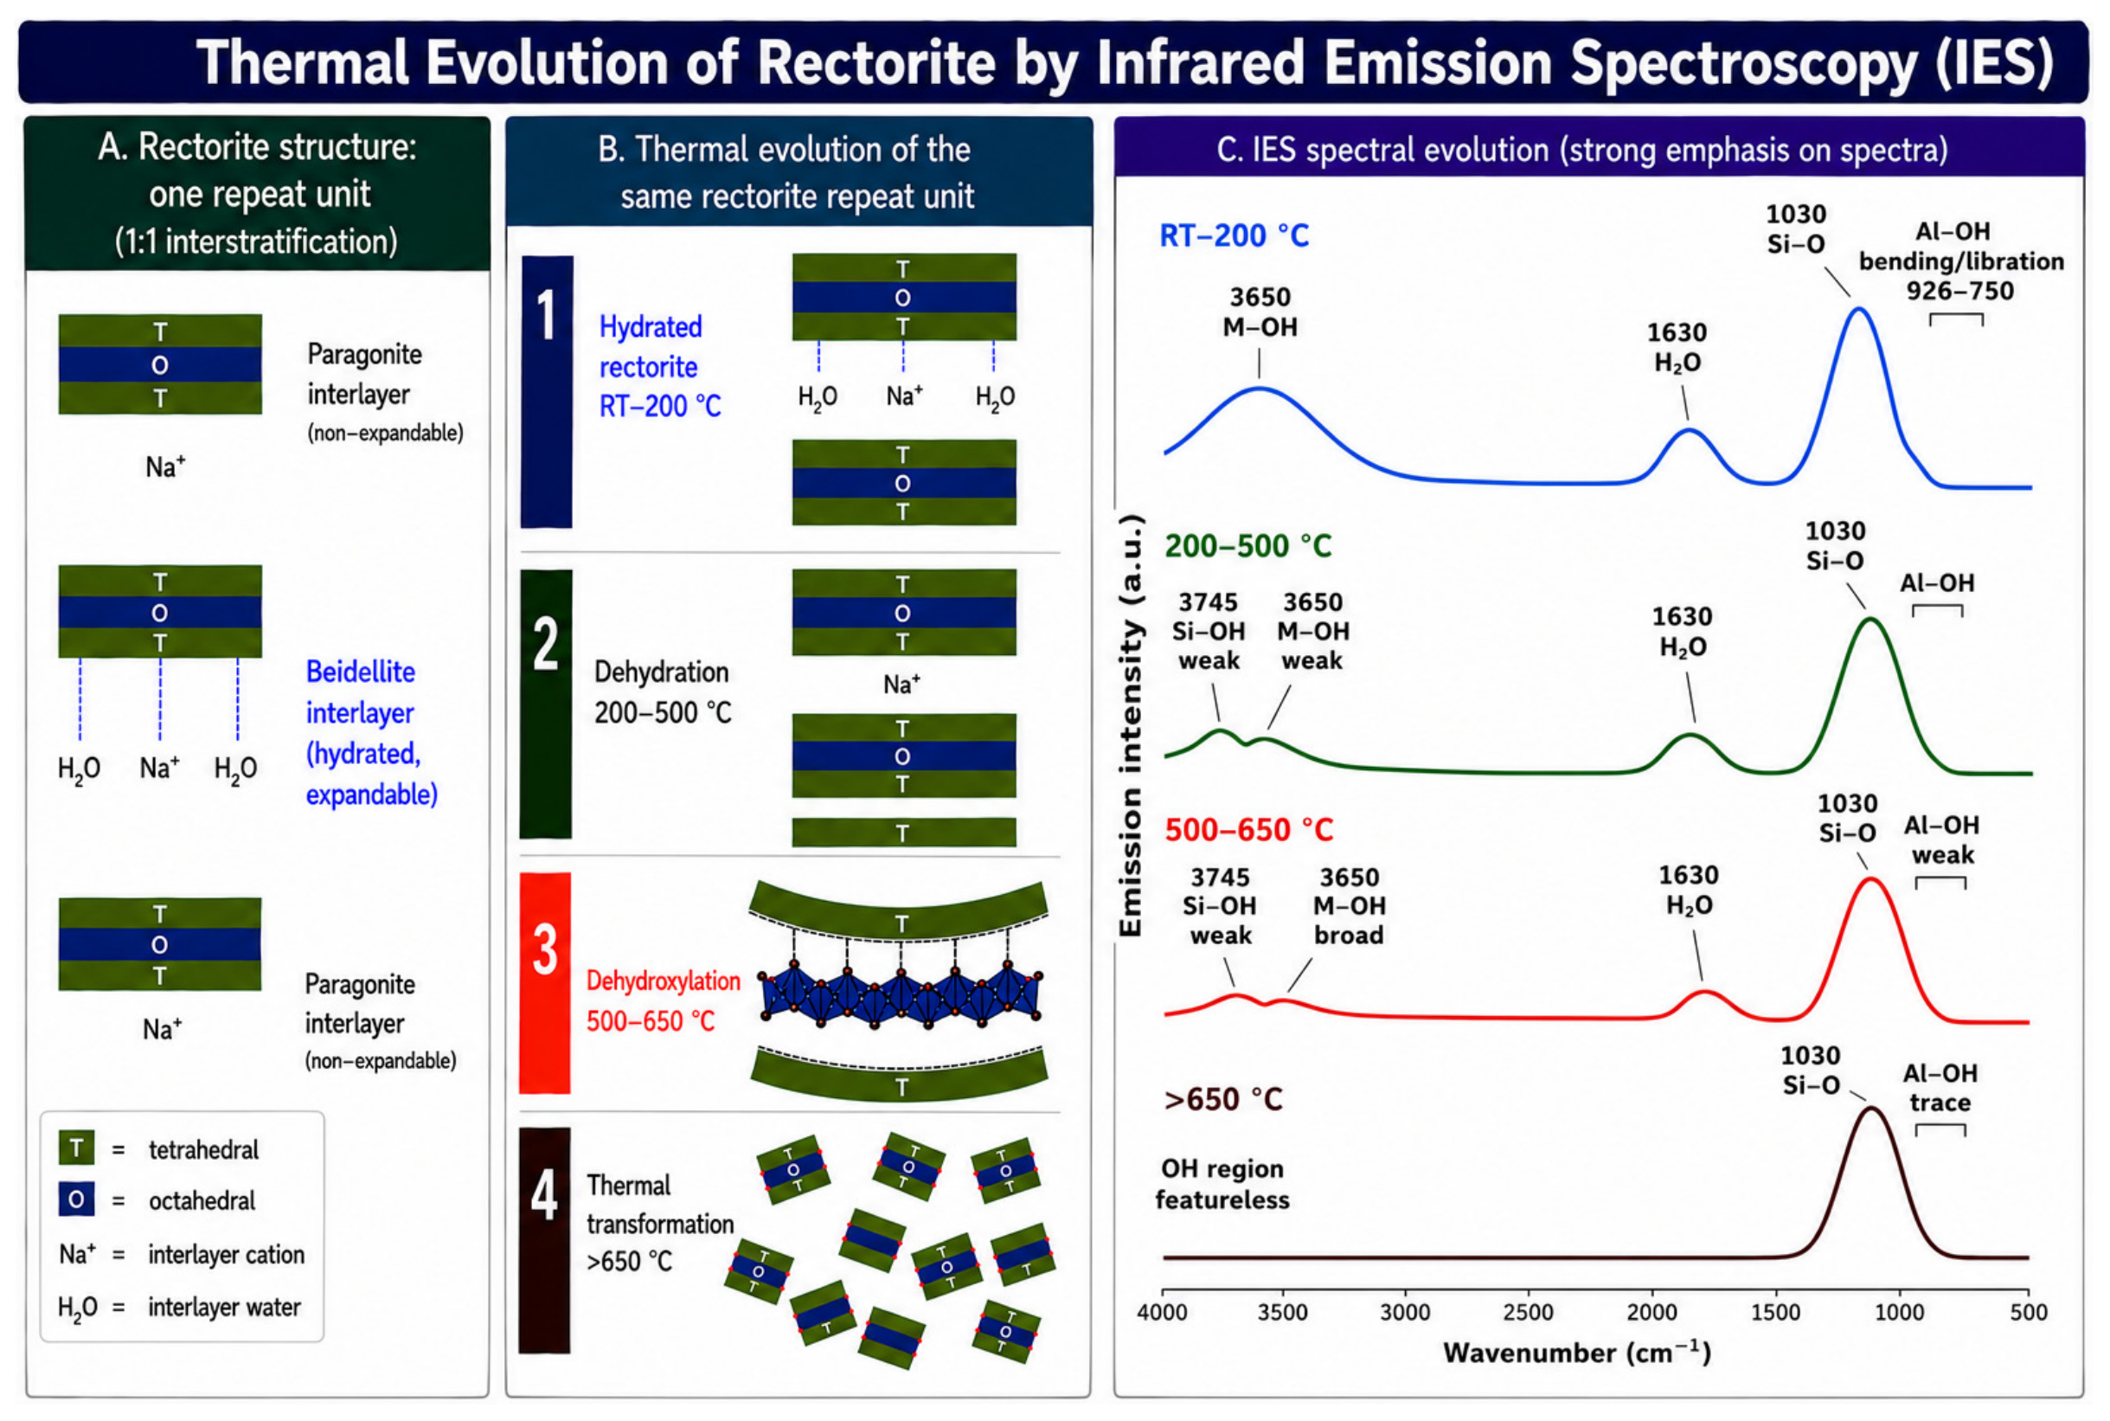
Studies on synthetic and natural beidellites using IES demonstrate that dehydroxylation leads to a decrease in intensity of OH-stretching modes around 3600–3615 cm−1 and 3650 cm−1 [61]. These bands diminish upon heating, with natural beidellite dehydroxylating up to 600 °C and synthetic varieties up to 700–750 °C (Figure 4). This difference is linked to crystallinity, with more crystalline samples exhibiting higher thermal stability. A critical observation is the appearance of a new band around 3715 cm−1 (or 3720 cm−1) above 400 °C, attributed to silanol (Si-OH) groups on the edges of the tetrahedral layers. These silanol groups are thought to be an intermediate stage in dehydroxylation, where hydroxyls are transferred from the octahedral layer to the Si(edge) of the tetrahedral layer before being released as water vapor. Restructuring of the octahedral layer and formation of new Al-O bonds are evidenced by a new band appearing at 722 cm−1 after dehydroxylation.
Comprehensive spectroscopic investigations of phyllosilicate minerals reveal systematic changes in vibrational bands during thermal transformations [36]. When compared to the broader phyllosilicate thermal behavior documented in these studies, beidellite exhibits characteristic patterns consistent with the general dehydroxylation mechanisms observed across the phyllosilicate group. However, the IES results on beidellite demonstrate important distinctions that highlight the mineral’s specific structural features. While Che, Glotch, Bish, Michalski and Xu [36] documented widespread phyllosilicate dehydration and dehydroxylation processes, the Kloprogge, Komarneni, Yanagisawa, Fry and Frost [61] IES data on beidellite reveal more precise temperature-dependent band position and intensity changes in the OH-stretching region. The silanol intermediate formation at 3715–3720 cm−1 observed in beidellite is a particularly well-defined spectroscopic signature that differentiates it from some other phyllosilicates, indicating a distinct hydroxyl transfer mechanism from octahedral to tetrahedral layer edges (Figure 4). This sequential band evolution in beidellite—characterized by progressive intensity loss in the 3600–3700 cm−1 region coupled with the emergence of silanol features—provides direct real-time evidence of structural reorganization that complements the broader understanding of phyllosilicate thermal decomposition pathways established by comparative spectroscopic studies. The temperature-dependent behavior observed in beidellite dehydroxylation reflects the complex interplay between crystallinity and molecular structure. Natural beidellite samples, which typically exhibit lower crystallinity due to various defects and compositional variations, dehydroxylate over a broader temperature range extending to 600 °C. In contrast, synthetic beidellites with higher crystallinity display sharper dehydroxylation transitions that extend to 700–750 °C, indicating enhanced thermal stability associated with more ordered crystal structures. The appearance of the 722 cm−1 band after dehydroxylation marks the formation of new Al-O bonds and signifies the restructuring of the octahedral layer, representing a critical transition point in the thermal transformation sequence. The spectroscopic monitoring of beidellite thermal evolution demonstrates how modern infrared emission spectroscopy techniques enable real-time observation of structural changes at elevated temperatures. The combined evidence from OH-stretching band intensity reduction, silanol intermediate formation, and new Al-O bond signatures provides a comprehensive picture of the dehydroxylation process occurring without the artifacts associated with quenching-based methods. This detailed molecular-level characterization of beidellite thermal behavior establishes the foundation for understanding broader phyllosilicate transformation mechanisms and their industrial applications in calcined clay systems.
The activation energy data and kinetic mechanisms described by Derkowski and Kuligiewicz [51] provide critical mechanistic context for interpreting the spectroscopic signatures observed in the IES studies of Kloprogge and colleagues [61]. Derkowski & Kuligiewicz [51] demonstrate that beidellite dehydroxylation is controlled by the octahedral cation–OH bond strength and the type of octahedral vacancy (trans-vacant versus cis-vacant), with an activation energy of 170 kJ/mol for Cs+-exchanged beidellite representing the energy barrier for the sequential loss of structural OH groups. These kinetic parameters directly translate to the temperature-dependent band evolution observed in the Kloprogge, Komarneni, Yanagisawa, Fry and Frost [61] IES spectra: the progressive narrowing and eventual disappearance of the 3600–3615 cm−1 and 3650 cm−1 OH-stretching modes between 600 and 750 °C reflects the thermally activated breaking of these Mg-OH bonds on a molecular timescale. The appearance and persistence of the silanol band at 3715–3720 cm−1, which Kloprogge et al. [61] interpret as an intermediate stage in dehydroxylation, corresponds directly to the intermediate structural phases described in the kinetic framework of Derkowski & Kuligiewicz [51], where hydroxyl transfer from octahedral to tetrahedral layer edges represents a key mechanistic step in the overall dehydroxylation pathway. Furthermore, the observation that synthetic beidellites with higher crystallinity exhibit sharper dehydroxylation transitions extending to 750 °C, as opposed to the broader transitions in natural samples extending only to 600 °C, reflects the relationship between structural order and activation energy highlighted by Derkowski & Kuligiewicz [51]: more ordered crystal structures possess fewer defect sites and thus require higher temperatures and longer activation times to initiate the concerted OH loss process. When viewed within the broader phyllosilicate context established by Che, Glotch, Bish, Michalski and Xu [36], the beidellite dehydroxylation mechanism reveals how the fundamental principles of octahedral cation–OH bond strength and structural vacancy type—which Derkowski & Kuligiewicz [51] identify as universal controls on phyllosilicate thermal stability—manifest themselves through specific, quantifiable spectroscopic signatures that can be monitored in real time by IES. Thus, the synergy between kinetic modeling [51], molecular-level spectroscopic observation [61], and comparative phyllosilicate analysis [36] creates a comprehensive understanding of beidellite thermal behavior that links thermodynamic driving forces, activation energy barriers, and real-time structural reorganization into a unified mechanistic framework.

3.2.3. Hectorite

Hectorites, as magnesian trioctahedral smectites with a layer charge mainly through Li+ for Mg2+ in the octahedral sheet, undergo distinctive thermal transformations observable through in situ infrared emission spectroscopy that reveal systematic changes in vibrational bands characteristic of this mineral phase. Comprehensive spectroscopic investigations of phyllosilicate minerals document systematic changes in vibrational bands during thermal transformations [36], and hectorite exhibits pronounced spectroscopic signatures that reflect its specific octahedral composition and layered structure. The dehydration and dehydroxylation behavior of hectorites demonstrates the sensitivity of trioctahedral minerals to temperature-dependent structural modifications, with infrared emission spectroscopy providing real-time evidence of these transformations as they occur.
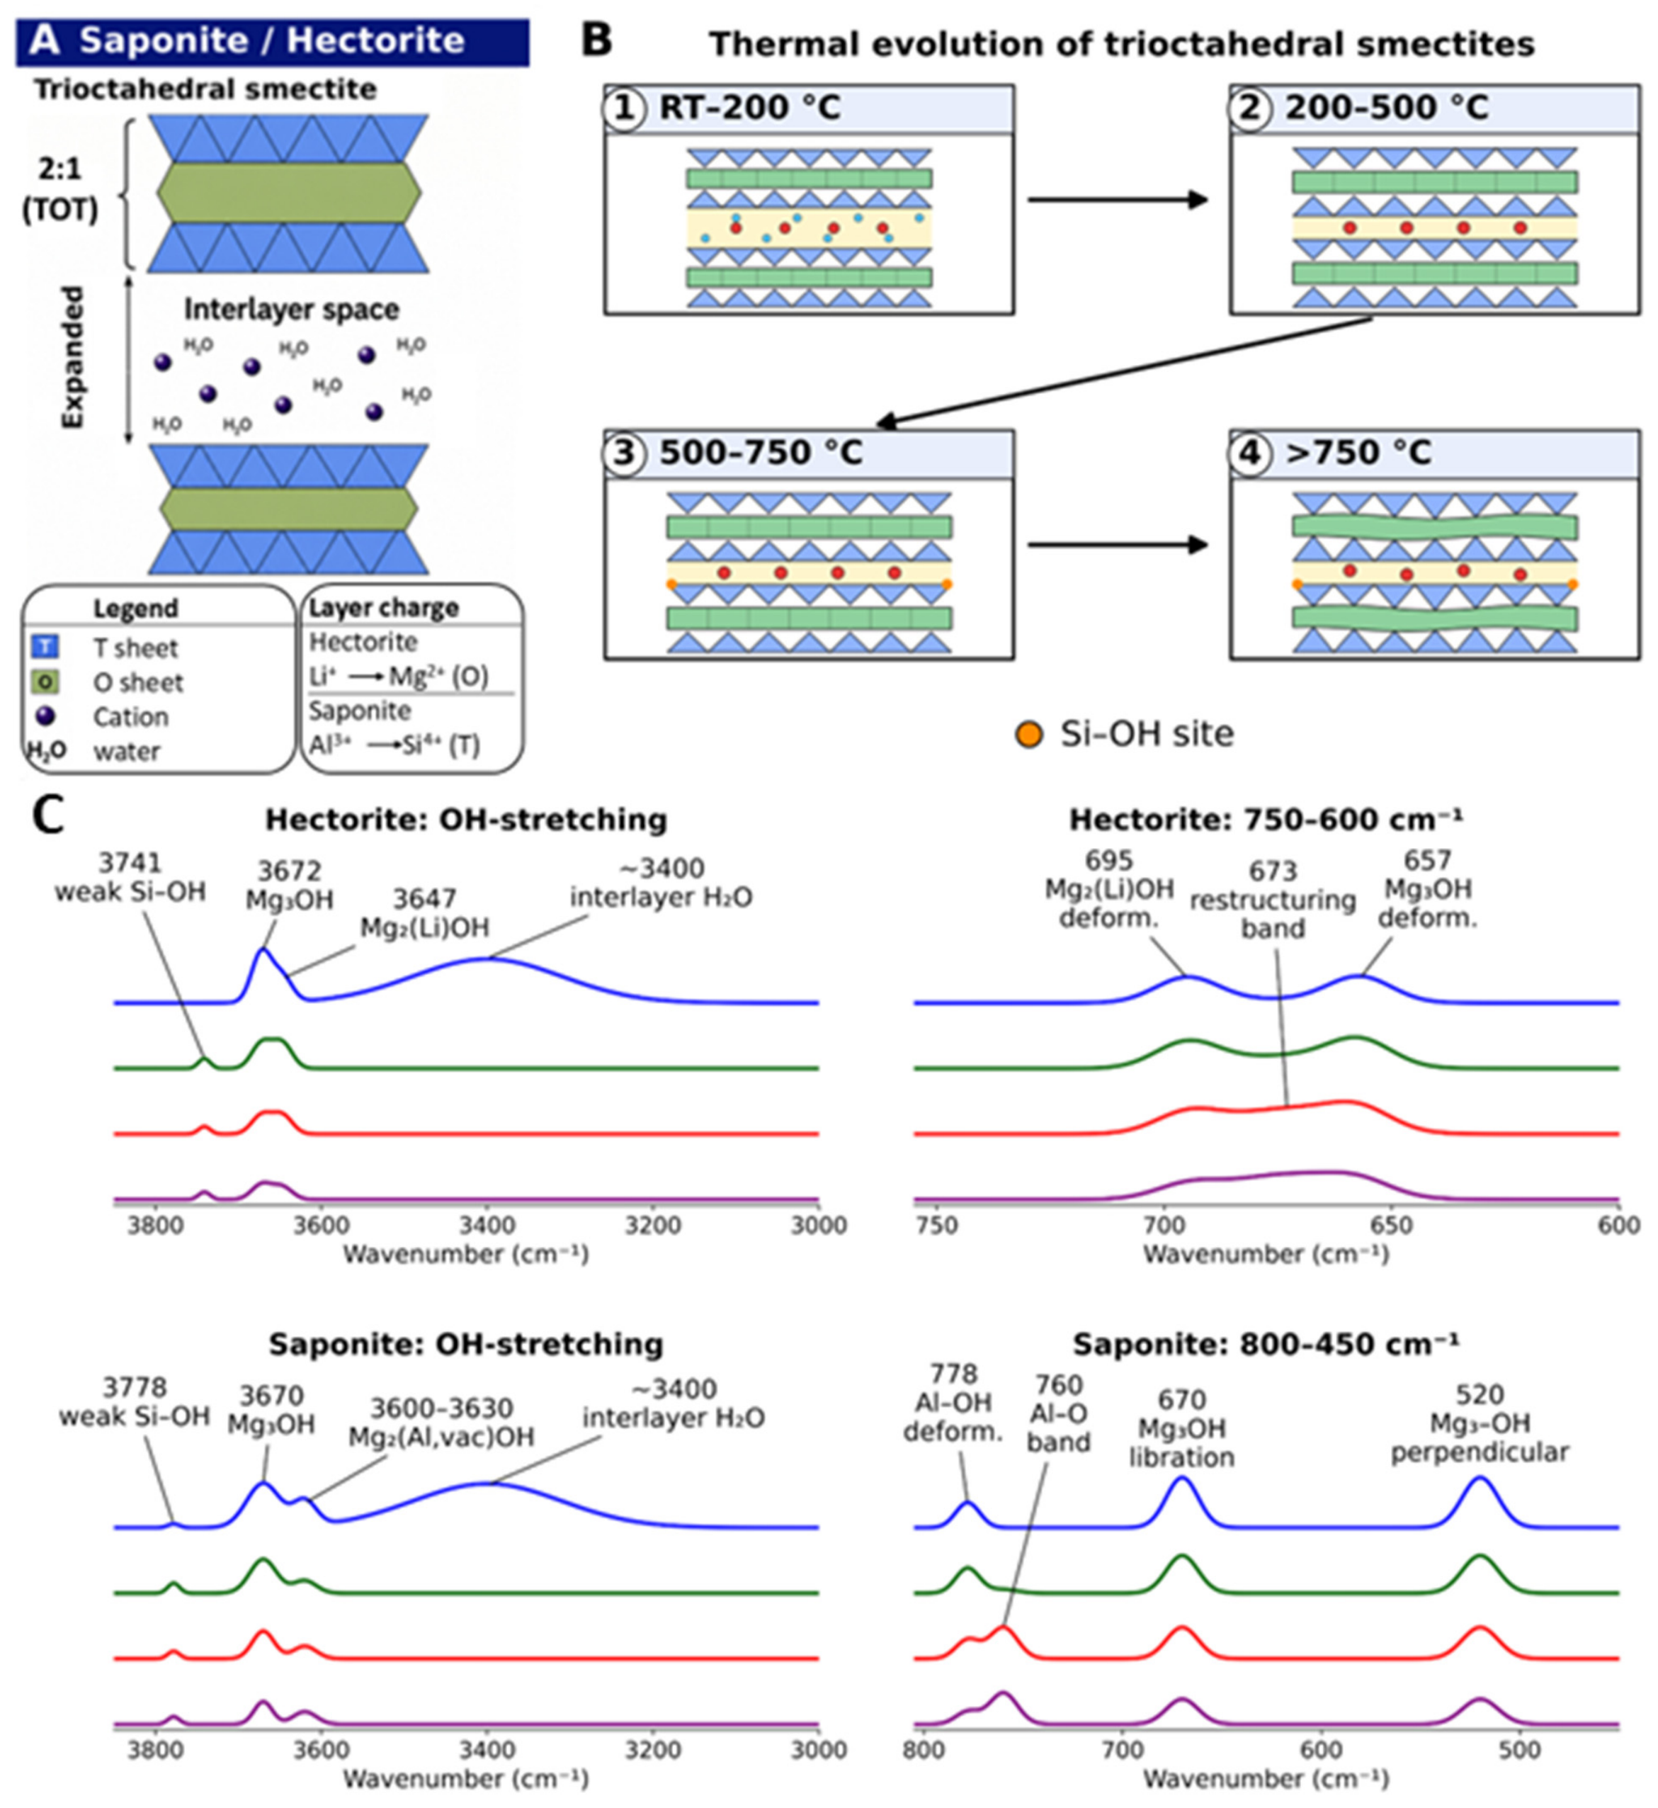
Infrared emission spectroscopic studies of hectorite reveal a complex dehydration behavior characterized by the progressive loss of interlayer and structural water at distinct temperature intervals (Figure 5). The OH-stretching region of hectorite is characterized by two characteristic hydroxyl stretching modes at approximately 3647 cm−1 and 3672 cm−1 [18], assigned to different octahedral hydroxyl environments reflecting the Mg3-OH and Mg2(Al,vac)-OH coordination within the trioctahedral layer structure. Upon heating, these bands decrease progressively in intensity up to 750 °C but do not completely disappear, a behavior that distinguishes hectorite from many dioctahedral smectites that show more complete band elimination [18]. This persistence of hydroxyl bands to higher temperatures reflects the enhanced thermal stability of the trioctahedral arrangement and the strength of Mg-OH bonds in the octahedral layer. The differential behavior of the two OH-stretching bands during heating indicates that they represent fundamentally different hydroxyl coordination environments with distinct thermal stabilities, with the higher-frequency band at 3672 cm−1 showing somewhat more rapid intensity loss than the lower-frequency component.
A critical spectroscopic feature observed in the thermal transformation of hectorite is the appearance of a new silanol band around 3741 cm−1 above 250 °C (Figure 5), which emerges as interlayer water is progressively removed and structural reorganization begins [18]. This silanol intermediate band formation indicates the transfer of hydroxyls from the octahedral layer to the siloxane layer edges before their ultimate loss as water vapor, a mechanism that has been documented across multiple phyllosilicate systems. The emergence of this band at relatively low temperature (compared to the main dehydroxylation window) suggests that a portion of the octahedral hydroxyl groups become accessible for migration to tetrahedral layer edges well before the major bulk dehydroxylation event. The intensity of this silanol band increases gradually with temperature, reaching a maximum somewhere in the 400–600 °C range before ultimately diminishing as these intermediate hydroxyl groups are finally released from the mineral structure. The presence of this well-defined silanol signature indicates an organized mechanism of hydroxyl transfer rather than random bond rupture, demonstrating how modern infrared emission spectroscopy can reveal intermediate structural reorganization steps that occur during the sequential dehydroxylation process.
The dehydroxylation process in hectorites involves not only progressive loss of OH-stretching mode intensity but also systematic changes in the hydroxyl deformation (bending) modes around 657 and 695 cm−1, which show progressive intensity decrease during heating as the octahedral hydroxyl groups are eliminated from the structure [18]. These OH-bending modes are particularly sensitive indicators of octahedral layer integrity and bond angles, and their systematic disappearance during the 600–750 °C temperature interval directly correlates with the breaking of Mg-OH bonds and reorganization of the octahedral coordination environment. The Si-O stretching region around 1000–1100 cm−1 undergoes parallel changes, with band broadening and position shifts reflecting the distortion of the silicate tetrahedral framework as the neighboring octahedral layer structure collapses. These coupled changes in both OH-stretching and Si-O stretching regions demonstrate that dehydroxylation in hectorite involves coordinated modifications throughout the entire layer structure rather than isolated hydroxyl loss, with spectroscopic evidence showing that the mineral undergoes progressive ordering and structural collapse as temperature increases.
The disruption of the hectorite structure above 600–650 °C becomes increasingly pronounced and can lead to the formation of pyroxene-like (MgSiO3) units and progressively amorphous silica, changes that are reflected in dramatic broadening of bands in the low-frequency region and the emergence of new absorption features characteristic of these high-temperature phases [18]. The systematic investigation of thermal reactions of synthetic hectorite provides a mechanistic understanding of these transformations, revealing that the conversion from the layered hectorite structure to pyroxene-like phases occurs through a series of intermediate stages governed by the kinetics of oxygen rearrangement and cation migration [62]. Investigation using advanced nuclear magnetic resonance techniques, including 29Si magic angle spinning NMR spectroscopy, has demonstrated the progressive transformation of tetrahedral silicon environments from the layered silicate structure toward more isolated SiO4 tetrahedra and chain-like silicate units characteristic of pyroxene-type structures [63]. The infrared spectra of the high-temperature products show new absorption features in the 800–1000 cm−1 region characteristic of pyroxene Si-O stretching modes and new bands in the 500–600 cm−1 region reflecting novel Si-O-Mg linkages formed during recrystallization. The persistence of broad, poorly defined features in the spectra above 700 °C indicates substantial structural disorder and the likely formation of amorphous or very poorly crystalline phases alongside crystalline pyroxene, demonstrating that the thermal decomposition of hectorite is not a simple single-step transformation but rather involves complex, partially concurrent mechanisms of dehydroxylation, phase dissolution, and recrystallization.
The detailed methodological advantages of infrared emission spectroscopy for studying hectorite thermal behavior become evident when considering that conventional thermal analysis techniques such as thermogravimetry and differential thermal analysis provide only bulk mass loss and heat flow information without revealing the real-time molecular-level structural changes that occur during each thermal interval [51]. In situ infrared emission spectroscopy eliminates the artifacts associated with quenching-based methods by allowing direct measurement of vibrational spectra at elevated temperatures, enabling researchers to establish precise correlations between specific structural changes and their characteristic temperature ranges. The kinetic processes governing hectorite dehydration and dehydroxylation are controlled by factors including the interlayer cation hydration state, the strength of Mg-OH bonds in the octahedral layer, and the extent of structural ordering in the parent mineral [51]. The integration of spectroscopic observations with thermodynamic and kinetic modeling provides a comprehensive understanding of why hectorite exhibits enhanced thermal stability compared to many dioctahedral smectites, with the trioctahedral arrangement and strong Mg-centered hydroxyl coordination being fundamental controls on the mineral’s resistance to thermal decomposition.

3.2.4. Saponite

Comprehensive spectroscopic investigations of phyllosilicate minerals reveal systematic changes in vibrational bands during thermal transformations [36]. Saponites, as trioctahedral smectites with Mg-rich octahedral layers and layer charge mainly through Al3+ for Si4+ substitution in the tetrahedral sheet, exhibit distinctive thermal behavior that reflects their unique crystal chemistry and structural organization. Infrared emission spectroscopy has emerged as a powerful technique for monitoring these transformations in real-time, enabling researchers to track the sequential dehydration, dehydroxylation, and recrystallization processes without the complications of sample quenching artifacts [17].
Early pioneering infrared spectroscopic investigations of saponite dehydration established the foundation for understanding these processes [53]. These foundational studies demonstrated that saponites undergo progressive structural changes with heating, and subsequent detailed IES investigations have revealed the precise temperature-dependent evolution of spectroscopic features during thermal treatment [17]. The OH-stretching region in saponites is characterized by two distinct bands around 3600–3630 cm−1, assigned to Mg2(Al,vac)-OH stretching modes, and around 3670 cm−1, attributed to Mg3-OH stretching vibrations (Figure 5). These assignments reflect the presence of two different octahedral environments in the saponite structure, with Mg atoms bonded to either aluminum-substituted or fully Mg-occupied coordination sites.
Upon heating from room temperature through the initial thermal decomposition stages, interlayer water gradually disappears, accompanied by progressive changes in the hydroxyl stretching bands. The Mg2(Al,vac)-OH band intensity decreases substantially with increasing temperature, reflecting the loss of structural water and disruption of the hydration shells surrounding the interlayer cations. In striking contrast, the Mg3-OH band shows comparatively smaller intensity reduction, indicating that the Mg–O bonds in the fully trioctahedral layers are more thermally resistant than those in mixed-occupancy sites. This differential thermal stability of the two hydroxyl populations provides direct spectroscopic evidence of the composite nature of the octahedral layer and illustrates how crystal structure controls thermal behavior [51].
A particularly distinctive feature of saponite thermal transformation is the persistent presence of a silanol band at 3778 cm−1 that remains consistently visible from room temperature up to 750 °C (Figure 5) [17]. This characteristic silanol signature, positioned at a notably higher wavenumber than silanol intermediates observed in dioctahedral smectites like beidellite, indicates the formation and retention of Si–OH groups located at the edges of the tetrahedral layers. The continuity of this band throughout the heating sequence suggests that silanol formation in saponites occurs through a distinct mechanism compared to other phyllosilicates, likely reflecting the stabilizing effect of the trioctahedral layer and its different propensity for hydroxyl transfer to the tetrahedral-layer edges.
The restructuring of the octahedral layer during high-temperature dehydroxylation is evidenced by the appearance of a new absorption band around 730–740 cm−1, which reflects the formation of new Al–O bonds as octahedral coordination sites are reorganized following the loss of structural hydroxyl groups. This band formation marks a critical transition point in the thermal transformation sequence, indicating that the dehydroxylation process leads to substantial structural rearrangement rather than simply the removal of hydroxyl groups. The temperature-dependent evolution of these spectroscopic features—from initial interlayer water loss through progressive dehydroxylation and culminating in octahedral layer restructuring—provides comprehensive molecular-level evidence of the sequential thermal transformation mechanisms governing saponite behavior. These detailed IES observations demonstrate the complementary value of infrared emission spectroscopy for investigating saponite thermal transformations [51]. Whereas conventional thermal analysis provides quantitative information on bulk properties such as mass loss and reaction temperatures, IES provides molecular-level information on the structural changes occurring in real time during heating.

3.2.5. Nontronite

Comprehensive spectroscopic investigations of phyllosilicate minerals reveal systematic changes in vibrational bands during thermal transformations [36], with nontronite representing a particularly significant iron-bearing example within this broader mineral family. Iron-rich nontronite minerals show distinctive IES (infrared emission spectroscopy) behavior due to their characteristic FeFeOH units [15]. IES studies of Garfield and Uley nontronites reveal strong emission bands at 3570 cm−1 attributed to FeFeOH stretching vibrations, with dehydroxylation accompanied by progressive loss of intensity in this band as a function of temperature. The FeFeOH deformation vibration at 843 cm−1 also decreases with heating, reflecting systematic bond reorganization within the octahedral layer. A critical finding is that IES shows dehydroxylation occurring as a continuous process, in contrast to DTA/TGA studies where dehydroxylation appears to occur abruptly at 425 °C. This methodological distinction highlights the complementary role of real-time spectroscopic approaches by providing molecular-level information on transformation mechanisms during heating that complements the bulk thermal information obtained from conventional thermal analysis.
Water in these high iron-bearing smectites is observed through distinctive stretching modes at 3430 cm−1 and bending modes at 1630 cm−1 [15]. Band profile analysis in the 1590–1680 cm−1 region reveals the presence of different water types within the nontronite structure, providing insights into the hydration environment and coordination sphere of these iron-rich minerals. This complexity reflects the strong interaction between interlayer cations and water molecules, which governs dehydration kinetics. The presence of multiple water populations—including physisorbed surface water, hydration shells around interlayer cations, and structural water—creates the observed spectroscopic complexity and explains the multi-stage dehydration behavior observable during thermal treatment.
Nontronite’s thermal behavior within the broader smectite framework is controlled by fundamental physicochemical parameters identified across the smectite group. Dehydroxylation proceeds as an evolution of structural OH groups in the 300–900 °C range, with maximum dehydroxylation temperatures controlled by cation–OH bond strengths [51]. For nontronite specifically, the activation energy for dehydroxylation correlates linearly with temperature and is notably elevated at approximately 170 kJ/mol for Cs+-exchanged nontronite, reflecting the strong bond strengths inherent to iron–oxygen interactions. This kinetic parameter directly manifests in the temperature-dependent spectroscopic evolution: the progressive intensity loss of the 3570 cm−1 FeFeOH band occurs systematically with heating, revealing the sequential nature of hydroxyl group liberation. The FeFeOH deformation mode at 843 cm−1 similarly shows temperature-dependent intensity changes, demonstrating how local octahedral-layer chemistry controls vibrational behavior throughout the dehydroxylation process.
The structural integrity of nontronite undergoes profound changes under extreme pressure conditions between 10 and 40 GPa [64], observations that provide context for understanding its behavior under more moderate thermal conditions. Structural and spectroscopic changes induced by such extreme conditions establish that nontronite’s framework is susceptible to reorganization when subjected to external stresses. At elevated temperatures, thermal energy similarly promotes structural rearrangement, manifested through progressive changes in bond distances and coordination environments. Nontronite exhibits distinctive thermal alteration patterns with implications for understanding Mars surface mineralogy, where iron-bearing phyllosilicates are significant indicators of aqueous alteration history [64,65]. These patterns reflect the fundamental thermodynamic stability relationships controlled by iron chemistry and octahedral site occupancy, principles that govern nontronite behavior both on Earth and on planetary surfaces.
High-temperature transformation of Fe-bearing minerals in nontronite-bearing bentonites has been extensively characterized through complementary Mössbauer spectroscopy studies, which reveal iron oxidation state changes and phase transitions during heating [66]. Detailed investigation of bentonite containing Fe-bearing minerals (including montmorillonite and nontronite components) shows that at 400 °C, dehydroxylation of the smectite component begins and continues progressively up to 700 °C. Mössbauer absorption spectra of raw nontronite reveal that iron exists in both paramagnetic phases and in association with accessory magnetic minerals. Upon thermal treatment, these spectra show dramatic changes: the spectrum of thermally treated nontronite displays oxidized magnetite/maghemite and hematite phases, reflecting systematic iron redox chemistry occurring concurrent with structural dehydroxylation. These results demonstrate that thermal transformation of nontronite is not simply a loss-of-water phenomenon but involves coupled redox and structural reorganization processes that fundamentally alter the mineral’s crystal chemistry and physical properties.
These detailed spectroscopic observations demonstrate the complementary value of IES for investigating nontronite thermal transformations, revealing the continuous nature of dehydroxylation and iron oxidation-state evolution during heating while complementing the quantitative bulk information provided by conventional thermal analysis methods. The methodological advantages of real-time spectroscopic measurement over conventional techniques that measure only bulk properties become evident when examining nontronite, where complex iron chemistry and multi-phase water content create transformation pathways invisible to traditional thermal analysis approaches [51]. Modern understanding of nontronite thermal behavior emphasizes the critical role of activation energy relationships, iron coordination state changes, and phyllosilicate structural controls in determining both the temperature range and mechanistic pathways of thermal transformation. These principles, established through integrated analysis of IES results combined with Mössbauer spectroscopy findings and kinetic analysis frameworks, enable prediction of nontronite behavior across the range of geological and industrial conditions.

3.2.6. Comparative Analysis: Thermal Transformations Across Smectite Minerals

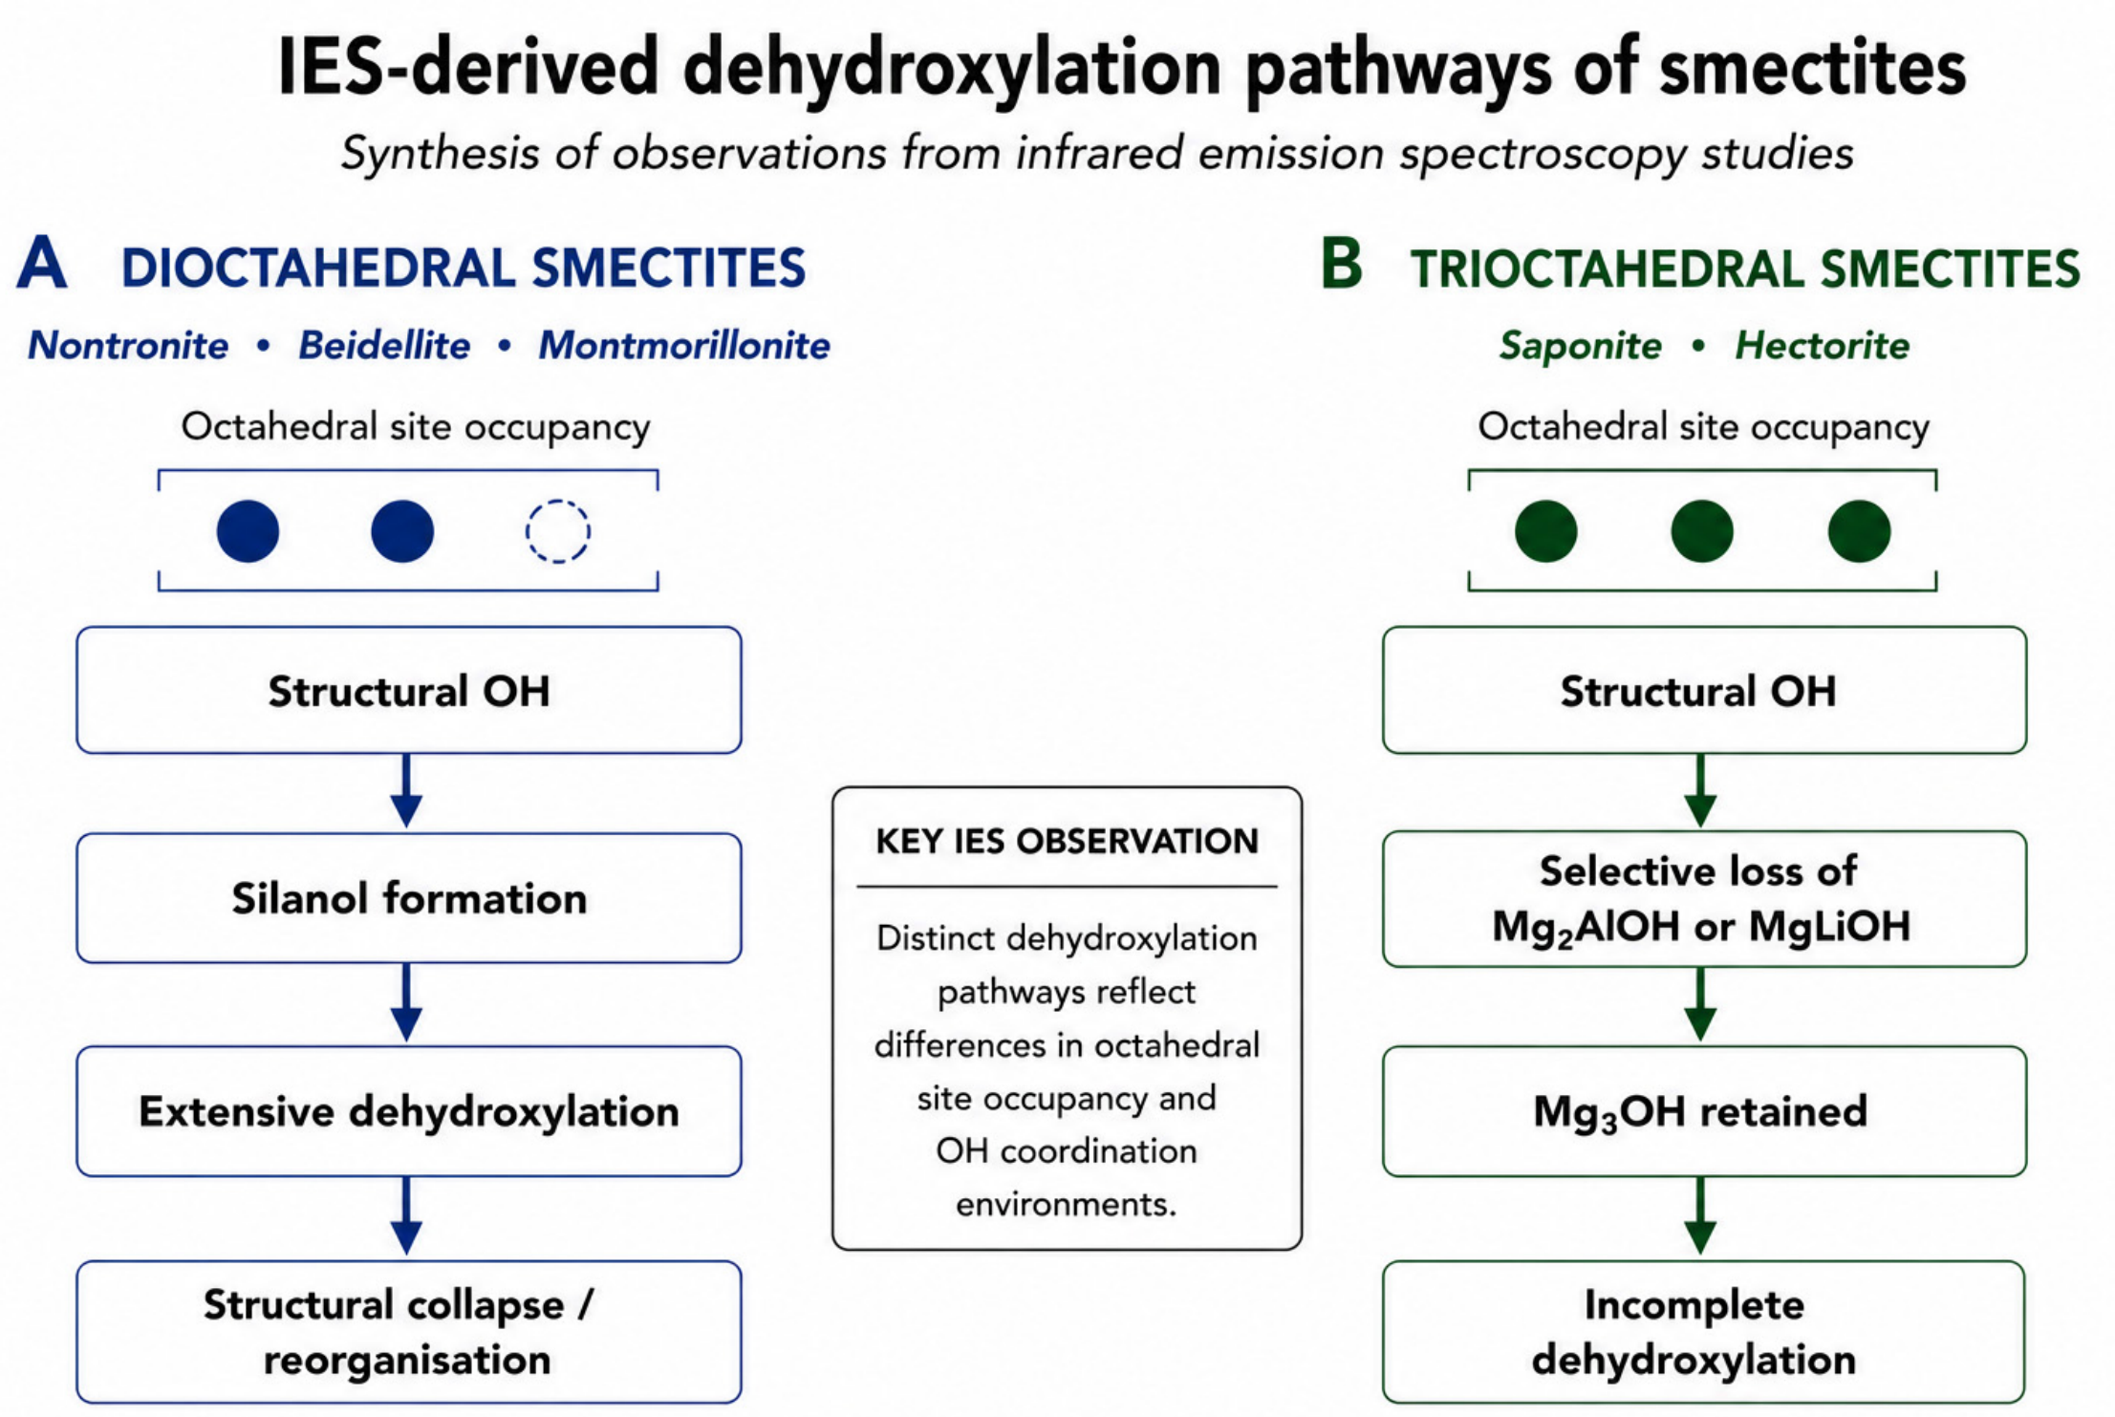
The smectite group demonstrates systematic variation in dehydration behavior directly linked to their octahedral composition. Dioctahedral smectites like montmorillonite and beidellite exhibit multi-stage dehydration beginning below 150 °C with loss of surface-adsorbed moisture, followed by removal of cation hydration shell water between 150 and 300 °C [50]. In contrast, trioctahedral smectites such as hectorite and saponite display more complex dehydration patterns reflecting their distinctive octahedral environment (Figure 6). The trioctahedral minerals maintain progressive interlayer water loss at distinct temperature intervals through 750 °C, demonstrating enhanced water retention compared to their dioctahedral counterparts. This fundamental structural difference—the presence of three versus two octahedral sites per formula unit—directly controls water accessibility and hydrogen bonding network stability [36].
Dehydroxylation temperature varies significantly across smectite minerals and correlates directly with cation–OH bond strength and octahedral vacancy type (Table 3), providing a universal framework for predicting thermal behavior [51]. Dioctahedral smectites show markedly different dehydroxylation onsets: natural beidellite dehydroxylates up to 600 °C while synthetic varieties extend to 700–750 °C [61], a difference governed by crystallinity. Montmorillonite initiates dehydroxylation at 400 °C and continues through 600 °C in dioctahedral Ca-montmorillonite [52]. In striking contrast, the trioctahedral smectites extend dehydroxylation to significantly higher temperatures (Figure 6). Hectorite maintains hydroxyl bands decreasing progressively up to 750 °C without complete disappearance [18], while saponite exhibits even more dramatic persistence of certain hydroxyl populations to temperatures beyond 750 °C [17].
These temperature differences directly reflect underlying kinetic parameters. Activation energy for dehydroxylation correlates linearly with maximum dehydroxylation temperature across the smectite group, ranging from approximately 170 kJ/mol for iron-bearing species like nontronite through 300 kJ/mol for Mg-rich montmorillonite, to over 500 kJ/mol for trioctahedral saponite [51]. The trioctahedral arrangement and strong Mg-centered hydroxyl coordination provide fundamental controls on the mineral’s resistance to thermal decomposition, explaining why these minerals exhibit superior thermal stability [36].
A key distinction among smectites emerges in the formation and persistence of silanol intermediates, revealing mechanistically how different structural types evolve. In dioctahedral beidellite, silanol bands at 3715–3720 cm−1 appear above 400 °C as a well-defined intermediate stage where hydroxyls transfer from octahedral to tetrahedral layer edges [61]. The appearance of the 722 cm−1 band after dehydroxylation marks octahedral layer restructuring, indicating a discrete mechanistic pathway through intermediate structural phases [51].
Trioctahedral smectites display fundamentally different silanol behavior. Hectorite shows a distinctive silanol band at 3741 cm−1 emerging above 250 °C [18], appearing at notably lower temperature than in dioctahedral smectites and reaching maximum intensity in the 400–600 °C range. Even more striking, saponite maintains a persistent silanol signature at 3778 cm−1—positioned at substantially higher wavenumber—that remains consistently visible from room temperature up to 750 °C [17]. This wavenumber difference and persistence indicate that silanol formation in trioctahedral minerals occurs through a distinct mechanism, likely reflecting the stabilizing effect of the trioctahedral layer and its different propensity for hydroxyl transfer to tetrahedral layer edges. These observations demonstrate how octahedral composition fundamentally controls not just the temperature of dehydroxylation, but the actual mechanism by which hydroxyl groups migrate and are ultimately liberated.
Crystallinity emerges as a critical secondary control on thermal behavior, with this effect most pronounced in dioctahedral species. Natural beidellite with lower crystallinity dehydroxylates over a broader temperature range (to 600 °C) while more crystalline synthetic beidellites display sharper transitions extending to 750 °C. The relationship reflects how structural order governs activation energy: more ordered crystal structures possess fewer defect sites and thus require higher temperatures and longer activation times to initiate concerted OH loss [51]. In contrast, trioctahedral smectites show less dramatic crystallinity effects, suggesting that the intrinsic strength of Mg-OH bonds and octahedral coordination geometry dominate over structural ordering considerations. This structural resilience of the trioctahedral arrangement provides thermal stability that is less sensitive to sample-specific variations in crystallinity.
Above 700 °C, smectite minerals follow mineral-specific recrystallization pathways reflecting their distinct compositions. Montmorillonite recrystallizes above 700 °C [57] while developing cristobalite and mullite phases above 800 °C [58]. In contrast, hectorite undergoes formation of pyroxene-like (MgSiO3) units and progressively amorphous silica above 600–650 °C [18], reflecting the stabilizing effect of Mg on the formation of silicate chain structures. Saponite similarly follows a Mg-controlled recrystallization pathway, with new Al–O bonds appearing at 730–740 cm−1 after dihydroxylation [17]. Nontronite presents additional complexity with concurrent iron oxidation state changes: at 400–700 °C, dehydroxylation proceeds while iron phases transform to magnetite/maghemite and hematite [66], demonstrating that iron chemistry introduces coupled redox processes absent in magnesian or aluminous smectites.
The comparative analysis reveals that octahedral composition acts as the primary determinant of smectite thermal behavior, with a clear hierarchy: trioctahedral smectites > dioctahedral aluminum-rich smectites > iron-bearing dioctahedral smectites in terms of thermal resistance. Activation energy relationships, octahedral cation–OH bond strength, and octahedral vacancy type—identified as universal controls on phyllosilicate thermal stability [51]—manifest through specific, quantifiable spectroscopic signatures that can be monitored in real time by infrared emission spectroscopy. The synergy between kinetic modeling [51], molecular-level spectroscopic observation [21], and comparative mineral analysis [36] creates a comprehensive mechanistic understanding linking thermodynamic driving forces, activation energy barriers, and real-time structural reorganization into a unified framework for predicting how any smectite mineral will transform when subjected to thermal treatment.

3.3. Illite

Illite-rich clays constitute important raw materials for structural ceramics, bricks and roofing tiles because they contribute fluxing components during firing and influence densification and mechanical strength [3]. Illite, a widespread 2:1 dioctahedral layer silicate with the general formula K0.8Al2(Si3.2Al0.8)O10(OH)2, undergoes progressive structural transformations during heating that span a broad temperature interval (600–850 °C), making it distinct from other layer silicates in its thermal behavior [22]. Unlike kaolinite, which exhibits abrupt dehydroxylation at 400–600 °C, illite demonstrates gradual structural reorganization extending through 600–700 °C and beyond [22]. This extended transformation interval reflects the complex coordination environments of hydroxyl groups within the octahedral sheet and the stabilizing role of interlayer potassium in maintaining layer integrity during heating. Infrared and Raman spectroscopy provide complementary, non-destructive insights into these dehydration and dehydroxylation mechanisms at the molecular level.
The OH-stretching region between 3600 and 3800 cm−1 in Fourier-transform infrared (FTIR) spectra represents the primary indicator of hydroxyl group content and local bonding environments in illite. During thermal treatment, systematic intensity reduction and broadening of bands in this region directly document the progressive loss of structural hydroxyl groups [67]. In natural clay samples containing mixtures of illite, illite–smectite, and kaolinite, the dehydroxylation signature appears across a wider temperature range (200–250 °C to 550–600 °C) than in pure mineral systems, reflecting the superposition of overlapping dehydration processes from multiple clay phases [67].
The coupled changes in both OH-stretching and Si-O stretching regions (1000–1100 cm−1) during illite heating reflect coordinated modifications throughout the entire crystal structure rather than isolated hydroxyl loss [67]. This spectral interdependence demonstrates that dehydroxylation in illite involves framework distortion affecting multiple structural units simultaneously, as the silicate tetrahedral and octahedral sheets respond to progressive hydroxyl removal. FTIR spectroscopy thus provides a sensitive, real-time fingerprint of ongoing structural transformation.
Thermogravimetric analysis (TGA) in conjunction with FTIR provides quantitative context for spectroscopic observations. While kaolinite achieves virtually complete dehydroxylation at 650 °C, illite and other 2:1 minerals (such as smectite) demonstrate only approximately 60–70% dehydroxylation at 650 °C, requiring 850 °C or higher for near-complete transformation [22]. This differential behavior is directly observable in FTIR spectra as persistent, broadened OH-stretching bands at temperatures where kaolinite has already lost its characteristic hydroxyl features. The broad, asymmetric bands remaining in illite FTIR spectra at intermediate temperatures (650–800 °C) indicate that structural hydroxyl groups remain distributed across multiple coordination environments, each removed at distinct temperature thresholds [67].
Thermal analysis of illite-containing clay samples further reveals that dehydroxylation extends from 200 to 250 °C (physically bound water loss) through 550–600 °C (primary dehydroxylation) and continuing to 800–900 °C (secondary dehydroxylation processes) [67]. The intermediate steps between 550 and 600 °C and 800–900 °C document the gradual removal of hydroxyl groups from octahedral coordination positions, observable as progressive intensity loss in the FTIR OH-stretching region.
Raman spectroscopy offers direct, non-destructive real-time monitoring of illite structural transformations, with quantifiable temperature-dependent behavior [19]. Unlike FTIR, which primarily measures dipole moment changes during vibrations, Raman spectroscopy detects polarizability changes in the crystal lattice, making it particularly sensitive to short-range order modifications and cation coordination geometry rearrangements [19].
The most revealing Raman evidence of illite’s thermal transformation emerges from the hydroxyl (OH) vibration region (Figure 7). With increasing temperature, hydroxyl vibration peaks in illite Raman spectra demonstrate systematic narrowing [19]. Simultaneously, the peak area ratios—which reflect the relative intensity distribution among multiple OH-stretching modes—show characteristic increases with temperature [19]. These coupled changes in both peak width and area ratios indicate that illite undergoes increased structural ordering during heating, possibly reflecting progressive loss of defects and structural water as hydroxyl groups are removed [19].
A direct quantitative relationship exists between temperature and Raman spectral parameters in heated illite [19]. This temperature-dependent behavior provides a basis for using Raman spectroscopic measurements as a real-time monitor of illite transformation progress without requiring destructive sampling. The narrow, reproducible relationship between observable spectral features (peak width, area ratios) and applied temperature establishes Raman spectroscopy as a rapid, quantitative analytical tool suitable for assessing thermal transformation extent in both laboratory and industrial settings [19]. This quantitation capability contrasts with visual FTIR inspection and demonstrates Raman’s particular utility for process monitoring and quality assurance.
X-ray diffraction provides independent evidence of structural reorganization corresponding to Raman and FTIR observations. The 004 reflection of illite shifts from approximately 5.00 Å (2θ ≈ 17.8°) at room temperature to 5.04 Å (2θ ≈ 17.6°) after calcination at 850 °C [22]. This shift is attributed to rearrangement of the illite structure due to dehydroxylation. Critically, the XRD shift is only partial after 650 °C calcination (reflections present at both ~5.00 Å and ~5.04 Å), confirming that 650 °C is insufficient for complete structural transformation [22]. This XRD evidence validates the FTIR and Raman spectroscopic findings that illite dehydroxylation and structural reorganization extend beyond 650 °C and require temperatures up to 850 °C for virtual completion.
Differential thermal analysis (DTA) reveals the temperature-dependent nature of illite decomposition processes. Illite-bearing clay samples show endothermic reactions between 470 and 580 °C caused by dehydroxylation of the octahedral sheet [68]. The hydroxyl groups of the tetrahedral sheet are gradually removed up to 850 °C, with an exothermic peak resulting from crystal reformation (spinel phase formation) appearing between 850 and 920 °C [68]. At higher temperatures (1110–1150 °C), additional endothermic peaks appear due to formation of mullite and cristobalite phases [68]. These thermal signatures align with the progressive spectroscopic changes documented through FTIR and Raman spectroscopy across the same temperature intervals.
For iron-bearing illites, Mössbauer spectroscopy (57Fe) provides additional insight into structural changes during heating. At 750 °C, Mössbauer spectra show only Fe3+, indicating complete oxidation of Fe2+ [68]. The high quadrupolar splitting observed at this temperature likely results from dehydroxylation of Fe3+ hydroxide and variable iron site distortion caused by trapped water molecules and oxygen deficiencies [68]. At temperatures from 800 to 1150 °C, a sextet with hyperfine field ~495 kOe characteristic of hematite (Fe2O3) emerges, with increasing hematite subspectra absorption at higher temperatures [68]. This magnetic phase formation demonstrates that iron redox chemistry and phase segregation accompany illite’s hydroxyl loss and structural reorganization, particularly at temperatures above 800 °C [68].

3.4. Modulated Clay Minerals: Palygorskite and Sepiolite

Modulated clay minerals, including palygorskite and sepiolite, represent a distinctive group characterized by their fibrous structure and water in channels and coordinated positions. Palygorskite and sepiolite are valued for their fibrous morphology, high specific surface area and sorptive properties, leading to applications as adsorbents, catalysts, rheological modifiers and nanocomposite fillers [3]. These minerals exhibit complex dehydration and dehydroxylation mechanisms observable through infrared emission spectroscopy (IES), providing real-time molecular-level insights into their thermal transformations. Comprehensive spectroscopic investigations of phyllosilicate minerals reveal systematic changes in vibrational bands during thermal transformations [36], with palygorskites and sepiolites displaying distinctive patterns reflecting their unique crystal structure and water-hosting capacity.
Palygorskite exhibits characteristic dehydration and dehydroxylation behavior observable through infrared emission spectroscopy, with IES studies on selected Chinese palygorskites revealing clear structural changes and progressive dehydroxylation with increasing temperature [69]. The thermal evolution of palygorskite demonstrates the sensitivity of fibrous clay minerals to temperature-dependent structural modifications, with infrared emission spectroscopy providing real-time evidence of these transformations as they occur.
Infrared emission spectroscopic studies of palygorskite reveal a complex dehydration behavior characterized by the progressive loss of water in channels and coordinated positions at distinct temperature intervals. The OH-stretching region is characterized by prominent vibration bands between 3600 and 3200 cm−1, with dehydration of channel and coordinated water accompanied by systematic intensity reduction in this spectral region. As temperature increases from room temperature, the intensity of bands associated with water-related vibrations progressively decreases, reflecting the organized removal of hydration shells and structural water from the palygorskite framework (Figure 8).
Partial loss of coordinated water begins at approximately 400 °C, with complete dehydration generally achieved by 600 °C [69]. Below 400 °C, the primary dehydration process involves removal of channel water and weakly coordinated water molecules, observable through progressive broadening and intensity decrease in bands in the 3400–3500 cm−1 region. The differential thermal behavior of different water populations in palygorskite reflects the hierarchical accessibility of water within the fibrous structure and varies depending on the specific geological origin and compositional characteristics of individual samples.
Dehydroxylation in palygorskite is reflected in the systematic decrease in band intensity between 3700 and 3550 cm−1, with these features corresponding to structural hydroxyl groups bonded to octahedral cations within the palygorskite framework [69]. The progressive intensity loss of OH-stretching modes during heating indicates the sequential liberation of structural hydroxyl groups, a process that occurs over a broad temperature range and reflects the multiple hydroxyl coordination environments present in the mineral structure. Unlike the more abrupt dehydroxylation transitions observed in some layer silicates, palygorskite demonstrates gradual hydroxyl loss extending through the 400–700 °C temperature interval.
Complementary infrared transmission spectroscopy and IES investigations reveal that structural changes in palygorskite under heating involve not only intensity reduction but also characteristic band position shifts reflecting molecular-level modifications to the coordination geometry [70]. The Si-O stretching region around 1000–1100 cm−1 undergoes parallel changes during heating, with band broadening and position shifts reflecting the distortion of the silicate tetrahedral framework as the fibrous structure responds to hydroxyl loss and water removal. These coupled changes in both OH-stretching and Si-O stretching regions demonstrate that dehydroxylation in palygorskite involves coordinated modifications throughout the entire fibrous structure rather than isolated hydroxyl loss.
The structural differences and geological settings of palygorskite from different origins produce notable variations in band intensities and precise dehydration temperatures, though the main band positions remain consistent [69]. Natural and acid-activated Al-rich and Mg-rich palygorskites show differential thermal behavior reflecting their distinct octahedral cation compositions and coordination geometries [71]. More Mg-rich palygorskites typically display higher thermal stability and slower intensity loss in the OH-stretching region compared to Al-rich varieties, suggesting that Mg-OH bond strengths exceed those of Al-OH coordination in the palygorskite structure.
The FTIR spectroscopy study of structure changes in palygorskite under heating reveals that thermal treatment induces progressive reorganization of the fibrous framework [72]. Band profile analysis in the OH-stretching region demonstrates systematic narrowing and intensity decrease, with these spectroscopic signatures providing quantitative measures of the degree of hydroxyl depletion. At temperatures approaching 700 °C, the characteristic palygorskite features in the infrared spectrum become nearly absent, indicating substantial structural reorganization and potential formation of high-temperature phases. Infrared emission spectroscopy has proven to be an effective method for determining the thermal stability and precise dehydration mechanisms of palygorskite minerals, providing information complementary to traditional thermal analysis techniques [69].
The infrared emission spectroscopic characterization of “Rocky Mountain leather” (sepiolite) reveals that the thermal transformations of this mineral occur through systematic intensity reduction and progressive band broadening in both the water-related and hydroxyl-stretching regions [70]. Palygorskite minerals, similarly structured as fibrous clay minerals with channels hosting coordinated water and structural water, display characteristic dehydration signatures observable through heating-stage infrared emission spectroscopy, with water removal at temperatures below 400 °C followed by progressive dehydroxylation extending through 400–700 °C.
The persistence of certain spectroscopic features to higher temperatures in sepiolite compared to palygorskite suggests enhanced thermal stability in the sepiolite structure, likely reflecting the different distribution and bonding of octahedral cations. The comparative analysis of palygorskite, sepiolite, and attapulgite demonstrates how the fibrous geometry of these modulated clay minerals controls their water-hosting capacity and dehydration kinetics, with implications for predicting their behavior during thermal processing and high-temperature applications.

3.5. Mixed-Layer Clay Minerals

Mixed-layer clay minerals occur in many natural clay deposits used for ceramic manufacture and other industrial applications. Because they combine the structural characteristics of two or more clay minerals, their thermal transformations are generally more complex than those of the corresponding end-member phases and are therefore of considerable importance for predicting the behavior of natural clay raw materials during firing [73]. These minerals combine structural elements characteristic of various phyllosilicates, resulting in unique thermal behavior and spectroscopic signatures. Among mixed-layer minerals, rectorite represents a particularly important system for studying dehydroxylation mechanisms and structural transformations during thermal treatment [74]. The complexity of mixed-layer minerals requires comprehensive spectroscopic characterization using complementary techniques to fully understand their thermal decomposition pathways.
Infrared emission spectroscopy (IES) studies have proven invaluable for characterizing the molecular-level structural changes in rectorite during heating (Figure 8). The hydroxyl-stretching region of rectorite, when compared to synthetic beidellite and paragonite, shows distinctive features that reflect its unique interstratified structure [74]. In all these mixed-layer systems, a characteristic band appears around 3640–3650 cm−1, which is assigned to H-bonded Si-O-Si interactions. However, rectorite and paragonite display an additional band at approximately 3675 cm−1, with a broad band around 3450 cm−1 reflecting a combination of H-bonded water molecules and Si-O-Al linkages [74]. These spectroscopic features provide direct evidence of the structural heterogeneity inherent in mixed-layer phyllosilicates and their differing coordination environments compared to simple layer silicates.
The infrared absorption spectra of ammonium-exchanged rectorite reveal similar characteristic bands, with subtle variations depending on the interlayer cation and the degree of structural order [75]. Early infrared studies demonstrated that the thermal decomposition of ammonium rectorite proceeds through distinct stages, with progressive loss of structural hydroxyl groups occurring at well-defined temperature intervals [75]. These studies established foundational understanding of how the interlayer chemistry influences the overall dehydroxylation behavior of mixed-layer minerals.
In situ infrared emission spectroscopy of rectorite reveals that interlayer water removal occurs through a multi-step process with distinct temperature thresholds (Figure 9). Interlayer water bands at approximately 3300 cm−1 disappear completely by 250 °C, indicating rapid loss of adsorbed and interlayer water and loosely coordinated interlayer moisture [74]. A second water-related band centered around 3465 cm−1 vanishes by 350 °C, corresponding to the removal of more strongly associated water molecules or partially coordinated interlayer species [74]. This stepwise dehydration pattern reflects the hierarchical arrangement of water within the interstratified structure, with successive removal of water populations possessing progressively stronger interactions with the clay framework.
The dehydroxylation of octahedral hydroxyl groups in rectorite follows a progressive path during thermal treatment. Al-OH stretching and bending modes, which characterize the Al-coordinated hydroxyl groups in the octahedral sheet, decrease systematically in intensity with increasing temperature and become completely absent by 650 °C [74]. This temperature threshold marks a critical transition point where octahedral dehydroxylation has proceeded sufficiently to eliminate discernible Al-OH vibrational signatures in the infrared spectrum. The complete elimination of Al-OH features by 650 °C indicates that the mixed-layer structure has undergone substantial reorganization and hydroxyl loss compared to the original hydrated rectorite.
A particularly distinctive feature observed during rectorite dehydroxylation is the appearance and persistence of Si-OH stretching bands in the infrared spectrum. A weak Si-OH band emerges around 3745 cm−1 at approximately 300 °C and remains visible throughout heating up to 800 °C [74]. This unusual observation—the appearance of Si-OH features during the progressive disappearance of Al-OH features—provides direct evidence of hydroxyl group migration within the crystal structure. The formation of Si-OH groups suggests that structural hydroxyl moieties transfer from octahedral coordination sites (Al-OH) to tetrahedral sheet edge positions (Si-OH) as an intermediate step in the overall dehydroxylation process [74]. This dynamic hydroxyl redistribution illustrates the complexity of mixed-layer phyllosilicate thermal decomposition, where simple loss of hydroxyl groups is preceded by internal rearrangement and site-transfer mechanisms.
Following the loss of hydroxyl groups, in situ spectroscopic data reveal the formation of new bonding arrangements within the rectorite structure. A new absorption band appears at 555 cm−1 above 400 °C, which is assigned to the formation of Al-O-Si linkages [74]. This new bonding signature documents the structural reorganization accompanying dehydroxylation—the mineral does not simply lose hydroxyl groups but simultaneously forms new bridging bonds that stabilize the modified framework. The persistence of this band through 800 °C indicates ongoing structural adjustment throughout the dehydroxylation interval. These observations confirm that rectorite thermal decomposition involves coupled processes: hydroxyl loss is accompanied by coordinated structural rearrangement, resulting in a progressively more condensed silicate framework with enhanced Si-O-Si and Al-O-Si bridging interactions.
The comparative study of rectorite with synthetic mica-montmorillonite, beidellite, and paragonite reveals systematic differences in thermal stability and dehydroxylation mechanisms [76]. While all these mixed-layer and 2:1 systems show broadly similar spectroscopic trends—initial water loss followed by hydroxyl dehydroxylation—the exact temperature ranges and the distribution of hydroxyl populations vary significantly based on the specific interstratification pattern and interlayer composition. Recent comprehensive studies on the evolution of crystallographic structure and physicochemical aspects of rectorite upon calcination have confirmed that the transformation pathway involves a sequence of intermediate phases and structural configurations before reaching the final dehydroxylated state [77]. These studies demonstrate that the mixed-layer nature of rectorite results in more gradual and complex thermal transformations compared to simple layer silicates, with multiple overlapping dehydroxylation events occurring across the 300–800 °C temperature range.
The systematic investigation of rectorite thermal behavior through multiple complementary spectroscopic techniques has established this mineral as a model system for understanding mixed-layer clay mineral thermal chemistry and the mechanisms by which structural complexity influences dehydroxylation pathways.

4. Thermal Transformations of Clay Minerals in Ceramic Production: Applications and Optimization Strategies

4.1. Spectroscopic Control of Firing Temperatures in Ceramic Manufacturing

The comprehensive spectroscopic characterization of clay mineral thermal behavior documented in Section 3 provides unprecedented guidance for optimizing ceramic firing protocols. Understanding the temperature-dependent structural transformations revealed through infrared emission spectroscopy, Raman spectroscopy, and complementary techniques enables ceramic manufacturers to precisely control firing schedules to achieve desired material properties. The multi-stage dehydration and dehydroxylation processes identified across different clay mineral families—particularly the distinction between 1:1 layer silicates (kaolinite, halloysite), 2:1 smectites (montmorillonite, hectorite, saponite), and mixed-layer minerals (rectorite)—provide a molecular-level foundation for predicting phase assemblages at any firing temperature.
The activation energy relationships established in Section 3 directly translate into practical firing strategies. Since dioctahedral smectites like montmorillonite initiate dehydroxylation around 400 °C and require approximately 600 °C for substantial transformation, while trioctahedral minerals like saponite extend dehydroxylation beyond 750 °C, ceramic producers can tailor kiln temperatures based on the mineralogical composition of their raw clay mixtures. This composition-dependent thermal response, confirmed through systematic spectroscopic monitoring of OH-stretching band intensity, Al-OH deformation modes, and formation of silanol intermediates, ensures that firing temperatures balance complete dehydroxylation (necessary for phase development and strength) against excessive sintering and undesired phase formation.

4.2. Kaolinite-Based Ceramics: Optimizing Firing for Metakaolin Formation and Mechanical Properties

Kaolinite represents the ideal ceramic material because its thermal transformation pathway is well-characterized through the spectroscopic studies summarized in Section 3.1.1. The homogeneous dehydroxylation mechanism—where inner and outer hydroxyl groups are lost simultaneously as identified through progressive narrowing of OH-stretching bands between 3550 and 3750 cm−1—creates conditions for uniform amorphization and development of metakaolin (Al2Si2O7), the highly reactive calcined product. The critical temperature range for kaolinite firing extends from approximately 400 °C (initiation of dehydroxylation) to 600 °C (near-complete transformation), as confirmed through complementary DTA studies showing endothermic reactions in this interval and complete disappearance of Al-OH stretching features by 650 °C.
Recent ceramic studies demonstrate the practical application of this thermal understanding. When kaolinite-rich clays are fired at controlled temperatures between 700 and 900 °C, X-ray diffraction reveals progressive formation of mullite (3Al2O3·2SiO2) and cristobalite (SiO2 polymorph), with mullite becoming prominent above 1100 °C. The mechanical properties of fired kaolinite ceramics directly correlate with the degree of dehydroxylation achieved, as demonstrated through studies showing compressive strength increasing from 11.2 MPa at 800 °C to 42.3 MPa at 1050 °C due to densification and mullite formation [78]. Importantly, underfiring (holding temperatures below 650 °C) results in incomplete dehydroxylation, leaving residual OH-groups detectable through infrared spectroscopy and leading to reduced mechanical strength and pore volume changes during subsequent cooling. The FTIR-based quantification of dehydroxylation extent—achievable through monitoring the progressive loss of the Al-OH stretching band intensity—provides ceramic manufacturers with real-time feedback to optimize kiln dwell times at peak temperature.

4.3. Illite-Dominated Clay Ceramics: Extended Firing Requirements and Phase Development Control

The spectroscopic characterization of illite thermal behavior in Section 3.4 reveals fundamental challenges and opportunities for ceramic production with illite-rich raw materials. Unlike kaolinite, which completes dehydroxylation by 650 °C, illite undergoes extended dehydroxylation from 600 °C to 850 °C, with partial structural reorganization observable at intermediate temperatures through XRD monitoring of the 004 reflection shift from 5.00 Å to 5.04 Å. This extended transformation interval requires higher firing temperatures and longer kiln residence times compared to kaolinite-based ceramics, increasing energy costs but also creating opportunities for targeted phase development.
Ceramic manufacturers must recognize the multi-step nature of illite dehydroxylation, which proceeds through intermediate mechanisms identifiable through complementary spectroscopic signatures. DTA studies reveal distinct endothermic reactions between 470 and 580 °C (octahedral sheet dehydroxylation), with tetrahedral sheet hydroxyl removal extending to 850 °C, followed by exothermic crystal reformation (spinel phase formation) between 850 and 920 °C. At higher temperatures (1110–1150 °C), final recrystallization into mullite and cristobalite phases occurs, providing the ceramic “markers” that define firing temperature estimates. For iron-bearing illites—common in many ceramic clay deposits—Mössbauer spectroscopy reveals additional complexity: complete oxidation of Fe2+ to Fe3+ occurs by 750 °C, followed by formation of hematite (Fe2O3) phases above 800 °C, which contribute red coloration and affect sintering behavior. The appearance of hematite subspectra in Mössbauer spectra correlates with the transition from partially dehydroxylated to fully transformed mineral phases, providing an independent verification that firing has achieved complete structural reorganization.

4.4. Smectite-Based Ceramics: Thermal Stability Hierarchy and Tailored Processing

The comparative analysis of smectite thermal behavior in Section 3.2.6 establishes a clear hierarchy of thermal stability that directly governs ceramic firing protocols. Dioctahedral smectites (montmorillonite, beidellite) exhibit thermal fragility, completing dehydroxylation by 600–750 °C with silanol intermediate formation at 3715–3720 cm−1 indicating hydroxyl redistribution before final loss. In contrast, trioctahedral smectites (hectorite, saponite) demonstrate enhanced thermal resistance, maintaining hydroxyl populations to 750 °C and beyond, with persistent silanol signatures at higher wavenumbers (3741 cm−1 for hectorite, 3778 cm−1 for saponite) indicating distinct hydroxyl transfer mechanisms.
For ceramic applications, this thermal hierarchy creates distinct production scenarios. Montmorillonite-rich raw materials require careful control to avoid excessive firing, which causes particle sintering and loss of specific surface area, particularly in iron-rich deposits where sintering accelerates above 700 °C. The formation of new Al-O bonds at 722 cm−1 (detectable through FTIR) marks the point at which octahedral layer restructuring becomes substantial, signaling the transition from partially reactive metaclays to heavily sintered products with reduced pozzolanic activity. Conversely, saponite-based ceramics benefit from their extended dehydroxylation interval, allowing higher firing temperatures that promote better phase development and densification without excessive sintering. The persistent silanol band at 3778 cm−1 throughout heating up to 750 °C indicates that hydroxyl transfer from octahedral to tetrahedral sites provides pathways for structural stabilization, preventing amorphization and preserving ceramic properties during extended high-temperature holds.

4.5. Mixed-Layer Mineral Ceramics: Complex Processing of Rectorite and Interstratified Systems

Mixed-layer clay minerals like rectorite present unique opportunities and challenges for ceramic production due to their interstratified structures combining 1:1 and 2:1 layer characteristics. Section 3.5 demonstrates that rectorite undergoes multi-step dehydration and dehydroxylation occurring across the 300–800 °C temperature range, with distinct spectroscopic signatures enabling precise process control. Interlayer water bands at 3300 cm−1 disappear by 250 °C, followed by removal of more strongly bound water around 3465 cm−1 by 350 °C, reflecting hierarchical water populations with different binding strengths. Al-OH stretching and bending modes completely disappear by 650 °C, establishing a critical firing temperature threshold for complete octahedral dehydroxylation.
The distinctive formation of Si-OH intermediates at 3745 cm−1 (emerging around 300 °C and persisting to 800 °C) provides direct evidence of hydroxyl migration from octahedral to tetrahedral sites, a mechanism that fundamentally alters ceramic properties during firing. Simultaneous formation of new Al-O-Si linkages (band at 555 cm−1 above 400 °C) indicates structural condensation and formation of more stable bridging configurations. For ceramic manufacturers, this means that rectorite-rich clays develop desirable properties through controlled heating protocols that balance complete dehydroxylation against over-firing, optimally firing in the 650–800 °C range to maximize both hydroxyl removal and structural stabilization through new bonding formation. The complex, gradual transformation of rectorite—compared to the more abrupt transitions in simple layer silicates—allows fine-tuned kiln control strategies that are impossible with simpler mineral assemblages.

4.6. Multi-Phase Natural Clay Ceramics: Integrating Spectroscopic Knowledge for Mineral Assemblage Control

Most ceramic raw materials contain complex assemblages of multiple clay minerals and accessory phases, requiring ceramic producers to apply the spectroscopic understanding from Section 3 in an integrated manner. Carbonatic clays containing illite-dominated matrices with accessory quartz, feldspar, and iron oxides exhibit firing behavior that reflects superposition of individual mineral transformation pathways, modified by mineral-mineral interactions. FTIR analysis of illite-dominated clays heated to 1200 °C reveals sequential phase development: meta-clay (pseudoamorphous phase) appears by 700 °C from illite degradation; illite–muscovite destruction occurs at 900–1100 °C; and final products include gehlenite, clinopyroxene, maghemite, hematite, mullite, α-cristobalite, and glass phases.
The integration of FTIR spectroscopy with X-ray powder diffraction enables comprehensive tracking of phase development and the formation of “ceramic markers” that provide firing temperature estimates. For ecological building materials produced from ceramic waste waters containing quartz, kaolinite, mullite, and iron hydroxides, thermal consolidation at 700, 800, and 900 °C produces strength improvements directly correlating with firing temperature: 4.44 MPa at 700 °C, 5.88 MPa at 800 °C, and 16.87 MPa at 900 °C, with X-ray diffraction confirming that kaolinite dehydration drives densification at each temperature step [79]. Ceramic producers optimizing natural clay firing schedules must therefore track how the dehydroxylation temperature windows for each mineral phase—as established through spectroscopic studies in Section 3—shift and overlap during simultaneous heating of mixed assemblages, allowing targeted adjustment of peak temperatures and residence times to maximize desirable phase formation while suppressing undesired reactions.

5. Conclusions

This comprehensive review demonstrates that infrared emission spectroscopy (IES), Raman spectroscopy, and complementary analytical techniques have revolutionized our understanding of clay mineral thermal transformations, enabling real-time observation of molecular-level structural reorganization previously invisible to conventional bulk analysis methods. By systematically examining 1:1 layer silicates (kaolinite, halloysite, serpentine minerals), 2:1 layer silicates (montmorillonite, beidellite, hectorite, saponite, nontronite), modulated fibrous minerals (palygorskite, sepiolite), illite, and mixed-layer minerals (rectorite), this review establishes that clay mineral thermal behavior is controlled by fundamental structural parameters—octahedral cation composition, cation–OH bond strength, octahedral vacancy type, and crystallinity—which manifest as quantifiable spectroscopic signatures.
The thermal transformation pathway followed by clay minerals occurs through three sequential phases: dehydration (removal of interlayer and surface water below 200 °C), dehydroxylation (loss of structural hydroxyl groups typically in the 400–900 °C range controlled by mineral-specific activation energies), and recrystallization (formation of new crystalline phases at temperatures above 700 °C). Spectroscopic monitoring reveals that these transitions do not occur abruptly but progress through intermediate structural configurations, with hydroxyl transfer to tetrahedral layer edges (silanol formation) representing a critical mechanistic step before final hydroxyl release. This detailed molecular understanding now enables precise prediction of thermal behavior for any clay mineral based on its composition and structural characteristics.
In ceramic production, this spectroscopic knowledge translates into practical advances in firing optimization and phase control. Understanding that kaolinite achieves complete dehydroxylation by 650 °C while illite requires 850 °C allows ceramic manufacturers to tailor kiln temperatures for specific clay mineralogy, balancing the need for complete dehydroxylation against particle sintering and loss of specific surface area. Multi-analytical studies confirm that characteristic “ceramic markers”—crystalline phases such as gehlenite, clinopyroxene, mullite, and cristobalite that form at predictable temperature intervals—provide a spectroscopic “thermometer” for firing temperature estimation and post hoc thermal history reconstruction. The compressive strength of fired ceramics correlates directly with dehydroxylation extent and phase development: measurements on Chinese red clay samples show dramatic strength improvements from 11.2 megapascals at 800 °C to 42.3 megapascals at 1050 °C due to densification and mullite formation [78]. For ecological building materials produced from ceramic slurries, thermal consolidation at 700–900 °C produces strength values (4.44–16.87 MPa) that increase systematically with firing temperature due to controlled kaolinite dehydration and densification [79,80].
Despite the considerable advances achieved over the past three decades, several important challenges remain. The molecular mechanisms governing dehydration, dehydroxylation and recrystallization are still incompletely understood for many clay minerals, particularly mixed-layer clays, fibrous clay minerals and chemically complex natural clay assemblages. Quantitative relationships between spectral changes and the extent of structural transformation remain limited, while relatively few systematic studies have examined the influence of heating rate, atmosphere, particle size and chemical composition under standardized experimental conditions. Furthermore, the application of vibrational spectroscopy to natural ceramic raw materials remains challenging because of mineralogical heterogeneity, overlapping spectral features and interactions between coexisting mineral phases.
Future research should focus on the development of quantitative spectroscopic methods capable of monitoring thermal transformations in situ under well-controlled experimental conditions. Greater integration of FTIR, Raman spectroscopy and infrared emission spectroscopy with complementary techniques such as high-temperature X-ray diffraction, thermal analysis, electron microscopy and computational modeling will provide a more complete understanding of reaction mechanisms and phase evolution. Expanded investigations of well-characterized natural clay assemblages, together with synthetic reference materials of controlled composition and layer charge, will improve the interpretation of spectroscopic data and facilitate direct comparison between studies. Continued advances in heating-stage instrumentation, chemometric analysis and machine-learning approaches are also expected to enhance the application of vibrational spectroscopy to ceramic manufacture, supplementary cementitious materials and other high-temperature technologies.
The emerging field of thermal activation has revealed significant applications for calcined clays as sustainable supplementary cementitious materials (SCMs) in blended cements, where the understanding that optimal thermal treatment conditions must balance complete dehydroxylation against undesired recrystallization or sintering is now critical to material performance. Calcined kaolinitic clays used as SCMs must achieve temperatures where clay minerals are fully dehydroxylated but retain sufficient amorphous character for pozzolanic reactivity. Illite-dominated raw materials, by contrast, require substantially higher calcination temperatures (800–850 °C versus 500–800 °C for kaolinite) due to their extended dehydroxylation intervals, with the consequence that particle sintering and loss of specific surface area limit their SCM effectiveness unless firing conditions are carefully optimized.
Future advances in clay mineral thermal science will likely integrate modern spectroscopic approaches (IES, Raman, ATR-FTIR) with computational modeling (molecular dynamics, reactive force field simulations) to predict thermal behavior across diverse conditions, enabling optimization of thermal treatment for specific industrial applications and development of new technologies based on controlled thermal transformation of clay minerals. The coupling of high-resolution thermal analysis with evolved gas analysis and microstructural examination offers additional promise for understanding the kinetics and mechanisms of thermal decomposition. Furthermore, recognition that thermally induced transformations follow complex, sometimes non-linear pathways—such as the critical temperature phenomenon observed in smectite-to-illite transformation in shale systems—suggests that future work should emphasize integrated multi-method approaches combining kinetic modeling, spectroscopic observation, and microstructural analysis to fully elucidate the rich complexity of clay mineral thermal chemistry.
Particular opportunities exist for expanding the application of infrared emission spectroscopy to clay minerals that have received relatively little attention, including mixed-layer clay minerals, fibrous clay minerals and complex natural ceramic raw materials, where its ability to monitor structural transformations directly at elevated temperatures offers significant potential for advancing both fundamental understanding and industrial process optimization.

Funding

This research received no external funding.

Data Availability Statement

No new data were created or analyzed in this study.

Conflicts of Interest

The author declares no conflict of interest.

Abbreviations

The following abbreviations are used in this manuscript:
FTIRFourier transform infrared
IESInfrared emission spectroscopy
TGThermogravimetry
DTADifferential thermal analysis
DSCDifferential scanning calorimetry
XRDX-ray Diffraction
HT-XRDHigh-temperature X-ray diffraction
IRInfrared
ATR-FTIRAttenuated total reflection—Fourier transform infrared
VT-DRIFTSVariable-temperature diffuse reflectance infrared Fourier transform spectroscopy
TG-MSThermogravimetry–mass spectrometry
KASKissinger–Akahira–Sunose
FWOFlynn–Wall–Ozawa
vacvacancy
MASNMRMagic angle spinning nuclear magnetic resonance
SCMSupplementary cementitious material

Appendix A. Reference Clay Minerals Frequently Used in Spectroscopic Investigations

Most vibrational spectroscopic investigations reviewed in this article have been carried out using well-characterized reference clay minerals rather than natural clay assemblages. Such reference materials possess known mineralogical composition, chemical composition, layer charge, exchangeable cations and crystallinity, allowing spectral changes associated with dehydration, dehydroxylation and recrystallization to be interpreted with confidence. The most widely used natural reference materials are distributed through the Clay Minerals Society (CMS) Source Clays Repository, while additional reference minerals are available from geological collections, museum collections and well-characterized commercial deposits. Throughout this review, mineral names refer to these well-characterized reference materials unless explicitly stated otherwise in the original publications.
In addition to natural reference materials, synthetic clay minerals play an important role in vibrational spectroscopic investigations because they permit systematic control of chemical composition, layer charge and octahedral substitution. This approach has been particularly valuable for studies of trioctahedral smectites such as saponites and hectorites, as well as dioctahedral smectites including beidellites, where synthesis allows individual structural parameters to be varied independently. Detailed synthesis procedures for these minerals have been described elsewhere and provide highly reproducible reference materials for spectroscopic investigations [80,81,82,83].
Table A1. Commonly used reference clay minerals employed in vibrational spectroscopic investigations of thermally treated clay minerals.
Mineral GroupTypical Reference Material(s)Principal SourceCharacteristics/Comments
KaoliniteKGa-1b, KGa-2Clay Minerals Society (CMS) Source Clays RepositoryWell-crystallized reference kaolinites widely used for FTIR, Raman and IES investigations.
HalloysiteDragon Mine halloysiteCommercial deposits/museum collectionsFrequently used for studies of dehydration and dehydroxylation of tubular clay minerals.
MontmorilloniteSWy-2, SWy-3, STx-1bCMS Source Clays RepositoryStandard dioctahedral smectite reference materials differing in layer charge and exchangeable cations.
BeidelliteSBId-1 (natural); synthetic beidelliteCMS Source Clays Repository; laboratory synthesisNatural reference material available through CMS; synthetic beidellites permit systematic studies of layer charge and composition.
NontroniteNAu-1, NAu-2CMS Source Clays RepositoryFerruginous dioctahedral smectites extensively used for studies of Fe-related thermal transformations.
HectoriteSHCa-1; synthetic hectoriteCMS Source Clays Repository; laboratory synthesisTrioctahedral smectite commonly investigated as both natural and synthetic materials.
SaponiteSynthetic saponitesLaboratory synthesisWell-defined compositions allow systematic investigation of octahedral substitution and thermal behavior.
IlliteIMt-1, IMt-2CMS Source Clays RepositoryStandard illite reference materials representative of natural illitic clays.
Rectorite/mixed-layer claysRAr-1; natural rectoritesCMS Source Clays Repository; geological collectionsRegularly interstratified clay minerals widely used for studies of mixed-layer behavior during heating.
PalygorskiteGeorgia (USA), Spanish depositsGeological reference collectionsWell-characterized fibrous clay minerals widely used in spectroscopic investigations.
SepioliteVallecas and Vicálvaro (Spain)Geological reference collectionsReference fibrous clay minerals used extensively in thermal and spectroscopic studies.

References

  1. Bergaya, F.; Lagaly, G. Handbook of Clay Science; Elsevier: Amsterdam, The Netherlands, 2013; Volume 5, p. 1752. [Google Scholar]
  2. Grim, R.E. Clay Mineralogy, 2nd ed.; McGraw Hill: New York, NY, USA, 1968; p. 596. [Google Scholar]
  3. Murray, H.H. Applied Clay Mineralogy: Occurrences, Processing and Applications of Kaolins, Bentonites, Palygorskitesepiolite, and Common Clays; Elsevier Science: Amsterdam, The Netherlands, 2006; Volume 2. [Google Scholar]
  4. Scrivener, K.; Martirena, F.; Bishnoi, S.; Maity, S. Calcined clay limestone cements (LC3). Cem. Concr. Res. 2018, 114, 49–56. [Google Scholar] [CrossRef]
  5. Brown, G.W. Crystal Structures of Clay Minerals and Their X-Ray Identification; Mineralogical Society of Great Britain and Ireland: London, UK, 1980; p. 495. [Google Scholar]
  6. Mackenzie, R.C. Differential Thermal Analysis: Fundamental Aspects; Academic Press: London, UK, 1970; p. 775. [Google Scholar]
  7. Mackenzie, R.C. Differential Thermal Analysis: Applications; Academic Press: London, UK, 1972; p. 607. [Google Scholar]
  8. Smykatz-Kloss, W. Differential Thermal Analysis: Application and Results in Mineralogy; Springer: Berlin/Heidelberg, Germany, 1974. [Google Scholar]
  9. Wang, G.; Wang, H.; Zhang, N. In situ high temperature X-ray diffraction study of illite. Appl. Clay Sci. 2017, 146, 254–263. [Google Scholar] [CrossRef]
  10. Farmer, V.C. The Infrared Spectra of Minerals; Mineralogical Society of Great Britain and Ireland: London, UK, 1974; p. 539. [Google Scholar]
  11. Gates, W.; Kloprogge, J.T.; Madejova, J.; Bergaya, F. Infrared and Raman Spectroscopies of Clay Minerals; Elsevier: Amsterdam, The Netherlands, 2017; Volume 8, p. 620. [Google Scholar]
  12. Madejová, J. FTIR techniques in clay mineral studies. Vib. Spectrosc. 2003, 31, 1–10. [Google Scholar] [CrossRef]
  13. Madejová, J.; Komadel, P. Baseline studies of the clay minerals society source clays: Infrared methods. Clays Clay Miner. 2001, 49, 410–432. [Google Scholar] [CrossRef]
  14. Madejová, J.; Gates, W.P.; Petit, S. Chapter 5—IR Spectra of Clay Minerals. In Developments in Clay Science; Gates, W.P., Kloprogge, J.T., Madejová, J., Bergaya, F., Eds.; Elsevier: Amsterdam, The Netherlands, 2017; Volume 8, pp. 107–149. [Google Scholar]
  15. Frost, R.L.; Kloprogge, J.T. Vibrational spectroscopy of ferruginous smectite and nontronite. Spectrochim. Acta Part A Mol. Biomol. Spectrosc. 2000, 56, 2177–2189. [Google Scholar] [CrossRef] [PubMed]
  16. Kloprogge, J.T.; Frost, R.L. Infrared emission spectroscopy study of the dehydroxylation of 10 Å halloysite from a Neogene cryptokarst of South Belgium. Geol. Belg. 1999, 2, 213–220. [Google Scholar] [CrossRef]
  17. Kloprogge, J.T.; Frost, R.L. Infrared emission spectroscopic study of the dehydroxylation of some natural and synthetic saponites. Neues Jahrb. Mineral. Monatshefte 2001, 446–463. [Google Scholar]
  18. Kloprogge, J.T.; Frost, R.L.; Hickey, L. Infrared emission spectroscopic study of the dehydroxylation of some hectorites. Thermochim. Acta 2000, 345, 145–156. [Google Scholar] [CrossRef]
  19. Wang, Q.; Zhou, Y.; Ma, Z.; Chen, Y.; Yan, S.; Liu, C.; Zhang, J. Laser Raman Spectroscopic Characteristics of Low-temperature Heated Illite. Rock Miner. Anal. 2007, 26, 188–192. [Google Scholar]
  20. Frost, R.L.; Kloprogge, T.J. Chapter 6—Heating Stage Spectroscopy: Infrared, Raman, Energy Dispersive X-Ray and X-Ray Photoelectron Spectroscopy. In Handbook of Thermal Analysis and Calorimetry; Brown, M.E., Gallagher, P.K., Eds.; Elsevier Science B.V.: Amsterdam, The Netherlands, 2008; Volume 5, pp. 171–208. [Google Scholar]
  21. Kloprogge, J.T.; Frost, R.L. Infrared Emission Spectroscopy of Clay Minerals. In The Application of Vibrational Spectroscopy to Clay Minerals and Layered Double Hydroxides; Clay Minerals Society: Duluth, VA, USA, 2005; Volume 13, pp. 99–124. [Google Scholar]
  22. Msinjili, N.S.; Gluth, G.J.G.; Sturm, P.; Vogler, N.; Kühne, H.-C. Comparison of calcined illitic clays (brick clays) and low-grade kaolinitic clays as supplementary cementitious materials. Mater. Struct. 2019, 52, 94. [Google Scholar] [CrossRef]
  23. Raj, A. A Review on the Thermal Behavior and Dehydroxylation Characteristics of Kaolin. i-Manag. J. Phys. Sci. 2025, 4, 1–35. [Google Scholar] [CrossRef]
  24. Hefney, S.; Awotoye, D.T.; Fairley, N.; Laskin, A.; Baltrusaitis, J. In Situ ATR-FTIR Nonisothermal Kinetic Analysis of Struvite–Dittmarite Thermal Transformation. ACS Earth Space Chem. 2026, 10, 815–828. [Google Scholar] [CrossRef] [PubMed]
  25. Zheng, M.; Kebukawa, Y.; Hayashi, Y.; Kobayashi, K. Kinetic analysis of dehydration/dehydroxylation from carbonaceous chondrites by in situ heating experiments under an infrared microscope. Meteorit. Planet. Sci. 2024, 59, 2981–2997. [Google Scholar] [CrossRef]
  26. King, P.L.; Mernagh, T.P. A review of infrared and Raman spectroscopy in the geosciences. In Treatise on Geochemistry, 3rd ed.; Anbar, A., Weis, D., Eds.; Elsevier: Oxford, UK, 2025; pp. 723–787. [Google Scholar]
  27. Izadifar, M.; Thissen, P.; Steudel, A.; Kleeberg, R.; Kaufhold, S.; Kaltenbach, J.; Schuhmann, R.; Dehn, F.; Emmerich, K. Comprehensive Examination of Dehydroxylation of Kaolinite, Disordered Kaolinite, and Dickite: Experimental Studies and Density Functional Theory. Clays Clay Miner. 2020, 68, 319–333. [Google Scholar] [CrossRef]
  28. Frost, R.L.; Kloprogge, J.T. Raman spectroscopy of kaolinite hydroxyls between 25 °C and 500 °C. J. Raman Spectrosc. 2000, 31, 415–420. [Google Scholar] [CrossRef]
  29. Frost, R.L.; Vassallo, A.M. The Dehydroxylation of the Kaolinite Clay Minerals using Infrared Emission Spectroscopy. Clays Clay Miner. 1996, 44, 635–651. [Google Scholar] [CrossRef]
  30. MacKenzie, K.J.D. A simple high-temperature infrared cell and its application to the dehydroxylation of kaolinite. J. Appl. Chem. Biotechn. 2007, 23, 903–908. [Google Scholar]
  31. Frost, R.L.; Vassallo, A.M. Fourier-transform Infrared Emission Spectroscopy of Kaolinite Dehydroxylation. In Proceedings of the Progress in Fourier Transform Spectroscopy, Vienna, Austria, 10–14 August 1997; pp. 789–791. [Google Scholar]
  32. Vassallo, A.M.; Cole-Clarke, P.A.; Pang, L.S.K.; Palmisano, A.J. Infrared Emission Spectroscopy of Coal Minerals and Their Thermal Transformations. J. Appl. Spectros. 1992, 46, 73–78. [Google Scholar] [CrossRef]
  33. Cheng, H.; Frost, R.L.; Yang, J.; Liu, Q.; He, J. Infrared and infrared emission spectroscopic study of typical Chinese kaolinite and halloysite. Spectrochim. Acta Part A Mol. Biomol. Spectrosc. 2010, 77, 1014–1020. [Google Scholar] [CrossRef] [PubMed]
  34. Shoval, S.; Boudeulle, M.; Yariv, S.; Lapides, I.; Panczer, G. Micro-Raman and FT-IR spectroscopy study of the thermal transformations of St. Claire dickite. Opt. Mater. 2001, 16, 319–327. [Google Scholar] [CrossRef]
  35. Shoval, S.; Michaelian, K.H.; Boudeulle, M.; Panczer, G.; Lapides, I.; Yariv, S. Study of thermally treated dickite by infrared and micro-Raman spectroscopy using curve-fitting technique. J. Therm. Anal. Calorim. 2002, 69, 205–225. [Google Scholar] [CrossRef]
  36. Che, C.; Glotch, T.D.; Bish, D.L.; Michalski, J.R.; Xu, W. Spectroscopic study of the dehydration and/or dehydroxylation of phyllosilicate and zeolite minerals. J. Geophys. Res.-Planets 2011, 116, E05003. [Google Scholar] [CrossRef]
  37. Fotsop, C.G.; Lieb, A.; Scheffler, F. Elucidation of the thermo-kinetics of the thermal decomposition of cameroonian kaolin: Mechanism, thermodynamic study and identification of its by-products. RSC Adv. 2025, 15, 32172–32187. [Google Scholar] [CrossRef] [PubMed]
  38. Siranidi, E.; Hillier, S.; Chryssikos, G.D. Structure of tubular halloysite-(10 Å) and its transition to halloysite-(7 Å) by infrared spectroscopy and X-ray diffraction. Clays Clay Miner. 2024, 72, e33. [Google Scholar] [CrossRef]
  39. Li, Y.; Zhang, Y.; Zhang, Y.; Liu, M.; Zhang, F.; Wang, L. Thermal behavior analysis of halloysite selected from Inner Mongolia Autonomous Region in China. J. Therm. Anal. Calorim. 2017, 129, 1333–1339. [Google Scholar] [CrossRef]
  40. Abotaleb, A.; Gladich, I.; Mroue, K.; Abounahia, N.; Alkhateeb, A.; Al-Shammari, A.; Tong, Y.; Al-Masri, D.; Sinopoli, A. Impact of thermal treatment on halloysite nanotubes: A combined experimental-computational approach. Heliyon 2024, 10, e39952. [Google Scholar] [CrossRef] [PubMed]
  41. Aytekin, M.T.; Hoşgün, H.L. Characterization studies of heat-treated halloysite nanotubes. Chem. Pap. 2020, 74, 4547–4557. [Google Scholar] [CrossRef]
  42. Auzende, A.L.; Daniel, I.; Reynard, B.; Lemaire, C.; Guyot, F. High-pressure behaviour of serpentine minerals: A Raman spectroscopic study. Phys. Chem. Miner. 2004, 31, 269–277. [Google Scholar] [CrossRef]
  43. Wicks, F.J.; O’Hanley, D.S. Serpentine minerals; structures and petrology. In Reviews in Mineralogy and Geochemistry; Mineralogical Society of America: Chantilly, VA, USA, 1988; Volume 19, pp. 91–167. [Google Scholar]
  44. Giacobbe, C.; Gualtieri, A.F.; Quartieri, S.; Rinaudo, C.; Allegrina, M.; Andreozzi, G.B. Spectroscopic study of the product of thermal transformation of chrysotile-asbestos containing materials (ACM). Eur. J. Mineral. 2010, 22, 535–546. [Google Scholar] [CrossRef]
  45. Roh, Y. Characterization of Mineralogical Changes of Chrysotile and its Thermal Decomposition by Heat Treatment. Econ. Environ. Geol. 2016, 49, 77–88. [Google Scholar] [CrossRef]
  46. Trittschack, R.; Grobéty, B. The dehydroxylation of chrysotile: A combined in situ micro-Raman and micro-FTIR study. Am. Mineral. 2013, 98, 1133–1145. [Google Scholar] [CrossRef][Green Version]
  47. Trittschack, R.; Grobéty, B.; Koch-Müller, M. In situ high-temperature Raman and FTIR spectroscopy of the phase transformation of lizardite. Am. Mineral. 2012, 97, 1965–1976. [Google Scholar] [CrossRef]
  48. Liang, S.; Liu, Y.; Mei, S. In Situ Study on Dehydration and Phase Transformation of Antigorite. Minerals 2022, 12, 567. [Google Scholar] [CrossRef]
  49. Schwartz, S.; Guillot, S.; Reynard, B.; Lafay, R.; Debret, B.; Nicollet, C.; Lanari, P.; Auzende, A.L. Pressure–temperature estimates of the lizardite/antigorite transition in high pressure serpentinites. Lithos 2013, 178, 197–210. [Google Scholar] [CrossRef]
  50. Kloprogge, J.T.; Mahmutagic, E.; Frost, R.L. Mid-infrared and infrared emission spectroscopy of Cu-exchanged montmorillonite. J. Colloid Interf. Sci. 2006, 296, 640–646. [Google Scholar] [CrossRef] [PubMed]
  51. Derkowski, A.; Kuligiewicz, A. Thermal Analysis and Thermal Reactions of Smectites: A Review of Methodology, Mechanisms, and Kinetics. Clays Clay Miner. 2022, 70, 946–972. [Google Scholar] [CrossRef]
  52. Bala, P.; Samantaray, B.K.; Srivastava, S.K. Dehydration transformation in Ca-montmorillonite. Bull. Mater. Sci. 2000, 23, 61–67. [Google Scholar] [CrossRef]
  53. Russell, J.D.; Farmer, V.C. Infra-red spectroscopic study of the dehydration of montmorillonite and saponite. Clay Miner. Bull. 1964, 5, 443–464. [Google Scholar] [CrossRef]
  54. Ogloza, A.A.; Malhotra, V.M. Dehydroxylation induced structural transformations in montmorillonite: An isothermal FTIR study. Phys. Chem. Miner. 1989, 16, 378–385. [Google Scholar] [CrossRef]
  55. Emmerich, K.; Madsen, F.T.; Kahr, G. Dehydroxylation Behavior of Heat-Treated and Steam-Treated Homoionic cis-Vacant Montmorillonites. Clays Clay Miner. 1999, 47, 591–604. [Google Scholar] [CrossRef]
  56. Malhotra, V.M.; Ogloza, A.A. FTIR spectra of hydroxyls and dehydroxylation kinetics mechanism in montmorillonite. Phys. Chem. Miner. 1989, 16, 386–393. [Google Scholar] [CrossRef]
  57. Li, K.-W.; Lu, H.-L.; Nkoh Nkoh, J.; Xu, R.-K. Effect of high-temperature dehydroxylation on acidification-induced aluminum activation in montmorillonite. J. Soils Sediments 2023, 23, 2473–2481. [Google Scholar] [CrossRef]
  58. Vallina, D.; Rodríguez-Ruiz, M.D.; Santacruz, I.; Cuesta, A.; Aranda, M.A.G.; De la Torre, A.G. Supplementary cementitious material based on calcined montmorillonite standards. Constr. Build. Mater. 2024, 426, 136193. [Google Scholar] [CrossRef]
  59. Gao, P.; Zhang, Y.; Liu, X.; Lu, X. Mechanistic understanding of the dehydroxylation reaction of smectites: Insights from reactive force field (ReaxFF) molecular dynamics simulation. Am. Mineral. 2025, 110, 748–756. [Google Scholar] [CrossRef]
  60. Karzhaubayeva, A.; Beisebekov, M.; Shaimardan, E.; Nauryzova, S.; Kabdrakhmanova, S. Thermally modified bentonite clay as a water-retaining material for soils. Soil Sci. Agrochem. 2025, 4, 82–95. [Google Scholar] [CrossRef]
  61. Kloprogge, J.T.; Komarneni, S.; Yanagisawa, K.; Fry, R.; Frost, R.L. Infrared emission spectroscopic study of the dehydroxylation via surface silanol groups of synthetic and natural beidellite. J. Colloid Interf. Sci. 1999, 212, 562–569. [Google Scholar] [CrossRef]
  62. Green, J.M.; Mackenzie, K.J.D.; Sharp, J.H. Thermal Reactions of Synthetic Hectorite. Clays Clay Miner. 1970, 18, 339–346. [Google Scholar] [CrossRef]
  63. Mandair, A.-P.S.; Michael, P.J.; McWhinnie, W.R. 29Si MASNMR investigations of the thermochemistry of laponite and hectorite. Polyhedron 1990, 9, 517–525. [Google Scholar] [CrossRef]
  64. Friedlander, L.R.; Glotch, T.D.; Bish, D.L.; Dyar, M.D.; Sharp, T.G.; Sklute, E.C.; Michalski, J.R. Structural and spectroscopic changes to natural nontronite induced by experimental impacts between 10 and 40  GPa. J. Geophys. Res.-Planets 2015, 120, 888–912. [Google Scholar] [CrossRef]
  65. Kloprogge, J.T.; Hartman, H. Clays and the Origin of Life: The Experiments. Life 2022, 12, 259. [Google Scholar] [CrossRef] [PubMed]
  66. Kądziołka-Gaweł, M.; Klimontko, J.; Wojtyniak, M. High temperature transformation of Fe-bearing minerals in bentonite–Mössbauer spectroscopy studies. In Proceedings of the 31st International Conference on Metallurgy and Materials, Brno, Czech Republic, 18–19 May 2022; pp. 66–71. [Google Scholar]
  67. Kaljuvee, T.; Štubňa, I.; Húlan, T.; Uibu, M.; Einard, M.; Traksmaa, R.; Viljus, M.; Jefimova, J.; Trikkel, A. Thermal Behavior of Ceramic Bodies Based on Estonian Clay from the Arumetsa Deposit with Oil Shale Ash and Clinker Dust Additives. Processes 2022, 10, 46. [Google Scholar] [CrossRef]
  68. Araújo, J.H.d.; Silva, N.F.d.; Acchar, W.; Gomes, U.U. Thermal decomposition of illite. Mater. Res. 2004, 7, 359–361. [Google Scholar] [CrossRef]
  69. Cheng, H.; Yang, J.; Frost, R.L.; Wu, Z. Infrared transmission and emission spectroscopic study of selected Chinese palygorskites. Spectrochim. Acta Part A Mol. Biomol. Spectrosc. 2011, 83, 518–524. [Google Scholar] [CrossRef] [PubMed]
  70. Frost, R.L.; Cash, G.A.; Kloprogge, J.T. ‘Rocky Mountain leather’, sepiolite and attapulgite—An infrared emission spectroscopic study. Vib. Spectrosc. 1998, 16, 173–184. [Google Scholar] [CrossRef]
  71. Gonzalez, F.; Pesquera, C.; Blanco, C.; Benito, I.; Mendioroz, S.; Pajares, J.A. Structural and textural evolution under thermal treatment of natural and acid-activated Al-rich and Mg-rich palygorskites. Appl. Clay Sci. 1990, 5, 23–36. [Google Scholar] [CrossRef]
  72. Yan, W.; Liu, D.; Tan, D.; Yuan, P.; Chen, M. FTIR spectroscopy study of the structure changes of palygorskite under heating. Spectrochim. Acta Part A Mol. Biomol. Spectrosc. 2012, 97, 1052–1057. [Google Scholar] [CrossRef] [PubMed]
  73. Meunier, A. Clays; Springer: Berlin/Heidelberg, Germany, 2005. [Google Scholar]
  74. Kloprogge, J.T.; Frost, R.L. Study of the thermal behaviour of rectorite by in-situ infrared emission spectroscopy. Neues Jahrb. Mineral. Monatshefte 2000, 4, 145–157. [Google Scholar] [CrossRef]
  75. Russell, J.D.; White, J.L. Infrared Study of the Thermal Decomposition of Ammonium Rectorite. Clays Clay Miner. 1966, 14, 181–191. [Google Scholar] [CrossRef]
  76. Kloprogge, J.T.; Frost, R.L.; Hickey, L. Infrared absorption and emission study of synthetic mica-montmorillonite in comparison to rectorite, beidellite and paragonite. J. Mater. Sci. Lett. 1999, 18, 1921–1923. [Google Scholar] [CrossRef]
  77. Xie, W.; Wang, J.; Fu, L.; Tan, Q.; Tan, X.; Yang, H. Evolution of the crystallographic structure and physicochemical aspects of rectorite upon calcination. Appl. Clay Sci. 2020, 185, 105374. [Google Scholar] [CrossRef]
  78. Gu, X.; Ling, Y. Characterization and properties of Chinese red clay for use as ceramic and construction materials. Sci. Prog. 2024, 107, 00368504241232534. [Google Scholar] [CrossRef] [PubMed]
  79. Avram, S.E.; Birle, B.V.; Cosma, C.; Tudoran, L.B.; Moldovan, M.; Cuc, S.; Borodi, G.; Petean, I. Ecological Building Material Obtained Through the Moderate Thermal Consolidation of Ceramic Slurry Collected from Industrial Waste Waters. Materials 2025, 18, 1715. [Google Scholar] [CrossRef] [PubMed]
  80. Kloprogge, J.T.; van der Eerden, A.M.J.; Jansen, J.B.H.; Geus, J.W. Hydrothermal synthesis of Na-beidellite. Neth. J. Geosci. 1990, 69, 351–357. [Google Scholar]
  81. Vogels, R.J.M.J.; Kloprogge, J.T.; Geus, J.W. Synthesis and characterization of saponite clays. Am. Mineral. 2005, 90, 931–944. [Google Scholar] [CrossRef]
  82. Kloprogge, J.T.; Breukelaar, J.; Geus, J.W.; Jansen, J.B.H. Characterization of Mg-saponites synthesized from gels containing amounts of Na+, K+, Rb+, Ca2+, Ba2+, or Ce4+ equivalent to the CEC of the saponite. Clays Clay Miner. 1994, 42, 18–22. [Google Scholar] [CrossRef]
  83. Zhang, J.; Zhou, C.H.; Petit, S.; Zhang, H. Hectorite: Synthesis, modification, assembly and applications. Appl. Clay Sci. 2019, 177, 114–138. [Google Scholar] [CrossRef]
Figure 1. Schematic representation of the infrared emission spectroscopy (IES) system used for in situ investigation of thermal transformations in clay minerals. Infrared radiation emitted from a heated sample on a platinum hotplate is collected by an off-axis paraboloidal mirror and directed into a Fourier-transform infrared spectrometer for spectral analysis.
Ceramics 09 00074 g001
Figure 2. Schematic representation of heating-stage Raman spectroscopy for in situ investigation of thermal transformations in clay minerals. (A) Principle of heating-stage Raman spectroscopy showing laser excitation, Raman scattering and spectral acquisition. (B) Experimental configuration consisting of a Raman microscope equipped with a long-working-distance objective and a temperature-controlled heating stage. (C) Example of the thermal evolution of the hydroxyl-stretching region in kaolinite-group minerals, illustrating progressive dehydroxylation, structural disordering and high-temperature phase development during heating.
Ceramics 09 00074 g002
Figure 3. Thermal evolution of kaolinite during dehydroxylation as monitored by infrared emission spectroscopy (IES). (A) Evolution of the hydroxyl-stretching region showing progressive loss of inner and inner-surface Al–OH bands and formation of a transient silanol (Si–OH) band near 3720–3725 cm−1. (B) Schematic representation of hydroxyl migration from the octahedral layer to edge siloxane sites during dehydroxylation. (C) Conceptual intensity–temperature relationships for hydroxyl bands and extent of dehydroxylation, illustrating the transition from ordered kaolinite to metakaolinite.
Ceramics 09 00074 g003
Figure 4. Thermal evolution of the hydroxyl-stretching region in beidellite as monitored by infrared emission spectroscopy. During dehydroxylation, Al–OH stretching bands decrease in intensity while a transient silanol (Si–OH) band develops near 3715 cm−1, indicating hydroxyl migration from the octahedral layer to edge siloxane sites prior to complete dehydroxylation.
Ceramics 09 00074 g004
Figure 5. Structural evolution and vibrational spectroscopic changes in trioctahedral smectites during thermal treatment, illustrated using saponite and hectorite as representative examples. (A) Schematic representation of the 2:1 (TOT) layer structure of trioctahedral smectites, showing the expanded interlayer region containing exchangeable cations and interlayer water. The layer charge originates predominantly from tetrahedral Al3+ → Si4+ substitution in saponite and octahedral Li+ → Mg2+ substitution in hectorite. (B) Schematic model of the thermal evolution of trioctahedral smectites during heating: (1) dehydration and loss of interlayer water below ~200 °C, (2) progressive collapse of the interlayer region between 200 and 500 °C, (3) dehydroxylation and formation of Si–OH groups between 500 and 750 °C, and (4) advanced structural reorganization above 750 °C. (C) Representative IES spectral changes observed for hectorite and saponite during heating. Characteristic OH-stretching bands decrease in intensity and eventually disappear as dehydroxylation proceeds, while changes in the low-wavenumber region reflect structural modifications associated with dehydration, dehydroxylation and subsequent recrystallization processes.
Ceramics 09 00074 g005
Figure 6. Conceptual model of dehydroxylation pathways derived from infrared emission spectroscopy (IES) studies of smectites. Dioctahedral smectites (nontronite, beidellite and montmorillonite) undergo hydroxyl transfer to the siloxane sheet with formation of transient silanol groups prior to extensive dehydroxylation and structural collapse. Trioctahedral smectites (saponite and hectorite) exhibit preferential loss of Mg2AlOH or MgLiOH groups, while Mg3OH groups persist to substantially higher temperatures, resulting in incomplete dehydroxylation at 750 °C.
Ceramics 09 00074 g006
Figure 7. Thermal evolution of illite during heating as monitored by Raman spectroscopy. Spectra collected at room temperature, 450 °C and 700 °C illustrate progressive dehydroxylation, loss of structural hydroxyl groups and reorganization of the aluminosilicate framework. At elevated temperature, the development of mullite is indicated by the appearance of characteristic Raman bands and the accompanying schematic representation of mullite needles formed during ceramic firing.
Ceramics 09 00074 g007
Figure 8. Thermal evolution of palygorskite and sepiolite as monitored by infrared emission spectroscopy (IES), FTIR and Raman spectroscopy. Progressive loss of channel water, coordinated water and structural hydroxyl groups is accompanied by systematic changes in hydroxyl-stretching and hydroxyl-bending vibrations, framework distortion and eventual structural collapse during progressive heating. Characteristic band assignments and representative wavenumber positions are indicated.
Ceramics 09 00074 g008
Figure 9. Thermal evolution of rectorite monitored by infrared emission spectroscopy (IES). (A) Schematic representation of the 1:1 interstratified structure consisting of alternating non-expandable paragonite layers and expandable beidellite layers containing interlayer water and exchangeable cations. (B) Structural evolution during heating, showing progressive dehydration (200–500 °C), dehydroxylation (500–650 °C) and thermal transformation at temperatures above 650 °C. (C) Evolution of the infrared emission spectra with increasing temperature. Dehydration is marked by the loss of interlayer water, whereas dehydroxylation results in a progressive decrease in the M–OH stretching bands and the appearance of a weak Si–OH band associated with transient silanol formation. The Si–O stretching vibration near 1030 cm−1 remains the dominant framework band throughout thermal treatment, while the Al–OH bending and libration bands between 926 and 750 cm−1 progressively decrease in intensity and ultimately disappear as dehydroxylation proceeds.
Ceramics 09 00074 g009
Table 1. Comparative capabilities of FTIR, Raman spectroscopy and infrared emission spectroscopy (IES) for studying thermal transformations of clay minerals.
FeatureFTIRRaman SpectroscopyIES
Measurement conditionsUsually ex situ at room temperature; in situ measurements require a heating accessoryEx situ or in situ using a heating stageDirect measurement from the sample at elevated temperature
OH-stretching vibrationsExcellent sensitivityVery good, depending on mineral symmetry and Raman activityExcellent at moderate and high temperatures
Interlayer waterExcellent sensitivity to stretching and bending modesGenerally weakGood for directly following water loss during heating, although low-temperature spectra may have poorer signal-to-noise
OH deformation modesExcellentOften weak or absentVery good where emission intensity is sufficient
Silicate-framework vibrationsExcellentExcellent, particularly for symmetric modesVery good, although strong bands may be affected by self-absorption in thick samples
Sensitivity to structural disorderGood, through band broadening and shiftsExcellent sensitivity to local order, symmetry and crystalline phase developmentGood for following temperature-dependent band broadening, shifts and disappearance
Detection of dehydrationExcellentModerateVery good for in situ monitoring, but sensitivity is lower at the lowest temperatures
Detection of dehydroxylationExcellentExcellentExcellent for following the process directly at temperature
Detection of transient intermediate speciesGood if sufficiently stable for measurementGood where Raman-active bands are presentExcellent for transient species formed during heating
Detection of recrystallization productsGood, but overlapping bands may limit phase discriminationExcellent for identifying newly formed crystalline phasesGood; phase assignments generally benefit from Raman or XRD confirmation
Monitoring reaction kineticsLimited in conventional ex situ measurements; good with temperature-resolved accessoriesGood with a heating stageVery good, provided suitable temperature intervals and acquisition times are used
Sample preparationUsually simple; transmission measurements may require dilution or pellet preparationMinimal preparation in many casesThin, homogeneous layers are required to minimize self-absorption, reflectance effects and temperature gradients
Spatial resolutionGenerally bulk measurement; microscopy is possibleExcellent with Raman microscopyNormally bulk measurement over the heated sample area
Instrument availabilityWidely availableWidely availableLimited; requires specialized emission and heating-stage instrumentation
Principal strengthsHigh sensitivity to water, hydroxyl groups and silicate vibrationsStrong phase specificity, high spatial resolution and sensitivity to crystallinity and symmetryDirect in situ observation at elevated temperature without quenching or rehydration artifacts
Principal limitationsAtmospheric and adsorbed water may interfere; ex situ measurements can miss transient structuresFluorescence, possible laser heating, and weak response for some water and OH deformation modesPoorer signal-to-noise at low temperatures; specialized instrumentation; strict sample-thickness requirements; phase identification often requires complementary methods
Best suited applicationRoutine identification and characterization of hydroxyl groups, water and silicate structuresIdentification of crystalline phases, structural order and recrystallization productsIn situ monitoring of dehydration, dehydroxylation and thermal transformation pathways
Table 3. Comparison of the thermal transformations of representative smectites observed by vibrational spectroscopy.
PropertyMontmorilloniteBeidelliteNontroniteSaponiteHectorite
Smectite typeDioctahedralDioctahedralDioctahedral (Fe-rich)TrioctahedralTrioctahedral
Dominant octahedral cationAlAlFe3+MgMg–Li
Layer charge originMainly octahedralMainly tetrahedralMainly octahedralMainly tetrahedralMainly octahedral
Interlayer cationsNa, CaNa, CaNaNa, CaNa
Initial dehydration<200 °C<200 °C<200 °C<200 °C<200 °C
Dehydroxylation~500–750 °C~500–750 °C~400–650 °C~650–850 °C~600–800 °C
FTIR diagnostic observationsProgressive loss of interlayer H2O bands followed by disappearance of Al–OH bandsSimilar to montmorillonite with tetrahedral substitution effectsLoss of Fe–OH vibrations and formation of iron oxide phasesLoss of Mg–OH bandsLoss of Mg3OH/LiMg2OH bands
Raman diagnostic observationsBroadening and disappearance of OH bands; framework reorganizationSimilar behaviorMarked changes in Fe–O vibrationsProgressive disappearance of Mg–OH bandsSimilar to saponite
IES diagnostic observationsContinuous monitoring of dehydration and dehydroxylation; OH emission decreases with heatingSimilar behaviorSensitive to Fe-related structural changesClear monitoring of trioctahedral OH lossSimilar to saponite
Structural collapseProgressiveProgressiveProgressiveProgressiveProgressive
Major recrystallization productsSpinel-type phases, mullite/cristobalite (composition dependent)Mullite/cristobaliteHematite, cristobalite and Fe-bearing silicatesEnstatite, forsterite, silica phasesEnstatite, cristobalite, silica phases
Distinguishing featureMost widely studied dioctahedral smectiteTetrahedral layer chargeIron-rich smectiteSynthetic analogs widely availableLi-bearing trioctahedral smectite
Representative references[11,12,50][12,61][15][17][18]
Footnote: Transition temperatures are approximate and vary with chemical composition, layer charge, exchangeable cations, crystallinity, heating rate and experimental atmosphere.
Disclaimer/Publisher’s Note: The statements, opinions and data contained in all publications are solely those of the individual author(s) and contributor(s) and not of MDPI and/or the editor(s). MDPI and/or the editor(s) disclaim responsibility for any injury to people or property resulting from any ideas, methods, instructions or products referred to in the content.