Article

Dry Machining of AISI 316 Steel Using Textured Ceramic Tool Inserts: Investigation of Surface Roughness and Chip Morphology

Department of Mechanical and Industrial Engineering Technology, University of Johannesburg, Doornfontein Campus, Johannesburg 2028, South Africa
*
Author to whom correspondence should be addressed.
Ceramics 2025, 8(3), 97; https://doi.org/10.3390/ceramics8030097 (registering DOI)
Submission received: 27 May 2025 / Revised: 15 July 2025 / Accepted: 21 July 2025 / Published: 31 July 2025

Abstract

Stainless steel is recognized for its excellent durability and anti-corrosion properties, which are essential qualities across various industrial applications. The machining of stainless steel, particularly under a dry environment to attain sustainability, poses several challenges. The poor heat conductivity and high ductility of stainless steel results in poor heat distribution, accelerating tool wear and problematic chip formation. To mitigate these challenges, the implementation of surface texturing has been identified as a beneficial strategy. This study investigates the impact of wave-type texturing patterns, developed on the flank surface of tungsten carbide ceramic tool inserts, on the machinability of AISI 316 stainless steel under dry cutting conditions. In this investigation, chip morphology and surface roughness were used as key indicators of machinability. Analysis of Variance (ANOVA) was conducted for chip thickness, chip thickness ratio, and surface roughness, while Taguchi mono-objective optimization was applied to chip thickness. The ANOVA results showed that linear models accounted for 71.92%, 83.13%, and 82.86% of the variability in chip thickness, chip thickness ratio, and surface roughness, respectively, indicating a strong fit to the experimental data. Microscopic analysis confirmed a substantial reduction in chip thickness, with a minimum observed value of 457.64 µm. The corresponding average surface roughness Ra value 1.645 µm represented the best finish across all experimental runs, highlighting the relationship between thinner chips and enhanced surface quality. In conclusion, wave textures on the cutting tool’s flank face have the potential to facilitate the dry machining of AISI 316 stainless steel to obtain favorable machinability.

Graphical Abstract

1. Introduction

Stainless steel AISI 316 with a high chromium and nickel presence provides remarkable corrosion resistance and contributes to its substantial strength, making it a reliable choice for applications for challenging environments, making commercial products, and biomedical applications [1]. This material undergoes extensive machining operations while being made into products. Machining is a key manufacturing process that converts an enormous quantity of components into their final shape, size, and geometry. These days, due to strict environmental regulations, all sectors of manufacturing including machining require giving special attention to sustainability, ensuring that operations and products are conducted with the interventions of techniques for reducing adverse impact on our environment [2]. Dry machining is increasingly being adopted in manufacturing as a sustainable alternative due to its positive environmental impact and significant cost savings by minimizing the need for harmful cutting fluids, minimizing hazardous waste and associated disposal costs, and significantly lowering emissions [3]. The process of cutting metal involves plastic deformation [4], which inherently generates substantial heat and stress. During dry machining operations, the absence of lubricants or cutting fluids can further increase the significant thermal and mechanical challenges. This increase in thermal energy and mechanical force within the cutting zone can adversely affect both tool and workpiece [5]. Specific to stainless steel, the unique challenges to its machining are as follows: (i) Stainless steel’s low thermal conductivity results in poor heat distribution during machining, which can lead to excessive tool wear [6,7]. (ii) Its high ductility can lead to increased friction and the formation of long, unbroken chips, which in turn can exert higher cutting forces on the machinery [8]. (iii) Moreover, the tendency of these chips to adhere together with the cutting tool might result in a high built-up edge, adversely affecting the finished surface’s integrity and leading to the chipping of the cutting tool [9]. These issues worsen without the application of any coolant in a dry cutting environment.
To overcome that, researchers have been searching for novel techniques that can be coupled with dry machining. Recently, surface texturing has emerged as one of such techniques for reducing adverse thermal effects by minimizing friction in the dry cutting operations [10]. This innovative technique involves creating patterns on the cutting tool’s surface (rake or flank) to alter the interaction conditions and reduce the frictional forces, and it is now feasible because of developments in micro-manufacturing processes. Earlier research found that using the textures on the tool’s surfaces leads to a considerable decrease in the frictional forces ranging from 13% to 26% [10]. In the machining process, extensive research is being conducted on rake-face patterned or textured cutting tools to evaluate their potential to enhance cutting performance by leveraging their intrinsic tribological benefits.
Bertolete et al. [11] investigated the machining potential of four straight-groove rake-face textured carbide inserts in a dry cutting environment. They modified the spacing between the grooves and also adjusted the distance from the cutting edge and found that frictional and machining forces were reduced by 40% and 20%, respectively, while surface quality improved significantly as compared to plain inserts while machining martensitic stainless steel. Ma et al. [12] performed a simulation study to examine the outcome of the micro-bump form and size parameters on the cutting tool’s rake surface used to machine mild steel grade AISI 1045 in a dry cutting condition. They concluded that the shape, size, and position of the texturing had a substantial impact on chip morphology and cutting force, and textured tools performed better than simple tools. Zhang et al. [13] improved the coating adhesiveness during the dry machining of additive-manufactured AISI-316L stainless steel by adding textures to the rake surface. This texturing led to an increase in the critical load of the coatings by 16 N (from 57 N to 73 N). Additionally, the use of rake-surface textured tools in dry machining resulted in lowering the cutting forces by 10–20%, decreasing the cutting temperature by 10–15%, and producing improved machined parts’ surface roughness at high cutting speeds in comparison to plain-coated tools. Meng et al. [14] evaluated the impact of textures on the rake face of coated carbide cutting inserts using the scratch testing and machining of AISI-316L stainless steel. They developed straight micro-textured rake surfaces and observed a 32.89% reduction in machining forces on average. Nagendra Prasad and Ismail [9] machined AISI 316 L stainless steel using positively textured cutting tools in a dry environment and found substantial enhancements in the tool lifespan, the surface quality of machined components, and the machining force reduction. Fernández-Lucio et al. [15] implemented a laser-textured groove on the cutting tool’s rake surface, and it was able to create chip breakers that effectively redirected chips away from the part, enhancing the machining process.
Fatima et al. [16] evaluated the results of two different texturing dimples and slot forms on the cutting tool’s rake face when milling EN19 alloy steel. They tested the performance of cutting forces and tool life at various cutting speeds and concluded that textured tools outperformed plain tools. Vasumathy and Meena [17] conducted a comprehensive study on austenitic stainless steel grade AISI 316 turning using cutting tools with rake-surface texturing, focusing on the impact of texture lay directions relative to chip flow. They discovered that all textured tools were more efficient than regular carbide tools, and that texturing parallel to the cutting edge outperformed other methods, leading to a 7% reduction in cutting forces and a substantial enhancement in chip shape and wear performance. Roushan and Chetan [18] investigated cutting performance under dry and cryogenic (liquid nitrogen) conditions using tools with hexagonal and sine wave textures on the rake face. These textured tools were compared to plain carbide tools in terms of cutting forces and tool wear. The results showed that texturing reduced chip adhesion and lowered cutting forces by approximately 15%. The use of liquid nitrogen further enhanced overall machining performance. In a related study, Roushan and Chetan [19] developed tungsten carbide cutting tools with various rake-face textures—discrete, continuous, and mixed—to evaluate their machining performance on PH 13-8 Mo stainless steel. The discrete textures included dimple and hexagonal patterns, while the continuous texture was a sine wave. These textures were fabricated in different sizes, with widths and diameters of 40, 80, and 120 μm. Among the configurations, the mixed texture demonstrated the best performance, significantly reducing both rake and flank wear. It also achieved a cutting force reduction of 24.8% at 40 μm, compared to 21.4% for the sine wave and 12% for the hexagonal texture.
The investigation into the textures on the cutting tool surfaces, particularly the rake face, has yielded significant insights into the improvement of machinability for difficult-to-cut materials like stainless steel. Researchers have found that texturing the rake surface can lead to substantial reductions in the machining and quality of the workpiece, which is especially beneficial under dry machining conditions. The improved performance is attributed to the textured surfaces. These textures modify the area of contact between the chips and the tool’s rake face, leading to reduced friction and the reduced generation of heat during cutting.
Moreover, the implementation of textures on the flank face has been investigated by a small number of researchers [20,21,22,23,24] and they obtained encouraging outcomes for machinability enhancement. Fatima and Mativenga [25] highlight the effectiveness of texturing on the flank face in enhancing the effectiveness of cutting tools during the turning of plain carbon steel grade AISI 4140; there was a notable reduction in the tooltip temperature and cutting forces by 12% and an 18% improvement in tool life. These findings underscore the potential benefits of surface texturing on cutting tools’ flank surface. In a study by Sugihara et al. [23], high-speed machining experiments were conducted on Inconel 718 using cubic boron nitride cutting inserts with textured flank faces, oriented both parallel and perpendicular to the cutting edges. The cutting experiments clearly exhibited that the micro-grooves formed on the flank surface effectively reduced cutting-edge chipping and significantly improved the lifespan of the CBN tools. Liu et al. [26] evaluated texturing orientation on the flank surface for the machining of green ceramics and revealed that flank-face texturing significantly reduces tool wear compared to plain-surface tools, and textured grooves parallel to the main cutting edge show better wear performance than other textured orientations. The research of Rajbongshi and Sarma [22] highlights the benefits of using flank-face textured tools over plain inserts in the dry machining of steel grade AISI-D2, with a focus on the improved flank wear resistance and surface finish quality. They compared the dotted and grooved texturing on the flank surface of the tools and revealed that the dotted texturing performed better. Sun et al. [24] explored the effects of a micro-texture fabricated on the flank face of an Al2O3 ceramic cutting tool, aligned parallel to the cutting edge. Their study focused on the phenomenon of derivative cutting and its impact on surface integrity during machining; they found that derivative cutting occurred at cutting speeds between 90 and 270 m/min, leading to notable improvements in surface quality.
These findings have indicated that the flank surface of a cutting tool is a key area to focus on, since it significantly impacts the machined surface quality and longevity of the tool. Texturing the flank surface of cutting tools offers a promising approach for improving their tribological performance and offers substantial benefits that can lead to cost and environmental benefits in machining difficult-to-cut materials. The past studies have also indicated that various parameters such as shape, size, and distribution can influence the effectiveness of the texturing performance.
The present study aims to explore the impact of wave texturing patterns on the chip morphology and on the machinability of stainless steel grade AISI 316 alloy under a dry cutting environment. One of the key machinability indicators, i.e., chip morphology, has been considered. The novelty of this work lies in its focused analysis of chip thickness within chip morphology, a critical but under-explored aspect in flank-face texturing for machining stainless steel. The chip thickness provides insight into the extent of material deformation during cutting and is closely linked to surface quality. Chip thickness is indeed a pivotal aspect of machining processes, as it directly affects the surface roughness of the machined workpiece, the wear performance of the cutting tool, and the overall efficiency of the operation.
This knowledge is instrumental in optimizing machining parameters, i.e., cutting speed, feed rate, and depth of cut, to enhance machined surface quality and overall machining performance.

2. Experimental Details

The machining performance of flank-face wave textures on carbide inserts was examined in the present study during the dry machining of stainless steel grade AISI 316. Figure 1 represents the setup for the experiment, apparatus, and materials, along with an outline of the methods applied in the present study.
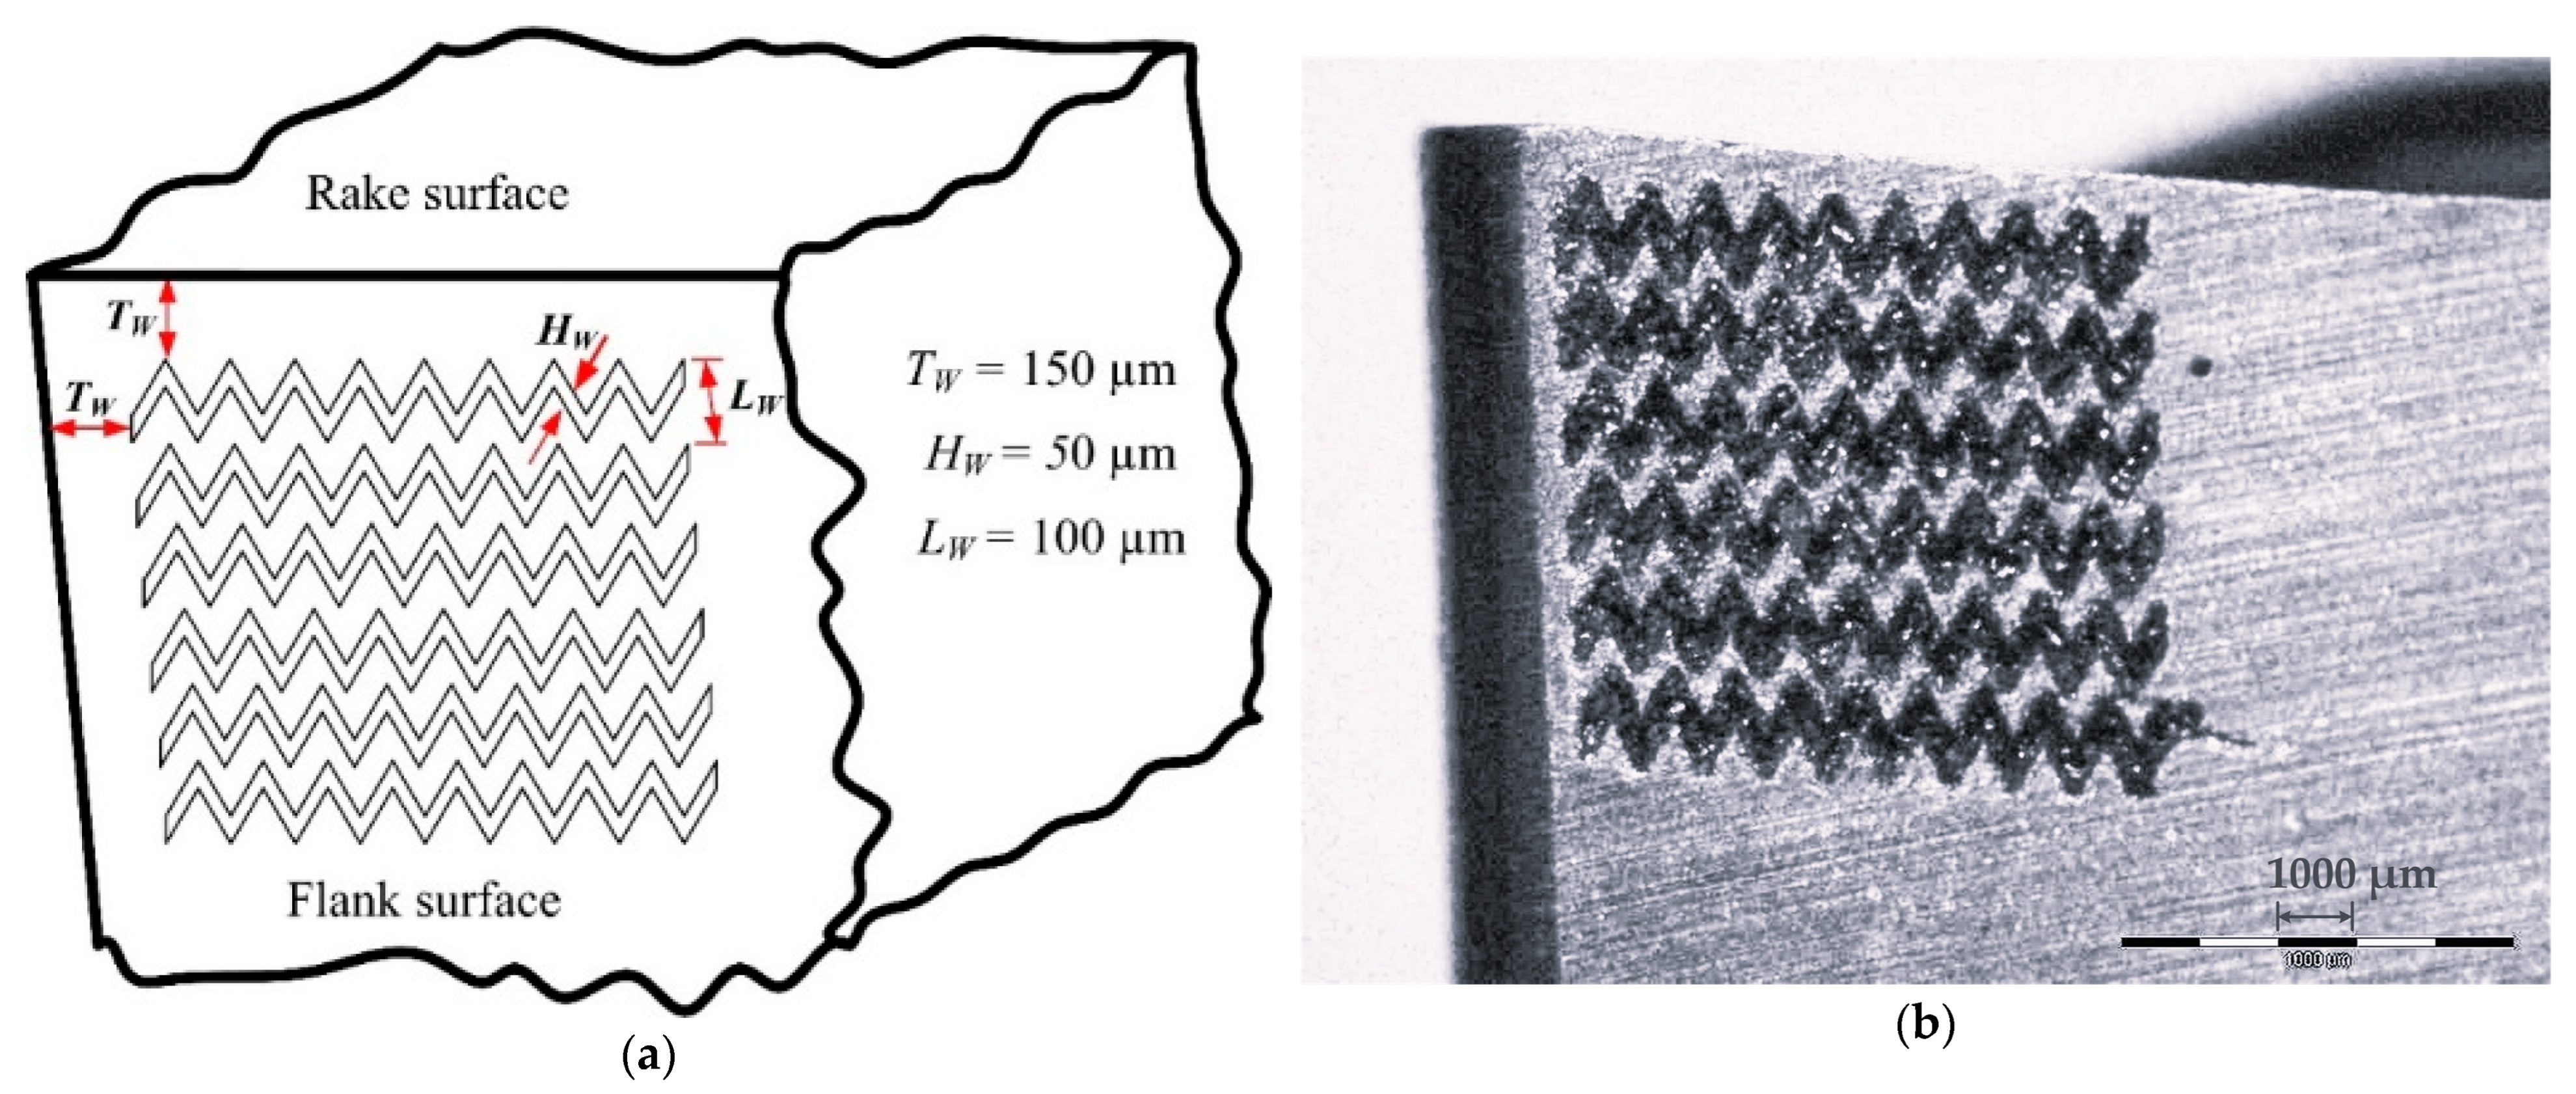
The vital cutting parameters, cutting speed (vc), feed rate (fr), and depth of cut (dc), each with three levels, are used as input parameters in the present turning experiments. Table 1 details the cutting conditions including workpiece material, cutting tool and tool holder, cutting parameter levels, and other relevant information such as machine tools, performance characteristics, and measuring equipment. The range of cutting parameters and turning times has been chosen based upon the cutting insert supplier’s recommendations, machine tool considerations, literature recommendations [1,7], and preliminary experiments. The wave texturing was produced on the flank surface of the cutting inserts using the SLT-Q905 model solid-state laser (Nd-YAG) machine from Lee Laser Machine, Orlando, FL, USA. The textures were engraved onto a square side section measuring 2.5 mm on the flank surface of the inserts, with a clearance (Tw) of 150 µm near the nose radius. The wave texture used a 50 µm wide wave pattern with 100 µm spacing between waves, and the engraving depth of the waves was 50 µm. A pulse frequency of 3 kHz, a laser power of 3 W, and a scanning speed of 100 mm/s were employed to generate texture patterns on the tools’ flank surfaces. Figure 2 summarizes the dimensions, design elements, and actual profiles of the wave patterns employed in this study. A fresh cutting edge for the inserts was used for every experiment.

3. Results and Discussion

In the current investigation, turning tests were performed on a stainless steel AISI 316 round bar workpiece with flank-face wave-textured cutting tool inserts. The chip details were measured and analyzed using microscopic images, and the surface roughness (Ra) was measured using the surface tester. The Ra was measured after each experimental run using a TMR200 Surface Roughness Tester, Beijing China. The tester was calibrated prior to taking the readings using a master sample provided along with the tester to ensure accurate surface roughness measurements. To ensure the accuracy and reliability of the results, each experiment was performed twice, and the corresponding readings were recorded each time. The results are summarized in Table 2 and discussed in the subsequent sections.
The chip thickness ratios reported in Table 2 were determined by dividing the uncut chip thickness by the corresponding final chip thickness.
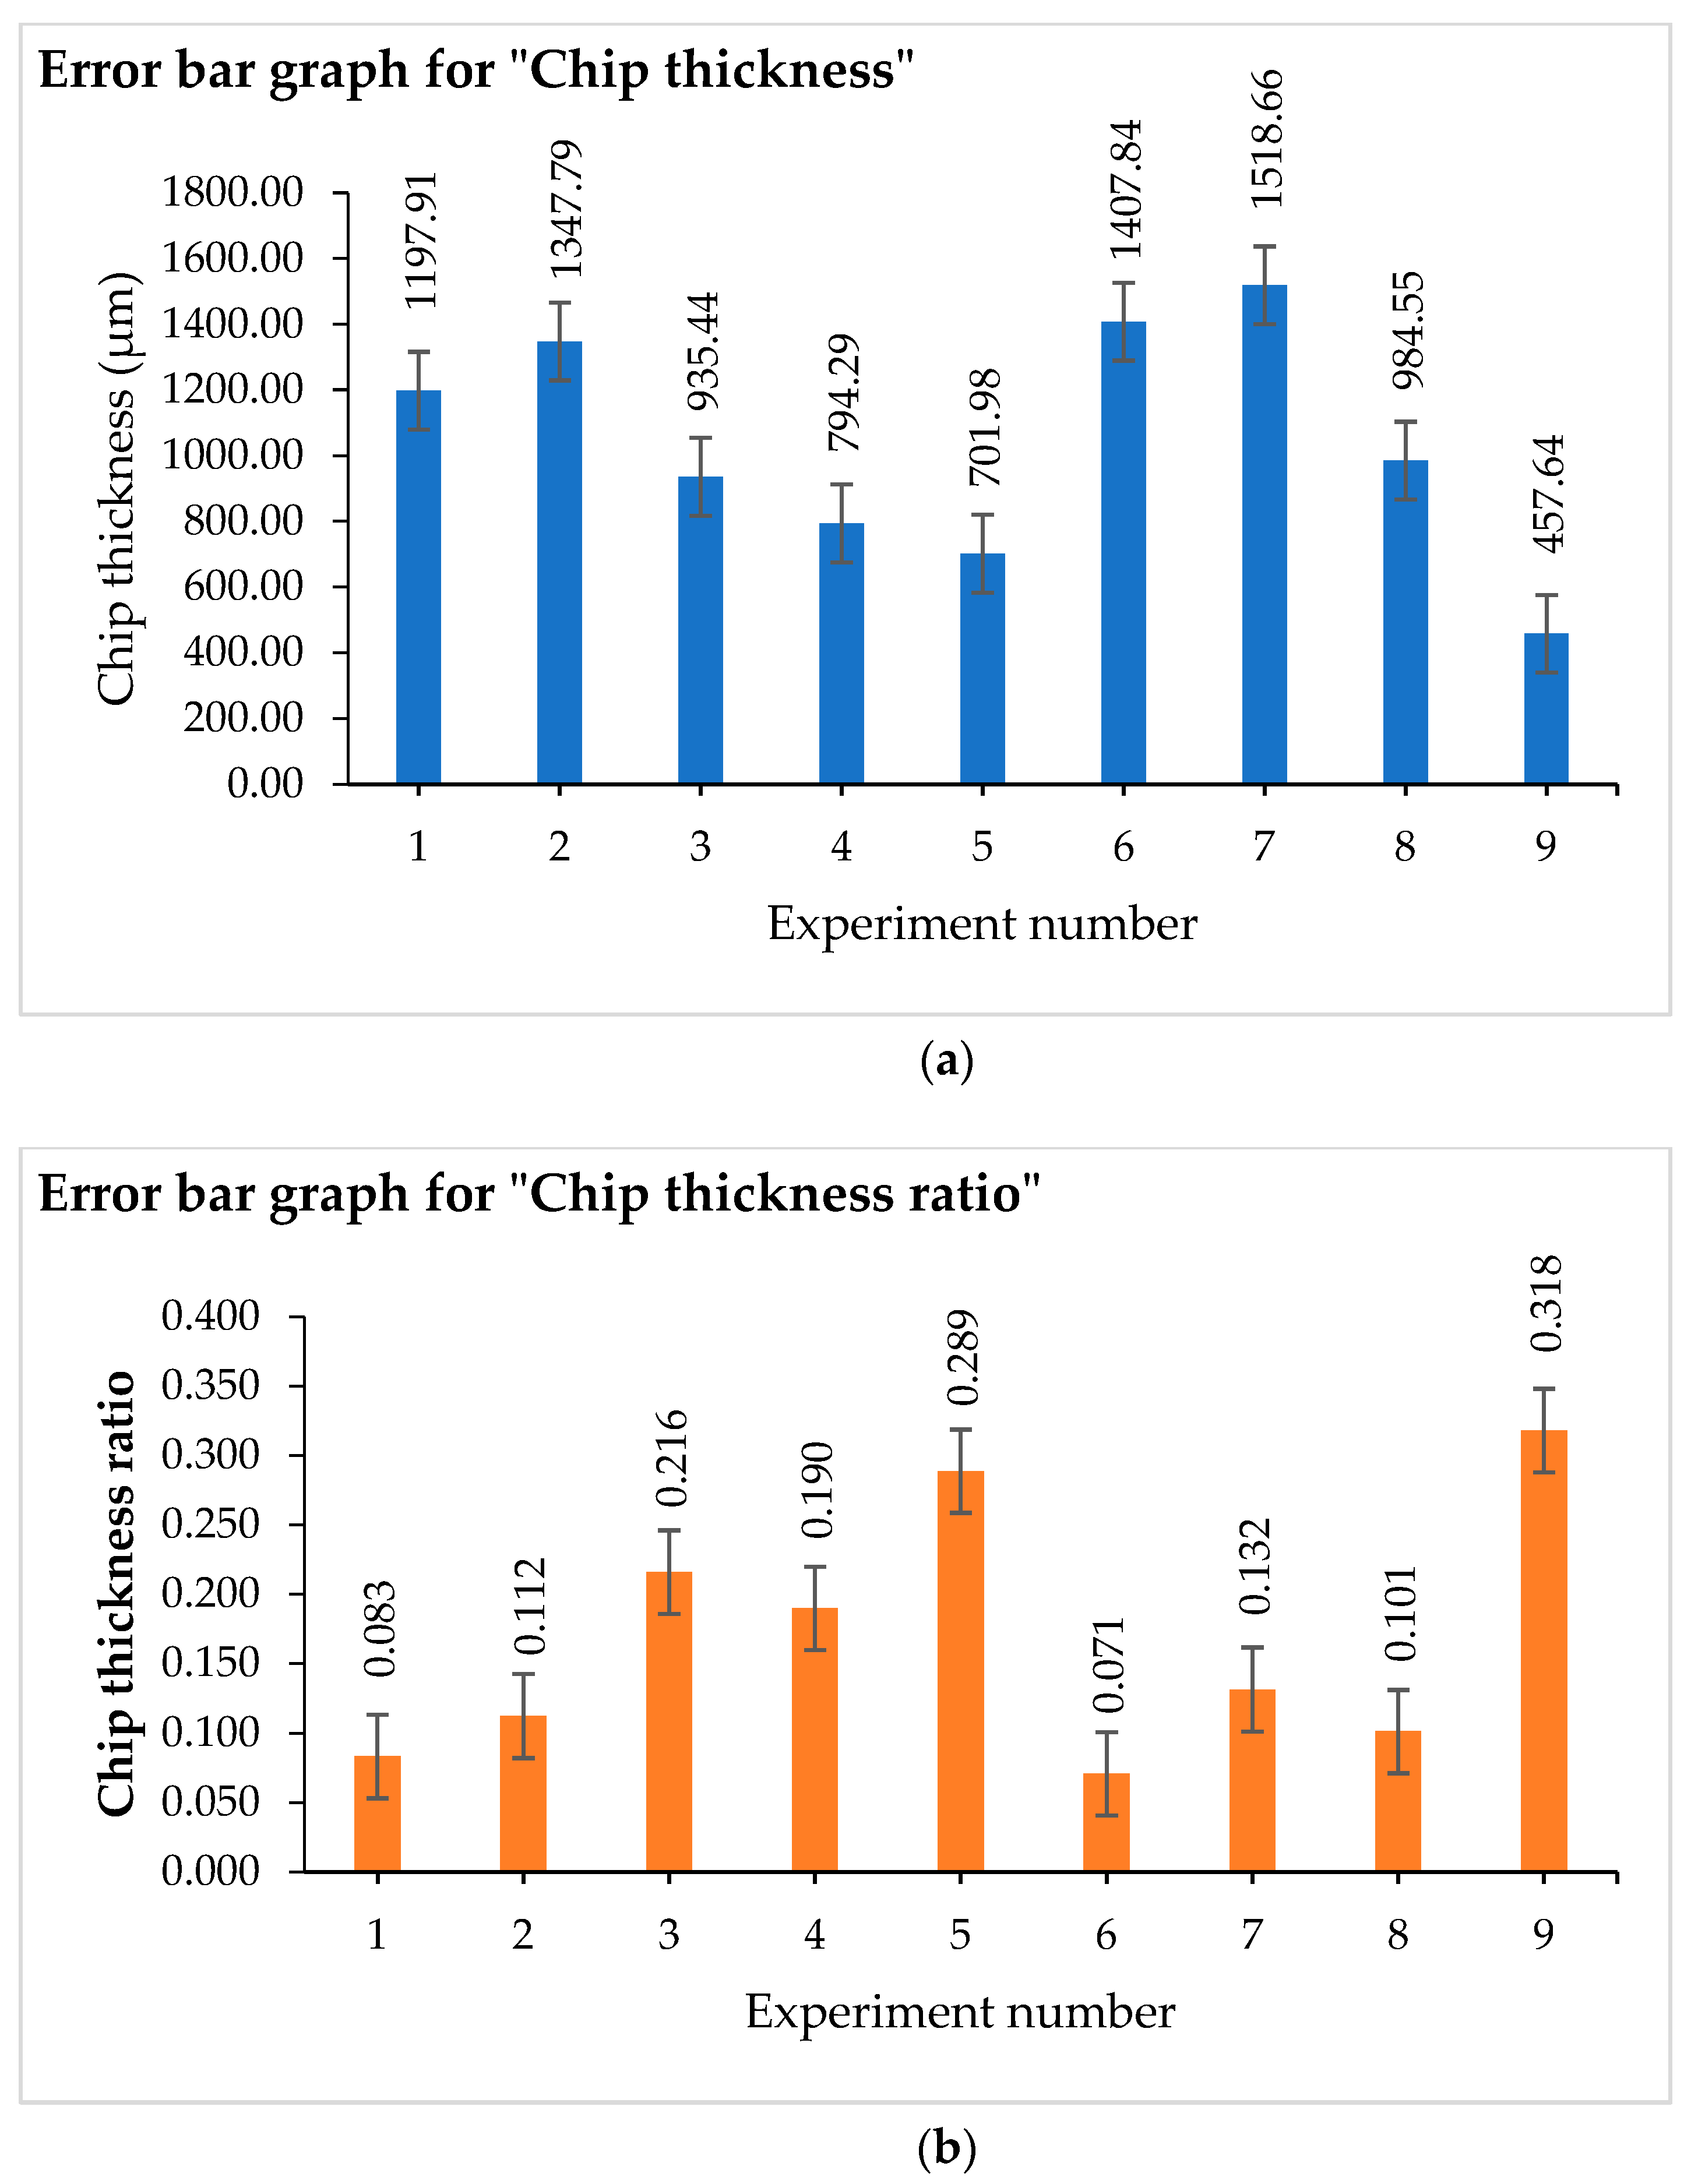
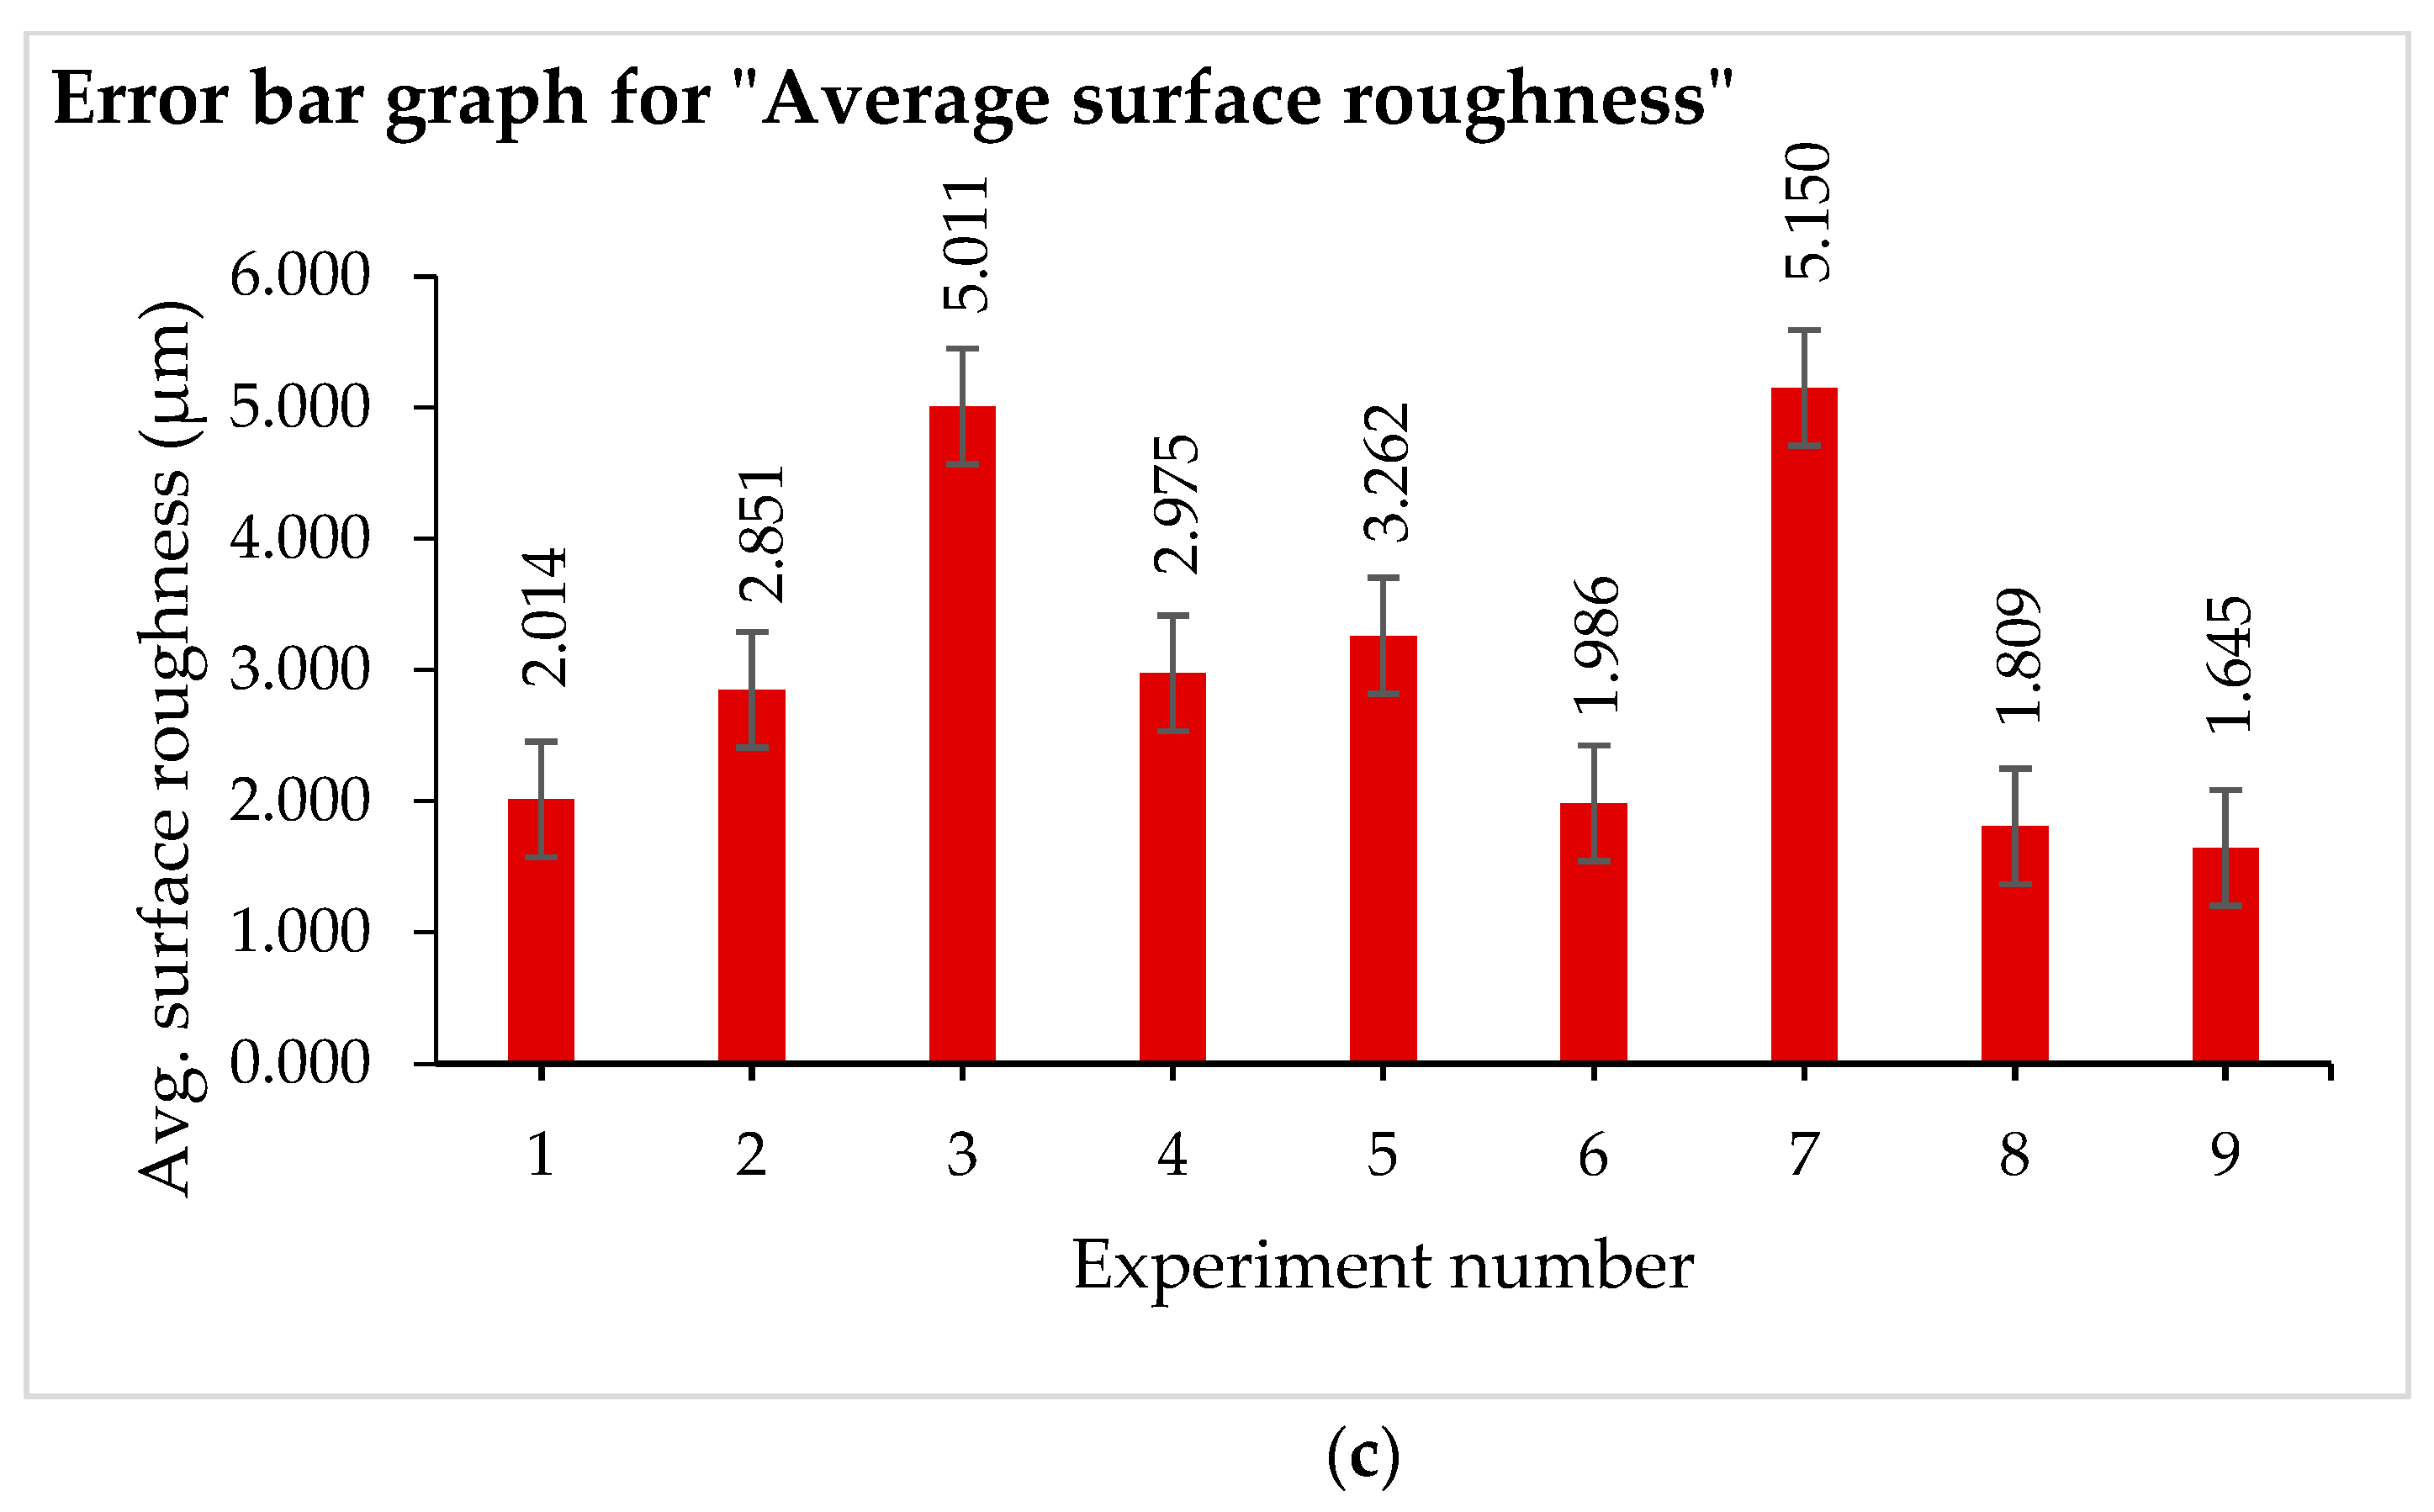
Figure 3 illustrates the average values obtained from the first and second replications for all experimental runs, including chip thickness, chip thickness ratio, and surface roughness. Standard error bars are included to reflect the variability in the data, with the “I”-shaped symbols above each bar representing the standard error for the corresponding run. The numerical values displayed above each bar indicate the average chip thickness, chip thickness ratio, and surface roughness, as shown in Figure 3a, Figure 3b, and Figure 3c, respectively.
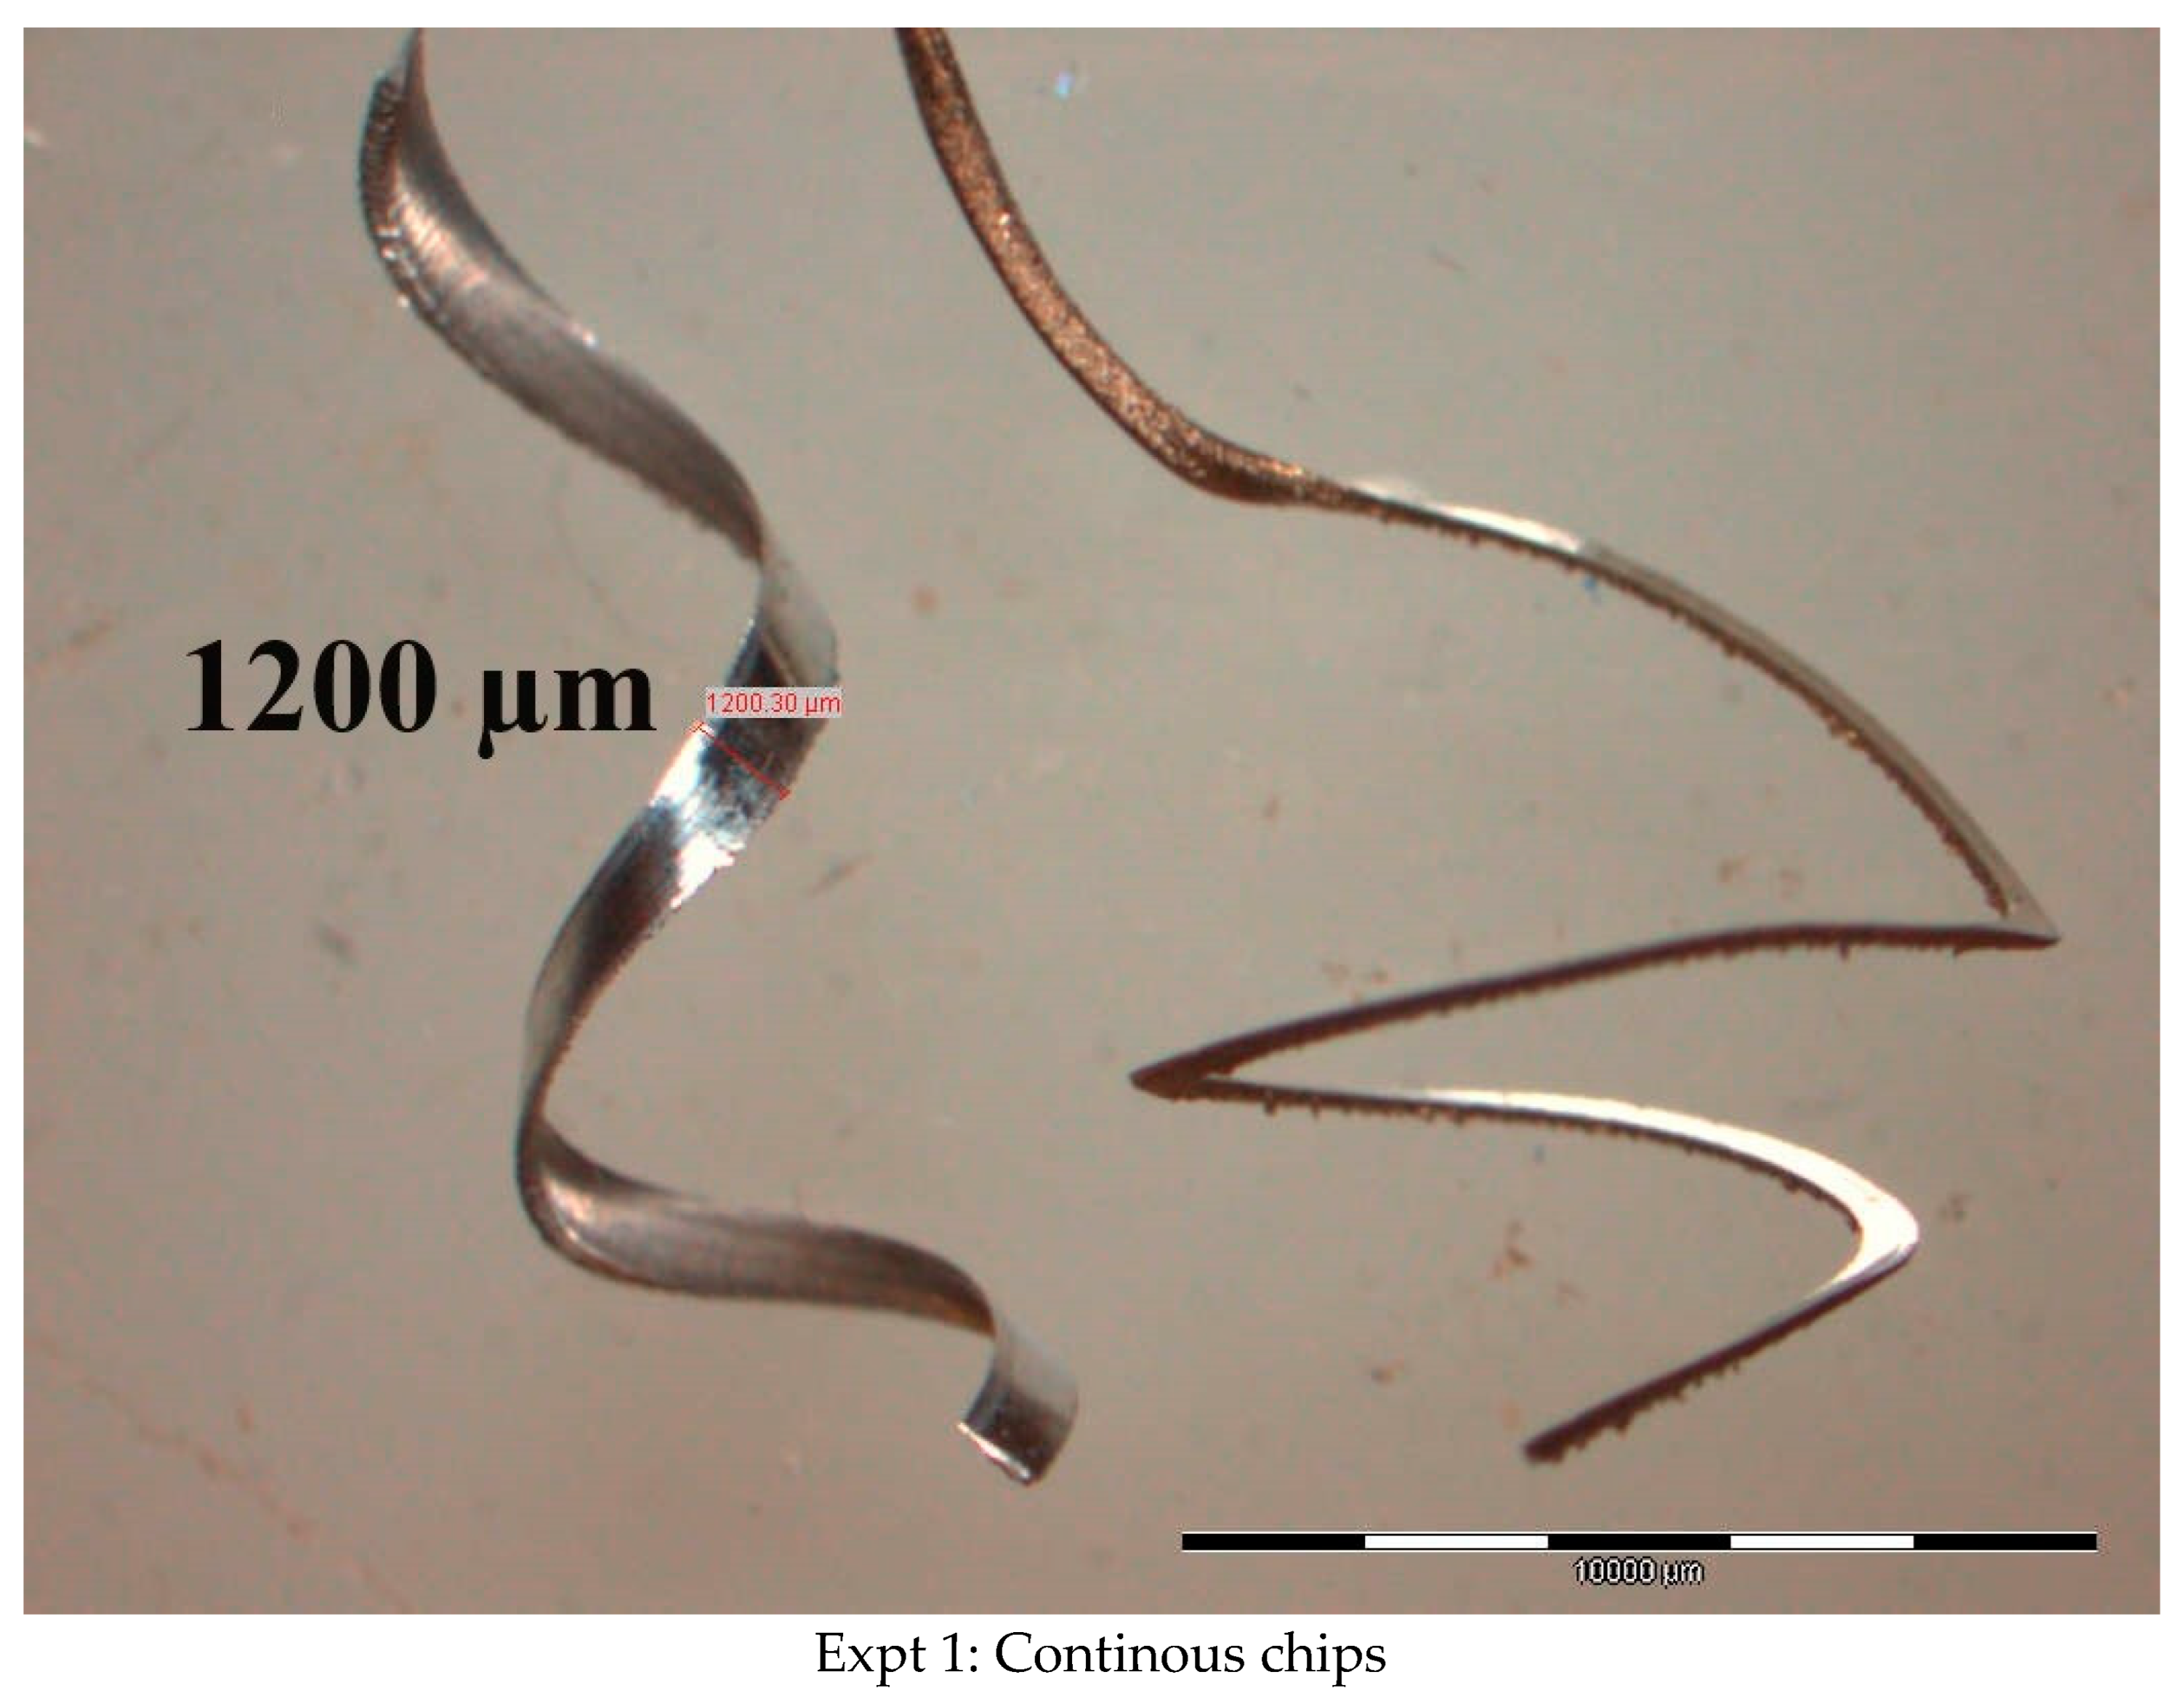
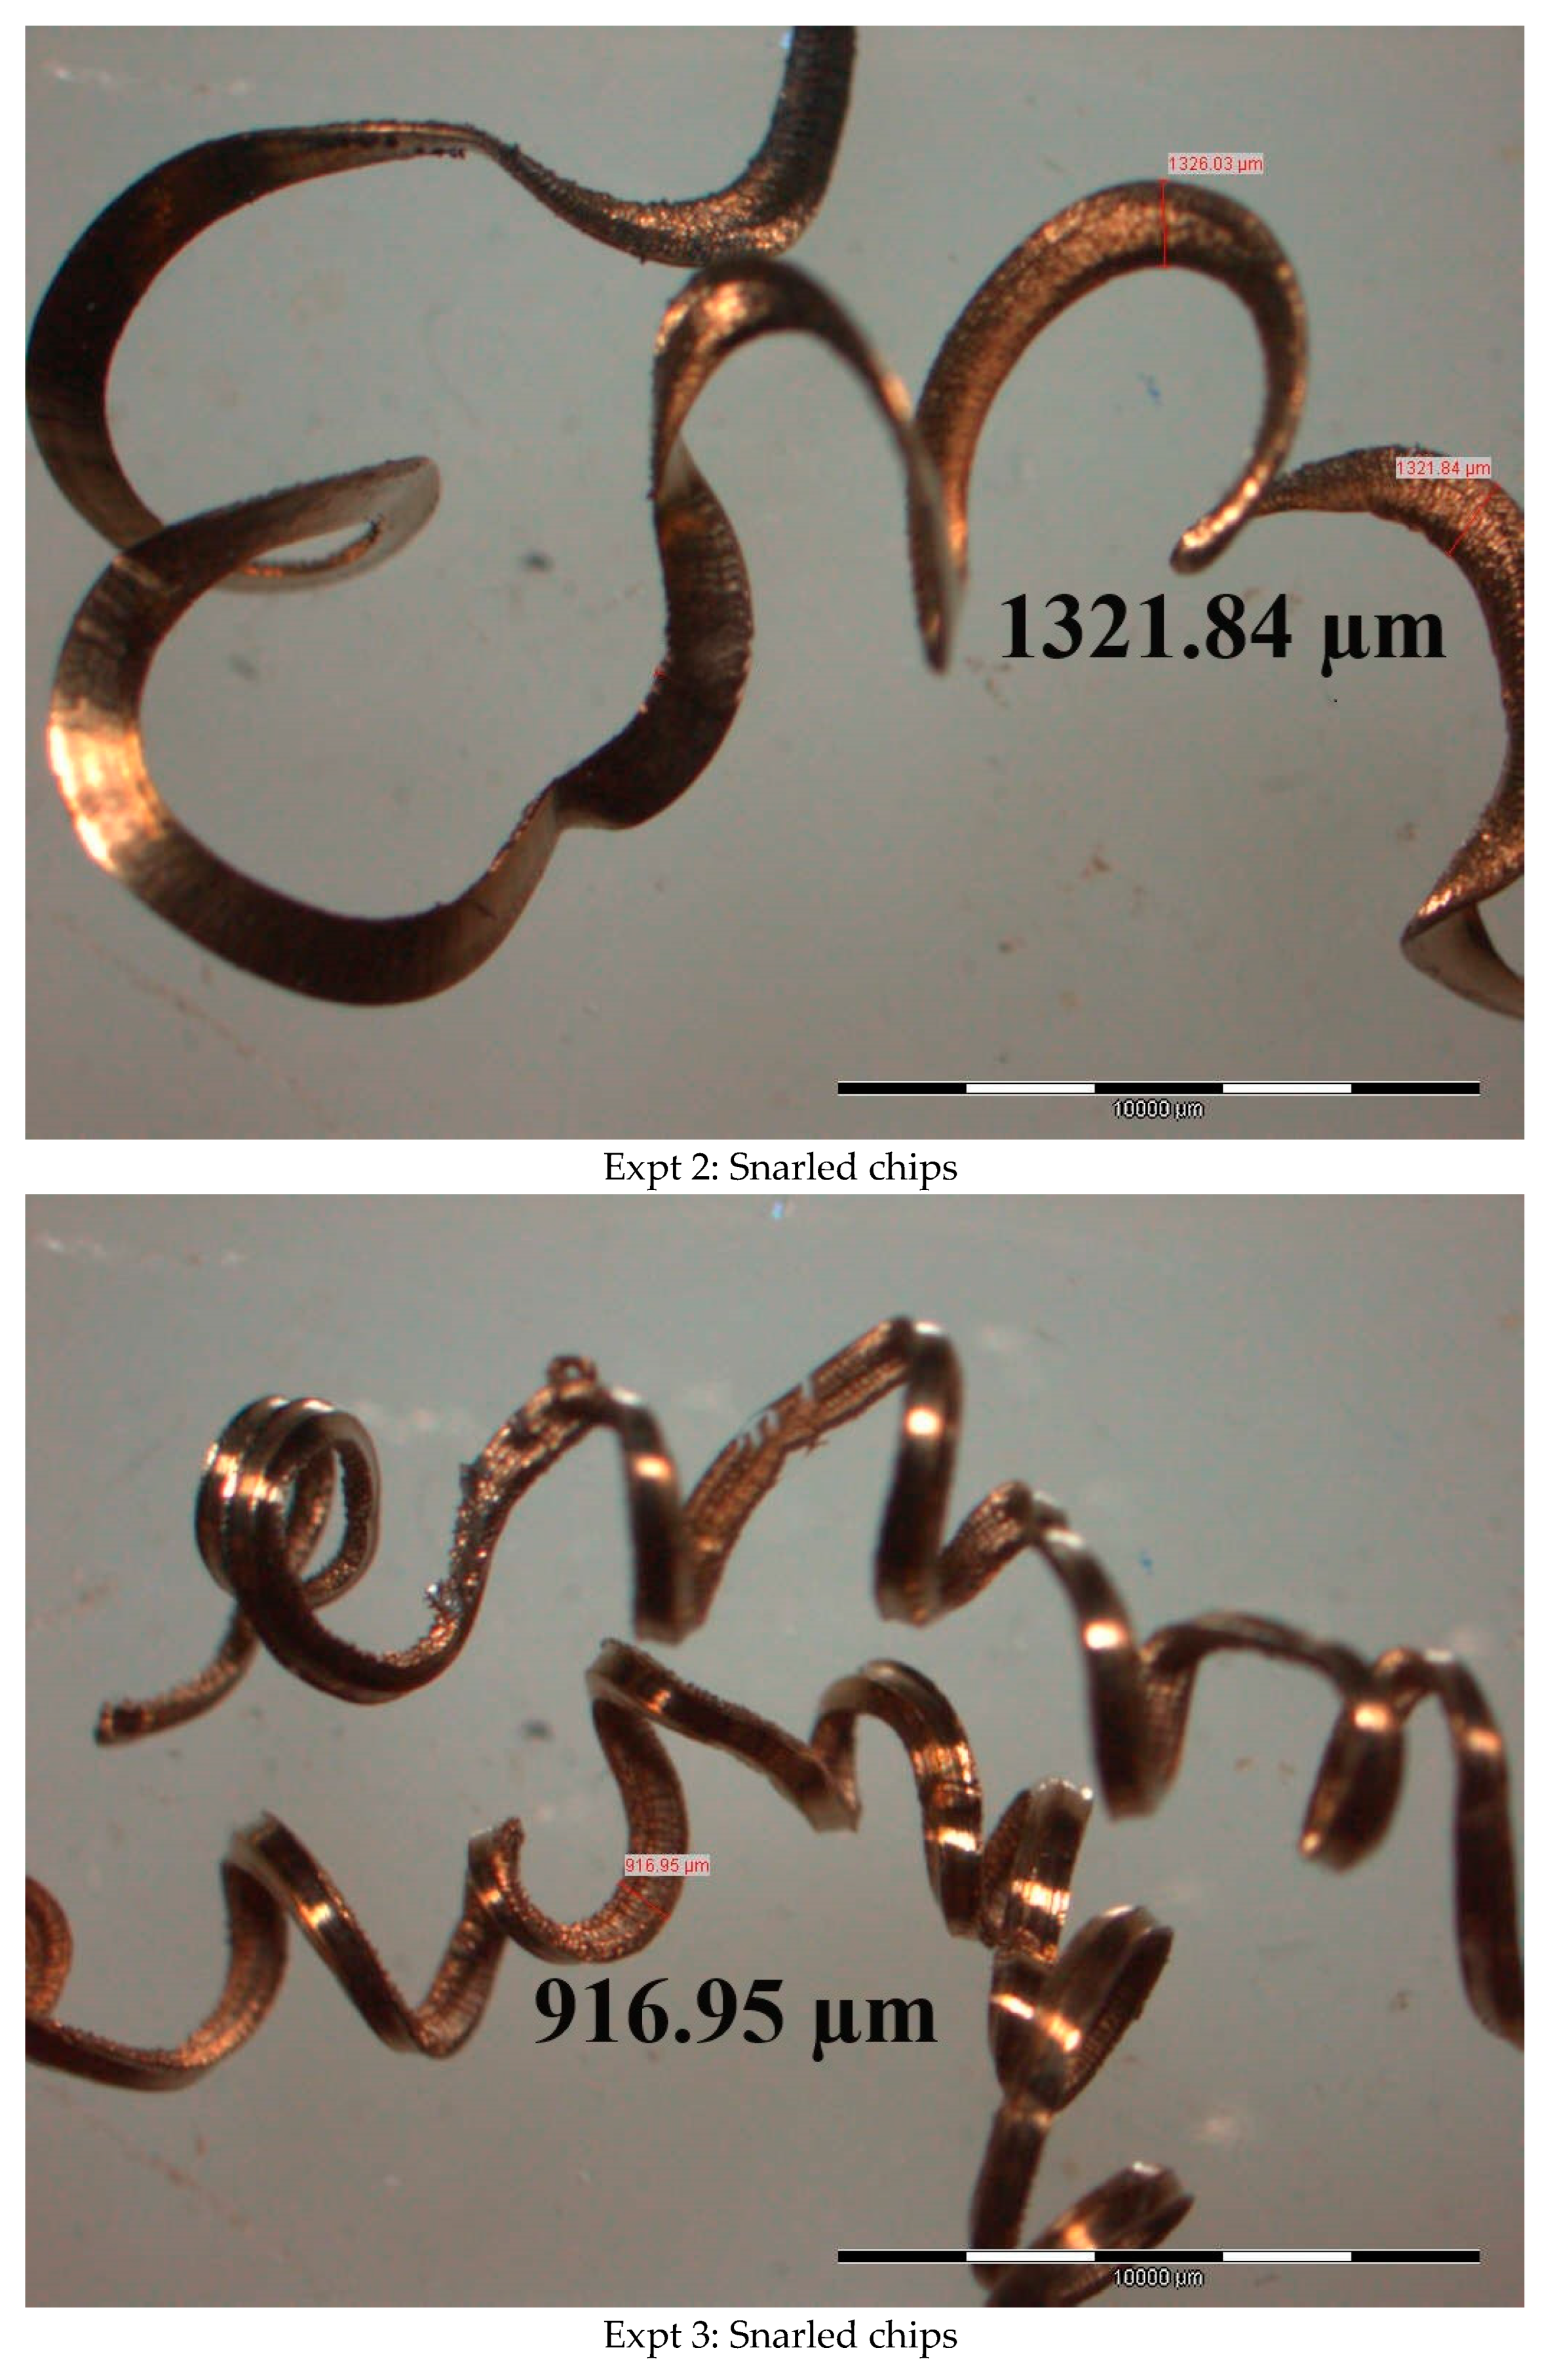
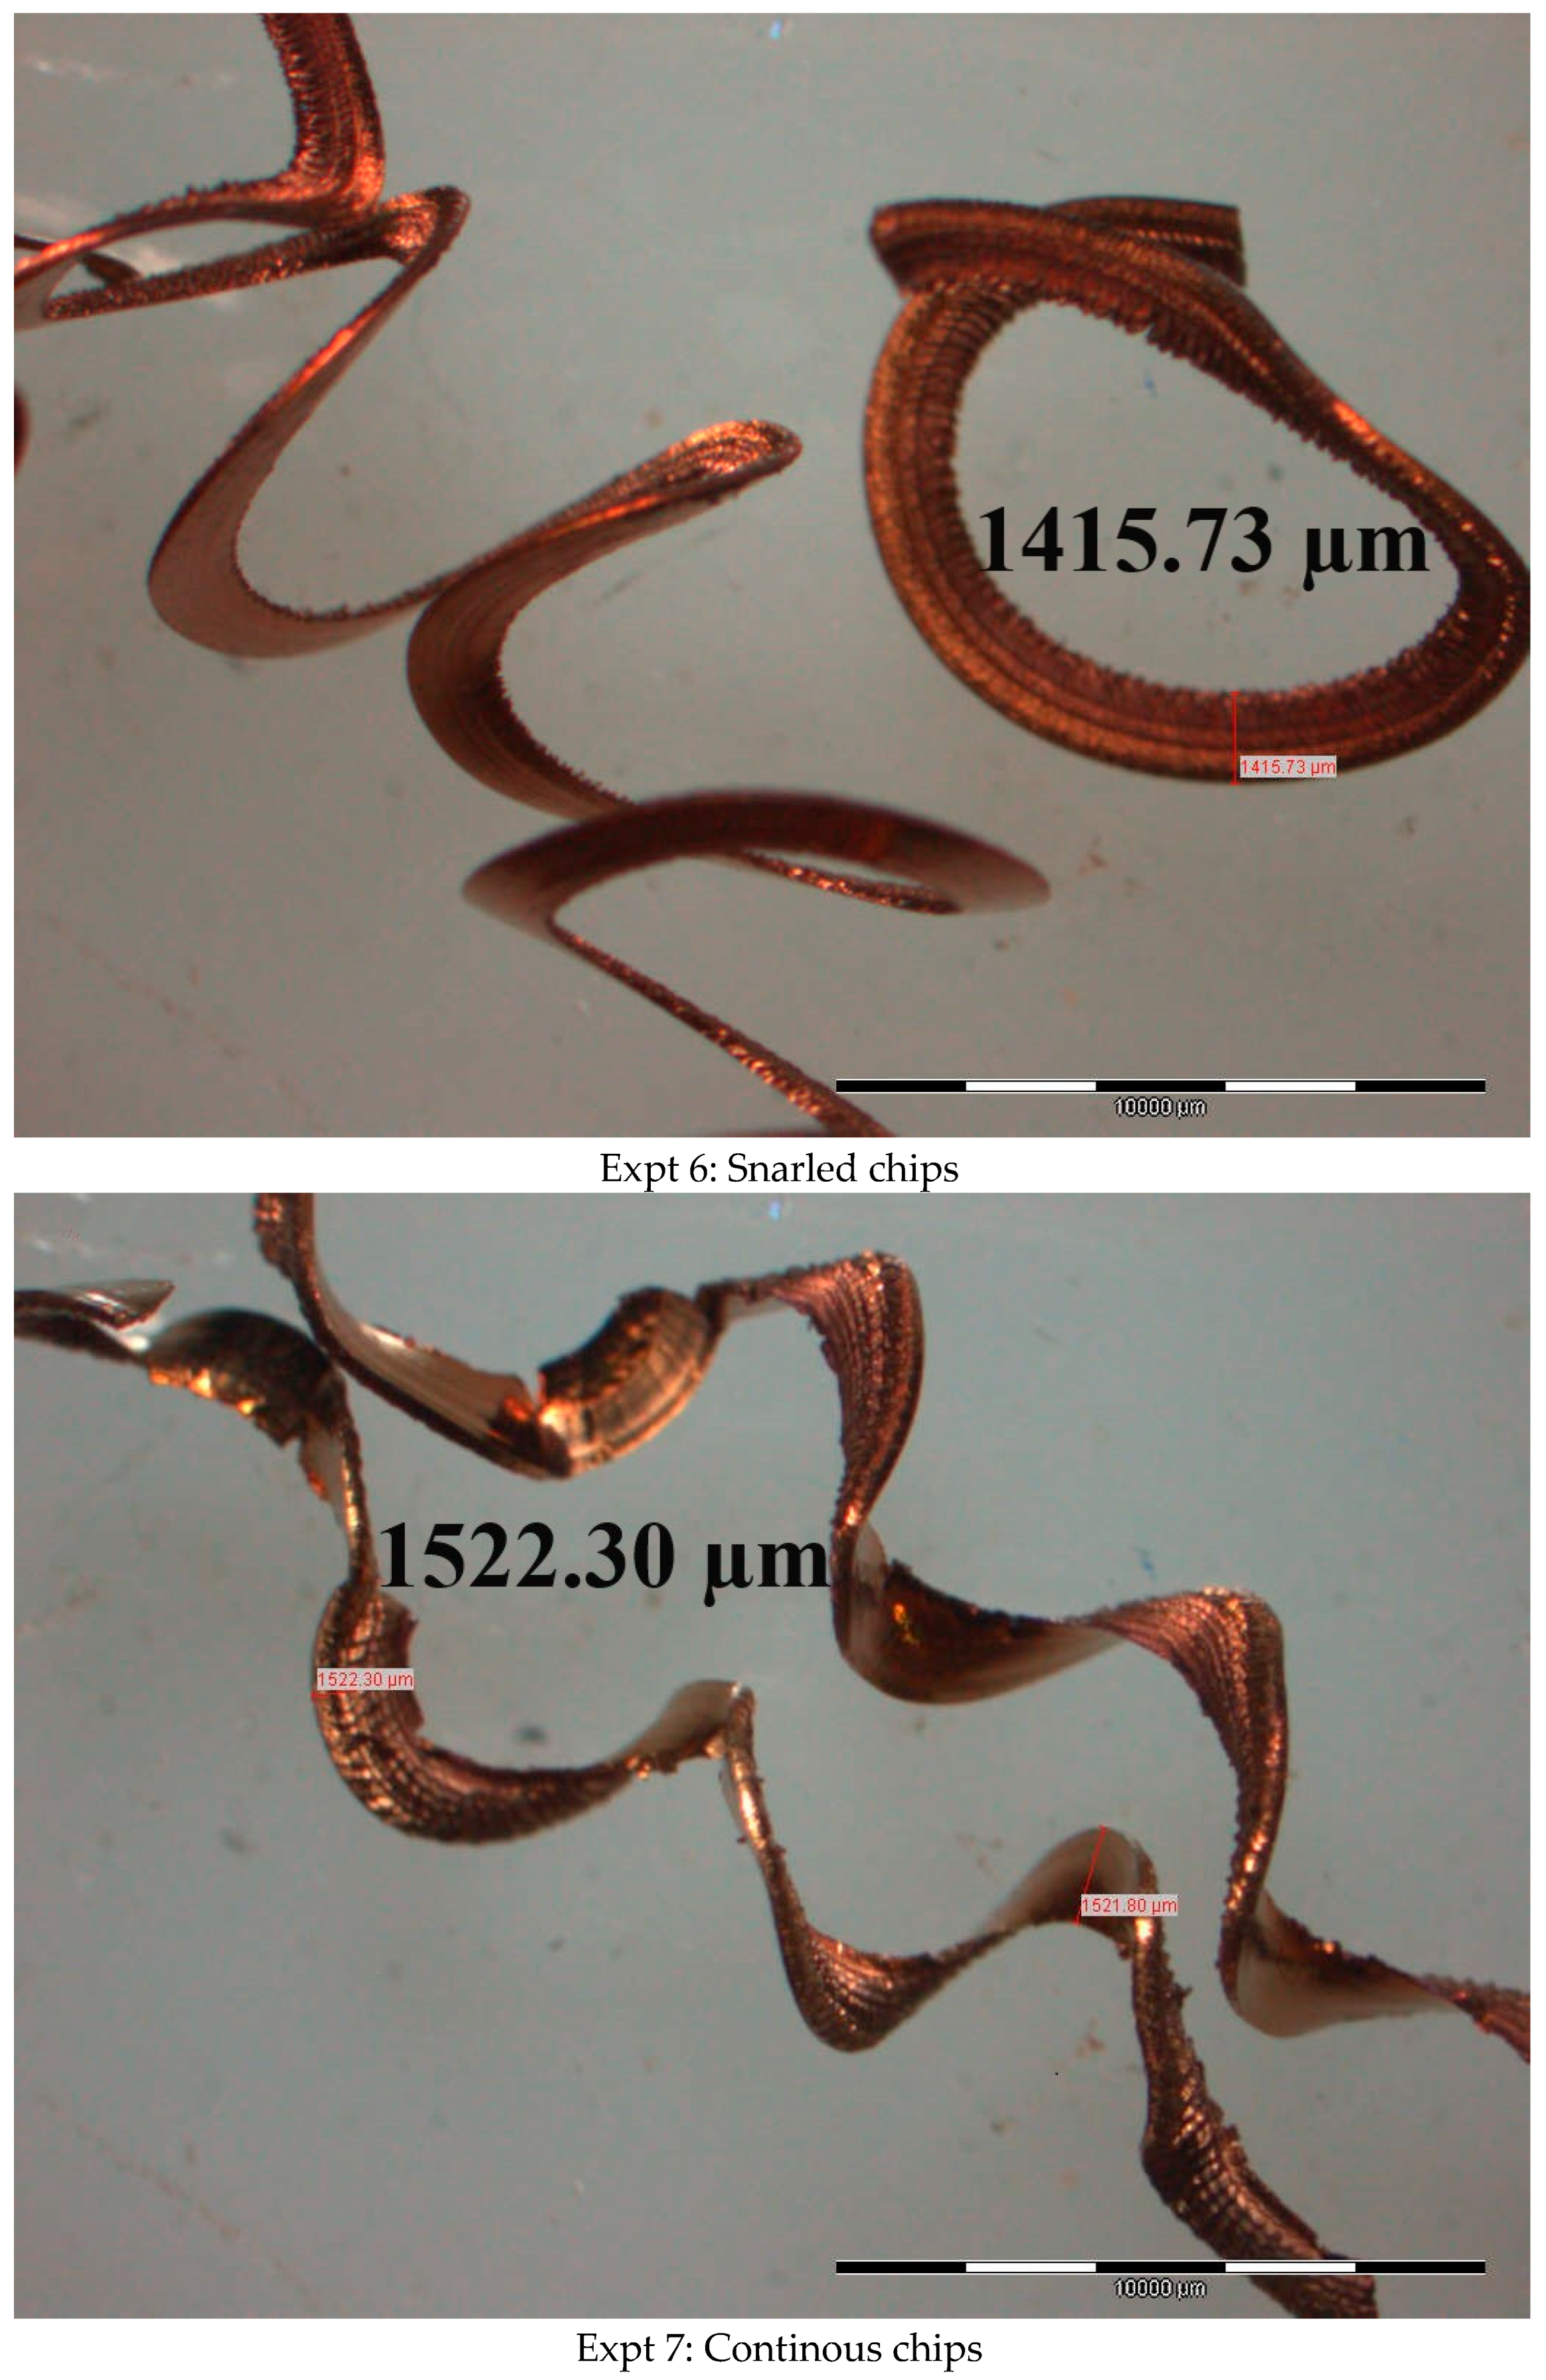
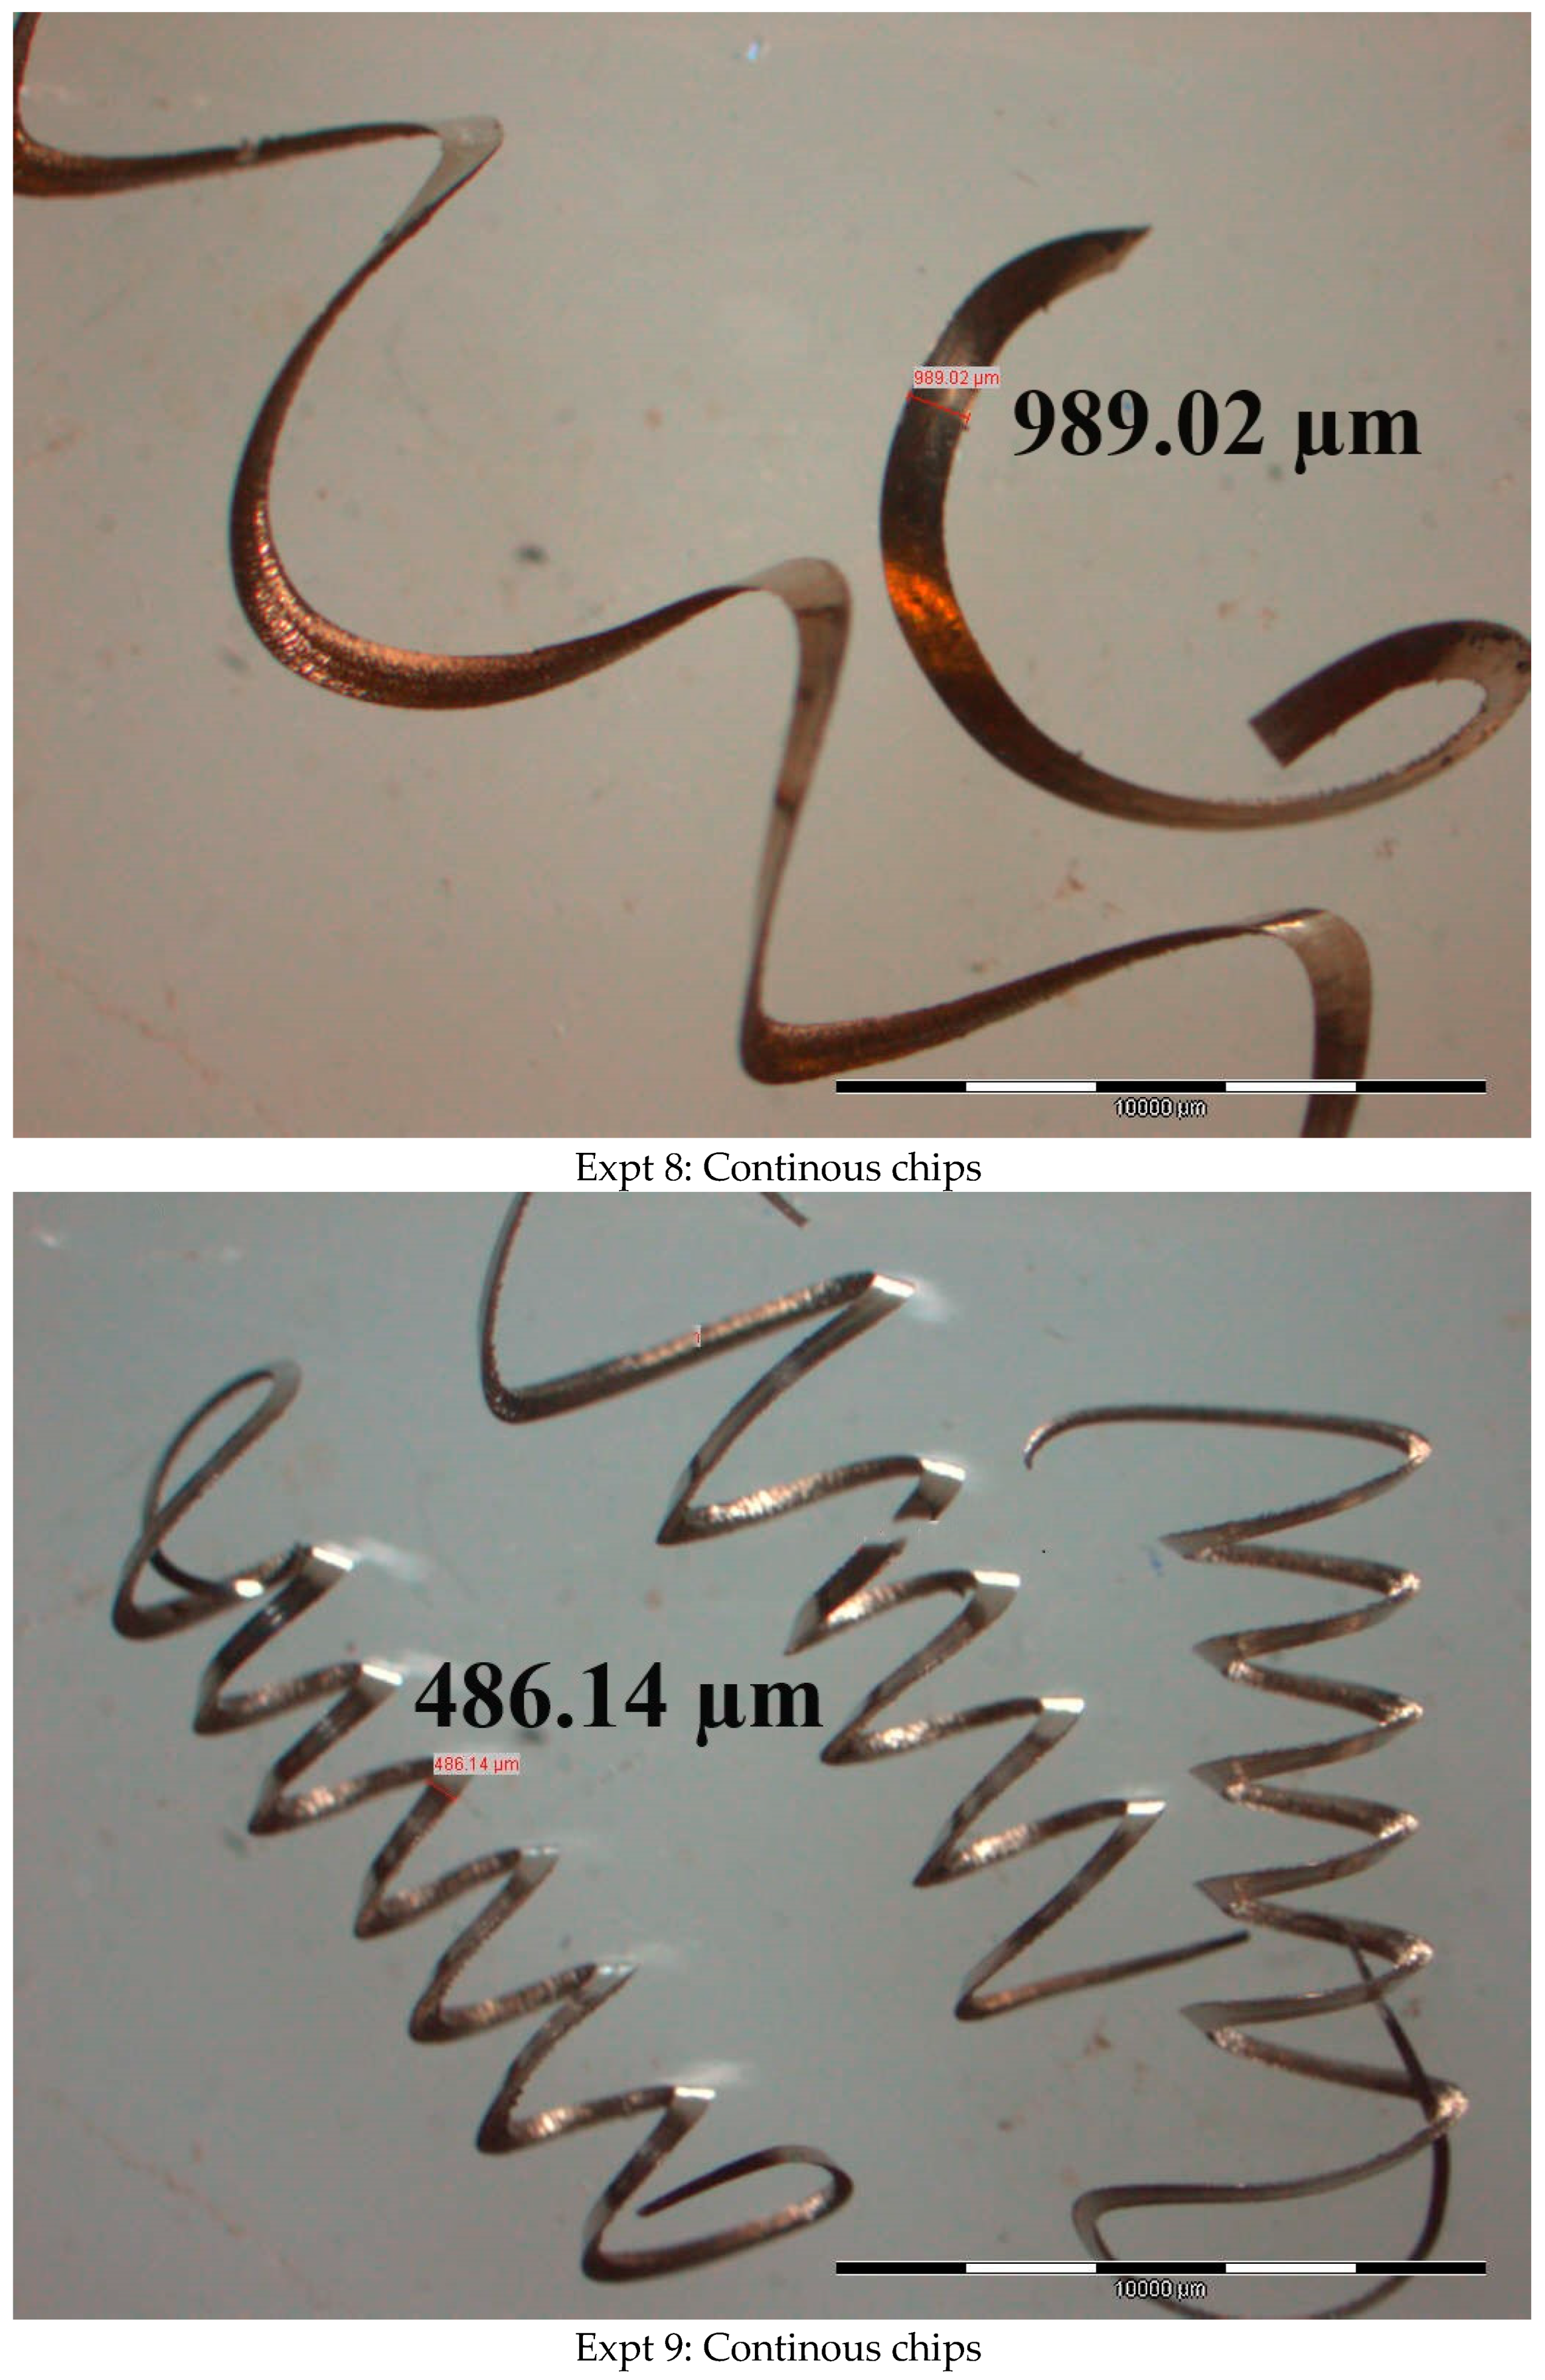
Figure 4 shows the microscopic images of the chips corresponding to the first replication of the experimental results. Most of the chips were of the continuous and snarled types.

3.1. Chip Morphology

The visual assessment of the chips, as per Figure 4, revealed that mostly continuous chips are produced during the machining of SS 316 with wave-textured cutting tools under a dry environment. Figure 4 shows a tendency for the curvature of the produced chips to increase with cutting speed. This trend could be influenced by the rising cutting temperature as the cutting speed increases, although other factors may also contribute. The observation that the curvature of the produced chips increases with cutting speed is in line with the results of Debnath et al. [27]. An increase in cutting speed results in a higher temperature in the cutting region, which can cause the thermal softening of the workpiece material. This, in turn, affects the shear plane angle and leads to increased chip curvature [28]. At lower speeds and depth of cut, snarled, long, and continuous chips that can entangle around the workpiece and cutting tool are produced. This is because the material deformation tends to be more homogeneous at a lesser cutting speed and depth of cut. As the cutting speed increases, the heat generated in the cutting zone alters the material’s behavior, promoting the formation of segmented chips [29], often observed as helical or saw-tooth shapes [30]. These segmented chips are more manageable and less likely to cause damage or interfere with the machining process.
At a lower feed rate, the material is more likely to deform plastically in a controlled manner, resulting in a higher probability of continuous chip formation. The formation of continuous chips is a result of the material undergoing quasi-stationary plastic deformation at the shear zone [28].
Figure 4 shows that lower cutting depths, i.e., 0.5 mm corresponding to experiment numbers 1, 5, and 9, lead to the formation of small, helical chips resembling washers. As the depth of cut increases during machining, there is typically a corresponding increase in the chip cross-sectional area, leading to the formation of thicker and segmented chips.

3.2. Chip Thickness and Its Ratio

The shape, thickness, and thickness ratio of the chips can reveal valuable insights into the cutting conditions, tool wear, and material behavior under stress. For instance, continuous chips often indicate a smooth cutting operation on ductile materials, whereas discontinuous chips may suggest brittle material or suboptimal cutting parameters. Moreover, the thickness of the chips can affect heat dissipation and tool life, with thicker chips potentially leading to increased tool wear and thinner chips suggesting efficient cutting with less heat generation. The chip thickness values corresponding to the experiments using different cutting parameter combinations are summarized in Table 2. Table 3 presents the ANOVA results for the linear model applied to chip thickness.
The ANOVA results for chip thickness, shown in Table 3, indicate that the model provides a reasonable fit, explaining approximately 71.92% of the total variation. The overall model is marginally significant, with a p-value of 0.076, indicating a potential influence of the input parameters, though not strongly supported at the 95% confidence level. Among the factors, the depth of cut (dc) stands out with a statistically significant effect on chip thickness with p of 0.022.
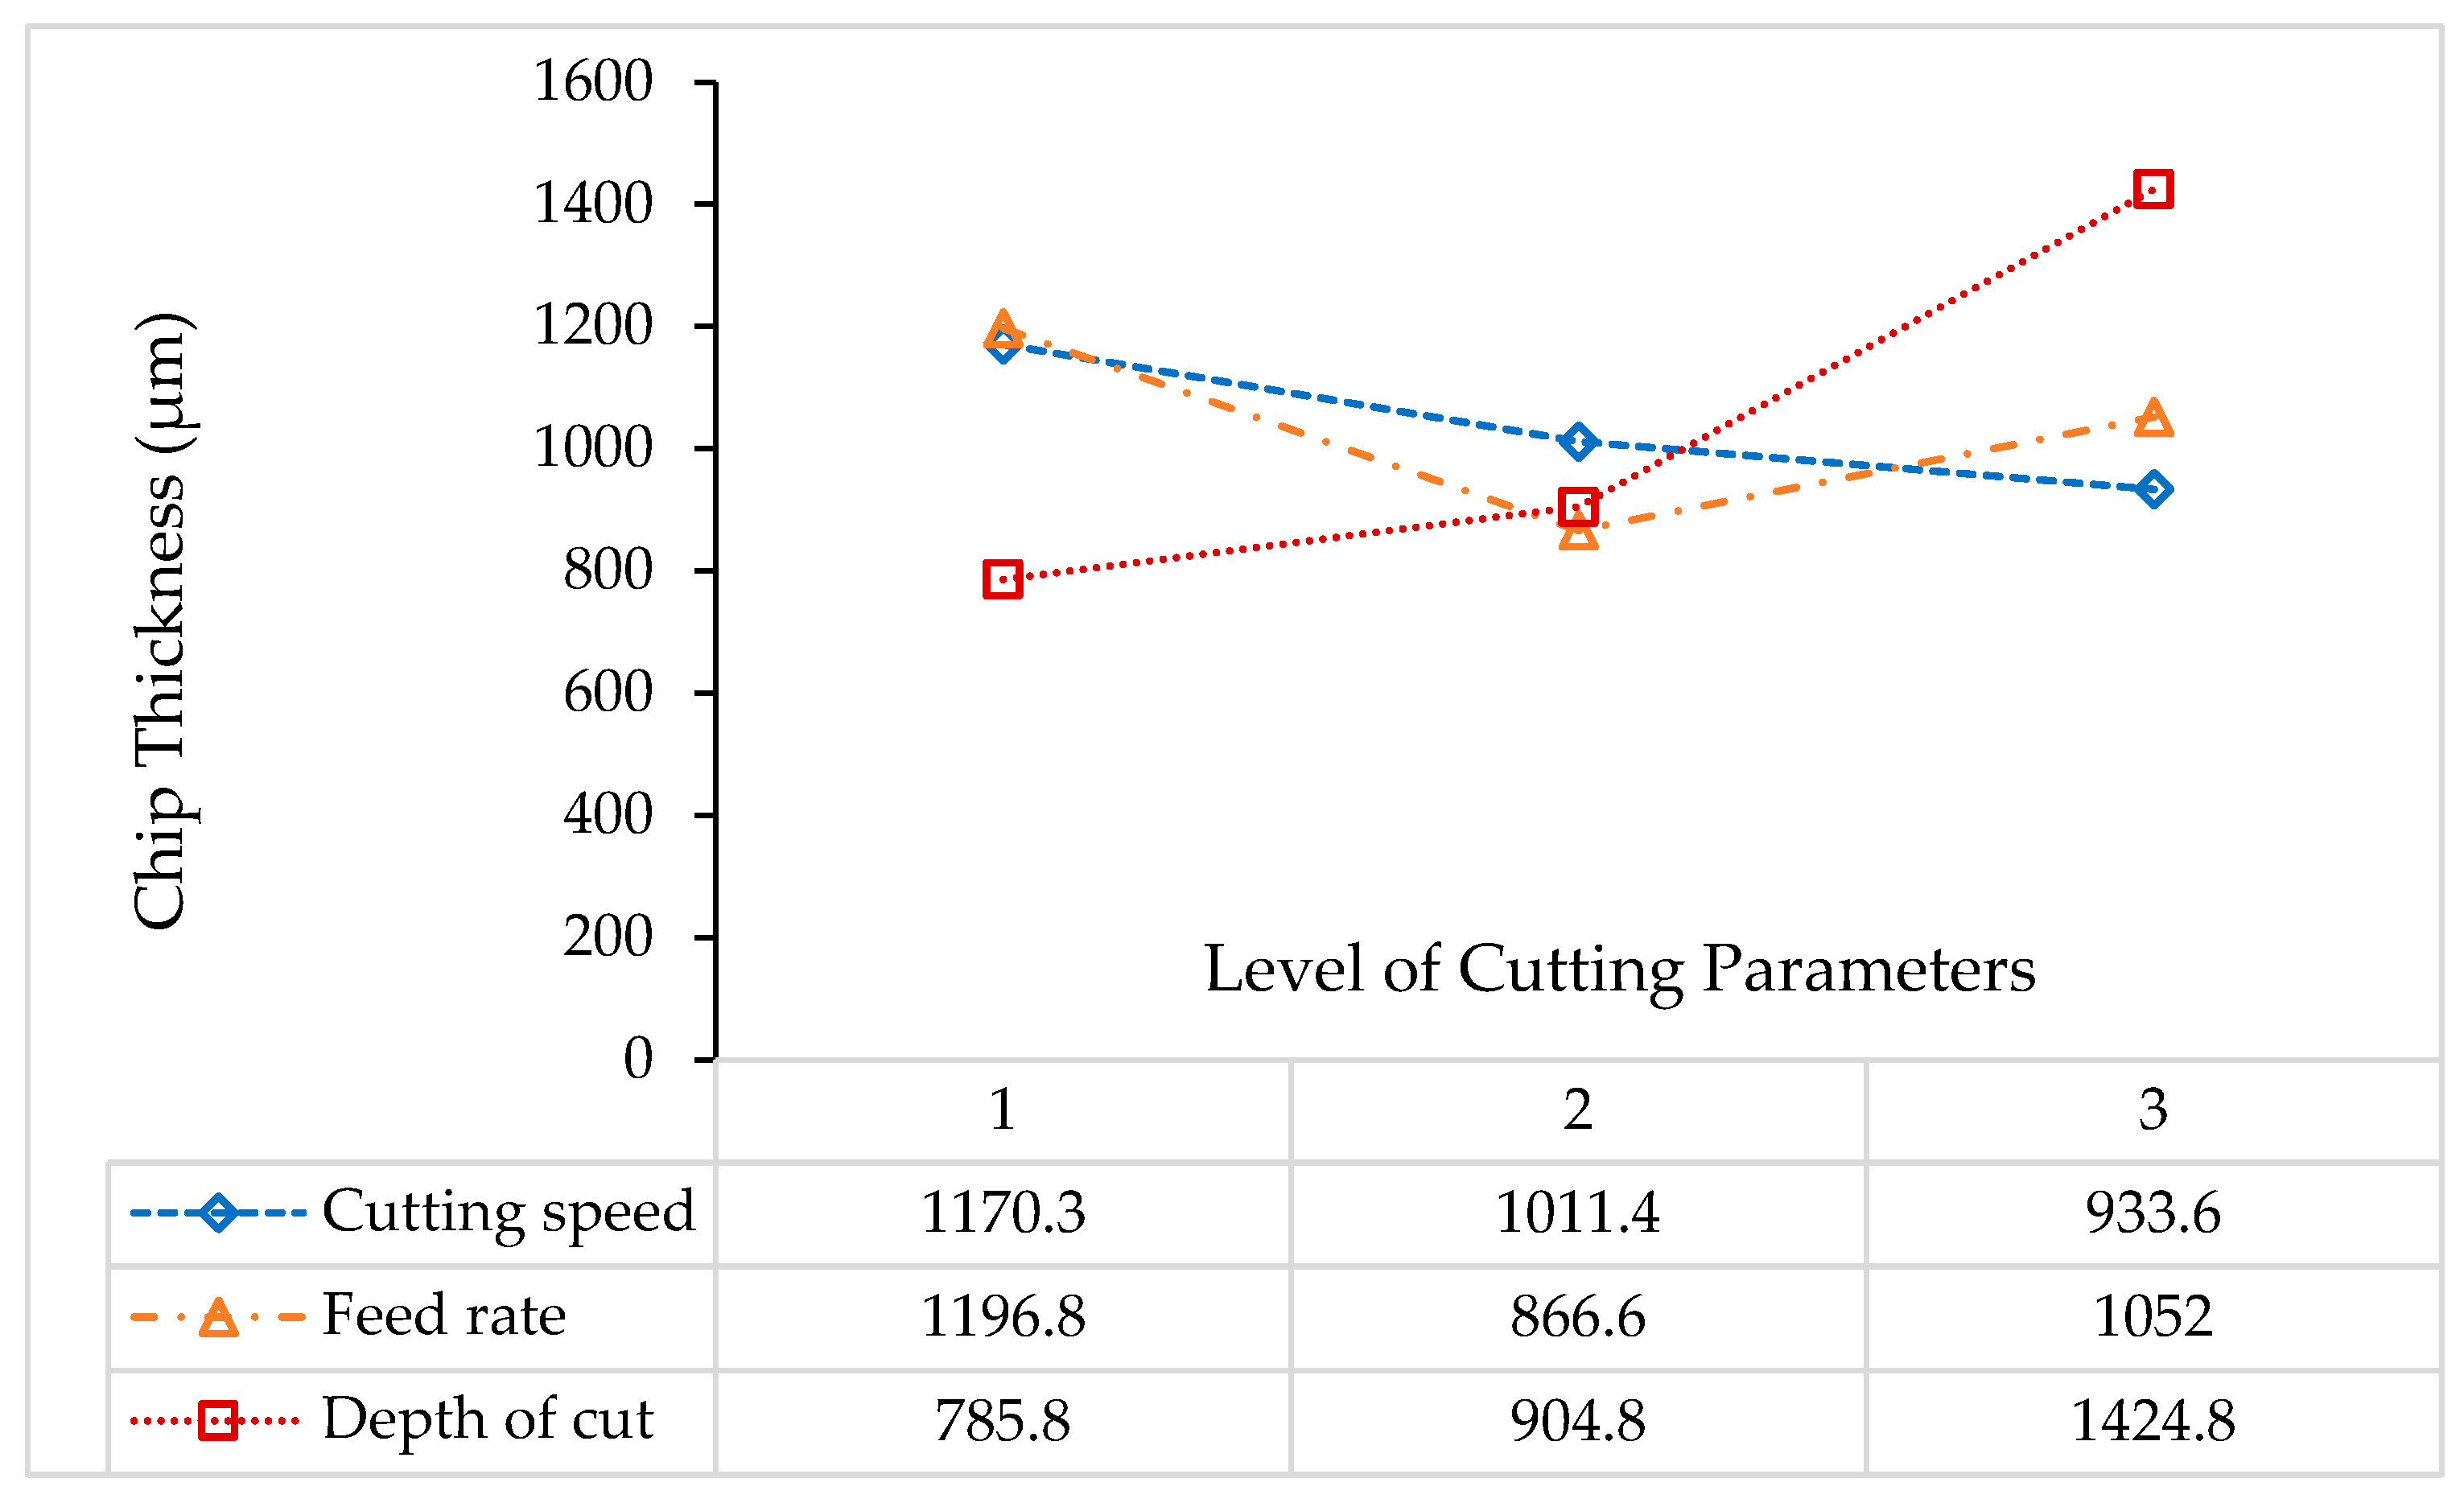
The mean values of chip thicknesses corresponding to each level of the cutting parameters are computed and graphically presented in Figure 5. The data presented in Figure 5 align with prior research on chip thickness [31,32], revealing a trend of decreasing chip thickness with increasing cutting speed. With a cutting speed increase from 70 m/min to 170 m/min, a significant reduction in mean chip thickness is observed, from 1170.30 µm to 933.60 µm as indicated in Figure 5. The reduction in cutting force is certainly an important factor in the decrement of chip thickness during machining processes. With an increase in the cutting speed, the contact time between the tool and the material decreases, resulting in poorer heat dissipation from the machining zone to the surroundings, due to which the workpiece material becomes softer and more easily sheared [32]. This phenomenon contributes to the formation of thinner chips and is well documented in the literature. Thinner chips potentially lead to a better surface quality for machined parts and lower tool wear [33].
It is widely established in the literature and compatible with metal cutting mechanics concepts that chip thickness proportionally increases with the feed rate [32] and depth of cut due to the increased material removal volume per unit time. As illustrated in Figure 5, we have observed similar trends for variation with depth of cut from level 1 to 3. But for feed rate, chip thickness increases from level 2 to 3. At level 1 of the feed rate, the measured chip thickness was the highest, perhaps due to the presence of noise factors and/or the unexpected and unavoidable cumulative effects of all machining parameters.
The chip thickness ratio represents the amount of deformation the chip undergoes during the cutting process, calculated by dividing the uncut chip thickness by the final chip thickness. It is an important measurement in the machining process since it serves as a valuable indicator of both productivity and the machined surface quality. The values of the chip thickness ratio for each experimental run are summarized in Table 2. Table 4 presents the ANOVA results for the linear model applied to the chip thickness ratio.
As shown in Table 4, the model explains approximately 83.13% of the total variation, indicating a strong fit. The overall model is statistically significant with a p-value of 0.022, suggesting that the input parameters collectively have a meaningful impact on the chip thickness ratio. Among the individual factors, feed rate and depth of cut show statistically significant effects, with p-values of 0.021 and 0.022, respectively.
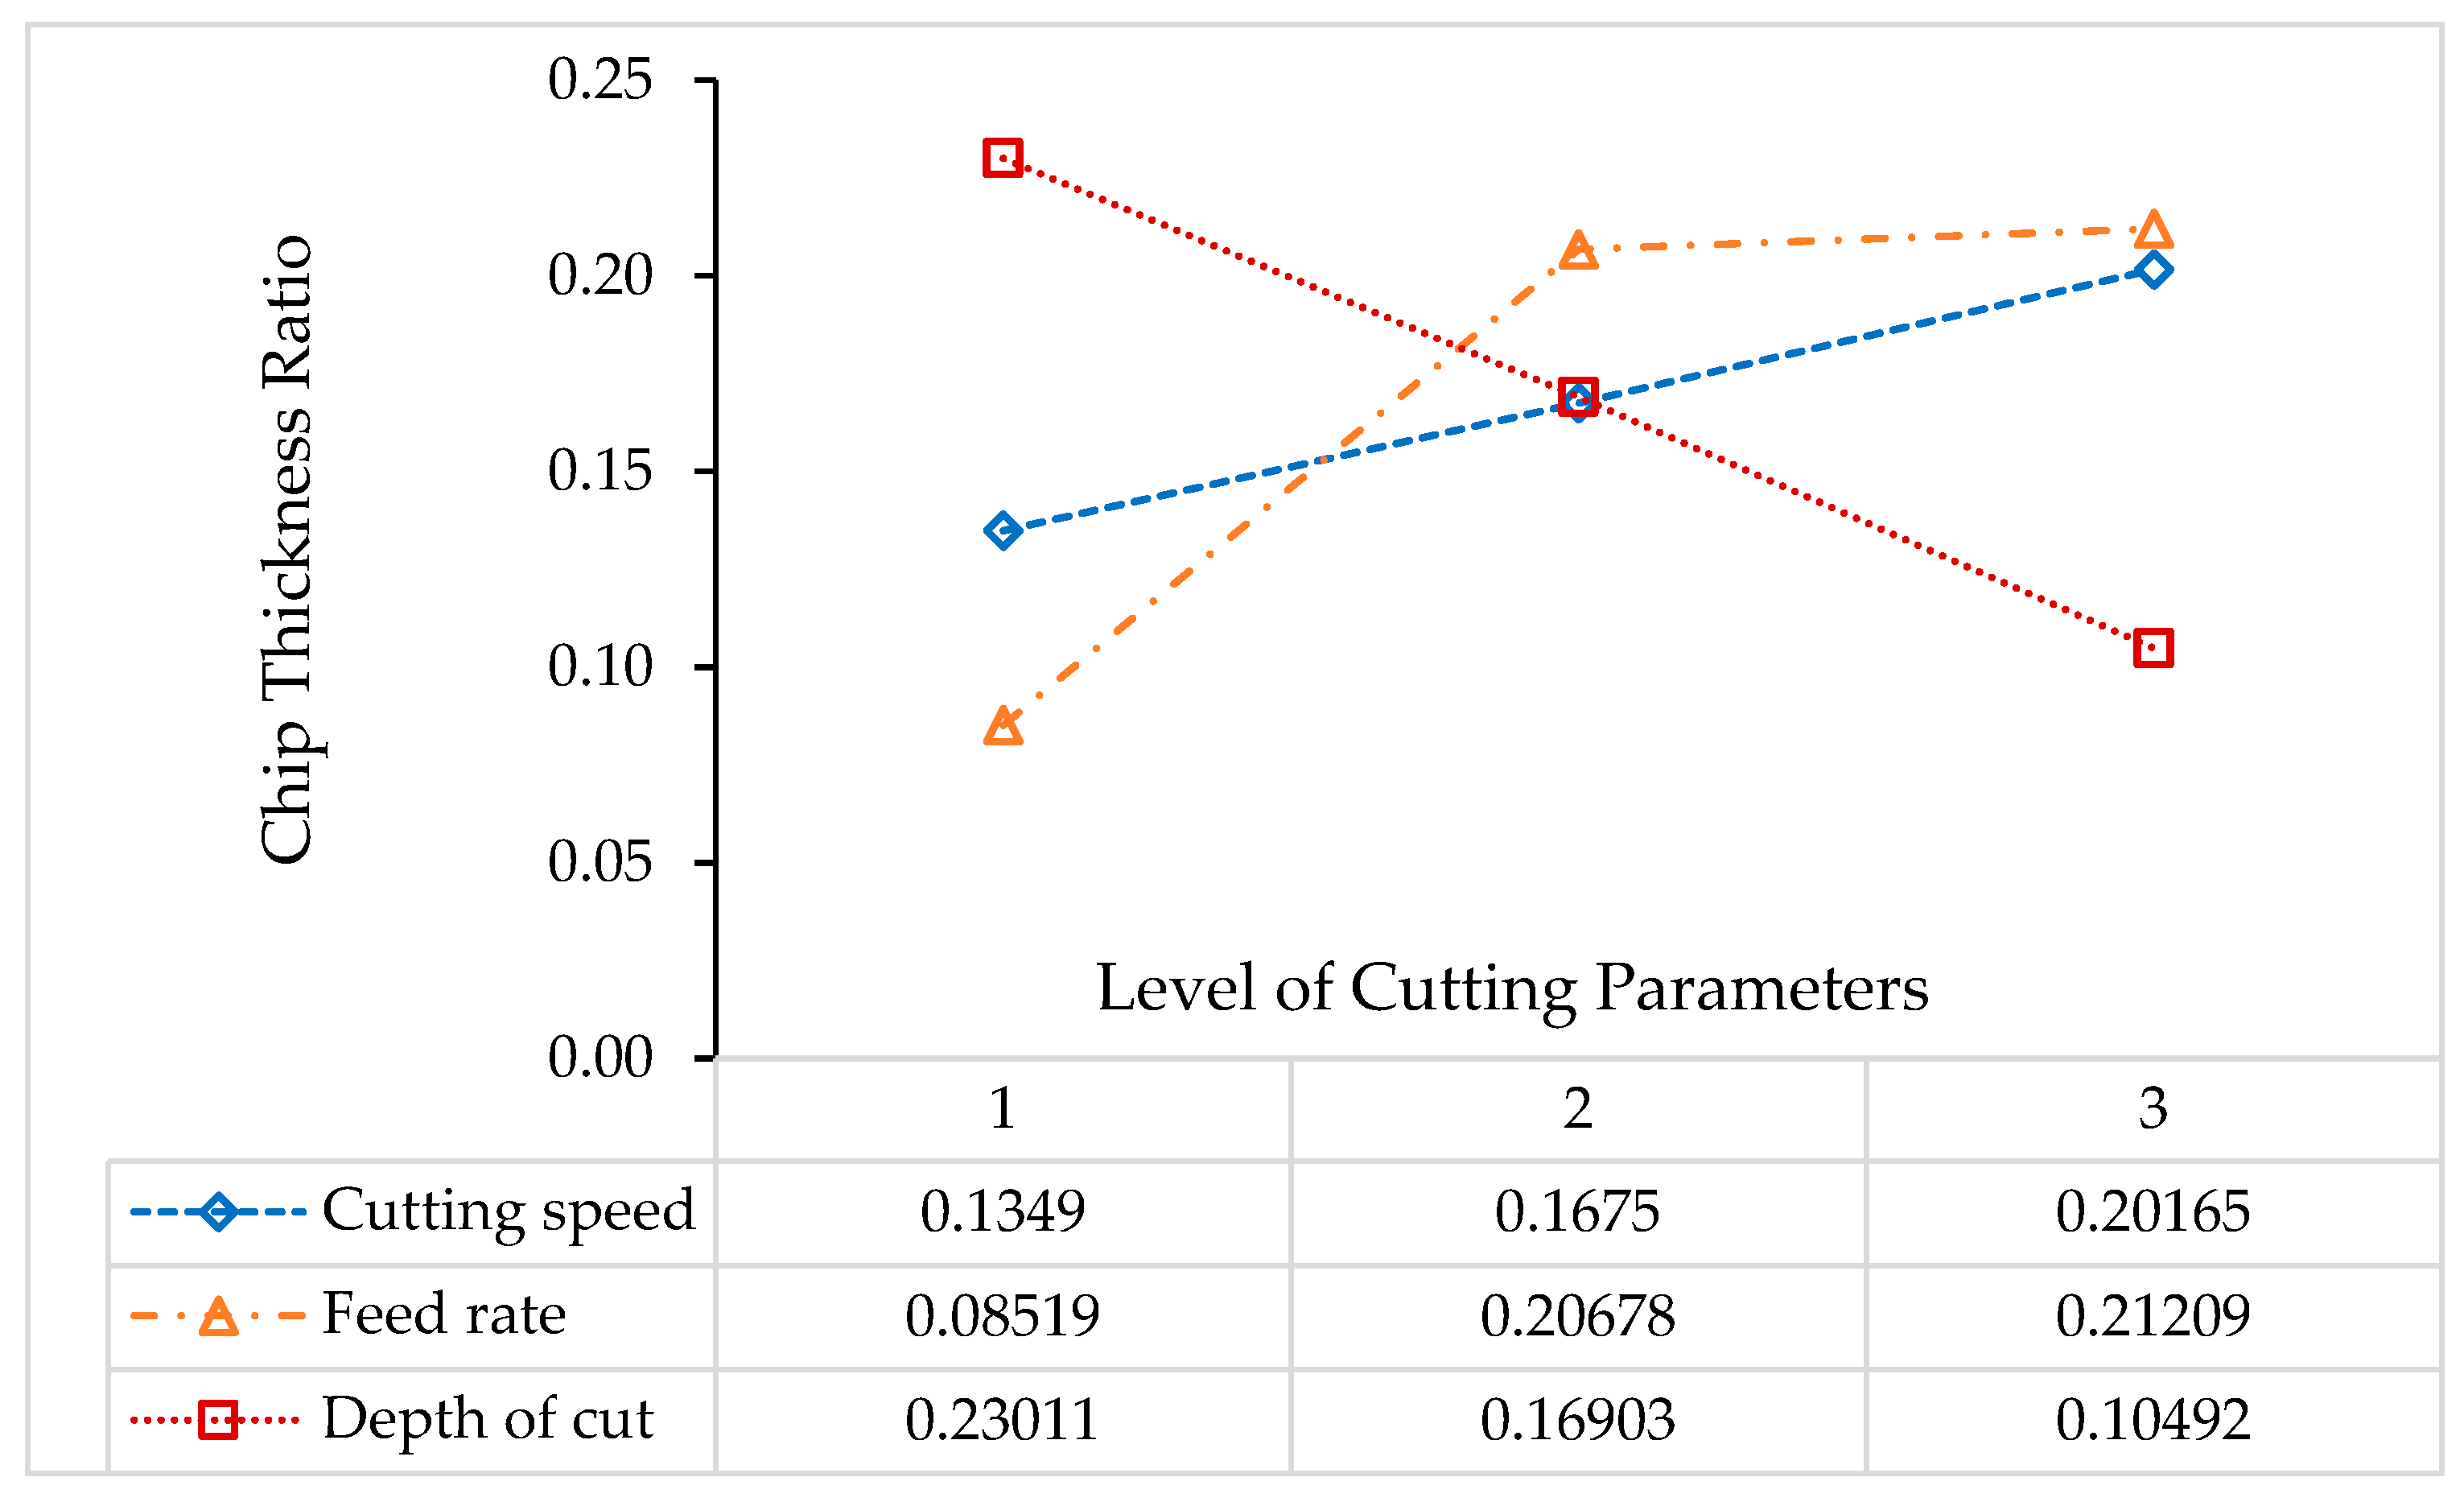
The mean values of the chip thickness ratios at each level of the cutting parameters are computed and graphically presented in Figure 6. The chip thickness ratio is always <1, since the chip thickness exceeds or equals the uncut chip thickness as can be seen in Table 2. A higher ratio suggests a smoother cut and finer finish, as it implies less material spring-back and more effective cutting [34]. Thinner chips often result in a higher chip thickness ratio. Similar observations were recorded in the current study. As can be seen in Table 2, the high chip thickness ratios obtained corresponded to the minimum chip thicknesses.
Figure 6 shows that the values of the chip thickness ratio increase with cutting speed, which is consistent with the findings of Fatima and Mativenga [25]. Similarly, an increase in the feed rate corresponds to an increase in the chip thickness ratio, as seen in Figure 6. Furthermore, the results in Figure 6 suggest that a larger depth of cut leads to a lower chip thickness ratio, consistent with the findings reported by Tamizharasan et al. [35].
Compared to the past work conducted by Soni and Mashinini [36], a significant reduction in chip thickness has been observed, which highlights the superiority of the wave-type flank texturing over rack texturing. Thinner chips, as obtained in our research, often correspond to higher chip thickness ratios, which in turn are associated with higher shear angles. This relationship can be advantageous in cutting processes, as larger shear angles typically require less cutting force for deformation.

3.3. Surface Roughness Analysis

Surface roughness is one of the critical factors which significantly influence the performance and durability of machined components, influencing aspects such as friction, wear resistance, and fatigue strength [37]. Accurate measurement and control of surface roughness are essential in industries like aerospace, automotive, and medical devices to ensure components meet rigorous quality standards. The process parameters play a crucial role in influencing surface roughness, making it essential to optimize cutting conditions for achieving desired outcomes. The surface roughness values recorded for each experimental run are summarized in Table 2. Table 5 presents the ANOVA results for the linear model of surface roughness (Ra).
The model accounts for approximately 82.86% of the total variation, indicating a strong fit to the experimental data. The overall model is statistically significant, with a p-value of 0.023, suggesting that the considered cutting parameters collectively have a meaningful influence on surface roughness. Among the cutting parameters, feed rate shows a highly significant effect on Ra, with a p-value of 0.006. This confirms that changes in feed rate strongly impact the surface finish.
The mean values of surface roughness at each level of the cutting parameters are computed and graphically presented in Figure 7.
Figure 7 provides insight into how surface roughness (Ra) is influenced by the cutting parameters: vc, fr, and dc. As the feed rate increases from level 1 to level 3, the average Ra value rises sharply from 1.936 to 4.474 µm, indicating a strong positive correlation. This trend aligns with established machining theory, where higher feed rates tend to produce poor surfaces due to increased material deformation and tool marks. Depth of cut also shows a noticeable effect on surface roughness. As the depth of cut increases, the Ra values tend to rise, suggesting that larger depths of cut may contribute to greater surface irregularities, possibly due to increased cutting forces and vibrations. Conversely, cutting speed exhibits a relatively smaller influence. Ra decreases from level 1 to level 2, then slightly increases at level 3. This non-linear trend suggests that while higher cutting speeds can sometimes improve the surface finish by reducing the built-up edge formation, the benefit may taper off or reverse at higher levels depending on tool wear or thermal effects.

3.4. Taguchi Based Optimization

In this study, the Taguchi method is employed to identify the optimal cutting parameters for minimizing chip thickness and to quantify the influence of individual process parameters on it.
The Taguchi method is a widely adopted statistical approach in engineering that aims to enhance process or product robustness by minimizing variability caused by uncontrollable factors. It leverages orthogonal arrays and signal-to-noise (S/N) ratios to identify optimal input parameters efficiently, significantly reducing the number of required experimental trials.
Introduced by Genichi Taguchi, the Signal-to-Noise (S/N) ratio serves as a performance metric that simultaneously accounts for both the mean and variability of the output response. Depending on the optimization objective, one of the following S/N ratios’ mathematical formulae is used [38]:
Larger-the-Better (to maximize the response) [38]:
S N = 10 L o g 1 n i = 1 n 1 y i 2
This formulation is applied when higher output values are desirable.
Smaller-the-Better (to minimize the response) [38]:
  S N = 10 L o g 1 n i = 1 n y i 2
This is used when lower output values are preferred.
Nominal-the-Best (to target a specific value) [38]:
S N = 10 l o g y ¯ 2 S 2
This is employed when the goal is to maintain the output as close as possible to a desired target.
Here y i , n , y ¯ , and S represent the experimental value, number of experiments, mean of y , and variance of y , respectively. In the present study, minimizing chip thickness is the desired objective; therefore, Equation (2) with “Smaller the Better” criteria was used to calculate the S/N ratios, and the results are summarized in Table 6.
Furthermore, the delta ( Δ ) value quantifies the influence of each input factor on the response by measuring the difference between the maximum and minimum S/N ratios observed across its levels [38]:
Δ j   =   Max S N j Min S N j
where   j represents the input factor under consideration. After computing the delta values for all parameters, they are ranked based on their influence. The response table for S/N ratios of chip thickness with delta values are shown in Table 7.
By analyzing the S/N ratios across different levels of the cutting parameters, the optimal parameter settings can be identified. The level of a cutting parameter that yields the highest S/N ratio is considered its optimal setting, as it ensures improved performance and reduced sensitivity to external variations.
Accordingly, Level 3 of cutting speed, Level 2 of feed rate, and Level 1 of depth of cut were identified as the optimal combination for achieving the minimum chip thickness, which was found to be 457.64 µm, as shown in Table 2. The corresponding parameter values are as follows: cutting speed ( v c ) = 170 m/min, feed rate ( f r ) = 0.15 mm/rev, and depth of cut ( d c ) = 0.5 mm. In Table 7, a larger delta value indicates a greater influence of the corresponding factor on the output. Based on the results, the depth of cut is identified as the most influential parameter, followed by feed rate and cutting speed.
As mentioned earlier, the chip thickness ratio reflects the extent of deformation the chip undergoes during the cutting process. It is a key indicator in machining, as it relates closely to both productivity and surface quality. Notably, at the optimal cutting parameters observed in the experiments, the chip thickness ratio was at its minimum, and the corresponding surface roughness was also at its lowest. This suggests that smoother machining, characterized by thinner chips, is beneficial for achieving better surface finish. Therefore, minimizing chip thickness can be considered desirable for improving the overall quality of the machined surface.

4. Conclusions

The current study has investigated the effect of wave-textured flank-face cutting tool inserts on chip morphology during the dry machining of stainless steel AISI 316. Chip morphology analysis showed predominantly continuous chips, indicating favorable machining conditions. These chips are more manageable and less likely to cause damage or interfere with the machining process. The chip thickness analysis unveiled a notable decrease in chip thickness compared to the prior study. Thinner chips lead to higher chip thickness ratios, resulting in higher shear angles, which can be beneficial since larger shear angles typically demand less cutting force for deformation, thereby reducing energy consumption. Chip thickness decreases with increasing cutting speed but increases with both feed rate and cutting depth. Using the Taguchi method, the optimal parameter combination for minimizing chip thickness was identified as the following: cutting speed of 170 m/min, feed rate of 0.15 mm/rev, and depth of cut of 0.50 mm, yielding a minimum chip thickness of 457.64 µm. The corresponding surface roughness of 1.645 µm represented the best surface finish among all experimental runs, indicating that producing thinner chips facilitates smoother machining and improves overall surface quality. The analysis of S/N ratios and delta values further revealed that the depth of cut had the most significant influence on chip thickness, followed by feed rate and cutting speed. Wave-textured flank faces on cutting tools led to improved machining performance, particularly in terms of reduced chip thickness, during the dry turning of stainless steel.

Author Contributions

S.P.: writing—original draft, methodology, investigation, formal analysis, conceptualization. K.G.: writing—review and editing, supervision, conceptualization, methodology, fund acquisition, project administration. All authors have read and agreed to the published version of the manuscript.

Funding

This research received no external funding.

Institutional Review Board Statement

Not applicable.

Informed Consent Statement

Not applicable.

Data Availability Statement

The original contributions presented in this study are included in the article. Further inquiries can be directed to the corresponding author.

Acknowledgments

The authors would like to acknowledge the technicians and lab staff of the Department of Mechanical and Industrial Engineering Technology at the University of Johannesburg.

Conflicts of Interest

The authors declare no conflicts of interest.

References

  1. Mashinini, P.M.; Soni, H.; Gupta, K. Investigation on Dry Machining of Stainless Steel 316 Using Textured Tungsten Carbide Tools. Mater. Res. Express 2020, 7, 016502. [Google Scholar] [CrossRef]
  2. Guvenc, M.A.; Bilgic, H.H.; Mistikoglu, S. Identification of Chatter Vibrations and Active Vibration Control By Using the Sliding Mode Controller on Dry Turning of Titanium Alloy (Ti6Al4V). Facta Univ. Ser. Mech. Eng. 2023, 21, 307–322. [Google Scholar] [CrossRef]
  3. Nguyen, T.T.; Mia, M.; Dang, X.P.; Le, C.H.; Packianather, M.S. Green Machining for the Dry Milling Process of Stainless Steel 304. Proc. Inst. Mech. Eng. Part B J. Eng. Manuf. 2020, 234, 881–899. [Google Scholar] [CrossRef]
  4. Stanojković, J.; Radovanović, M. Influence of the Cutting Parameters on Force, Moment and Surface Roughness in the End Milling of Aluminum 6082-T6. Facta Univ. Ser. Mech. Eng. 2022, 20, 157. [Google Scholar] [CrossRef]
  5. Siju, A.S.; Jose, S.; Waigaonkar, S.D. Experimental Analysis and Characterisation of Chip Segmentation in Dry Machining of Ti-6Al-4V Alloy Using Inserts with Hybrid Textures. CIRP J. Manuf. Sci. Technol. 2022, 36, 213–226. [Google Scholar] [CrossRef]
  6. Yuan, J.; Fox-Rabinovich, G.S.; Veldhuis, S.C. Control of Tribofilm Formation in Dry Machining of Hardened AISI D2 Steel by Tuning the Cutting Speed. Wear 2018, 402–403, 30–37. [Google Scholar] [CrossRef]
  7. Babe, I.B.; Gupta, K.; Chaubey, S.K. Sustainable Dry Machining of Stainless Steel with Microwave-Treated Tungsten Carbide Cutting Tools. Micromachines 2023, 14, 1148. [Google Scholar] [CrossRef] [PubMed]
  8. Yu, S.; Zhao, G.; Li, C.; Xu, S.; Zheng, Z. Prediction Models for Energy Consumption and Surface Quality in Stainless Steel Milling. Int. J. Adv. Manuf. Technol. 2021, 117, 3777–3792. [Google Scholar] [CrossRef]
  9. Nagendra Prasad, K.; Ismail, S. Machining Performance of Protruded Textured High-Speed Steel Cutting Tool under Dry Turning Operation. Mater. Today Proc. 2022, 66, 2115–2123. [Google Scholar] [CrossRef]
  10. Siju, A.S.; Gajrani, K.K.; Joshi, S.S. Dual Textured Carbide Tools for Dry Machining of Titanium Alloys. Int. J. Refract. Met. Hard Mater. 2021, 94, 105403. [Google Scholar] [CrossRef]
  11. Bertolete, M.; Barbosa, P.A.; Machado, R.; Samad, R.E.; Vieira, N.D.; Vilar, R.; de Rossi, W. Effects of Texturing the Rake Surfaces of Cemented Tungsten Carbide Tools by Ultrashort Laser Pulses in Machining of Martensitic Stainless Steel. Int. J. Adv. Manuf. Technol. 2018, 98, 2653–2664. [Google Scholar] [CrossRef]
  12. Ma, J.; Duong, N.H.; Lei, S. Numerical Investigation of the Performance of Microbump Textured Cutting Tool in Dry Machining of AISI 1045 Steel. J. Manuf. Process. 2015, 19, 194–204. [Google Scholar] [CrossRef]
  13. Zhang, K.; Guo, X.; Sun, L.; Meng, X.; Xing, Y. Fabrication of Coated Tool with Femtosecond Laser Pretreatment and Its Cutting Performance in Dry Machining SLM-Produced Stainless Steel. J. Manuf. Process. 2019, 42, 28–40. [Google Scholar] [CrossRef]
  14. Meng, X.; Zhang, K.; Guo, X.; Wang, C.; Sun, L. Preparation of Micro-Textures on Cemented Carbide Substrate Surface by Plasma-Assisted Laser Machining to Enhance the PVD Tool Coatings Adhesion. J. Mater. Process. Technol. 2021, 288, 116870. [Google Scholar] [CrossRef]
  15. Fernández-Lucio, P.; Villarón-Osorno, I.; Pereira Neto, O.; Ukar, E.; López de Lacalle, L.N.; Gil del Val, A. Effects of Laser-Textured on Rake Face in Turning PCD Tools for Ti6Al4V. J. Mater. Res. Technol. 2021, 15, 177–188. [Google Scholar] [CrossRef]
  16. Fatima, A.; Zaheer, A.; Fahad, M. Comparative Performance Analysis of Micro-Structured Carbide Inserts in Machining of EN19 Alloy Steel. J. Braz. Soc. Mech. Sci. Eng. 2019, 41, 405. [Google Scholar] [CrossRef]
  17. Vasumathy, D.; Meena, A. Influence of Micro Scale Textured Tools on Tribological Properties at Tool-Chip Interface in Turning AISI 316 Austenitic Stainless Steel. Wear 2017, 376–377, 1747–1758. [Google Scholar] [CrossRef]
  18. Roushan, A. Chetan Influence of Texture Patterns and Cryogenic Coolant During Machining of Precipitation-Hardened SS; Springer Proceedings in Materials; Springer: Singapore, 2024; Volume 54, pp. 177–188. [Google Scholar] [CrossRef]
  19. Roushan, A. Chetan Effect of Discrete and Continuous Texture Geometries on Tool Wear and Derivative Cutting Effect during the Machining. Wear 2025, 568–569, 205964. [Google Scholar] [CrossRef]
  20. Liu, D.; Wang, W.; Wang, L. Energy-Efficient Cutting Parameters Determination for NC Machining with Specified Machining Accuracy. Procedia CIRP 2017, 61, 523–528. [Google Scholar] [CrossRef]
  21. Dhage, S.; Jayal, A.D.; Sarkar, P. Effects of Surface Texture Parameters of Cutting Tools on Friction Conditions at Tool-Chip Interface during Dry Machining of AISI 1045 Steel. Procedia Manuf. 2019, 33, 794–801. [Google Scholar] [CrossRef]
  22. Rajbongshi, S.K.; Sarma, D.K. Performance Parameters Studies in Machining of AISI D2 Steel with Dot-Textured, Groove-Textured & Non-Textured Cutting Tool at the Flank Face. Int. J. Refract. Met. Hard Mater. 2019, 83, 104970. [Google Scholar] [CrossRef]
  23. Sugihara, T.; Nishimoto, Y.; Enomoto, T. Development of a Novel Cubic Boron Nitride Cutting Tool with a Textured Flank Face for High-Speed Machining of Inconel 718. Precis. Eng. 2017, 48, 75–82. [Google Scholar] [CrossRef]
  24. Sun, J.; Duan, R.; Wang, Q.; Qu, B.; Wang, M. Effect of Derivative Cutting of Flank-Faced Textured Ceramic Tools on Machined Surface. J. Mater. Eng. Perform. 2024, 34, 13492–13513. [Google Scholar] [CrossRef]
  25. Fatima, A.; Mativenga, P.T. Performance of Flank Face Structured Cutting Tools in Machining of AISI/SAE 4140 over a Range of Cutting Speeds. Proc. Inst. Mech. Eng. Part B J. Eng. Manuf. 2016, 230, 3–18. [Google Scholar] [CrossRef]
  26. Liu, Y.; Deng, J.; Wu, F.; Duan, R.; Zhang, X.; Hou, Y. Wear Resistance of Carbide Tools with Textured Flank-Face in Dry Cutting of Green Alumina Ceramics. Wear 2017, 372–373, 91–103. [Google Scholar] [CrossRef]
  27. Debnath, S.; Reddy, M.M.; Yi, Q.S. Influence of Cutting Fluid Conditions and Cutting Parameters on Surface Roughness and Tool Wear in Turning Process Using Taguchi Method. Measurement 2016, 78, 111–119. [Google Scholar] [CrossRef]
  28. Bag, R.; Panda, A.; Sahoo, A.K.; Kumar, R. Sustainable High-Speed Hard Machining of AISI 4340 Steel Under Dry Environment. Arab. J. Sci. Eng. 2023, 48, 3073–3096. [Google Scholar] [CrossRef]
  29. Jurko, J.; Panda, A.; Zaborowski, T. Study of Evaluation Machinability of a Stainless Steels and Accompanying Phenomena in the Cutting Zone During Machining. In Trends in Vital Food and Control Engineering; IntechOpen: London, UK, 2012. [Google Scholar] [CrossRef]
  30. Uysal, A.; Jawahir, I.S. Analysis of Slip-Line Model for Serrated Chip Formation in Orthogonal Machining of AISI 304 Stainless Steel under Various Cooling/Lubricating Conditions. J. Manuf. Process. 2021, 67, 447–460. [Google Scholar] [CrossRef]
  31. Singh, A.; Thakur, A.; Gangopadhyay, S. Influence of MoS2-Based Nanofluid Minimum Quantity Lubrication on Machining Performance of AISI 316L Stainless Steel. J. Mater. Eng. Perform. 2024, 34, 5184–5195. [Google Scholar] [CrossRef]
  32. Das, A.; Padhan, S.; Das, S.R.; Alsoufi, M.S.; Ibrahim, A.M.M.; Elsheikh, A. Performance Assessment and Chip Morphology Evaluation of Austenitic Stainless Steel under Sustainable Machining Conditions. Metals 2021, 11, 1931. [Google Scholar] [CrossRef]
  33. Mahdavinejad, R.A.; Saeedy, S. Investigation of the Influential Parameters of Machining of AISI 304 Stainless Steel. Sadhana Acad. Proc. Eng. Sci. 2011, 36, 963–970. [Google Scholar] [CrossRef]
  34. Thamizhmanii, S.; Hasan, S. Machinability Study Using Chip Thickness Ratio on Difficult to Cut Metals by Cbn Cutting Tool. Key Eng. Mater. 2012, 504–506, 1317–1322. [Google Scholar] [CrossRef]
  35. Tamizharasan, T.; Senthilkumar, N.; Selvakumar, V.; Dinesh, S. Taguchi’s Methodology of Optimizing Turning Parameters over Chip Thickness Ratio in Machining P/M AMMC. SN Appl. Sci. 2019, 1, 160. [Google Scholar] [CrossRef]
  36. Soni, H.; Mashinini, P.M. An Analysis on Tool-Chip Interaction During Dry Machining of SS316 Using Textured Carbide Tools. Arab. J. Sci. Eng. 2021, 46, 7611–7621. [Google Scholar] [CrossRef]
  37. Abellán-Nebot, J.V.; Vila Pastor, C.; Siller, H.R. A Review of the Factors Influencing Surface Roughness in Machining and Their Impact on Sustainability. Sustainability 2024, 16, 1917. [Google Scholar] [CrossRef]
  38. Rathod, N.J.; Chopra, M.K.; Shelke, S.N.; Chaurasiya, P.K.; Kumar, R.; Saxena, K.K.; Prakash, C. Investigations on Hard Turning Using SS304 Sheet Metal Component Grey Based Taguchi and Regression Methodology. Int. J. Interact. Des. Manuf. 2024, 18, 2653–2664. [Google Scholar] [CrossRef]
Figure 1. The experimental setup, apparatus, materials, and outline of the methods.
Ceramics 08 00097 g001
Figure 2. Cutting insert with wave textures on the flank face: (a) schematic representation, (b) microscopic visualization of the actual insert.
Ceramics 08 00097 g002
Figure 3. Mean responses and standard error bars from replicated experiments for (a) chip thickness, (b) chip thickness ratio, and (c) surface roughness.
Ceramics 08 00097 g003aCeramics 08 00097 g003b
Figure 4. Chips thickness with corresponding actual pictures and optical images, for all experiments.
Ceramics 08 00097 g004aCeramics 08 00097 g004bCeramics 08 00097 g004cCeramics 08 00097 g004dCeramics 08 00097 g004e
Figure 5. Mean chip thickness values at each cutting parameter level.
Ceramics 08 00097 g005
Figure 6. Mean chip thickness ratios at each cutting parameter level.
Ceramics 08 00097 g006
Figure 7. Mean surface roughness at each cutting parameter level.
Ceramics 08 00097 g007
Table 1. Cutting conditions and other relevant details.
WorkpieceStainless steel grade AISI 316 round bars of initial diameter 60 mm and length 200 mm
Chemical composition in % weight: 16–18 (Cr), 10–14 (Ni), 2–3 (Mo), 0.045 (P), 0.030 (S), 0.08 (C), 0.10 (N), 2 (Mn), and 0.75 (Si); and the remaining is Fe.
Cutting
tool
Sandvik ISO standard CNMG 120404 uncoated tungsten carbide inserts in rhombic shape with wave textures on the flank face
Tool holderISO standard DCLNR 2525M12
Basic geometryMain cutting-edge angle: 95°, rake angles: 6°, and nose radius: 0.4 mm
Cutting speed70, 120, 170 m/min
Feed rate0.10, 0.15, 0.20 mm/rev
Depth of cut0.5, 1.0, 1.5 mm
Cutting
environment
Dry
Design of
experiments
Orthogonal array of Taguchi L9
Turning time300 s
Machine toolMascot 1600 lathe machine tool, made by Lathes, Colchester, UK with a maximum RPM of 1600 and a spindle power of 12.5 HP
Performance
characteristics
Chip analysis: Chip morphology, chip thickness and its ratio, and surface roughness
Measuring
equipment/devices
Olympus BX-51 fluorescent microscope from Olympus, Tokyo, Japan for measuring chip thickness and the corresponding images
TMR200 surface roughness tester manufactured by TMTeck Instrument Co., Ltd., Beijing, China. Used for surface roughness measurement
Table 2. Experimental results.
Exp.vc
(m/min)
fr
(mm/rev)
dc
(mm)
Chip Thickness
(µm)
Chip Thickness RatioAverage Surface Roughness
(µm)
R1R2AverageR1R2AverageR1R2Average
1700.100.501200.301195.521197.910.0830.0830.0831.9932.0342.014
21200.151.501321.841373.731347.790.1130.1110.1122.9012.8002.851
31700.201.00916.95953.93935.440.2180.2140.2165.0264.9965.011
4700.151.00786.52802.06794.290.1910.1890.1902.9483.0012.975
51200.200.50683.46720.50701.980.2930.2850.2893.3123.2123.262
61700.101.501415.731399.951407.840.0710.0710.0711.9722.0001.986
7700.201.501522.301515.021518.660.1310.1320.1325.1005.2005.150
81200.101.00989.02980.07984.550.1010.1020.1011.7571.8601.809
91700.150.50486.14429.14457.640.3090.3280.3181.6151.6751.645
R1 and R2: Replications.
Table 3. Analysis of Variance for chip thickness.
SourceDFAdj SSAdj MSF-Valuep-Value
Model3727,751242,5844.270.076
Linear3727,751242,5844.270.076
vc184,00284,0021.480.278
fr131,42431,4240.550.491
dc1612,325612,32510.780.022 *
Error5284,09856,820
Total81,011,849
R2: 71.92%
* Indicates the significant parameters.
Table 4. Analysis of Variance for chip thickness ratio.
SourceDFAdj SSAdj MSF-Valuep-Value
Model30.0543460.0181158.210.022 *
Linear30.0543460.0181158.210.022 *
vc10.0066830.0066833.030.142
fr10.0241550.02415510.950.021 *
dc10.0235090.02350910.660.022 *
Error50.0110270.002205
Total80.065373
R2: 83.13%
* Indicates the significant parameters.
Table 5. Analysis of Variance for average surface roughness.
SourceDFAdj SSAdj MSF-Valuep-Value
Model311.60443.86818.060.023 *
Linear311.60443.86818.060.023 *
vc10.3730.3730.780.418
fr19.66479.664720.130.006 *
dc11.56671.56673.260.131
Error52.4010.4802
Total814.0054
R2: 82.86%
* Indicates the significant parameters.
Table 6. S/N ratios for chip thickness.
vcfrdcChip ThicknessS/N Ratios
700.100.51197.91−61.5685
1200.151.51347.79−62.5924
1700.201.0935.44−59.4203
700.151.0794.29−57.9996
1200.200.5701.98−56.9265
1700.101.51407.84−62.9711
700.201.51518.66−63.6292
1200.101.0984.55−59.8647
1700.150.5457.64−53.2105
Table 7. Response table for Signal-to-Noise ratios of chip thickness.
Cutting Parameters
Levelvcfrdc
1−61.07−61.47−57.24 *
2−59.79−57.93 *59.79
3−58.53 *−59.99−63.06
Delta ( Δ )2.533.535.83
Rank321
* Indicates the highest S/N ratio, suggesting the optimal parameter level.
Disclaimer/Publisher’s Note: The statements, opinions and data contained in all publications are solely those of the individual author(s) and contributor(s) and not of MDPI and/or the editor(s). MDPI and/or the editor(s) disclaim responsibility for any injury to people or property resulting from any ideas, methods, instructions or products referred to in the content.