Article

Decarbonisation of Earthenware Ceramic Production Using Bivalve Shell Waste

by
Inês Silveirinha Vilarinho
1,*,
Miguel Ferreira
1,2,3,
Claúdia Miranda
2,
José Silva
2,
Sofia Batista
2,
Maria Clara Gonçalves
3 and
Maria Paula Seabra
1,*
1
Department of Materials and Ceramic Engineering, CICECO—Aveiro Institute of Materials, Campus Universitário de Santiago, University of Aveiro, 3810-193 Aveiro, Portugal
2
Grupo MCS Portugal, Zona Industrial de Oiã, Lote 34, 3770-908 Oiã, Portugal
3
Department of Materials Engineering/ICEMS, Instituto Superior Técnico, av. Rovisco Pais, 1049-001 Lisboa, Portugal
*
Authors to whom correspondence should be addressed.
Ceramics 2025, 8(2), 76; https://doi.org/10.3390/ceramics8020076
Submission received: 15 May 2025 / Revised: 6 June 2025 / Accepted: 16 June 2025 / Published: 19 June 2025
(This article belongs to the Special Issue Ceramic Materials for Industrial Decarbonization)

Abstract

:
To mitigate CO2 emissions from raw material decomposition and reduce the consumption of natural resources, this study investigated the use of mussel and oyster shell waste as secondary raw materials in earthenware production. Mineralogical, chemical and thermal analyses confirmed their suitability as sources of bio-calcite. Specimens incorporating various replacement levels (0–100%) showed no significant differences in key properties. Plates produced with mussel-derived bio-calcite in a pilot plant exhibited comparable properties to standard ceramics, demonstrating their industrial viability. CO2 emissions were reduced by 14% and 10% in mussel and oyster shell-based ceramics, respectively, potentially saving up to 53 kgCO2eq/t under the European Emissions Trading System, if the shells are classified as by-products. These findings demonstrated that bivalve shell waste can effectively replace mineral calcite in earthenware products, reducing CO2 emissions and virgin raw material consumption, diverting waste from landfills and promoting sustainability in the ceramic industry.

1. Introduction

Global CO2 emissions from the ceramic industry amount to approximately 19 million tonnes annually, representing about 1% of Europe’s total industrial emissions regulated under the EU Emissions Trading System (ETS) [1]. These emissions originate from three main sources: (i) fuel combustion for drying and firing processes; (ii) mineralogical transformation of the raw materials; and (iii) indirect emissions, mainly from electricity production. Among these, emissions resulting from the decomposition of carbonates (mainly calcite and dolomite) during firing account for approximately 17% of the total emissions.
Moving towards a robust circular economy is essential for sustainable development and resource efficiency. In 2022, only 11.5% of material resources utilised in Europe came from recycled waste materials, representing a modest increase of 3.3% compared to 2004 [2]. Despite this progress, the current circularity rate remains low, highlighting the urgent need for accelerated efforts in material reuse and recycling. The circularity rate, which measures the proportion of material resources derived from recycled waste materials, plays a key role in reducing the extraction of raw materials. However, this rate varies depending on the material type: 24% for metal ores, 14% for non-metallic minerals (including glass), 10% for biomass (including paper, wood, tissue, etc.) and only 3% for fossil fuels. In 2022, the Netherlands led with the highest circularity rate at 28%, followed by Belgium (22%) and France (19%). Conversely, Finland and Romania had the lowest rates (≈1%), with Ireland and Portugal slightly higher (≈2%) [2]. Increasing the circularity rate is crucial to reduce the environmental footprint of mining activities and minimise landfilled waste. Circular economy practices also reduce costs associated with raw material extraction, processing and waste management. To enhance circularity, various strategies can be implemented, including the following: (i) advancing technology to enhance the efficiency and effectiveness of material recovery; (ii) promoting eco-design to develop products incorporating wastes and facilitating easy disassembly for recycling and reuse; (iii) implementing and strengthening regulations on recycling and waste reduction; (iv) educating the public on the importance of recycling; and (v) fostering collaborations between industries to use exogenous waste. By integrating these strategies, a more sustainable and resource-efficient economy can be achieved.
Calcite, or calcium carbonate (CaCO3), is a widely available mineral, constituting around 4 wt.% of the Earth’s crust [3]. In Europe, its annual consumption is estimated to be around 20 million tonnes [4]. Despite its abundance, calcite extraction and processing have significant environmental impacts, such as soil degradation, water shortages, biodiversity loss, damage of ecosystem functions and global warming potential [5]. To mitigate these effects and increase the circularity rate, the scientific community, together with the mining and processing industry, have been exploring the use of calcium carbonate-based waste as a sustainable alternative. Several sectors have investigated these applications. Studies have examined calcium carbonate waste in construction materials [6], dietary supplements [7] and bioceramics [8]. Ceren et al. (2020) [9] investigated the use of seashells in glaze compositions and concluded that it is possible to produce transparent glazes with a 20 wt.% of seashells in an eco-friendly and cost-effective manner. Peceno et al. (2021) [10] assessed the feasibility of replacing up to 60% of gypsum with seashell waste in fireproofing materials. Matej (2021) [11] analysed the milling energy requirements of several calcium carbonate-based waste sources, such as eggshells, oyster shells, shrimp shells, nacre or scallop shells and bones, identifying bioceramic applications—particularly hydroxyapatite production—as the primary use for these materials. Vilarinho et al. (2022) [12] studied the incorporation of bio-calcite from eggshell waste in ceramic wall tiles and found that, at laboratory scale, eggshell waste can totally substitute for calcite. However, despite these promising findings, most of these applications have not yet reached an industrial scale, highlighting the need for practical studies on the large-scale implementation. Some concerns may arise from the fact that transportation requirements could reduce the attractiveness of using waste materials. However, as highlighted by Vieira et al. [13], the cost of landfilling waste is approximately 60 €/t in Portugal, whereas transporting 1 t over a distance of 68 km costs only 2.80 €/t (based on a 10 t truckload and a diesel price of 1.525 €/L). Consequently, even for moderate transport distances, the use of waste materials remains economically viable for the waste producer. For material manufacturers, incorporating waste offers significant environmental and regulatory benefits, including the reduction in virgin raw material consumption and alignment with circular economy principles.
This study aimed to address that gap by evaluating the substitution of calcite with bio-calcite derived from mussel and oyster shells in earthenware ceramic production. For mussel shell bio-calcite, various substitution levels were formulated and tested with different particle sizes. Specimens were produced both at laboratory and pilot plant scales, and their properties were analysed. Additionally, industrially glazed plates were produced and tested. Finally, the CO2 emissions associated with different calcium carbonate sources were calculated and analysed, providing a comprehensive assessment of the environmental benefits of calcite substitution.

2. Materials and Methods

2.1. Raw Materials

The raw materials necessary to formulate earthenware ceramic bodies (clays—kaolinite, muscovite—and silica) were supplied by Mota Ceramic Solutions (MCS) in the liquid form, except the kaolin and calcite that were provided separately in powder. Mussel shell waste was supplied by Finisterra, a bivalve transformation facility in Sagres (Algarve), while oyster shell waste was collected from a local restaurant in Aveiro, see Figure 1.
The mussel and oyster shell waste were dried in an oven at 100 °C for 24 h. Then, each calcium carbonate source (calcite, mussel shell and oyster shell) was mixed with kaolin in a weight ratio of 11.5:1. The dry material (500 g) was milled in a porcelain jar with alumina balls (400 g) and water (250 mL) until the desired particle size was achieved. The resulting suspensions were sieved at 720 μm and dried at 120 °C for 24 h, yielding bio-calcite powders for each type of waste: mussel (Mussel c) and oyster (Oyster c) bio-calcite.

2.2. Laboratory Scale Specimen Preparation

The Brongniart equation was used to determine the solid content in the suspensions:
P = d 1000 s s 1
where P is the mass of dry solids in 1000 mL of the suspension (g), d is the density of the suspension (g/cm3) and s is the specific gravity of solids (a value of 2.58 g/cm3 was considered).
Calcite and bio-calcite powders were added to the suspensions, homogenised in a blunger and sieved at 125 μm. Subsequently, to obtain the plastic ceramic body (1 kg of each formulation), the suspensions were dried in gypsum moulds until reaching the desired humidity content (≈20 wt.%). Table 1 presents the prepared formulations and their calcium carbonate sources. Herein, STD refers to the standard formulation, while M and O indicate the use of mussel- and oyster-shell-derived calcium carbonate, respectively. The number following each code denotes the substitution level (25, 50, 75 or 100 wt.%). The standard earthenware formulation included calcite with a median particle diameter (D50) of around 4 μm. To assess the influence of particle size, mussel bio-calcite was also tested at D50 values of 3, 5 and 6 μm, designated as M100G3, M100G5 and M100G6, respectively. Please note that due to the milling time required for the oyster bio-calcite, only 2 substitution levels were tested, at ≈5 times higher than calcite.
Two shaping methods were used to prepare the samples: (i) extrusion to obtain cylindrical specimens (d = 8 mm, l = 150 mm, see Figure 1) and (ii) uniaxial hydraulic pressing (RAM from MACOCER) for rectangular specimens (l = 100 mm, w = 85 mm, h = 7 mm). After the shaping process, the specimens were dried at 100 °C during 24 h and fired in a laboratory muffle kiln with a heating and cooling rate of 5 °C/min and a soaking time of 60 min. Four maximum firing temperatures were tested: 1025, 1050, 1075 and 1100 °C.

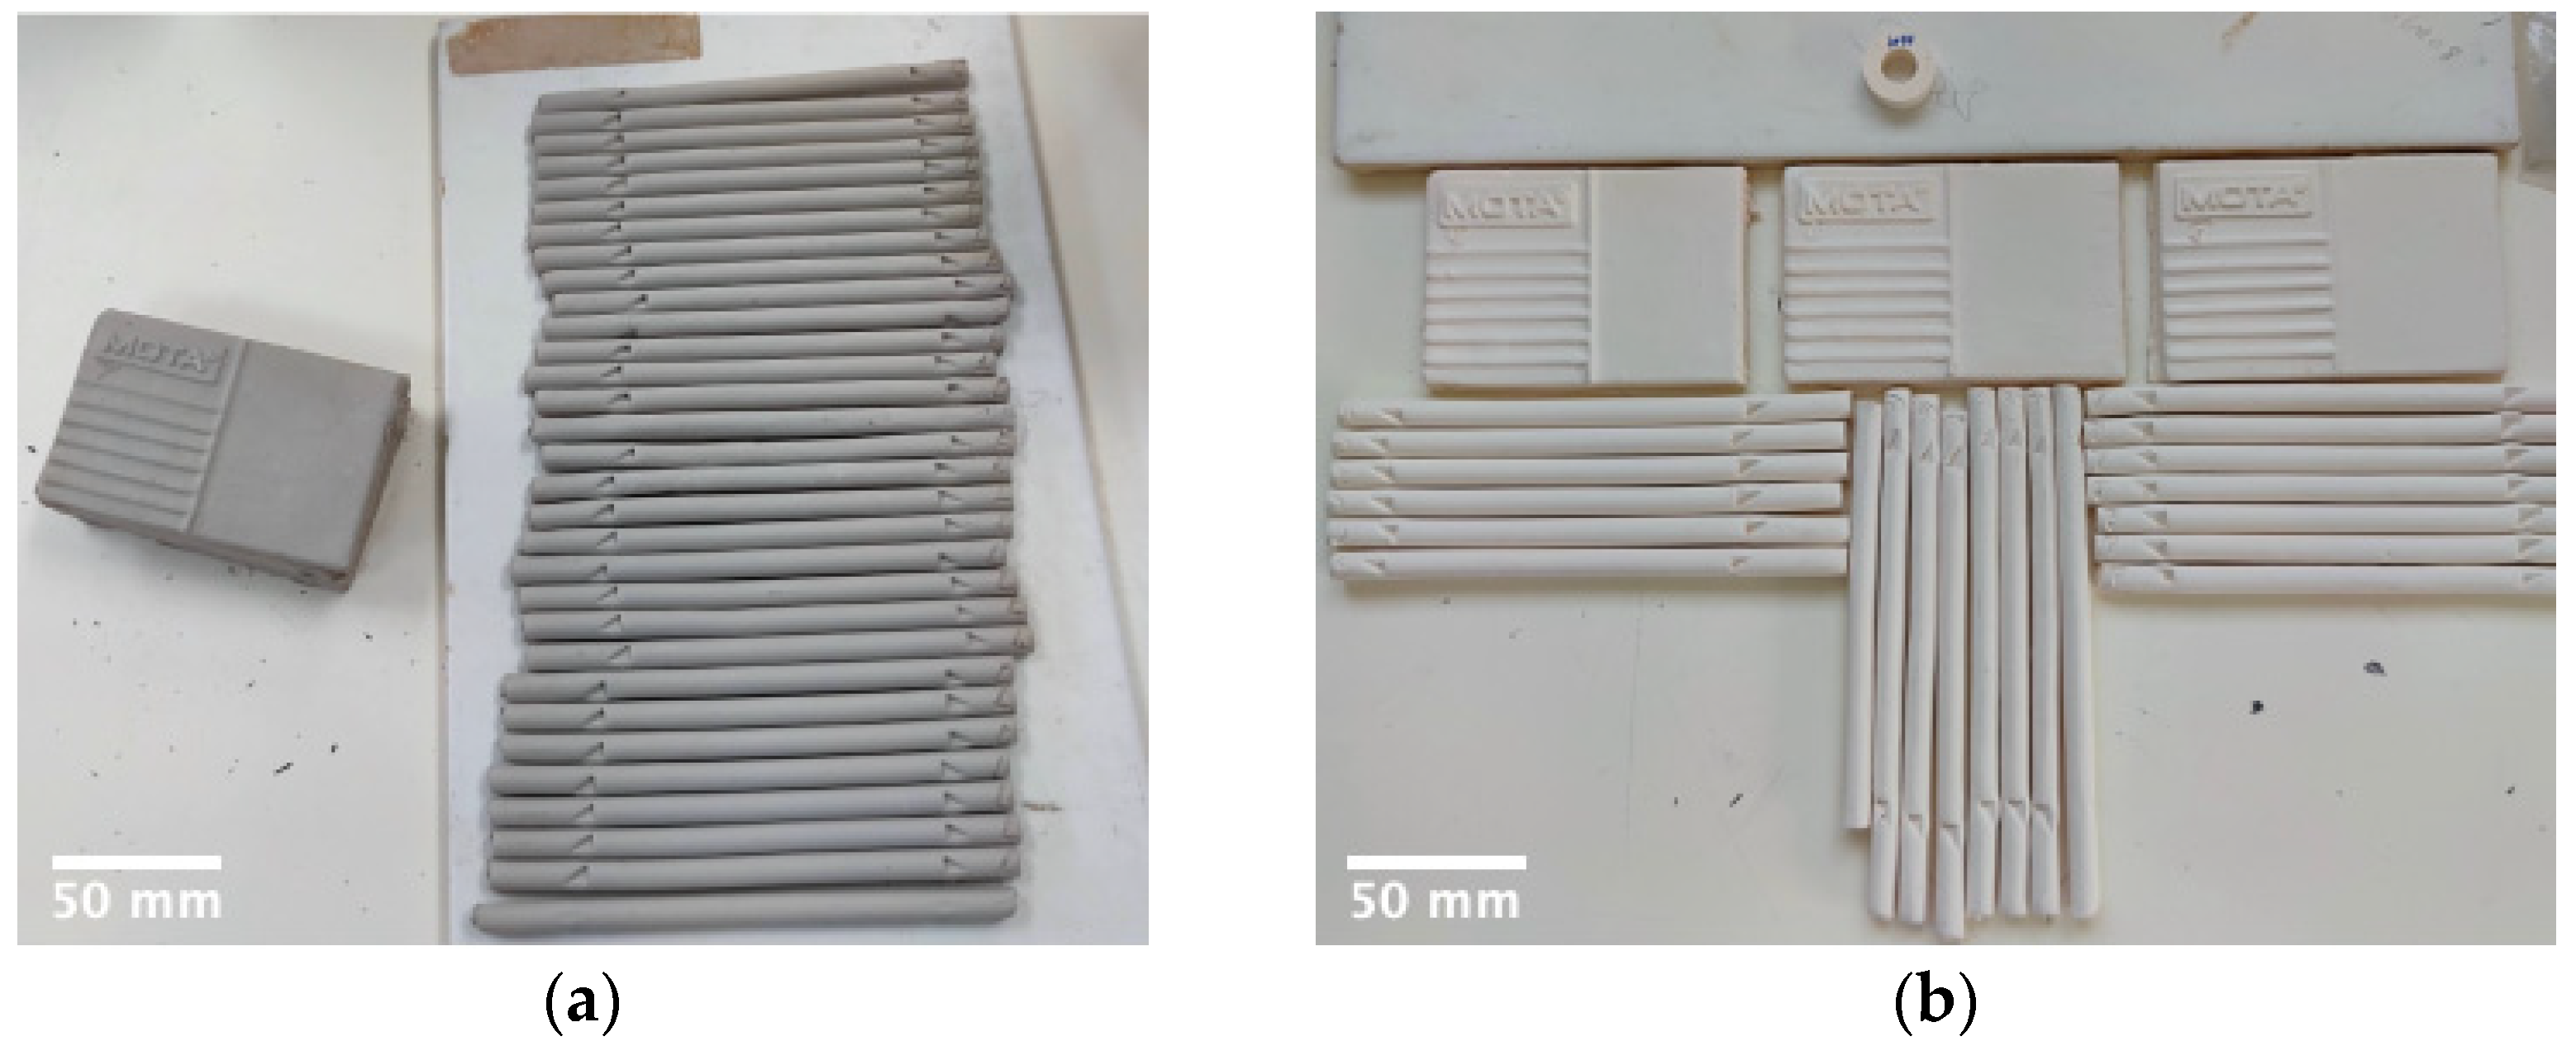
2.3. Pilot Plant Specimen and Prototype Preparation

The pilot plant trials were conducted at the MCS Company. Three formulations (300 kg each) were prepared: STD, M100 and M100G3. The mussel shell waste underwent similar pre-treatment as in the laboratory scale preparation, however a mill with a higher capacity (50 kg) was used. The bio-calcite was mixed with the other raw materials in a 1-tonne-capacity blunger, and the prepared suspensions were filter pressed to remove the excess water. The resulting filter-pressed cakes were extruded using a pugging machine (30 cm outlet diameter), producing pugged rods (each weighing around 18 kg).
Plates with a diameter of 28 cm were produced by uniaxial hydraulic pressing in the José Carlos Mateus S.A. factory (Caldas da Rainha, Portugal). The prototypes were dried at 100 °C during 24 h and biscuit fired at 1050 °C with a heating/cooling rate of 5 °C/min and a soaking time of 60 min. The plates were then coated, by pulverisation, with a white opaque shinning glaze and glost fired at a maximum temperature of 1000 °C. Additionally, cylindrical and rectangular specimens were prepared at the MCS R&D laboratory and subjected to the two firing cycles, biscuit and glost firing.

2.4. Characterisation Techniques

2.4.1. Calcium Carbonates and Ceramic Bodies

The chemical composition of all calcium carbonate sources and ceramic bodies were obtained by X-ray fluorescence (XRF, Philips X’Pert Pro MPD spectrometer, Amsterdam, The Netherlands) on a compressed pellet (10 g of dry and grounded (<63 µm) powder). Their mineralogical composition were assessed by X-ray diffraction (XRD) at room temperature using a θ/θ diffractometer (PANalytical’s X’Pert Pro, Tokyo, Japan) equipped with a fast RTMS detector (PIXcel 1D, PANalytical, Tokyo, Japan). Cu Kα radiation was used an applied voltage of 45 kV and a current of 40 mA, scanning over a 2θ range from 5 to 80°2θ, with a virtual step size of 0.02°2θ and a virtual time-per-step of 200 s. The thermal behaviour was determined by differential thermal/thermogravimetry analyses (DTA/TG) in Nexta STA300 equipment (Hitachi High-Technologies Corporation, Tokyo, Japan) from room temperature until 1200 °C, with a heating rate of 10 °C/min in argon. The granulometric distribution of the calcite, mussel and oyster bio-calcites (Mussel c and Oyster c, respectively) and the prepared pastes was characterised by a laser diffraction analyser (Mastersizer 3000, Malvern Panalytical, Malvern, UK). Prior to analysis, the powders were dispersed in water and wet-sieved through a 125 µm mesh to remove larger agglomerates.

2.4.2. Specimens and Prototypes

The flexural strength of the dried and fired specimens were evaluated using a three-point universal testing machine (Zick Rowell) with a 1 kN load at 0.5 mm/min, following ISO 10545-4 [14]. The firing shrinkage and water absorption (following BS EN 1217: 1998 [15]) were determined. The colour coordinates were assessed through a Konica Minolta CR300. The colorimetric stability, ΔE, was calculated according to Equation (2):
E = L 1 L 2 2 + a 1 a 2 2 + b 1 b 2 2 0.5
where L1, a1 and b1 are the colorimetric coordinates of the standard fired at 1050 °C and L2, a2 and b2 are the colorimetric coordinates of the sample. The mineralogical composition of the fired specimens at 1050 °C was evaluated (XRD, PANalytical’s X’Pert Pro) and their linear thermal expansion coefficients were calculated between 100 and 500 °C using a dilatometer Netsch dil 402C (Netzsch, Selb, Germany) with a heating rate of 10 °C/min.
The resistance of the plates to cracking was evaluated according to ISO 10545-11 [16]. In this test, the plates were subjected to 3 cycles of 3.5 bar pressure for 2 h in an autoclave. Afterwards, the glaze was inspected for the presence of cracks.

3. Results and Discussion

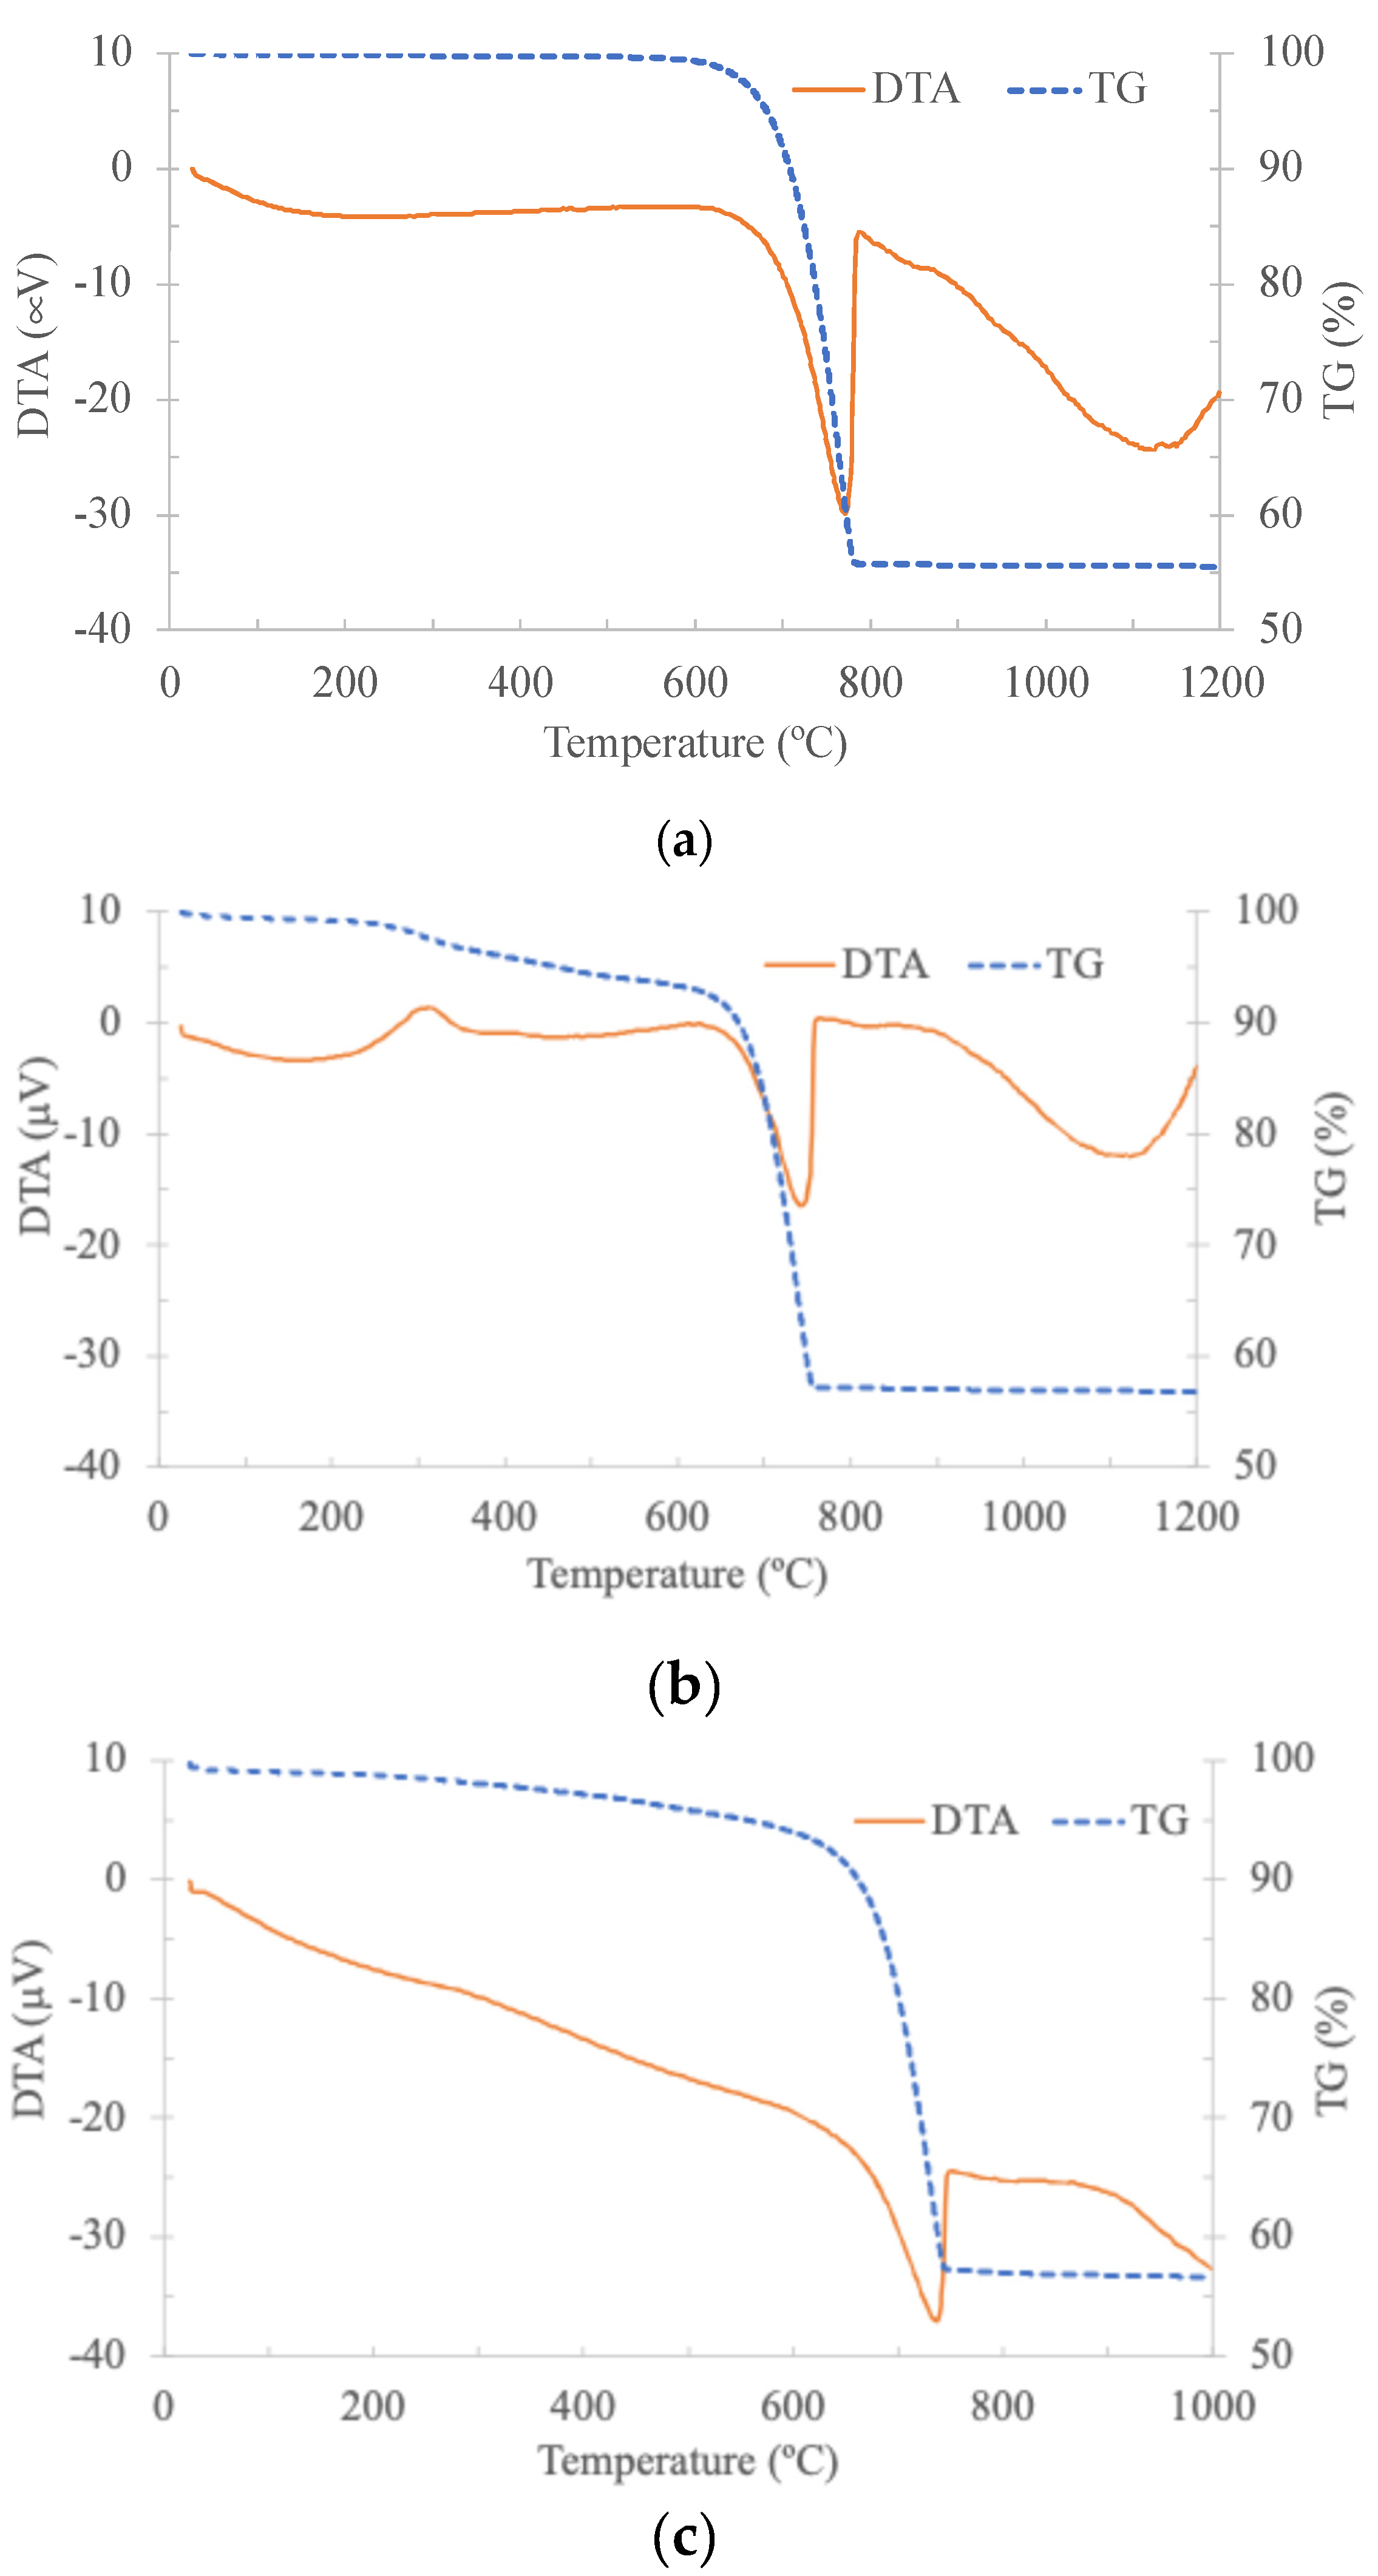
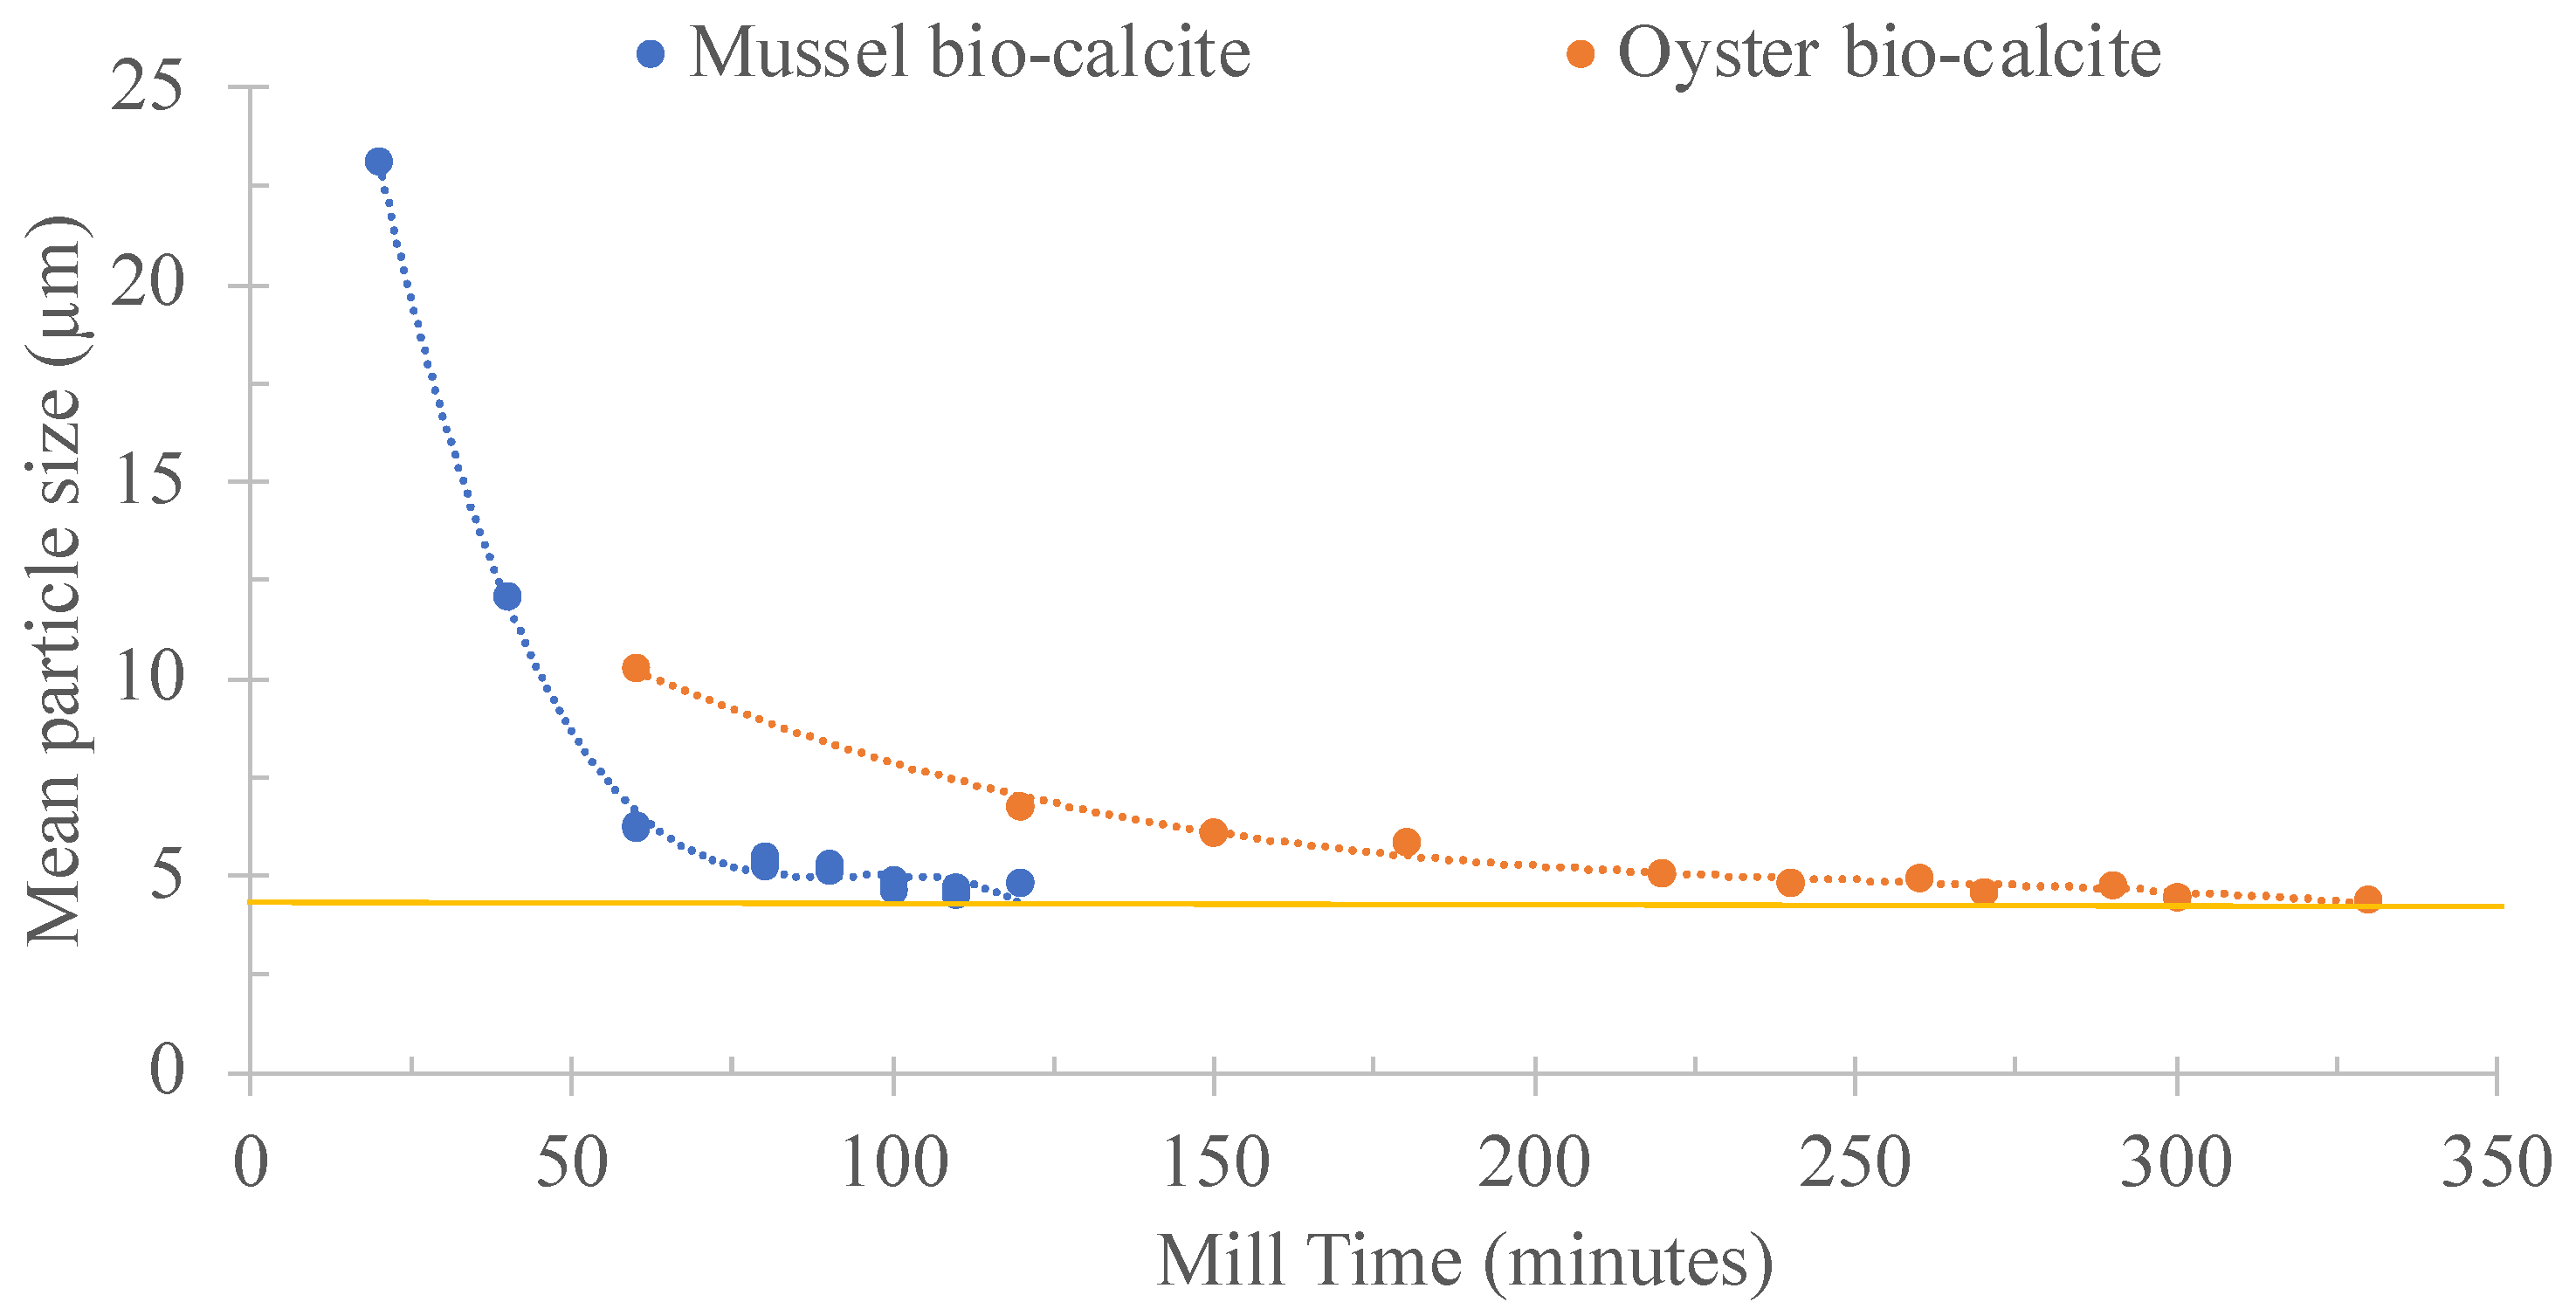
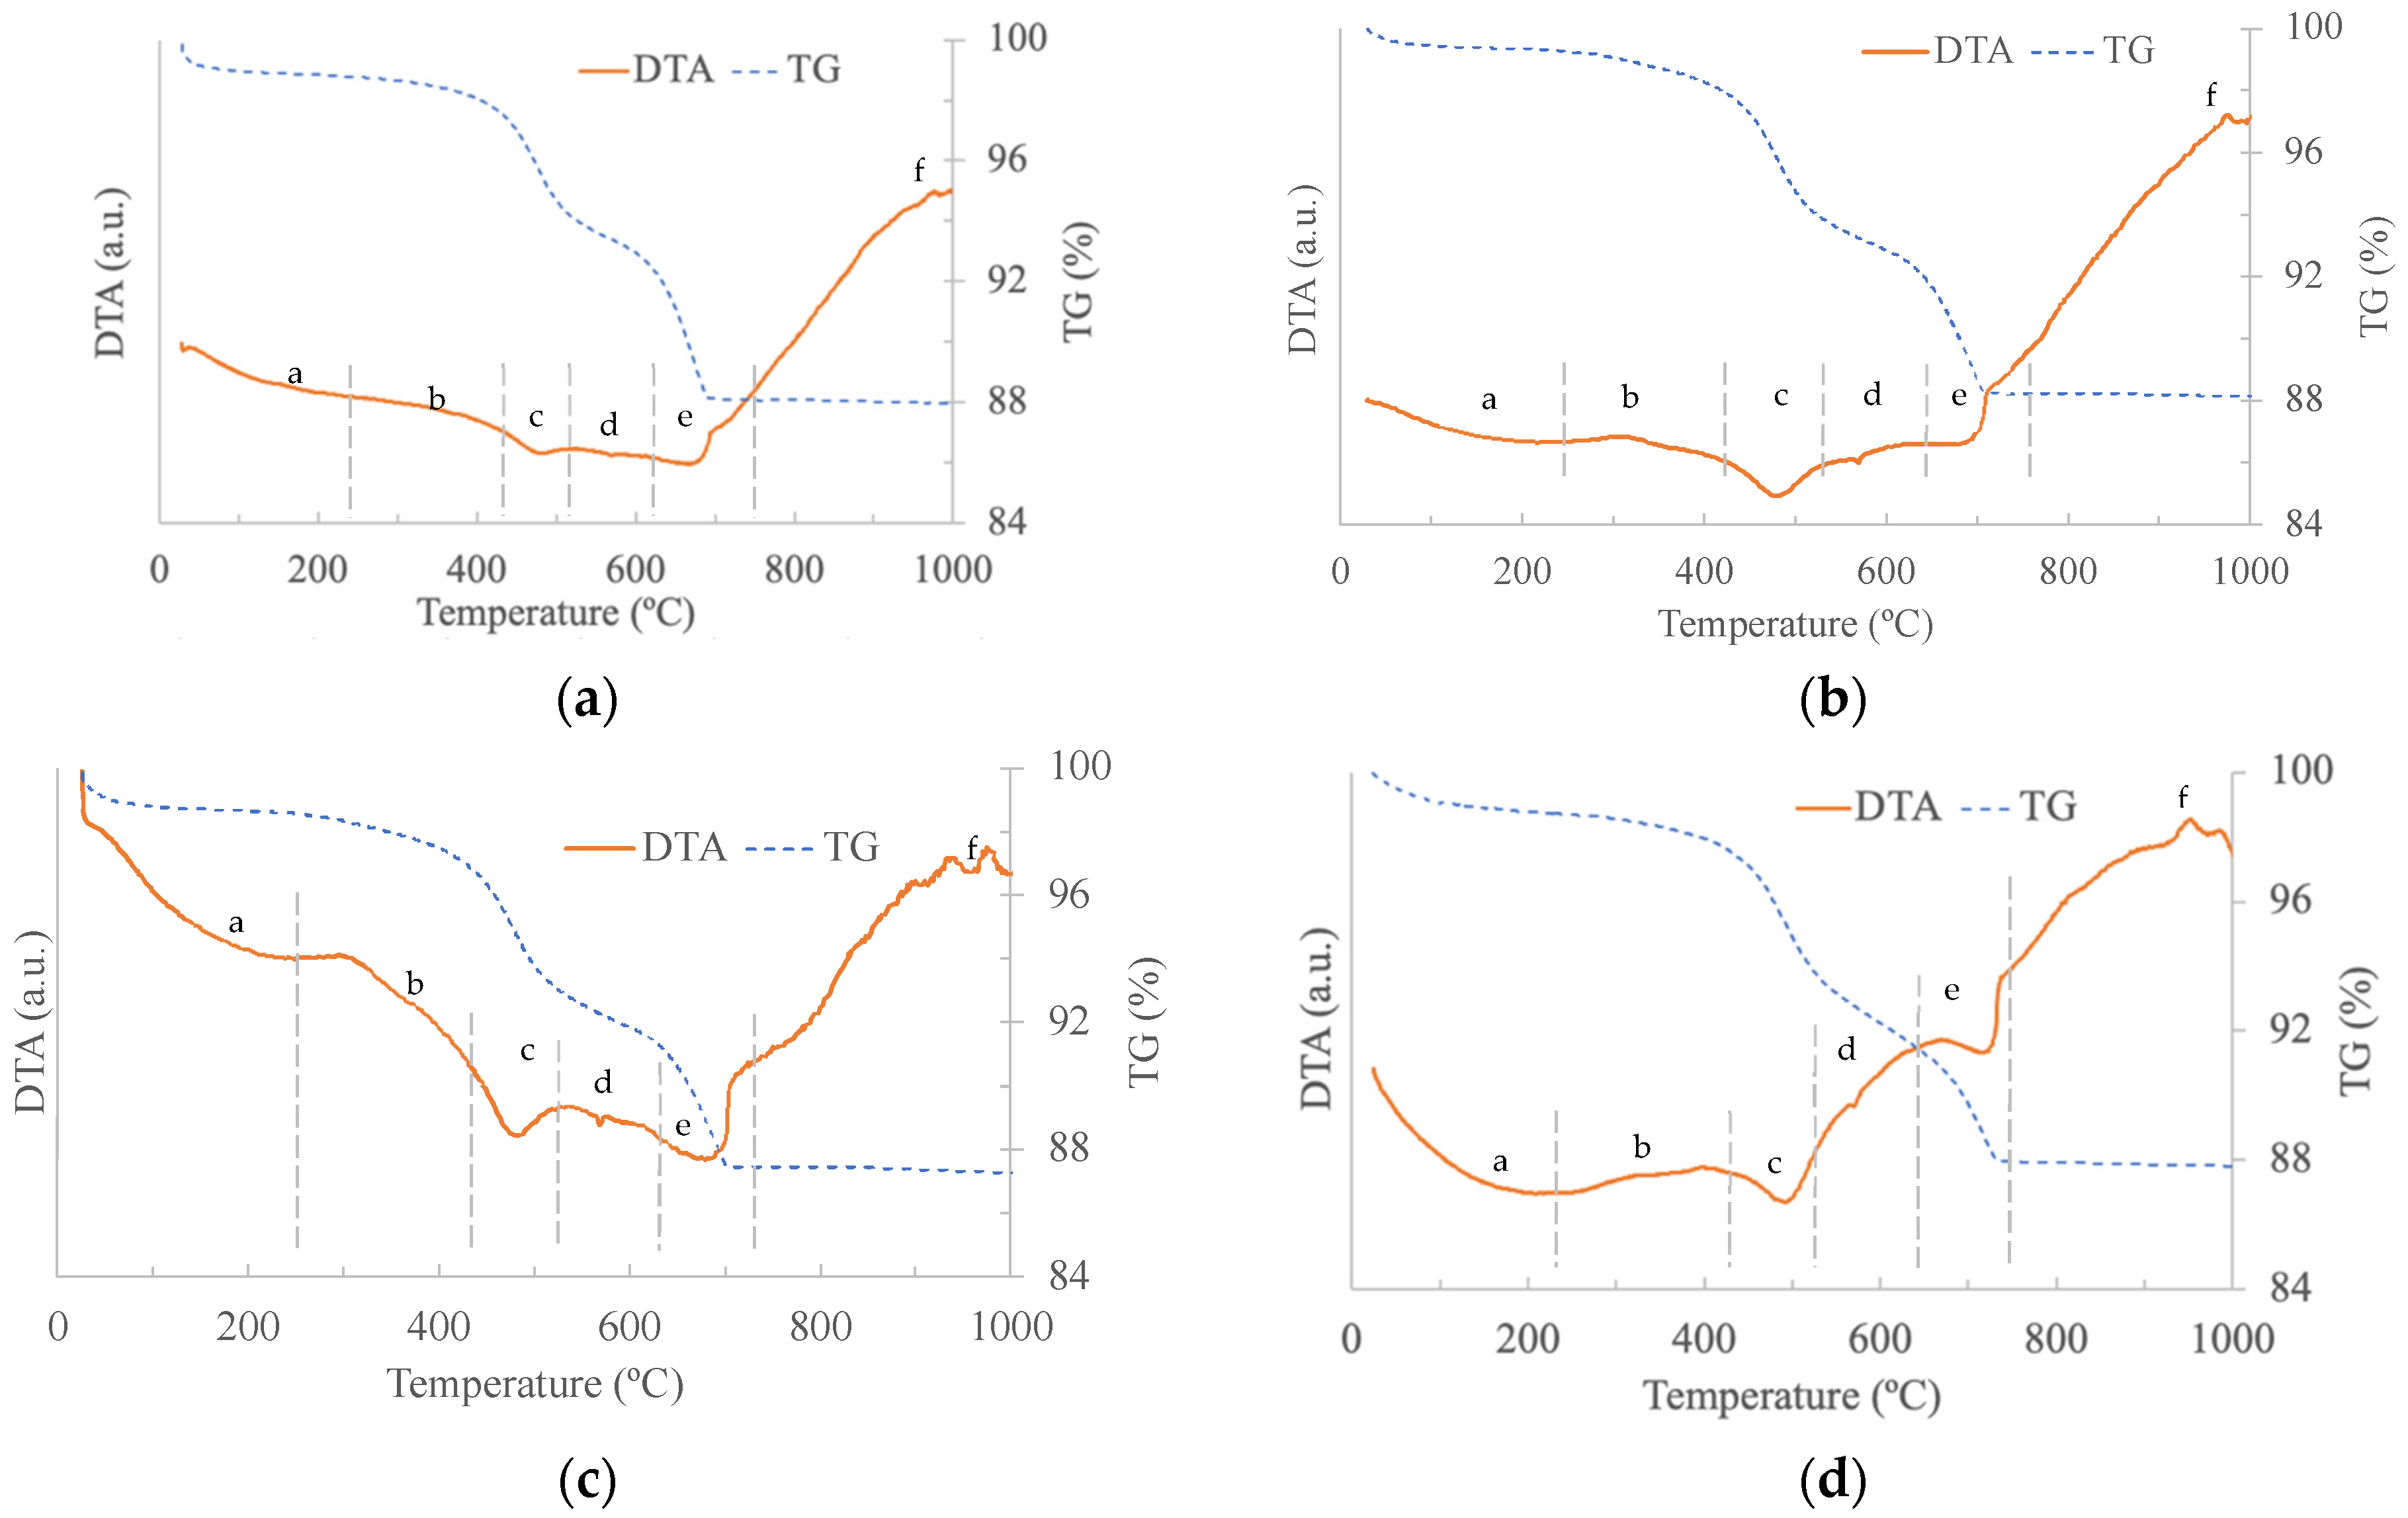
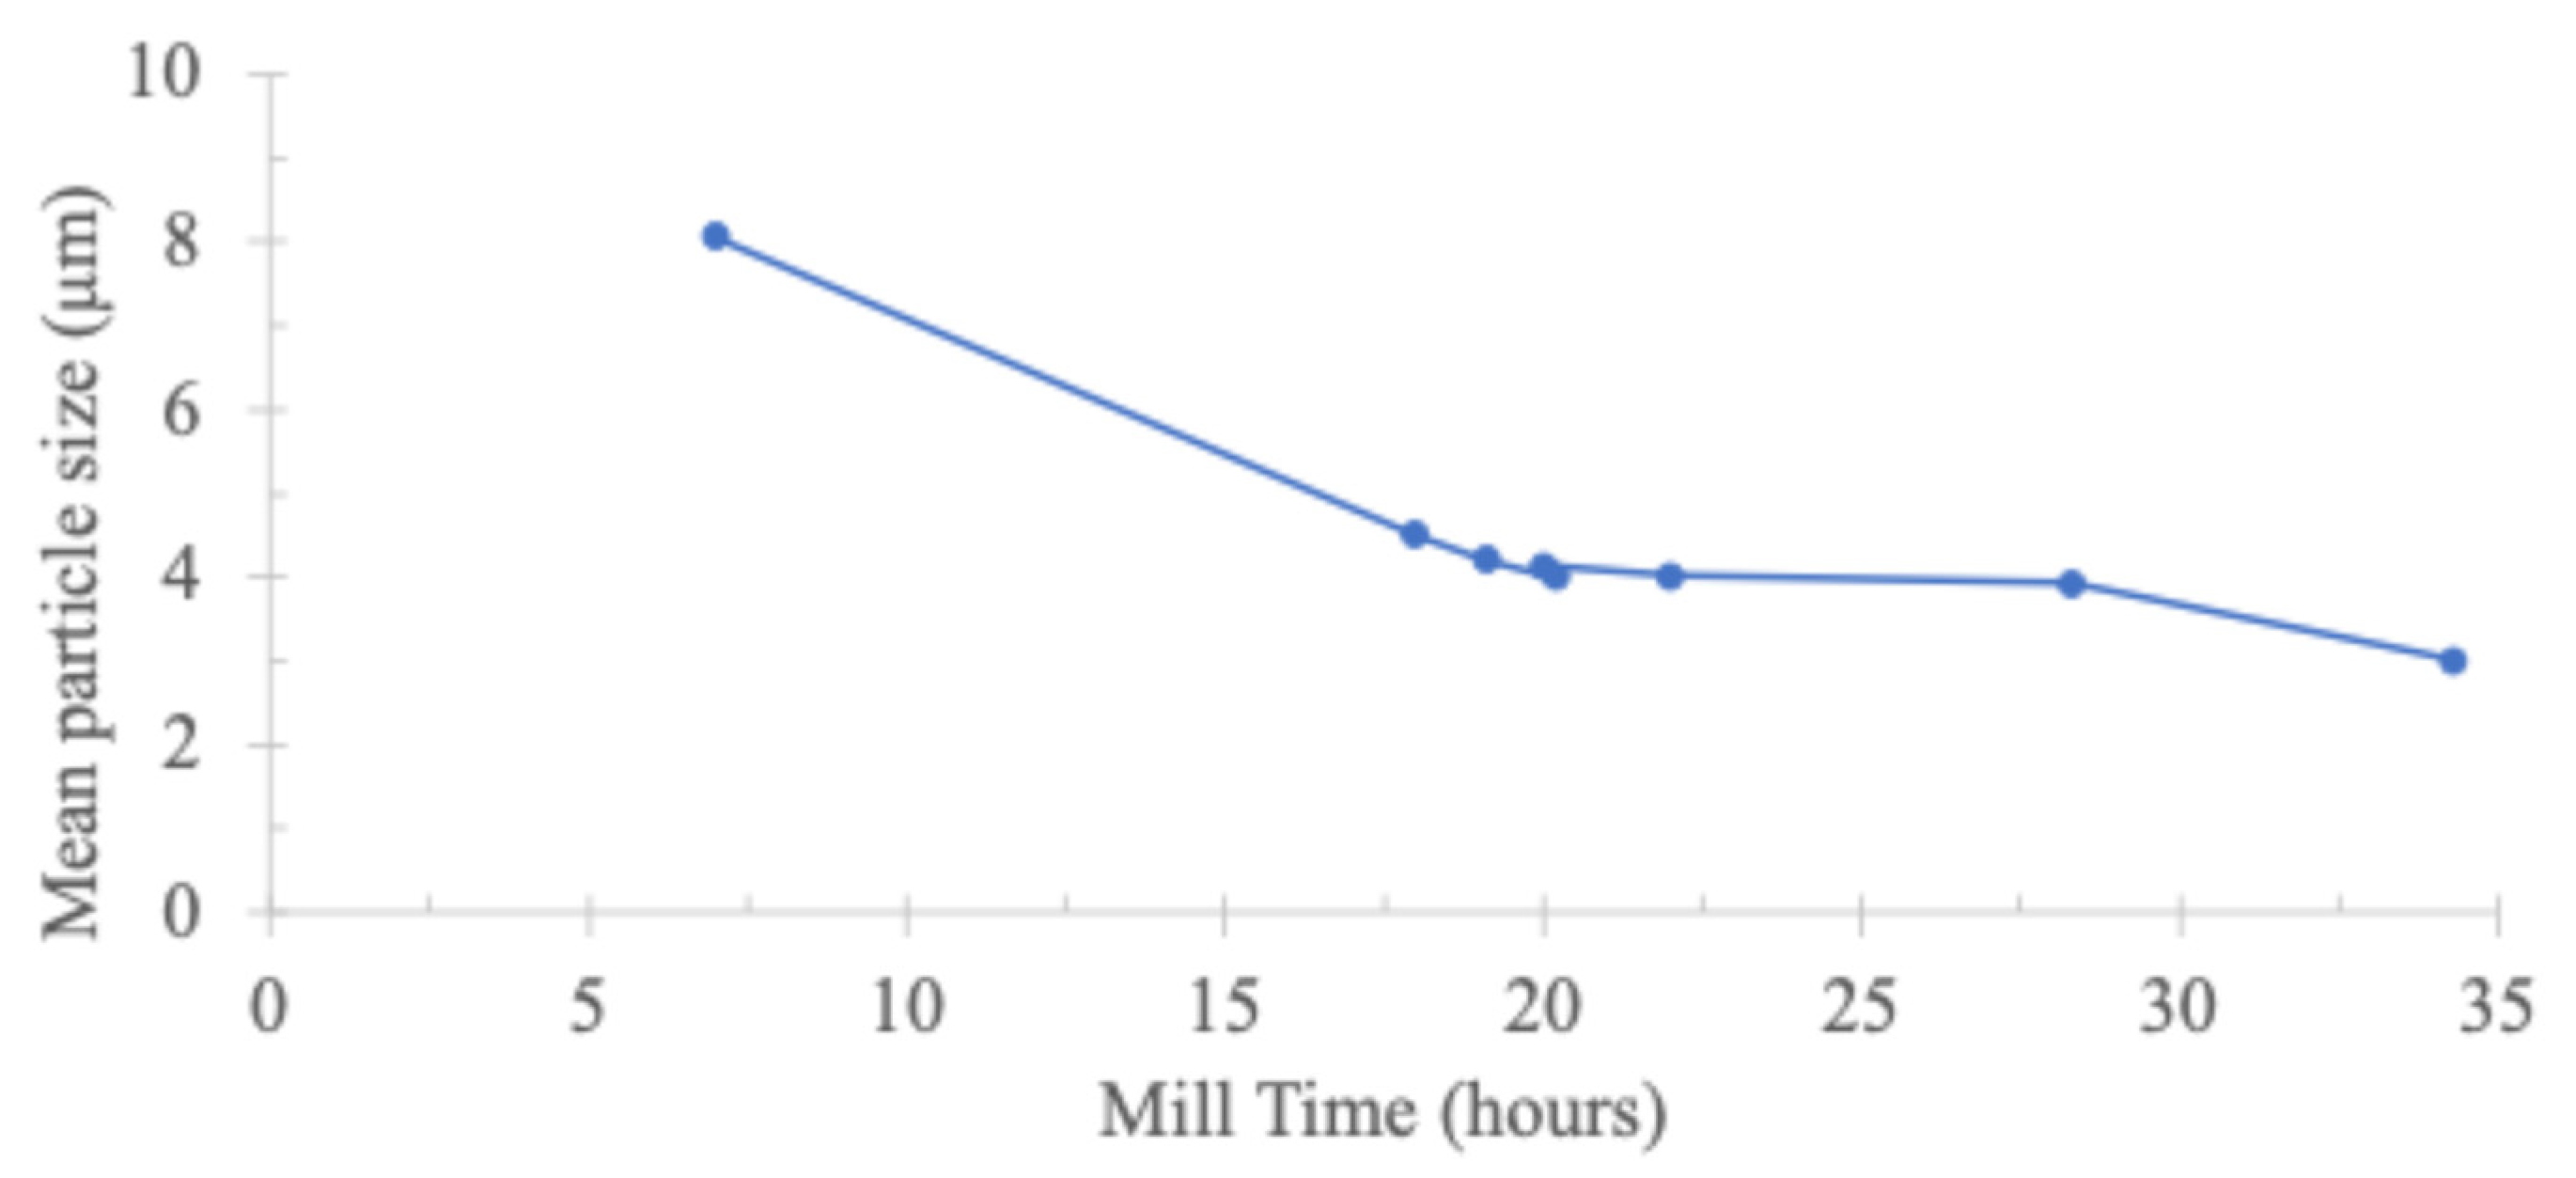
3.1. Calcium Carbonate Sources and Paste Characterisation

The chemical composition of all calcium carbonate sources, obtained by XRF, is presented in Table 2.
Regarding the calcium oxide content, calcite had the highest amount (55.74 wt.%), while mussel shell waste presented the lowest (48.05 wt.%). Additionally, the carbon content in mussel shell waste was slightly higher than in calcite (9.52 vs. 8.74 wt.%).
Figure 2 shows the XRD of the calcite, mussel shells and oyster shells. Their main crystalline phase in all the samples was calcite; however, aragonite was also detected in the oyster shell waste.
The differential thermal (DTA) and thermogravimetric (TG) analyses of calcite, mussel shells and oyster shells waste are presented in Figure 3. The TG curve of the calcite exhibited a single weight loss (≈45%), that occurred around 750–800 °C, corresponding to the calcium carbonate decomposition. This is typical behaviour of the calcite [17]. The oyster shell exhibited a similar behaviour, with a weight loss of ≈46%. The mussel waste presented a total weight loss of ≈43%, showing an exothermic reaction and a small weight loss around 300 °C, mainly due to organic matter (protein) decomposition.
The granulometric distribution of the commercial calcite milled for 60 min presented a normal particle size distribution with a mean diameter, D50, of ≈4 μm (Figure S1). The influence of grinding time on the D50 values of the mussel and oyster bio-calcite is shown in Figure 4, along with the target D50 value (≈4 μm, indicated by a horizontal line). The wastes were grounded in a jar mill, requiring 110 min for mussel and 315 min for oyster shells to achieve the desired particle size (D50 ≈ 4 μm).
Table 3 presents the efficiency of the milling process for the three CaCO3 sources. Among them, calcite exhibited the highest milling efficiency, achieving a mean particle size of 4 μm at a rate of 0.5 kg/h. In comparison, the efficiency decreased significantly for mussel shell (0.27 kg/h) and oyster shell (0.1 kg/h).
The chemical composition of the selected ceramic pastes (STD, M50, M100, O50 and O100) is presented in Table 4. As expected, the component content and LOI values were very similar for all the analysed pastes.
The granulometric distribution and key parameters (e.g., D50, D90) of the prepared pastes are presented in Figure S2 and Table 5. All the pastes exhibited bimodal distributions, and those with the same mean diameter maintained consistency across the different percentages of calcite replacement. This uniformity was evident in the similarity of the distributions (Figure S2) and the corresponding parameters outlined in Table 5. However, as expected, variations in the mean particle size value of the mussel bio-calcite led to distinct granulometric distributions. The B100G3 paste had the lowest D50 value (7.8 μm), representing a 7% reduction relatively to the standard paste. It also had a higher proportion of fine particles (<2 μm: 14.0%; <10 μm: 57.2%). Conversely, in the paste B100G6, the opposite trend was observed, with an increased D50 (13.8 μm) and D90 (47.0 μm), and a lower proportion of fine particles (<2 μm: 8.2%, <10 μm: 41.8%), when compared to the standard paste.
The crystalline phases of the ceramic pastes before being fired were the same in all pastes—quartz (Q), calcite (C), kaolinite (K) and muscovite (M); see Figure S3.
Figure 5 shows the results of the thermal analyses conducted on the prepared pastes, revealing similar thermogravimetric profiles for all the formulations. The initial weight loss (≈2 wt.%), that occurred between 100 to 250 °C (a) was associated with an endothermic peak and corresponded to the release of residual water still present in the pastes. In the M100 and M100G3 pastes, the exothermic peak around 300 °C (b) was attributed to the decomposition of organic matter present in the mussel shell waste, consistent with the observations in Figure 3. Subsequently, the endothermic reaction observed between 450 and 525 °C (c) was associated with the loss of the structural water of the clays and kaolin, resulting in a weight loss of ≈5%. The observed endothermic reaction, between 525 and 650 °C (d), was due to the allotropic transformation of quartz [17,19]. Between 650 and 800 °C (e), an endothermic reaction denoted the decomposition of calcium carbonate, with a weight loss of around 6%. Finally, an exothermic reaction is noticed around 970 °C, corresponding to crystallisation of the anorthite phase (CaAl2Si2O8) [20].

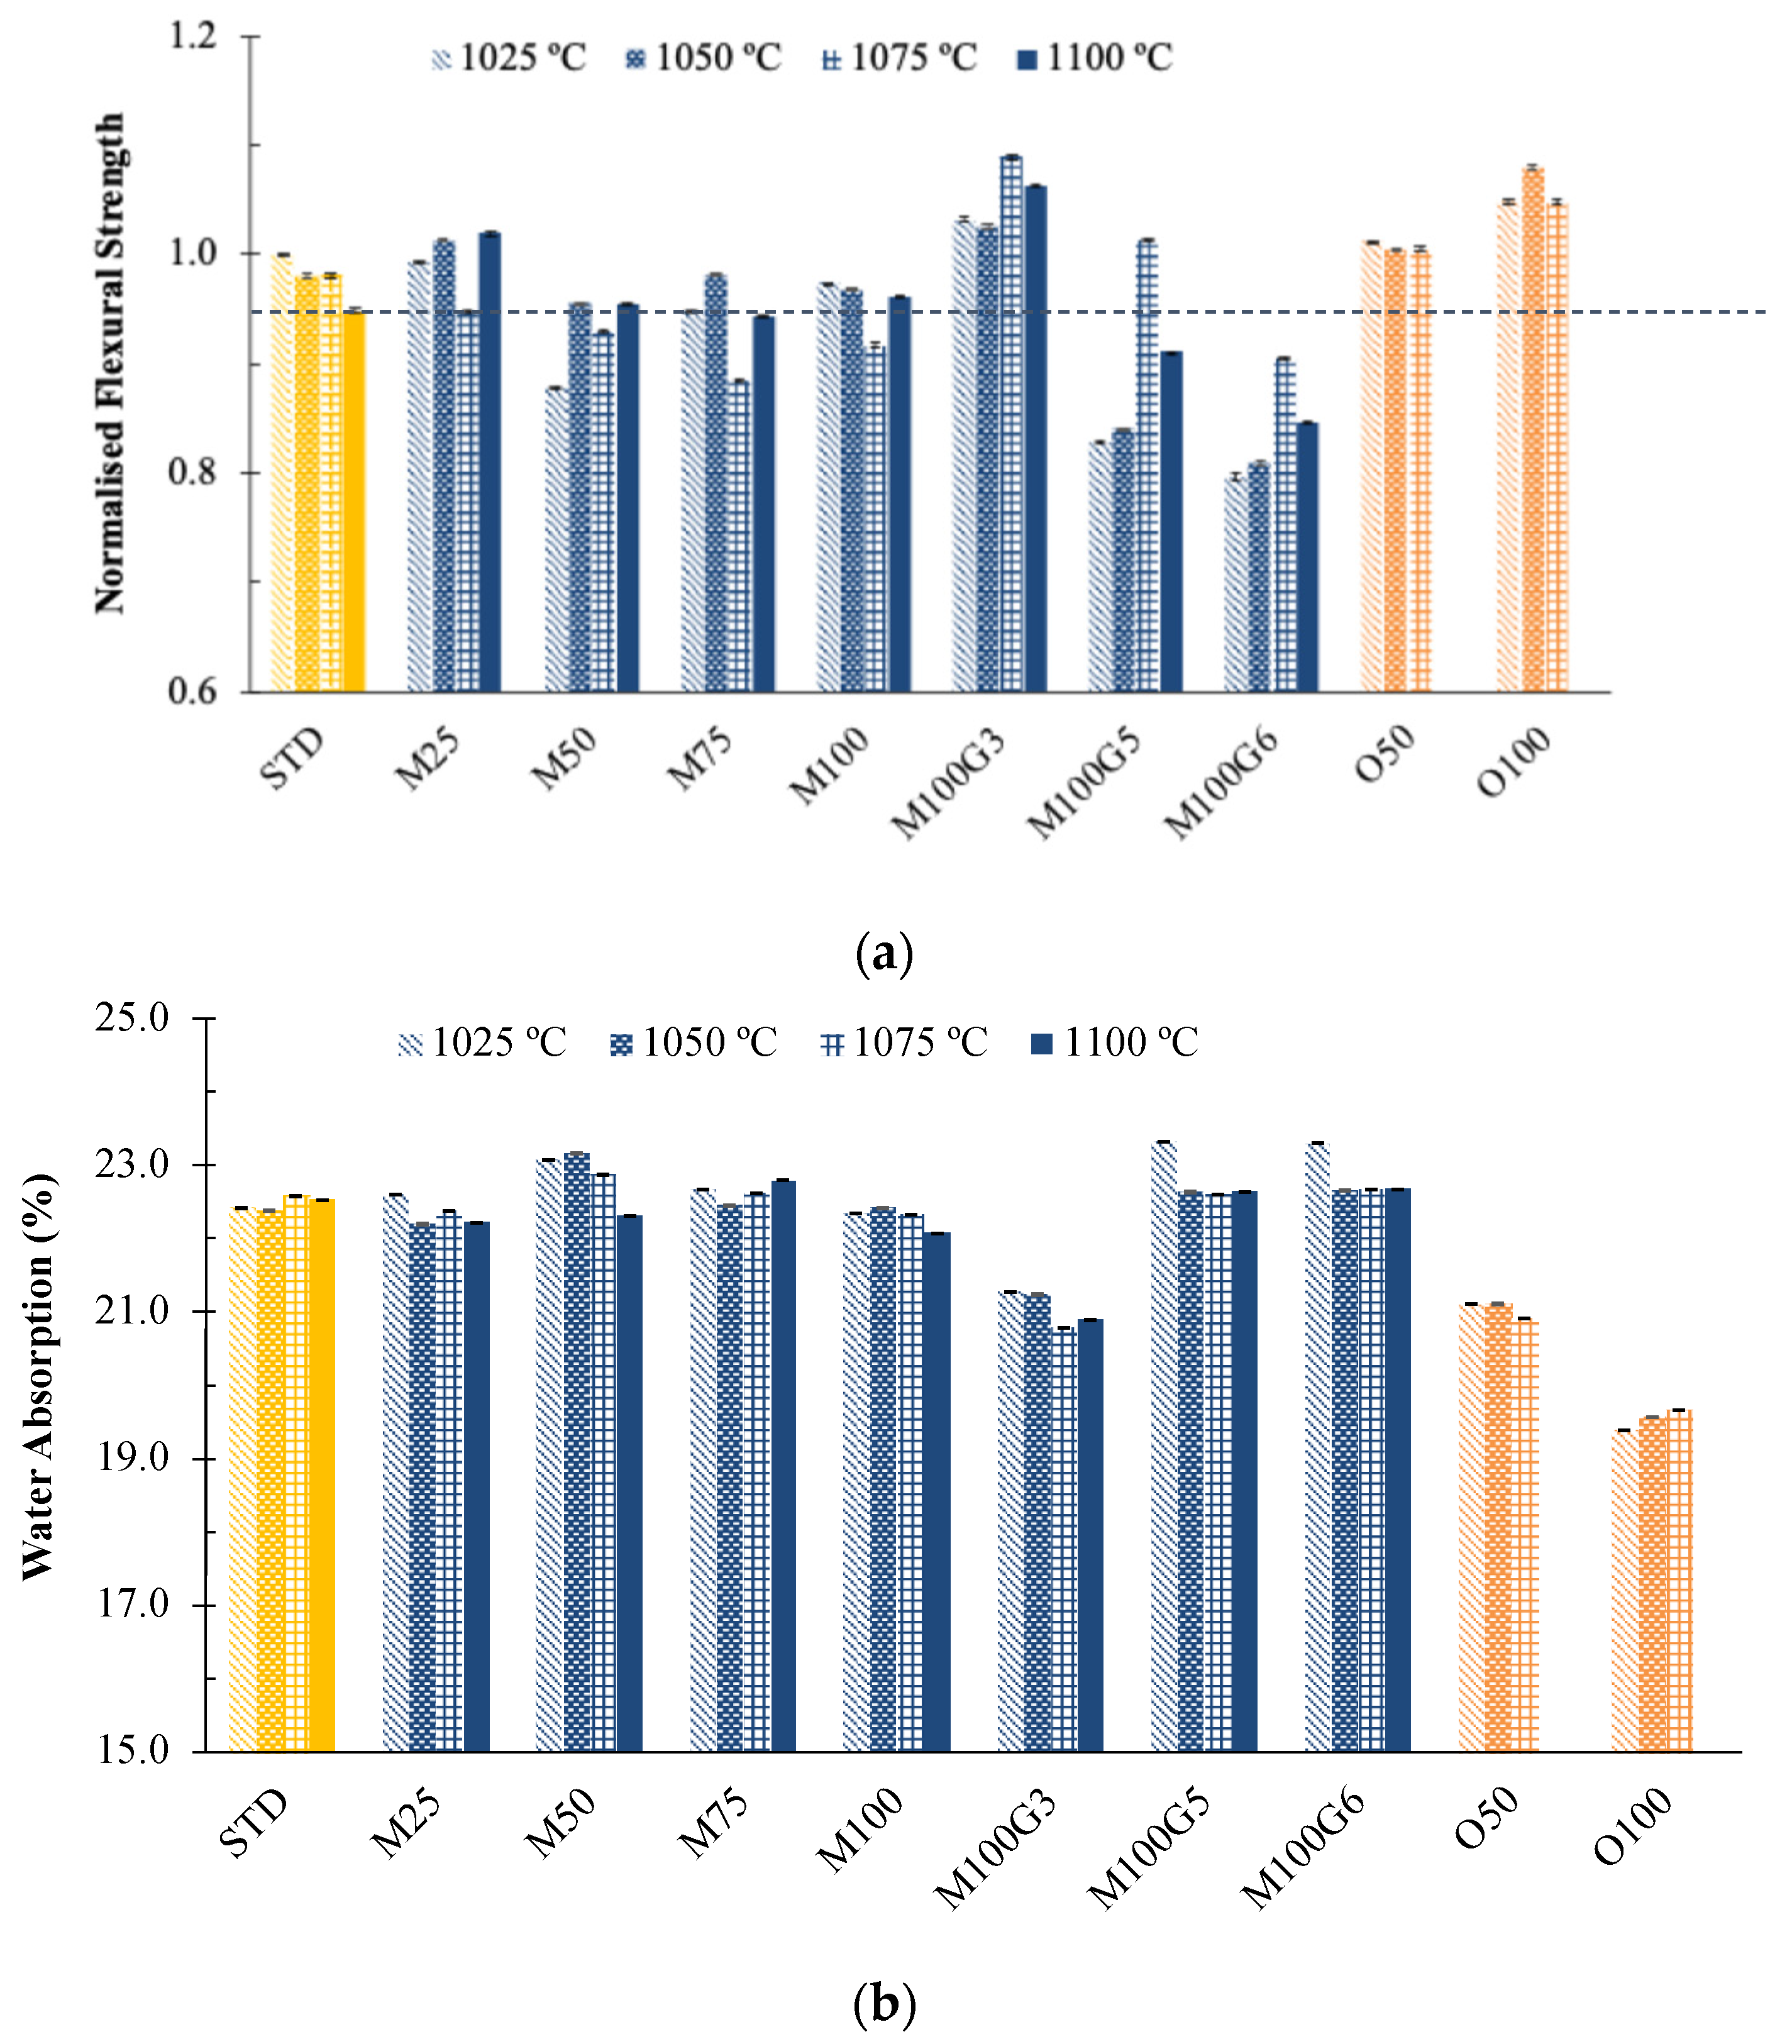
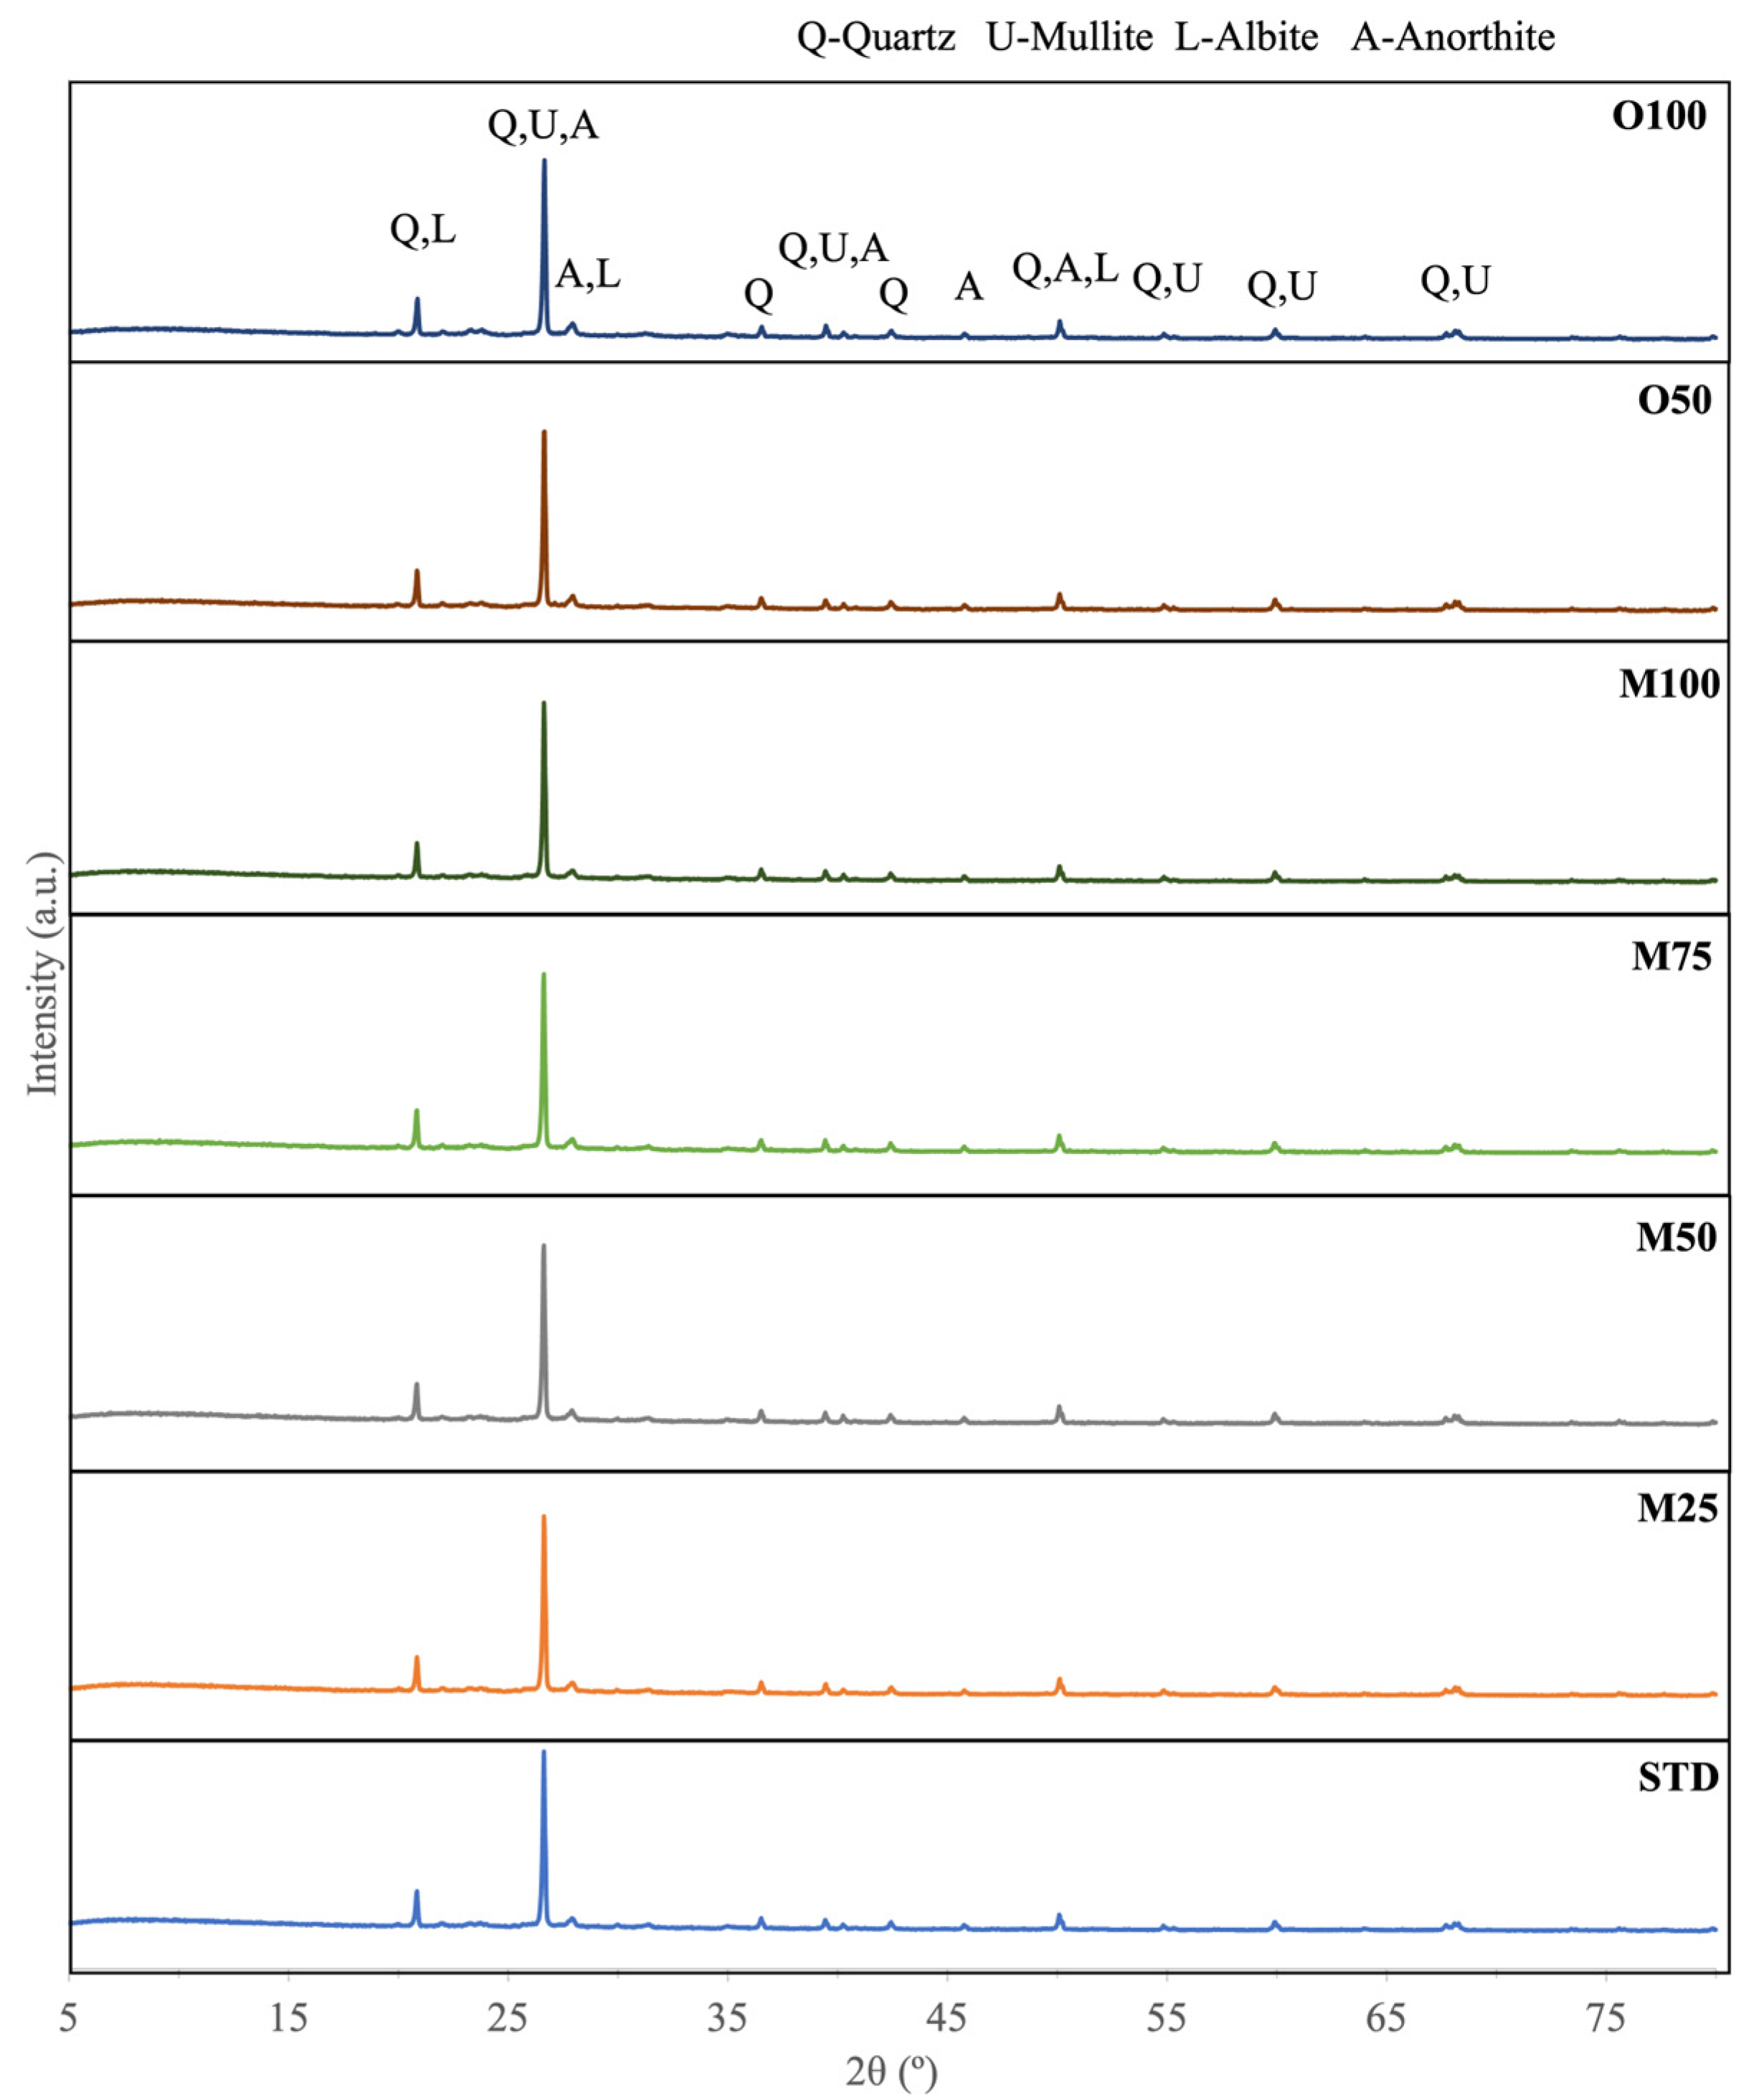
3.2. Laboratory Results

Figure 6a shows the influence of the firing temperature on the flexural strength of the prepared specimens, normalised to the strength of the standard specimens fired at 1025 °C. Overall, the substitution of mineral calcite by mussel bio-calcite with a similar particle size distribution tended to decrease the mechanical strength of the specimens, whereas the substitution by oyster bio-calcite tended to increase it. However, reducing the medium particle size of the mussel bio-calcite from 4 to 3 μm resulted in an increase, for all the firing temperatures, when compared to the STD ceramic body. Therefore, considering only the flexural strength results, the use of mussel bio-calcite allowed for a reduction in the firing temperature, particularly when the finest particle size was used (M100G3).
Conversely, the increase in the bio-calcite particle size led to a decrease in the mechanical strength of the specimens. Further, increasing the firing temperature negatively impacted the flexural strength of the standard specimen but for the M100G3 sample, there appeared to be an optimum value at 1075 °C. The incorporation of oyster bio-calcite improved the mechanical strength of the material, with a ≈7% increase for the specimens fired at 1050 °C compared to the STD specimens fired at the same temperature. This suggested that the dense phase of these specimens is more compact or that oyster bio-calcite exhibits higher resistance. Indeed, milling oyster bio-calcite required five times the duration needed for commercial calcite, indicating that the oyster c is harder than the calcite.
The influence of firing temperature on the water absorption of the specimens is shown in Figure 6b. The lowest values were obtained for the specimens prepared with OS100 (19.6%) and M100G3 (21.3%), whereas the STD, fired at 1025 °C, presented a value of 22.4%. Water absorption was directly related to open porosity and, consequently, to the densification of the ceramic body [21]. Therefore, a lower water absorption indicated a denser material. The obtained results were aligned with the flexural strength results, presented Figure 6a where the highest mechanical strength was achieved for the specimens containing oyster bio-calcite and M100G3. The M100G3 paste exhibited the lowest water absorption due to the finer granulometry of the bio-calcite used, which promoted smaller pore sizes, reducing its open porosity. Contrarily, M100G5 and M100G6 showed slightly higher values (≈23.3% at 1025 °C). The other compositions, M25, M75 and M100, presented water absorption values similar to the STD (≈22.4%). Regarding the temperature, slight fluctuations in water absorption were observed but they remained below 1%.
Table 6 presents the influence of the firing temperature on the shrinkage of the prepared specimens. In agreement with the previous results, the specimens containing oyster bio-calcite and M100G3 presented the highest shrinkage values, approximately 2.1% for the O100 and 1.5% for M100G3 while the STD sample showed a shrinkage of around 0.8%. Therefore, these observations confirmed that higher firing shrinkage corresponded to greater flexural strength, lower water absorption, and increased material density.
The colour difference (ΔE) of the fired specimens is presented in Table 7. The ΔE values were calculated relatively to the standard specimen fired at 1050 °C. The O100 specimens fired at different temperatures exhibited ΔE values between 2 and 3.5, meaning that an inexperienced observer could detect colour differences compared to the STD sample [22]. Regarding M100, only for the specimens fired at 1025 °C could the colour difference be perceived by an experienced observer (1 < ΔE < 2); otherwise, at the other firing temperatures, the differences in colour were imperceptible (ΔE < 1) [22]. The reduction in the granulometry resulted in an increase in the ΔE values regardless of the firing temperature. The rise of the mussel bio-calcite particle size, for temperatures ≤ 1050 °C, led to a decrease in ΔE, while for temperature above 1050 °C, an increase in ΔE was observed.
The XRD patterns of the specimens fired at 1050 °C are shown in Figure 7. The detected crystalline phases were quartz (SiO2), mullite (3Al2O3.2SiO2), albite (NaAlSi3O8) and anorthite (CaAl2Si3O8). No significant differences were observed in the diffraction patterns of the standard (STD) and those specimens in which the calcite was replaced by bio-calcite (mussel or oyster shell).
The values of the linear thermal expansion coefficient for the temperature range of 100 to 500 °C are presented in Table 8. The total substitution of calcite by bio-calcite led to a slight decrease in these coefficients, with values of 8.43 × 10⁻⁶ K−1 for the STD specimen, and 8.08 × 10⁻⁶ K−1 and 7.92 × 10⁻⁶ K−1 for the M100 and O100 compositions, respectively. This reduction suggested that these compositions are slightly less prone to dimensional changes under thermal stress. Additionally, the particle size of the bio-calcite also influenced the thermal expansion coefficient of the paste, with the lowest value (7.86 × 10⁻⁶ K−1) observed for M100G3.

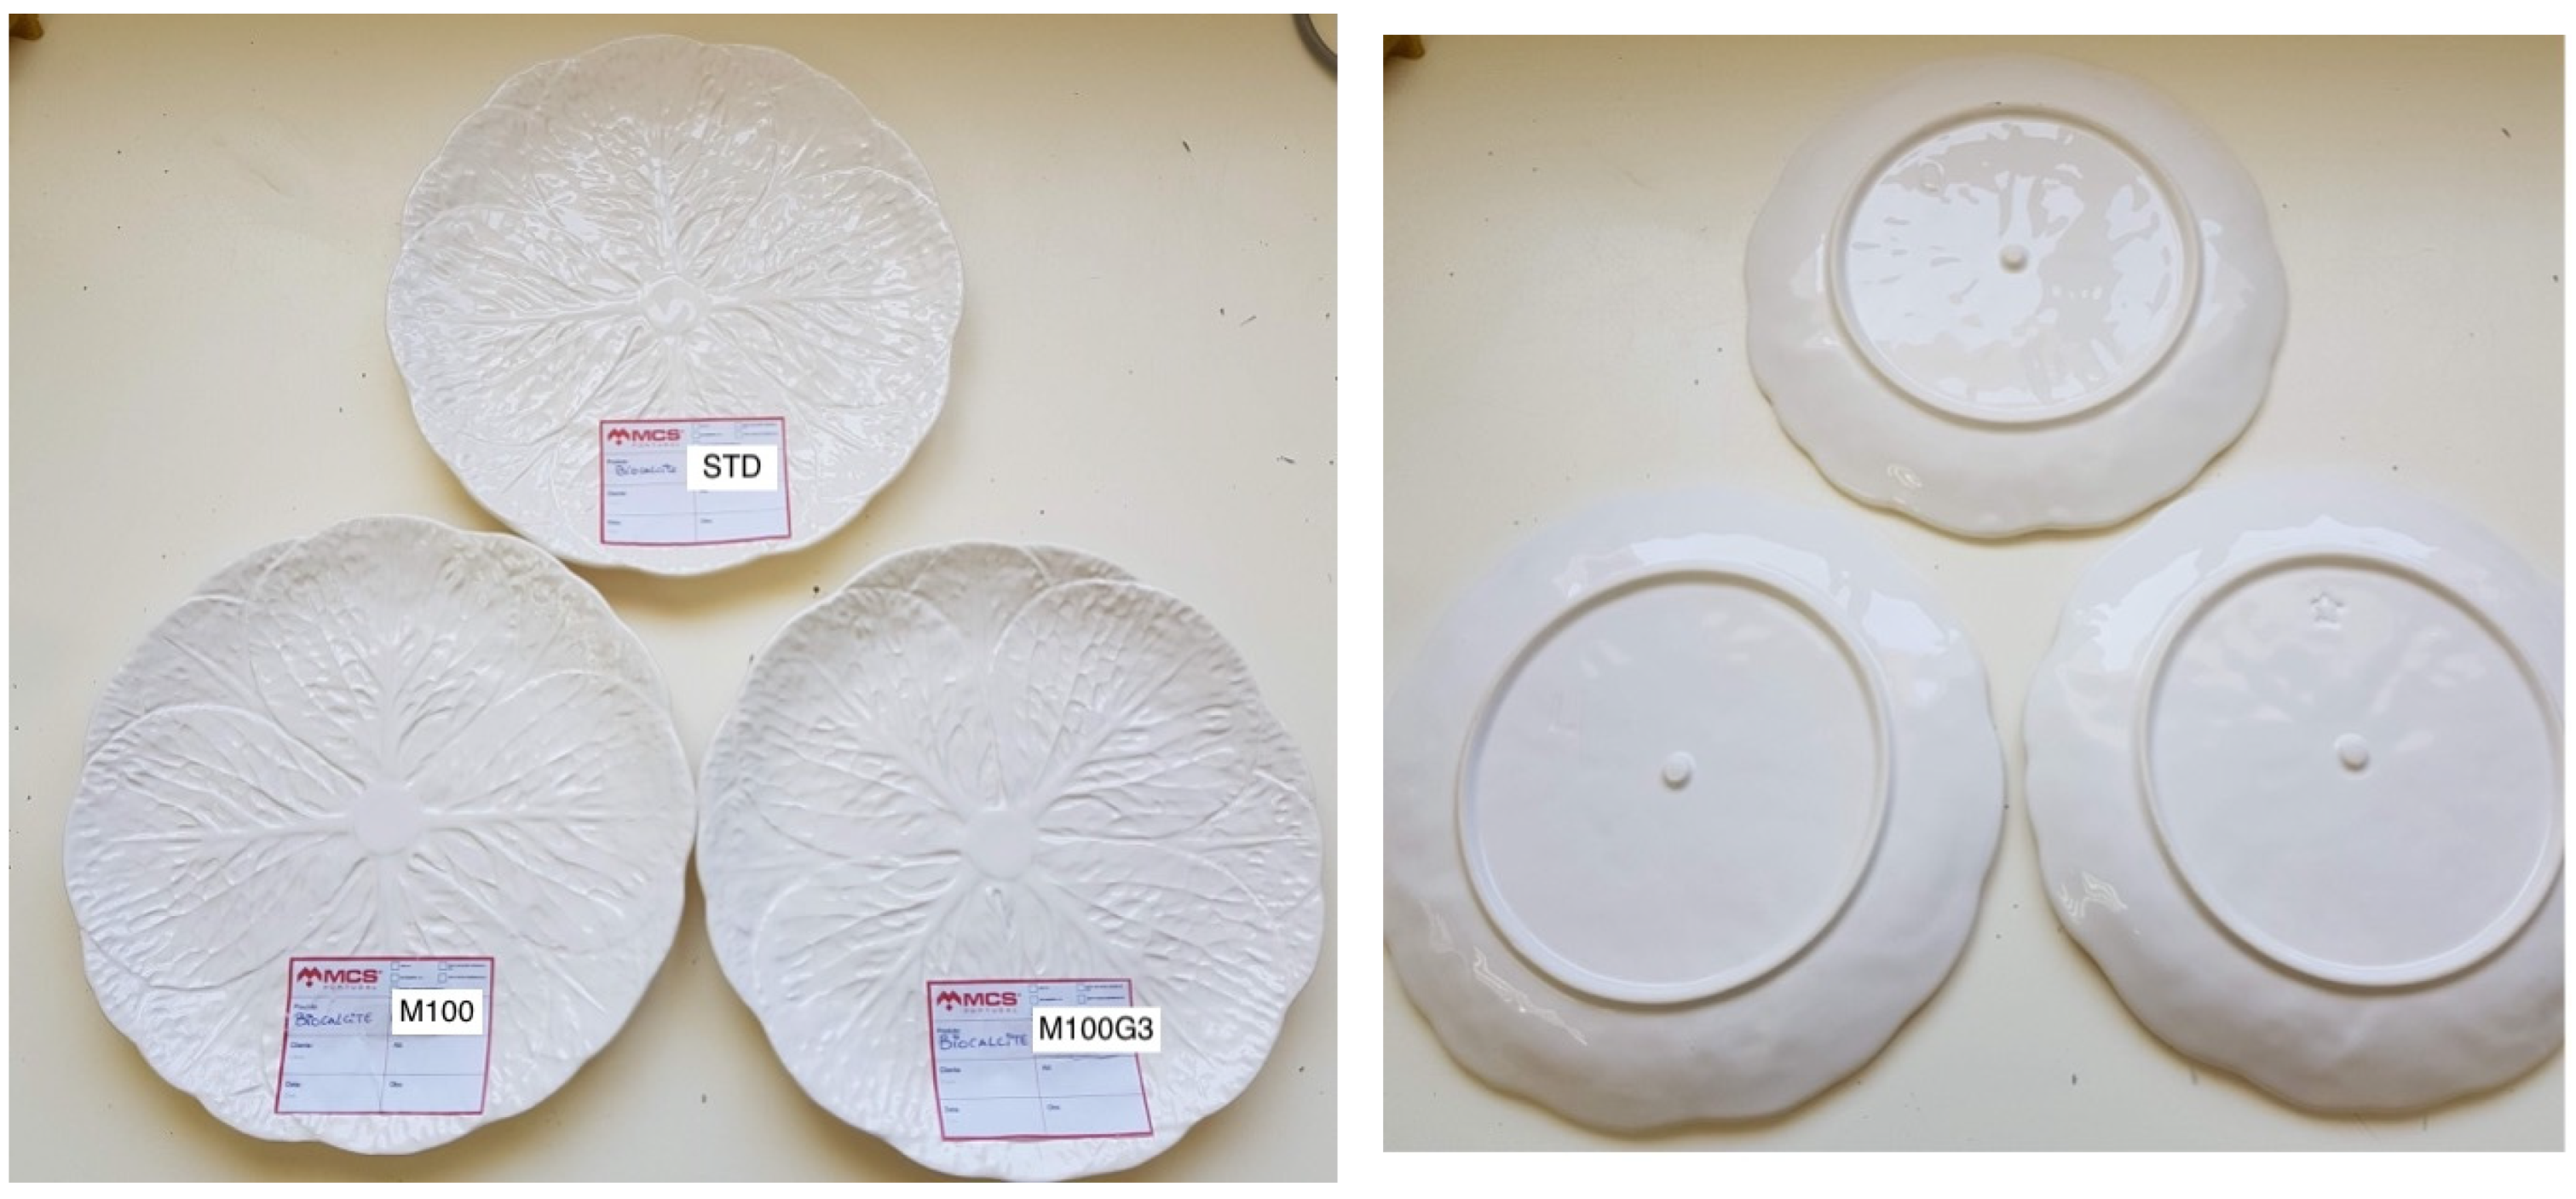
3.3. Pilot Plant Scale Results

The influence of grinding time at the pilot plant scale on the D50 value of the mussel bio-calcite is shown in Figure 8. For calcite, reaching a D50 ≈ 4 μm required around 12 h of milling. In contrast, the mussel bio-calcite needed, approximately, 20 h and 34 h of milling to achieve a D50 of 4 µm and 3 µm, respectively. Table 9 presents the milling process efficiency, which was found to be 4.17 kg/h for calcite and 2.5 kg/h for bio-calcite. The milling efficiency was higher in the pilot plant mill than in the laboratory mill, a difference that could be attributed to distinct milling conditions. These included the type of mill (jars in the laboratory vs. drum in the pilot plant) and the scale of the material processed (500 g in the laboratory vs. 50 kg in the pilot plant). Further, at laboratory scale, the mussel waste was pre-dried, while in the pilot plant it was used as supplied.
The influence of the firing temperature on the flexural strength of the specimens is shown in Figure 9. All formulations exhibited a higher mechanical strength when fired in the industrial furnace compared to the laboratory muffle. This difference might be attributed to the different heating and cooling rates achievable in these furnaces. The complete substitution of calcite with bio-calcite resulted in a very small reduction (≈2%) in the mechanical strength of the specimens. Additionally, reducing the particle size of bio-calcite led to an increase of ≈3%, with values of 335 kgf/cm2 for STD and 345 kgf/cm2 for M100G3. Nevertheless, all values remained within the required technical specifications. In the laboratory muffle, the standard formulation and M100G3 exhibited the highest flexural strength after firing at 1050 °C. In contrast, for M100, the maximum flexural strength (319 kgf/cm2) was achieved at 1075 °C. Maintaining the same mean particle diameter, the total substitution of calcite by the mussel bio-calcite led to a slight reduction in the flexural strength. The largest difference was observed at 1050 °C; however, this reduction remained below 6%. Notice that at 1075 °C, both the STD and M100 formulations presented the same mechanical strength of 319 kgf/cm2. The reduction in the particle size of the bio-calcite led to an increase in the flexural strength of the material, a trend also observed in the industrial furnace results.
The influence of the firing temperature on the water absorption values aligned with the results obtained for the mechanical strength. The M100G3 formulation exhibited the lowest water absorption (17.3%). Regarding the other compositions, differences below 1.5% were observed, with the water absorption of the STD sample fired in the industrial furnace being ≈19%.
Table 10 shows the colorimetric coordinates and the colour difference values (∆E), relative to the standard, of the pastes prepared at the pilot plant and fired in the industrial furnace. No visible differences in the colour of the specimens were observed (∆E < 1) [22].
The produced plates (see Figure 10) were subjected to the cracking resistance test and, all of them, resisted four cycles without registering the appearance of cracks on the glazed surface. Consequently, no differences were observed between the plates obtained from the formulation with calcite and those with mussel bio-calcite.

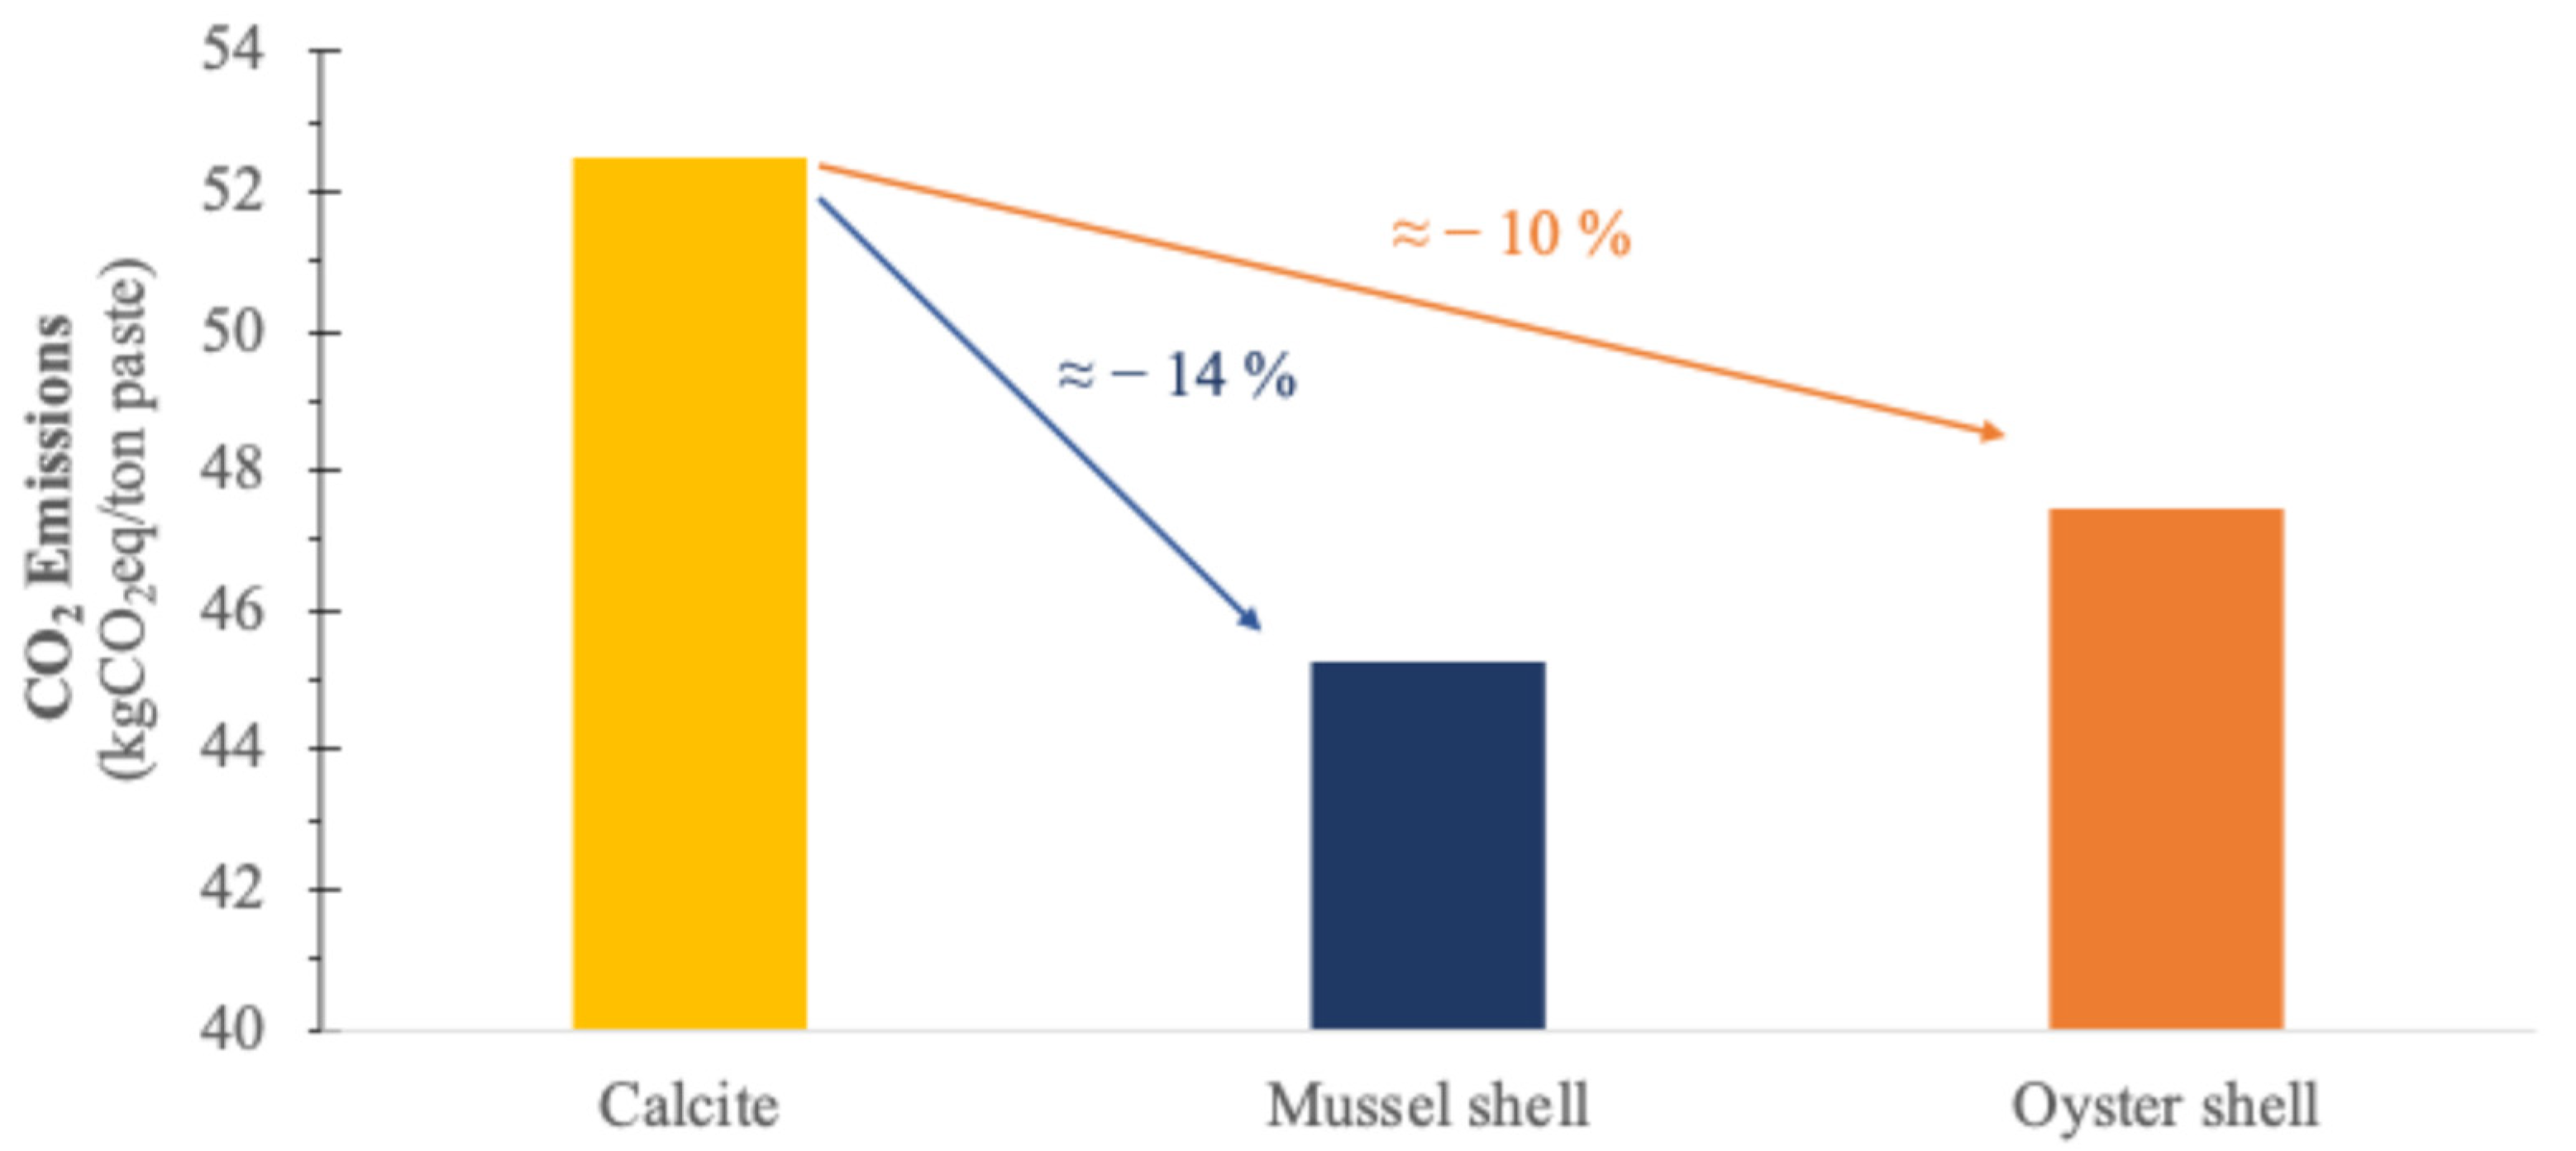
3.4. CO2 Emissions from the Different Calcium Carbonate Sources

The primary source of CO2 emissions associated with earthenware product production is the decomposition of calcium carbonate present in the raw materials. During the firing process, calcium carbonate (CaCO3) undergoes thermal decomposition, resulting in the formation of calcium oxide (CaO) and releasing carbon dioxide (CO2) into the atmosphere, as shown in Equation (3).
C a C O 3 ( s ) C a O ( s ) + C O 2 ( g )
Based on the amount of calcium carbonate incorporated into the ceramic bodies, the associated CO2 emissions can be estimated. The calcium carbonate content varied depending on the source: 55.7 wt.% for the commercial calcite, 48.1 wt.% for the mussel shells and 50.4 wt.% for the oyster shells (see Table 2). Figure 11 presents the calculated CO2 emissions resulting from the thermal decomposition of each calcium carbonate source. These estimations were based on the amount of calcium carbonate added to the ceramic mixtures, considering the specific calcium oxide content of each material.
As shown in Figure 11, the estimated CO2 emissions from CaCO3 decomposition were approximately 53 kgCO2eq/t of paste prepared with calcite. In comparison, pastes prepared with mussel or oyster shells emitted around 45 and 48 kgCO2eq/t of paste, respectively, representing a 14 and 10% reduction compared to calcite.
According to the Commission Implementing Regulation (EU) 2018/2066 [23], which establishes the rules for monitoring and reporting greenhouse gas emissions, a distinction is made between organic and inorganic materials. Emissions from biomass (an organic material) are typically rated as zero under the European Emissions Trading System (EU ETS). In Portugal, eggshells, classified as a by-product by the Portuguese Environmental Agency, are considered a biological source of calcite with a 100% biomass fraction, meaning that their decomposition emissions can be counted as zero under the EU ETS framework.
Bivalve shells are excluded from Regulation 1069/2009 [24] (art. 2, no. 2, subparagraph f: Shells from shellfish from which the soft tissue or flesh have been removed), fall under the General Waste Management Regime (RGGR) and are still considered a waste. Therefore, to utilise bivalve shells in the ceramic industry, they must first be classified as a by-product and authorised accordingly. Once classified, CO2 emissions from their decomposition can also be considered zero under the EU ETS framework.
In 16 June 2024, the price of emission allowances was 68.28 €/t of CO2, having peaked at 100.34 €/t of CO2 in February 2023 [25]. Therefore, the use of mussel or oyster shell in ceramic production could lead to significant cost savings, potentially reducing up to 53 kgCO2eq per tonne of paste.

4. Conclusions

The present study demonstrated the viability of using bivalve waste—specifically mussel and oyster shells—as an alternative source of calcium carbonate in earthenware body production. These shells can fully replace natural calcite, transforming a waste product into a valuable secondary raw material.
Laboratory experiments revealed that earthenware pastes incorporating varying levels of the bivalve shells, maintained properties comparable to those of the standard material, including chemical and mineralogical composition, flexural strength, thermal behaviour and colour. Particularly, the reduction in the particle size of the mussel shell bio-calcite improved earthenware body performance, increasing the flexural strength of the final product by 10%. This improvement remained consistent across all tested firing temperatures, indicating no need for adjustments in industrial firing cycles when using bio-calcites.
Pilot plant trials confirmed the industrial feasibility of replacing calcite with mussel shells, corroborating the laboratory results. Plates produced with pastes formulated with bio-calcite exhibited comparable properties to standard earthenware bodies, including colour and crazing resistance.
The estimated CO2 emissions from calcite decomposition were approximately 53 kgCO2eq per tonne of paste. By using mussel or oyster shell, emissions are reduced by 14 and 10%, respectively. Moreover, under the EU Emissions Trading Systems (ETS) framework, bio-calcite decomposition emissions can potentially be classified as zero, leading to savings of up to 53 kgCO2eq per tonne of paste.
The proposed solution offers both environmentally and economically benefits, as it utilises waste materials, reduces the extraction of natural raw materials, decreases the landfill waste and significantly lowers the cost associated with CO2 emissions. Furthermore, the substitution of calcite with bivalve shell waste holds cross-industry potential, aligning with increasingly stringent environmental regulations and providing a cost-effective pathway to compliance and long-term sustainability.

Supplementary Materials

The following supporting information can be downloaded at: https://www.mdpi.com/article/10.3390/ceramics8020076/s1, Figure S1: Granulometric distribution of the commercial calcite; Figure S2: Granulometric distribution of the prepared pastes; Figure S3: XRD patterns of the prepared pastes before being fired; Table S1: Influence of the bio-calcite used and firing temperature on the colorimetric coordinates (L, a, b) and colour difference (ΔE) of the specimens.

Author Contributions

Conceptualisation, I.S.V. and M.P.S.; Data curation, I.S.V., M.F. and C.M.; Formal analysis, I.S.V., M.F. and C.M.; Funding acquisition, J.S., S.B. and M.P.S.; Investigation, I.S.V., M.F., C.M. and M.P.S.; Methodology, I.S.V., M.F., C.M. and M.P.S.; Project administration, S.B. and M.P.S.; Resources, C.M., J.S., S.B. and M.P.S.; Supervision, I.S.V., C.M., S.B., M.C.G. and M.P.S.; Validation, I.S.V., C.M., J.S. and M.P.S.; Writing—original draft, I.S.V.; Writing—review and editing, I.S.V., M.F., C.M., J.S., S.B., M.C.G. and M.P.S. All authors have read and agreed to the published version of the manuscript.

Funding

This work was conducted within the scope of the project CICECO—Aveiro Institute of Materials, UIDB/50011/2020, UIDP/50011/2020, and LA/P/0006/2020, financed by national funds through the FCT/MCTES (PIDDAC).

Institutional Review Board Statement

Not applicable.

Informed Consent Statement

Not applicable.

Data Availability Statement

Data is contained within the article or Supplementary Materials.

Conflicts of Interest

Authors Miguel Ferreira, Claúdia Miranda, José Silva, Sofia Batista were employed by the company Grupo MCS Portugal. The authors declare that the research was conducted in the absence of any commercial or financial relationships that could be construed as a potential conflict of interest.

References

  1. Cerame-Unie TECIA. Ceramic Roadmap to 2050—Continuing Our Path Towards Climate Neutrality; Cerame-Unie TECIA: Brussels, Belgium, 2021. [Google Scholar]
  2. Eurostat EU. EU’s Circular Material Use Rate Slightly Up in 2022. 2021. Available online: https://ec.europa.eu/eurostat/en/web/products-eurostat-news/w/ddn-20231114-2 (accessed on 5 July 2024).
  3. CCA-Europe CCAE Aisbl. Calcium Carbonate is a Renewable Raw Material. 2020. Available online: https://ima-europe.eu/wp-content/uploads/2021/12/Renewability-Statement.pdf (accessed on 5 July 2024).
  4. CCA-Europe CCAE Aisbl. Life Cycle Analysis for Calcium Carbonate. 2021. Available online: https://calcium-carbonate.org.uk/media/dcefn104/cca-lca-pcc-slurry.pdf (accessed on 5 July 2024).
  5. The UBA TU. Resource Use and Its Consequences. 2019. Available online: https://www.umweltbundesamt.de/en/topics/waste-resources/resource-use-its-consequences#:~:text=In%20short%2C%20raw%20material%20extraction,functions%20and%20global%20warming%20exacerbation (accessed on 5 July 2024).
  6. Souidi, A.; Maaloufa, Y.; Amazal, M.; Atigui, M.; Oubeddou, S.; Mounir, S.; Idoum, A.; Aharoune, A. The effect of mussel shell powder on the thermal and mechanical properties of plaster. Constr. Build. Mater. 2024, 416, 135142. [Google Scholar] [CrossRef]
  7. Shahroom, A.; Shapawi, R.; Mustafa, S.; Abd Halid, N.F.; Estim, A.; Tuzan, A.D. Effects of eggshell and seashell powder as natural dietary calcium supplements on growth, molting frequency, and carapace calcium composition of juvenile red claw crayfish, Cherax quadricarinatus. PeerJ 2023, 11, e15449. [Google Scholar] [CrossRef] [PubMed]
  8. Borciani, G.; Fischetti, T.; Ciapetti, G.; Montesissa, M.; Baldini, N.; Graziani, G. Marine biological waste as a source of hydroxyapatite for bone tissue engineering applications. Ceram. Int. 2023, 49, 1572–1584. [Google Scholar] [CrossRef]
  9. Peksen, C.; Koroglu, L.; Kartal, H. Utilization of seashells in matte glaze preparation. Int. J. Appl. Ceram. Technol. 2020, 17, 1940–1947. [Google Scholar] [CrossRef]
  10. Peceño, B.; Alonso-Fariñas, B.; Vilches, L.F.; Leiva, C. Study of seashell waste recycling in fireproofing material: Technical, environmental, and economic assessment. Sci. Total Environ. 2021, 790, 148102. [Google Scholar] [CrossRef] [PubMed]
  11. Baláž, M. Shells and Other Calcium Carbonate-Based Waste. In Environmental Mechanochemistry; Springer: Berlin/Heidelberg, Germany, 2021. [Google Scholar]
  12. Vilarinho, I.S.; Filippi, E.; Seabra, M.P. Development of eco-ceramic wall tiles with bio-CaCO3 from eggshells waste. Open Ceram. 2022, 9, 100220. [Google Scholar] [CrossRef]
  13. Vieira, I.; Vilarinho, I.S.; Buruberri, L.; Carneiro, J.; Seabra, M.P. Upcycling process of mill scale waste into high-value ceramic products. Ceram. Int. 2024, 50, 36800–36810. [Google Scholar] [CrossRef]
  14. ISO 10545-4:2019; Ceramic Tiles—Part 4: Determination of Modulus of Rupture and Breaking Strength. International Organization for Standardization: Geneva, Switzerland, 2019.
  15. BS EN 1217:1998; Materials and Articles in Contact With foodstuffs. Test Methods for Water Absorption of Ceramic Articles. British and European Standards: London, UK, 1998.
  16. ISO 10545-11:1996; Ceramic Tiles—Part 11: Determination of Crazing Resistance for Glazed Tiles. International Organization for Standardization: Geneva, Switzerland, 1996.
  17. Viczián, I.; Mária, F. Handbook of the thermogravimetric system of minerals and its use in geological practice. Cent. Eur. Geol. 2013, 56, 397–400. [Google Scholar] [CrossRef]
  18. Joaquim, M.; Ribeiro, P.M.; Abrantes, C. Moagem em moinho de bolas: Estudo de algumas variáveis e otimização energética do processo. Rev. Cerâmica Ind. 2001, 6, 7–11. [Google Scholar]
  19. Agrawal, P.; Misra, S.N. Irreversible Dilatometry as a Tool for Body Composition and Firing Schedule Design in Traditional Ceramics. Trans. Indian Ceram. Soc. 2014, 73, 14–21. [Google Scholar] [CrossRef]
  20. Zouaoui, H.; Bouaziz, J. Physical and mechanical properties improvement of a porous clay ceramic. Appl. Clay Sci. 2017, 150, 131–137. [Google Scholar] [CrossRef]
  21. Mücke, U. Ceramic microstructures. Property control by processing. von W. E. Lee und W. M. Rainforth, 590 Seiten, Zahlreiche Abbildungen, Chapman & Hall, London, Glasgow, Weinheim. New York, Tokio, Melbourne, Madras, 1994, £ 89.00, ISBN 0-412-43140-8. Mater. Corros. 1996, 47, 346–347. [Google Scholar] [CrossRef]
  22. Mokrzycki, W.S.; Tatol, M. Colour difference Delta-E—A survey. Mach. Graph. Vis. 2011, 20, 383–411. [Google Scholar]
  23. European Union. Commission Implementing Regulation (EU) 2018/2066 of 19 December 2018 on the Monitoring and Reporting of Greenhouse gas Emissions; Official Journal of the European Union: Luxembourg, 2018. [Google Scholar]
  24. EC. Regulation (EC) No 1069/2009, Animal by-Products Regulation; Official Journal of the European Union: Luxembourg, 2009; 300p. [Google Scholar]
  25. Statista. Daily European Union Emission Trading System (EU-ETS) Carbon Pricing from 2022 to 2024. 2024. Available online: https://www.statista.com/statistics/1322214/carbon-prices-european-union-emission-trading-scheme/#:~:text=The%20price%20of%20emissions%20allowances,reform%20of%20the%20EU%2DETS (accessed on 26 June 2024).
Figure 1. Produced specimens after (a) conformation process and (b) firing at 1050 °C.
Ceramics 08 00076 g001
Figure 2. XRD pattern of calcite, mussel shells and oyster shells.
Ceramics 08 00076 g002
Figure 3. Differential thermal and thermogravimetric analyses of (a) calcite, (b) mussel shell and (c) oyster shell.
Ceramics 08 00076 g003
Figure 4. The influence of milling time on the bio-calcite’s mean particle size.
Ceramics 08 00076 g004
Figure 5. Differential thermal and thermogravimetric analyses of the prepared pastes: (a) STD, (b) M100, (c) M100G3, (d) O100.
Ceramics 08 00076 g005
Figure 6. Influence of the firing temperature on the specimens: (a) flexural strength and (b) water absorption. The yellow color represents the standard specimens, blue and orange the specimens prepared in bio-calcite from mussel and oyster shell, respectively.
Ceramics 08 00076 g006
Figure 7. XRD patterns of the fired ceramic pastes.
Ceramics 08 00076 g007
Figure 8. The influence of milling time, at the pilot scale, on the mussel bio-calcite mean particle size (D50).
Ceramics 08 00076 g008
Figure 9. Influence of the firing temperature on the flexural strength.
Ceramics 08 00076 g009
Figure 10. Industrially produced plates.
Ceramics 08 00076 g010
Figure 11. CO2 emissions from the calcium carbonate decomposition of the different sources: calcite, mussel shell and oyster shell.
Ceramics 08 00076 g011
Table 1. Calcium carbonate sources of the prepared formulations.
Calcium Carbonate (wt.%)
ReferenceSTDM25M50M75M100M100G3M100G5M100G6O50O100
CaCO3 SourceCalcite100755025----50-
Mussel c-255075100100100100--
Oyster c--------50100
Table 2. Chemical composition of the CaCO3 sources.
ComponentsCalciteMussel ShellOyster Shell
(wt.%)
CaO55.7448.0550.42
Al2O30.250.310.54
MgO0.320.420.52
C8.749.528.42
Table 3. Influence of the CaCO3 source on the milling process efficiency to obtain a mean particle size of ≈4 μm, according to [18].
CaCO3
Source
Quantity of Material
(kg)
Mill Time
(h)
Efficiency
(kg/h)
Calcite0.510.5
Mussel bio-calcite1.830.27
Oyster bio-calcite5.250.10
Table 4. Chemical composition of the prepared pastes obtained by FRX.
ComponentSTDM50M100O50O100
SiO260.8061.0860.7460.4460.32
Al2O317.9817.2617.6618.3118.38
K2O0.580.560.580.590.62
Na2O0.260.160.190.290.35
MgO0.280.180.200.290.29
CaO6.516.416.226.466.35
Fe2O30.620.620.630.610.65
TiO20.240.250.250.250.25
S0.030.030.040.030.02
C1.511.711.691.511.49
LOI11.1811.7211.8011.2311.29
Table 5. Granulometric distribution of the prepared pastes.
STDM25M50M75M100M100G3M100G5M100G6O50O100
<2 μm
(%)
10.9410.8811.5810.7712.0814.0211.718.2010.6612.79
<10 μm
(%)
55.6055.2855.4554.3555.6457.2354.2241.8056.3455.86
D50
(μm)
8.358.428.378.688.317.808.6913.808.068.25
D90
(μm)
34.1034.6034.2034.8033.6033.0035.4047.0036.1033.20
Table 6. Influence of the firing temperature on the shrinkage of the specimens.
Firing Shrinkage (%)
Firing Temperature
(°C)
1025105010751100
STD0.75 ± 0.060.48 ± 0.081.07 ± 0.090.45 ± 0.08
M250.58 ± 0.040.58 ± 0.060.69 ± 0.040.77 ± 0.04
M500.87 ± 0.080.88 ± 0.080.43 ± 0.090.70 ± 0.05
M751.01 ± 0.070.81 ± 0.060.86 ± 0.070.95 ± 0.04
M1001.13 ± 0.090.99 ± 0.060.82 ± 0.070.75 ± 0.05
M100G31.48 ± 0.081.27 ± 0.081.34 ± 0.091.06 ± 0.09
M100G50.85 ± 0.060.74 ± 0.071.10 ± 0.080.74 ± 0.08
M100G60.62 ± 0-050.53 ± 0.060.70 ± 0.050.83 ± 0.03
O501.22 ± 0.021.16 ± 0.051.36 ± 0.03-
O1002.08 ± 0.032.11 ± 0.042.12 ± 0.06-
Table 7. Influence of the bio-calcite used and the firing temperature on the colour differences of the specimens (ΔE).
ΔE
Firing
Temperature
(°C)
1025105010751100
STD0.47-0.791.33
M251.390.750.951.37
M501.710.260.711.47
M751.800.830.380.73
M1001.170.850.780.44
M100G31.491.401.010.49
M100G50.960.301.251.43
M100G60.430.200.841.40
O501.670.900.54-
O1003.223.293.27-
Table 8. Linear thermal expansion coefficients (100 and 500 °C).
STDM25M50M75M100M100G3M100G5M100G6O50O100
α × 10−6 K−18.438.168.028.198.087.868.238.158.037.92
Table 9. Influence of the CaCO3 source on the pilot plant scale milling process efficiency for a D50 of ≈4 μm, according to [18].
CaCO3
Source
Material Quantity
(kg)
Milling Time
(h)
Efficiency
(kg/h)
Calcite50124.17
Mussel bio-calcite202.5
Table 10. Colour coordinates and colour differences of the specimens prepared at pilot scale and fired in the industrial furnace.
STDM100M100G3
L*92.6292.5592.32
a*1.831.791.62
b*8.088.078.31
ΔE-0.080.43
Disclaimer/Publisher’s Note: The statements, opinions and data contained in all publications are solely those of the individual author(s) and contributor(s) and not of MDPI and/or the editor(s). MDPI and/or the editor(s) disclaim responsibility for any injury to people or property resulting from any ideas, methods, instructions or products referred to in the content.

