Article

Comparing the Efficacies of Electrospun ZnO and TiO2 Nanofibrous Interlayers for Electron Transport in Perovskite Solar Cells

1
School of Materials Science and Textile Engineering, Wuhan Textile University, Wuhan 430000, China
2
School of Agricultural Engineering and Food Science, Shandong University of Technology, Zibo 255000, China
3
Shandong Research Center of Engineering and Technology for Clean Energy, Zibo 255000, China
4
School of Textile Science and Engineering, Wuhan Textile University, Wuhan 430000, China
5
Department of Physics, College of Science, Qassim University, Buraydah 51452, Saudi Arabia
*
Author to whom correspondence should be addressed.
Ceramics 2024, 7(4), 1742-1757; https://doi.org/10.3390/ceramics7040111
Submission received: 4 October 2024 / Revised: 24 October 2024 / Accepted: 7 November 2024 / Published: 13 November 2024
(This article belongs to the Special Issue Advances in Electronic Ceramics)

Abstract

:
ZnO and TiO2 are both well-known electron transport materials. Their comparison of performance is considered advantageous and novel. Therefore, a viable electrospinning route was considered for the development of highly polycrystalline TiO2 and ZnO nanofibers as an electron transport material (ETM) for perovskite solar cells. The materials were well-characterized in terms of different analytical techniques. The X-ray diffraction detected polycrystalline structural properties corresponding to TiO2 and ZnO. Morphological analysis by scanning electron microscopy revealed that the nanofibers are long, uniform, and polycrystalline, having a diameter in the nanometer range. Optoelectronic properties showed that TiO2 and ZnO exhibit absorption values in the ultraviolet and visible ranges, and band gap values for TiO2 and ZnO were 3.3 and 3.2 eV, respectively. TiO2 bandgap and semiconductor nature were more compatible with Electron Transport Layer (ETL) compared to ZnO. Electrical studies revealed that TiO2 nanofibers have enhanced values of conductivity and sheet carrier mobility compared to ZnO nanofibers. Therefore, higher photovoltaic conversion efficiency was achieved for TiO2 nanofibers (10.4%) compared to ZnO (8.5%).

Graphical Abstract

1. Introduction

Since semiconductor nanomaterials have special features in nanoscale devices, there has been significant interest in researching them. In particular, research has evolved to focus on their use in solar energy-harvesting for photocatalysis, electricity, and environmental remediation [1,2]. TiO2 and ZnO nanostructures, being significant semiconductors, have been thoroughly investigated in the field of photovoltaics, particularly in relation to perovskite solar cells (PSCs) [3]. They are preferred as electron transport materials (ETM) due to their large specific surface area and 1D shape. TiO2 and ZnO offer a direct path for electron movement. While some researchers claim that ZnO in a wurtzite or hexagonal structure gives remarkable performance, others suggest that the crystalline characteristics of TiO2 nanostructures are more compatible with ETM [4]. Both ZnO and TiO2 nanofibers typically have a surface area of 30–40 m2 g−1 and a broad distribution range of 80–300 nm. Due to their main features of higher electron mobility, mesoporous TiO2- and ZnO-based ETMs for PSCs exhibit remarkable photovoltaic performance [5]. Higher electron or carrier mobility ideally supports higher current densities and improved open-circuit voltage. Furthermore, a lower recombination rate is required to prevent PSCs from internal losses.
One-dimensional (1D) TiO2 nanomaterial production is documented in numerous investigations, with the goal of using their large fiber dimensions and high surface areas. IMA electrospun TiO2 nanofibers were reported by Mohammed et al. to achieve an acceptable performance (5.41%) in PSCs [4,6]. The primary parameters for adjusting their optoelectronic characteristics are the electrode type, surface area, and photoabsorption contact layer. Functional 1D TiO2 nanostructures, such as nanowires and nanofibers, were investigated by XL Wang et al. for use in perovskite solar cells. TiO2 ETM was used in PSCs to produce improved efficiencies of up to 5.9% by customizing their sizes, functional groups, and band gap [7]. TiO2 nanofibers produced by sol-gel electrospinning were reported to have better contact qualities and larger surface areas. Conversely, a faster rate of photoactivity is induced by increased current density and enhanced electron mobility in the oriented direction, which also results in one-dimensional (1D) ZnO being recorded in perovskite solar cells [8]. Electrospun ZnO nanofibers were utilized as ETM to achieve a sufficient band gap (3.3 eV) and improved electron mobility. ZnO nanofibers have shown compatibility with perovskite solar cells and photoanode materials to achieve an efficiency of up to 8.7% [9].
Fewer energy trap states exist between the valence and conduction bands in ZnO nanofibers, which lowers losses [10]. ZnO surface modification and nanofiber diameter optimization lead to a current density of 14.51 mA/cm2 in highly efficient perovskite solar cells (PSCs) [11]. When compared to nanoparticles, electrospun TiO2 and ZnO nanofibers with their 1D structure provide less quantum confinement and greater photovoltaic performance [12]. A large body of research has been done recently on the production of ZnO and TiO2 nanofibers via electrospinning under various processing conditions [13]. With an ideal dopant concentration of 3%, indium-doped ZnO demonstrated enhanced structural characteristics, adjusted the electronic band structure, and, as a result, demonstrated an improvement in photocatalytic activity [1]. Using an electrospinning approach, highly porous scaffold nanofibers of zinc tin oxide (Zn2SnO4) have been synthesized and successfully applied to methyl ammonium lead halide (CH3NH3PbI3) perovskite-sensitized solid-state solar cells. The optimized perovskite solar cell devices that were fabricated demonstrated a power conversion efficiency (PCE) of 7.38% under AM 1.5 G sunlight (100 mW cm−2), with an open-circuit voltage (VOC) of 0.986 V, current density (JSC) of 12.68 mA cm−2, and fill factor (FF) of 0.59. This is in comparison to perovskite solar cells based on Zn2SnO4 nanoparticles (η = 2.52%) [14]. By careful addition of Mg nanofibers into the ZnO substrate, charge extraction was promoted without sacrificing the charge transport efficiency, leading to enhanced photovoltaic efficiency and an optimized band gap of 3.2 eV [15]. However, no paper has yet comparred the photovoltaic capabilities of ZnO and TiO2 nanofibers synthesized under similar processing conditions [16].
In this study, electrospun pristine TiO2 and ZnO nanofibers were fabricated under the same set of circumstances and conditions, including gel flow, syringe gauge, drying conditions, discharge rate, and direct and negative voltages [17]. The materials for the photoanodes were applied to the FTO under the same coating cycles and spin rates. The ability of these potential photoanodes to transport electrons in perovskite solar cells was examined. Through the use of Raman spectroscopy, X-ray diffraction, and scanning electron microscopy, the morphological and structural characteristics of both nanofibers were examined. To determine the fundamental mechanism of improved performance, TiO2 and ZnO nanofibers’ optical, chemical, and electrical characteristics were examined. The suggested 1D TiO2 and ZnO nanofibers, which were created exactly the same way, work admirably as ETMs for perovskite solar cells.

2. Materials and Methodology

For the manufacture of titanium and zinc oxide nanofiber sol, Sigma-Aldrich, Austin, TX, USA provided absolute ethanol (C2H5OH, Merck, Beijing, China) and acetic acid (CH3CO2H, 99.7%, Sigma-Aldrich, Austin, TX, USA). Polyvinyl pyrrolidone (PVP, Mw ~29,000 Sigma-Aldrich, Austin, TX, USA), titanium tetra-isopropoxide (TTIP Assay 97%, Sigma-Aldrich, Austin, TX, USA, and zinc acetate di-hydrate (Zn(CH3COO)2 H2O: Lab 97%, Aldrich, USA) were used as precursors for the electrospinning process. TiO2 and ZnO nanofiber collection was conducted using fluorine-doped tin oxide (FTO) glass. It was decided to employ electrospinning, since it is a popular, quick, and easily controllable technique for creating nanofibers [17]. MaBr (solution parameters such as viscosity, concentration, and surface tension), processing parameters such as applied voltage, spinning distance, and nozzle radius, and environmental parameters such as temperature, humidity, and atmosphere pressure, are the optimized conditions for producing nanofibers in the fabrication of solar cells [12].

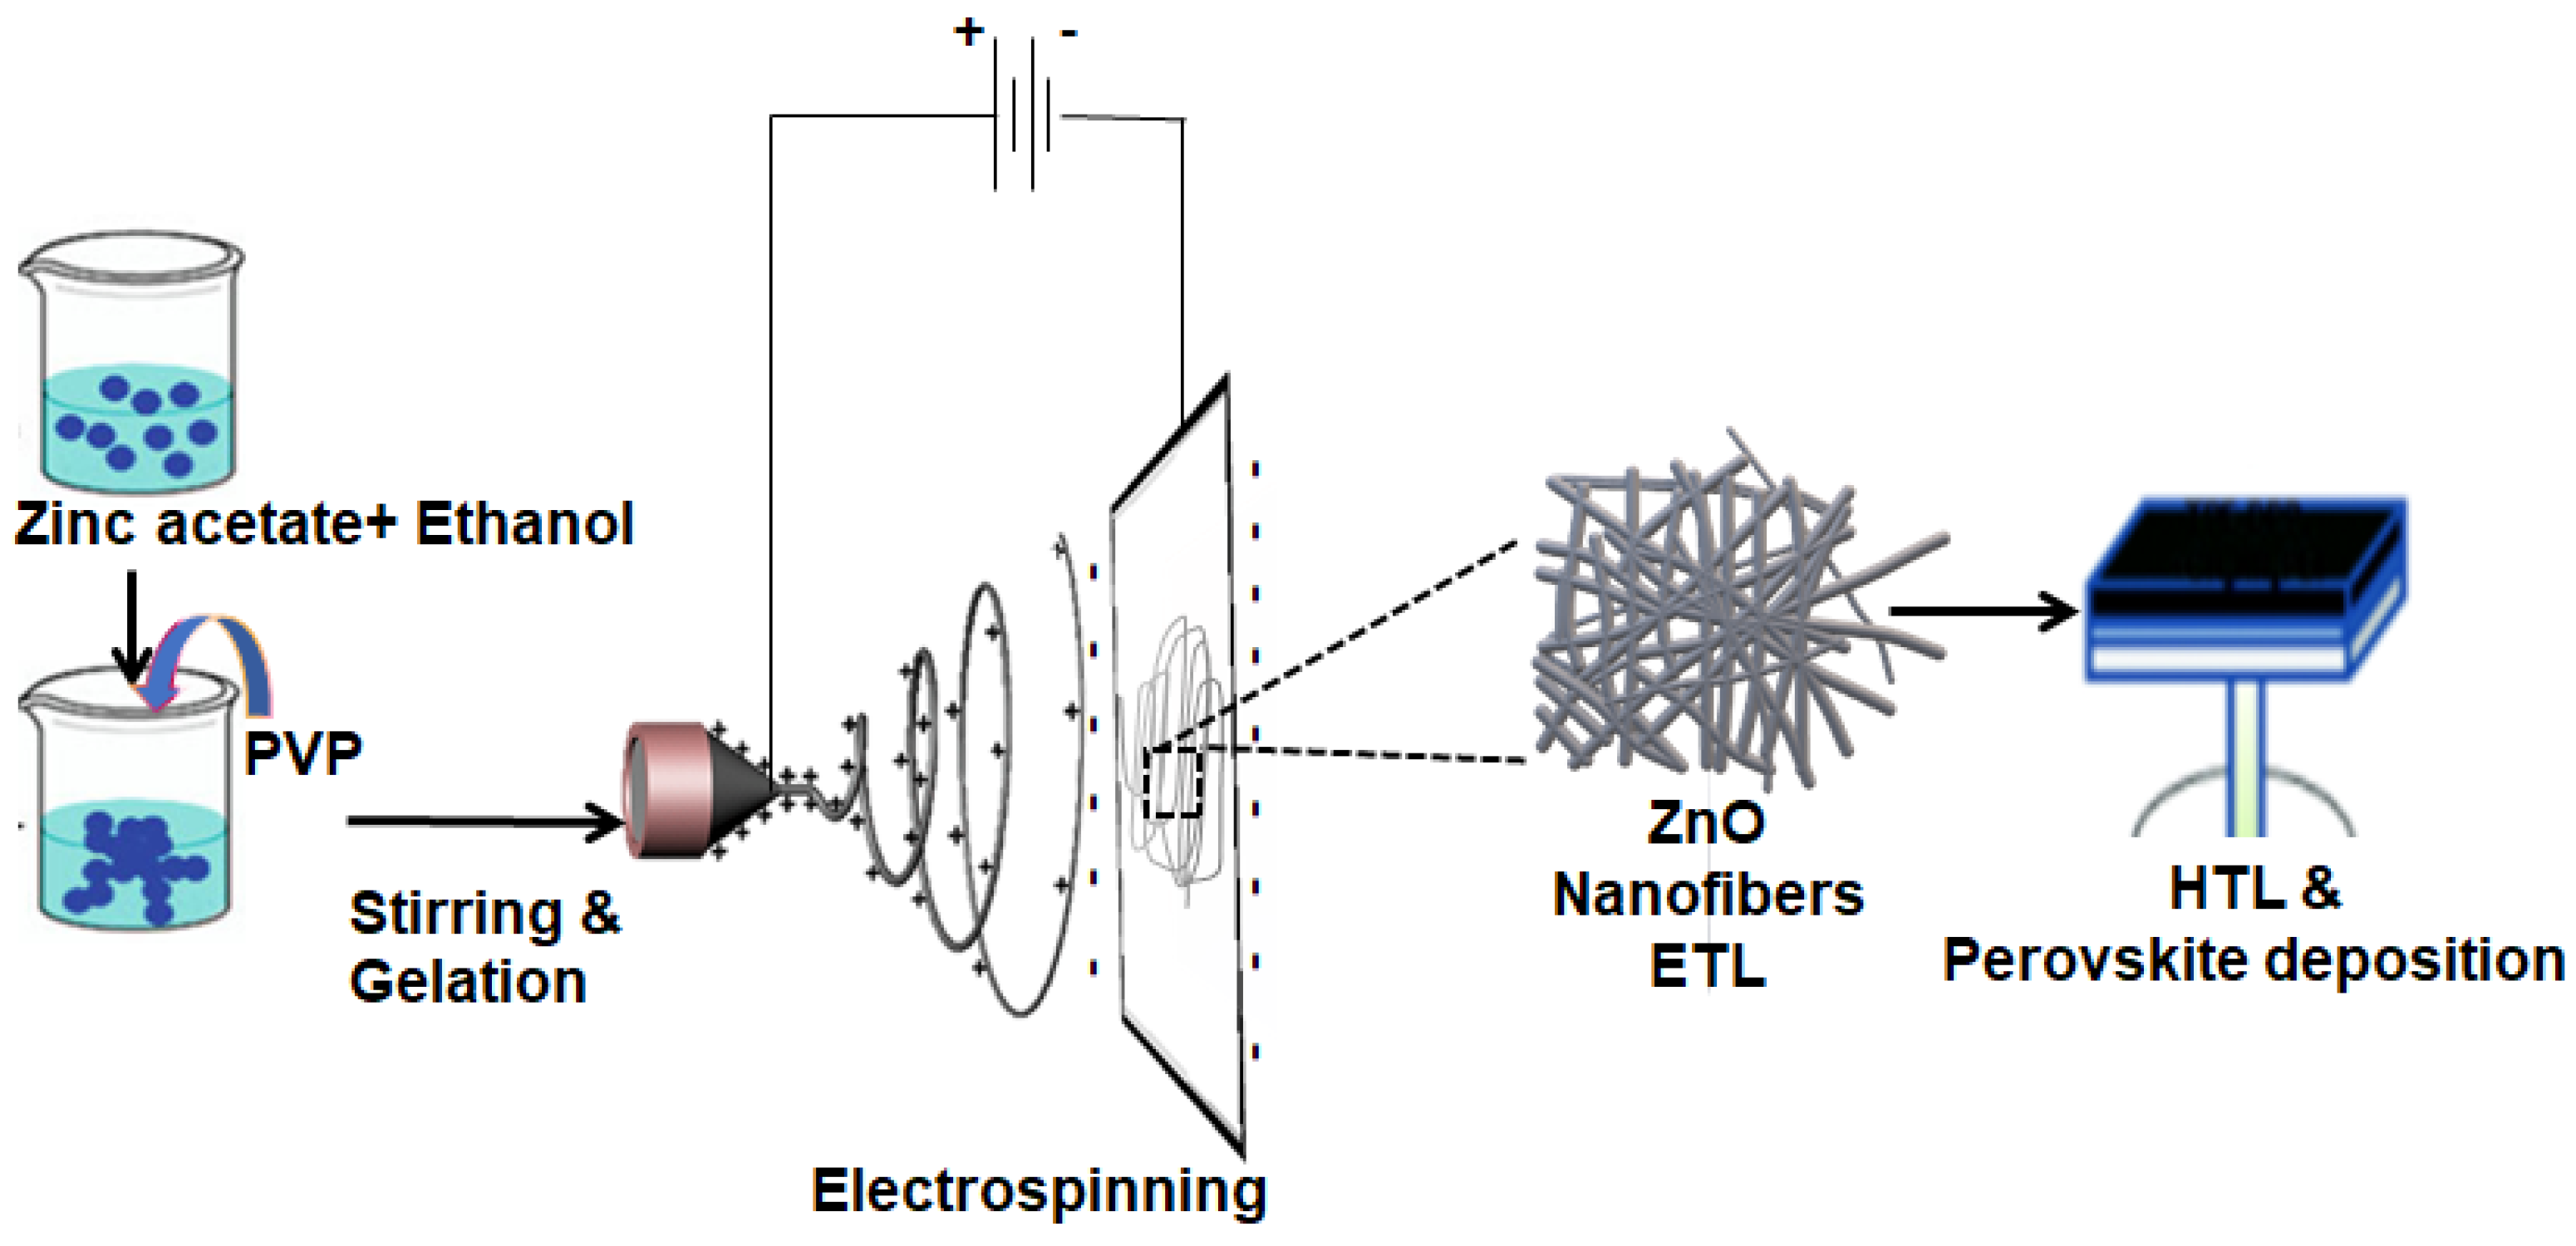
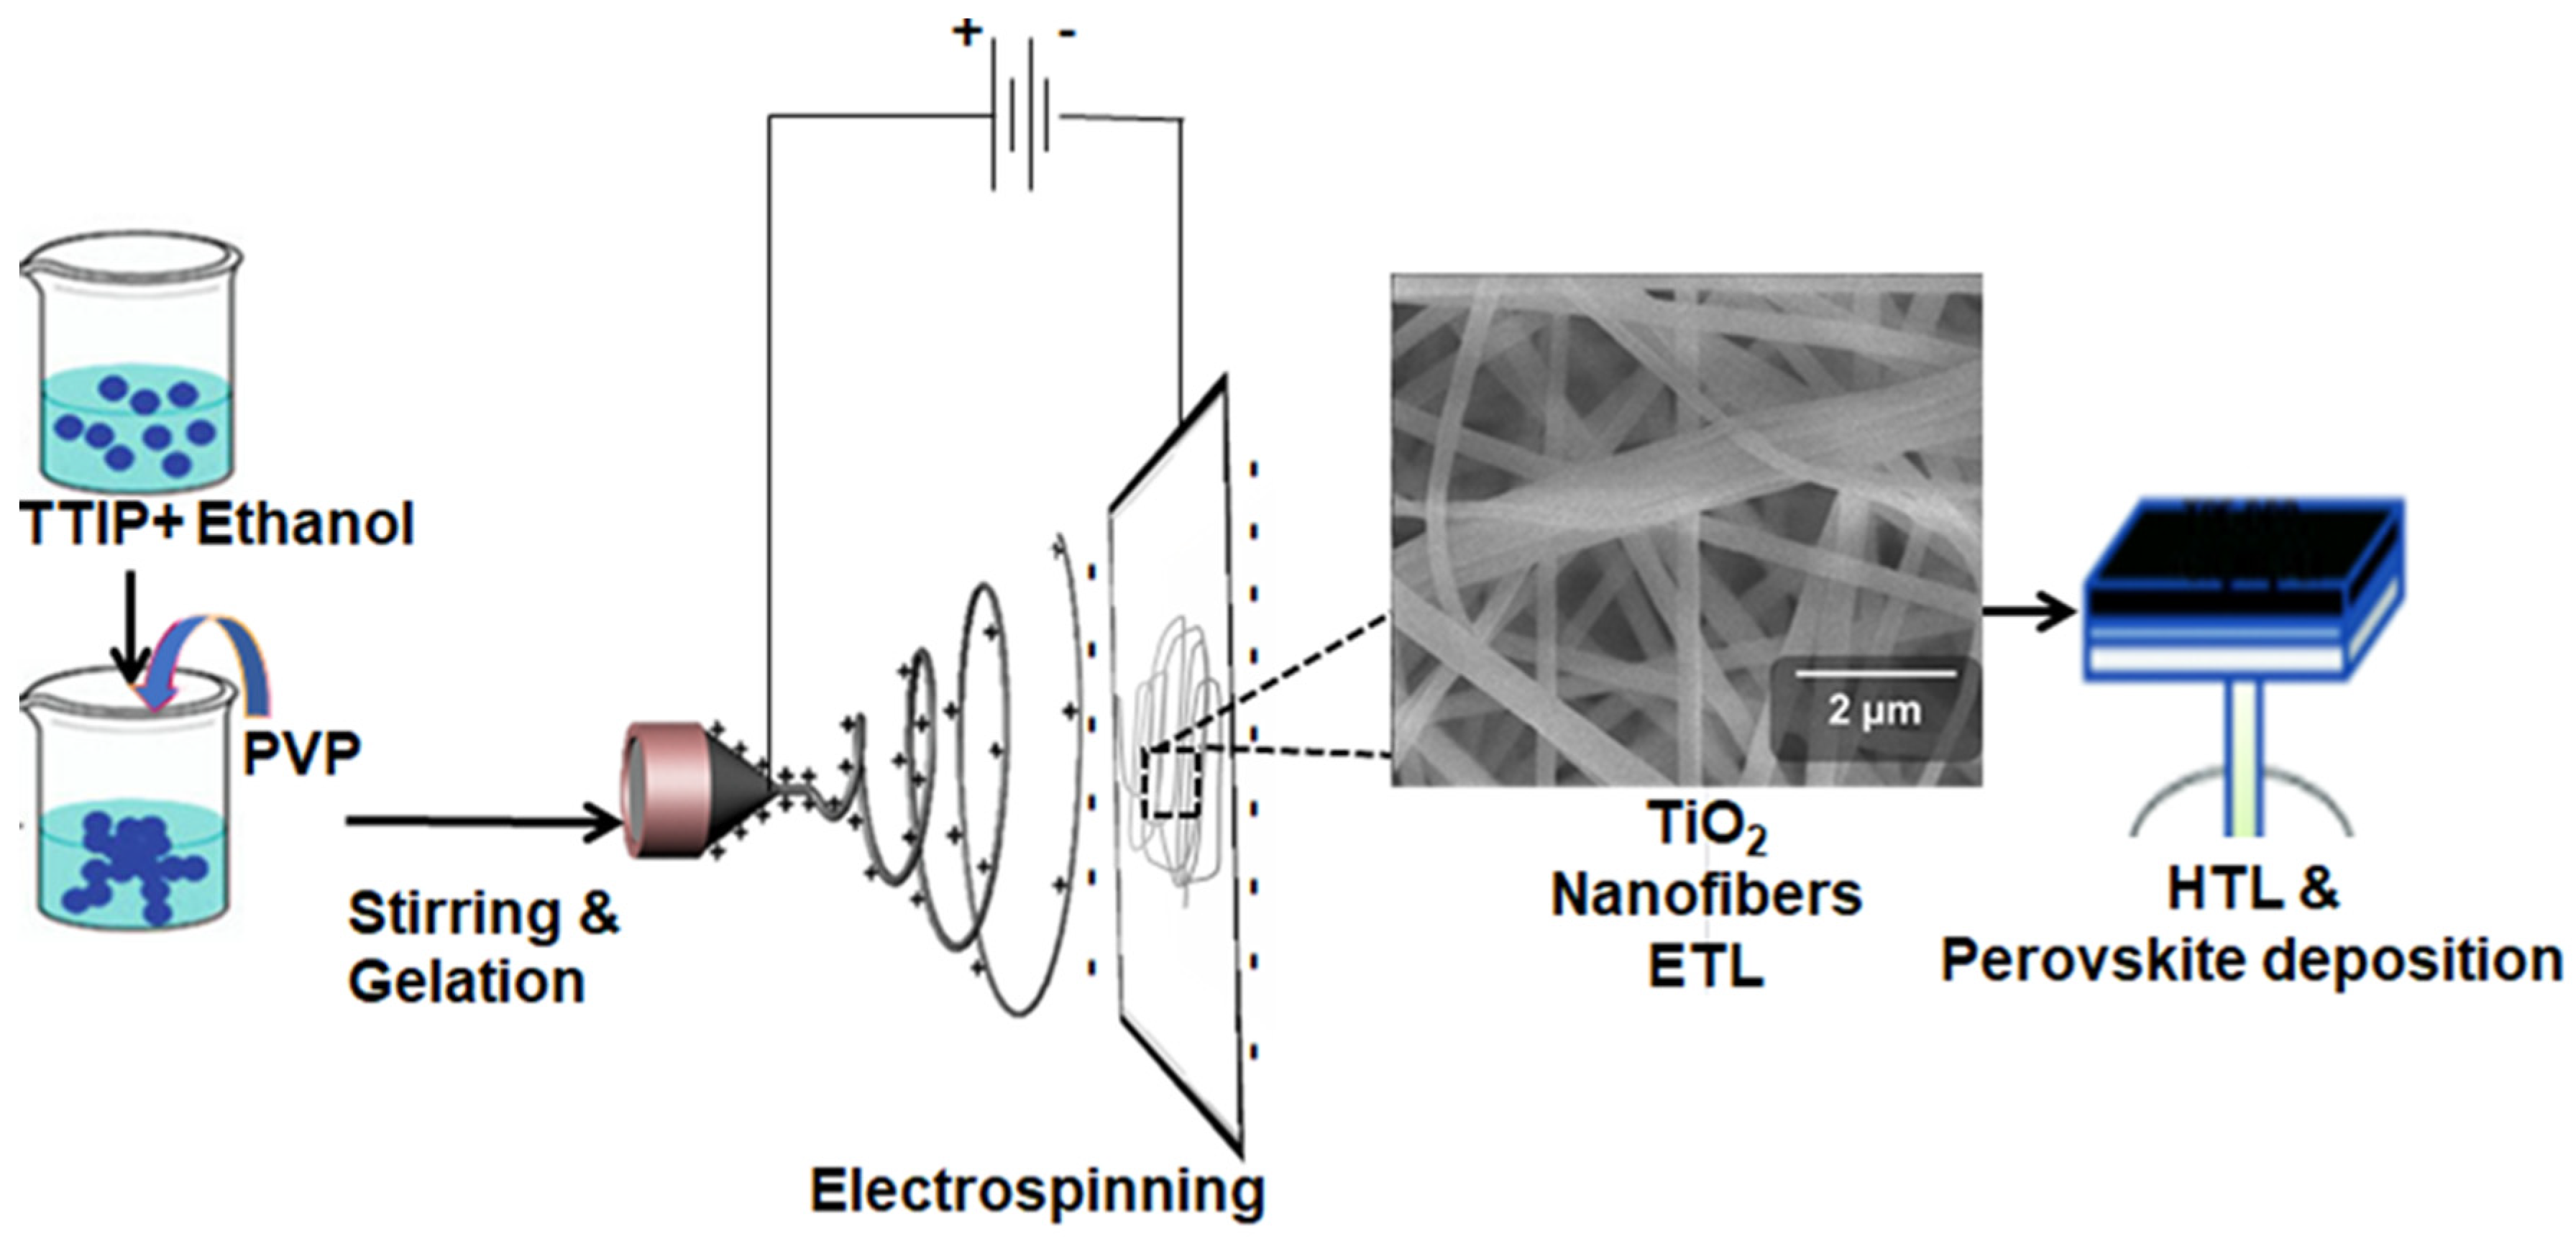
2.1. ZnO and TiO2 Nanofiber Synthesis

Figure 1 illustrates the process of electrospinning ZnO nanofiber synthesis. One hour was spent stirring 40 mL of ethanol with 5 g of zinc acetate added. At 60 °C, 3 mL of acetic acid and 2.5 g of PVP were added while stirring and allowed to stir further for 5 h. In order to ensure optimal gelation, this was left to age for two days. A 0.45-mm needle tip diameter syringe, diffusion pumps, collector and intake stages, and a DC power source make up the electrospinning setup. The entire electrospinning apparatus for the manufacture of nanofibers is shown in Figure 1. Using a needle (21 gauge) and a pumping velocity of 4000 rpm, these mixes were spun in an electric field of up to 20 kV. We used a direct voltage of 18 kV and a negative voltage of 4 kV at the time of discharge. The solutions moved at a rate of 5 mL/min, and there was a gap of 16 to 20 cm between the needle and the substrates. Perovskite and hole transport material were deposited following the creation of nanofiber Electron Transport Layer (ETL), as detailed in the section on the construction of solar cells.
For the TiO2 nanofiber sol, 48 mL of ethanol was gradually mixed with 12 mL of TTIP. After two hours of continuous stirring at 400 rpm, 2.5 g of PVP was added in stages and stirred for 5 h at 60 °C. In order to obtain the correct gelation, this was aged for two days, as Figure 2 illustrates.

2.2. Solar Cell Fabrication

For solar cell fabrication, firstly, the ETL layer was deposited, followed by a perovskite composition of methyl ammonium bromide (MABr, 0.2 mM). Dimethyl formamide (DMF, 0.8 mL, Sigma Aldrich, Austin, TX, USA) was mixed with dimethyl sulfoxide (DMSO, 0.2 mL, Sigma-Aldrich, Austin, TX, USA) in a 20 μL solution containing PbBr2 and PbI2 (0.2 mM, Sigma Aldrich, Austin, TX, USA), (1.1 mM, Sigma Aldrich, Austin, TX, USA), with formamidinium iodide (FAI, 1 mM; Sigma Aldrich, Austin, TX, USA) and methyl ammonium bromide (MABr, 0.2 mM, Sigma Aldrich, Austin, TX, USA). In order to deposit this, ZnO and TiO2 nanofiber ETLs were coated using a spin-coating process for seven seconds at 4500 rpm. Afterward, 90 μL of anhydrous chlorobenzene was added to help the evenly deposited film crystallize. The film was left to dry for fifteen minutes at 100 °C on a hot plate. Next, the HTL layer was coated using a mixture of spiro-OMeTAD (100 mg) and chlorobenzene solution (1.094 mL, Nature chemicals, Islamabad, Pakistan). On the absorber layer, this layer was once again spin-coated for 20 s at 2000 rpm. A glove box filled with N2 was used for the entire fabrication procedure. Our device’s mask aperture measured 15 mm by 15 mm, and its device area measured 25 mm by 25 mm. Finally, a thermal evaporator was utilized to deposit 80 nm gold back electrodes while maintaining a vacuum of 10−7 Torr.

2.3. Characterizations

Using an X-ray detector, Sigma Aldrich, Austin, TX, USA with a radiation wavelength of 1.5418 Å and a Bragg–Brentano configuration, the D8 Advance (Bruker Advanced, Berlin, Germany) was used to estimate the structural parameters and assess the impact of the TiO2 and ZnO structures. The samples were scanned with a step size of 0.05°/5 s, with a range of 2θ = 10° to 80°. To investigate the XRD analysis, DIFFRAC Plus EVA Version 5.0 software was utilized. A 514 nm excitation laser was used to corroborate the phase composition analysis of the nanofibers using RENISHAW Invia 2000 Raman spectroscopy, Bruker Advanced, Berlin, Germany. Using a JEOL JSM6490A scanning electron microscope (SEM) (Astoon, Tokyo, Japan), the morphology of the nanofiber samples was examined. Prior to sample analysis, all samples were coated with gold for one minute in order to obtain clear images free of charge accumulation. The Model UH4150AD UV-Vis-NIR, Bruker Advanced, Berlin, Germany was used to conduct UV-vis spectroscopy (300 nm–800 nm). Attenuated total reflection mode on the Cary 630 (Agilent Technologies, Austin, TX, USA) was utilized to conduct Fourier transform infrared spectrophotometry (FTIR). Electrical tests, conductivity, sheet resistance, and sheet carrier mobility were carried out using a Swin system, Austin, TX, USA with a 5300 G magnetic field at a temperature of 300 K [10]. Under a sunlight simulator (Newport 94043A, Austin, TX, USA, Bruker Advanced, Berlin, Germany), AM 1.5 simulated light (100 mW cm−2) was used to test the properties of solar cells and current density-voltage (J-V). The scan was conducted in reverse, with a speed of 10 mV s⁻¹ and a dwell duration of approximately 1 s for each 10 mV step. Using a Xenon lamp, Austin, TX, USA at 1.5 AM sun illumination and a Keithley 2400 source meter, Berlin, Germany calibrated to a silicon reference cell, initial JV parameters were determined. Prior to measurements, a silicon photodiode was used for calibration.

3. Results and Discussion

To investigate the crystal structure, crystallographic phases, and peaks at diffracted sites, XRD analysis was carried out. The fundamental composition of materials and their crystal planes were assessed by this analysis. Following calcination, the XRD spectra of ZnO and TiO2 nanofibers were measured between 12.5° and 80° (Figure 3a). Zinc oxide nanofibers exhibit the wurtzite phase, while Titania exhibits the anatase phase, upon annealing at 450 °C and the removal of the binder. This provides the crystal’s unique crystalline properties and crystallinity. An XRD examination of TiO2 nanofibers shows that peaks at 2θ of 25.5°, 38.52°, 48.49°, 54.09°, 55.62°, and 63.80°, correspond to (101), (004), (200), (105), (211), and (204) planes, respectively. Peaks were identified for a sintered sample at ambient temperature using JCPDS Nos. 21–1272 and 29–1363 [18]. There were no impurity peaks found in the TiO2 nanofibers, and the peaks of (101) at (2θ = 25.5°) were substantially stronger than the other peaks [19]. The relative intensity and its maxim were aligned with the anatase TiO2 general perturbation pattern, which shows a preferential growth of the (101) plane. Five primary peaks were seen in the ZnO spectra; these peaks corresponded to crystallographic planes (100), (002), (101), (102), (110), (103), (200), (112), and (201), which generally represent the hexagonal wurtzite structure of ZnO [20]. This observation, which is associated with the structure of polycrystalline ZnO nanofibers, correlates well with ZnO’s JCPDS (36–1453) and shows no impurity peaks. (Figure 3a). These nanofibers’ distinct, sharp peaks reflected how annealing produces well-oriented nanofibers with specified planes and an appropriate dislocation density. The formation of polycrystalline nanofibers is significantly impacted by the annealing temperature, since this is the stage where the sintering of nanodomains and removal of the binder take place [21].
Raman spectra are used to support the crystallographic analysis obtained via XRD. The Raman spectra of both fibers were obtained in the 250–3250 cm−1 range, which is consistent with the XRD results. Photoactive materials can be studied using Raman spectroscopy, which uses the inelastic scattering of light by phonon quanta with the energy of lattice vibrations. The perovskite material absorbs this energy and uses it to create holes and electrons. Raman scattering of the production or annihilation of a phonon affects the mobility and generation of electrons and holes. Due to their higher resonance, the polar bonds of O–O in the Titania lattice, such as the Eg, A1g, and B1g modes, have much greater intensities. The phonon mode of TiO2, which peaks at 527 cm−1, becomes active due to tensile stresses that impact the solar cell devices’ light conversion efficiency. ZnO’s Raman spectra showed an A1T phonon mode at 436.5 cm−1, whereas the phonon frequency of T2H indicated a strong mode at 638.5 cm−1. Phonons are scattered and absorbed due to the wurtzite crystal structure’s limited phonon frequency. Regarding anatase TiO2 fibers, three peaks were observed: the Eg, A1g, and B1g modes were located at 648, 405, and 527 cm−1, in that order [22]. These have a structure that is quite similar to anatase Titania. ZnO’s Raman spectra showed an A1T phonon mode at 436.5 cm−1, whereas the phonon frequency of T2H indicated a strong mode at 638.5 cm−1. A restricted phonon frequency like this is only seen in the crystal structure of wurtzite. Yang et al. have previously noted the TO phonon frequency redshift in ZnO nanofibers relative to TiO2 [23]. The second-order phonon mechanism at 1538.5 cm−1 is also highlighted, as in Figure 3b.
Using images from scanning electron microscopy, the surface morphology of the porous network made of nanofibers was examined. Attaining a high interface for electron conduction requires semiporous, fine, elongated, and homogeneous nanofibers. Better light absorption and consequent electron extraction from the perovskite material’s conduction band are made possible by these nanofibers’ properties. The ideal electrospinning setup settings and a controlled production rate result in the formation of fibers with the ideal shape. The collector at FTO was positioned in accordance with the characteristics of the nanofibers in order to produce a dense and ideal collection of nanofibers. Nanofiber formation is extremely dependent on sol-gel viscosity; at very low concentrations, nanofibers do not form [24]. Taking into consideration the previously mentioned characteristics, we considerably fine-tuned the processing settings to produce fibers suitable for ETL.
Figure 4a–c displays SEM images of the synthesized ZnO and TiO2 nanofibers following the annealing process. As anticipated, the spontaneous fiber extrusion via the electrospinning jet resulted in the nanofibers being localized at different orientations. There was no aggregation, and every fiber was uniformly produced and extended. Zinc oxide nanofiber films and nanoporous Titania form on the substrate as a result of this. The deposited ZnO and TiO2 sheet has a large number of nanofibers with diameters of less than 0.5 µm, providing a suitably high interface for charge extraction from the absorber layer.
When compared to ZnO, TiO2 nanofibers are more homogeneous, elongated, and dense. The maximal conduction of photogenerated electrons from the valence band to the conduction band is achieved by the extremely dense structure of TiO2 nanofibers. Additionally, the TiO2 fibrous structure facilitates a more aligned electron path that results in the maximum current densities. Additionally, it causes the electrons from the perovskite layer to diffuse efficiently. The fibers’ shape was consistent across the FTO-glass substrate, twisted in certain places, and uniformly porous. The side view of the entire PSC device is displayed in Figure 4c, which prominently displays the glass/FTO/ZnO nanofiber-based ETL/MAPbI3 (absorber layer)/spiro-OMeTAD/Ag, respectively. Figure 4c shows that the perovskite has been properly infused into the ETL nanofibers. Using an optical profilometer, the thickness of the electron transport layer (ETL), including ZnO and TiO2 nanofibers (440 nm), was determined.
As seen in Figure 5a,b, optical characterization of photoanodes based on TiO2 and ZnO nanofibers was performed to verify the absorption range, edge, and the band gap analysis for both samples. Photoexcitation is primarily due to semiconductor materials’ absorption of ultraviolet (UV); it can also be due to absorption of near-UV visible light. Only a specific percentage of the light—that is, light that is greater than the bandgap—is absorbed. The exciton, or electron-hole pair, that results from photoexcitation initiates photocatalysis. Using a UV-visible spectrophotometer, the radiation absorption of nanofibers was measured in the 220–800 cm−1 range. Both ZnO and TiO2 exhibited high energy spectrum absorption, as seen in the Figure 5, while low energy photons continued to flow through, which is necessary for the perovskite absorber layer [25,26]. A transparent ETL can be formed since the spectra show that a significant portion of absorption occurs in the ultraviolet (UV) and near-UV regions.
The sample bandgap was determined using the Tauc plot, which indicates the lowest energy needed for photoexcitation. Equation (1) was used to convert wavelength into energy and determine the bandgap of each sample:
E = hc/ƛ
In this case, “E” stands for energy, “h” for Planck’s constant, “ɛ” for wavelength, and “c” for the speed of light. The indirect bandgap of Titania is around 3.3 eV. The exciton band gap (Eg = 3.2 eV) is visible in the ZnO absorption spectra. The photoexcited electrons are transferred from the perovskite to the FTO glass by these appropriate bandgaps, which also supply the necessary Fermi energy level. Improved charge transport reduces energy loss, allowing the solar cell to have higher current densities and a higher open-circuit voltage. In comparison to Titania, ZnO had a marginally smaller band gap; however, Titania gives a more favorable band gap for fermi electron movement from the valence band to the conduction band.
As seen in Figure 5c, Fourier transform infrared spectroscopy analysis was used to find each group of function in the 720–4000 cm−1 range. Both nanofibers show characteristics peaks around 3200–3600 cm−1 associated that is associated with the OH bond’s vibration, while bending of OH appears at 1630 cm−1 [27]. On the surface of nanoparticles, dangling bonds give rise to these hydroxyl groups. The extended stay time of excitons and their absorption are caused by these hanging bonds, creating defect states. It is therefore anticipated that the functional surface will have increased photocatalytic activity. The hydrolysis reaction, which remains pendent at the surface, primarily forms Ti–OH bonds. Compared to Titania, ZnO exhibited somewhat more hydroxyl functional groups. A surface with this kind of functionality offers a more robust interface for the perovskite layer to adhere to [28]. However, the increased moisture absorption of such hydrophilic groups decreases the life of solar cells [29,30,31].
Characterizing the values of sheet resistance, conductivity, resistivity, and sheet carrier mobility was done using the Hall Effect swing system. Four probing approaches were employed to determine the conductivity characteristics of the nanofiber films. The resistivity, sheet resistance, carrier mobility, and conductivity of the two samples are contrasted in Table 1. The resistivity of pure TiO2 is 7.6 × 10³ Ω cm, but that of ZnO nanofibers is 9.8 × 10³ Ω cm. Due to its slower electron transport compared to TiO2, zinc oxide exhibits higher resistance. TiO2 offers an even and straight channel for the movement of electrons. It decreases resistivity by accelerating the diffusion of photoelectrons. The conductivity of the pure ZnO sample is 1.12 × 10⁻⁴ 1/Ohm-cm, whereas pure TiO2 has a conductivity of 1.28 × 10⁻⁴ 1/Ohm-cm.
TiO2 is a more conductive substance than ZnO because conductivity is reciprocal to resistance. TiO2 will help electrons move more quickly. As a result, the sheet resistance of the pure ZnO sample is 5.3 × 10⁸ Ohm-sq. The sheet resistance of pure TiO2 is 4.3 × 10⁸ Ohm-sq. ZnO’s photoactivity will be reduced since the electrons in this compound will encounter greater sheet resistance along their route. A carrier mobility of 1.4 × 10⁻² cm2/Vs was obtained from the pure ZnO sample. The carrier mobility of pure TiO2 is 1.52 × 10⁻² cm2/Vs. This suggests that TiO2 has slightly higher absorption of light and a tuned electrical band structure. These characteristics will help improve TiO2’s electron conduction and reduce resistance losses. Improved electron conduction leads to a higher current density, which raises solar cell efficiency. In general, TiO2 exhibits more favorable electrical characteristics than ZnO, including effective electron transport [32].
Electrochemical impedance spectrum (EIS) measurements were characterized to understand the charge transfer behavior of the solar cells. Figure 6a shows the Nyquist plots of solar cells based on TiO2 and ZnO nanofibers. The EIS show two arcs. The arc with higher frequency represents interface contact resistance, while low frequency generally represents recombination resistance (Rrec) and chemical capacitance (Cμ) of the device. Figure 6b shows an equivalent circuit for fitting the EIS. Table 2 also lists all the fitting values. The solar cells fabricated from TiO2 nanofibers have smaller series resistance and larger recombination resistance compared to ZnO nanofibers. This shows that the charge transport ability was modified by TiO2 nanofibers, thereby reducing carrier recombination. There are numerous bulk trap states as well as surface trap states due to oxygen vacancies in ZnO. TiO2 can decrease the trap density, probably due to oxygen vacancy reduction. The smaller series resistance in the case of TiO2 nanofibers is attributed to the decreased traps density.
As seen in Figure 7a, external quantum efficiency (EQE) was calculated for both TiO2 and ZnO nanofiber photoanodes with perovskite in order to determine the cause of the Jsc boost. According to reports, the EQE is the result of charge injection/transfer, charge collecting, and light harvesting efficiency. In the range of 400 to 780 nm, the EQE spectrum of TiO2 photoanodes exhibits a broad peak value of almost 90%, whereasthat of ZnO photoanodes shows a broad peak value below 80%. The creation of high-performance cells and their simple planar shape validates the superior potential of TiO2 nanofibers over ZnO nanofibers in solar applications.
The integral of the current density from External Quantum Efficiency (EQE) curves is a key parameter for evaluating the performance of photovoltaic devices, such as the solar cells shown in Figure 7b. The EQE curve represents the fraction of incident photons that are converted into electrical current at each wavelength of light. In our devices, the integrated photocurrent density for the ZnO photoanode is 16 mA cm−2, while for TiO2, its value is 18 mA cm−2. The integrated current density derived from the EQE spectra in Figure 7b is close to the Jsc measured under simulated sunlight.
A PL spectrophotometer was used for the characterization of charge recombination dynamics in perovskite solar cells. The electron and hole recombination of TiO2 and ZnO were compared using photoluminescence (PL) spectra, as shown in Figure 8a. The high peak intensity of ZnO shows a higher direct recombination of electron-hole pairs. In contrast, TiO2 nanofibers decrease the recombination of charges, thus resulting in better charge separation and associated photo-conversion efficiency. Charges have longer dwell times, hence charges can participate in photo-conversion efficiency for longer times.
Time-resolved photoluminescence spectra (TRPL) of undoped TiO2/perovskite and ZnO/perovskite were recorded using a fluorometer, as shown in Figure 8b. The TRPL measurements were characterized by a bi-exponential decay function, with a full fast decay (τ1) component and a slow decay component (τ2). Free carrier transportation from perovskite to TiO2 results in the fast decay component, while radiative decay results in the slow decay component. In the case of ZnO nanofibers, the fast decay time is 55.1 ns, and the slow decay time is 121.4 ns, while their weight fractions are 31.3 and 67.7%, respectively. In the case of TiO2 nanofibers, the fast decay lifetime is decreased to 36.4 from 55.1 ns, and the slow decay lifetime to 109.5 from 121.4 ns, while the weight fraction of fast decay is increased to 35.1 from 31.3%. It is concluded that the TiO2/perovskite interface presents a faster charge transfer and induced charge recombination than the ZnO/perovskite interface. The stability and efficiency of the solar cells based on TiO2 and ZnO nanofibers could be due to the property change of the ETM, which affects the charge behavior at the interfaces.
J-V measurements were performed to determine solar cell characteristics and to assess how TiO2 and ZnO nanofibers affected the performance of solar cells. Figure 9 illustrates the JV performance of photoanodes built on titanium and zinc oxide nanofibers. Table 3 also provides a summary of all performance metrics. The current density (Jsc) of ZnO nanofibers was 17.77 mA/cm2, while TiO2 had a Jsc of 20.68 mA/cm2. This increase is the result of TiO2’s improved conductivity of the ETL, which makes it possible for perovskite solar cells to efficiently use photons for energy harvesting [33]. As a result of TiO2’s superior charge transport characteristics over ZnO, more electrons are drawn to the external circuit, leading to a larger Jsc. In addition to effectively accelerating electron transport and lowering recombination rates to increase Jsc, band alignment with TiO2 also produces effective ETLs. TiO2’s transparency contributes to increased Jsc values and improved light absorption by the perovskite layer. Jsc is much better with TiO2 nanofibers ETL, which may be due to better band alignment. The electrons easily move from the perovskite conduction band to the TiO2 conduction band due to appropriate band alignment.
Because holes have a higher mass than electrons, electrons have a higher mobility than holes. This is due to the fact that holes, which are often the space left by missing electrons, have a fixed orbit around atoms. The movement of electrons is favored by the electron transport structure, which raises conductivity and electron transport properties. Higher electron concentrations reduce charge recombination by increasing charge mobility. Furthermore, the conduction band and Fermi level tuning facilitate improved electron quenching to TiO2 from the perovskite layer. Effective electron transport loops (ETLs) that aggressively suppress holes and recombination rates are produced by band alignment with TiO2. Effective charge separation is possible because band alignment and conduction work together to limit electron-hole recombination and preserve their energy barrier [34]. Furthermore, TiO2 nanofiber-based ETL proved successful in continuous electronic pathways; as a result, greater FF is achieved with improved electrical conductivity. One term for the increase in FF is “lowered series resistance” [11,35,36,37]. TiO2 showed an efficiency of 10.4%, while ZnO demonstrated an efficiency of 8.5%. TiO2 exhibits superior Jsc due to its efficient electron transport, which also results in less charge recombination. Increased electron transport from the valence band to the conduction band as a result of an optimized and tuned bandgap leads to increased efficiency. In conclusion, the TiO2 nanofiber-fabricated ETL offers improved energy harvesting and perovskite solar cell efficiency [38].
The performance of our proposed ZnO and TiO2 nanofibers was comparable to that of previously reported nanofibers, as shown in Table 4. Compared to other photoanodes, our materials are low-cost and earth-abundant, making them advantageous in commercial applications.
In our optimized ZnO nanofibers, the current density is 17.77 mA cm−2, possessing an efficiency 8.5%. For whole TiO2 nanofibers, the current density is 20.68 mA cm−2, possessing an efficiency 10.4%.

4. Conclusions

In conclusion, the electrospinning method was effectively used to synthesize ZnO and TiO2 nanofibers on the same scale and under the same parameters, which were then annealed at 450 °C. TiO2 and ZnO polycrystalline nanofibers were produced following the elimination of PVP during the annealing process, according to XRD spectra. The Raman spectra and the XRD data also revealed the polycrystalline nature of the nanofibers. It is evident from scanning electron microscopy images that ZnO and TiO2 nanofibers are long, fibrous, and continuous in shape. Both zinc oxide as well as Titania nanofibers exhibit promising absorption spectra, with bandgaps of 3.2 and 3.3 eV, respectively, according to a preliminary characterization for photoactivity. According to Hall measurements, TiO2 nanofibers have a greater conductivity of 1.28 × 10⁻⁴ Ohm/cm compared to ZnO nanofibers, which showed 1.12 × 10⁻⁴ Ohm/cm. TiO2 decreases the trap density probably due to oxygen vacancy reduction. The smaller series resistance in the case of TiO2 nanofibers is attributed to the decreased trap density. TiO2 nanofibers had a higher conversion efficiency of 10.4% compared to 8.5% for ZnO, owing to their superior conductivity. TiO2 will, therefore, have more photoactivity for energy harvesting if it is synthesized under the same processing conditions as ZnO.

Author Contributions

Methodology, A.Z.; Software, A.Z.; Validation, W.I.; Formal analysis, W.I.; Investigation, S.K.; Resources, M.F.; Writing—original draft, S.K. and M.F.; Writing—review and editing, A.A. All authors have read and agreed to the published version of the manuscript.

Funding

The researchers would like to thank the Deanship of Graduate studies and scientific research at Qassim University for financial support (QU-APC-2024-9/1).

Institutional Review Board Statement

Not applicable.

Informed Consent Statement

Not applicable.

Data Availability Statement

The original contributions presented in the study are included in the article; further inquiries can be directed to the corresponding author.

Conflicts of Interest

The authors declare no conflicts of interest.

References

  1. Lotus, A.; Kang, Y.; Ramsier, R.; Chase, G.G. Investigation of the physical and electronic properties of indium doped zinc oxide nanofibers synthesized by electrospinning. J. Vac. Sci. Technol. B 2009, 27, 2331–2336. [Google Scholar] [CrossRef]
  2. Wang, D.; Wright, M.; Elumalai, N.K.; Uddin, A. Stability of perovskite solar cells. Sol. Energy Mater. Sol. Cells 2016, 147, 255–275. [Google Scholar] [CrossRef]
  3. Patil, J.V.; Mali, S.S.; Patil, A.P.; Patil, P.S.; Hong, C.K. Highly efficient mixed-halide mixed-cation perovskite solar cells based on rGO-TiO2 composite nanofibers. Energy 2019, 189, 116396. [Google Scholar] [CrossRef]
  4. Park, N.-G. Perovskite solar cells: An emerging photovoltaic technology. Mater. Today 2015, 18, 65–72. [Google Scholar] [CrossRef]
  5. Mali, S.S.; Shim, C.S.; Kim, H.; Patil, P.S.; Hong, C.K. In situ processed gold nanoparticle-embedded TiO2 nanofibers enabling plasmonic perovskite solar cells to exceed 14% conversion efficiency. Nanoscale 2016, 8, 2664–2677. [Google Scholar] [CrossRef]
  6. Gonzalez-Pedro, V.; Juarez-Perez, E.J.; Arsyad, W.-S.; Barea, E.M.; Fabregat-Santiago, F.; Mora-Sero, I.; Bisquert, J. General working principles of CH3NH3PbX3 perovskite solar cells. Nano Lett. 2014, 14, 888–893. [Google Scholar] [CrossRef]
  7. Imran, M.; Haider, S.; Ahmad, K.; Mahmood, A.; Al-Masry, W.A. Fabrication and characterization of zinc oxide nanofibers for renewable energy applications. Arab. J. Chem. 2017, 10, S1067–S1072. [Google Scholar] [CrossRef]
  8. Valadi, K.; Gharibi, S.; Taheri-Ledari, R.; Akin, S.; Maleki, A.; Shalan, A.E. Metal oxide electron transport materials for perovskite solar cells: A review. Environ. Chem. Lett. 2021, 19, 2185–2207. [Google Scholar] [CrossRef]
  9. Son, D.-Y.; Im, J.-H.; Kim, H.-S.; Park, N.-G. 11% efficient perovskite solar cell based on ZnO nanorods: An effective charge collection system. J. Phys. Chem. C 2014, 118, 16567–16573. [Google Scholar] [CrossRef]
  10. Amna, T.; Hassan, M.S.; Barakat, N.A.; Pandeya, D.R.; Hong, S.T.; Khil, M.-S.; Kim, H.Y. Antibacterial activity and interaction mechanism of electrospun zinc-doped titania nanofibers. Appl. Microbiol. Biotechnol. 2012, 93, 743–751. [Google Scholar] [CrossRef]
  11. Zhen, C.; Wu, T.; Chen, R.; Wang, L.; Liu, G.; Cheng, H.-M. Strategies for modifying TiO2 based electron transport layers to boost perovskite solar cells. ACS Sustain. Chem. Eng. 2019, 7, 4586–4618. [Google Scholar] [CrossRef]
  12. Qiu, L.; Zhuang, Z.; Yang, S.; Chen, W.; Song, L.; Ding, M.; Xia, G.; Du, P.; Xiong, J. Fabrication of high efficiency perovskite solar cells based on mesoporous TiO2 nanofibrous film under high humidity conditions. Mater. Res. Bull. 2018, 106, 439–445. [Google Scholar] [CrossRef]
  13. Park, J.Y.; Kim, S.S. Growth of nanograins in electrospun ZnO nanofibers. J. Am. Ceram. Soc. 2009, 92, 1691–1694. [Google Scholar] [CrossRef]
  14. Mali, S.S.; Su Shim, C.; Kook Hong, C. Highly porous Zinc Stannate (Zn2SnO4) nanofibers scaffold photoelectrodes for efficient methyl ammonium halide perovskite solar cells. Sci. Rep. 2015, 5, 11424. [Google Scholar] [CrossRef]
  15. Erdogar, K.; Yucel, O.; Oruc, M.E. Investigation of Structural, Morphological, and Optical Properties of Novel Electrospun Mg-Doped TiO2 Nanofibers as an Electron Transport Material for Perovskite Solar Cells. Nanomaterials 2023, 13, 2255. [Google Scholar] [CrossRef]
  16. Aryal, S.; Kim, C.K.; Kim, K.-W.; Khil, M.S.; Kim, H.Y. Multi-walled carbon nanotubes/TiO2 composite nanofiber by electrospinning. Mater. Sci. Eng. C 2008, 28, 75–79. [Google Scholar] [CrossRef]
  17. Siddheswaran, R.; Sankar, R.; Ramesh Babu, M.; Rathnakumari, M.; Jayavel, R.; Murugakoothan, P.; Sureshkumar, P. Preparation and characterization of ZnO nanofibers by electrospinning. Cryst. Res. Technol. 2006, 41, 446–449. [Google Scholar] [CrossRef]
  18. Xu, A.-W.; Gao, Y.; Liu, H.-Q. The preparation, characterization, and their photocatalytic activities of rare-earth-doped TiO2 nanoparticles. J. Catal. 2002, 207, 151–157. [Google Scholar] [CrossRef]
  19. Liao, D.; Liao, B. Shape, size and photocatalytic activity control of TiO2 nanoparticles with surfactants. J. Photochem. Photobiol. A Chem. 2007, 187, 363–369. [Google Scholar] [CrossRef]
  20. Liu, L.; Li, S.; Zhuang, J.; Wang, L.; Zhang, J.; Li, H.; Liu, Z.; Han, Y.; Jiang, X.; Zhang, P. Improved selective acetone sensing properties of Co-doped ZnO nanofibers by electrospinning. Sens. Actuators B Chem. 2011, 155, 782–788. [Google Scholar] [CrossRef]
  21. Tai, M.; Zhao, X.; Shen, H.; Guo, Y.; Zhang, M.; Zhou, Y.; Li, X.; Yao, Z.; Yin, X.; Han, J. Ultrathin Zn2SnO4 (ZTO) passivated ZnO nanocone arrays for efficient and stable perovskite solar cells. Chem. Eng. J. 2019, 361, 60–66. [Google Scholar] [CrossRef]
  22. Choi, H.C.; Jung, Y.M.; Kim, S.B. Size effects in the Raman spectra of TiO2 nanoparticles. Vib. Spectrosc. 2005, 37, 33–38. [Google Scholar] [CrossRef]
  23. Liu, Y.; Zhang, H.; An, X.; Gao, C.; Zhang, Z.; Zhou, J.; Zhou, M.; Xie, E. Effect of Al doping on the visible photoluminescence of ZnO nanofibers. J. Alloys Compd. 2010, 506, 772–776. [Google Scholar] [CrossRef]
  24. Zhang, X.; Thavasi, V.; Mhaisalkar, S.; Ramakrishna, S. Novel hollow mesoporous 1D TiO2 nanofibers as photovoltaic and photocatalytic materials. Nanoscale 2012, 4, 1707–1716. [Google Scholar] [CrossRef] [PubMed]
  25. Wang, W.; Zhang, Z.; Cai, Y.; Chen, J.; Wang, J.; Huang, R.; Lu, X.; Gao, X.; Shui, L.; Wu, S. Enhanced performance of CH3NH3PbI3 − x Cl x perovskite solar cells by CH3NH3I modification of TiO2-perovskite layer interface. Nanoscale Res. Lett. 2016, 11, 316. [Google Scholar] [CrossRef]
  26. Mahmood, K.; Khalid, A.; Mehran, M.T. Nanostructured ZnO electron transporting materials for hysteresis-free perovskite solar cells. Sol. Energy 2018, 173, 496–503. [Google Scholar] [CrossRef]
  27. Onozuka, K.; Ding, B.; Tsuge, Y.; Naka, T.; Yamazaki, M.; Sugi, S.; Ohno, S.; Yoshikawa, M.; Shiratori, S. Electrospinning processed nanofibrous TiO2 membranes for photovoltaic applications. Nanotechnology 2006, 17, 1026. [Google Scholar] [CrossRef]
  28. Zhang, Y.; Liu, X.; Li, P.; Duan, Y.; Hu, X.; Li, F.; Song, Y. Dopamine-crosslinked TiO2/perovskite layer for efficient and photostable perovskite solar cells under full spectral continuous illumination. Nano Energy 2019, 56, 733–740. [Google Scholar] [CrossRef]
  29. Duan, L.; Liu, S.; Wang, X.; Zhang, Z.; Luo, J. Interfacial Crosslinking for Efficient and Stable Planar TiO2 Perovskite Solar Cells. Adv. Sci. 2024, 11, 2402796. [Google Scholar] [CrossRef]
  30. Shakoor, A.; Nowsherwan, G.A.; Alam, W.; Bhatti, S.Y.; Bilal, A.; Nadeem, M.; Zaib, A.; Hussain, S.S. Fabrication and characterization of TiO2: ZnO thin films as electron transport material in perovskite solar cell (PSC). Phys. B Condens. Matter 2023, 654, 414690. [Google Scholar] [CrossRef]
  31. Hu, W.; Zhou, W.; Lei, X.; Zhou, P.; Zhang, M.; Chen, T.; Zeng, H.; Zhu, J.; Dai, S.; Yang, S. Low-temperature in situ amino functionalization of TiO2 nanoparticles sharpens electron management achieving over 21% efficient planar perovskite solar cells. Adv. Mater. 2019, 31, 1806095. [Google Scholar] [CrossRef] [PubMed]
  32. Yakuphanoglu, F. Electrical and photovoltaic properties of cobalt doped zinc oxide nanofiber/n-silicon diode. J. Alloys Compd. 2010, 494, 451–455. [Google Scholar] [CrossRef]
  33. Son, D.-Y.; Bae, K.-H.; Kim, H.-S.; Park, N.-G. Effects of seed layer on growth of ZnO nanorod and performance of perovskite solar cell. J. Phys. Chem. C 2015, 119, 10321–10328. [Google Scholar] [CrossRef]
  34. Laila, I.K.; Mufti, N.; Maryam, S.; Fuad, A.; Taufiq, A. Synthesis and characterization of ZnO nanorods by hydrothermal methods and its application on perovskite solar cells. J. Phys. Conf. Ser. 2018, 1093, 012012. [Google Scholar] [CrossRef]
  35. Dharani, S.; Mulmudi, H.K.; Yantara, N.; Trang, P.T.T.; Park, N.G.; Graetzel, M.; Mhaisalkar, S.; Mathews, N.; Boix, P.P. High efficiency electrospun TiO2 nanofiber based hybrid organic–inorganic perovskite solar cell. Nanoscale 2014, 6, 1675–1679. [Google Scholar] [CrossRef]
  36. Cao, F.; Tian, W.; Gu, B.; Ma, Y.; Lu, H.; Li, L. High-performance UV–vis photodetectors based on electrospun ZnO nanofiber-solution processed perovskite hybrid structures. Nano Res. 2017, 10, 2244–2256. [Google Scholar] [CrossRef]
  37. Chen, D.; Zhu, Y. Electrospun perovskite nanofibers. Nanoscale Res. Lett. 2017, 12, 114. [Google Scholar] [CrossRef]
  38. Yang, H.; Kwon, H.-C.; Ma, S.; Kim, K.; Yun, S.-C.; Jang, G.; Park, J.; Lee, H.; Goh, S.; Moon, J. Energy level-graded Al-doped ZnO protection layers for copper nanowire-based window electrodes for efficient flexible perovskite solar cells. ACS Appl. Mater. Interfaces 2020, 12, 13824–13835. [Google Scholar] [CrossRef]
  39. Mahmood, K.; Khalid, A.; Ahmad, S.W.; Mehran, M.T. Indium-doped ZnO mesoporous nanofibers as efficient electron transporting materials for perovskite solar cells. Surf. Coat. Technol. 2018, 352, 231–237. [Google Scholar] [CrossRef]
  40. Zhuang, Z.; Qiu, L.; Dong, L.; Chen, Y.; Chu, Z.; Ma, X.; Du, P.; Xiong, J. Preparation of high-efficiency perovskite solar cells via doping Ag into CuO nanofibers as hole buffer layer. Polym. Compos. 2020, 41, 2145–2153. [Google Scholar] [CrossRef]
  41. Mohtaram, F.; Borhani, S.; Ahmadpour, M.; Fojan, P.; Behjat, A.; Rubahn, H.-G.; Madsen, M. Electrospun ZnO nanofiber interlayers for enhanced performance of organic photovoltaic devices. Sol. Energy 2020, 197, 311–316. [Google Scholar] [CrossRef]
  42. Abbas, A.; Shar, A.H.; Junejo, M.A. Why Brands Fail? Antecedents and Consequences of Brand Hate. A Study of Fashion Industry in Pakistan. J. Manag. Sci. 2023, 17, 1–26. [Google Scholar]
Figure 1. Electrospinning process and PSC fabrication for the ZnO nanofibers.
Ceramics 07 00111 g001
Figure 2. Electrospinning process and PSC fabrication for the TiO2 nanofibers.
Ceramics 07 00111 g002
Figure 3. (a) XRD spectra for TiO2 and ZnO nanofibers; (b) Raman spectra for TiO2 and ZnO nanofibers.
Ceramics 07 00111 g003
Figure 4. Scanning electron morphology: (a) TiO2 nanofiber, (b) ZnO nanofiber, (c) cross-section of the fabricated ZnO perovskite.
Ceramics 07 00111 g004
Figure 5. (a,b) UV vis absorption characterizations for photoanodes, (c) FTIR spectra for photoanodes, (d) bandgap mechanism for photoanodes based on TiO2 (red) and ZnO (black).
Ceramics 07 00111 g005
Figure 6. (a) Electrochemical Impedance spectra for TiO2 and ZnO; (b) circuit diagram for EIS.
Ceramics 07 00111 g006
Figure 7. (a) EQE spectra for TiO2, ZnO photoanodes; (b) integral current density for TiO2 and ZnO photoanodes.
Ceramics 07 00111 g007
Figure 8. (a) PL spectra for TiO2/perovskite, ZnO/perovskite, and glass/perovskite nanofibers; (b) TRPL spectra for TiO2/perovskite and ZnO/perovskite nanofibers.
Ceramics 07 00111 g008
Figure 9. J-V characteristics for photoanodes based on TiO2 and ZnO.
Ceramics 07 00111 g009
Table 1. Conductivity, resistivity, sheet resistance, and sheet carrier mobility for both samples.
SrConductivity
1/Ohm-cm
Resistivity
Ohm-cm
Sheet Resistance
Ohm-sq
Sheet Carrier Mobility
TiO21.28 × 10−47.6 × 1034.3 × 1081.52 × 10−2
ZnO1.12 × 10−49.8 × 1035.3 × 1081.4 × 10−2
Table 2. EIS measurement values.
SrRrec/OhmRs/OhmRco/OhmCPE-T/F
TiO212.827.125.95.7 × 10−6
ZnO68.833.957.96.5 × 10−6
Table 3. PSCs J-V parameters based on TiO2 and ZnO nanofibers.
PSCVoc (V)Jsc (mA/cm2)Shunt Resistance
(Ohm)
Series Resistance
(Ohm)
FFη (%)
ZnO0.8217.7752,278.68205.4230.598.5
TiO20.8320.6853,469.8197.5530.6110.4
Table 4. Comparison of the performance of different nanofiber ETL-based PSCs.
PSCJsc (mA cm−2)Voc (mV)FFη (%)Ref
In-doped ZnO nanofibers23.010007016.10[39]
Al doped Cu-ZnO18.6108070.7714.18[38]
TiO2 fiber4.02106073.03.11[35]
Pristine-TiO2 NFs23.32101367.015.82[3]
Ag doped CuO NFs17.889053.88.7[40]
ZnO NFs18.167058.1 7.05 [41,42]
TiO2 NFs20.688300.6110.4Our work
ZnO NFs17.778200.598.5
Disclaimer/Publisher’s Note: The statements, opinions and data contained in all publications are solely those of the individual author(s) and contributor(s) and not of MDPI and/or the editor(s). MDPI and/or the editor(s) disclaim responsibility for any injury to people or property resulting from any ideas, methods, instructions or products referred to in the content.

