Article

Hydrogen Permeation Properties of Ternary Ni–BaCe0.9Y0.1O3–Ce0.9Gd0.1O2 Cermet Membranes

Graduate Schools of Science and Engineering, Ehime University, Matsuyama 890-8577, Japan
*
Author to whom correspondence should be addressed.
Ceramics 2024, 7(1), 385-400; https://doi.org/10.3390/ceramics7010024
Submission received: 29 January 2024 / Revised: 29 February 2024 / Accepted: 1 March 2024 / Published: 13 March 2024
(This article belongs to the Special Issue Advances in Ceramics, 2nd Edition)

Abstract

:
A ternary Ni–BaCe0.9Y0.1O3 (BCY)–Ce0.9Gd0.1O2 (GDC) cermet involving 40 vol% Ni was fabricated, and its hydrogen permeation characteristics were evaluated when the GDC volume fraction was varied from 0 to 30 vol%. The X-ray diffraction results of the cermet after sintering at 1400 °C revealed that GDC was dissolved in BCY when the GDC volume composition was 20 vol%. Regardless of the BCY and GDC volume fractions, the metal conductivity of the cermet was dominated by Ni. After the addition of only 1 vol% GDC, the particle sizes of Ni and BCY in the cermet significantly decreased, and the particle size decreased as the volume fraction of GDC increased. The hydrogen permeability increased with increasing temperature and for up to 10 vol% GDC, and a maximum permeation rate of 0.142 mL min−1 cm−2 was obtained at 700 °C. This value is comparable to or better than previously reported values for Ni-cermets under the same conditions. The amount of hydrogen permeation decreased above 10 vol% GDC. This study demonstrated that Ni-BCY-GDC cermet is a material that has both high hydrogen permeability and CO2 resistance.

1. Introduction

From the perspective of global warming, carbon neutrality has attracted broad interest around the world, stimulating a shift from conventional fossil fuels to alternative clean energy sources that do not emit greenhouse gases. Among them, hydrogen energy is attracting attention because it does not emit CO2 during power generation. Water electrolysis using renewable energy is expected to be the cleanest energy production technique because it does not generate CO2, even in the hydrogen production process. However, the cost of renewable energy itself is still high, and depending on the type, the amount of supply depends on weather conditions. Fossil fuel reforming, described by the reaction Schemes (1) and (2), is currently the mainstream method of producing hydrogen [1]. Although this process contains CO2 as a byproduct, it is called “gray hydrogen”. The produced CO2 can be separated and recovered using an appropriate method, such as carbon dioxide capture, utilization, and storage, and it becomes “blue hydrogen”.
CH4 + H2O → CO + 3H2
CO + H2O → CO2 + H2
These reaction schemes indicate that approximately 25% of CO2 is present in the produced gas. According to the International Organization for Standardization (ISO) of Hydrogen Fuel Quality (ISO 14687), more than 99.97% of hydrogen is required for PEM-type fuel cells installed in fuel-cell vehicles, and especially CO must be removed to an extremely low concentration to avoid platinum poisoning [2,3].
Among the dense membranes, Pd alloys are practically used in the refining process for producing high-purity hydrogen [4,5,6,7,8,9,10]. H2 separation in metal membranes relies on the ability to diffuse only H2 gas and restrict the flow of other gases, as well as the ability to dissociate and recombine hydrogen atoms at the membrane surface. In addition, metal membranes effectively permeate hydrogen at temperatures between 300 °C and 600 °C, making it possible to obtain extremely high-purity H2. According to the U.S. Department of Energy (DOE), a hydrogen flux of 124 mL min−1 cm−2 was achieved using a Pd–Cu alloy foil at 400 °C [11]. However, Pd is expensive and lacks stability because of hydrogen embrittlement peculiar to metals.
Proton–electron mixed conductors exhibit ambipolar conduction by imparting electronic conductivity to proton-conducting ceramics. Perovskite-type proton-conducting oxides were discovered by Iwahara et al. [12,13,14] and have since been applied to hydrogen technologies, such as fuel production [15,16] and fuel cells [17,18]. Among the perovskite proton-conducting oxides, BaCeO3-based oxides such as BaCe0.9Y0.1O3 (BCY) exhibit relatively high proton conductivity [19,20]. The conductivity of BCY is approximately ten to the power of −1.7 S cm−1, even at 600 °C [21]. Guan et al. reported the mixed ionic–electronic conducting character of BCY and concluded that proton conduction dominates in hydrogen–water vapor atmosphere in the temperature range between 500 °C and 800 °C. By adding a metal phase to BCY, such as Ni–BCY, mixed proton–electronic conduction can be achieved. The hydrogen permeation flux with ambipolar conduction of electrons and protons can be theoretically described using Equation (3) [22]:
J H 2 = R T 4 F 2 L σ H + · σ e σ T l n P H 2 , f e e d P H 2 , s w e e p
where R, T, F, L, σ H + · σ e , and σ T are the gas constant, temperature, Faraday constant, pellet thickness, proton and electron conductivities, and total conductivity, respectively. P H 2 , f e e d and P H 2 , s w e e p are the hydrogen partial pressures at the feed and sweep gas sides, respectively. Hydrogen permeation has been studied using Ni–BCY cermets [22,23,24]. Kim et al. [22] obtained a good hydrogen flux of 0.76 mL min1 cm2 under 100% H2 at 800 °C using a 40 vol% Ni–BaCe0.9Y0.1O3–δ membrane with a thickness of 0.23 mm. A drawback of BCY is its chemical instability, especially in the CO2 atmosphere, increasing the electric resistance at grain boundaries owing to BaCO3 [25]. Partially replacing Ce with Zr, e.x., BaCe0.8Zr0.1Y0.1O3–δ (BCZY) are known to enhance CO2 resistance, although they are not as good as BCY in terms of proton conductivity [18,26]. Zuo et al. [27] reported a hydrogen permeability of 40 vol% Ni–BCZY membranes with a thickness of 0.266 mm, and among the membranes they tested, Ni–BaCe0.7Zr0.1Y0.2O3−δ exhibited the highest value of 0.805 mL min1 cm2 at 900 °C under 100% H2. They also demonstrated the stable performance of the membrane under wet gas containing 30% CO2. Previously, we found that in a hydrogen permeable membrane comprising a mixed phase of BCY and Ce0.9Gd0.1O2 (GDC), the addition of GDC significantly improved the CO2 resistance of BCY [28]. Since GDC exhibits electron conduction as Gd4+ is reduced to Gd3+ in a reducing atmosphere, GDC–BCY functions as a proton-electron mixed conductive film in a reducing atmosphere. We investigated the hydrogen permeability of the dual–phase membrane containing equal weights of BCY and GDC with a thickness of 1.1 mm and obtained a permeation flow rate of 0.30 mL min1 cm2 at 800 °C under 100% H2 [28]. Since the electronic conductivity of GDC in 100% H2 is at the level of 10−1 S cm−1 even at 900 °C [28], adding Ni into the BCY–GDC is expected to improve ambipolar conductivity and CO2 resistance of the membrane. In our previous result, the addition of 50 vol% GDC to 40 vol% Ni–BCY significantly suppressed the growth of Ni particles during the sintering process at 1450 °C and enhanced the electronic conductivity of Ni [29]. Since the proton conductivity of GDC is negligibly low compared with that of BCY [30], the excessive addition of GDC may reduce the transference number of protons in the ceramic phase. In this study, ternary Ni–BCY–GDC cermets containing 40 vol% Ni were fabricated, and their hydrogen permeation characteristics were evaluated by varying the GDC volume fraction from 0 to 30 vol%.

2. Experimental Procedure

2.1. Sample Powder Synthesis

The proton conductor, BaCe0.8Y0.2O3−δ (BCY), used in this study was synthesized using a solid-state reaction method starting from the stoichiometric amounts of BaCO3 (>99%), CeO2 (>99%), and Y2O3 (>99%). All starting materials were purchased from Kojundo Chemical Laboratory CO., LTD., Saitama, Japan and used without further purification. Consequently, the powders were mixed and milled using zirconia balls and dried for 3 h. Then, the mixed powder was calcined at 1000 °C for 12 h. After calcination, they were compacted using uniaxial pressing and fired at 1200 °C for 10 h. The prepared BCY was ball-milled in ethanol for 24 h. The obtained powder was identified using X-ray diffraction (XRD) with Cu Kα X-rays (X’Pert Pro MPD, Malvern PANalytical, Almelo, Holland). XRD peak position of the samples was compared without the Rietveld refinement. Finally, the obtained powders were compacted again into pellets using uniaxial pressing and sintered at 1400 °C for 5 h.

2.2. Preparation of Ni–BCY–GDC Cermets

The powders of NiO (d = 0.5 μm; Sumitomo Metal Mining Co., Ltd., Tokyo, Japan), BCY, and GDC (d = 0.1 µm; AGC Seimichemical, CO. LTD. Chigasaki, Japan) were weighed with volume fractions of Ni (metal form equivalent):BCY:GDC = 40:30:30, 40:40:20, 40:50:10, 40:55:5, 40:59:1 and 40:60:0. Hereafter, these samples are referred to as x = 30, 20, 10, 5, 1 and 0, respectively, after the volume fraction of GDC. The powders were first ball-milled in ethanol for 8 h and then dried. The mixed powders were pressed into disks at 5 MPa for 30 s using uniaxial pressing. The obtained disks were sintered at 1400 °C for 5 h in air. To reduce NiO into Ni, the calcinated disks were heated at 700 °C for 1 h under H2 flow at a rate of 100 mL min−1. Thereafter, the surface and cross-sectional morphology of the cermets were observed using scanning electron microscopy with energy-dispersive X-ray spectroscopy (SEM-EDS: JSM-6510LA, JEOL Ltd., Tokyo, Japan), and the densities of the cermets were evaluated using the Archimedes method in water.

2.3. Conductivity Measurements

The surfaces of the disks were polished using abrasive paper (#1000), and Pt electrodes were printed on both sides of the disk surfaces. Pt wires were then attached to the electrodes. To measure the electrical conductivities of the cermets using the four-terminal DC method, a sintered cermet pellet was cut into a rectangular body, and pairs of current and voltage probes were attached using Pt paste on both end faces and the surface. The Pt electrodes were fired at 700 °C for 1 h. The test cells were placed in a tubular electric furnace, and the conductivity was measured under 4%H2/N2 flow after passing water at a rate of 100 mL min−1. The current flow was regulated using an electronic load device (, FK-160L2Z, Takasago LTD., Kawasaki, Japan), and the potential was measured with a digital electrometer (R8240, ADVANTEST, Tokyo, Japan).

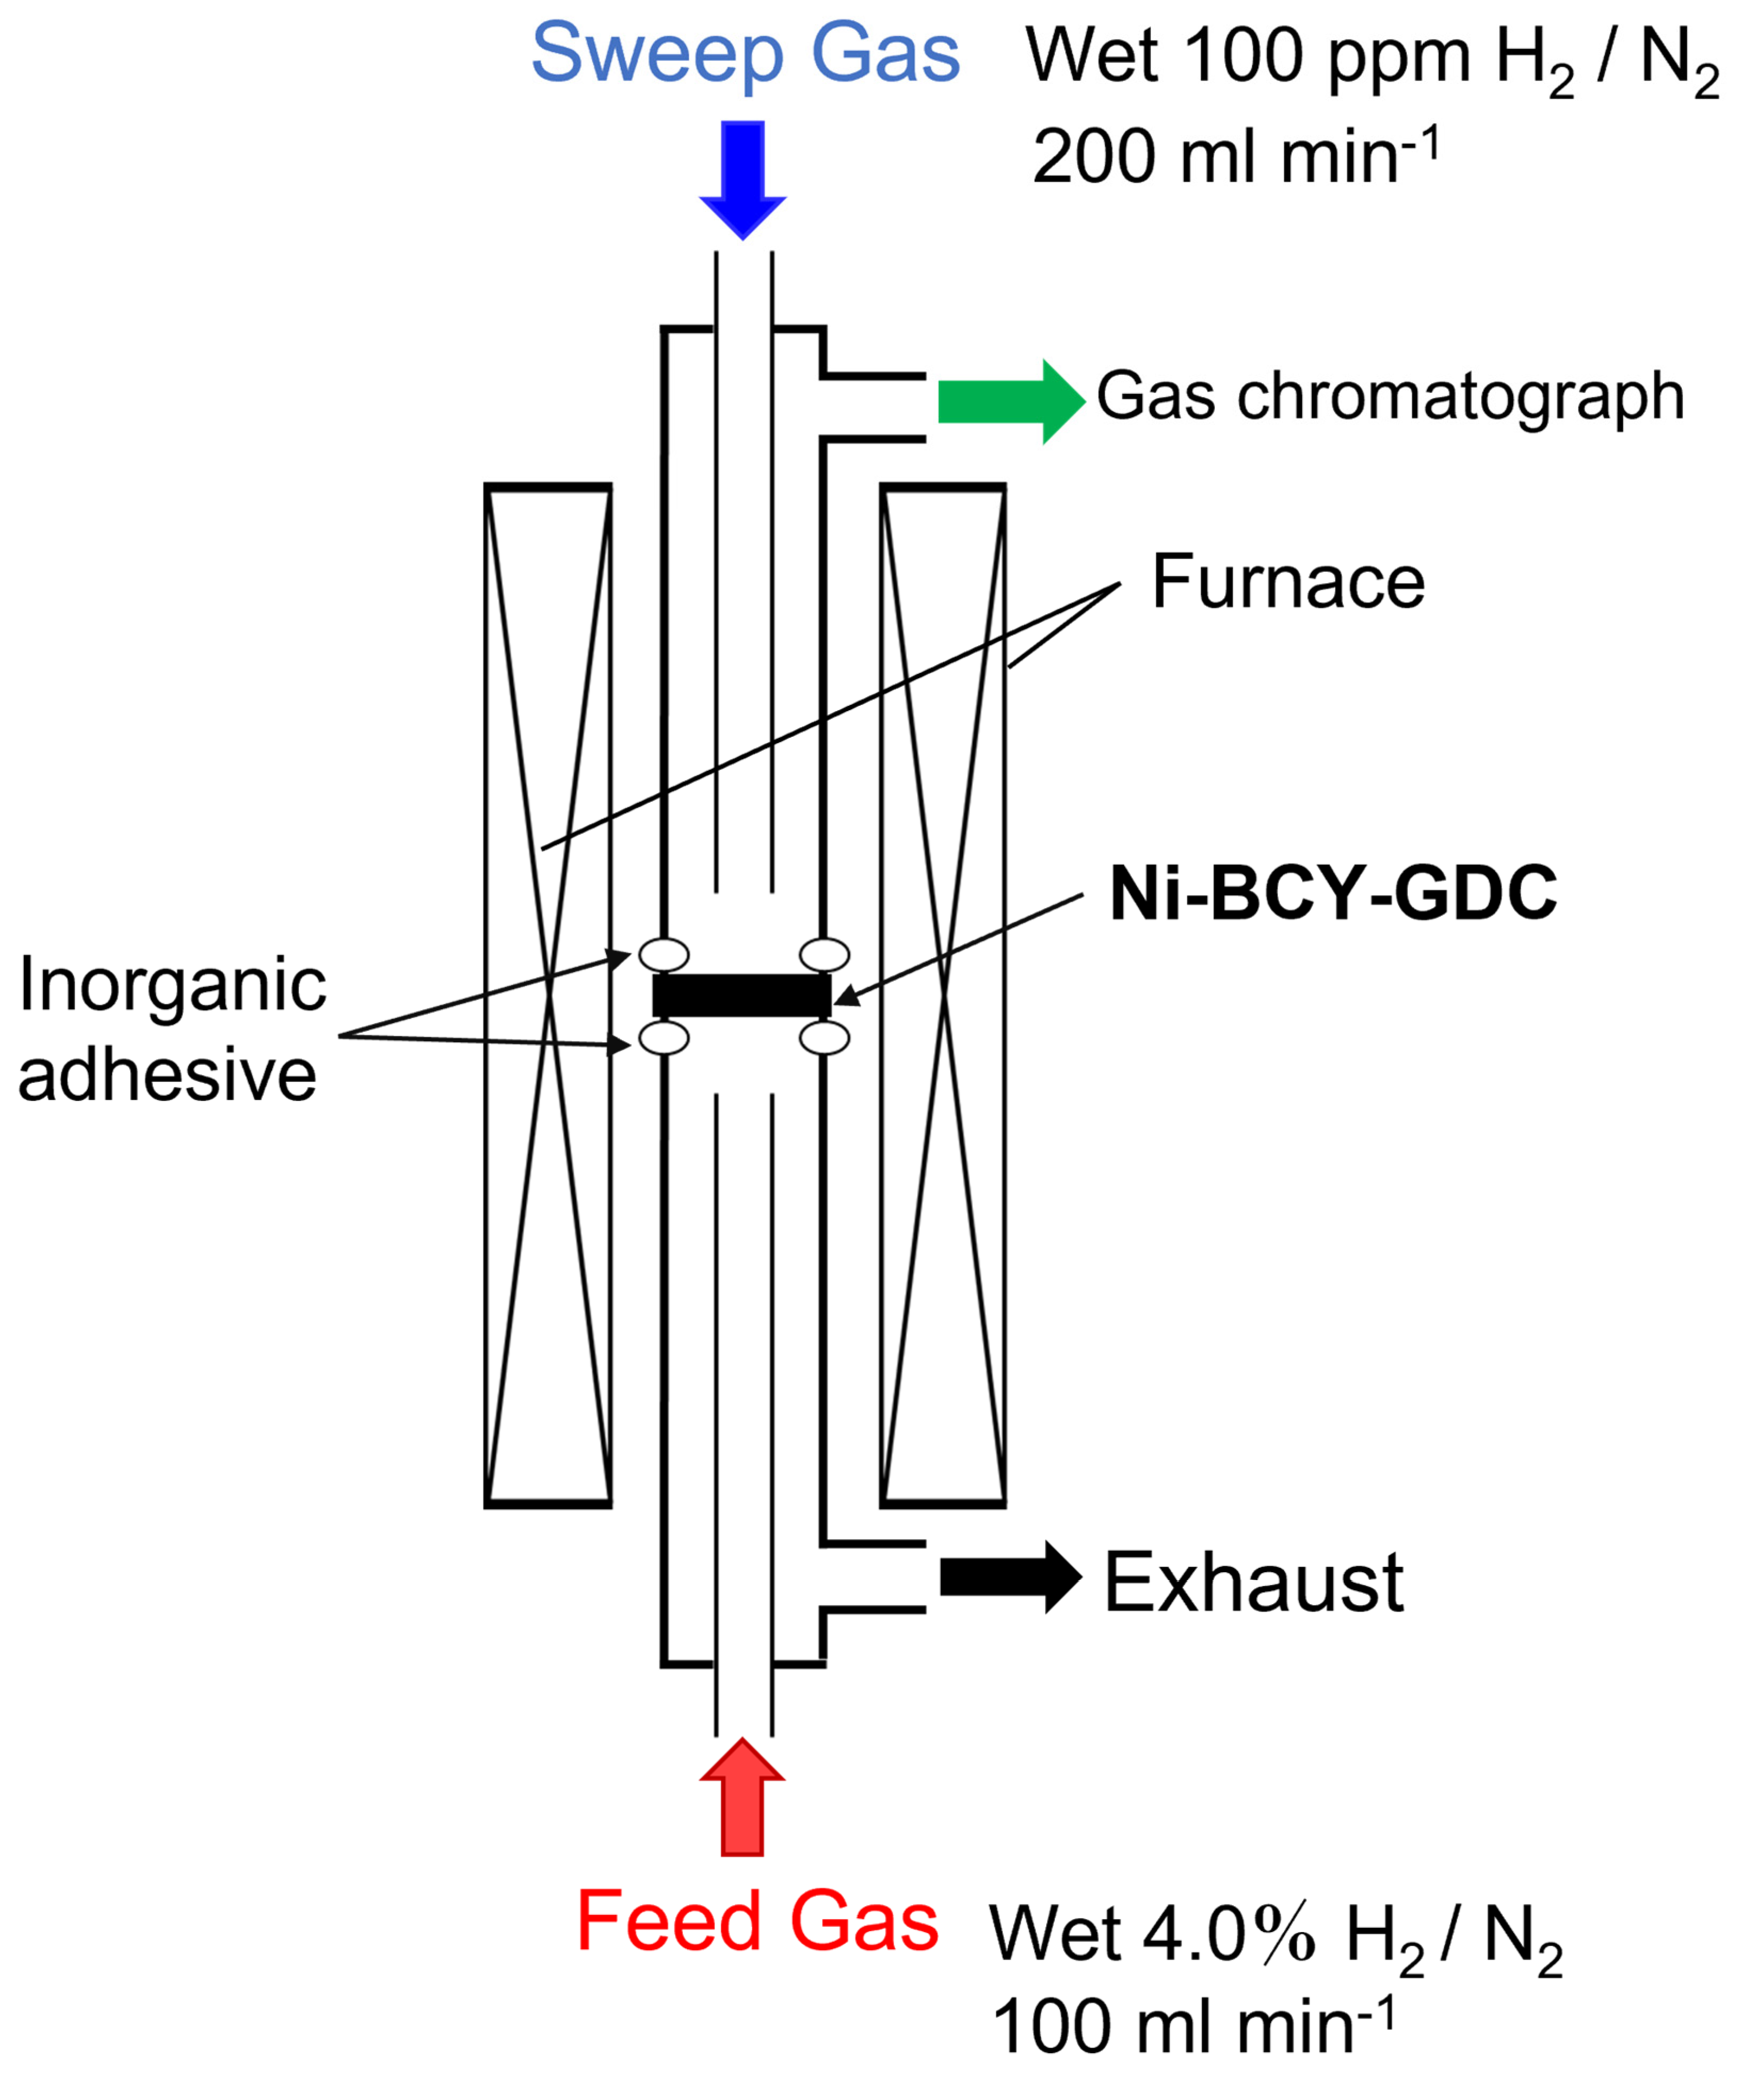
2.4. Fabrication and Evaluation of Hydrogen Permeation Cells

The surfaces of the cermets were polished using abrasive paper (#1000) for hydrogen permeation tests, and their thicknesses were adjusted to 0.8 ± 0.05 mm. Subsequently, they were installed in a hydrogen permeation test apparatus, as shown in Figure 1. The test cells were mounted on the top of the alumina tube and sealed using a glass sealer (GM31107, Schott AG, Mainz, Germany). Humidified 4% H2/N2 on the feed side and humidified 100 ppm H2/N2 on the sweep side were introduced at a rate of 100 mL min−1. The hydrogen permeation flux was evaluated in the temperature range of 500–700 °C using a gas chromatograph with a TCD detector (GC-8APT; Shimadzu Corporation, Kyoto, Japan).

3. Results and Discussion

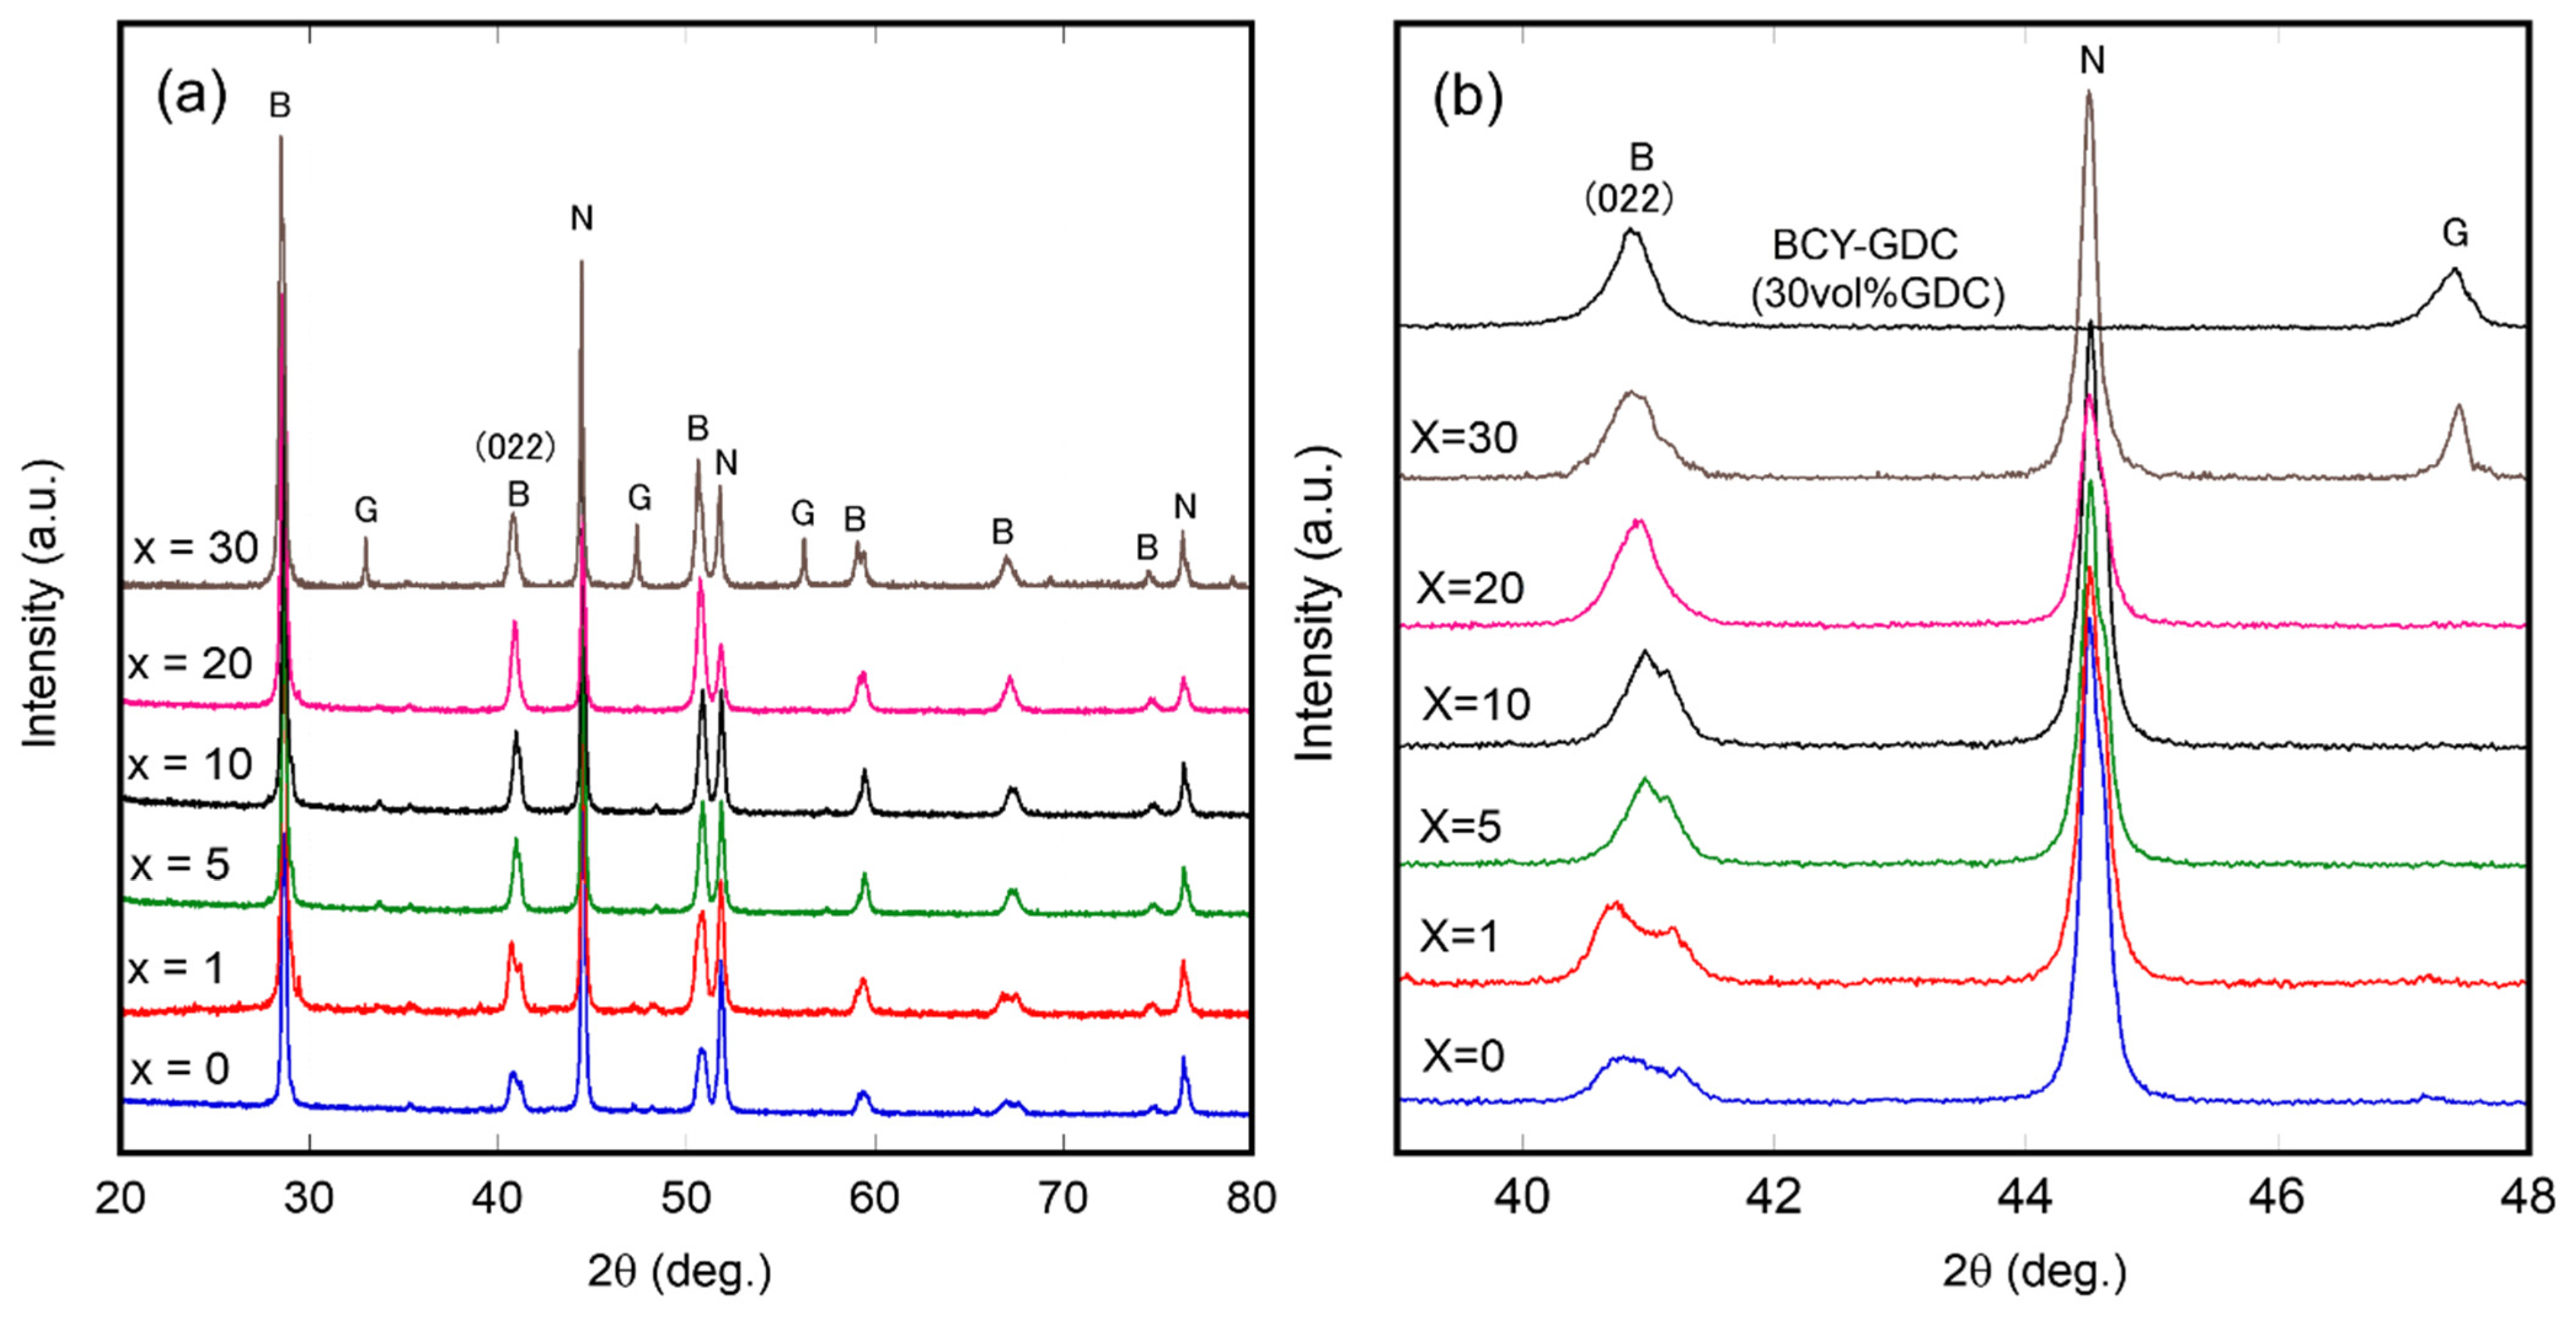
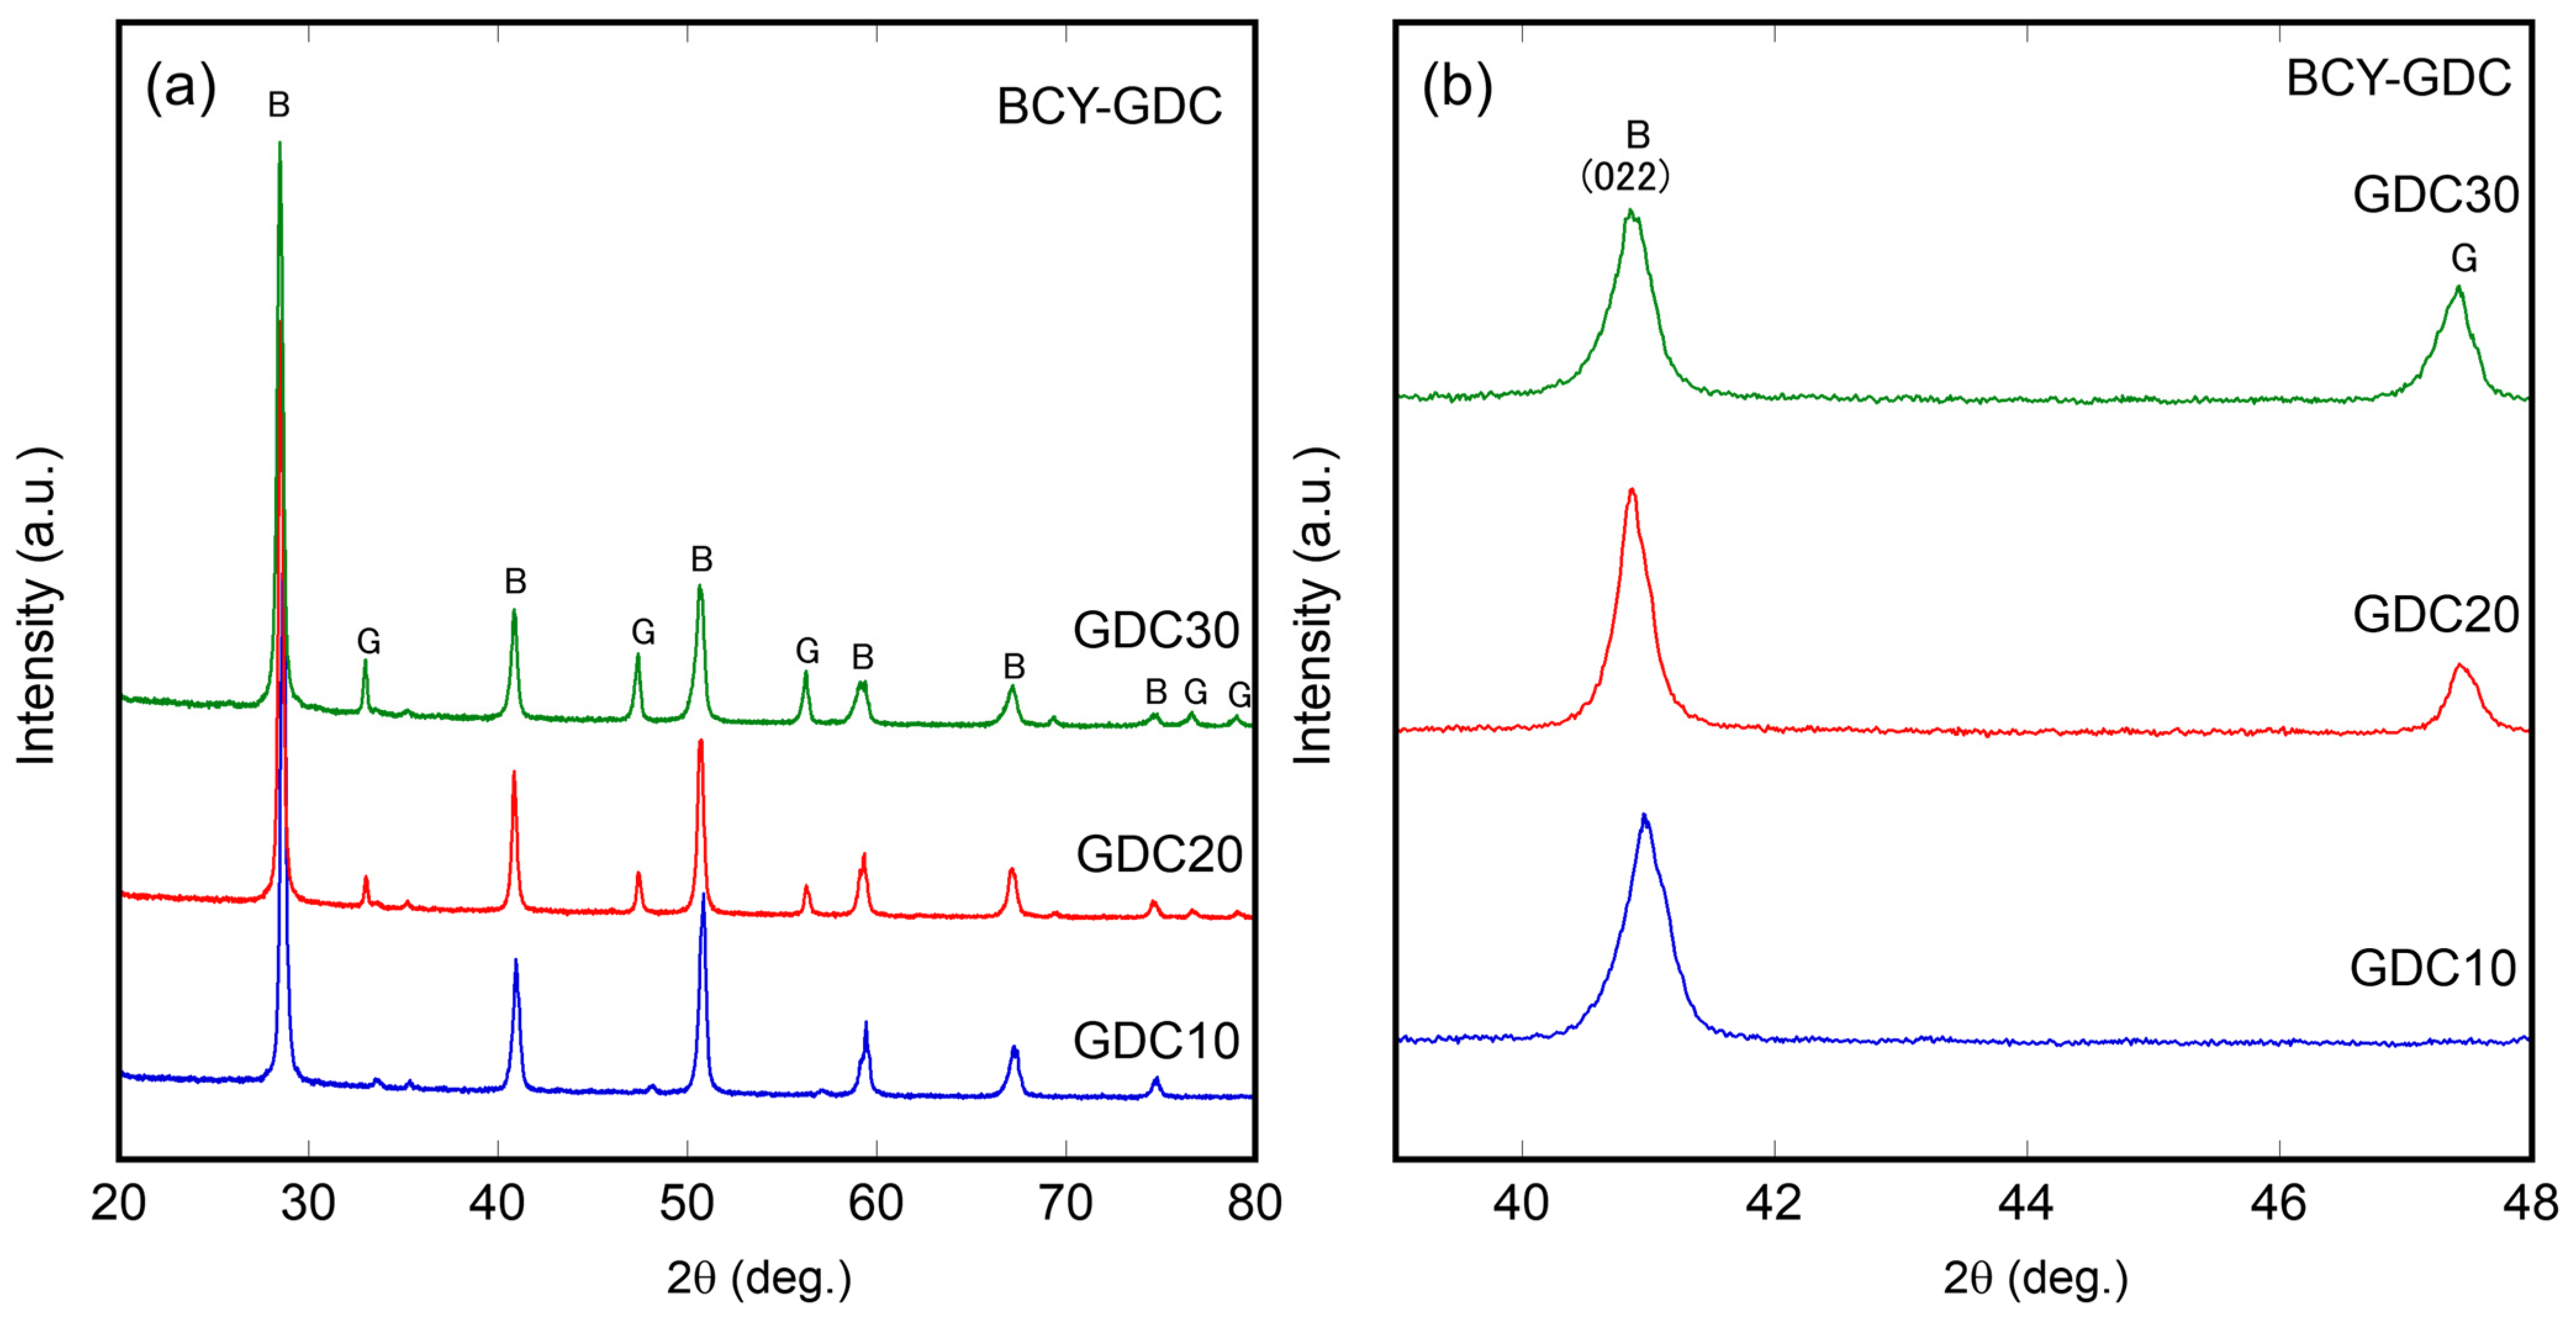
3.1. Characterization of Ni–BCY–GDC Composites

Figure 2a shows the XRD of the surface of a sintered body of BCY-GDC containing 10, 20, and 30 vol% of GDC. The GDC peak was observed at 20 vol%, and an increase in peak intensity was observed at 30 vol%. The GDC phase is invisible at 10 vol%, suggesting that GDC reacts with BCY to yield a solid solution. Figure 2b is a magnified image of the XRD patterns from 39 to 48°. Peak positions of the XRD patterns were compared, and no significant peak shift was observed for the (022) peak of the BCY phase with increasing GDC volume fraction, suggesting that 10 vol% is a limit of GDC in BCY.
Figure 3 shows the XRD diffraction patterns of the Ni–BCY–GDC cermet disks sintered at 1400 °C, followed by hydrogen reduction at 700 °C. Similar patterns were obtained for all Ni–BCY–GDC cermets. Notably, the diffraction pattern of GDC was not observed up to the 20 vol% GDC-containing sample, and the XRD peaks attributable to GDC appeared at 30 vol%. The melting point of Gd2O3 at standard pressure is approximately 1900 °C; hence, the boiling point is even higher; therefore, GDC did not evaporate during the sintering process at 1400 °C. One possibility is that the GDC phase entirely or partially dissolved into BCY to form a single phase upon the reaction between BCY and GDC. Lin et al. [31] investigated the phase formation of the BCY–GDC composite and reported that only the perovskite phase was observed after sintering at 1550 °C, indicating that BCY–GDC formed a solid solution, i.e., BaCe0.8−xGdxY0.2O3−δ (BCGY). Figure 3b shows a magnified image of the (022) diffraction peaks of the BCY phase. The peak asymmetrically split to x = 1, and they merge and become intense with an increase in the GDC content. We previously prepared the BCY–GDC dual-phase oxide for a hydrogen permeation membrane containing a 50:50 volume ratio [28], and similar behavior was observed; the XRD peak of the BCY pellet sintered at 1450 °C was sharpened upon GDC addition. Lin et al. [31] also reported a change in the lattice constants of BCY with GDC addition, and the a-axis and b-axis constants became closer. Therefore, the sharpening of the XRD peak of BCY upon the addition of GDC might be due to the improvement in the symmetry of the crystal lattice by the solid solution of GDC in BCY. Dubai et al. [32] prepared BaCe0.7Gd0.1Y0.2O2.9 thin films using spray pyrolysis and confirmed the XRD peak shift to a lower angle compared with that of BCY. The (022) diffraction peaks in Figure 3 also shifted to a lower angle at x = 20 and 30. The ionic radii of the six-coordinated trivalent ions of Ce4+, Y3+, and Gd3+ reported by Shannon et al. [33] are 0.87, 0.938, and 0.900 nm, respectively. The XRD peak shift to a lower angle indicates the volume shrinkage of the BCY crystal lattice upon substitution with a larger ion and is attributable to the partial replacement of Ce4+ with Gd3+. No significant peak shift was observed below x = 10. Further, Ni has been shown to dissolve in BCY in small amounts to form BaCe0.9−xY0.1NixO3−δ (BCYNi) [34]. Since the ionic radius of six-coordinated Ni2+ is 0.69 nm [33], the substitution of Ni2+ to the Ce4+ site is accompanied by a large volume contraction, causing the XRD peak shift to a higher angle. The magnified image in Figure 3 also shows the peaks of BCY–GDC sintered at 1400 °C. Compared with Ni–BCY–GDC, no significant peak shift was observed. Therefore, even if there was a solid solution of Ni2+ in BCY, it did not affect the crystal structure.
The relative densities of BCY and BCY-GDC (x = 50) pellets sintered at 1400 °C and were measured in water using the Archimedes method, which were 92.3 and 92.5%, respectively. When NiO is added to the pellets, the relative density increases to 97.8 and 98.7%, respectively. This is the effect of NiO on the sintering of BCY and BCY-GDC. It is well-accepted that NiO acts as a sintering aid in proton-conducting oxides [35]. The relative density decreased to 89.6 and 88.4%, respectively, after the reduction in NiO to Ni-BCY and Ni-BCY-GDC. This decrease in the relative density is probably due to oxygen detachment from NiO during the reduction process. Since the relative density is almost unchanged depending on whether GDC is added or not, it seems that there is almost no effect on the degree of sintering.

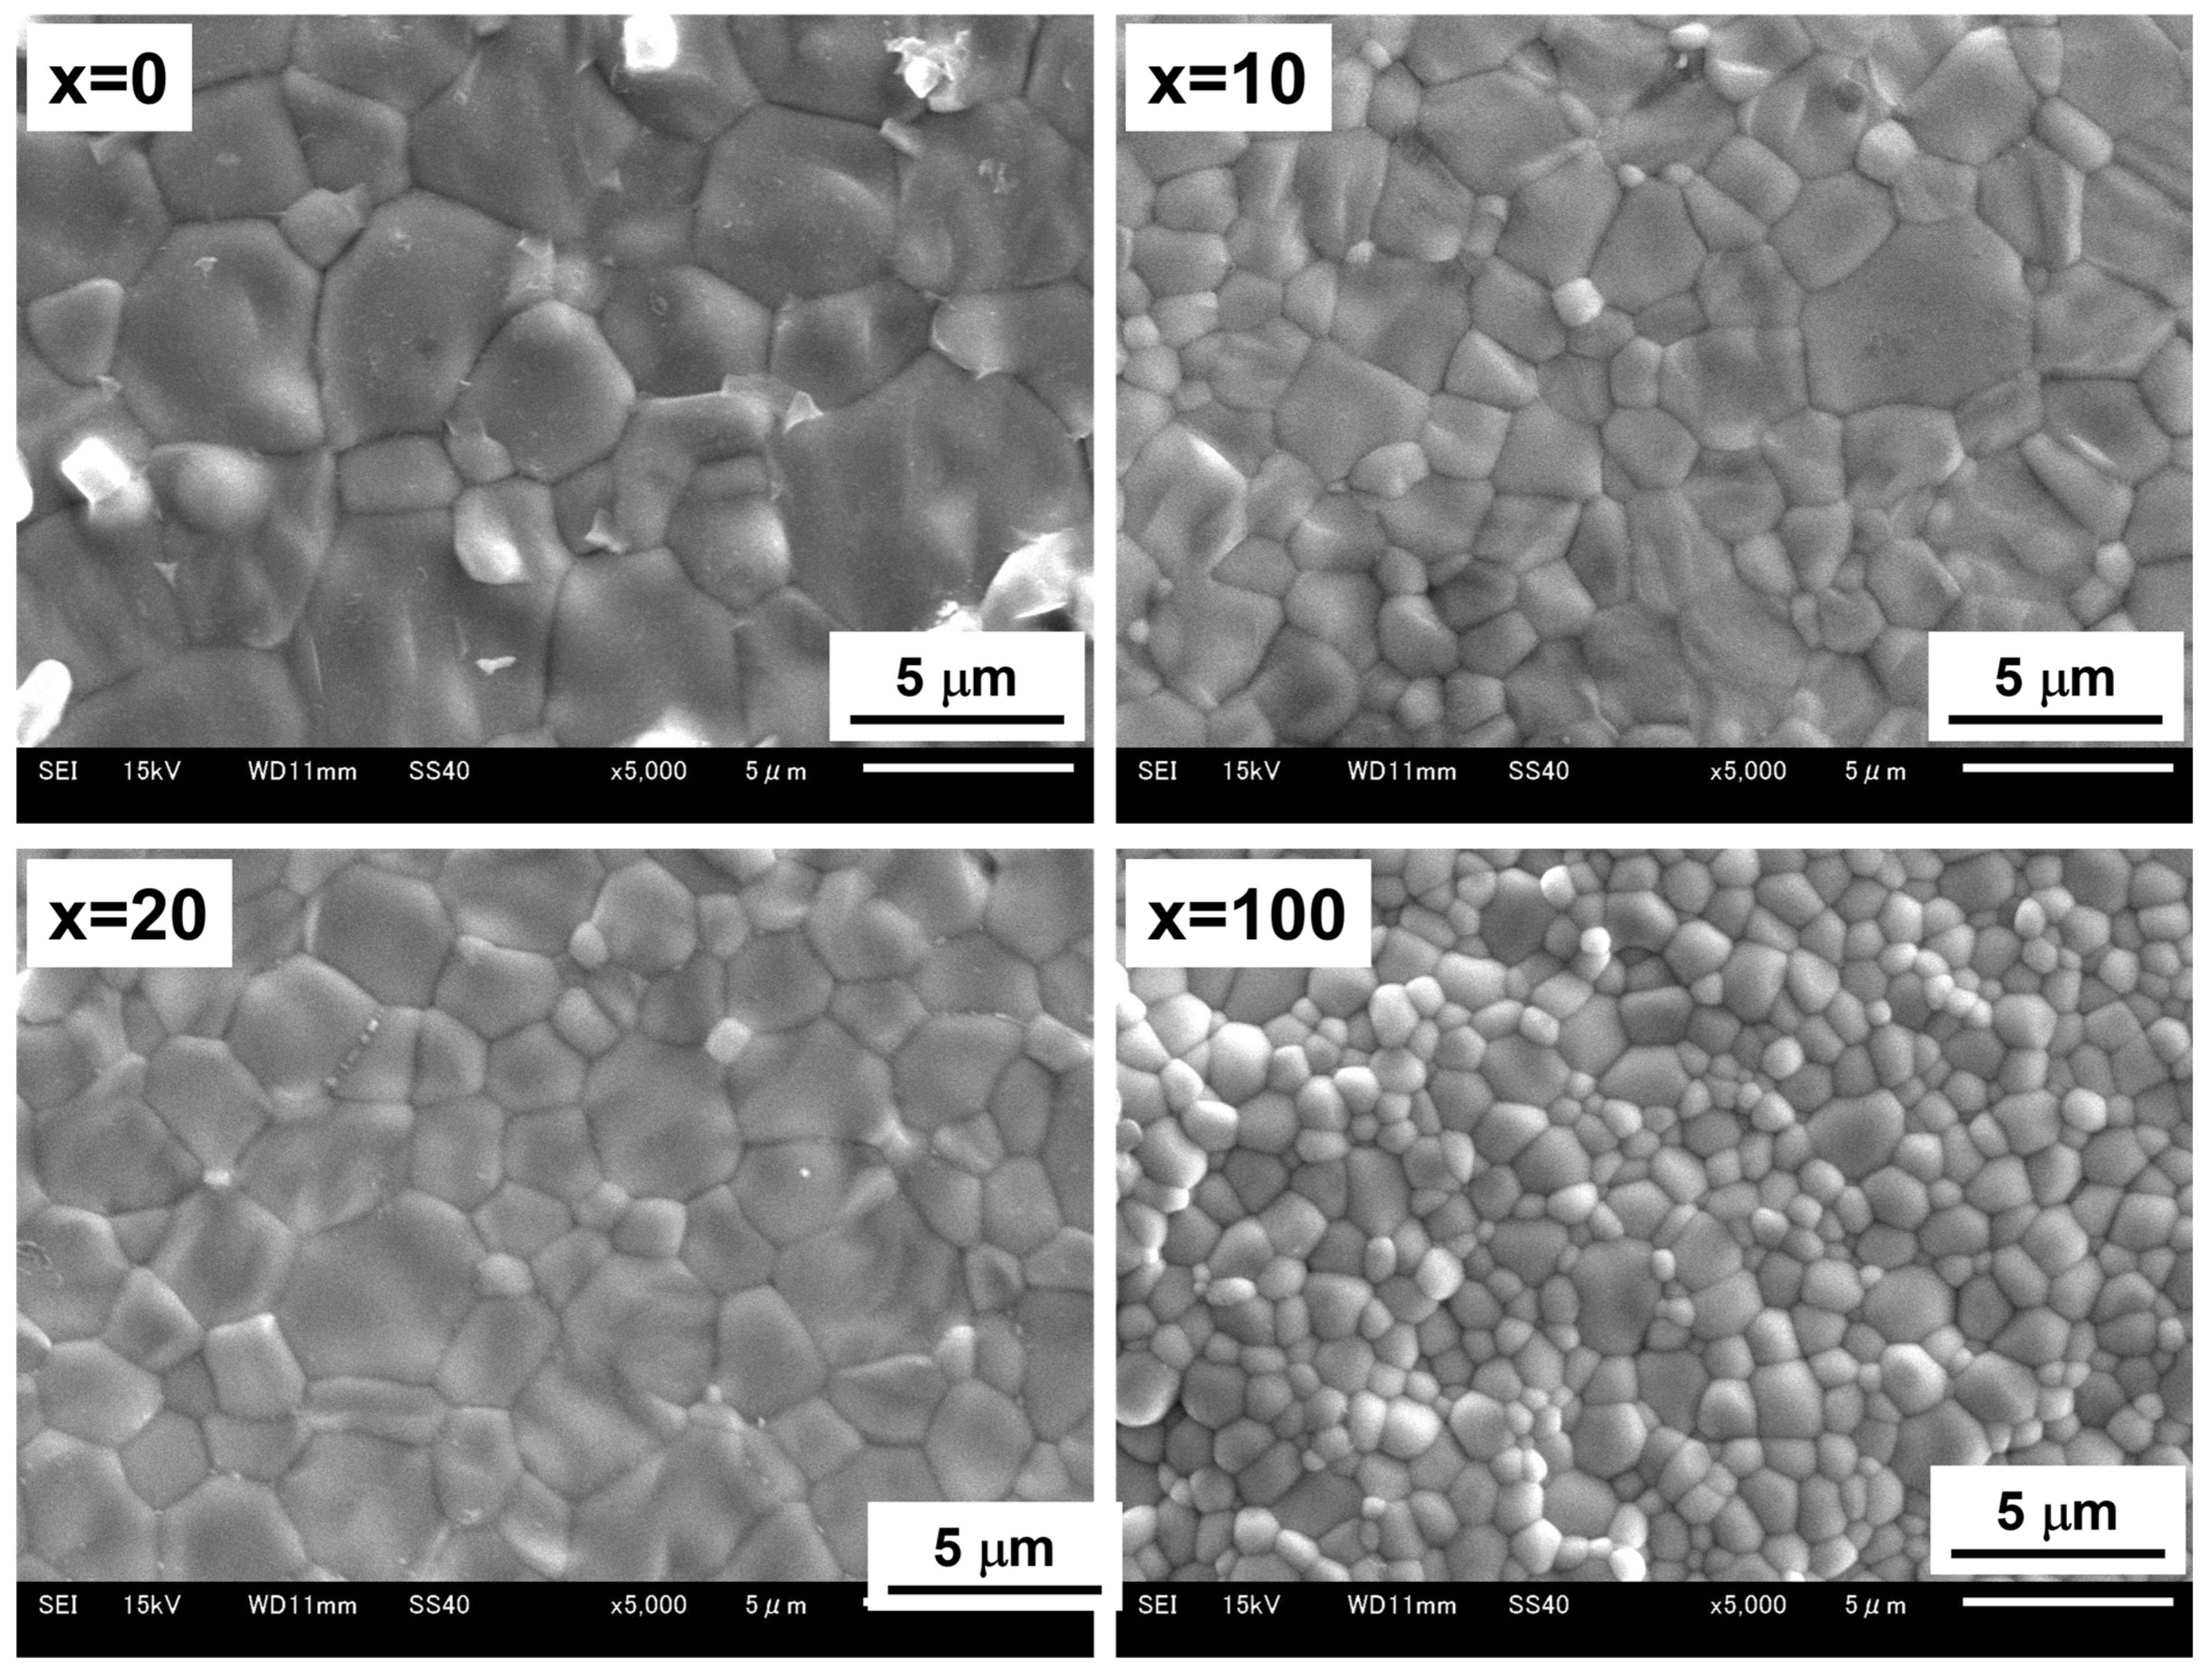
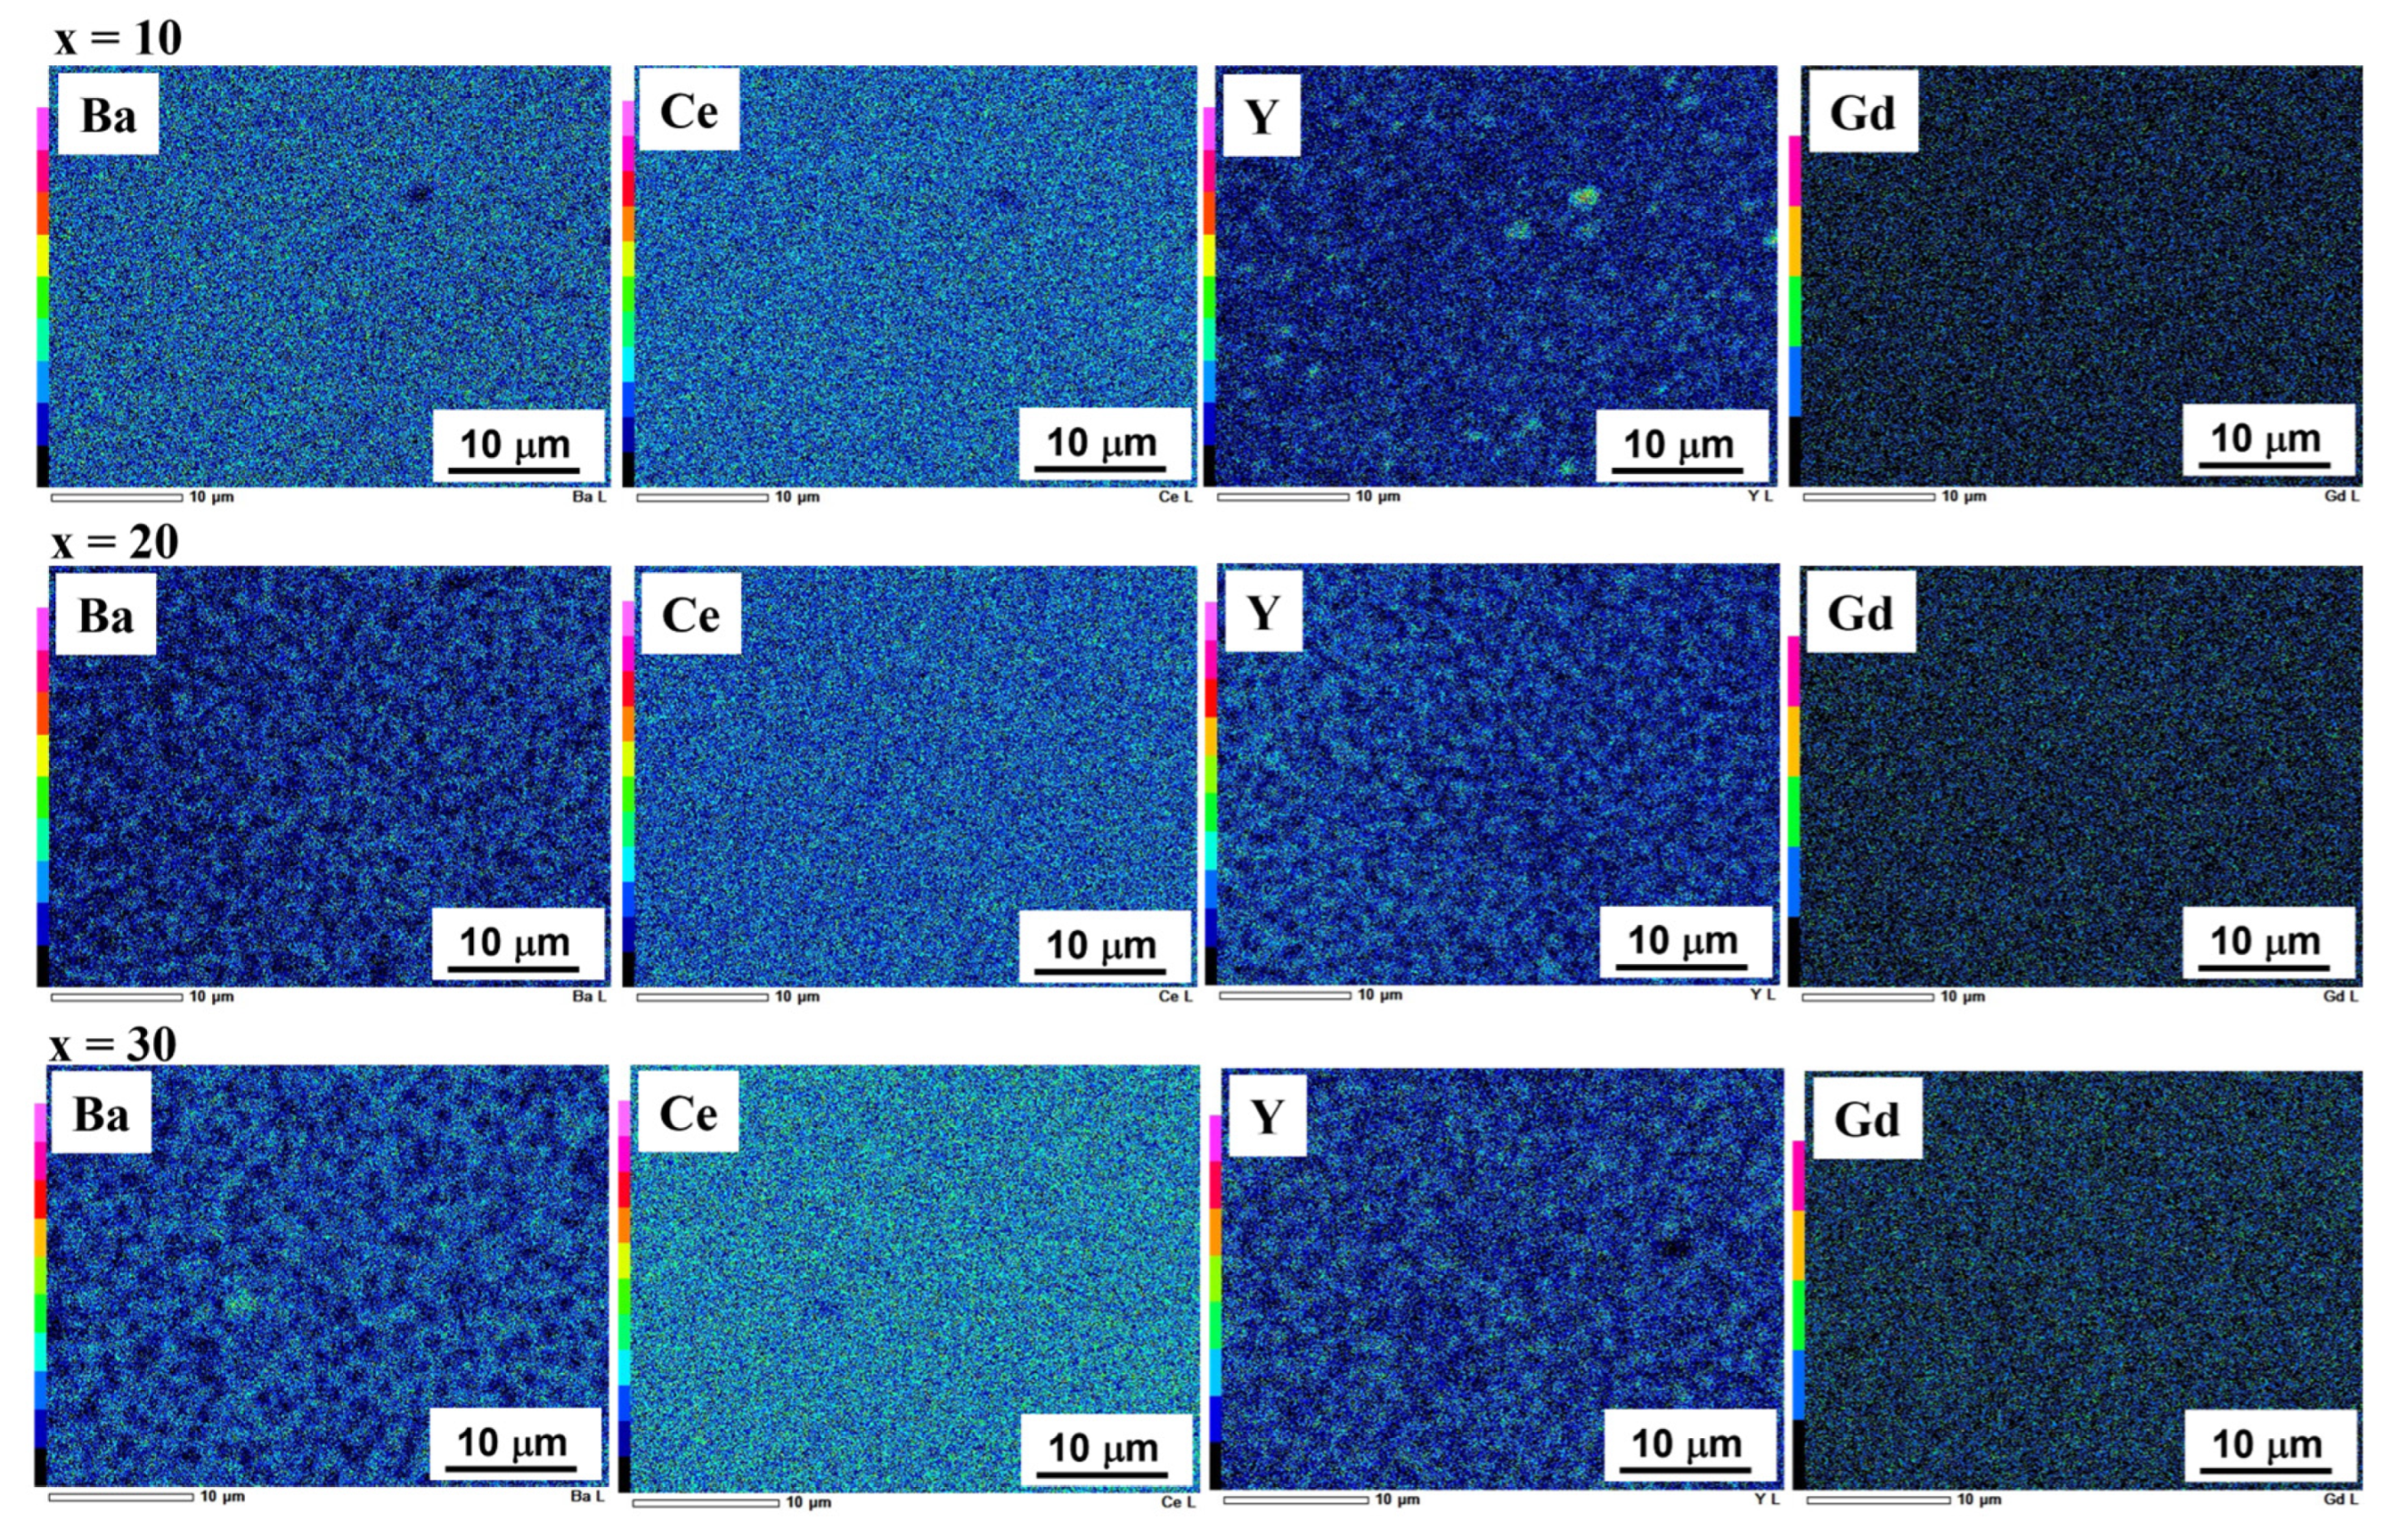
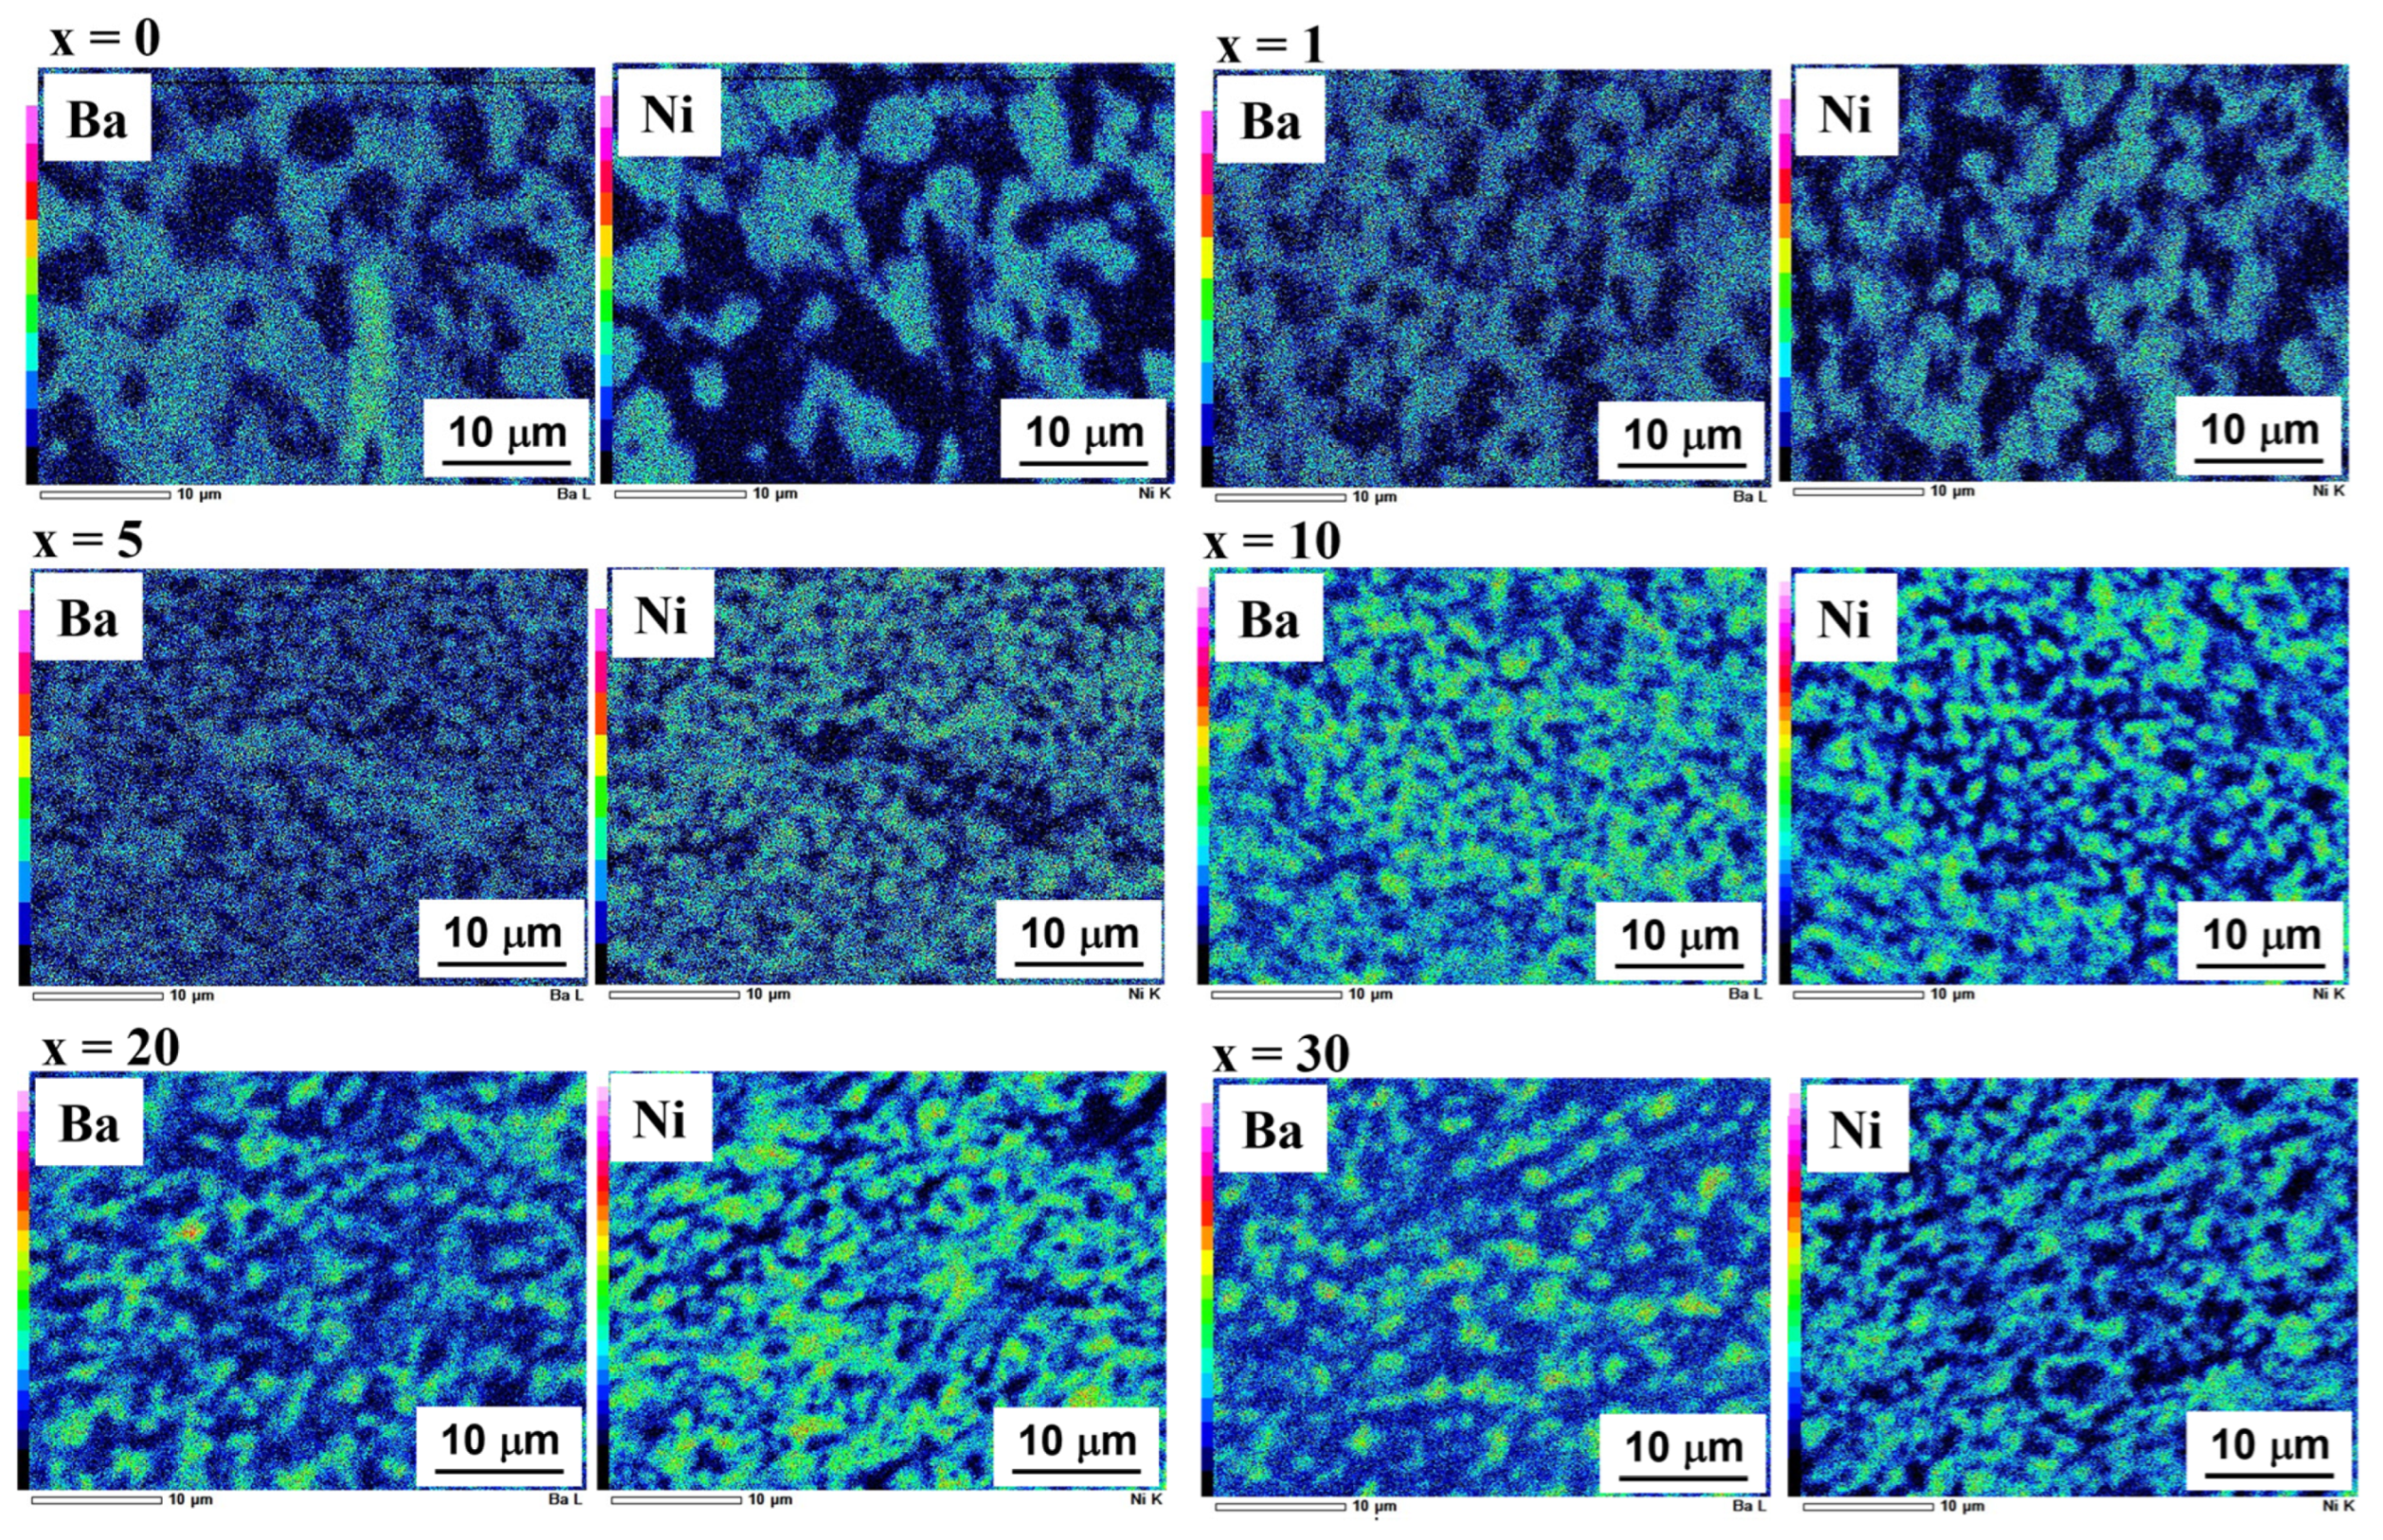
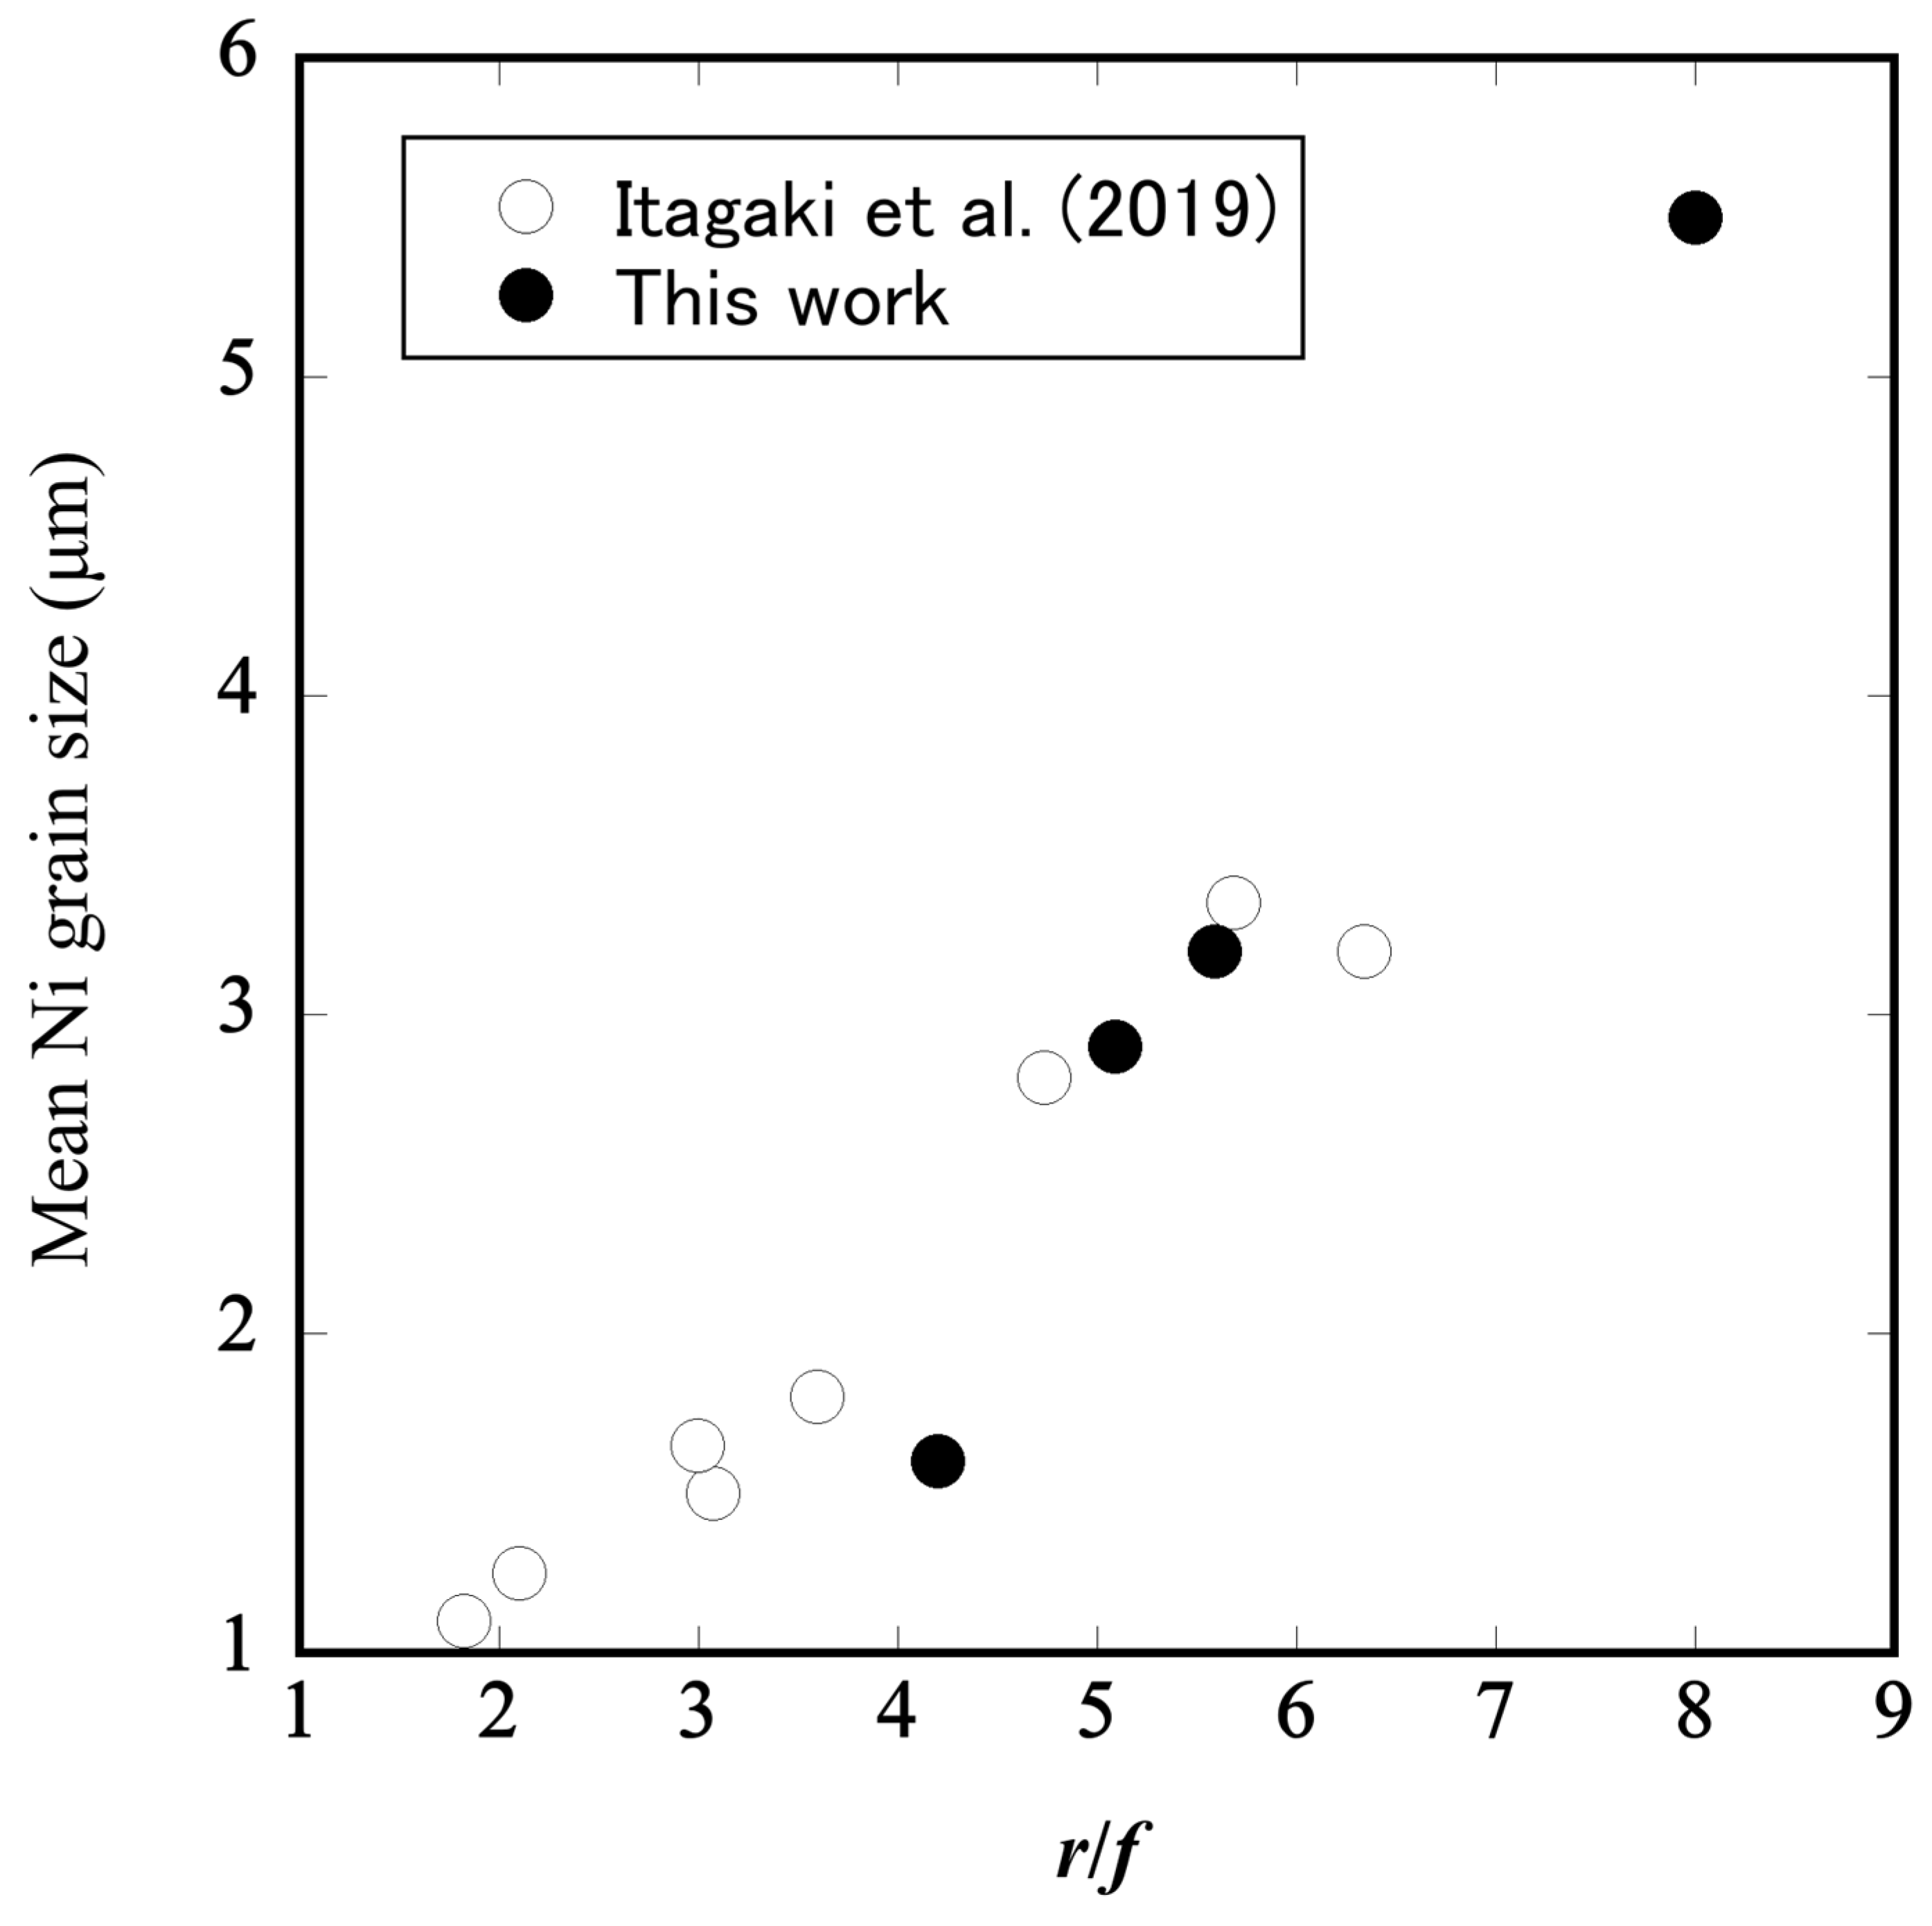
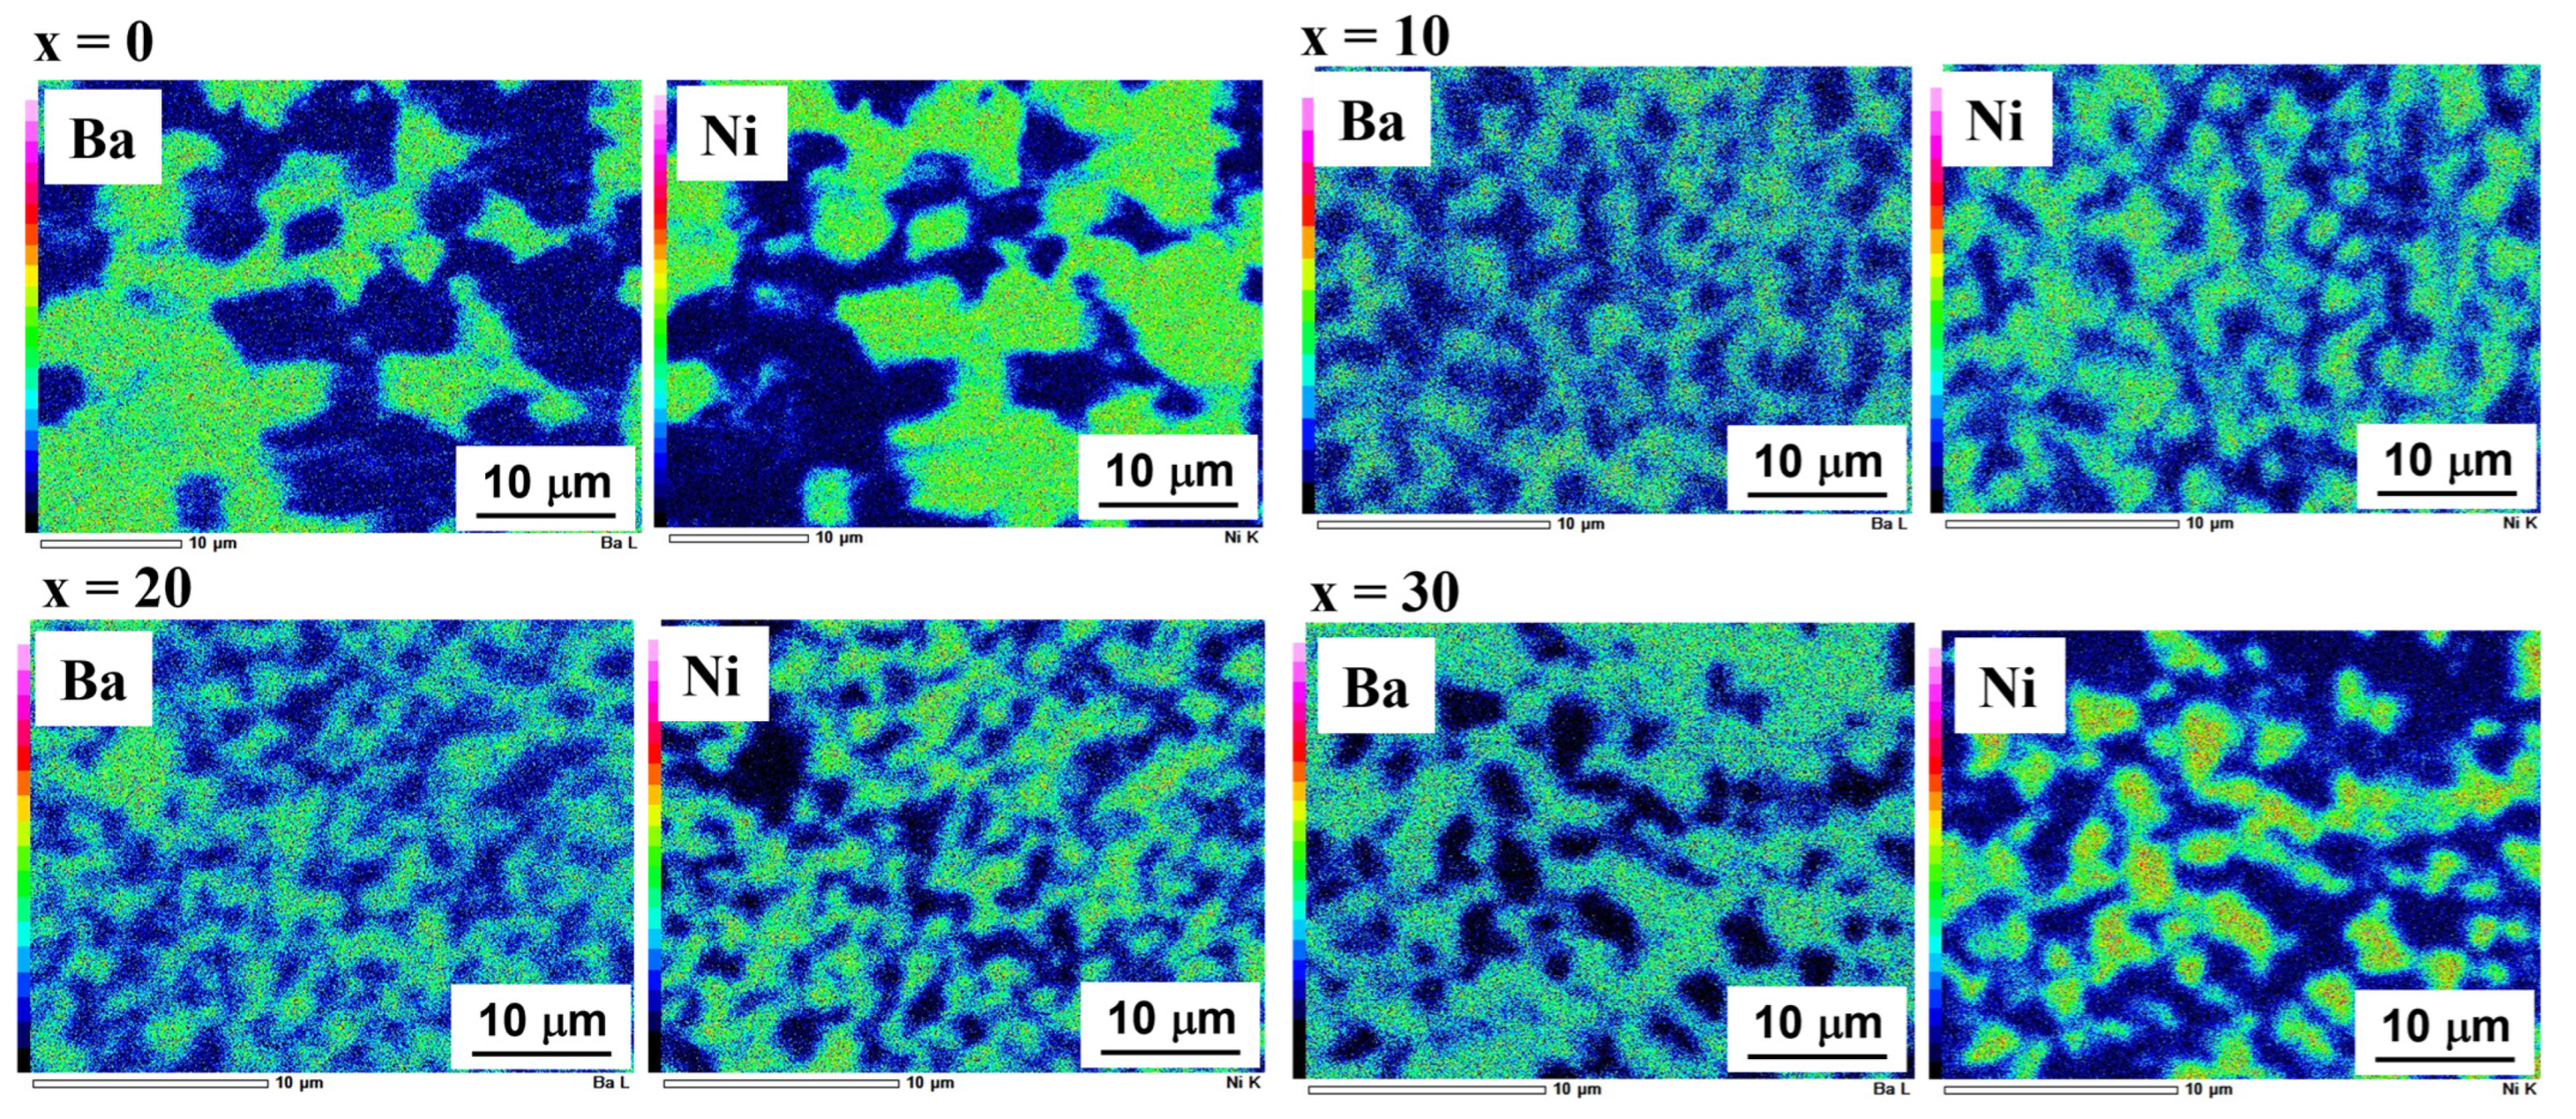
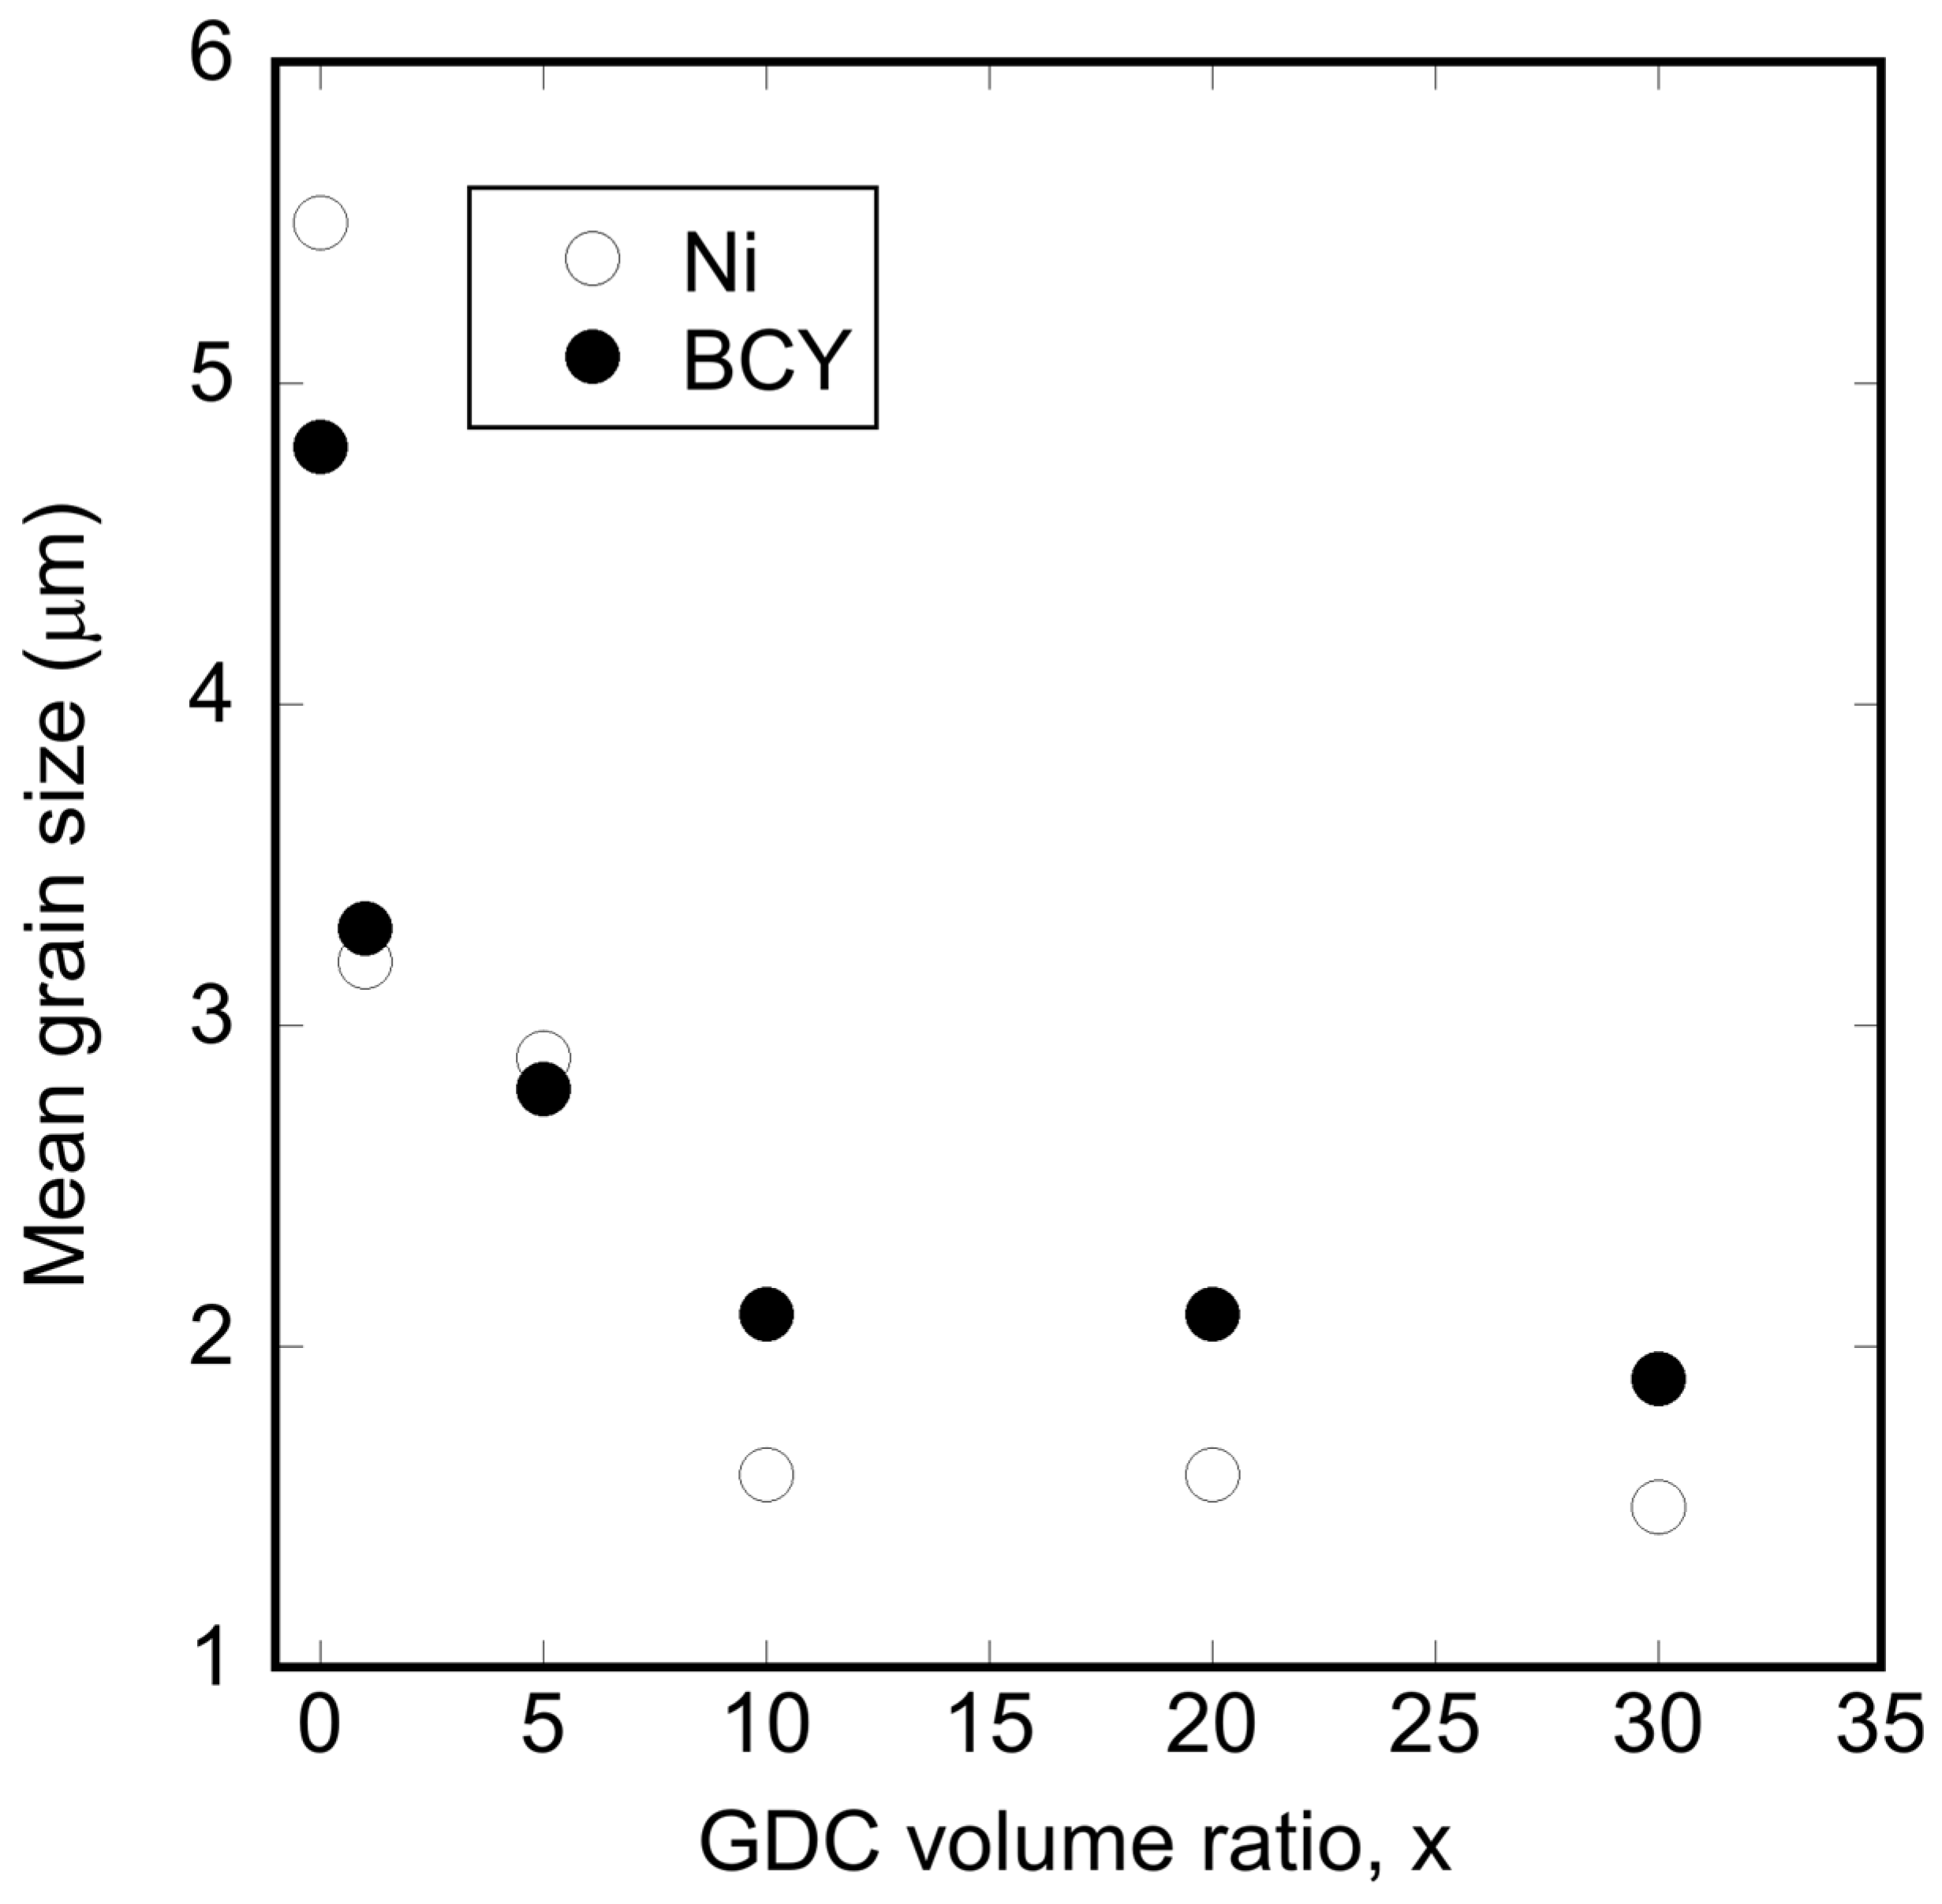
3.2. Microstructural Changes in Ni–BCY–GDC Cermets

First, the surface morphologies of Ni-free pellets sintered at 1400 °C were observed using SEM (Figure 4). All sintered bodies exhibited a dense morphology. The BCY sintered body showed remarkable grain growth and comprised particles approximately 5 μm in size. The grain growth was suppressed upon the addition of GDC. Figure 5 shows the EDS elemental mapping of the surface of the BCY-GDC sintered body. Ce and Gd are uniformly distributed. As the amount of GDC added increases, shading appears in the Ba element mapping. At the same time, Y element mapping also revealed that the distribution was reversed to that of Ba. This result suggests the segregation of yttria induced by the addition of GDC.
Figure 6 shows the Ni and Ba elemental mappings of the cross-section of the Ni–BCY–GDC pellets. Similar to the BCY–GDC binary system, the Ni particle size decreased with GDC addition. This is because the addition of GDC (1% GDC and above) inhibited the growth of Ni grains, suggesting that GDC may act as a sintering aid for BCY and NiO (as a precursor of Ni particles), decreasing grain boundary energy to promote the adhesion of grains. Several sintering aids for low-temperature sintering and densification of BCY-based perovskite oxides, such as NiO [35,36] and ZnO [37,38], have been reported. Sintering aids present at grain boundaries reduce grain boundary energy via diffusion into the solid solution. The XRD results shown in Figure 3 indicate that Gd forms a solid solution at the BCY grain boundaries, functions as a sintering aid, and suppresses BCY grain growth. We applied the Sherrer Equation (4) for the XRD peaks of Ni (111) around 2θ = 44.5° in Figure 3 to evaluate the crystallite size of Ni.
D = K λ/B cosθ
where D is crystallite size (nm), K is Scherrer Constant, λ is the X-ray wavelength of Cu-Kα (0.154 nm), B is the broadening of diffraction line width (rad), and θ is Bragg angle (rad). The B values are around 0.22° and large enough to apply Sherrer’s equation to evaluate crystallite size. The evaluation of crystallite size resulted in values ranging between 36 and 39 nm despite the difference in grain size of Ni. One possibility is that the Ni grains in the cermets are polycrystalline particles comprised of crystallites of the evaluated sizes. Figure 7 shows the surface EDS elemental mapping of the sintered pellets of x = 0–30. Obviously, the grain size in the surface structure is larger than that of the cross-section. This suggests that sintering progresses easily on the surface of Ni-BCY-GDC.
Figure 8 shows the relationship between the GDC volume fraction and the mean grain sizes of Ni and BCY in the Ni–BCY–GDC cermets. The average grain diameter was defined as the average value of 10 particles randomly extracted from the EDS images of Ni and B. The particle diameters of both Ni and BCY decreased rapidly up to x = 10 and hardly changed above x > 10. We found a linear relationship between the mean particle size of Ni in Ni–BCY–GDC and the ratio of the particle size (r) to the volume fraction (f) of the ceramic phase (r/f) [29]. Figure 9 shows the relationship between the radius of the Ni grains and the r/f values of the Ni–BCY–GDC composites used in this study. The data obtained in this study on the linear relationship between the radius of Ni grains and the r/f values of the Ni–BCY and Ni–BCY–GDC composites previously reported are presented [29]. Hara et al. [39] performed Monte Carlo simulations on the behavior of Ni particle growth in Ni–YSZ sinters and reported that Ni particle growth was significantly suppressed by increasing the YSZ content and decreasing the particle size. This phenomenon can be explained by the Zener pinning effect. When applied to the Ni–BCY–GDC system, the volumetric composition of BCY–GDC, which is the Ni matrix, is constant, but the particle size of the ceramic phase decreases with the addition of GDC. Therefore, the pinning effect on Ni works more strongly. The Ni metal particle dispersion could be ascribed from the viewpoint of Ni-GDC interaction. Some researchers have claimed that a strong interaction between Ni0 and Ce3+ activates Ni for the reforming reaction of methane [40,41]. It is, therefore, possible that the strong interaction of Ni0-Ce3+ could exist in Ni-BCY-GDC, which may increase the pinning force to delay the grain growth of Ni.

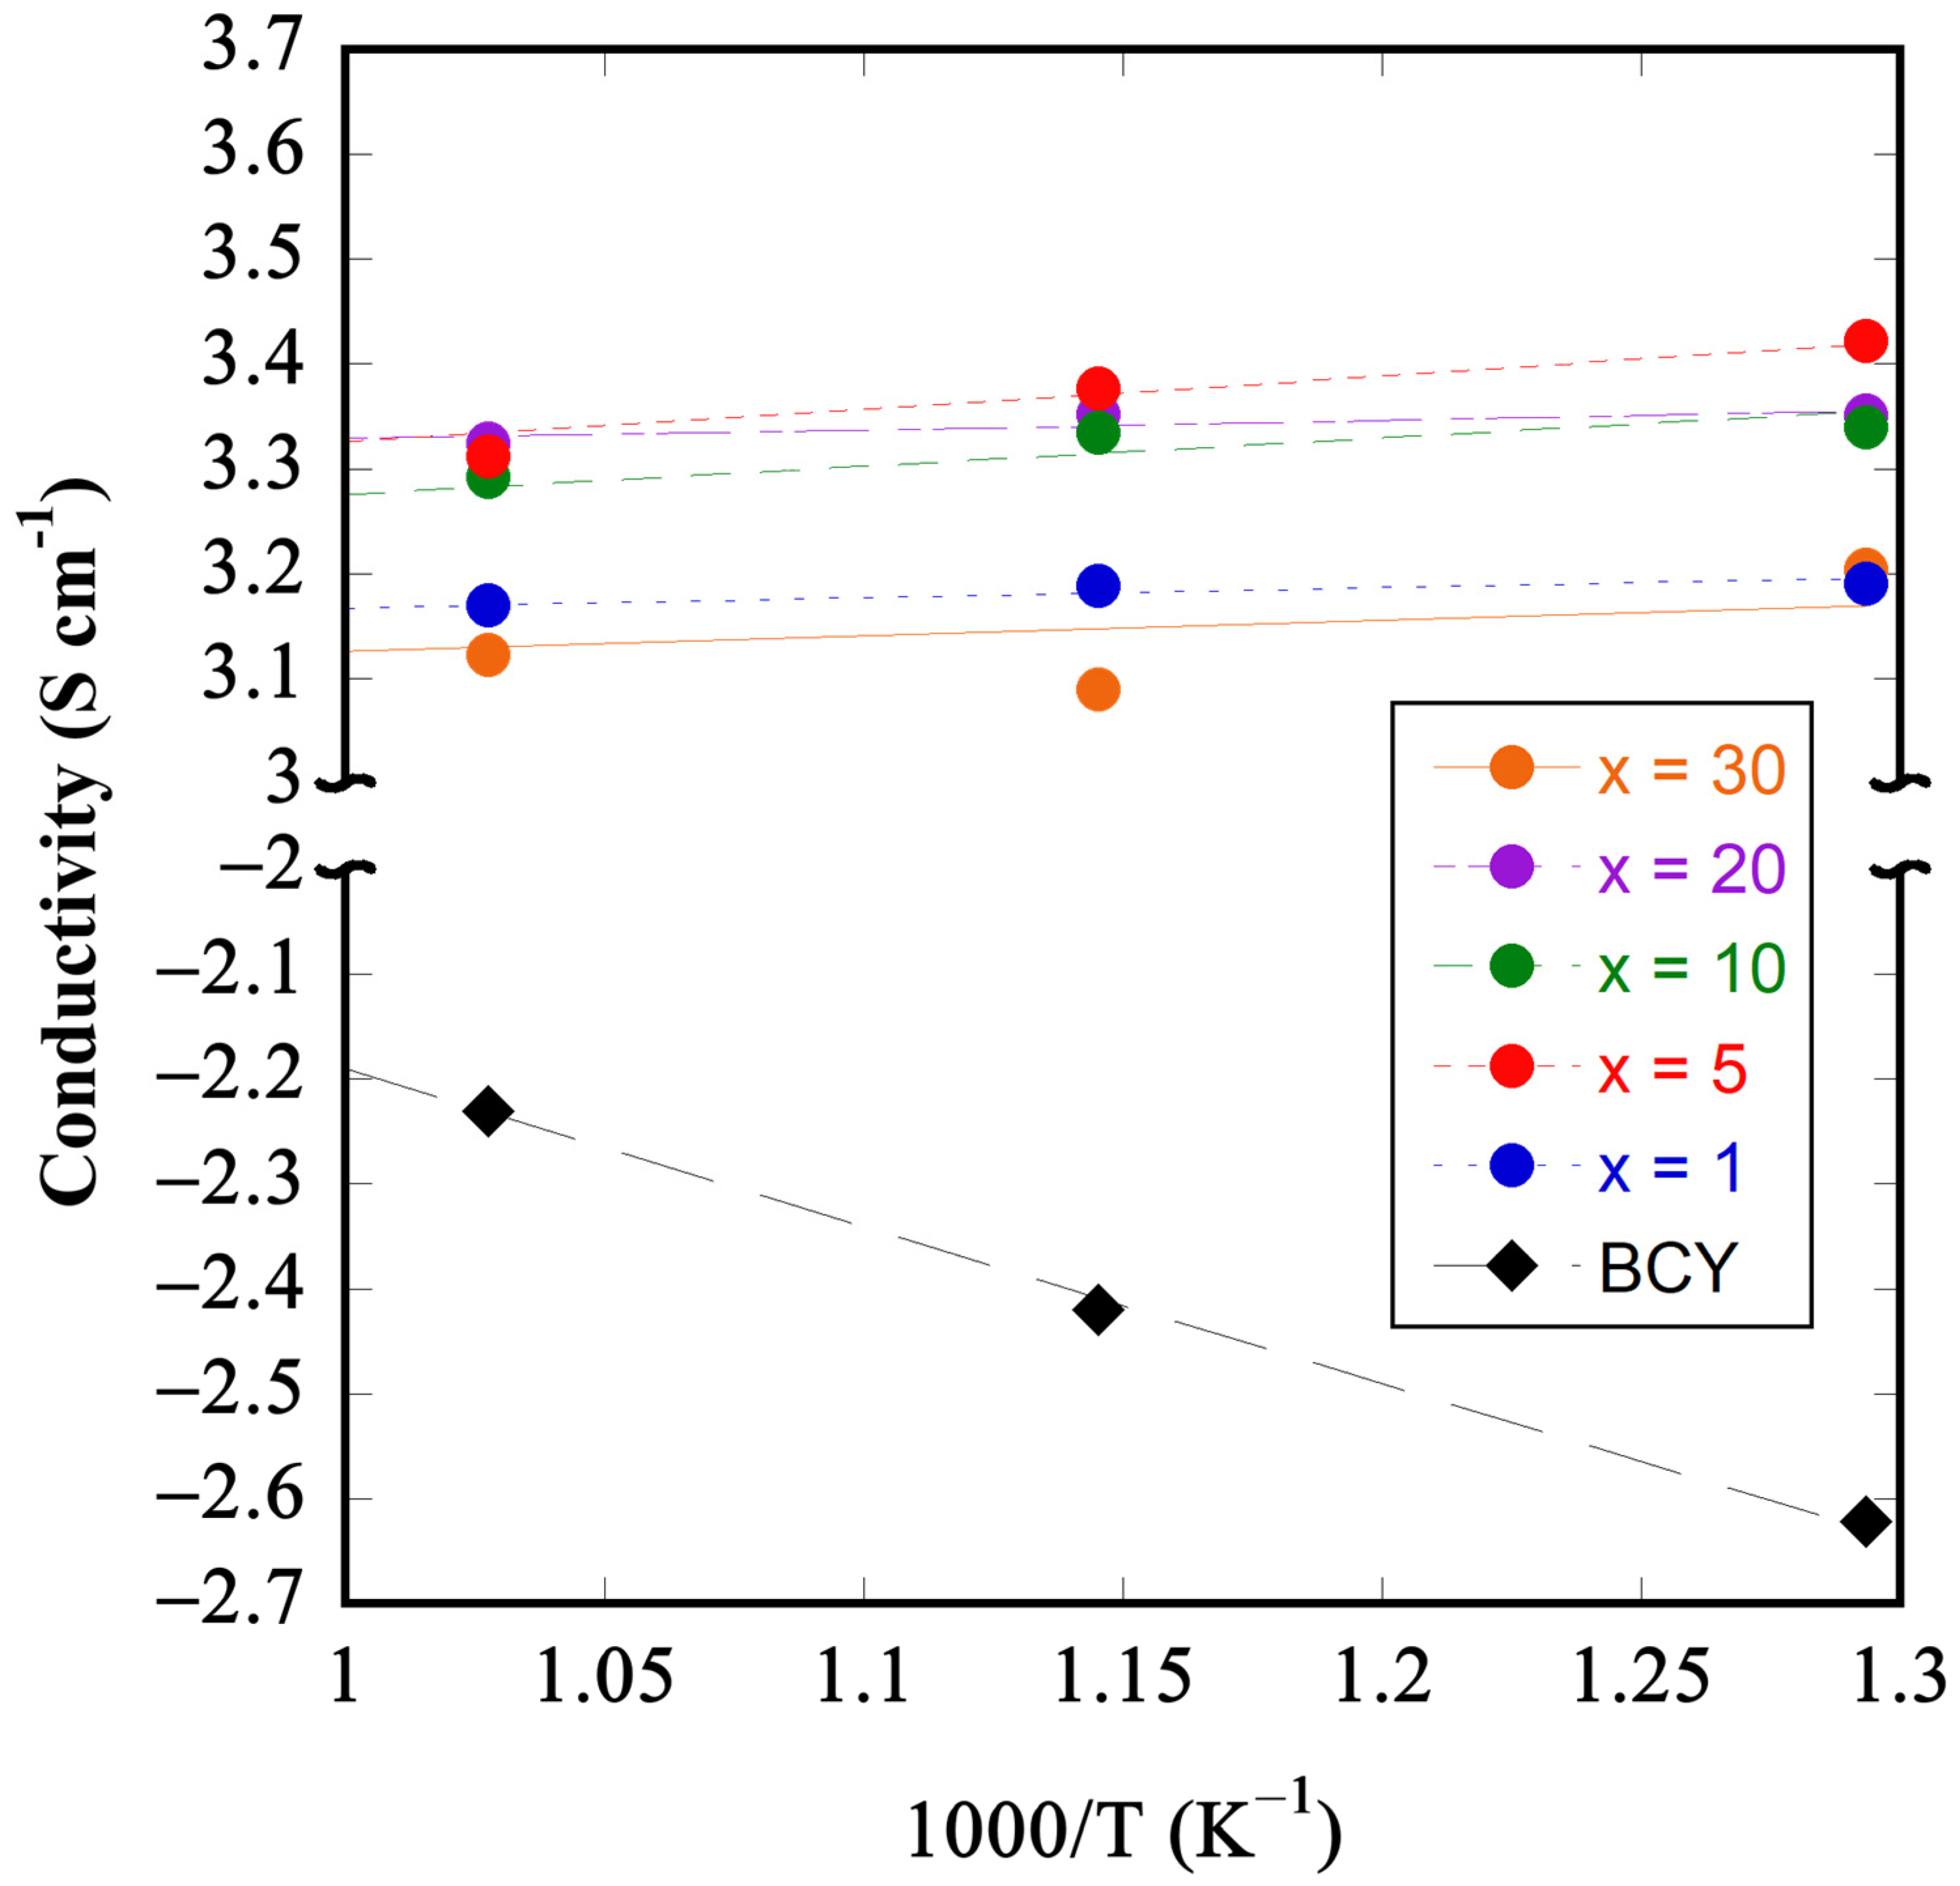
3.3. Conductivity Measurements

Figure 10 shows the electrical conductivity of the Ni–BCY–GDC cermets. All cermets exhibited a high electrical conductivity of over 103 S cm−1. The activation energies of the Ni-containing samples were nearly zero, suggesting a metallic conduction behavior. The conductivity rapidly increases with an increase in x from 1 to 5 and is almost constant up to x = 20. This increment in conductivity might be due to the Ni particle dispersion developing an electron conduction network in the Ni-cermets. It is not clear why conductivity again decreased at x = 30. According to Equation (3), electronic conductivity is not necessarily a decisive factor of hydrogen flux because proton conductivity in the cermets is negligibly small compared to electronic conductivity. Meanwhile, the BCY sinter exhibited a semiconducting behavior, and the activation energy was evaluated as 0.296 eV, which is close to that reported for BCY [42]. The conductivity of BCY was less than 10−2 S cm−1 even at 800 °C, which is approximately 10−5 times those of the samples containing 40 vol% Ni. This indicates that the ambipolar conductivity ( σ H + · σ e )/ σ H + · σ e , in Equation (3), which is a decisive factor for hydrogen flux, is governed by the proton conductivity of the ceramic phase. We previously measured the conductivity of BCY–GDC dual oxides in humidified H2 [28]. The conductivity of the BCY–GDC sinter with a volume ratio of 78:22 in 100% H2 was close to that of pure BCY, and it increased significantly when the volume ratio of GDC was 46, indicating that the addition of 22 vol% GDC did not practically affect the proton conductivity of BCY. The increase in conductivity upon the addition of GDC is due to the electronic conduction owing to the reduction in Ce4+ in GDC to Ce3+ in a hydrogen atmosphere [43,44]. In the current Ni–BCY–GDC with 40 vol% Ni phase, the volume fraction of the ceramic phase was 60 vol%, and x = 1, 5, 10, 20, and 30 correspond to GDC volume fractions [GDC]/([BCY] + [GDC]) of 1.67, 8.33, 16.7, 33.3 and 50.0, respectively. We deduced that the addition of GDC below x = 10 did not affect the proton conductivity of the ceramic phase.

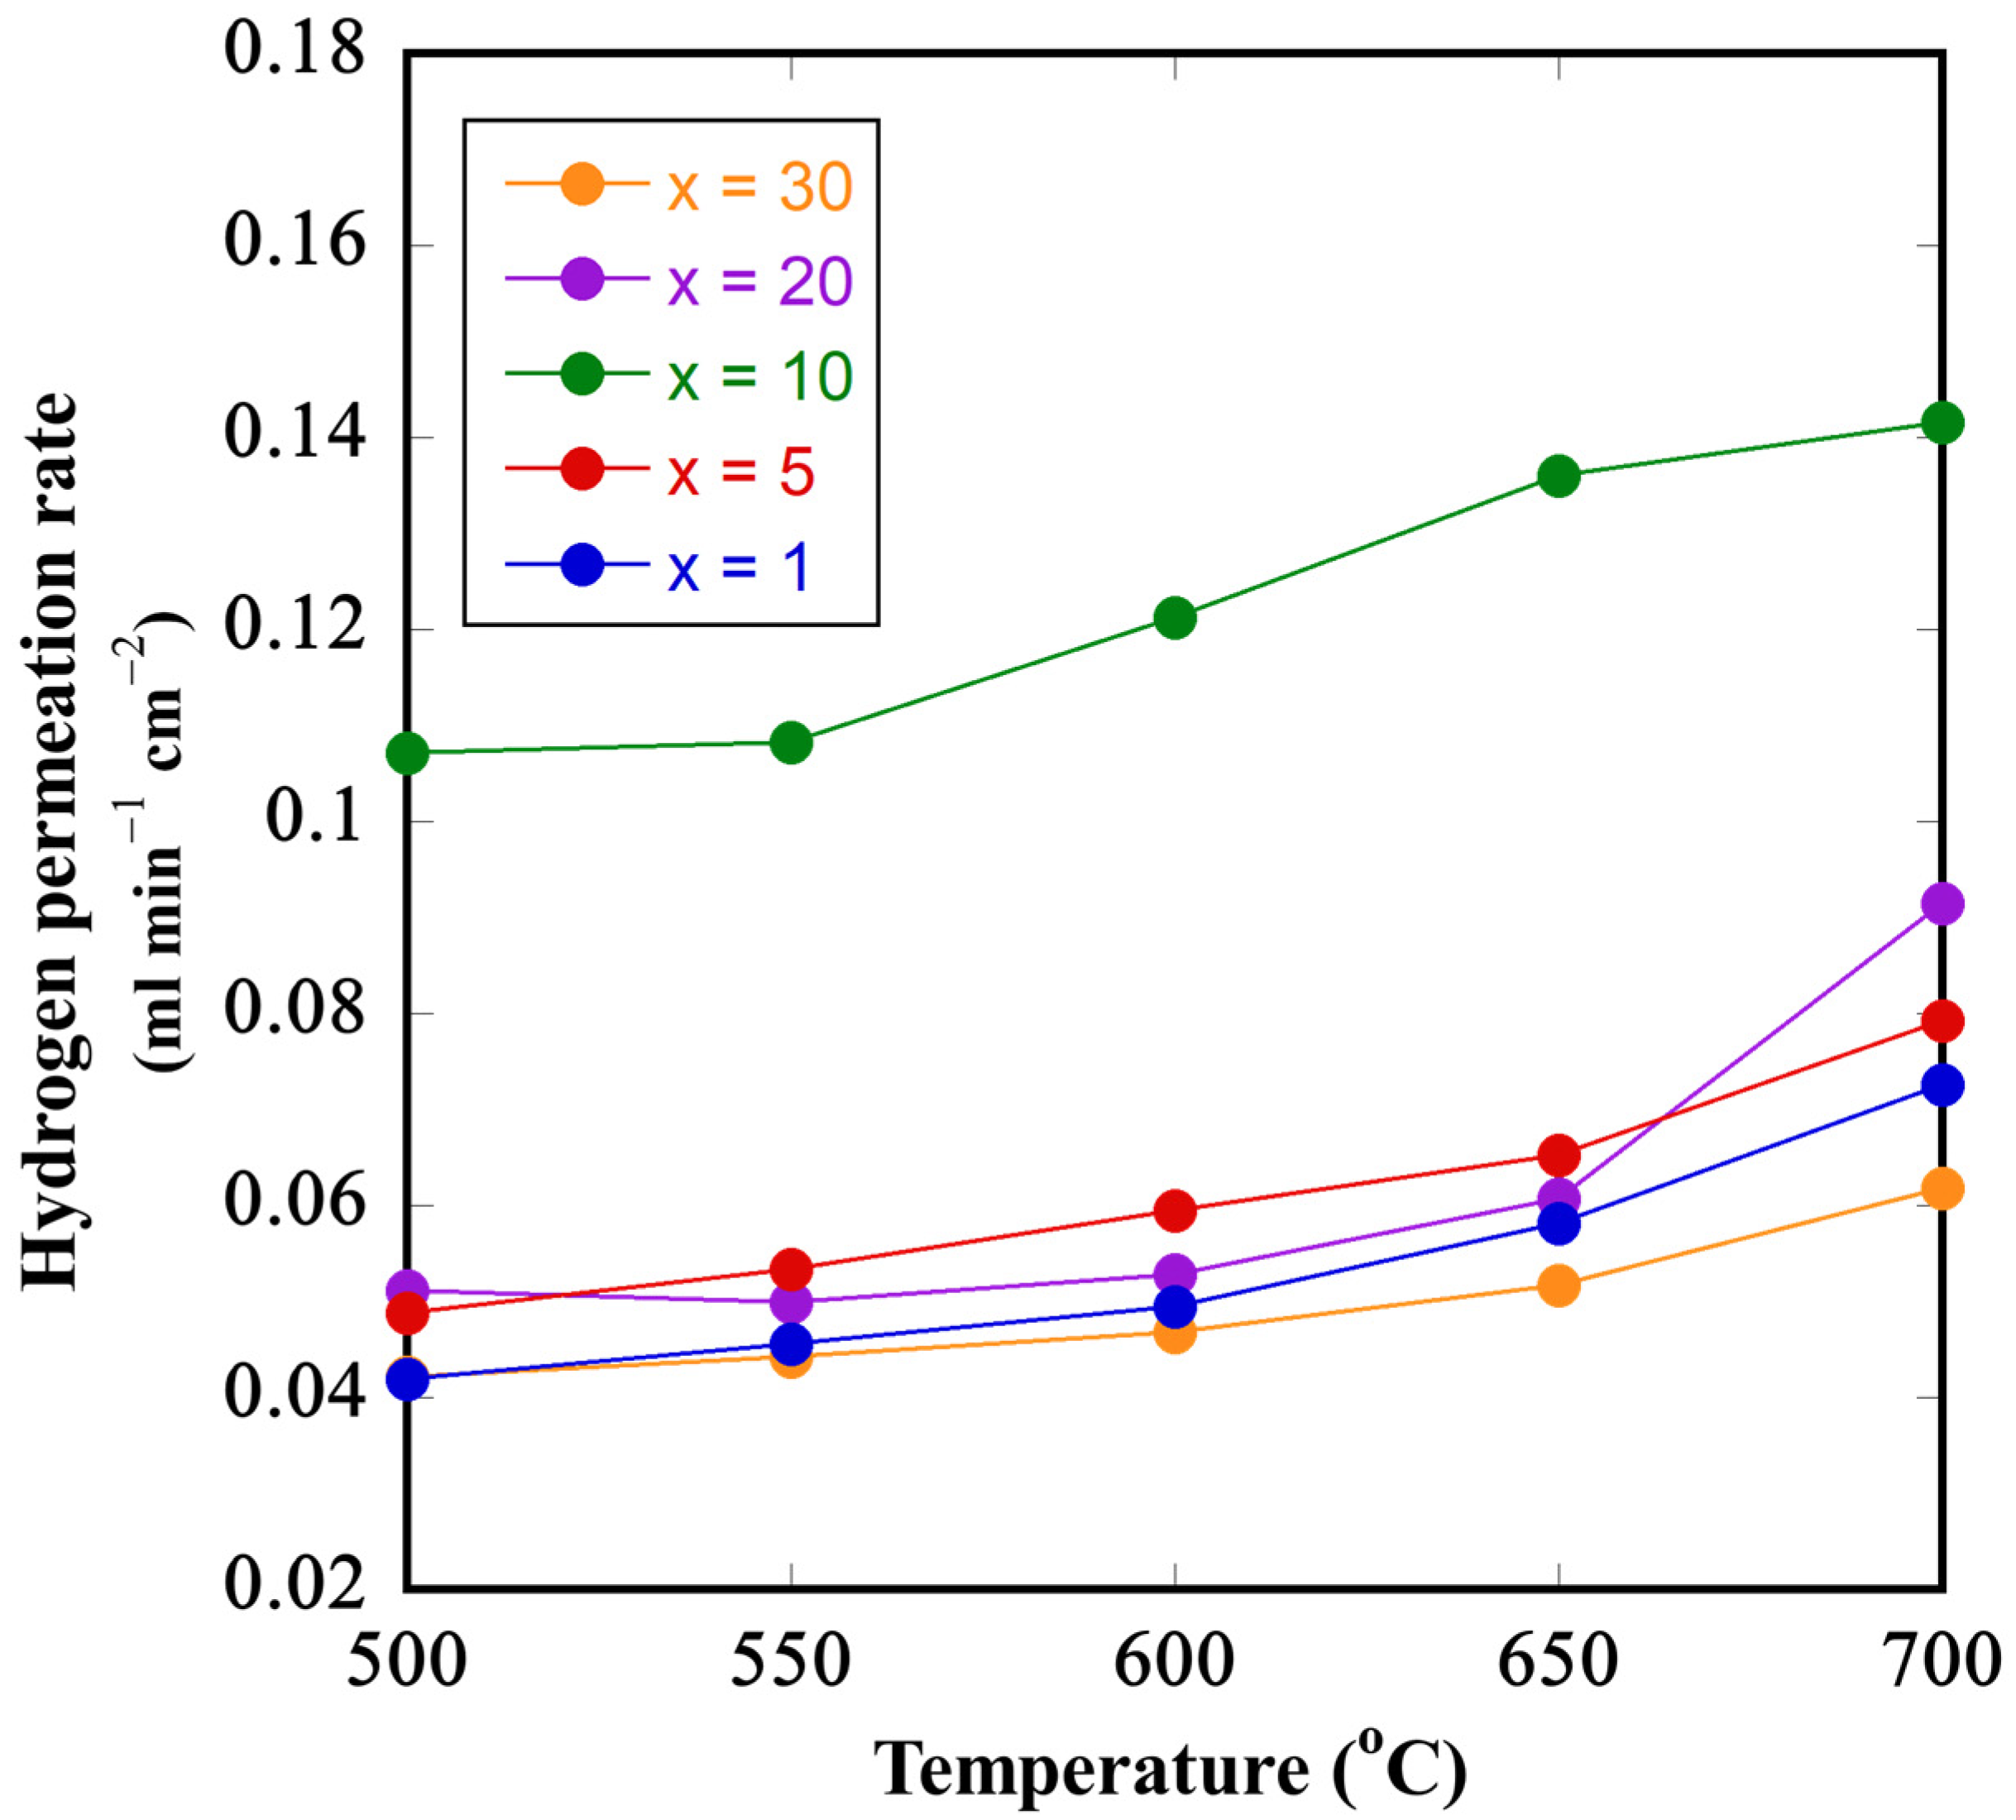
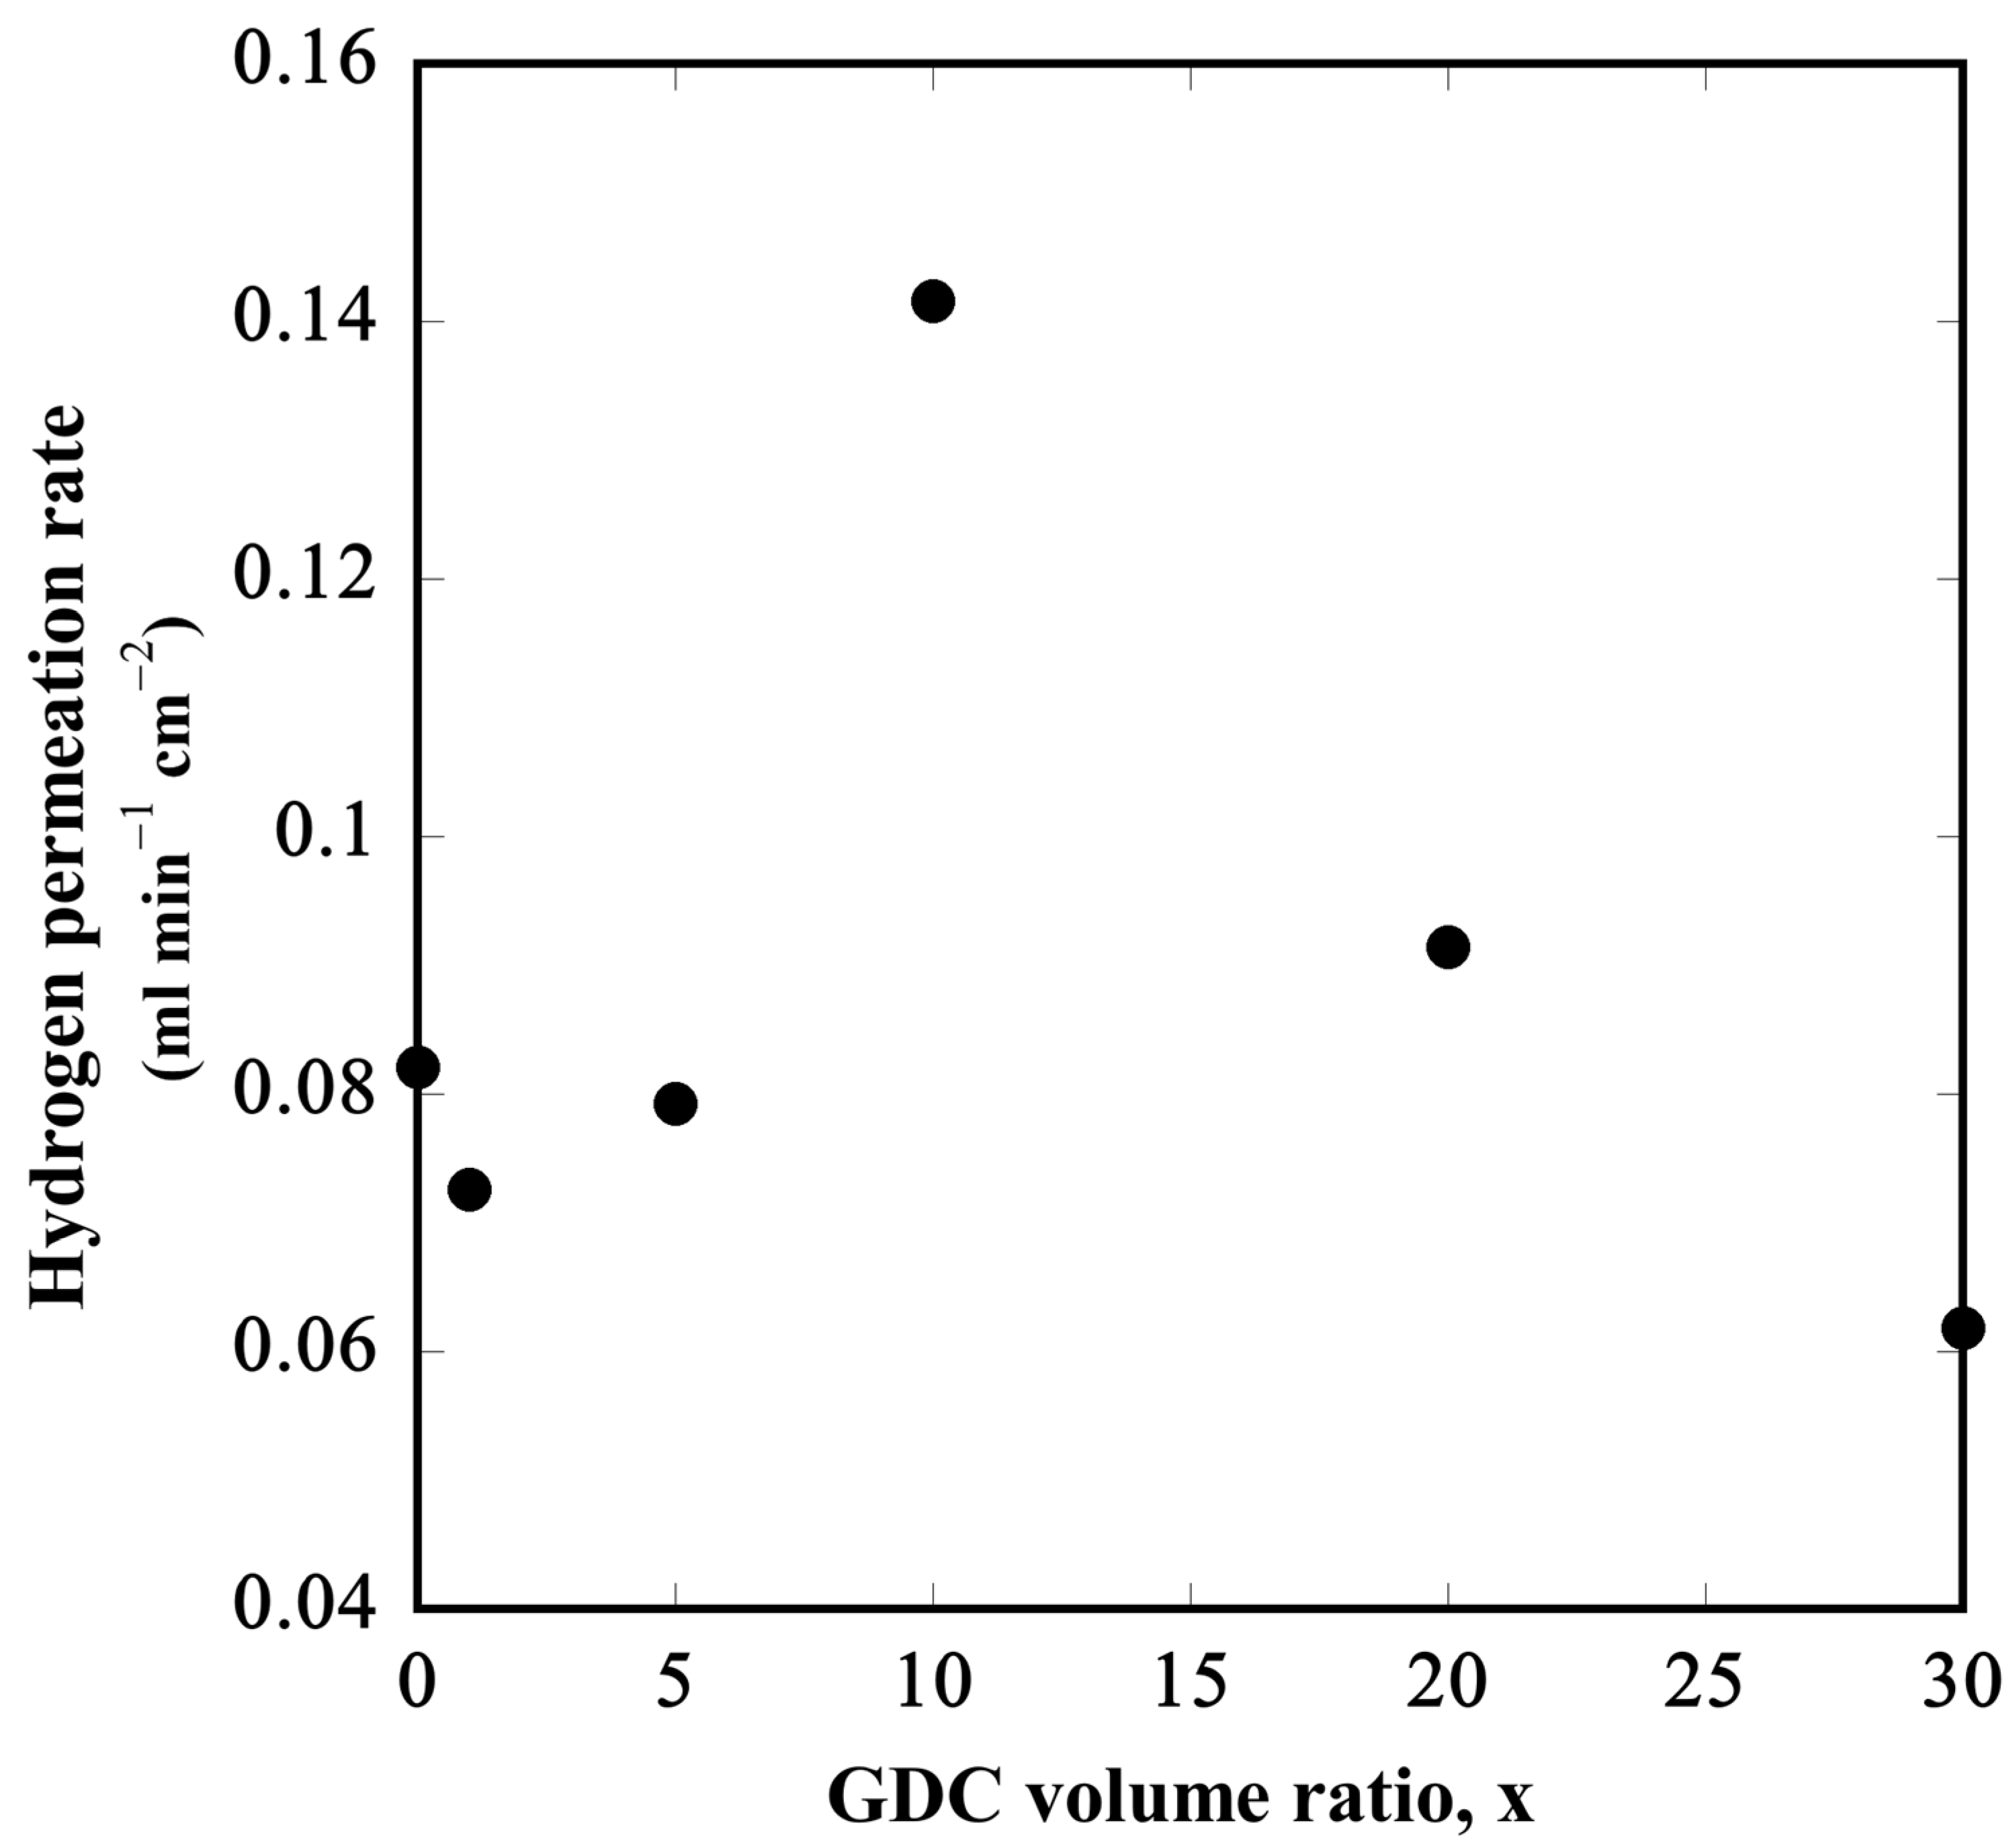
3.4. Hydrogen Permeation Tests

Figure 11 shows the hydrogen permeation fluxes of the Ni–BCY–GDC cermets in the temperature range of 500–700 °C. Hydrogen permeation increased with increasing temperature in all samples. The cermet with x = 10 exhibited a specifically high hydrogen permeation flux of 0.142 mL min−1 cm−2 at 700 °C. Song et al. [23] reported the hydrogen permeation fluxes of 40 vol% Ni–BCY sintered pellets with different thicknesses in wet 3.8% H2. Hydrogen permeation flux increased with decreasing thickness, and when the thickness of Ni–BCY was 0.64 mm, the hydrogen fluxes at 700 °C were approximately 0.05 mL min−1 cm−2. In the present case, the thickness was 0.80 ± 0.05 mm for all samples. Ni–BCY showed a hydrogen permeation flux of approximately 0.08 mL min−1 cm−2, which is almost comparable, but for Ni–BCY–GDC with x = 10, the hydrogen flux was significantly higher than that reported by Song et al. [23] despite its larger thickness. Figure 12 shows the hydrogen permeation flux versus the amount of GDC at 700 °C. The hydrogen permeation increased with the GDC volume fraction up to 10 vol% but decreased with further increase. Therefore, the optimum GDC volume fraction was 10 vol%. We inferred that the increase in hydrogen permeation up to x = 10 is correlated with the change in the particle size of the BCY phase (shown in Figure 8). The uniform dispersion of BCY grains spreads the proton conduction path throughout the cermet, resulting in improved proton conductivity. When the GDC volume fraction exceeds 10 vol%, the hydrogen permeation decreases despite the small size of the BCY particles because the excessive addition of GDC lowers the proton transfer number of the ceramic phase. Lin et al. [31] reported that the single-phase perovskite formed in BCY–GDC sintered at 1550 °C (BCGY) exhibited a higher conductivity than those sintered at lower temperatures. They explained that the increased conductivity was due to the formation of single-phase BCGY. In the present work, the GDC phase was not confirmed even at x = 20, suggesting the formation of a BCGY phase. However, if the solid solution of GDC increases the proton conductivity, the decrease in hydrogen permeability cannot be explained. Because the sintering temperature was as low as 1400 °C, factors related to the density and morphology of the sinter may affect the proton conductivity of the ceramic phase. We will investigate the effect of sintering temperature on hydrogen permeability in a follow-up study.

3.5. Comparison with Other Ceramics Material for H2 Permeation

Ceramic-based hydrogen permeation membranes such as Ni-cermet and dual-phase ceramics have been reported. Most of them are based on the principle of ambipolar conduction of electrons and protons. Table 1 summarizes the hydrogen permeation characteristics of previously reported ceramic hydrogen separation membranes. These films are classified into two types: cermets composed of Ni and proton conductive oxides and composites of doped–ceria and proton conductive oxides. It is difficult to make a simple comparison because they have been tested under different environments and film thicknesses, but assuming the same film thickness, hydrogen partial pressure, and temperature, the ternary film in this study exhibited comparable or higher hydrogen permeability than the other films. Hydrogen permeation properties do not differ significantly between the Ni–cermet and dual–phase ceramic membranes. The electronic conductivity of GDC is on the order of 10−1 S cm−1 even at 800 °C [28], which is extremely small compared to that of Ni metal. Therefore, it seems that proton conductivity, rather than electronic conductivity, makes a large contribution to hydrogen permeability. Although the addition of GDC improves CO2 resistance, there is a concern that the expansion and contraction of GDC due to the redox cycle may reduce the mechanical strength of the membrane [45,46]. Mortalò et al. [45] investigated the mechanical and redox stability of the BCZY-GDC membrane containing 54 wt% of GDC. They found that the presence of BCZY suppressed the excessive reduction in GDC in hydrogen, thereby ensuring redox and mechanical stability. Although this study revealed that the amount of GDC added affects hydrogen permeability, there is also interest in the effects of redox treatment on mechanical strength and hydrogen permeability. In the future, we plan to quantitatively evaluate chemical and mechanical stability in CO2 and the proton conductivity of the Ni-cermet membrane.

4. Conclusions

In this study, we investigated the effects of the GDC volume fractions (x = 0, 1, 5, 10, 20, and 30 vol%) of Ni–BCY–GDC cermets on their hydrogen permeation characteristics. Sintering at 1400 °C provided a single-phase perovskite in addition to the Ni phase below x = 20 upon the formation of the solid solution of GDC, and the GDC phase appeared at x = 30. The grain sizes of the Ni and BCY phases decreased with increasing GDC volume fraction, especially in the range of x = 0–10. All the cermets examined showed metallic conductivity in the humidified 4% H2/N2 atmosphere. Among them, x = 10 showed the maximum hydrogen permeation flux of 0.142 mL min−1 cm−2 at 700 °C, and this value is comparable to or even larger than those reported for the dual-phase systems such as Ni-BCY and Ni-BCZY. We found, in this study, that owing to GDC addition, BCY grains become homogeneously dispersed in the cermet, effectively developing conduction paths and thereby enhancing proton conductivity in the ceramic phase. We finally propose that the addition of 10 vol% of GDC to Ni-BCY is the most proper composition in this ternary system. To obtain a higher hydrogen permeation flux comparable to Pd membranes, it would be necessary to reduce the membrane thickness to at least μm size. In the future, we plan to quantitatively evaluate the chemical and mechanical stability of CO2 and the proton conductivity of the Ni-cermet membrane.

Author Contributions

Conceptualization, Y.I.; methodology, Y.I.; validation, Y.I. and H.A.; formal analysis, H.M. and T.M.; investigation, Y.I.; resources, Y.I.; data curation, T.M. and H.M.; writing—original draft preparation, Y.I.; writing—review and editing, Y.I.; supervision, Y.I.; project administration, Y.I.; funding acquisition, Y.I. All authors have read and agreed to the published version of the manuscript.

Funding

This research received external funding from JSPS KAKENHI Grant-in-Aid Scientific Research (Japan Society for the Promotion of Science, Grant Number JP22K05288).

Institutional Review Board Statement

Not applicable.

Informed Consent Statement

Not applicable.

Data Availability Statement

Data are contained within the article.

Acknowledgments

This research was supported by Grants-in-Aid for JSPS KAKENHI (Grant Number JP22K05288) and the Research Unit of Regional e-Fuel (ReFuel) at Ehime University.

Conflicts of Interest

The authors declare no conflicts of interest.

References

  1. Holladay, J.D.; Hu, J.; King, D.L.; Wang, Y. An overview of hydrogen production technologies. Catal. Today 2009, 139, 244–260. [Google Scholar] [CrossRef]
  2. Shu, J.; Grandjean, B.P.A.; Van Neste, A.; Kaliaguine, S. Catalytic palladium-based membrane reactors: A review. Can. J. Chem. Eng. 1991, 69, 1036–1060. [Google Scholar] [CrossRef]
  3. Cheng, X.; Shi, Z.; Glass, N.; Zhang, L.; Zhang, J.; Song, D.; Liu, Z.-S.; Wang, H.; Shen, J. A review of PEM hydrogen fuel cell contamination: Impacts, mechanisms, and mitigation. J. Power Sources 2007, 165, 739–756. [Google Scholar] [CrossRef]
  4. Hatlevik, Ø.; Gade, S.K.; Keeling, M.K.; Thoen, P.M.; Davidson, A.P.; Way, J.D. Palladium and palladium alloy membranes for hydrogen separation and production: History, fabrication strategies, and current performance. Sep. Purif. Technol. 2010, 73, 59–64. [Google Scholar] [CrossRef]
  5. Rahimpour, M.R.; Samimi, F.; Babapoor, A.; Tohidian, T.; Mohebi, S. Palladium membranes applications in reaction systems for hydrogen separation and purification: A review. Chem. Eng. Process 2017, 121, 24–49. [Google Scholar] [CrossRef]
  6. Howard, B.H.; Killmeyer, R.P.; Rothenberger, K.S.; Cugini, A.V.; Morreale, A.V.; Enick, R.M.; Bustamante, F. Hydrogen permeance of palladium–copper alloy membranes over a wide range of temperatures and pressures. J. Membr. Sci. 2004, 241, 207–218. [Google Scholar] [CrossRef]
  7. Kulprathipanja, A.; Alptekin, G.O.; Falconer, J.L.; Way, J.D. Pd and Pd–Cu membranes: Inhibition of H2 permeation by H2S. J. Membr. Sci. 2005, 254, 49–62. [Google Scholar] [CrossRef]
  8. Roa, F.; Block, M.J.; Way, J.D. The influence of alloy composition on the H2 flux of composite Pd-Cu membranes. Desalination 2002, 147, 411–416. [Google Scholar] [CrossRef]
  9. Li, Z.Y.; Maeda, H.; Kusakabe, K.; Morooka, S.; Anzai, H.; Akiyama, S. Preparation of palladium-silver alloy membranes for hydrogen separation by the spray pyrolysis method. J. Membr. Sci. 1993, 78, 247–254. [Google Scholar] [CrossRef]
  10. Cheng, Y.S.; Yeung, K.L. Palladium–silver composite membranes by electroless plating technique. J Membr. Sci. 1999, 158, 127–141. [Google Scholar] [CrossRef]
  11. Coulter, K. Cost-effective method for producing self-supporting Pd alloy membrane for use in the efficient production of coal-derived hydrogen. In FY 2008 Annual Progress Report; Hydrogen Program, US Department of Energy (DOE): Washington, DC, USA, 2008; pp. 212–214. [Google Scholar]
  12. Iwahara, H.; Esaka, T.; Uchida, H.; Maeda, N. Proton conduction in sintered oxides and its application to steam electrolysis for hydrogen production. Solid State Ionics 1981, 3–4, 359–363. [Google Scholar] [CrossRef]
  13. Iwahara, H. Proton conducting ceramics and their applications. Solid State Ionics 1996, 86–88, 9–15. [Google Scholar] [CrossRef]
  14. Iwahara, H. Technological challenges in the application of proton conducting ceramics. Solid State Ionics 1995, 77, 289–298. [Google Scholar] [CrossRef]
  15. Duan, C.; Kee, R.; Zhu, H.; Sullivan, N.; Zhu, L.; Bian, L.; Jennings, D.; O’Hayre, R. Highly efficient reversible protonic ceramic electrochemical cells for power generation and fuel production. Nat. Energy 2019, 4, 230–240. [Google Scholar] [CrossRef]
  16. Bi, L.; Boulfrad, S.; Traversa, E. Steam electrolysis by solid oxide electrolysis cells (SOECs) with proton-conducting oxides. Chem. Soc. Rev. 2014, 43, 8255–8270. [Google Scholar] [CrossRef]
  17. Duan, C.; Tong, J.; Shang, M.; Nikodemski, S.; Sanders, M.; Ricote, S.; Almansoori, A.; O’Hayre, R. Readily processed protonic ceramic fuel cells with high performance at low temperatures. Science 2015, 349, 1321–1326. [Google Scholar] [CrossRef]
  18. Fabbri, E.; D’Epifanio, A.; Di Bartolomeo, E.; Licoccia, S.; Traversa, E. Tailoring the chemical stability of Ba(Ce0.8−xZrx)Y0.2O3−δ protonic conductors for intermediate temperature solid oxide fuel cells (IT-SOFCs). Solid State Ionics 2008, 179, 558–564. [Google Scholar] [CrossRef]
  19. Kreuer, K.D. Proton-conducting oxides. Annu. Rev. Mater. Res. 2003, 33, 333–359. [Google Scholar] [CrossRef]
  20. Norby, T. Solid-state protonic conductors: Principles, properties, progress and prospects. Solid State Ionics 1999, 125, 1–11. [Google Scholar] [CrossRef]
  21. Taillades, G.; Jacquin, M.; Khani, Z.; Jones, D.; Marrony, M.; Roziere, J. Development of proton conducting thin films from nanoparticulate precursors. ECS Trans. 2007, 7, 2291–2298. [Google Scholar] [CrossRef]
  22. Kim, H.; Kim, B.; Lee, J.; Ahn, K.; Kim, H.-R.; Yoon, K.J.; Kim, B.-K.; Cho, Y.W.; Lee, H.-W.; Lee, J.-H. Microstructural adjustment of Ni–BaCe0.9Y0.1O3−δ cermet membrane for improved hydrogen permeation. Ceram. Int. 2014, 40, 4117–4126. [Google Scholar] [CrossRef]
  23. Song, S.-J.; Moon, J.-H.; Lee, T.H.; Dorris, S.E.; Balachandran, U. Thickness dependence of hydrogen permeability for Ni–BaCe0.8Y0.2O3−δ. Solid State Ionics 2008, 179, 1854–1857. [Google Scholar] [CrossRef]
  24. Zhang, G.; Dorris, S.E.; Balachandran, U.; Liu, M. Interfacial resistances of Ni–BCY mixed-conducting membranes for hydrogen separation. Solid State Ionics 2003, 159, 121–134. [Google Scholar] [CrossRef]
  25. Scholten, M.J.; Schoonman, J.; van Miltenburg, J.C.; Oonk, H.A.J. Synthesis of strontium and barium cerate and their reaction with carbon dioxide. Solid State Ionics 1993, 61, 83–91. [Google Scholar] [CrossRef]
  26. Guo, Y.; Lin, Y.; Ran, R.; Shao, Z. Zirconium doping effect on the performance of proton-conducting BaZryCe0.8−yY0.2O3−δ (0.0 ≤ y ≤ 0.8) for fuel cell applications. J. Power Sources 2009, 193, 400–407. [Google Scholar] [CrossRef]
  27. Zuo, C.; Lee, T.H.; Dorris, S.E.; Balachandran, U.; Liu, M. Composite Ni–Ba(Zr0.1Ce0.7Y0.2)O3 membrane for hydrogen separation. J. Power Sources 2006, 159, 1291–1295. [Google Scholar] [CrossRef]
  28. Itagaki, Y.; Hiraoka, A.; Aono, H.; Yahiro, H. Hydrogen permeation of BaCe0.80Y0.20O3−δ–Gd0.1Ce0.9Ox dual-phase membranes. J. Ceram. Soc. Jpn. 2017, 125, 338–342. [Google Scholar] [CrossRef]
  29. Itagaki, Y.; Cui, J.; Tani, Y.; Aono, H.; Yahiro, H. Inhibition of Ni grain growth in Ni-BCY anode substrate for solid oxide fuel cell. ECS Trans. 2019, 91, 1693–1971. [Google Scholar] [CrossRef]
  30. Zhu, B.; Albinsson, I.; Mellander, B.-E. Electrical properties and proton conduction of gadolinium doped ceria. Ionics 1998, 4, 261–266. [Google Scholar] [CrossRef]
  31. Lin, D.; Wang, Q.; Peng, K.; Shaw, L.L. Phase formation and properties of composite electrolyte BaCe0.8Y0.2O3−δ–Ce0.8Gd0.2O1.9 for intermediate temperature solid oxide fuel cells. J Power Sources 2012, 205, 100–107. [Google Scholar] [CrossRef]
  32. Dubal, S.U.; Bhosale, C.H.; Jadhav, L.D. Performance of spray deposited Gd-doped barium cerate thin films for proton conducting SOFC. Ceram. Int. 2015, 41, 5607–5613. [Google Scholar] [CrossRef]
  33. Shannon, R.D. Revised effective ionic radii and systematic studies of interatomic distances in halides and chalcogenides. Acta Cryst. A 1976, 32, 751–767. [Google Scholar] [CrossRef]
  34. Caldes, M.T.; Kravchyk, K.V.; Benamira, M.; Besnard, N.; Gunes, V.; Bohnke, O.; Joubert, O. Metallic Nanoparticles and proton conductivity: Improving proton conductivity of BaCe0.9Y0.1O3−δ using a catalytic approach. Chem. Mater. 2012, 24, 4641–4646. [Google Scholar] [CrossRef]
  35. Wang, B.; Bi, L.; Zhao, X.S. Exploring the role of NiO as a sintering aid in BaZr0.1Ce0.7Y0.2O3−δ electrolyte for proton-conducting solid oxide fuel cells. J. Power Sources 2018, 399, 207–214. [Google Scholar] [CrossRef]
  36. Lee, K.-R.; Tseng, C.-J.; Jang, S.-C.; Lin, J.-C.; Wang, K.-W.; Chang, J.-K.; Chen, T.-C.; Lee, S.-W. Fabrication of anode-supported thin BCZY electrolyte protonic fuel cells using NiO sintering aid. Int. J. Hydrogen Energy 2019, 44, 23784–23792. [Google Scholar] [CrossRef]
  37. Li, Y.; Guo, R.; Wang, C.; Liu, Y.; Shao, Z.; An, J.; Liu, C. Stable and easily sintered BaCe0.5Zr0.3Y0.2O3−δ electrolytes using ZnO and Na2CO3 additives for protonic oxide fuel cells. Electrochim. Acta 2013, 95, 95–101. [Google Scholar] [CrossRef]
  38. Baral, A.K.; Tsur, Y. Sintering aid (ZnO) effect on proton transport in BaCe0.35Zr0.5Y0.15O3−δ and electrode phenomena studied by distribution function of relaxation times. J. Am. Ceram. Soc. 2019, 102, 239–250. [Google Scholar] [CrossRef]
  39. Hara, S.; Shikata, K.; Shikzono, N.; Izumi, S.; Sakai, S. Monte Carlo study on the constraint effect of YSZ phase on Ni sintering in Ni-YSZ composite system. ECS Trans. 2013, 57, 2857–2863. [Google Scholar] [CrossRef]
  40. Wang, J.B.; Tai, Y.-L.; Dow, W.-P.; Huang, T.-J. Study of ceria-supported nickel catalyst and effect of yttria doping on carbon dioxide reforming of methane. Appl. Catal. A Gen. 2001, 218, 69–79. [Google Scholar] [CrossRef]
  41. Liu, Z.; Grinter, D.C.; Lustemberg, P.G.; Nguyen-Phan, T.-D.; Zhou, Y.; Luo, S.; Waluyo, I.; Crumlin, E.J.; Stacchiola, J.D.; Zhou, J.; et al. Dry Reforming of Methane on a Highly-Active Ni-CeO2 Catalyst: Effects of metal-support interactions on C–H Bond breaking. Angew. Chem. Int. Ed. 2016, 55, 7455–7459. [Google Scholar] [CrossRef]
  42. Maide, M.; Korjus, O.; Vestli, M.; Romann, T.; Aruväli, J.; Kirsimäe, K.; Nurk, G. Comparative study of BaY0.1Zr0.9O3−δ protective layers deposited to BaY0.1Ce0.9O3−δ membrane using ultrasonic spray pyrolysis and magnetron sputtering methods. J. Electrochem. Soc. 2016, 163, F443–F447. [Google Scholar] [CrossRef]
  43. Inaba, H.; Tagawa, H. Review Ceria-based solid electrolytes. Solid State Ionics 1996, 83, 1–16. [Google Scholar] [CrossRef]
  44. Zha, S.; Xia, C.; Meng, G. Effect of Gd (Sm) doping on properties of ceria lectrolyte for solid oxide fuel cells. J. Power Sources 2003, 115, 44–48. [Google Scholar] [CrossRef]
  45. Mortalò, C.; Boaro, M.; Rebollo, E.; Zin, V.; Aneggi, E.; Fabrizio, M.; Trovarelli, A. Insights on the interfacial processes involved in the mechanical and redox stability of the BaCe0.65Zr0.20Y0.15O3−δ–Ce0.85Gd0.15O2−δ composite. Appl. Energy Mater. 2020, 3, 9877–9888. [Google Scholar] [CrossRef]
  46. Mercandri, E.; Gondolini, A.; Arbit, M.; Cruciani, G.; Melandri, C.; Escolástico, S.; Serra, J.M.; Sanson, A. Chemical and mechanical stability of BCZY-GDC membranes for hydrogen separation. Sep. Purif. Technol. 2022, 289, 120795. [Google Scholar]
  47. Rosensteel, A.; Ricote, A.; Sullivan, N.P. Hydrogen permeation through dense BaCe0.8Y0.2O3−δ–Ce0.8Y0.2O2−δ composite-ceramic hydrogen separation membranes. Int. J. Hydrogen Energy 2016, 41, 2598–2606. [Google Scholar] [CrossRef]
  48. Rebollo, E.; Mortalò, C.; Escolástico, S.; Boldrini, S.; Barison, S.; Serrab, J.M.; Fabrizio, M. Exceptional hydrogen permeation of all-ceramic composite robust membranes based onBaCe0.65Zr0.20Y0.15O3−δ and Y- or Gd-doped ceria. Energy Environ. Sci. 2015, 8, 3675–3686. [Google Scholar] [CrossRef]
Figure 1. Experimental setup for hydrogen permeation tests.
Ceramics 07 00024 g001
Figure 2. XRD patterns of the BCY–GDC pellets with different GDC volume fractions sintered at 1400 °C (a) Diffraction patterns scanned from 2θ = 20 to 80° and (b) magnified images. The notations B and G denote the XRD peaks of the BCY and GDC phases.
Ceramics 07 00024 g002
Figure 3. XRD patterns of the Ni–BCY–GDC pellets sintered at 1400 °C and reduced by 4% H2 at 700 °C. (a) Diffraction patterns scanned from 2θ = 20 to 80° and (b) magnified images. The notations B, G, and N denote the XRD peaks of the BCY, GDC, and Ni phases.
Ceramics 07 00024 g003
Figure 4. SEM images of the surfaces of the BCY–GDC pellets with GDC volume fractions, ×, of 0, 10, 20, and 100 vol% sintered at 1400 °C.
Ceramics 07 00024 g004
Figure 5. EDS elemental mappings of the surface of BCY–GDC pellets with GDC volume fractions, ×, of 10, 20, and 30 vol% sintered at 1400 °C.
Ceramics 07 00024 g005
Figure 6. EDS elemental mappings of Ba and Ni collected from the cross-section of the Ni–BCY–GDC pellets (x = 0–30) sintered at 1400 °C and reduced in H2 at 700 °C.
Ceramics 07 00024 g006
Figure 7. EDS elemental mappings of Ba and Ni collected from the surface of the Ni–BCY–GDC pellets (x = 0–30) sintered at 1400 °C and reduced in H2 at 700 °C.
Ceramics 07 00024 g007
Figure 8. Relationship between the GDC volume ratio in Ni–BCY–GDC and the mean grain sizes of Ni and BCY. The grain size was evaluated using the EDS mappings of Ni and Ba collected from the surfaces of the Ni–BCY–GDC pellets.
Ceramics 07 00024 g008
Figure 9. Relationship between the mean Ni grain size and the ratio of the grain radius (r) to the volume fraction (f) of BCY, r/f. The open circles represent our previous data in ref. [29], and the solid circles represent the results of this work. The grain sizes of Ni and BCY were evaluated using the EDS elemental mappings of the Ni and Ba elements, respectively.
Ceramics 07 00024 g009
Figure 10. Electrical conductivities of sintered Ni–BCY–GDC cermets in 4% H2/N2 were measured using the four-terminal DC method. For BCY, the conductivity was measured using the two-terminal AC method.
Ceramics 07 00024 g010
Figure 11. Hydrogen permeation fluxes of Ni–BCY–GDC cermets in the temperature range between 500 °C and 700 °C; humidified 4%H2/N2 was fed on one side of the pellets, and humidified N2-balanced 100 ppm H2 was supplied as a sweep gas on the other side.
Ceramics 07 00024 g011
Figure 12. Hydrogen permeation fluxes of Ni–BCY–GDC sinters with different GDC volume fractions (x) at 700 °C.
Ceramics 07 00024 g012
Table 1. Hydrogen permeation properties of Ni–cermet and dual phase ceramic membranes.
MembranesT
[°C]
Thickness
[μm]
Concentration
(Feed Gas–Sweep Gas)
Hydrogen Flux *
[mL min−1 cm−2]
Ref.
Ni-Cermets
Ni–BaCe0.8Y0.2O3−δ-Gd0.1Ce0.9O2−δ
(40:50:10vol.%)
700800Wet 4.0% H2/N2
–Wet 100 ppm/N2
0.142 (0.38)This work
Ni–BaCe0.9Y0.1O3−δ
(40:60vol.%)
800230Wet 100% H2
–Wet 100 ppmH2/N2
0.76 (0.16)[22]
Ni–BaCe0.9Y0.1O3−δ
(40:60vol.%)
700640Wet 3.8% H2/N2
–100 ppmH2/N2
0.05 (0.11)[23]
Ni–Ba(Zr0.1Ce0.7Y0.2)O3−δ
(40:60vol.%)
900266Wet 100% H2
–100 ppmH2/N2
0.805 (0.18)[27]
Dual-phase ceramics
BaCe0.8Y0.2O3−δ–Gd0.1Ce0.9O2−δ
(54:46 vol%)
8001100Wet 100% H2
–Wet N2
0.30 (0.30)[28]
BaCe0.8Y0.2O3−δ–Y0.2Ce0.8O2−δ
(50:50 vol%)
90014400.5atm H2
partial pressure gradient
0.0744 (0.10)[47]
BaCe0.65Zr0.20Y0.15O3−δ–Gd0.15Ce0.85O2−δ
(50:50 vol%)
755650Wet 50% H2/He
–Wet Ar
0.27 (0.20)[48]
* The values in parentheses are values normalized based on actual measurements, assuming sweep gas of 100% H2, film thickness of 1000 μm, and temperature of 700 °C.
Disclaimer/Publisher’s Note: The statements, opinions and data contained in all publications are solely those of the individual author(s) and contributor(s) and not of MDPI and/or the editor(s). MDPI and/or the editor(s) disclaim responsibility for any injury to people or property resulting from any ideas, methods, instructions or products referred to in the content.

