Article

Holistic Characterization of MgO-Al2O3, MgO-CaZrO3, and Y2O3-ZrO2 Ceramic Composites for Aerospace Propulsion Systems

by
Kateryna O. Shvydyuk
1,*,
João Nunes-Pereira
1,
Frederico F. Rodrigues
1,
José C. Páscoa
1,
Senentxu Lanceros-Mendez
2,3,4,5 and
Abílio P. Silva
1,*
1
Centre for Mechanical and Aerospace Science and Technologies (C-MAST), University of Beira Interior, 6201-001 Covilhã, Portugal
2
Physics Centre of Minho and Porto Universities (CF-UM-UP), University of Minho, 4710-057 Braga, Portugal
3
Laboratory of Physics for Materials and Emergent Technologies (LapMET), University of Minho, 4710-057 Braga, Portugal
4
Basque Center for Materials, Applications and Nanostructures (BCMaterials), UPV/EHU Science Park, 48940 Leioa, Spain
5
Basque Foundation for Science (IKERBASQUE), 48009 Bilbao, Spain
*
Authors to whom correspondence should be addressed.
Ceramics 2024, 7(1), 364-384; https://doi.org/10.3390/ceramics7010023
Submission received: 15 December 2023 / Revised: 24 January 2024 / Accepted: 29 February 2024 / Published: 2 March 2024
(This article belongs to the Special Issue Advances in Ceramics, 2nd Edition)

Abstract

:
Aerospace propulsion systems are among the driving forces for the development of advanced ceramics with increased performance efficiency in severe operation conditions. The conducted research focused on the mechanical (Young’s and shear moduli, flexural strength, hardness, and fracture toughness), thermal (thermal conductivity and coefficient of thermal expansion), and electric (dielectric properties) characterization of MgO-Al2O3, MgO-CaZrO3, and stable YSZ ceramic composites. The experimental results, considering structural and functional traits, underscore the importance of a holistic understanding of the multifunctionality of advanced ceramics to fulfill propulsion system requirements, the limits of which have not yet been fully explored.

1. Introduction

Advanced ceramics show an increasing growing global demand based on their wide-ranging applications, which are related to their multifunctional characteristics, long-lasting lifetime span, and tailorable properties [1,2,3]. The global advanced ceramics market has reached USD 96.6 billion in 2022 and is forecasted to grow significantly during the period of 2023–2028, exhibiting a compound annual growth rate of 8.55% [4]. The pursuit for increased performance, higher efficiencies, and low costs in aerospace propulsion has been one of the driving forces for the research and development of novel multifunctional ceramics. Advanced ceramics find their structural and functional properties applied in aerospace propulsion for components for gas turbine engines, rocket propulsion, hybrid electric propulsion, lightweight hypersonic propulsion, nuclear propulsion, and in-space propulsion as thermal protection systems (TPSs) and thermal/environmental barrier coatings (T/EBCs) [1,5,6,7], among others.
The focus of TPSs consists of structurally shielding engineering components from aerothermodynamic heating phenomena without causing significant weight penalties. Various advanced ceramics are being applied in TPSs, including ceramic matrix composites (CMCs), integrated thermal protection systems (ITPS), ultra-high temperature ceramics (UHTCs), and ultra-high temperature ceramic matrix composites (UHTCMCs) [1]. The most used CMCs are non-oxide CMCs, including carbon/carbon (C/C), carbon/silicon carbide (C/SiC), and silicon carbide/silicon carbide (SiC/SiC). Hybrid composites and composites with nanostructured reinforcements, like carbon nanotubes (CNTs) and graphene, have paved the way for further investigations [1]. Yang et al. (2019) [8] conducted topology optimizations of ITPSs based on thermo-mechanical constraints. Triantou et al. (2017) [9] performed a microstructural and thermal shock analysis of two hybrid TPS families for re-entry bodies composed of a CMC material (Cf/SiC and C/C-SiC) combined with ablative carbon-based carbon fillers (CBCFs), i.e., Cf/SiC + CBCF and C/C-SiC + CBCF joined with alumina, graphite, and ZrO2-ZrSiO4-based commercial adhesives. The work of Yang et al. (2019) [8] focused on the thermo-mechanical component, whilst Triantou et al. (2017) [9] evaluated microstructural and thermal characteristics. The authors also highlighted the relevance of the relationship between the microstructural features and the mechanical and thermal behavior of ceramic composites.
Thermal barrier coating systems (TBCs) consist of a structural surface modification technique encompassing an outer ceramic layer that safeguards the critical metallic substrates from challenging high-temperature environment damage such as thermal shocks, corrosion, erosion, oxidation, phase transformation, sintering, and calcium–magnesium–aluminosilicate (CMAS) attacks. Ceramic materials such as defect cluster oxides, perovskite oxides, pyrochlores, and oxides with a magnetoplumbite structure have been reported as possible candidates to replace the long-term state-of-the-art 6–8 wt.% yttria-stabilized zirconia (YSZ) [1,10,11]. Ejaz et al. (2018) [12] performed experimental research on the thermo-physical properties of calcium zirconate (CaZrO3) perovskite, neodymium-doped lanthanum zirconate (La0.75Nd0.25)2Zr2O7), and neodymium cerate (Nd2Ce2O7) pyrochlores and compared the obtained results with the state-of-the-art YSZ sample. Venkadesan et al. (2019) [11] focused their research on the aluminium oxide/yttria-stabilized zirconia (20% Al2O3/80% 8YSZ) and ceria/yttria-stabilized zirconia (20% CeO2/80% 8YSZ) for TBCs fabricated through atmospheric plasma spraying. Xu et al. (2015) [13] developed a hybrid system containing an EBC for the SiC/SiC-based CMC protection against chemical attacks and a TBC to safeguard against thermal loading of the CMC applied in hot sections of gas turbines.
Additionally, by combining characteristics such as piezoelectric and dielectric properties, aligned with corrosion and thermal resistance, electroceramics are obtained, which are applied in aircraft instrumentation and control systems, for example, in ignition systems, engine equipment monitoring systems, and instrument display systems. Shvydyuk et al. (2023) [14] studied ceramic composites for dielectric barrier discharge plasma actuators. It was shown that the MgO-Al2O3 ceramic specimens presented the best results for aerodynamic flow control applications, whereas the YSZ sample reached a higher surface temperature, thus being a good candidate for ice mitigation purposes. Furthermore, the commercial aircraft Boeing 777 exploited piezoceramics’ oscillation responses to measure the level of fuel in tanks through an induced pulsed electric field [14]. Khasare et al. (2023) [15] numerically proved that DBD plasma actuators’ active flow control methods have the potential to improve combustion quality and thereby lead toward greener combustion systems. Consequently, dielectric barriers based on ceramic composites for DBD constitute a strong enabler for aerospace aerodynamic and combustion efficiency improvement [16,17,18].
Nowadays, among the major classes of materials, advanced ceramics represent an enabling technology with the potential to deliver high-value contributions for meeting future aerospace propulsion needs and challenges [2,3,7]. Although advanced ceramics have been continuously explored in various interesting forms, a more in-depth ceramic-relevant rethinking of the existing structures is necessary, where the entire component—structural and functional performance—is taken into consideration to fulfill increasingly complex propulsion applications [1,2,3,7,15]. As a result, comprehensive ceramic development based on the trend concepts of multifunctionality and smart materials, followed by characterization and testing are required to push forward both the ceramic engineering field and market [1,2]. To that aim, this study focused on an experimental investigation of the microstructure–property (physical, mechanical, thermal, and dielectric) relationship of MgO-Al2O3 (MA), MgO-CaZrO3 (MCZ), and Y2O3-stabilized ZrO2 (YSZ) ceramic compositions for aerospace propulsion applications.

2. Materials and Methods

2.1. Sample Manufacturing

Commercial powders of alumina oxide (Al2O3, A, wt%: 99, Acros Organics, Belgium) and magnesium oxide (MgO, M, wt%: 96, Alfa Aesar, Ward Hill, MA, USA) served as the starting materials for the MgO-Al2O3 (MA: 1/3 MgO and 2/3 Al2O3) ceramics samples. Commercial calcium zirconate (CaZrO3, CZ, wt%: 99.2, Alfa Aesar, Ward Hill, MA, USA) and magnesium oxide (MgO, M, wt%: 96) powders were used for the MgO-CaZrO3 (MCZ: 1/3 MgO and 2/3 CaZrO3) ceramics. Likewise, commercial 3 mol% yttria-stabilized zirconia (t-3YSZ, wt%: 99.8, Tosoh-Zirconia, Tokyo, Japan), 8 mol% yttria-stabilized zirconia (c-8YSZ, wt%: 99.7, Tosoh-Zirconia, Tokyo, Japan), and monoclinic zirconia (m-ZrO2, wt%: 98.5, Acros Organics, Belgium) powders were employed for the preparation of the YSZ (1/3 t-3YSZ, 1/3 c-8YSZ, and 1/3 m-ZrO2) ceramic system.
The MA starting powders were milled for 6 h, whereas the MCZ and YSZ powders were milled for 3 h in 250 mL gridding bowls in a high-energy planetary mill (Fritsch, Pulverisette 6, Idar-Oberstein, Germany) at 500 rpm. The alumina (for MA) and zirconia (for MCZ and YSZ) bowls contained isopropyl alcohol (LabChem, Zelienople, PA, USA) as a media, and 1 mm diameter balls (Fritsch, Idar-Oberstein, Germany) were used, in a powder/alcohol/ball ratio of 1/1/2. The milling process was checked for quality control using the laser diffraction method (Beckman Coulter, LS200, Brea, CA, USA) in terms of particle size distribution (PSD). The ceramic mixtures were dried in a stove (Carbolite, NR200-F, Hope Valley, UK) at 50 °C for 24 h before sieving (Retsch, AS200, Haan, Germany) using a 63 μm mesh to collect the resulting milled mixture powders free of balls, agglomerates, and impurities. Uniaxial pressing was performed using rectangular (Instron 8800, 100 kN electromechanical actuator, Norwood, MA, USA) and cylindrical (Shimadzu, AGS-X, 50 kN electromechanical actuator, Kyoto, Japan) dies of high-strength steel for rectangular specimens (60 mm × 60 mm), and disc specimens (13 mm diameter) at 25 MPa. Sintering was carried out in an electrical furnace (Thermolab, MLR, Águeda, Portugal) using a heating rate of 5 °C/min up to 1200 °C with 120 min dwell for a rectangular plate that was then cut (Accutom-2, Struers, Hovedstaden, Denmark) into rectangular bars (5 mm × 5 mm × 50 mm) specimens. The obtained rectangular bars, in addition to the disc and extra plates specimens, were then sintered as follows: heating rate of 5 °C/min to the sintering temperature (1600 °C for the MA, and 1450 °C for the MCZ and YSZ ceramic composites) with a 120 min dwell. Finally, a polishing procedure was performed (Struers DAP-V, Hovedstaden, Denmark).

2.2. Sample Analysis

The microstructures were characterized through scanning electron microscopy (SEM) (Hitachi S-2700, Tokyo, Japan) by applying an accelerating voltage of 20 kV. For that aim, thermal etching was conducted for 30 min with 10 °C/min heating and cooling rates at 1440 °C (MA sample) and 1305 °C (for YSZ and MCZ samples). The fracture surfaces were obtained from the parts resulting from the flexural strength test. The surfaces were observed at low magnification and high magnification (5000× for CZM and 15,000× for MA and YSZ) from the face subjected to tensile (opposite to the application of the force) where the fracture was most likely to have started. All specimens, for microstructures and fracture surfaces, were coated with an ultra-thin gold layer using a turbomolecular pump coater (Emitech K550 Gold Sputter Coater, Quorum Technologies, East Sussex, UK).
X-ray diffraction (XRD) analysis was performed based on CuKα radiation on the ceramic bar specimens using a diffractometer (Rigaku DMAX III/C, Tokyo, Japan). Data were collected between 5° and 90° (2θ). The diffractograms were analyzed by comparison with the theoretical ASTM XRD cards #71-1176 for MgO, #46-1212 for Al2O3, #35-0790 for CaZrO3, #50-1089 for t-3YSZ, #49-1642 for c-8YSZ, #37-1484 for m-ZrO2, and #77-1193 for MgAlO4.
Apparent porosity, bulk, and relative densities were determined according to the ASTM C-20 standard [19]. Theoretical density values of the previously listed XRD cards were used to compute the relative densities of the ceramic composites.
Considering the thermomechanical reactions that occur during the sintering process, diametrical linear contraction (ASTM C179-04 [20]) was measured on the disc specimens as a result of their initial and final diameters.
Both dynamic Young’s and shear moduli were experimentally obtained based on the non-destructive impulse excitation technique (IET) applied on bar specimens of approximately 5.0 mm × 4.5 mm × 45 mm, according to ASTM C1198-20 [21] (GrindoSonic MK7, Heverlee, Belgium). For computation, a Poisson ratio of 0.25 was considered. Determination of flexural strength was performed according to ASTM C1161-18 [22], by applying the three-point test (Shimadzu, AGS-X, Kyoto, Japan) on bar specimens, with a crosshead speed of 0.5 mm/min, and an outer support span of 40 mm. Subsequently, similar broken parts resulting from flexural tests of the compositions were embedded in a two-part mixture of epoxy resin (EpoxiCure 2 Epoxy Resin, Buehler, Lake Bluff, IL, USA), and the surfaces were diamond polished down to 1 µm (Struers, Cleavland, OH, RotoPol-21, USA) to avoid minor scratches or imperfections. The samples were tested for hardness and fracture toughness via the indentation technique as described in the ASTM C1327–15 standard [23]. Measurements were performed using a Vickers hardness testing machine (Mitutoyo AVK-C2, Kanagawa, Japan) that applied 100 N for 15 s.
Considering the multifunctional characteristics of the advanced ceramics developed in this work, the mechanical evaluation of the MA, MCZ, and YSZ specimens in parallel with the microstructural and physical analyses was the first step in the extensive characterization process. It provides information on the structural capabilities of the manufactured ceramics for TPS and T/EBC applications in the propulsion field.
Thermal conductivity was computed through bulk density, thermal diffusivity, and specific heat experimental determination according to the non-destructive and non-contact laser flash analysis (LFA) standard test method ASTM E1461-13 [24]. For the evaluation of the thermal conductivity, the disc specimens (diameter of 12.55 ± 0.5 mm), were tested on a laser flash apparatus (LFA 457 MicroFlash, Netzsch, Bayern, Germany) after applying a high emissivity coating (Graphit 33 Spray, Belgium) on the ceramic specimens’ surface. The thermal conductivity of the ceramic samples was tested in a temperature interval ranging from room temperature of 30 °C up to 700 °C in an inert atmosphere. In addition, a reference material (Pyroceramic, Netzsch, Bayern, Germany) was also tested with the manufactured ceramic samples to compute the specific heat of the ceramic specimens and for calibration purposes. The coefficient of thermal expansion (CTE) was determined according to the ASTM E831-06 [25] standard test method (TMA 402 F1/F3 Hyperion, Reinland Pfalz, Germany) though the computation of the linear thermal expansion of the ceramics specimens when subject to a constant heating rate of 5 K/min from 0 °C to 950 °C in an inert atmosphere. The mean coefficient of thermal expansion was determined with a pretest applied load of 0.2 N. A reference material (Fused Silica, Netzsch, Bayern, Germany) was also used for accuracy assessment and calibration.
Electrical characterization was carried out after the deposition of circular gold electrodes (5 mm diameter) on both sides of the ceramic disks by sputtering (Polaron, model SC502 sputter coater) for 3 × 30 s at approximately 20 mbar and 20 mA. The dielectric response of the composites was assessed using a Quadtech 1920 by measuring the capacitance (C) and the dielectric loss (tan(δ)) in the frequency range of 500 Hz to 1 MHz at room temperature. The dielectric constant (ε′) was determined by considering the parallel plate condenser’s geometrical parameters (C = ε′ε0A/d, where A is the area of the electrodes and d the thickness of the sample). The margin of error in the dielectric measurements was approximately 2%, primarily attributed to geometrical factors. The A.C. electrical conductivity (σ′) was determined from the dielectric measurements by the following equation:
σ = ω ε 0 ε
where ω is the angular frequency, ε0 is the permittivity of the free space, and ε″ (=ε′/tan(δ)) is the frequency-dependent imaginary part of the dielectric permittivity.

3. Results and Discussion

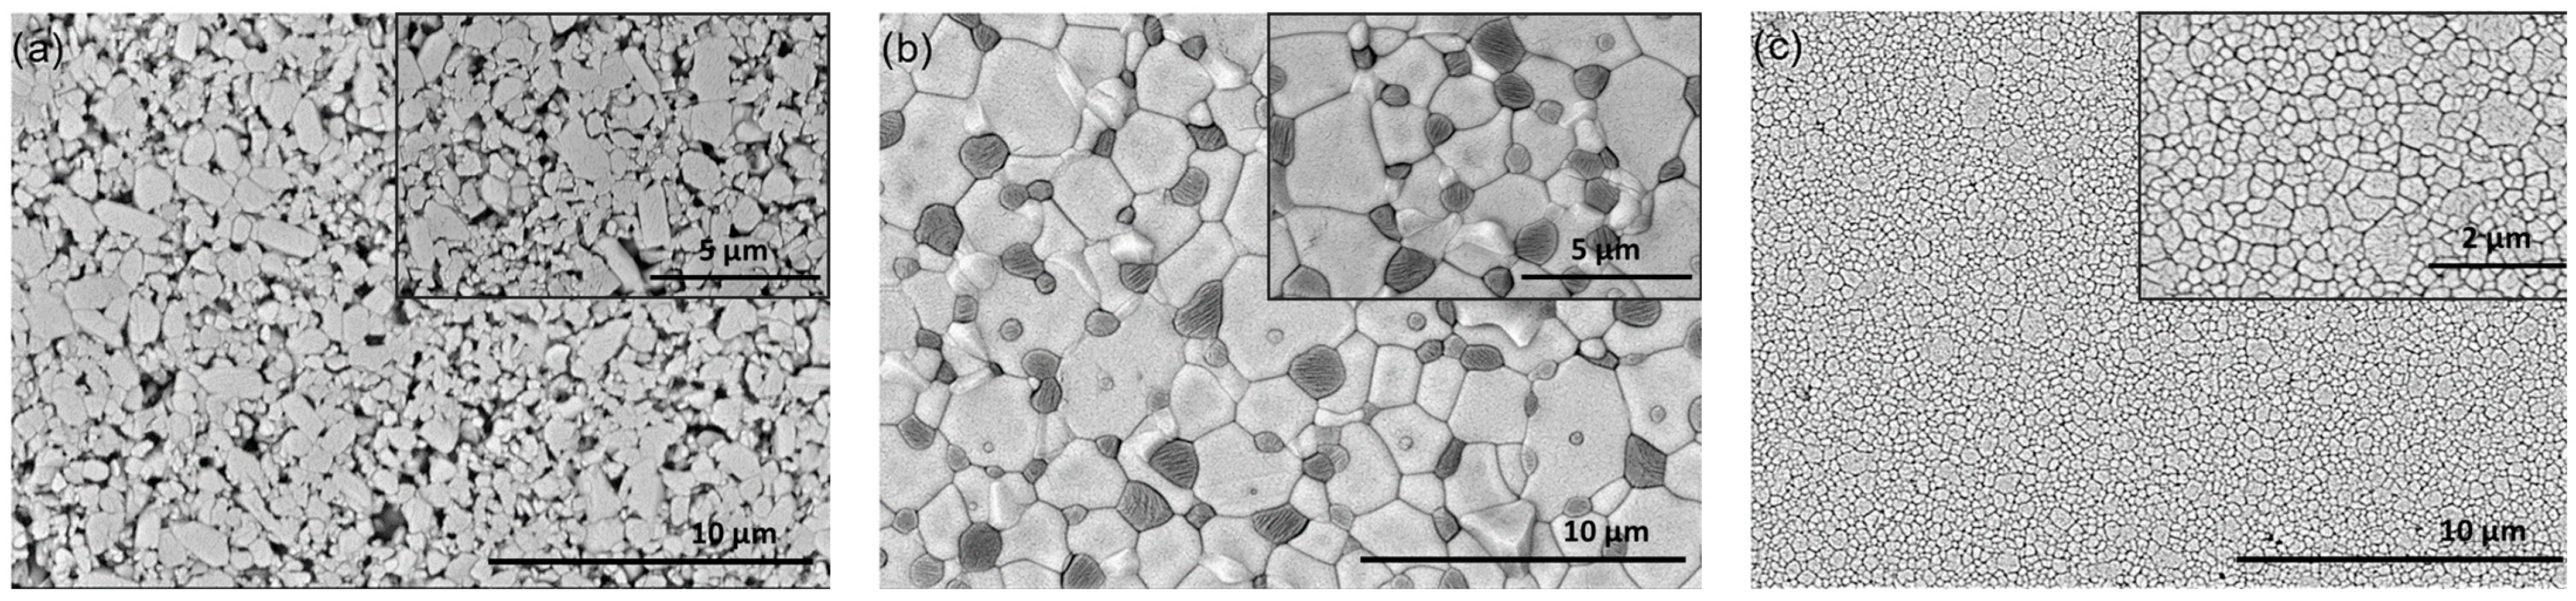
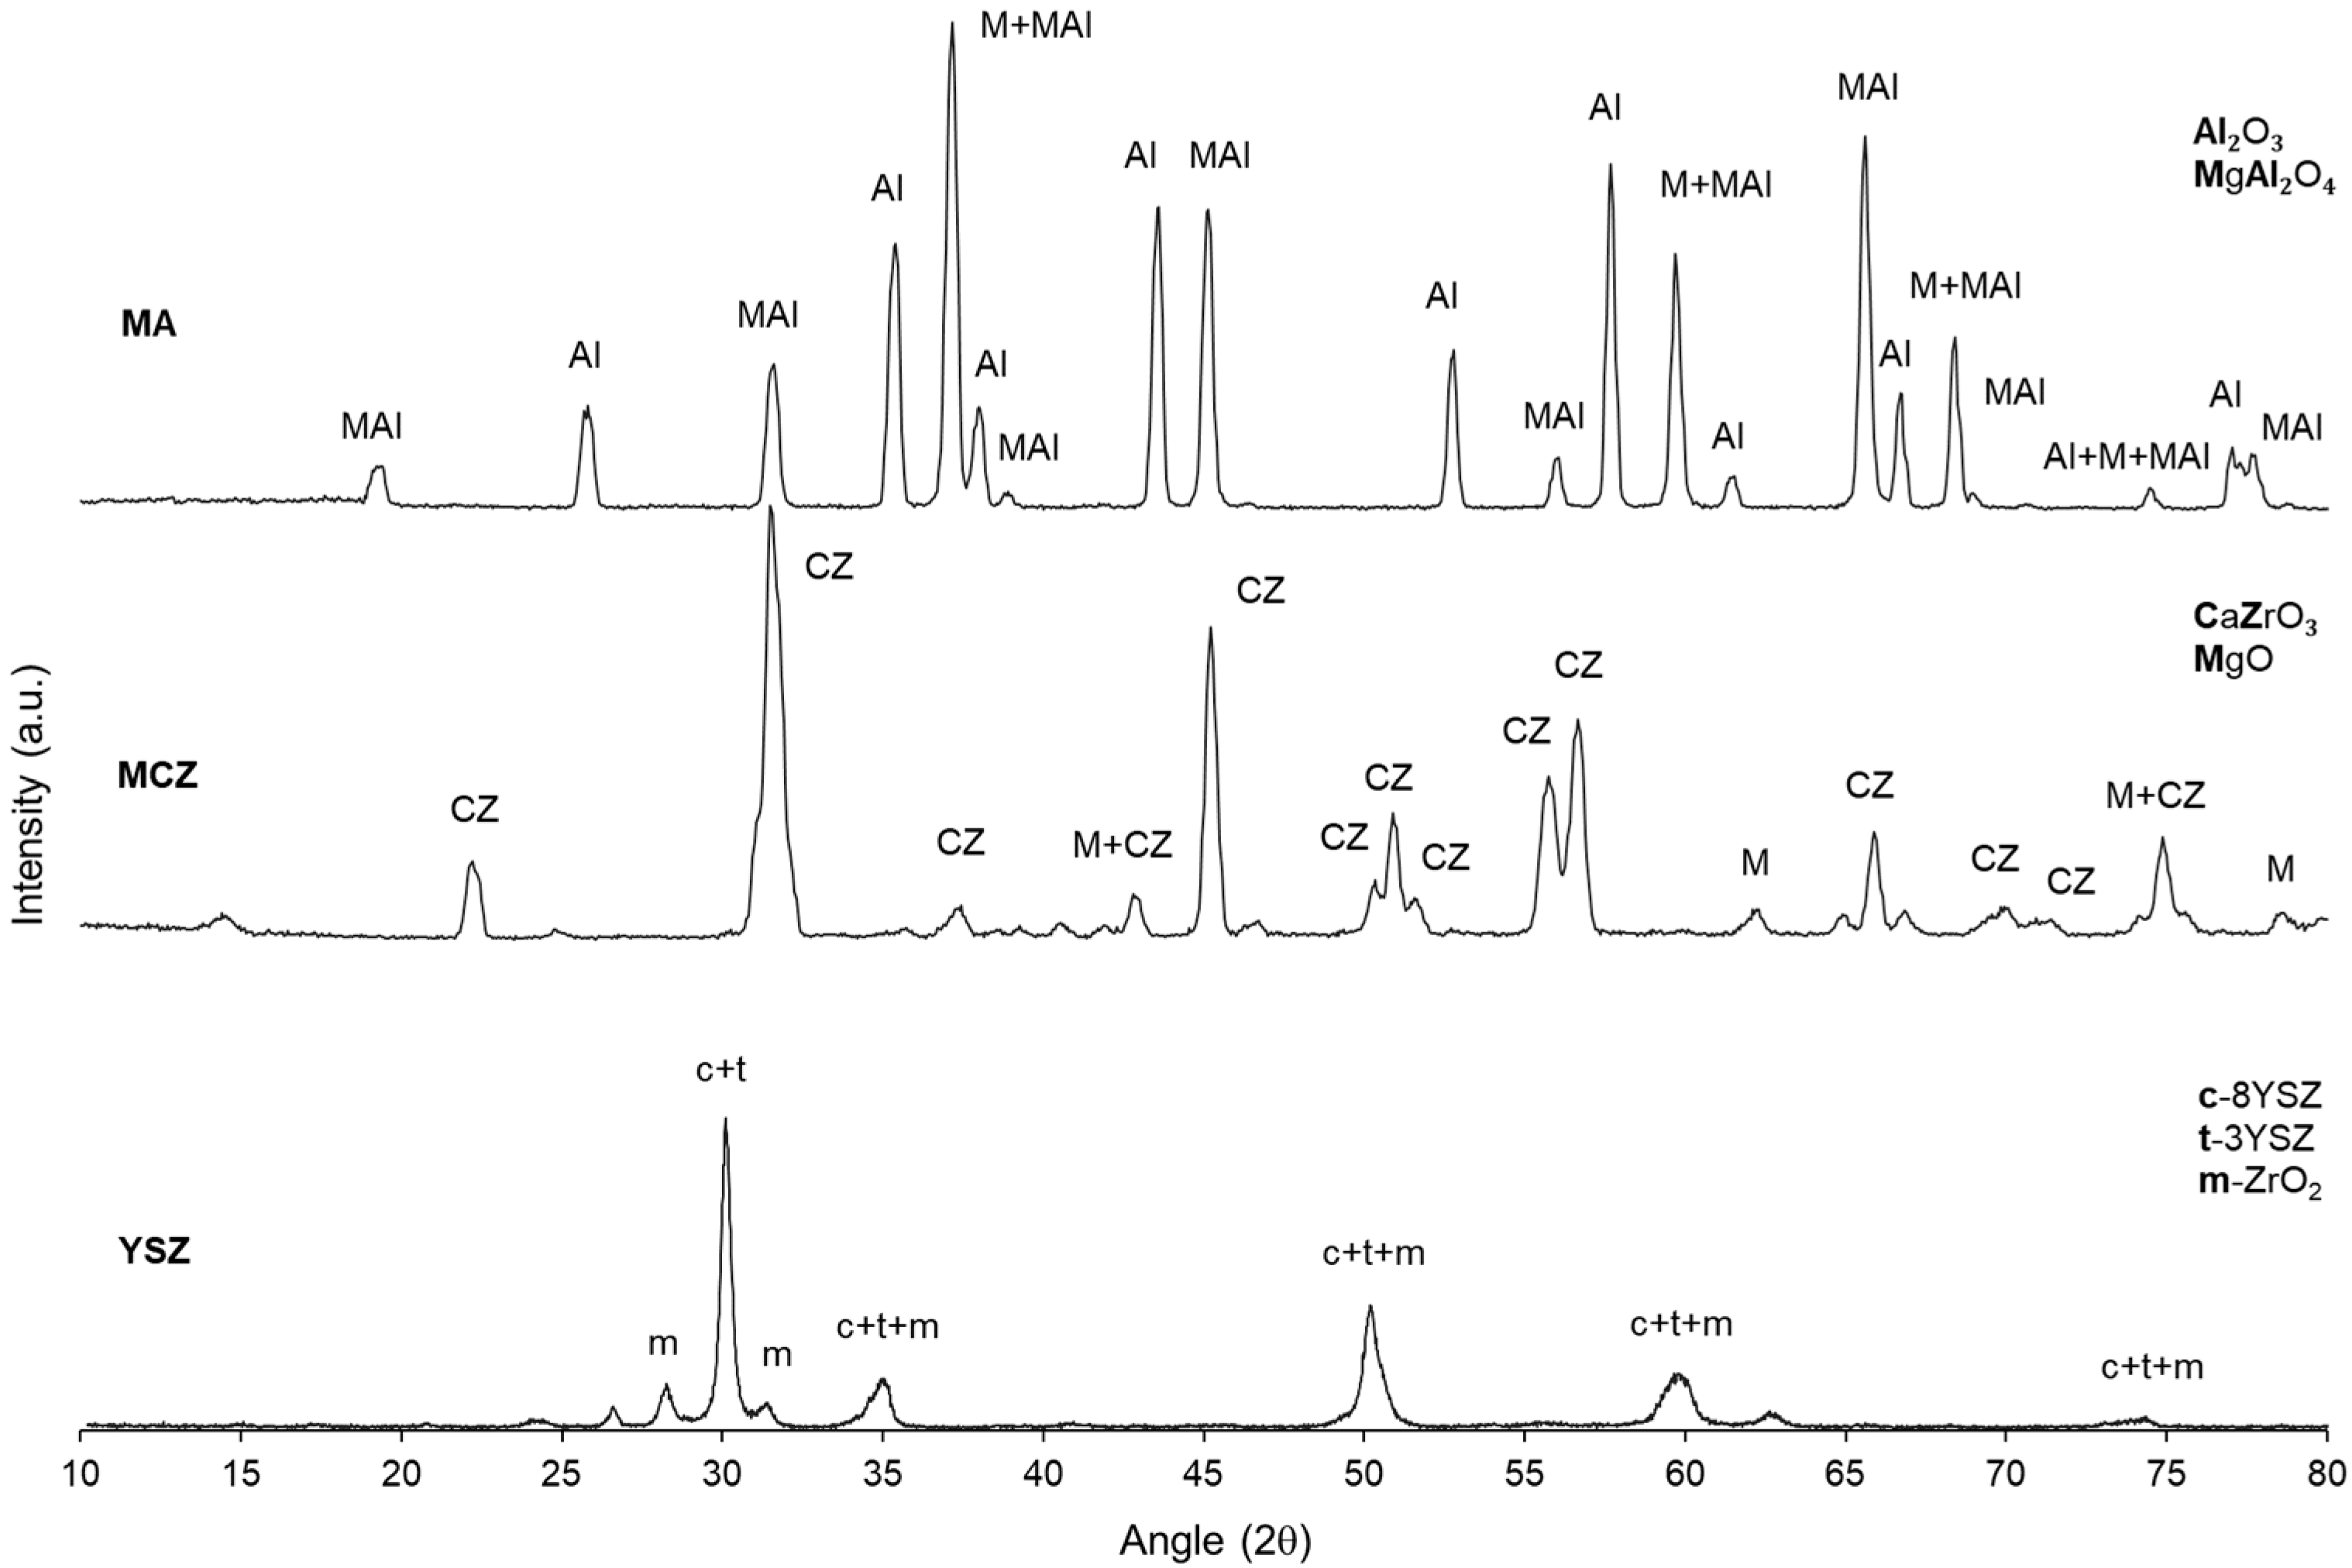
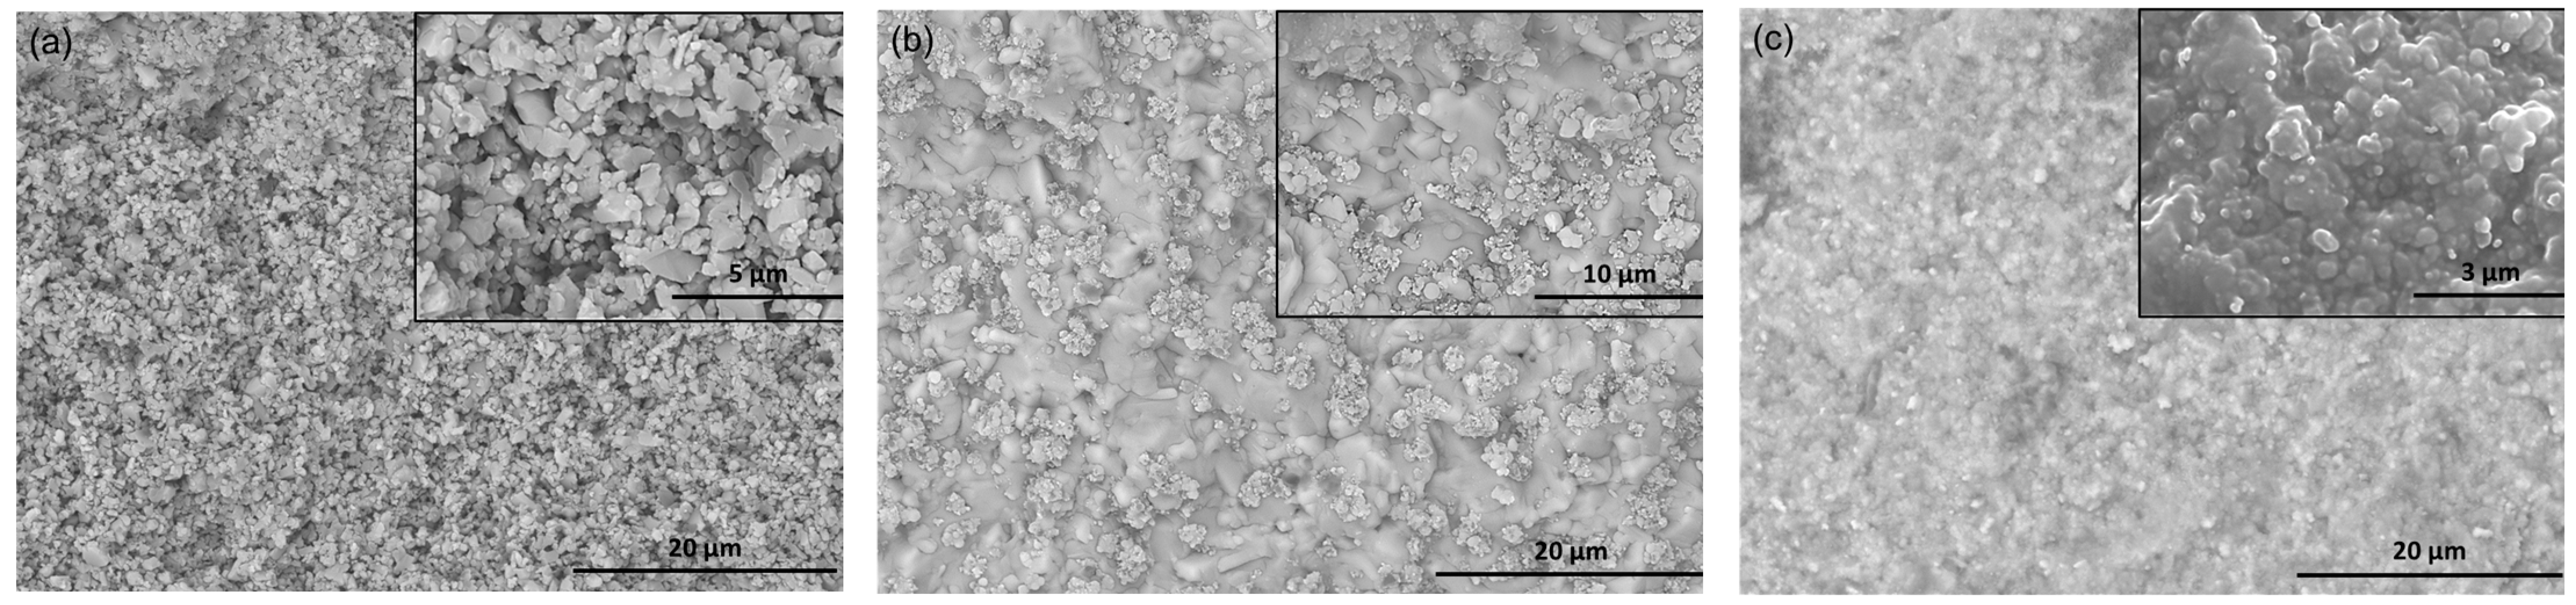
3.1. Particle Size Distribution and Microstructure

The MA, MCZ, and YSZ ceramic composite mixtures showed a similar initial PSD. After 6 h of milling, the MA mixture presented a d50 = 0.6 µm and a d90 = 1.8 µm. Moreover, after 3 h of milling, MCZ and YSZ showed a d50 = 0.8 µm and a d90 = 2.5 µm, and d50 = 0.9 µm and d90 = 1.6 µm, respectively. In short, PSD was conducted—throughout the fabrication stage—to obtain different microstructures with small grains and high repeatability.
Figure 1 shows the typical features of the alumina ceramic microstructure—characterized by a higher porosity, fewer points of contact among grains, and higher microstructure heterogeneity—and the zirconia-based MCZ and YSZ ceramics—with a greater compaction degree, i.e., densification of the material. Altogether the alumina micrographs show a multiformity of grains in size and geometry, which is illustrative of an incomplete sintering [26]. The grains were two typical sizes, the majority were small with a rounded and faceted shape, with a size up to 0.5 μm, and the others were larger with an elongated shape, with a width of up to 1 μm and length up to 1.8 μm.
By comparing the alumina- vs. zirconia-based ceramics, it is evident that the milling process of MCZ and YSZ produced a notably homogeneous grain size distribution, which, in turn, contributed to a higher densification of the ceramic. The YSZ grains were round, with most of them smaller than 0.3 μm, and some larger ones were up to 0.8 μm. The MCZ microstructure features were characterized by larger light gray grains as well as smaller dark rough texture grains, corresponding to calcium zirconate and magnesium oxide, respectively. More specifically, the MCZ presented faceted grains of calcium zirconate up to 3 μm, and smaller and dark ones of magnesium oxide up to 1.2 μm oxide. Moreover, there was no evidence of empty pores, nor intergranular and intragranular microfractures. In contrast, distinct grain sizes and contours, i.e., the boundary between two adjacent grains, were visible.
The XRD results (Figure 2) provide quality assurance by validating the compositions of the obtained specimens. For MA, various intensity peaks were identified, the majority of them corresponding to Al2O3 (2θ of 26°, 35°, 44°, and 58°) or MgAl2O4 (2θ of 45°, 65°). In the MCZ sample, the majority of the diffraction peaks coincide with CaZrO3 (2θ of 32°, 45°, 56°, and 58°), and a few with MgO (62° and 79°). The YSZ analysis exhibited that all three phases, i.e., c-8YSZ and t-3YSZ, (2θ of 30° and 50°) and m-ZrO2 (2θ of 28° and 32°), were similarly abundant.
Different ceramics—MA, MCZ and YSZ—with different microstructures and compositions were manufactured, and therefore, different physical properties are expected. More specifically, MA ceramics showed a relatively high porosity of approximately 7%; on the other hand, both MCZ and YSZ zirconia-based ceramics exhibited very low porosity—less than 0.05% porosity. Regarding the density data, for MA, the compaction process was lower than expected. Consequently, both its bulk (2.79 g / c m 3 ) and apparent (2.66 g / c m 3 ) densities were considerably lower that the theoretical value of 3.92 g / c m 3 that was used as a reference. For MCZ, compared to the theoretical density value of 4.49 g / c m 3 , the bulk density of 4.48 g / c m 3 was considered similar to the reference, as well as the apparent density of 4.52 g / c m 3 . Lastly, YSZ showed an excellent densification during the sintering phase, with similar bulk and apparent densities (5.88 g / c m 3 and 5.89 g / c m 3 ), which are close to the theoretical density of 6.00 g / c m 3 . The results are presented as an average of five measurements and the standard deviation was less than 1%.
Table 1 summarizes the diametric linear contraction ( C d ) of the specimens as a result of three measurements of each of the three ceramic composites sintered—MA, MCZ, and YSZ.
During the sintering process, MA underwent the lowest C d value of 13.0%, followed by MCZ and YSZ (24.0% and 27.4%, respectively) (Table 1). Somton et al. (2020) [26] studied the shrinkage and properties of die-pressed alumina produced from different powders sources, and achieved a contraction between 14.4% and 18.0%. Similarly, Shui et al. (2002) [27] verified that, in the height and diameter directions, alumina-based ceramic showed linear contraction values between 15 and 20%. Since the 13.0% for the MA is slightly out of the range of the values found in the literature, this is justified by the incomplete densification of the powders during the sintering process at 1600 °C. Szczerba et al. (2011) [28] studied the synthesis of spinel and calcium zirconate by sintering natural dolomite, zirconia, and alumina. The materials showed a shrinkage of about 20% and 22% at 1500 °C and 1600 °C. Thus, it is concluded that for the MCZ ceramic composite sintered at a temperature of 1450 °C, a diametrical linear contraction of 24% is quite achievable for high-purity MgO (96%) and CaZrO3 (99%) powders. Lastly, the measured YSZ diametrical linear contraction was 27.4%. Hu and Wang (2010) [29] reported the effect of different sintering temperatures in yttria-stabilized zirconia’s compressive strength as a potential heat-insulation material. All in all, the variation in linear shrinkage of the YSZ samples increased from 15.4 to 31.8% as the temperature increased from 1350 °C to 1550 °C. The authors highlight that between 1400 °C and 1450 °C, the shrinkage rate was the most prominent.

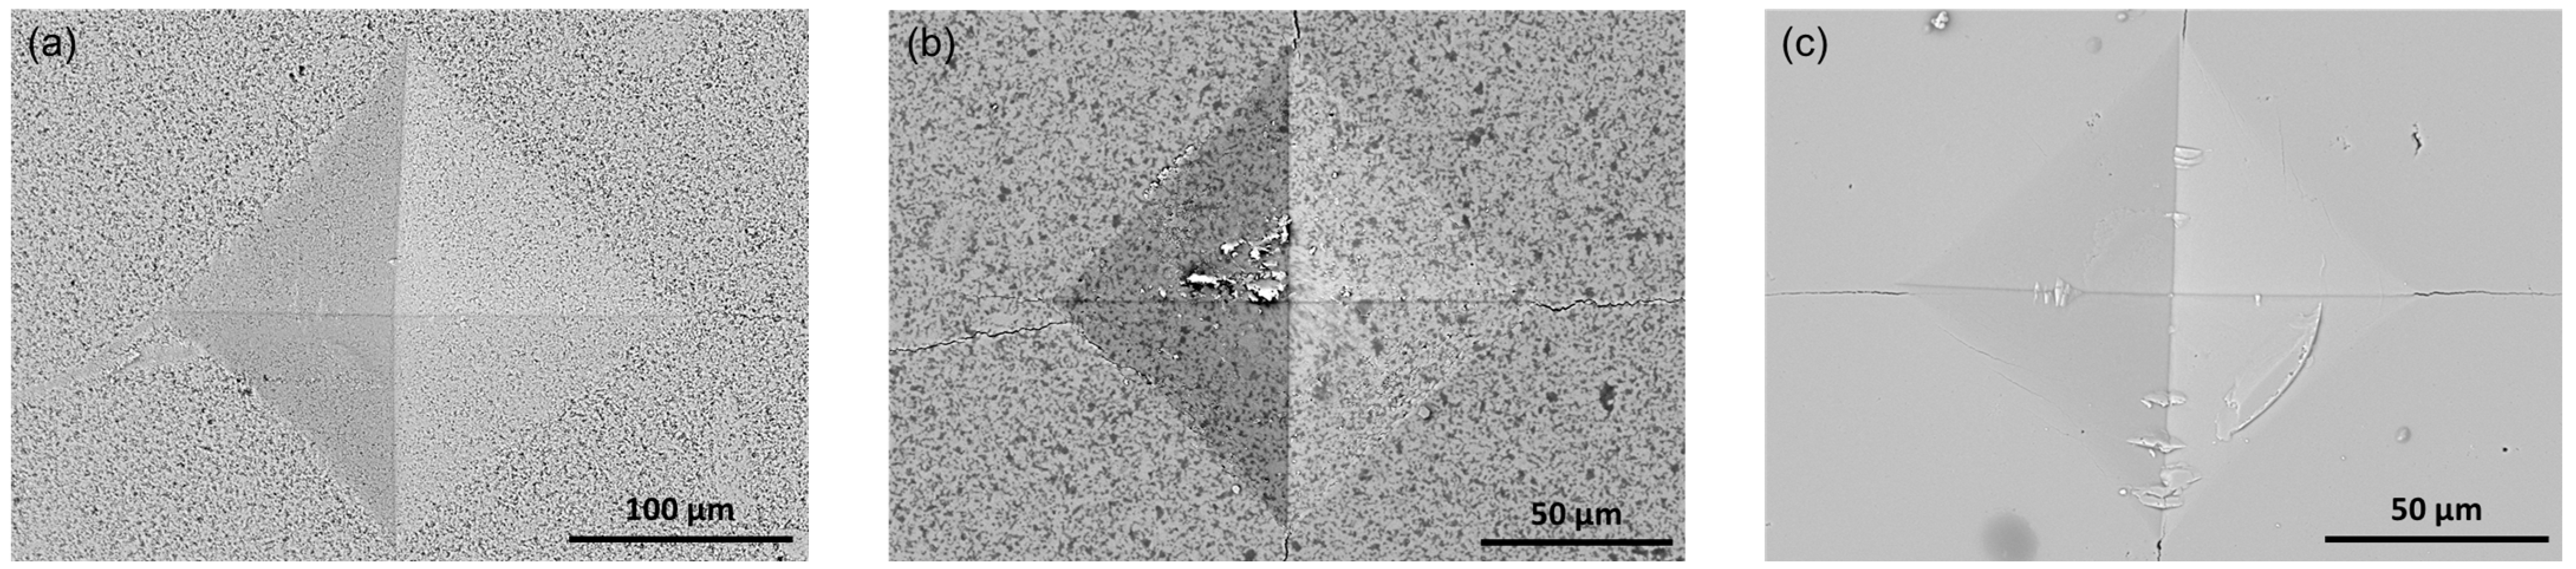
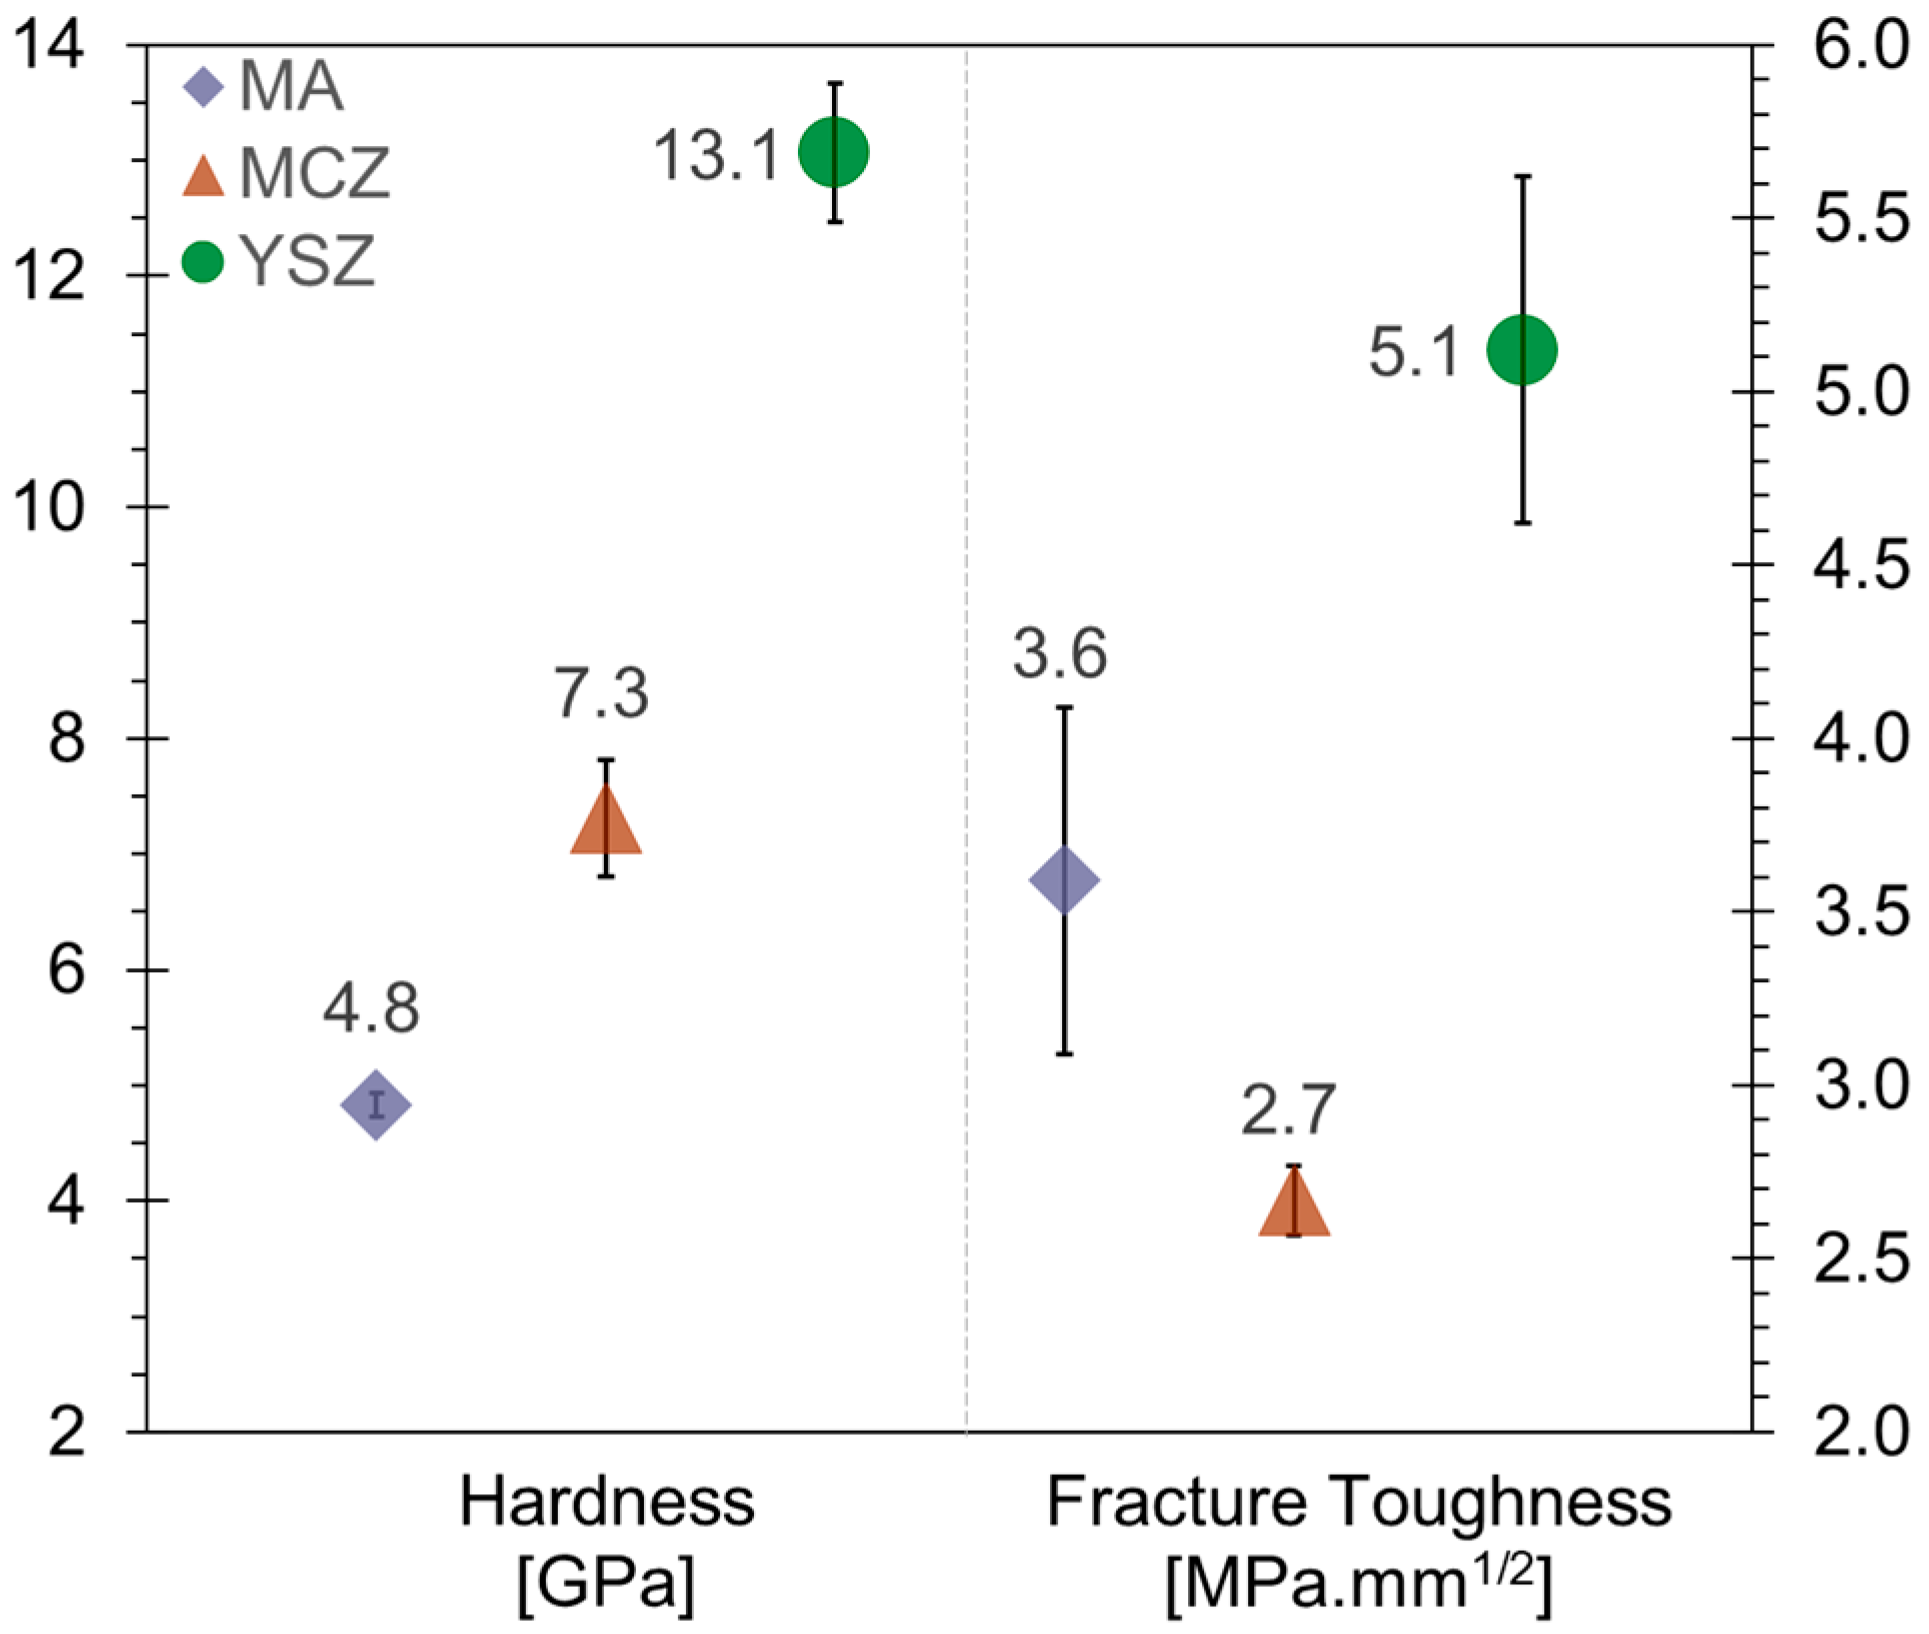
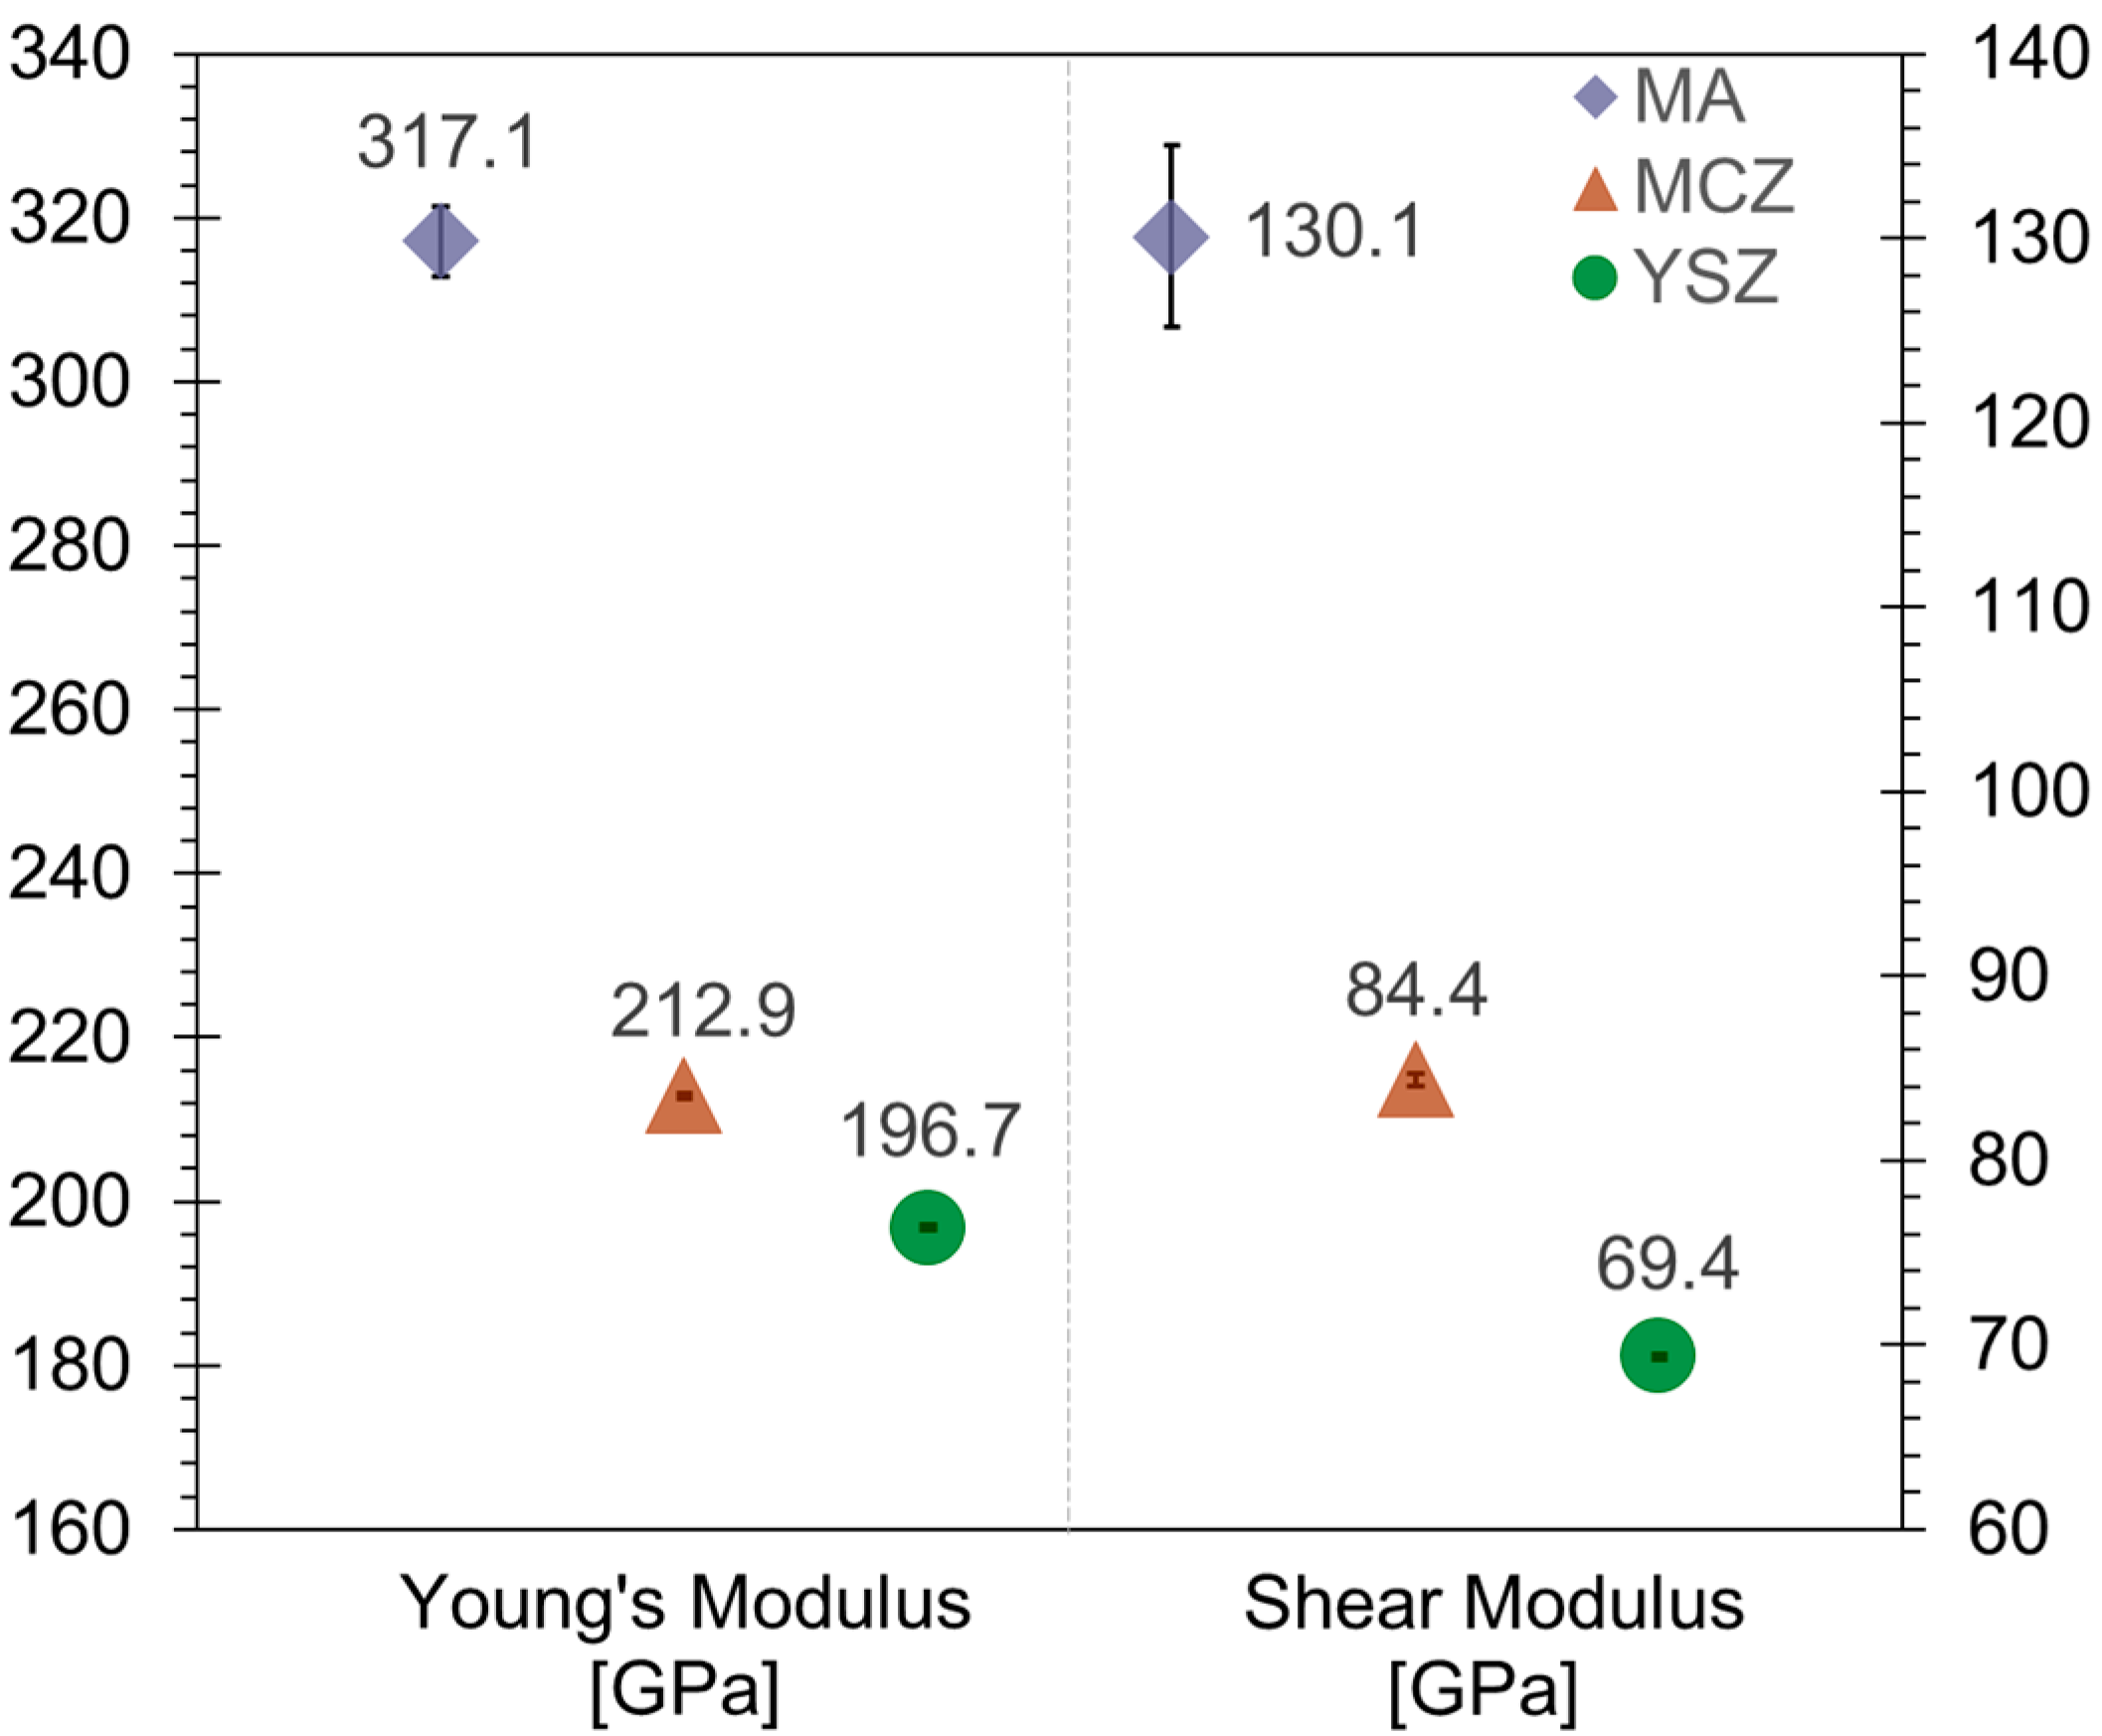
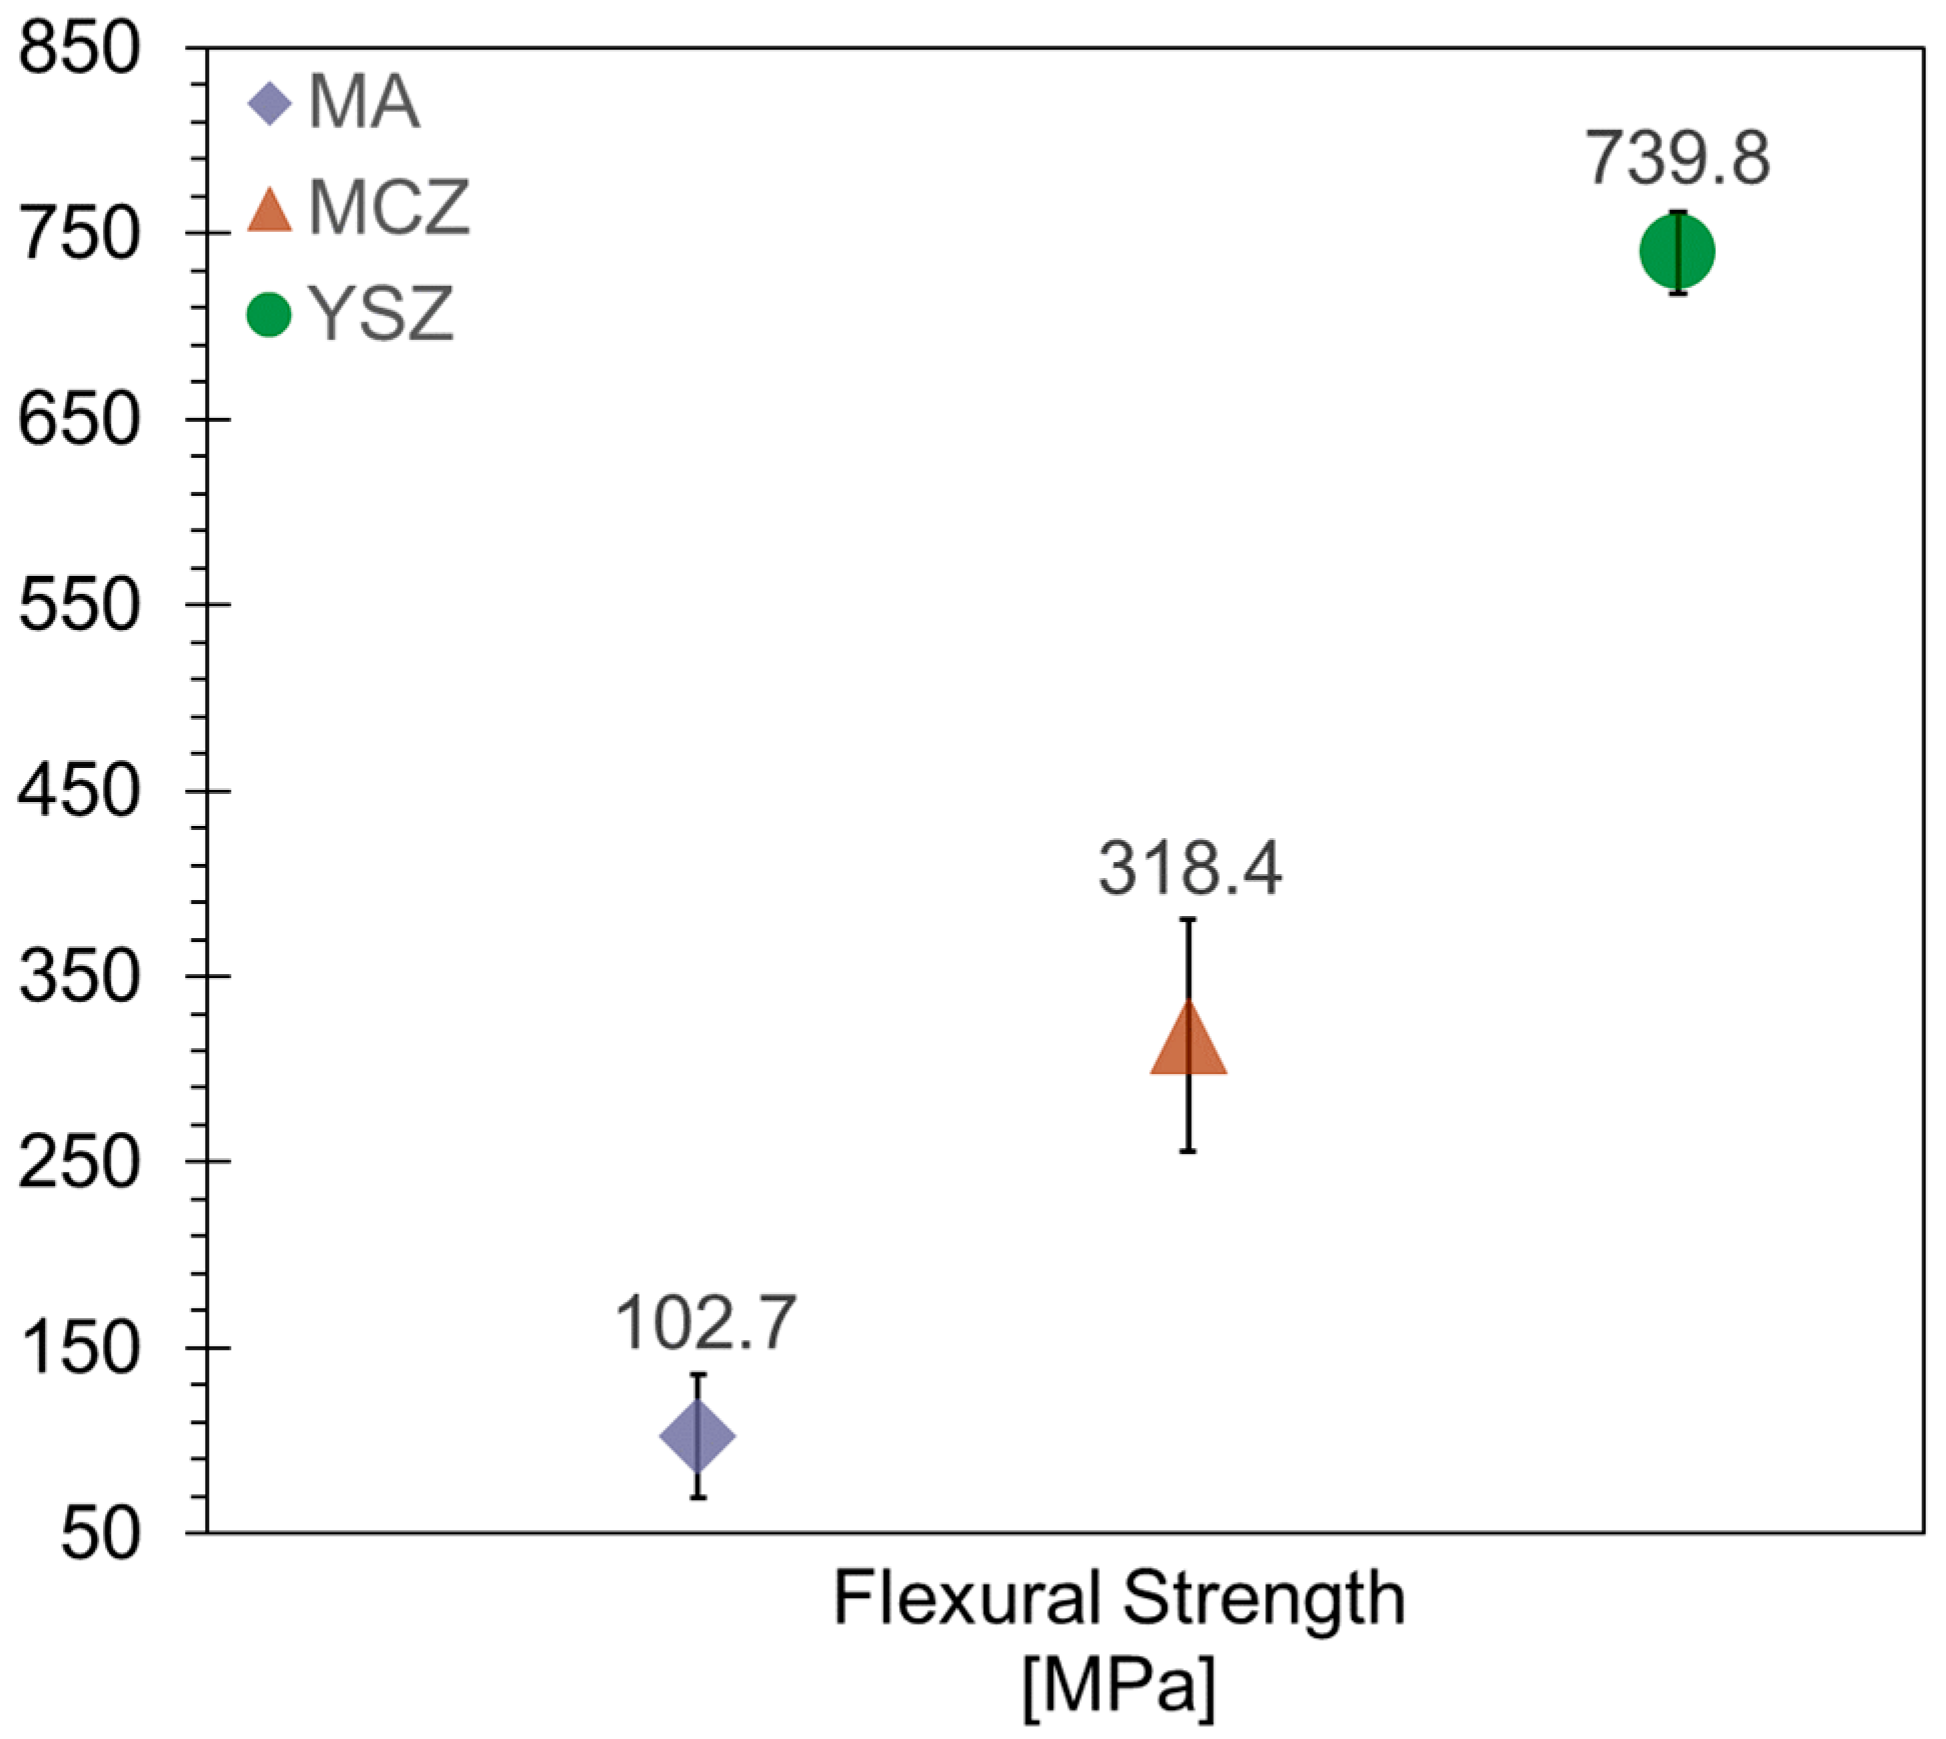
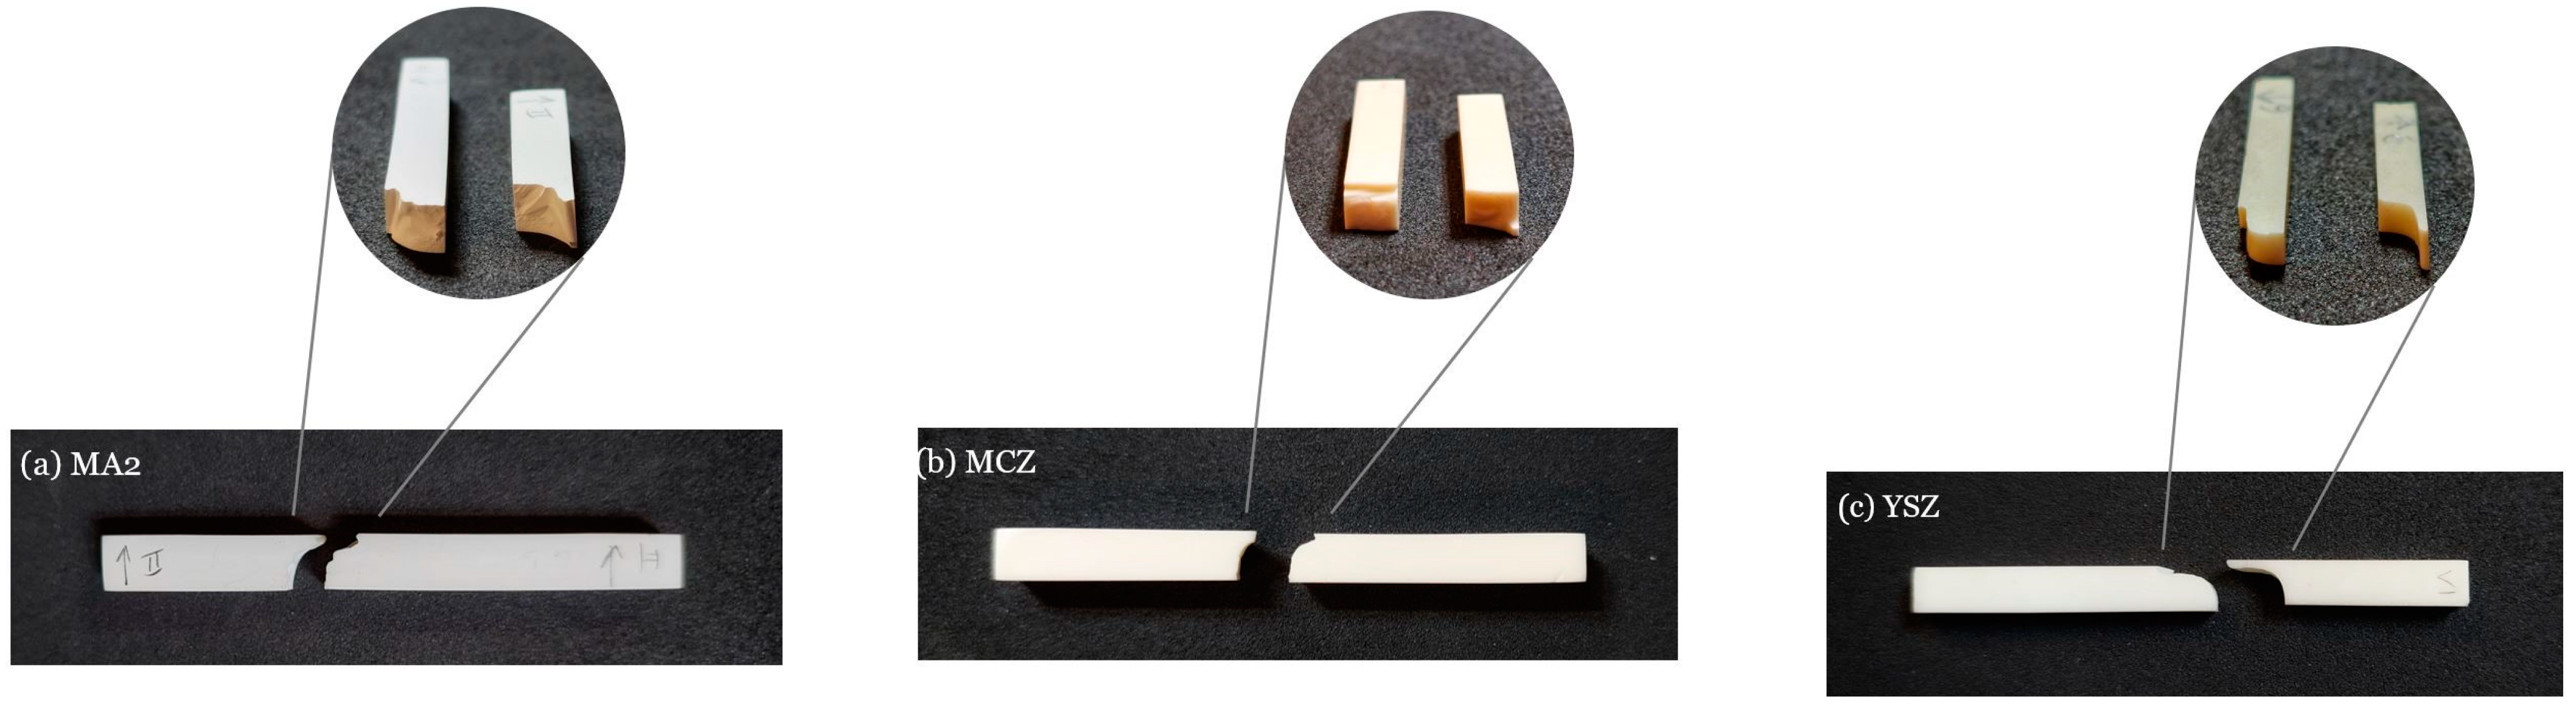
3.2. Mechanical Properties

In both functional and structural ceramics, the mechanical properties of the developed materials are of fundamental importance, as first and foremost, among other features, engineering ceramics are characterized by their high hardness, high wear, and corrosion resistance. However, a significant predisposition to brittle fracture and low endurance limits their applications.
Figure 3 shows the Young’s and shear moduli of the manufactured ceramics, measured by the impulse excitation technique at room temperature. It was shown that MA’s 317 GPa Young’s modulus strongly surpasses in magnitude the rest of the systems produced (213 GPa and 197 GPa for the MCZ and YSZ ceramic composites, respectively). Similarly, the MA ceramic showed a higher shear modulus value (130 GPa) than the rest of the zirconia-based materials (84 GPa and 69 GPa for MCZ and YSZ, respectively).
It must be strongly emphasized that, in the literature, it is well established—both experimentally and analytically—that there is a porosity dependence for materials’ properties. In particular, porosity in brittle materials, i.e., ceramics, can have significant drawbacks for their physical properties, including mechanical, thermal, and electrical features [30,31]. Moreover, in multiphase materials, additional complexity is added to the so-called modulus–porosity relationship since there may be divergent responses from the characteristic single ceramic composite’s phases. In short, the porosity dependence of materials’ properties is a large and complex field that has a great impact on materials’ elastic properties. Hence, it plays a key role in dictating the mechanical response of ceramic materials [32].
The elastic properties of polycrystalline materials are commonly envisioned to be isotropic. Under such conditions, the elastic properties—elastic modulus, shear modulus, bulk modulus, and Poisson’s ratio—have well-known relationships, i.e., given by the theory of elasticity. It is emphasized that for a more detailed description of these relationships, Munro (1997) [33]’s article is advised. Furthermore, Phani and Sanyal (2008) [34] studied the relationships between the elastic properties—shear modulus, bulk modulus, and Young’s modulus—for porous isotropic ceramic materials. By plotting the variation in the shear modulus with Young’s modulus (i.e., G versus E) for various porous materials including more than twenty-five datasets retrieved from the literature, the authors concluded that a similar relationship of the rough proportionality of G / E = 0.375 for polycrystalline metallic materials may also exist for ceramic porous materials. The derived relationship indicates that, if we ignore the variation in Poisson’s ratio with porosity, then G / E becomes constant for a material. For the oxide materials studied, a proportionality of the G / E interval ranging between 0.369 and 0.424 was provided. Considering the experimental Young’s and shear moduli values obtained for MA, MCZ, and YSZ, the relationship between these parameters was approximately 0.410, 0.396, and 0.353, respectively, which are consistent with the proportionality values derived in the Phani and Sanyal (2008) [34] study. Figure 4 depicts the flexural strength of the MA, MCZ, and YSZ sintered ceramic systems.
Figure 4 depicts that a reverse sequence of results was obtained, i.e., YSZ specimens showed the highest flexural strength with a magnitude of approximately 740 MPa, followed by the MCZ samples at approximately 318 MPa, and lastly MA at 103 MPa. Additionally, the largest dispersion achieved in the experimental results was somehow expected since the flexural strength is heavily dependent on microcracks and/or internal flaws of the specimens, as well as on the quality of their surfaces.
Based on the literature and commercially available datasheets for dense MA ceramic samples, a very low experimental flexural strength was determined. Heimann (2010) [35] indicates a range varying between 280 MPa and 420 MPa. In turn, Otitoju et al. (2020) [2] point out a value of 379 MPa, whereas the commercial datasheets suggest an interval of 310–455 MPa [36,37]. On the other hand, for alumina with a purity of 99% and 1–5% porosity level, Auerkari (1996) [38] reported a drop for the lower limit of the interval range of flexural strength of 150 MPa. Therefore, it is not unexpected that for the MA specimens with a considerably high porosity, the flexural strength parameter would be highly impacted, and its value in magnitude was greatly diminished. For the MCZ ceramic composites, a much higher flexural strength was recorded when compared to alumina-based ceramics. Bearing in mind that in investigations on MgO–CaZrO3 mixtures, slightly lower figures—compared to the ones experimentally obtained in this work, i.e., 318 MPa (with an apparent porosity of 0.05 ± 0.05)—were reported by Cabral (2021) [39] and Mamede et al. (2022) [40]: 270 MPa (with an apparent porosity of 0 ± 0.1%) and 251 MPa (with an apparent porosity of 0.03 ± 0.1%), respectively. The differences of around 15–18% may be justified by the chemical composition of the samples studied. Both Cabral (2021) [39] and Mamede et al. (2022) [40] investigated MgO–CaZrO3 mixtures with 22.5 vol.% MgO and 77.5 vol.% CaZrO3. The magnesium-doped calcium zirconate ceramic composites manufactured, as described in sample manufacturing section, had 12.7 vol.% MgO and 87.3 vol.% CaZrO3. In other words, here, the authors used a higher content of magnesium oxide. Lang et al. (2018) [41] studied the effect of MgO on the thermal shock resistance of CaZrO3 ceramics. Four batches containing 0 wt.%, 2 wt.%, 4 wt.%, and 8 wt.% were fabricated by solid-state reactions and further mechanically and thermally analyzed. It was concluded that, by adding MgO dopant, the flexural strength of the specimens at room temperature was improved due to grain refinement. However, after undergoing thermal shock, the samples with a higher content of MgO proved to be more prone to microcracks due to mismatches in thermal expansion coefficients between MgO and CaZrO3 ( 13.8 × 10 6 / ° C and 10.4 × 10 6 / ° C , respectively). This study, therefore, suggests that, in the course of the sintering process, the residual strength of the MgO–CaZrO3 specimens of Cabral (2021) [39] and Mamede et al. (2022) [40] was lowered due to the emergence of internal microcracks. Consequently, the highest flexural strength value of 318 MPa—with a lower content of MgO dopant—is very much plausible. Lastly, the YSZ samples showed the greatest flexural toughness among the studied ceramic composites. According to the Tosoh powder manufacturer datasheet [42], yttria-stabilized zirconia may achieve a bending strength of 1200 MPa, whereas Heimann (2010) [37] indicates a range between 900 MPa and 1300 MPa for commercially available zirconia with an yttria content of 3–5%. Amarante et al. (2019) [43] evaluated the flexural strength of yttria-stabilized zirconia specimens with different surface finishings. For polished surfaces, 3 mol% YSZ from the VIPI Block Zirconn Translucent manufacturer showed an average flexural strength of 861 ± 81 MPa. Further, White et al. (2005) [44] obtained a flexural module of rupture of 786 MPa for a solely zirconia layered beam. The authors reported a significant discrepancy between the manufacturer’s technical specifications and the experimentally obtained data (1272 MPa versus 786 MPa). Based on these figures, it was concluded that the value of 740 MPa for the YSZ ceramic composite in this study was therefore within the characteristic range for this material.
For visualization purposes, Figure 5 shows the fracture geometries of the specimens after testing from the top and side views for better fracture profile visualization.
Figure 6 shows characteristic Vickers imprints for the three ceramic composites. In all cases, symmetrical imprints covered a significant area of the specimens with large numbers of grains, with well-defined edges. Therefore, the imprints were adequate for the determination of Vickers hardness. In particular, in the MA composites, it can be seen that the region subjected to the compression force (Vickers imprints) had a reduction in porosity, i.e., part of the compression energy was used to densify the area below the indenter, thus justifying the lower hardness value.
Figure 7 shows the Vickers hardness and the fracture toughness of the different manufactured ceramic systems. The hardness parameter measures the resistance of the material to plastic deformation, which may potentially incorporate effects such as material displacement and fracture [33]. In ceramic materials, Vickers hardness is of high importance since it allows for the assessment and evaluation of the wear, abrasion, and friction resistance of the surface and structure. In turn, fracture toughness is used to assess the resistance to the extension of cracks in a material [33].
By studying the graph in Figure 7, it is possible to infer that of the three ceramic compositions investigated, YSZ showed the highest value of hardness (13.1 GPa), followed by MCZ with 7.3 GPa and, lastly, MA showed the lowest experimentally obtained value of 4.8 GPa. For the fracture toughness parameter, a different tendency was registered when compared to the Vickers hardness. In other words, the ability of a material to resist the propagation of flaws under applied stress was highest for YSZ with a magnitude of approximately 5.1 MPa·mm1/2, followed by MA at 3.6 MPa·mm1/2, and lastly, MCZ showed the lowest experimentally obtained value of 2.7 MPa·mm1/2.
The experimental data presented in Figure 7 must be carefully discussed on the following grounds. The average hardness value recorded for the alumina ceramic composites was considerably lower. Based on other investigations and commercially available alumina, the hardness value of this material should fall within a range of 15–22 GPa [33,36,45,46,47,48]. The porosity content of 7% present in these ceramic samples determined the results. Moreover, even if considering the lowest Vickers hardness value of MgO of 12 GPa [49], this doping material feature was not able to lower the final sintered ceramic composition hardness to the degree described.
In their article, Ternero et al. (2021) [50] discussed the influence of the total porosity on the overall properties of the sintered materials. It is contextualized that, for the indentation hardness study, whenever porosity is detected in a material, it is necessary to differentiate between true hardness and apparent hardness. The apparent hardness, in contrast to the true hardness, considers the effect of porosity. In the present work, the experimentally obtained hardness was 4.8 GPa due to the incomplete sintering process and incompletely compacted ceramic. In other words, the porosity filling beneath the loaded indenter compromises the Vickers hardness indentation testing, analysis, and, ultimately, the relevance of the method itself. Further, the MCZ’s hardness value of 7.3 GPa showed a more confident value when compared to other studies. For instance, Nunes-Pereira et al. (2020) [49] reported a Vickers hardness of 7.5 GPa and 7.8 GPa for CaZrO3-MgO composites sintered at temperatures of 1450 °C and 1500 °C. In line with these results, Mamede et al. (2022) [40] reported an experimental hardness value of 7.8 GPa for a CaZrO3-MgO composition with 0.02% porosity. As a result, it was concluded that the relative hardness of the MCZ ceramic composite, with a porosity of 0.05%, was quite achievable and valid. For the YSZ ceramic composite, the highest value of Vickers hardness was recorded (13.1 GPa). Balça (2022) [51] investigated several YSZ compositions and reported slightly lower values of about 10–11 GPa. According to the Tosoh powder manufacturer datasheet, YSZ’s typical hardness is 12.5 GPa [42]. Other datasheets [47,48] of commercially available YSZ ceramics point out a 12–14.5 GPa interval range. Thus, the value obtained for the fabricated ceramic samples is in line with these values.
In particular, for MA, a fracture toughness of 3.59 MPa·mm1/2 agrees with the values mentioned in the literature. At room temperature, Heimann (2010) [35] reported a range of 3–4 MPa·mm1/2 for the fracture toughness parameter of high-alumina ceramics. Additionally, Auerkari (1996) [38] showed that engineering alumina of 99% purity and a porosity content of 1–5% have a fracture toughness of about 3.5–5.5 MPa·mm1/2. Some commercially available manufacturers point out an interval varying from 3 to 5 MPa·mm1/2. Based on the diversity in fracture toughness data and considering the 7% porosity, the MA’s fracture toughness seems appropriate. The fracture toughness of 2.67 MPa·mm1/2 of MCZ is consistent with the one reported by Nunes-Pereira et al. (2020) [49] for CaZrO3-MgO ceramic composites, with values of 2.6 and 2.5 MPa·mm1/2 for sintering temperatures of 1450 °C and 1500 °C, respectively. In addition, Cabral (2021) [39] studied the enhancement of the mechanical resistance of CaZrO3-MgO for a pure standard sample, and indicated an experimentally achieved fracture toughness of 2.30 MPa·mm1/2. Consequently, and bearing in mind possible experimental fluctuations, the MCZ fracture toughness parameter is considered to be consistent with the ones reported by other investigations. In summary, the remaining ceramic composite, YSZ, as mentioned previously, recorded the highest value among all fabricated ceramics at 5.12 MPa·mm1/2. Studying the same compositions, i.e., 33.3 wt.% t-3YSZ, 33.3 wt.% c-8YSZ, and 33.3 wt.% m-ZrO2, Balça (2022) [51] recorded slightly a lower value of 4.09 MPa·mm1/2. Datasheets of the manufacturers of the powder used, however, indicate an optimum value of 6.0 MPa·mm1/2 [42]. It should be noted that the three-phase ceramic system YSZ presents an interesting composition in which the monoclinic, tetragonal, and cubic phases are ubiquitous. Consequently, it is expected that slight variations may prevail. Additionally, experimental deviation always occurs due to several different factors, the 5.12 MPa·mm1/2 values achieved is thus considered an interesting result for YSZ’s fracture roughness feature.
In a previous research work in our group [51], a design of experiments (DoE) was used to assess the effect of ternary composition based on t-YSZ, c-YSZ, and m-ZrO2. An arrangement with a ternary simplex and a centroid was used, i.e., with a point in the center (seven independent compositions). It was found that the presence of the monoclinic phase (m-ZrO2) in the composition, albeit in limited quantities, increases the fracture toughness of the ceramic composite due to crack deflection. In Balça [51]’s research, the deflection of cracks was proven in compositions with a significant percentage of m-ZrO2 (up to 33.3%) where short cracks with a tortuous path were observed (higher fracture toughness), while compositions with a low content of m-ZrO2 (5%) has long, linear cracks (lower fracture toughness).
When the crack is diverted from its straight path, the energy required to propagate it increases, increasing the ceramic’s fracture toughness [52]. The hardening mechanism due to the difficulty in propagating and deflecting cracks results from the fact that m-ZrO2 has a lower elastic modulus (Em-ZrO2 = 168 GPa [53], Et−3YSZ = 210 GPa [54], Ec−8YSZ = 210 GPa [55]) and the compressive residual forces. These compressive forces are the result of the t-m martensitic transformation, with a volume expansion of 3–5%, during cooling, and the significant incompatibility between the coefficient of thermal expansion of the different phases of zirconia (CTEm−ZrO2 = 15.6 × 10⁻⁶ K−1, CTEt−3YSZ = 11.5 × 10⁻⁶ K−1, CTEc−8YSZ = 10.7 × 10⁻⁶ K−1 [56]). This phenomenon of increased toughness due to the grains of the monoclinic phase being compressed inside other grains of other crystalline phases is also reported in the literature [56,57], and is justified by the expansive forces that are superimposed on the crack front forces. Therefore, during the cooling of the samples to room temperature, the volume expansion (3–5%) also contributes to increasing the density.
In Figure 8, the characteristic fracture surfaces of the three sintered materials are displayed. No singular large defects responsible for the origin of the fractures were observed at low magnification in the fracture surfaces of the MA, MCZ, and YSZ composites. The fractures most likely occurred due to the coalescence of smaller defects or microcracks near the face subjected to tensile forces (the face opposite to the force application).
In greater detail, the fracture surfaces of the MA composites showed specific characteristics similar to those of porous ceramics with interconnected porosity where some medium grains (~2 µm) with transgranular fractures and numerous small round grains (less than 1 µm) with intergranular fractures are observed. The fracture surface of the MCZ composites had a high content of debris particles and a tortuous, very dense surface. The CaZrO3 grains (clear) showed intergranular fractures and some cavities where the MgO grains (dark) were pulled out. These more rigid MgO grains (EMgO = 288 GPa, [51]) exhibited a transgranular fracture and were most likely responsible for the large volume of the above-mentioned debris particles. Lastly, there was no porosity on the fracture surface of the YSZ composites, the grains were very small (<0.5 µm), and on the almost clean surface, they exhibited a completely intergranular fracture.

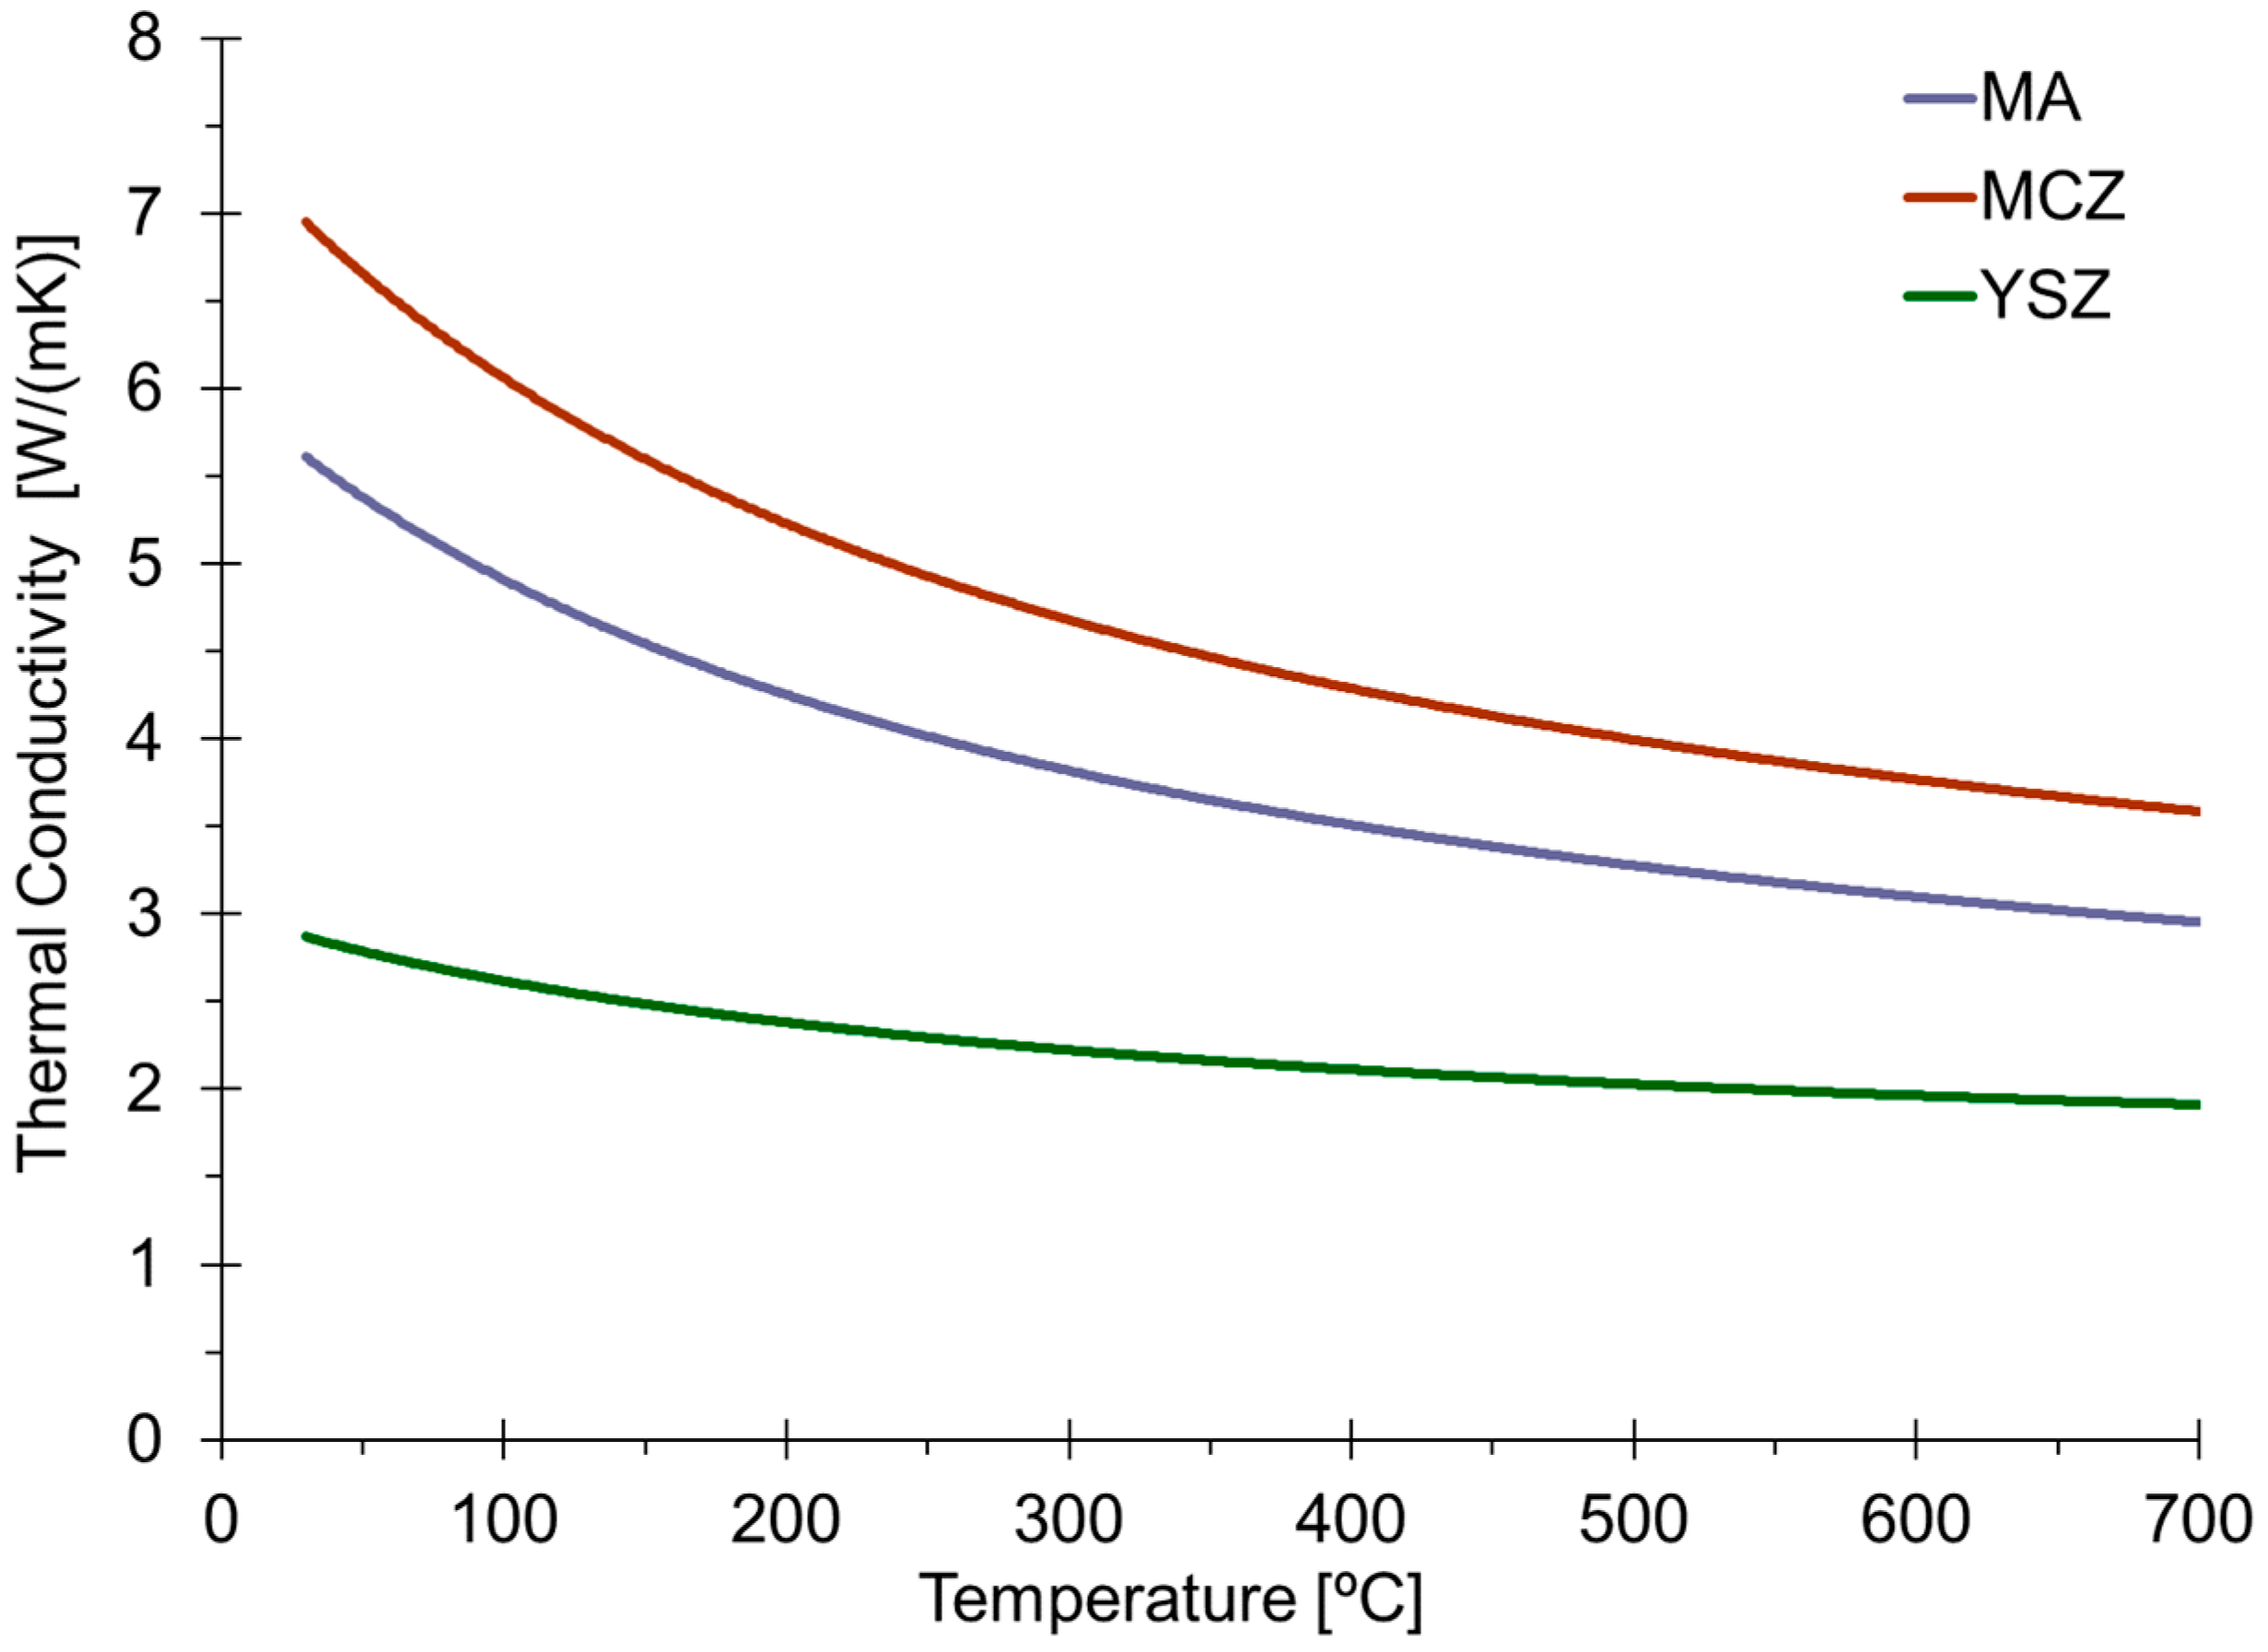
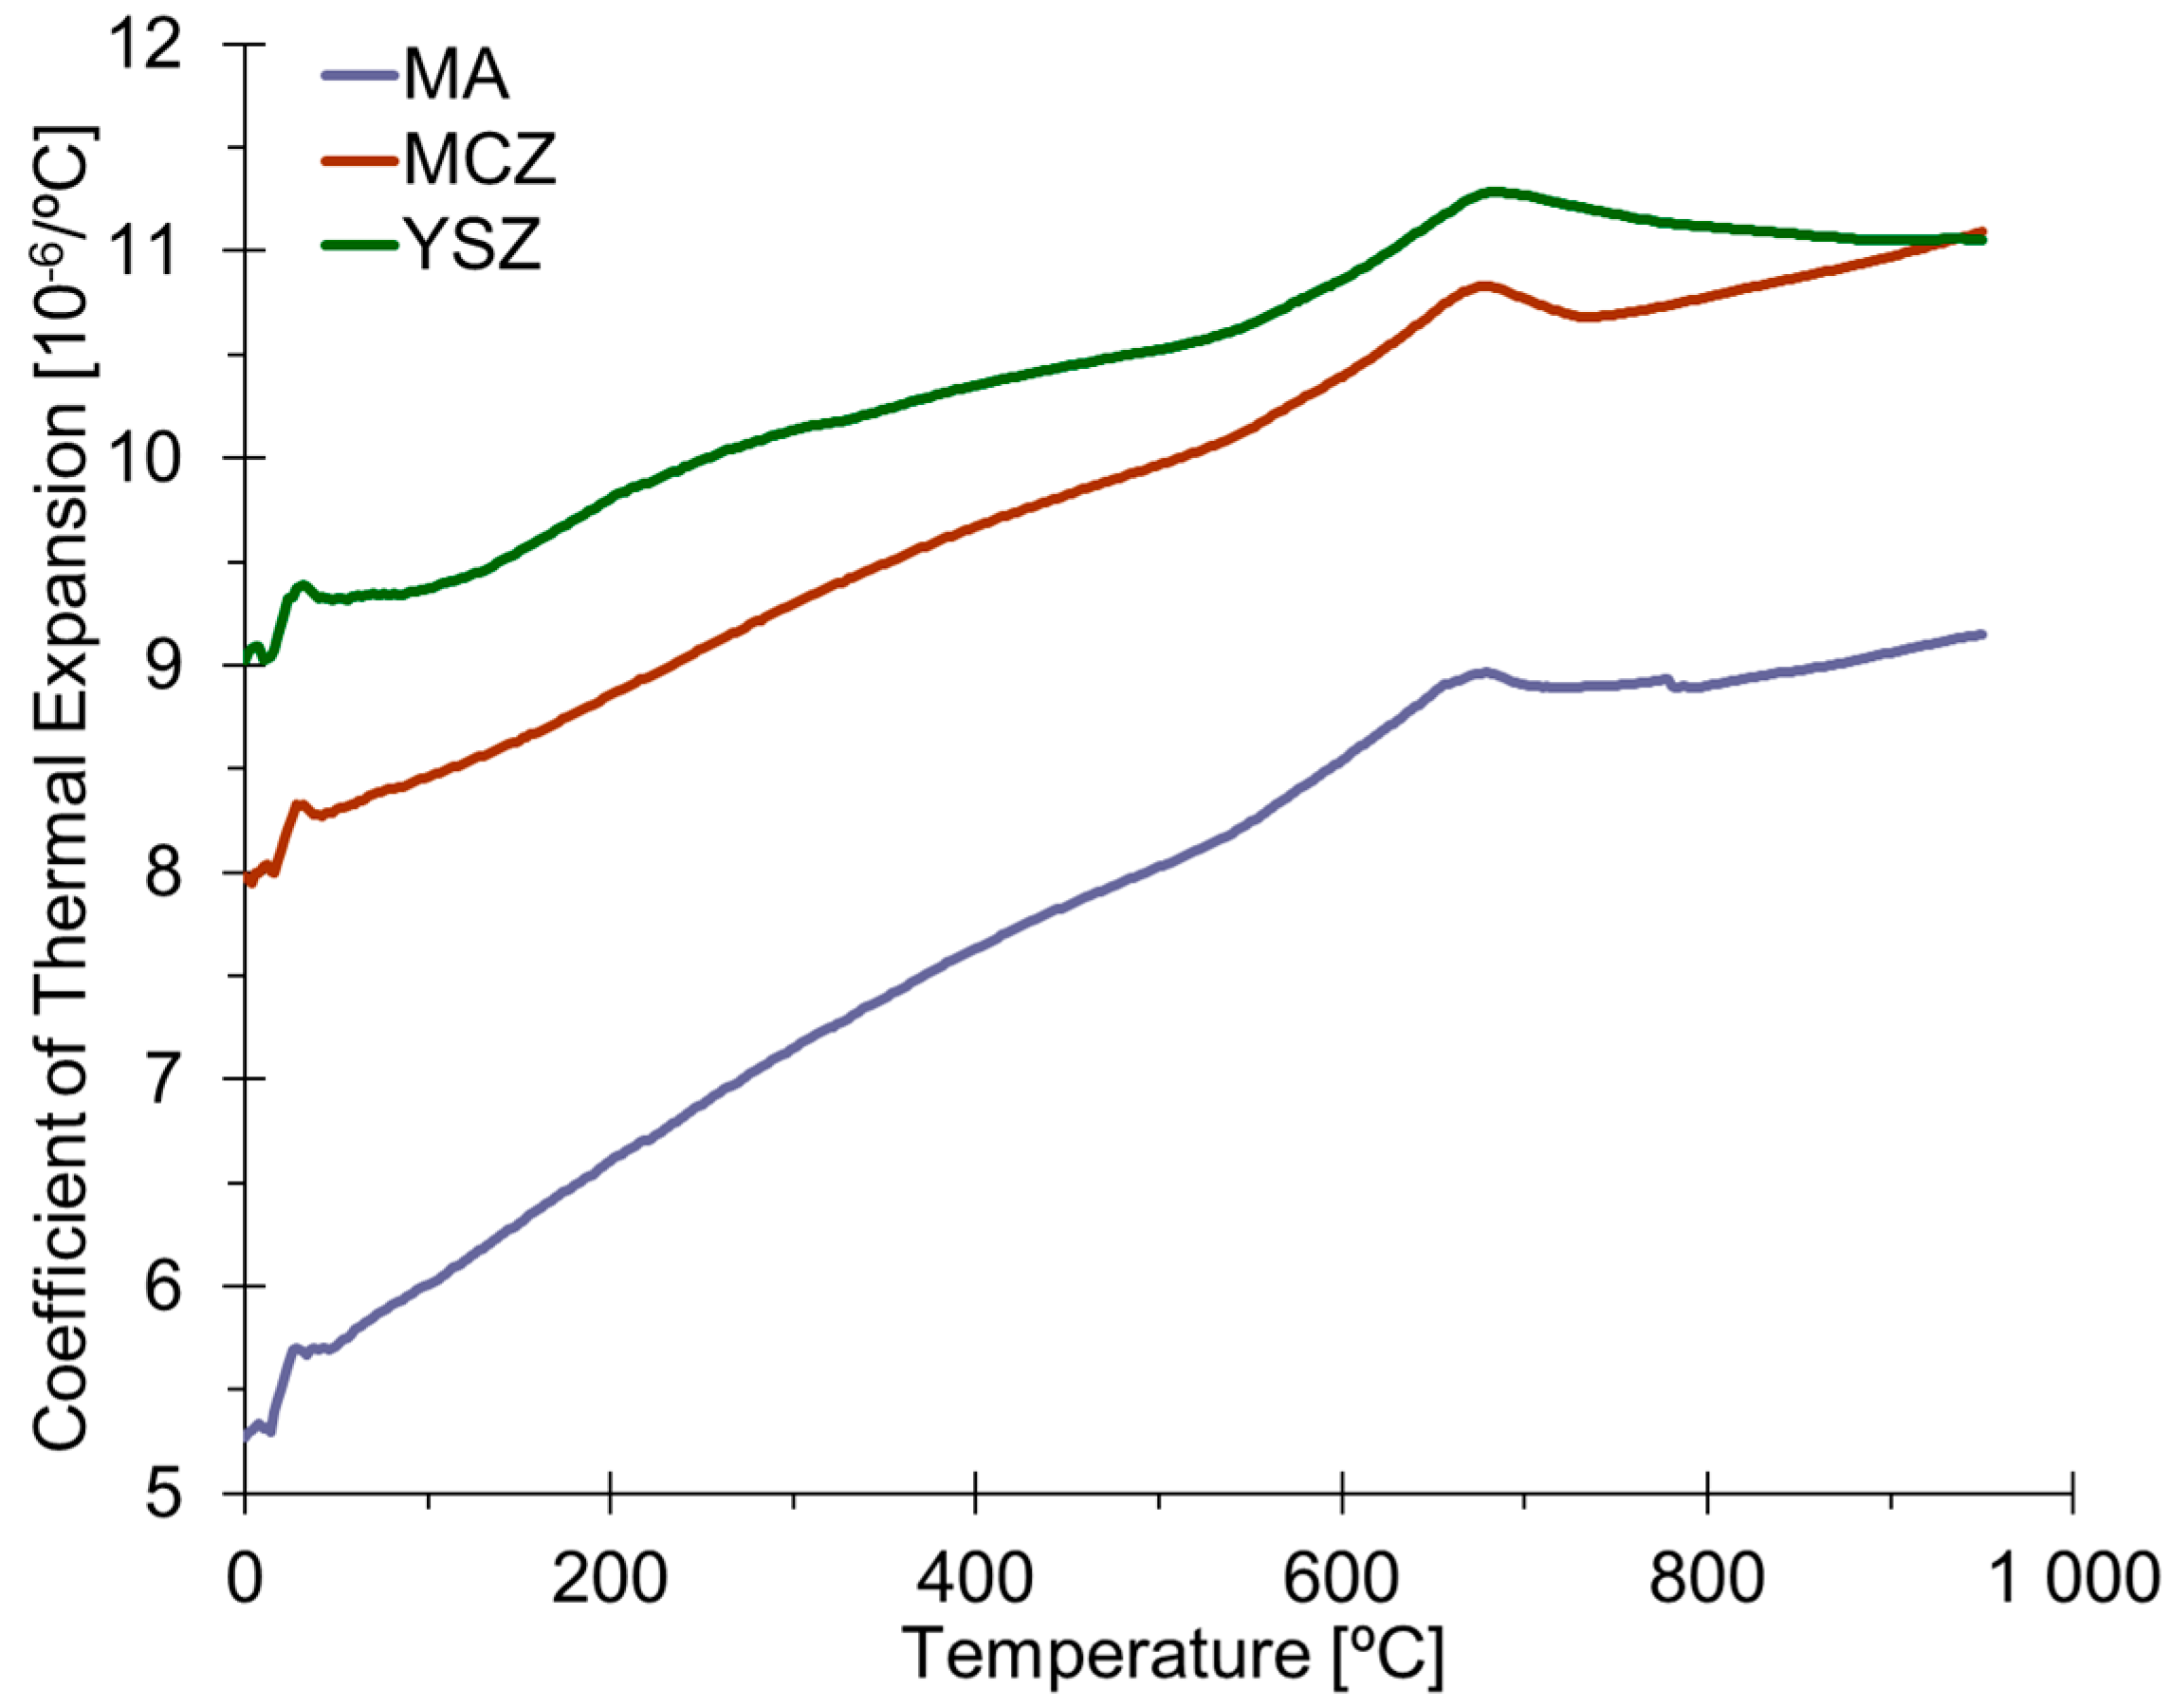
3.3. Thermal Properties

The assessment of the thermal properties of the MA, MCZ, and YSZ ceramic composites is of utmost importance, considering the wide range of potential applications. In other words, TBC and TPS require a comprehensive analysis of the thermal influence, which affects the performance of ceramic systems due to their desirable characteristics of providing both thermal insulation and environmental stability for engineering structures or parts. Therefore, considering aeronautical and aerospace applications, a thermal analysis becomes mandatory.
Figure 9 illustrates the thermal conductivity of MA, MCZ, and YSZ ceramic composite materials from 30 °C to 700 °C.
By studying Figure 9, two major conclusions can be withdrawn. Primarily, it shows that MCZ has a higher thermal conductivity than MA, which in turn has a higher thermal conductivity than YSZ. Secondly, all the samples’ thermal conductivity tended to diminish with increasing temperature.
Table 2 summarizes the experimentally obtained thermal conductivity values at 30 °C—room temperature—and 700 °C—high-temperature—regimes.
As a rule, the thermal conductivity of porous ceramic materials is known to decrease with increasing porosity [58]. More specifically, Sun et al. (2014) [59] explain that if the porosity is increased (i.e., lowering the density), the ceramic’s solid-phase heat conduction decreases regardless of the temperature range studied, whilst the gas-phase heat conduction and thermal radiation rises. Thus, the overall thermal conductivity diminishes. The typical tendency curves shown for porous alumina ceramics in Živcová et al. (2009) [60] show a thermal conductivity behavior variation with temperature similar to the one represented for MA in Figure 9. For magnesium oxide-doped calcium zirconate, Carneiro et al. (2021) [61] performed a complete thermal characterization of composite materials with different CaZrO3/MgO fractions. In their study, for the CZ2M1 ceramic (1/3 MgO and 2/3 CaZrO3), the experimental results, in addition to finite element method (FEM) simulations and analytical model comparison, showed a thermal conductivity rough variation between 3 and 7 W/(mK) for temperatures of approximately, [20; 500] °C. Accordingly, these values are in line with the ones obtained for MCZ ranging from 3.59 W/(mK) and 6.95 W/(mK) in this study (shown in Table 2). In terms of tendency behavior, similar results to the ones reported by Carneiro et al. (2021) [61] may be observed, i.e., with increasing temperature, thermal conductivity diminishes. Lastly, for the YSZ ceramic composite, suitable results were achieved. From the commercially available datasheets, YSZ has a very low thermal conductivity of approximately 2–3 W/(mK) [47,62,63]. Additionally, Zhao et al. (2006) [64] reported a range for the thermal conductivity of yttria-stabilized zirconia of 2.2–2.9 W(mK). Balça (2022) [51] clarified that the cubic, tetragonal, and monoclinic phases that coexist in YSZ ceramic composites have dissimilar thermal conductivities of approximately 1.8 W/(mK), 3 W/(mK), and 7 W/(mK), respectively. Adopting different analytical methods, the results for the conductivity pointed out in Balça (2022) [51] varied between 2.93 and 3.57 W/(mK) at room temperature. Bearing this in mind, the values of 2.87 W(mK) and 1.91 W(mK) for 30 °C and 700 °C, respectively, agree with the ones reported in the literature. For fully dense yttria-stabilized zirconia, Schlichting et al. (2001) [65] supported the behavior of a lower thermal conductivity with increasing temperature, as depicted in Figure 9.
Figure 10 describes the evolution of the CTE of the MA, MCZ, and YSZ ceramic composites in a temperature interval from 0 °C to 950 °C.
By analyzing Figure 10, a similar tendency was identified for all the ceramic composites. Their behavior started with an increase in CTE until approximately 50 °C temperature, after which, a steadier growth was observed up to 650 °C. Around approximately 650 °C, an abrupt decrease in growth was observed, and a stabilization of the parameter under study up to 950 °C was verified. It should be noted that, for the last analyzed temperature value of 950 °C, YSZ’s CTE curve overlaps with that of MCZ, with a CTE of approximately 11.1 × 10 6 / ° C .
Table 3 summarizes the average CTE data for the temperature intervals: room temperature was from 20 to 30 °C, and high temperatures were from 800 to 950 °C.
The values presented in Table 3 allow to conclude that these CTE values are characteristic for every ceramic material under study, once they are considerably chemically, microstructurally, and physically dissimilar. Nevertheless, a common tendency for MA, MCZ, and YSZ, as previously analyzed in Figure 10, is stressed, i.e., with the growth in temperature, there is a rise in the thermal expansion coefficient. Considering the MA ceramic composite, the values obtained regardless of the temperature regimes studied, i.e., room temperature and high-temperature ranges, in Table 3 may be perceived as consistent with the data reported in the literature. More precisely, Auerkari (1996) [38] pointed out that, at room temperature, for engineering alumina ceramic of 99% purity with a 1–5% porosity level, the CTE is approximately 5.4 × 10 6 / ° C . If considering the value listed in Table 3 for the room temperature regime from 20 °C to 30 °C, MA possesses a very identical figure of 5.6 × 10 6 / ° C . Additionally, Munro (1997) [33] reported a CTE of approximately 4.6 × 10 6 / ° C , 7.1 × 10 6 / ° C , and 8.1 × 10 6 / ° C for [0; 20] °C, [0; 500] °C, and [0; 1000] °C temperature intervals. The averages of the determined discrete CTE values for these specific temperatures ranges were approximately 5.4 × 10 6 / ° C , 6.8 × 10 6 / ° C , and 7.8 × 10 6 / ° C (the latter value corresponds to the interval [0; 950 °C]).
Bearing in mind the values indicated in the literature, it was concluded that MCZ showed similar values. More precisely, Schafföner et al. (2017) [66] reported CTE values collected from other previous studies of CaZrO3 ceramics of about 8.5   11.8 × 10 6 / ° C for temperatures between 20 °C and 900 °C. For the sake of completeness and within the same framework of thought, the experimental MCZ’s CTE feature between 20 °C and 900 °C was calculated. The result was approximately 9.8 × 10 6 / ° C . Moreover, in their study on dense CaZrO3 produced by electric arc melting, Schafföner et al. (2013) [67] experimentally obtained a CTE of 10.45 × 10 6 / ° C . In contrast, Hou (2008) [68] found a relatively rather lower thermal expansion coefficient of 6.5   8.5 × 10 6 / ° C . Additionally, keeping in mind the exploited dopant agent, MgO, the literature indicates a CTE of 13.5 × 10 6 / ° C [69]. The slightly dissimilar values found in the literature may be justified by the anisotropic structure of MgO-doped CaZrO3. More accurately, there is a thermal mismatch between MgO that has a CTE of 13.5 × 10 6 / ° C and CaZrO3’s average CTE of 10.4 × 10 6 / ° C (result of large thermal expansion anisotropy, i.e., C T E a = 4.9 × 10 6 K 1 , C T E b = 10.9 × 10 6 K 1 , and C T E c = 15.1 × 10 6 K 1 ). Therefore, considering the data provided, the CTE results for the MCZ ceramic composite is in line with the ones from the literature.
Finally, for the YSZ material the following results was obtained. Some of the values provided by the manufacturer’s datasheets vary considerably. Naturally, it depends on the compositions of the yttria-stabilized zirconia used, the methodologies of manufacturing and testing applied, as well as the conditions in which the tests were conducted. Overall, some datasheets indicate CTE values of 9.1 × 10 6 / ° C for temperatures between 20 and 100 °C; 9.9 × 10 6 / ° C for temperatures between 20 and 200 °C; and 10.1 × 10 6 / ° C for temperatures between 20 and 300 °C [70]. Other datasheets show lower values, for instance, 6.9 × 10 6 / ° C for temperatures between 25 and 100 °C; 8.1 × 10 6 / ° C for temperatures between 25 and 300 °C; and 10.5 × 10 6 / ° C for temperatures between 25 and 600 °C [71]. Cao et al. (2004) [62] summarized the basic properties for thermal barrier coatings from studies available in the literature and listed a CTE of 11.5 × 10 6 / ° C for 3YSZ and a slightly lower 10.7 × 10 6 / ° C for 8YSZ. The experimentally fabricated, tested, and evaluated YSZ ceramic exhibited reasonable and more constant (than of some references) values in terms of the CTE parameter over the studied temperature interval.

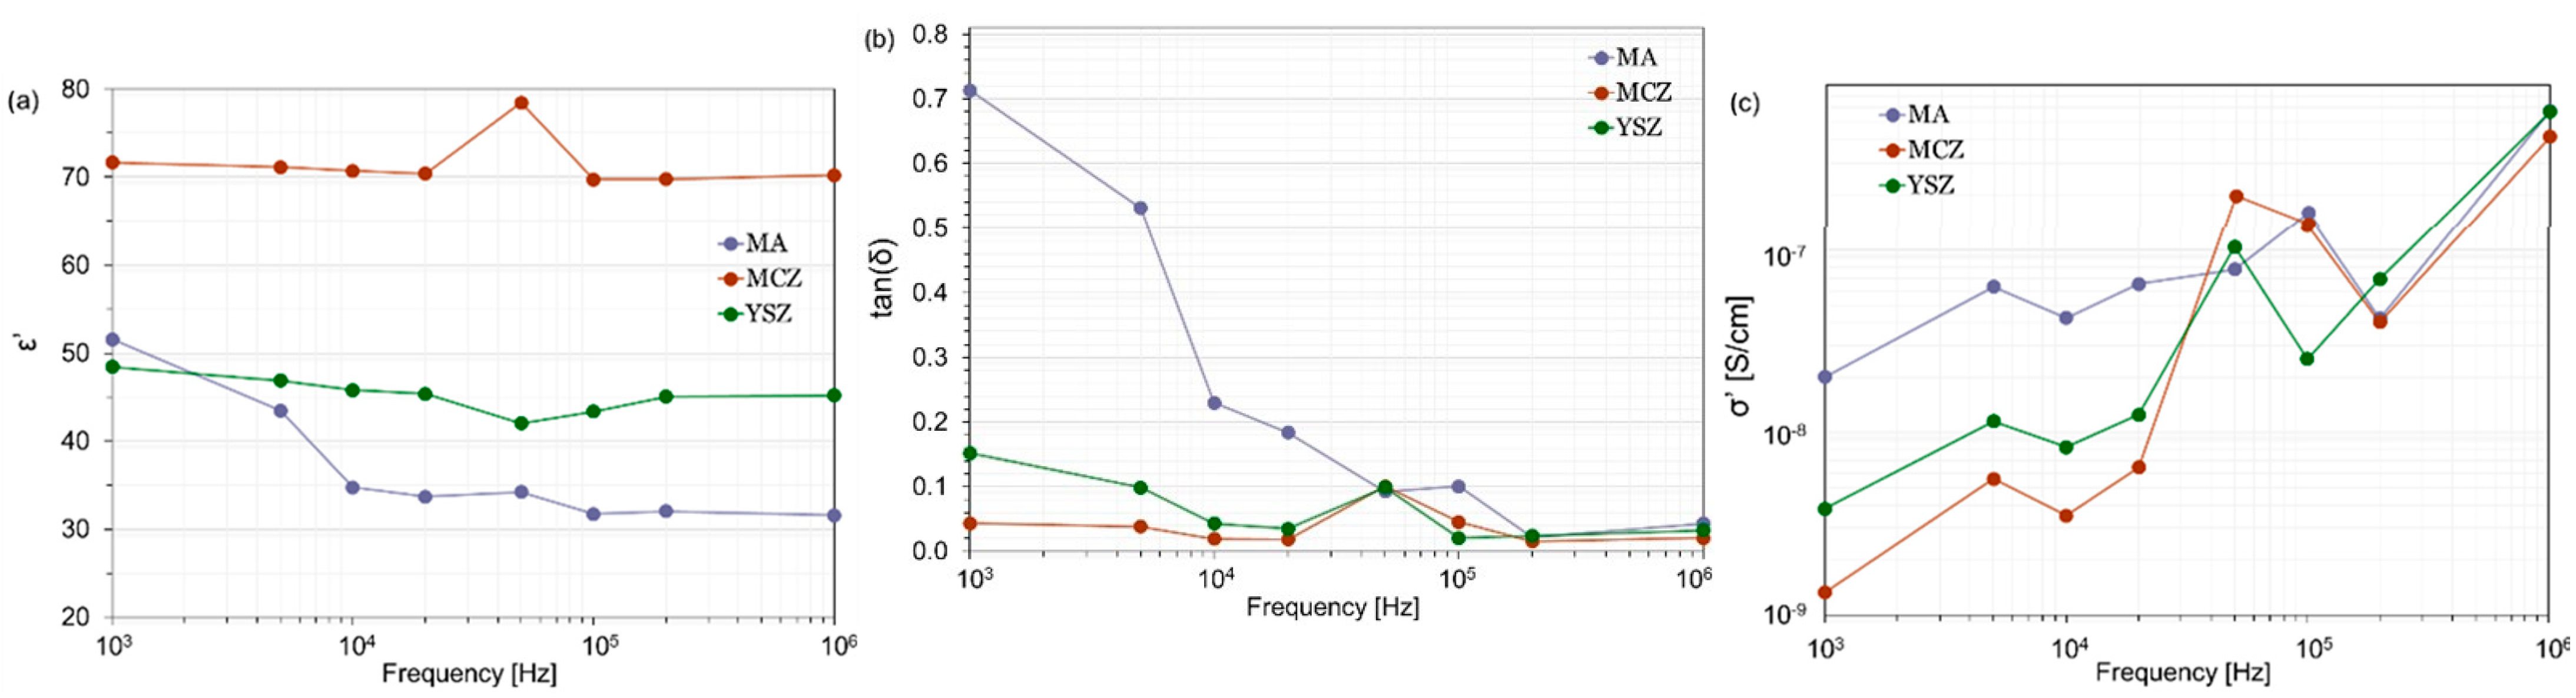
3.4. Dielectric Properties

Dielectric spectroscopy was employed for determining the dielectric characteristics of the samples as a function of frequency. This is essential in gaining a better understanding of how these properties affect the range of applications of the electroceramics composites. The range of values of the dielectric constant and tangent loss of ceramic materials is a governing factor in their categorization and potential use of the ceramics in various designs, such as capacitors, sensors, actuators, and resonators.
Figure 11 shows the evolution, as a function of frequency, of the dielectric constant (ε′), dielectric loss (tan(δ)), and A.C. electrical conductivity (σ′) of the MA, MCZ, and YSZ ceramic composites.
Figure 11a illustrates that the dielectric constant for the three ceramic compositions has an almost frequency-independent behavior within the range of 1 kHz to 1 MHz. Overall, the dielectric constant values ranged from a minimum of approximately 32 for MA to a maximum of 78 for MCZ.
For the MA ceramic composition, the dielectric constant varied between a minimum recorded value of about 32 and a maximum of 52. For frequencies exceeding 10 kHz, the dielectric constant stabilized at around 32–34. The MCZ composition demonstrated the highest dielectric constant values across the entire frequency range, registering values between 70 and 71, except for the 50 kHz frequency, where it recorded a relatively elevated value (78). Finally, for the YSZ system, the dielectric constant ranged from 42 to 48, indicating a higher stability throughout the frequency range above 1 kHz.
The dielectric constant values of these three composite systems greatly surpass those found in the literature for each individual ceramic phase. For instance, for magnesium oxide (MgO), the literature cites fairly consistent ε′ values of 9.830 (1 kHz and 300 K) [72,73], 9.958 (1 kHz and 295 K) [74], and 9.9 (1 MHz) [75]. Similarly, alumina (Al2O3) has a value of 9.2 (1 kHz and room temperature) [76] and 9.164 (17 GHz). For calcium zirconate (CaZrO3), a wider range of values of approximately 20 [77] to 23.8 [78] up to 32 [79] has been reported. Likewise, the values of YSZ are 38.0 (150 kHz to 40 MHz, 8 mol% yttria) [80], 28.6 (30 kHz to 1 MHz, 9.5 mol% yttria) [81], 34.5 (X-band, 2 mol% yttria), and 27.2 (X-band, 9 mol% yttria) [82].
In turn, the dielectric losses shown in Figure 11b varied between 0.01 and 0.7 for MA, 0.05 and 0.09 for MCZ, and 0.01 and 0.1 for YSZ. These tangent loss values are also significantly higher than those reported in the literature for the individual ceramic phases, which noted values of 8 × 10 3 for MgO [83], 7.4 × 10 4 for Al2O3 [84], 6 × 10 4 for CaZrO3 [77], and 4 × 10 3 for YSZ [80].
Based on the information reported above, the obtained results show that the recorded increase in dielectric constant, up to 10-fold in the optimal scenario, was accompanied by a notable surge in tangent loss, surpassing 100-fold in certain specimens. The reason behind such a difference could be the accumulation of charges at the interface between the distinct ceramic phases present in the composites. The interfaces frequently contain incompatible crystalline structures and differing dielectric constants, leading to the formation of regions with much higher carrier concentrations than in the surrounding material. This polarization phenomenon is commonly referred to as Maxwell–Wagner–Sillars polarization [85], and it is frequently observed in heterogeneous materials, including ceramic composites. On the one hand, the accumulation of charge carriers acts as additional dipoles contributing to the overall polarization of the material, thus increasing the dielectric constant. On the other hand, trapped charge carriers also raise the overall conductivity of the composite, and when exposed to an A.C. electrical field, they oscillate back and forth, resulting in a rise in tangent loss.
Additionally, Figure 11c illustrates the electrical conductivity, which aligns with the expected and published trend of increasing electrical conductivity with frequency [86]. The conductivity value ranged from 10 9 to 10 7 S/cm across all ceramic composites between a frequency range of 1 kHz to 1 MHz.
It is worth noting that ceramic composites with a high dielectric constant and high tangent loss are used in aeronautics as dissipative dielectric ceramics in situations that call for the absorption of electromagnetic energy.

4. Conclusions

The presented investigation targeted the microstructure–property relationship of three distinct ceramic systems, i.e., MgO-Al2O3 (MA), MgO-CaZrO3 (MCZ), and Y2O3-stabilized ZrO2 (YSZ), for aerospace propulsion applications. A wide-ranging experimental characterization—in terms of microstructure, and physical, mechanical, thermal, and dielectric properties—was carried out. On the whole, the results obtained for all of the studied parameters matched with the results of similar ceramic systems found in the literature.
A microstructure assessment was carried out, followed by analyses of the apparent porosity, bulk, and relative densities. On the whole, zirconia-based ceramic microstructures did not provide evidence of microstructural flaws due to their high level of densification, which cannot be assured for alumina-based ceramics. MA showed 7% porosity, followed by MCZ and YSZ with less than 0.05%. The bulk and relative densities showed congruent results when accounting for the apparent porosity: 2.79 g / c m 3 and 2.66 g / c m 3 for MA, 4.49 g / c m 3 and 4.48 g / c m 3 for MCZ, and 5.88 g / c m 3 and 5.89 g / c m 3 , respectively. Additionally, shrinkage of the samples was evaluated based on the diametric linear contraction which was approximately 13%, 24%, and 27% for MA, MCZ, and YSZ.
MA (317 GPa for the Young modulus and 130 GPa for the shear modulus) showed an influence on the mechanical response due to its relatively high porosity content. For MCZ, the corresponding values were 213 GPa and 84 GPa, and for YSZ, they were 197 GPa and 69 GPa, respectively. For the flexural strength parameter, the experimental figures agree with the ones reported by the bibliography, even for the alumina-based ceramics specimens with their respective porosities (103 MPa, 318 MPa, and 740 MPa for MA, MCZ, and YSZ, respectively). Lastly, the hardness and fracture toughness properties were 4.8 GPa and 3.6 MPa·mm1/2 for MA, 7.3 GPa and 2.7 MPa·mm1/2 for MCZ, and 13.1 GPa and 5.1 MPa·mm1/2 for YSZ, respectively.
In terms of thermal properties, the MA ceramic was characterized by lower thermal conductivity values compared to fully dense samples due to its porosity of 7%. Both the alumina- and zirconia-based ceramics’ CTE results were in line with the literature.
The evaluation of the dielectric properties showed an increased dielectric constant and tangent loss for all ceramic systems at 1 kHz (ε′ 52 and tan(δ)   0.7 for MA; ε′ 72 and tan(δ) 0.03 for MCZ; and ε′ 48 and tan(δ) 0.1 for YSZ).
Finally, it is emphasized that the clever attainment of multifunctionally, via novel ceramics composites research, as pointed out by many investigators, will instigate advanced ceramics’ potential and boost their global market.

Author Contributions

Conceptualization, K.O.S. and A.P.S.; methodology, J.N.-P., F.F.R. and A.P.S.; validation, K.O.S. and A.P.S.; formal analysis, K.O.S., J.N.-P. and A.P.S.; investigation, K.O.S., J.N.-P., F.F.R., J.C.P., S.L.-M. and A.P.S.; resources, J.N.-P., F.F.R., J.C.P., S.L.-M. and A.P.S.; data curation, K.O.S., J.N.-P. and A.P.S.; writing—original draft preparation, K.O.S.; writing—review and editing, K.O.S., J.N.-P., F.F.R., J.C.P., S.L.-M. and A.P.S.; visualization, K.O.S. and A.P.S.; supervision, J.N.-P., F.F.R. and A.P.S.; project administration, A.P.S.; funding acquisition, J.N.-P., F.F.R., J.C.P., S.L.-M. and A.P.S. All authors have read and agreed to the published version of the manuscript.

Funding

This research was funded by the Portuguese Foundation for Science and Technology, I.P. (FCT, I.P.) FCT/MCTES through national funds (PIDDAC), under the R&D Unit C-MAST/Center for Mechanical and Aerospace Science and Technologies, reference: Projects UIDB/00151/2020 (https://doi.org/10.54499/UIDB/00151/2020) and UIDP/00151/2020 (https://doi.org/10.54499/UIDP/00151/2020), and under the R&D Unit CF-UM-UP/Centro de Física das Universidades do Minho e do Porto, Project UID/FIS/04650/2020. João Nunes-Pereira would also like to thank FCT, I.P., for the contract under the Stimulus of Scientific EmploymentIndividual Support: (2022.05613.CEECIND; https://doi.org/10.54499/2022.05613.CEECIND/CP1746/CT0001). Funding from the Basque Government under the Elkartek program is also acknowledged.

Institutional Review Board Statement

Not applicable.

Informed Consent Statement

Not applicable.

Data Availability Statement

Data are contained within the article.

Conflicts of Interest

The authors declare no conflicts of interest.

References

  1. Shvydyuk, K.O.; Nunes-Pereira, J.; Rodrigues, F.F.; Silva, A.P. Review of Ceramic Composites in Aeronautics and Aerospace: A Multifunctional Approach for TPS, TBC and DBD Applications. Ceramics 2023, 6, 195–230. [Google Scholar] [CrossRef]
  2. Otitoju, T.A.; Okoye, P.U.; Chen, G.; Li, Y.; Okoye, M.O.; Li, S. Advanced ceramic components: Materials, fabrication, and applications. J. Ind. Eng. Chem. 2020, 85, 34–65. [Google Scholar] [CrossRef]
  3. Rödel, J.; Kounga, A.B.; Weissenberger-Eibl, M.; Koch, D.; Bierwisch, A.; Rossner, W.; Hoffmann, M.J.; Danzer, R.; Schneider, G. Development of a roadmap for advanced ceramics: 2010–2025. J. Eur. Ceram. Soc. 2009, 29, 1549–1560. [Google Scholar] [CrossRef]
  4. Advanced Ceramics Market: Global Industry Trends, Share, Size, Growth, Opportunity and Forecast 2023–2028. Research and Markets. 2023. Available online: https://www.researchandmarkets.com/reports/5742831/advanced-ceramics-market-global-industry (accessed on 28 August 2022).
  5. Subbarao, E.C. Advanced ceramics—An overview. Sādhanā 1988, 13, 1–11. [Google Scholar] [CrossRef]
  6. Petzow, G.; Telle, R.; Danzer, R. Microstructural defects and mechanical properties of high-performance ceramics. Mater. Charact. 1991, 26, 289–302. [Google Scholar] [CrossRef]
  7. Padture, N.P. Advanced structural ceramics in aerospace propulsion. Nat. Mater. 2016, 15, 804–809. [Google Scholar] [CrossRef]
  8. Yang, Q.; Gao, B.; Xu, Z.; Xie, W.; Meng, S. Topology optimisations for integrated thermal protection systems considering thermo-mechanical constraints. Appl. Therm. Eng. 2019, 150, 995–1001. [Google Scholar] [CrossRef]
  9. Triantou, K.; Mergia, K.; Perez, B.; Florez, S.; Stefan, A.; Ban, C.; Pelin, G.; Ionescu, G.; Zuber, C.; Fischer, W.; et al. Thermal shock performance of carbon-bonded carbon fiber composite and ceramic matrix composite joints for thermal protection re-entry applications. Compos. Part B Eng. 2017, 111, 270–278. [Google Scholar] [CrossRef]
  10. Bakan, E.; Vaßen, R. Ceramic top coats of plasma-sprayed thermal barrier coatings: Materials, processes, and properties. J. Therm. Spray Technol. 2017, 26, 992–1010. [Google Scholar] [CrossRef]
  11. Venkadesan, G.; Muthusamy, J. Experimental investigation of Al2O3/8YSZ and CeO2/8YSZ plasma sprayed thermal barrier coating on diesel engine. Ceram. Int. 2019, 45, 3166–3176. [Google Scholar] [CrossRef]
  12. Ejaz, N.; Ali, L.; Ahmad, A.; Mansoor, M.; Asim, M.M.; Rauf, A.; Mehmood, K. Thermo-physical properties measurement of advanced TBC materials with pyrochlore and perovskite structures. Key Eng. Mater. 2018, 778, 236–244. [Google Scholar] [CrossRef]
  13. Xu, J.; Sarin, V.; Dixit, S.; Basu, S. Stability of interfaces in hybrid EBC/TBC coatings for Si-based ceramics in corrosive environments. Int. J. Refract. Met. Hard Mater. 2015, 49, 339–349. [Google Scholar] [CrossRef]
  14. Shvydyuk, K.O.; Nunes-Pereira, J.; Rodrigues, F.F.; Páscoa, J.; Lanceros-Mendez, S.; Silva, A.P. Long-lasting ceramic composites for surface dielectric barrier discharge plasma actuators. J. Eur. Ceram. Soc. 2023, 43, 6112–6121. [Google Scholar] [CrossRef]
  15. Khasare, S.; Bagherighajari, F.; Dolati, F.; Mahmoudimehr, J.; Pascoa, J.; Abdollahzadeh, M. Control of the flame and flow characteristics of a non-premixed bluff body burner using dielectric barrier discharge plasma actuators. Appl. Therm. Eng. 2023, 235, 121432. [Google Scholar] [CrossRef]
  16. Abdollahzadeh, M.; Rodrigues, F.; Nunes-Pereira, J.; Pascoa, J.; Pires, L. Parametric optimization of surface dielectric barrier discharge actuators for ice sensing application. Sens. Actuators A Phys. 2022, 335, 113391. [Google Scholar] [CrossRef]
  17. Rodrigues, F.F.; Pascoa, J.C. Implementation of Stair-Shaped Dielectric Layers in Micro- and Macroplasma Actuators for Increased Efficiency and Lifetime. J. Fluids Eng. 2020, 142, 104502. [Google Scholar] [CrossRef]
  18. Nunes-Pereira, J.; Rodrigues, F.F.; Abdollahzadehsangroudi, M.; Páscoa, J.C.; Lanceros-Mendez, S. Improved performance of polyimide Cirlex-based dielectric barrier discharge plasma actuators for flow control. Polym. Adv. Technol. 2021, 33, 1278–1290. [Google Scholar] [CrossRef]
  19. ASTM C20-00; Standard Test Methods for Apparent Porosity, Water Absorption, Apparent Specific Gravity, and Bulk Density of Burned Refractory Brick and Shapes by Boiling Water. ASTM—American Society for Testing and Materials: West Conshohocken, PA, USA, 2022; p. 3.
  20. ASTM C1054–03; Standard Test Method for Drying and Firing Linear Change of Refractory Plastic and Ramming Mix Specimens. ASTM—American Society for Testing and Materials: West Conshohocken, PA, USA, 2019; p. 3.
  21. ASTM C119–20; Standard Test Method for Dynamic Young’s Modulus, Shear Modulus, and Poisson’s Ratio for Advanced Ceramics by Sonic Resonance. ASTM—American Society for Testing and Materials: West Conshohocken, PA, USA, 2020; p. 12.
  22. ASTM C1161–18; Standard Test Method for Flexural Strength of Advanced Ceramics at Ambient Temperature. ASTM—American Society for Testing and Materials: West Conshohocken, PA, USA, 2019; p. 19.
  23. ASTM C1327; Standard Test Method for Vickers Indentation Hardness of Advanced Ceramics. ASTM—American Society for Testing and Materials: West Conshohocken, PA, USA, 2019; p. 10.
  24. ASTM E1461-07; Standard Test Method for Thermal Diffusivity by the Flash Method. ASTM—American Society for Testing and Materials: West Conshohocken, PA, USA, 2022; p. 11.
  25. ASTM E228-17; Standard Test Method for Linear Thermal Expansion of Solid Materials by Thermomechanical Analysis. ASTM—American Society for Testing and Materials: West Conshohocken, PA, USA, 2012; p. 5.
  26. Somton, K.; Dateraksa, K.; Laoratanakul, P.; McCuiston, R. Shrinkage and Properties of Die Pressed Alumina Produced from Different Granule Sources. AIP Conf. Proc. 2020, 2279, 060003. [Google Scholar] [CrossRef]
  27. Shui, A.; Uchida, N.; Uematsu, K. Origin of Shrinkage Anisotropy During Sintering for Uniaxially Pressed Alumina Compacts. Powder Technol. 2002, 127, 9–18. [Google Scholar] [CrossRef]
  28. Szczerba, J.; Pdzich, Z.; Madej, D. Synthesis of Spinel-Calcium Zirconate Materials. Mater. Ceram. 2011, 63, 27–33. Available online: https://www.researchgate.net/profile/Zbigniew-Pedzich/publication/285158717_Synthesis_of_spinel-calcium_zirconate_materials_materialy_ceramiczne/links/5662adc108ae4931cd5ea54b/Synthesis-of-spinel-calcium-zirconate-materials-materialy-ceramiczne.pdf (accessed on 28 August 2022).
  29. Hu, L.; Wang, C.A. Effect of Sintering Temperature on Compressive Strength of Porous Yttria-Stabilized Zirconia Ceramics. Ceram. Int. 2010, 36, 1697–1701. [Google Scholar] [CrossRef]
  30. Ren, F.; Case, E.D.; Morrison, A.; Tafesse, M.; Baumann, M.J. Resonant ultrasound spectroscopy measurement of Young’s modulus, shear modulus and Poisson’s ratio as a function of porosity for alumina and hydroxyapatite. Philos. Mag. 2009, 89, 1163–1182. [Google Scholar] [CrossRef]
  31. Rice, R.W. The porosity dependence of physical properties of materials: A summary review. Key Eng. Mater. 1996, 115, 1–20. [Google Scholar] [CrossRef]
  32. Pabst, W.; Gregorová, E.; Tichá, G. Elasticity of porous ceramics—A critical study of modulus—porosity relations. J. Eur. Ceram. Soc. 2006, 26, 1085–1097. [Google Scholar] [CrossRef]
  33. Munro, M. Evaluated material properties for a sintered α-alumina. J. Am. Ceram. Soc. 1997, 80, 1919–1928. [Google Scholar] [CrossRef]
  34. Phani, K.K.; Sanyal, D. The relations between the shear modulus, the bulk modulus and Young’s modulus for porous isotropic ceramic materials. Mater. Sci. Eng. A 2008, 490, 305–312. [Google Scholar] [CrossRef]
  35. Heimann, R.B. Classic and Advanced Ceramics: From Fundamentals to Applications; Wiley & Sons: Hoboken, NJ, USA, 2010; Chapter 7; p. 176. [Google Scholar]
  36. High Purity Alumina (99.5%, 99.8%, 99.96%). STC Material Solutions, Ceramic Materials Solutions. Available online: https://www.ceramics.net/ceramic-materials-solutions/aluminas/high-purity (accessed on 28 August 2022).
  37. Heimann, R.B. Classic and Advanced Ceramics: From Fundamentals to Applications; Wiley & Sons: Hoboken, NJ, USA, 2010; Chapter 10; p. 361. [Google Scholar]
  38. Auerkari, P. Mechanical and Physical Properties of Engineering Alumina Ceramics. VTT Manufacturing Technology, ESPOO: Technical Research Centre of Finland. 1996. Available online: https://www.vttresearch.com/sites/default/files/pdf/tiedotteet/1996/T1792.pdf (accessed on 28 August 2022).
  39. Cabral, A.R.S. Melhoria da Resistência Mecânica do Compósito Cerâmico CaZrO3-MgO com a Adição de 3YSZ e 8YSZ. 2021. Available online: https://ubibliorum.ubi.pt/handle/10400.6/11881 (accessed on 28 August 2022).
  40. Mamede, J.; Macedo, D.F.; Maceiras, A.; Silva, A.P. Reinforcement of the Ceramic Matrix of CaO-ZrO2-MgO with Al2O3 Coarse Particles. Ceramics 2022, 5, 148–160. [Google Scholar] [CrossRef]
  41. Lang, J.F.; You, J.G.; Zhang, X.F.; Luo, X.D.; Zheng, S.Y. Effect of MgO on thermal shock resistance of CaZrO3 ceramic. Ceram. Int. 2018, 44, 22176–22180. [Google Scholar] [CrossRef]
  42. Zirconia Brochure. TOSOH Corporation. Available online: https://www.rbhltd.com/wp-content/uploads/2019/05/Tosoh-Zirconia-Brochure.pdf (accessed on 28 August 2022).
  43. Amarante, J.E.V.; Pereira, M.V.S.; Souza, G.M.; Alves, M.F.R.P.; Simba, B.G.; Santos, C. Roughness and its effects on flexural strength of dental yttria-stabilized zirconia ceramics. Mater. Sci. Eng. A 2019, 739, 149–157. [Google Scholar] [CrossRef]
  44. White, S.N.; Miklus, V.G.; McLaren, E.A.; Lang, L.A.; Caputo, A.A. Flexural strength of a layered zirconia and porcelain dental all-ceramic system. J. Prosthet. Dent. 2005, 94, 125–131. [Google Scholar] [CrossRef]
  45. Teng, X.; Liu, H.; Huang, C. Effect of Al2O3 particle size on the mechanical properties of alumina-based ceramics. Mater. Sci. Eng. A 2007, 452, 545–551. [Google Scholar] [CrossRef]
  46. Piconi, C.; Maccauro, G. Zirconia as a ceramic biomaterial. Biomaterials 1999, 20, 1–25. [Google Scholar] [CrossRef] [PubMed]
  47. Ceramic Materia Comparison Chart. Precision Ceramics USA. 28 August 2022. Available online: https://precision-ceramics.com/materials/properties/hardness/ (accessed on 28 August 2022).
  48. Extreme Hardness Surpassing that of Metals. Fine Ceramic World. Available online: https://global.kyocera.com/fcworld/charact/strong/hardness.html (accessed on 28 August 2022).
  49. Nunes-Pereira, J.; Carneiro, P.M.; Maceiras, A.; Baudín, C.; Silva, A.P. Modelling of elastic modulus of CaZrO3-MgO composites using isotropic elastic and anisotropic models. J. Eur. Ceram. Soc. 2020, 40, 5882–5890. [Google Scholar] [CrossRef]
  50. Ternero, F.; Rosa, L.G.; Urban, P.; Montes, J.M.; Cuevas, F.G. Influence of the total porosity on the properties of sintered materials—A review. Metals 2021, 11, 730. [Google Scholar] [CrossRef]
  51. Balça, F. Otimização de Compósitos Multifásicos de Zircónia para Aplicações Termomecânicas Aeronáuticas. 2022. Available online: https://ubibliorum.ubi.pt/handle/10400.6/13019 (accessed on 28 August 2022).
  52. Rösler, J.; Harders, H.; Bäker, M. Mechanical Behaviour of Engineering Materials: Metals, Ceramics, Polymers, and Composites; Springer Science & Business Media: Berlin/Heidelberg, Germany, 2007. [Google Scholar]
  53. Wellman, R.G.; Dyer, A.; Nicholls, J.R. Nano and Micro indentation studies of bulk zirconia and EB PVD TBCs. Surf. Coat. Technol. 2004, 176, 253–260. [Google Scholar] [CrossRef]
  54. Ragurajan, D.; Golieskardi, M.; Satgunam, M.; Hoque, M.E.; Ng, A.M.H.; Ghazali, M.J.; Ariffin, A.K. Advanced 3Y-TZP bioceramic doped with Al2O3 and MnO2 particles potentially for biomedical applications: Study on mechanical and degradation properties. J. Mater. Res. Technol. 2018, 7, 432–442. [Google Scholar] [CrossRef]
  55. Silva, A.P.; Booth, F.; Garrido, L.; Aglietti, E.; Pena, P.; Baudín, C. Young’s modulus and hardness of multiphase CaZrO3-MgO ceramics by micro and nanoindentation. J. Eur. Ceram. Soc. 2018, 38, 2194–2201. [Google Scholar] [CrossRef]
  56. Cutler, R.A.; Reynolds, J.R.; Jones, A. Sintering and characterization of polycrystalline monoclinic, tetragonal, and cubic zirconia. J. Am. Ceram. Soc. 1992, 75, 2173–2183. [Google Scholar] [CrossRef]
  57. Glymond, D.; Vick, M.J.; Giuliani, F.; Vandeperre, L.J. High-temperature fracture toughness of mullite with monoclinic zirconia. J. Am. Ceram. Soc. 2017, 100, 1570–1577. [Google Scholar] [CrossRef]
  58. Rhee, S.K. Porosity—Thermal conductivity correlations for ceramic materials. Mater. Sci. Eng. 1975, 20, 89–93. [Google Scholar] [CrossRef]
  59. Sun, J.; Hu, Z.; Zhou, J.; Wang, X.; Sun, C. Thermal Properties of Highly Porous Fibrous Ceramics. In Proceedings of the 5th International Conference on Porous Media and Its Applications in Science and Engineering, Kona, Hawaii, 22–27 June 2014. [Google Scholar]
  60. Živcová, Z.; Gregorová, E.; Pabst, W.; Smith, D.S.; Michot, A.; Poulier, C. Thermal conductivity of porous alumina ceramics prepared using starch as a pore-forming agent. J. Eur. Ceram. Soc. 2009, 29, 347–353. [Google Scholar] [CrossRef]
  61. Carneiro, P.M.; Maceiras, A.; Nunes-Pereira, J.; Silva, P.D.; Silva, A.P.; Baudín, C. Property characterization and numerical modelling of the thermal conductivity of CaZrO3-MgO ceramic composites. J. Eur. Ceram. Soc. 2021, 41, 7241–7252. [Google Scholar] [CrossRef]
  62. Cao, X.; Vassen, R.; Stoever, D. Ceramic materials for thermal barrier coatings. J. Eur. Ceram. Soc. 2004, 24, 1–10. [Google Scholar] [CrossRef]
  63. Thermal Conductivity Easily Transmits Heat. Fine Ceramics World. Available online: https://global.kyocera.com/fcworld/charact/heat/thermalcond.html?_sm_au_=iVVVM32RrVnNH5f6f7CV7K0qc3s8c (accessed on 28 August 2022).
  64. Zhao, H.; Yu, F.; Bennett, T.D.; Wadley, H.N. Morphology and thermal conductivity of yttria-stabilized zirconia coatings. Acta Mater. 2006, 54, 5195–5207. [Google Scholar] [CrossRef]
  65. Schlichting, K.W.; Padture, N.P.; Klemens, P.G. Thermal conductivity of dense and porous yttria-stabilized zirconia. J. Mater. Sci. 2001, 36, 3003–3010. [Google Scholar] [CrossRef]
  66. Schafföner, S.; Fruhstorfer, J.; Faßauer, C.; Freitag, L.; Jahn, C.; Aneziris, C.G. Influence of in situ phase formation on properties of calcium zirconate refractories. J. Eur. Ceram. Soc. 2017, 37, 305–313. [Google Scholar] [CrossRef]
  67. Schafföner, S.; Aneziris, C.G.; Berek, H.; Hubálková, J.; Priese, A. Fused calcium zirconate for refractory applications. J. Eur. Ceram. Soc. 2013, 33, 3411–3418. [Google Scholar] [CrossRef]
  68. Hou, Z.F. Ab initio calculations of elastic modulus and electronic structures of cubic CaZrO3. Phys. B Condens. Matter 2008, 403, 2624–2628. [Google Scholar] [CrossRef]
  69. Aksel, C.; Rand, B.; Riley, F.L.; Warren, P.D. Thermal shock behaviour of magnesia–spinel composites. J. Eur. Ceram. Soc. 2004, 24, 2839–2845. [Google Scholar] [CrossRef]
  70. Compare by Thermal Expansion Coefficient. Nishimura Advanced Ceramics. Available online: https://nishimuraac.com/propertie/compare-by-thermal-expansion-coefficient/ (accessed on 28 August 2022).
  71. Zirconia Ceramics. STC Material Solutions. Available online: https://ceramics.net/wp-content/uploads/stc-material-brochure-zirconia-ceramic-web-NEW-LOGO.pdf (accessed on 28 August 2022).
  72. Wintersgill, M.; Fontanella, J.; Andeen, C.; Schuele, D. The temperature variation of the dielectric constant of ‘‘pure’’ CaF2, SrF2, BaF2, and MgO. J. Appl. Phys. 1979, 50, 8259–8261. [Google Scholar] [CrossRef]
  73. Fontanella, J.; Andeen, C.; Schuele, D. Low-frequency dielectric constants of α-quartz, sapphire, MgF2, and MgO. J. Appl. Phys. 1974, 45, 2852–2854. [Google Scholar] [CrossRef]
  74. Bartels, R.; Smith, P. Pressure and temperature dependence of the static dielectric constants of KCl, NaCl, LiF, and MgO. Phys. Rev. B 1973, 7, 3885–3892. [Google Scholar] [CrossRef]
  75. Subramanian, M.; Shannon, R.; Chai, B.; Abraham, M.; Wintersgill, M. Dielectric constants of BeO, MgO, and CaO using the two-terminal method. Phys. Chem. Miner. 1989, 16, 741–746. [Google Scholar] [CrossRef]
  76. Birey, H. Thickness dependence of the dielectric constant and resistance of Al2O3 films. J. Appl. Phys. 1977, 48, 5209–5212. [Google Scholar] [CrossRef]
  77. Xing, C.; Wang, J.; Li, J.; Shi, F. Precise prediction of dielectric property for CaZrO3 ceramic. J. Adv. Dielectr. 2018, 8, 1850029. [Google Scholar] [CrossRef]
  78. Prasanth, C.; Kumar, H.; Pazhani, R.; Solomon, S.; Thomas, J. Synthesis, characterization and microwave dielectric properties of nanocrystalline CaZrO3 ceramics. J. Alloys Compd. 2008, 464, 306–309. [Google Scholar] [CrossRef]
  79. Lee, W.; Su, C.; Lee, Y.; Lin, S.; Yang, T. Effects of dopant on the dielectric properties of CaZrO3 ceramic sintered in a reducing atmosphere. Jpn. J. Appl. Phys. 2006, 45, 5853–5858. [Google Scholar] [CrossRef]
  80. Thorp, J.; Buckley, H. The dielectric constants of current-blackened single crystral yttria-stabilized zirconia. J. Mater. Sci. 1973, 8, 1401–1408. [Google Scholar] [CrossRef]
  81. Subramanian, M.; Shannon, R. Dielectric constant of Y-stabilized zirconia, the polarizability of zirconia and the oxide additivity rule. Mater. Res. Bull. 1989, 24, 1477–1483. [Google Scholar] [CrossRef]
  82. Lanagan, M.; Yamamoto, J.; Bhalla, A.; Sankar, S. The dielectric properties of yttria-stabilized zirconia. Mater. Lett. 1989, 7, 437–440. [Google Scholar] [CrossRef]
  83. Liang, G.; Bi, J.; Sun, G.; Wang, W.; Wang, L. Effect of boron nitride nanosheets addition on the mechanical and dielectric properties of magnesium oxide ceramics. Ceram. Int. 2020, 46, 23669–23676. [Google Scholar] [CrossRef]
  84. Rajab, K.; Naftaly, M.; Linfield, E.; Nino, J.; Arenas, D.; Tanner, D.; Mittra, R.; Lanagan, M. Broadband dielectric characterization of aluminum oxide (Al2O3). J. Microelectron. Electron. Packag. 2008, 5, 2–7. [Google Scholar] [CrossRef]
  85. Singh, S.; Kumar, P.; Mondal, D. Advanced Ceramics for Versatile Interdisciplinary Applications; Elsevier: Amsterdam, The Netherlands, 2022; pp. 89–109. [Google Scholar]
  86. Jebli, M.; Rayssi, C.; Dhahri, J.; Henda, M.; Belmabrouk, H.; Bajahzar, A. Structural and morphological studies, and temperature/frequency dependence of electrical conductivity of Ba0.97La0.02Ti1−xNb4x/5O3 perovskite ceramics. RSC Adv. 2021, 11, 23664–23678. [Google Scholar] [CrossRef] [PubMed]
Figure 1. Representative SEM images of polished and thermally etched surfaces of (a) MA (light gray grains—MA; dark regions—porosity), (b) MCZ (light gray grains—CaZrO3; dark grains—MgO), and (c) YSZ (light gray grains—YSZ; dark regions—grain boundaries).
Ceramics 07 00023 g001
Figure 2. XRD analysis of MA, MCZ, and YSZ samples.
Ceramics 07 00023 g002
Figure 3. Young’s and shear moduli that were experimentally obtained for MA, MCZ, and YSZ ceramic composites.
Ceramics 07 00023 g003
Figure 4. Flexural strength that was experimentally obtained for MA, MCZ, and YSZ ceramic composites.
Ceramics 07 00023 g004
Figure 5. Fracture geometry of (a) MA, (b) MCZ, and (c) YSZ ceramic composites.
Ceramics 07 00023 g005
Figure 6. Characteristic results from Vickers indentation for the three composites (a) MA, (b) MCZ (light gray grains—CaZrO3; dark grains—MgO), and (c) YSZ (light gray grains—YSZ; dark regions—grain boundaries).
Ceramics 07 00023 g006
Figure 7. Hardness and fracture toughness that were experimentally obtained for MA, MCZ, and YSZ ceramic composites.
Ceramics 07 00023 g007
Figure 8. Characteristic fracture surface of the three ceramic composites: (a) MA, (b) MCZ, and (c) YSZ.
Ceramics 07 00023 g008
Figure 9. Thermal conductivity variation as a function of temperature for MCZ, MA, and YSZ ceramic composites.
Ceramics 07 00023 g009
Figure 10. CTE variation as a function of temperature for YSZ, MCZ, and MA ceramic composites.
Ceramics 07 00023 g010
Figure 11. (a) Dielectric constant (ε′), (b) dielectric loss (tan(δ)), and (c) A.C. electrical conductivity (σ′) of the three ceramic composites.
Ceramics 07 00023 g011
Table 1. Mean diametrical linear contraction values and associated error of sintered ceramic composites.
Ceramic Composite C d [ % ] Sintering Temperature [°C]
MA13.0 ± 0.21600
MCZ24.0 ± 0.11450
YSZ27.4 ± 0.31450
Table 2. Thermal conductivity of MA, MCZ, and YSZ ceramic composites at 30 °C and 700 °C.
Ceramic CompositeThermal Conductivity [W/(mK)]
Room Temperature (30 °C)High Temperature (700 °C)
MA5.612.95
MCZ6.953.59
YSZ2.871.91
Table 3. Average CTE values of MA, MCZ, and YSZ ceramic composites at room and high temperatures.
Ceramic CompositeMaterial CTE [10−6/°C]
Room Temperature [20; 30]High Temperature [800; 950]
MA5.69.0
MCZ8.210.9
YSZ9.311.1
Disclaimer/Publisher’s Note: The statements, opinions and data contained in all publications are solely those of the individual author(s) and contributor(s) and not of MDPI and/or the editor(s). MDPI and/or the editor(s) disclaim responsibility for any injury to people or property resulting from any ideas, methods, instructions or products referred to in the content.

