1. Introduction
Transparent polycrystalline ceramics can replace single crystals in optical applications, such as scintillators, light converters, and, in the case of YAG-based compositions, solid-state laser gain media [
1,
2,
3]. The ceramic process offers several advantages over the melt growth methods used to prepare single crystals: in particular, faster production times, increased doping levels and the opportunity to design profiles and structures before sintering. Although significant progress has been made in improving the optical quality, ceramics often scatter light more than single crystals due to microstructural features like pores, impurities, grain boundaries, and birefringence effects [
4,
5]. Ceramics are polycrystalline materials with a microstructure that forms during the sintering process and that is strongly influenced by the shaping process. A green compact is formed by particles assembled together through pressing, casting, or other shaping techniques and is then densified during the sintering process. Transparent ceramics need to reach full density during sintering; i.e., pores should be completely removed. To promote complete densification, during the shaping step, compact particle packing should be obtained and the porosity should be homogeneous in size and shape. In addition, to ease the densification, advanced sintering techniques (e.g., vacuum sintering, sintering in the atmosphere of a specific gas, or pressure-assisted sintering) are often used, separately or together, and are often coupled with suitable sintering aids [
6,
7,
8,
9]. The production of transparent ceramics is therefore a complex process that involves several processing steps, and each of them could be responsible for defect formation. All these features make it challenging to identify the source of any defects that may arise. Furthermore, most of the defects can be identified only at the end of the production process and after sample polishing.
To ensure competitiveness with a single crystal, it is important for the ceramic to be free from defects. The presence of secondary phases and residual porosity are among the most common defects that need to be addressed [
10,
11]. Yet, of all the factors that contribute to light scattering, the most significant cause of light attenuation in transparent ceramics is pore scattering [
4,
10,
12]. This is due to the major difference between the refractive index of the ceramic matrix and the defects: the difference between the ceramic phase and the pores is about one order of magnitude higher compared to that of two oxide phases. The difference between the refractive indexes is determinative of the attenuation of the effects of scattering centres in a transparent medium.
Measuring the concentration and dimensional distribution of defects is a daily challenge in the study of transparent ceramics. Frequently used analytical techniques include scanning electron microscopy (SEM) and measurements of optical transmittance [
13,
14]. SEM analysis can be used to examine the microstructure and determine the nature of the defects. However, this analysis is limited to the surface of the material, and, in the case of high optical quality, the concentration of defects decreases to such an extent that many images would need to be taken for a thorough analysis. In addition, it is a destructive analysis because several layers of the material should be cut, polished, and observed. Optical transmittance measurement provides a rapid means of assessing the optical quality of the material. In this case, the entire thickness of the sample is analysed, providing more information about the material’s performance under real-world conditions. However, transmittance alone does not provide accurate information about the size and distribution of the defects.
There is therefore a need for a non-destructive experimental technique for the quantitative evaluation of the concentration and size of defects present in a volume that is representative of the entire sample. Many groups have proposed methods to characterize residual porosity in transparent materials. In 1991, Lopez et al. used the custom setup of a 1.06 µm YAG laser and an IR camera to capture the pores inside a fluoride glass [
15]. More recently, Stuer et al. [
16] proposed a characterization technique utilizing 3D focused ion beam (FIB) tomography coupled with SEM to slice and reconstruct pore positions in transparent alumina. This technique is well suited to the characterization of nanometric-sized pores (<150 nm in diameter), resulting in a relatively small analysed volume of approximately 69 µm
3, due to the high magnification used. Another drawback of this technique is that it is destructive. Boulesteix et al. [
17] used confocal laser scanning microscopy (CLSM) to reconstruct the pore distribution within Nd:YAG. However, due to the low resolution of CLSM, an additional SEM analysis over many images was required to determine the pore size. Kosyanov et al. and Yavetskiy et al. used CLSM to calculate both the pore size and their concentration in Nd:YAG [
18,
19]. These techniques are non-destructive and allow for the analysis of larger volumes, approximately ~1.25 × 10
5 µm
3 according to Yavetskiy et al. and 2 × 10
5 µm
3 according to Boulesteix et al. The average pore size detected for Yavetskiy was from 150 to 200 nm, and for Boulesteix, it was from 0.5 to 0.7 µm [
17,
19].
All these techniques, which involve the use of SEM or CLSM, are subject to the so-called “corpuscle problem”, which was raised and solved by Wicksell in 1925 [
20]. The “corpuscle problem” addresses the problem of determining the distribution of spherical particles from planar sections by reconstructing the true size of pseudo-spherical features on a flat image that represent a cross-section of the material under examination. When arbitrarily slicing a transparent ceramic, in the search for defects, the chances of having all the defects sliced in their centre is zero. It has also been observed that large defects are statistically more prone to be sliced compared to smaller ones. As a result, the observed diameter of the defects is generally smaller than the real diameter of the defects and the smaller portion of defects can be under-assessed. It is worth noting that this issue is not limited to defect quantification in transparent polycrystalline ceramics, but it is also present in various other branches of natural sciences, ranging from biology to astronomy. Other researchers have also contributed to the refinement of Wicksell’s results [
20], including Saltykov [
21], Cruz-Orive [
22], and, more recently, Pabst et al. [
23].
Jin et al. [
5] quantified the overall amount of residual porosity of ceramics based on YAG using an optical microscope and found a relationship between the residual porosity and the scattering coefficient. In their study, they captured an image focused on each pore that they found in the analysed volume. This approach is effective in avoiding the “corpuscle problem” because the slicing process captures the pore at its maximum diameter and all the pores are recorded, not only the larger ones, thus simplifying the calculation. This method is particularly suitable for materials of high optical quality, in which the number of pores is low. However, it is important to note that the number of images quickly increases, making analysis slow.
In this study, we use a digital optical microscope for the rapid analysis of large sample volumes (~2.2 × 10⁷ µm
3) and for a precise quantification of the number and size of pores, which are the main defects observed in YAG-based ceramics. The specific technique, called bulk defect analysis, is based on capturing focus-stacked images within the sample, which are then analysed using image analysis software. The depth of field of the optical microscope is much higher compared to CLSM and, above all, is higher than the distance between the stacked layers. This means that the image takes into account all the pores at their maximum diameter. Therefore, the “corpuscle problem” does not apply to bulk defect analysis in the same way as it does for Jin et al. [
5].
For transparent materials, optical microscopy allows for the examination of not only the surface but also the entire volume of the sample. However, bulk defect analysis is not meant as a substitute for SEM, but as a complementary analysis. Bulk defect analysis may be particularly useful for the analysis of micrometric pores, which have greater scattering properties than nanopores (<150 nm) from the visible to NIR spectrum [
12,
24].
2. Experimental Methods
High-purity powders, including Y
2O
3 (≥99.99%, D
50: 0.22 µm; Nippon Yttrium Co., Ltd., Fukuoka, Japan), Al
2O
3 (≥99.99%, D
50: 0.12 µm; Baikowski, Poisy, France), and Yb
2O
3 (≥99.9%, D
50: 0.27 µm; Nippon Yttrium Co., Ltd., Fukuoka, Japan) were used. As sintering aids, TEOS (TetraEthyl OrthoSilicate, ≥99.999%, Sigma Aldrich, Burlington, MA, USA) and MgO (≥99.99%, D
50: 1.35 µm; Baikowski, Poisy, France) were incorporated. Defloc Z3 (Werner G. Smith Inc., Cleveland, OH, USA) was used as the dispersant at a concentration of 2 wt.% relative to the solids’ weight. Samples with a composition of 10 at.% Yb:YAG (Yb
0.3Y
2.7Al
5O
12) were produced through reactive sintering in high vacuum furnace. The ceramic process is similar to the one reported in our previous work [
25], with minor modifications, as reported in
Table 1. The powders, TEOS, and the dispersant were dispersed in absolute ethanol with high purity (99.9%) alumina milling media in polyethylene bottles and mixed on a roller mill for 24 h at 80 rpm. The powder-to-ethanol ratio used was 1 to 2, while the powder-to-milling-media ratio was 1 to 2. Then, the milling media were separated from the suspension and the solvent removed via rotary evaporator or oven drying. The use of a rotary evaporator was expected to help avoid selective sedimentation of the powders since, during the desiccation, the suspension was kept in motion; after ethanol evaporation, the powders were placed in oven at 80 °C for 12 h. To remove the solvent via oven drying, the suspension is poured into a glass crystallization dish and placed into an oven at 80 °C for 24 h. The dried powders were sieved using a 134 µm (110 mesh) disposable plastic silkscreen. The samples were shaped into pellets with diameter of 15 mm via linear and isostatic pressing. For linear pressing, the powders were poured into a steel die and pressed at 80 MPa. The pressed pellets were cold-isostatic-pressed at 250 MPa. Pellets were calcinated in air at 800 °C for 1 h to remove humidity and residual organics. The calcinated pellets were sintered at 1750 °C for 16 h under high vacuum in a clean furnace with tungsten heating elements. In selected mixtures, an ultrasonication step was added between ball milling and desiccation using a 20 kHz ultrasonic probe (Sonics GEX500, Sonics & Materials, Inc., Newtown, CT, USA); the probe settings were amplitude of 35%, cycles of 10 s on and 2 s off, and total time of 20 min.
The sintered samples underwent mirror polishing on both faces with diamond suspensions from 15 µm down to 0.25 µm using an automated polishing machine (Tegramin 25, Struers, Copenhagen, Denmark). Transmittance spectra were recorded with a UV-Vis spectrometer (Lambda 750, PerkinElmer Inc., Shelton, CT, USA) in the wavelength range from 200 to 1500 nm. The microstructure of the polished surfaces was analysed with a scanning electron microscope (ΣIGMA, Carl Zeiss microscopy GmbH, Oberkochen, Germany) equipped with Energy Dispersive X-ray analysis (EDX) probe INCA Energy X-Act (Oxford Instrument plc, Abingdon, UK). The X-ray diffractometry analysis (XRD) was performed with the D8 Advanced instrument (Bruker Co., Billerica, MA, USA).
In the bulk defect analysis, a digital optical microscope (RH-2000, Hirox Co., Tokyo, Japan) was employed. To conduct porosity analysis, an automated focus stacking function was used to acquire multiple images (slices) at different depths of focus and to merge them into a single image with only the in-focus pixels. The magnification used was 400×. The distance between each slice was 4 µm. Thanks to the high depth of field of the Hirox optical microscope (20 µm at 400×), all the pores in the focus-stacked image were captured at their maximum diameter. This enhanced the precision of the measurement and greatly simplified the calculations. The focus-stacked image is a flat image that represents a portion of the sample volume.
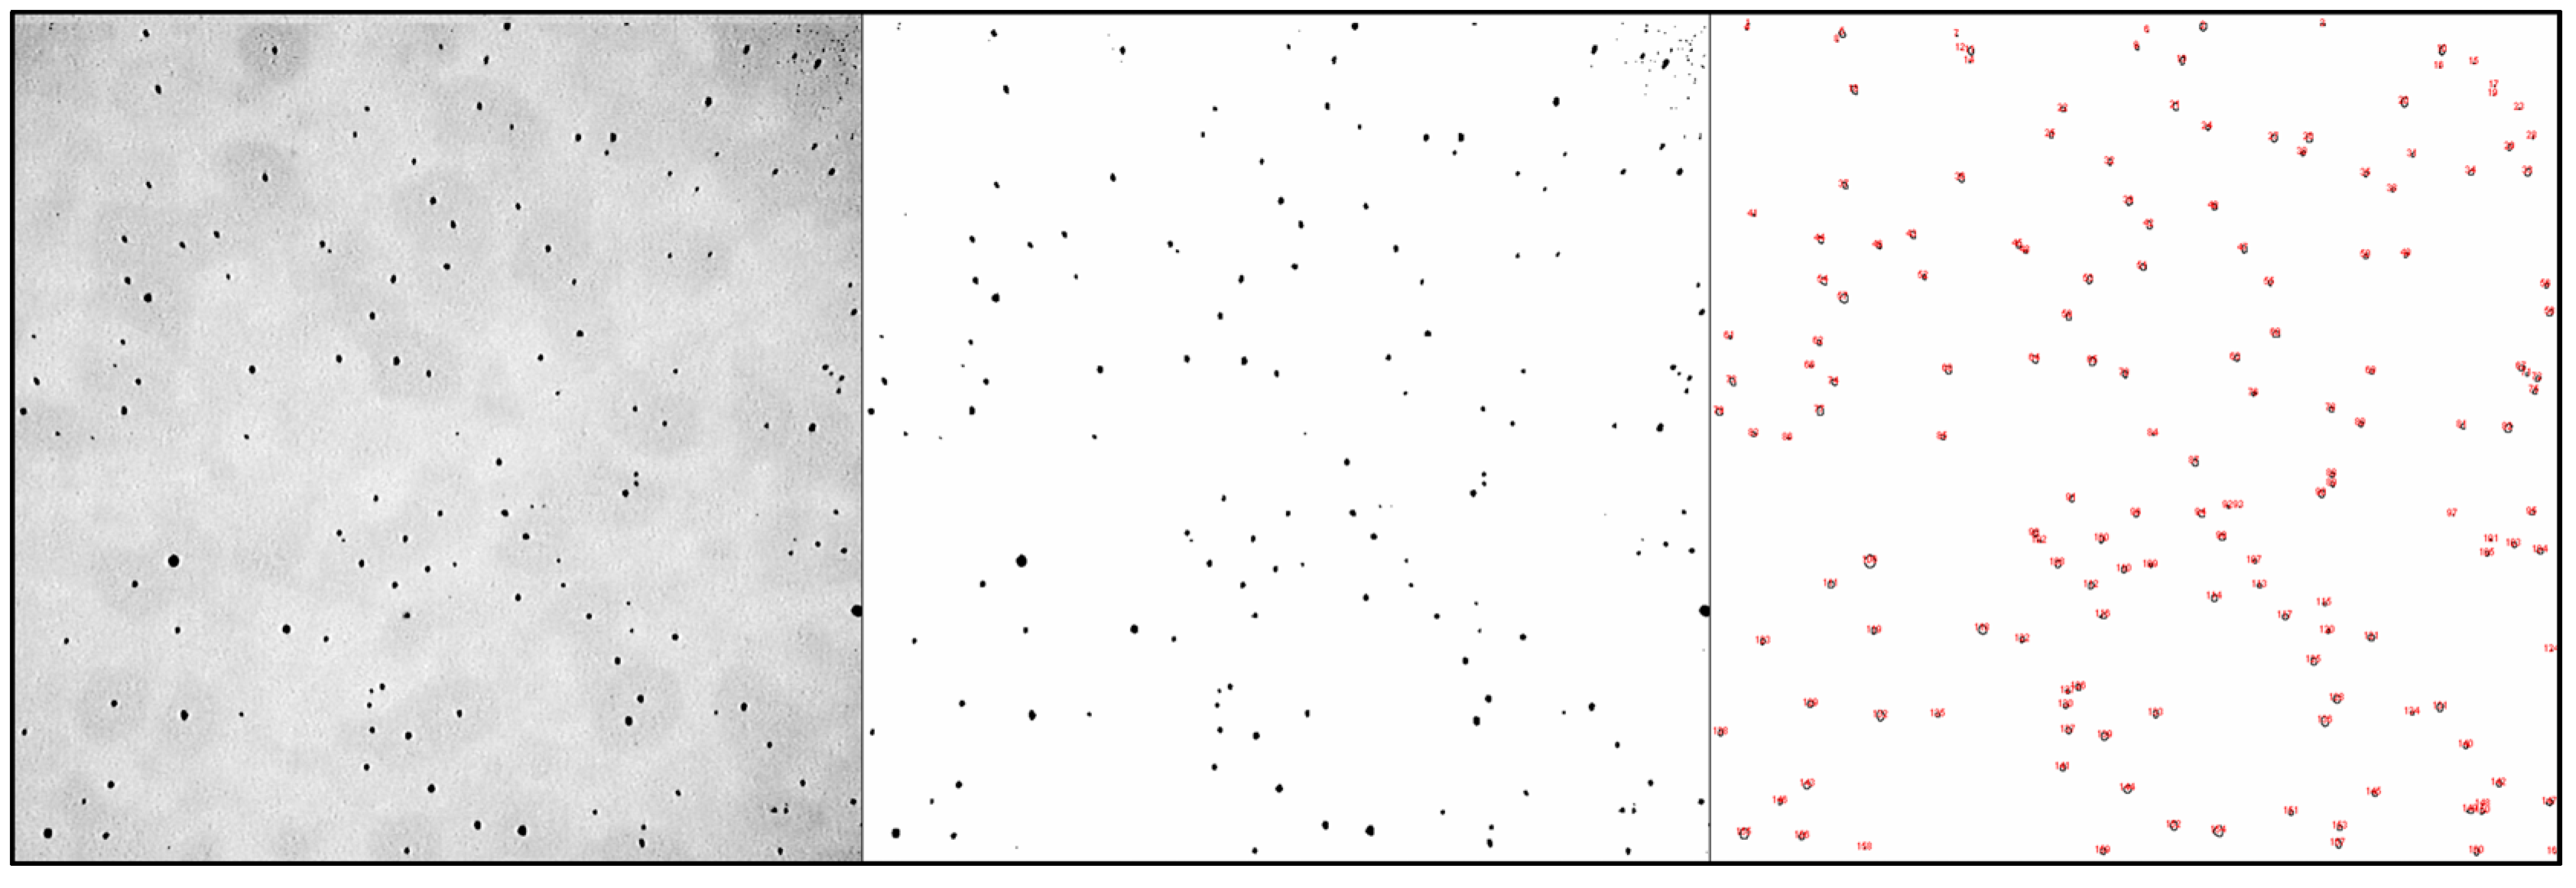
The acquired images were processed using the ImageJ (version 1.5.3) image analysis software. The software requires a binary (1 bit, black and white) image that distinguishes material from porosity. Image processing and analysis are shown in
Figure 1. The analysed depth in the samples is 250 µm, and pictures are squares with a side length of approximately 300 µm. The total volume analysed with each picture is approximately 2.2 × 10
7 µm
3. Three pictures were captured in different areas of each sample. A spherical pore shape was considered.
Using the obtained data, the average pore diameter, residual porosity by volume (
rpV, the quantity generally described simply as porosity), and residual porosity by number (
rpN, the number of pores per volume) were calculated using the following formulae:
3. Results and Discussion
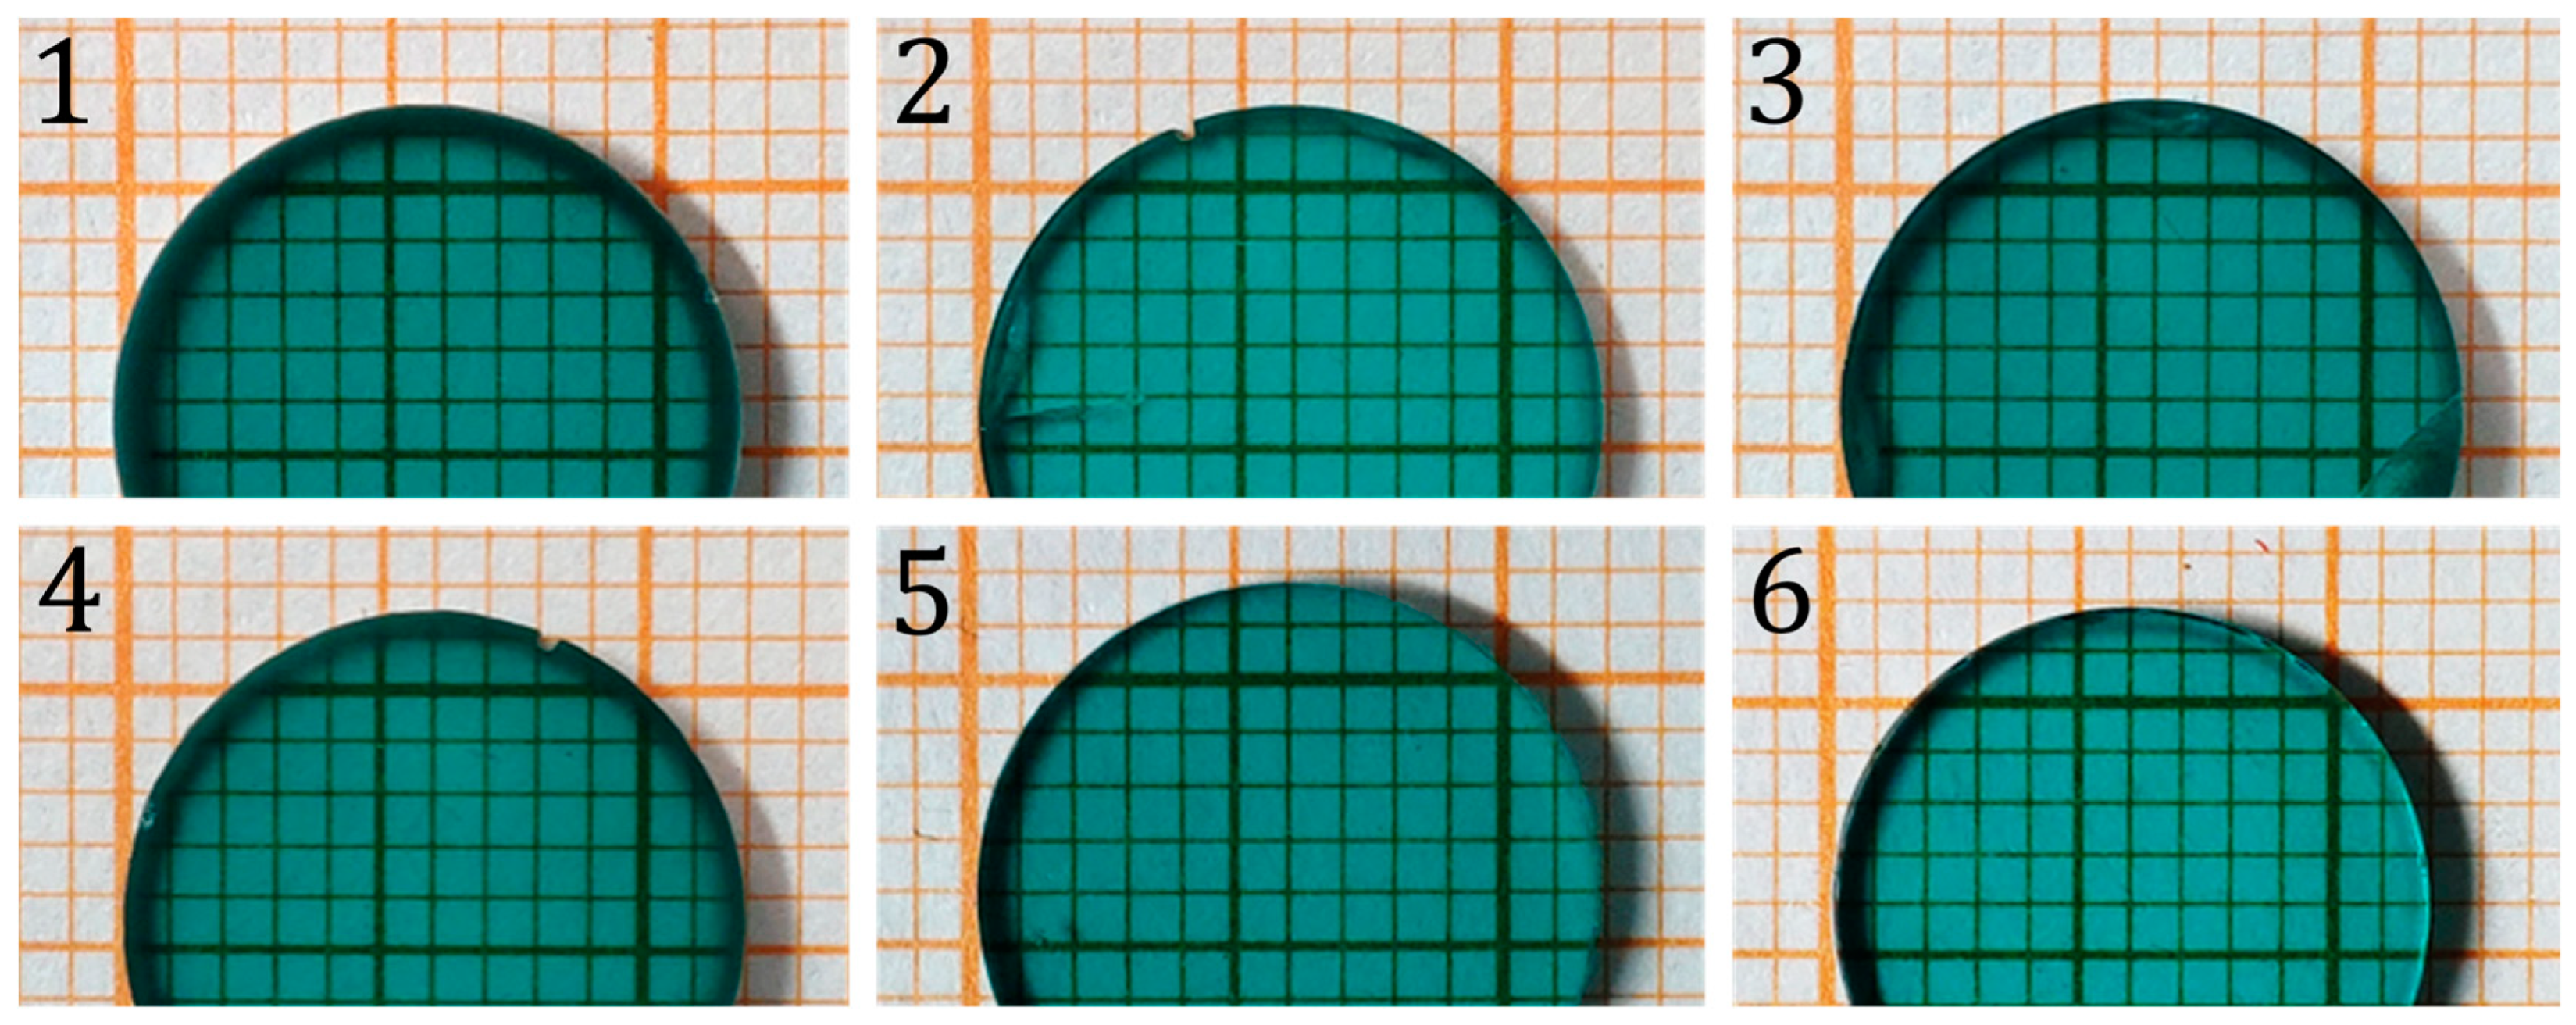
Figure 2 displays photographs of the obtained samples; it can be observed that they all have a transparent appearance and are free from macro-defects.
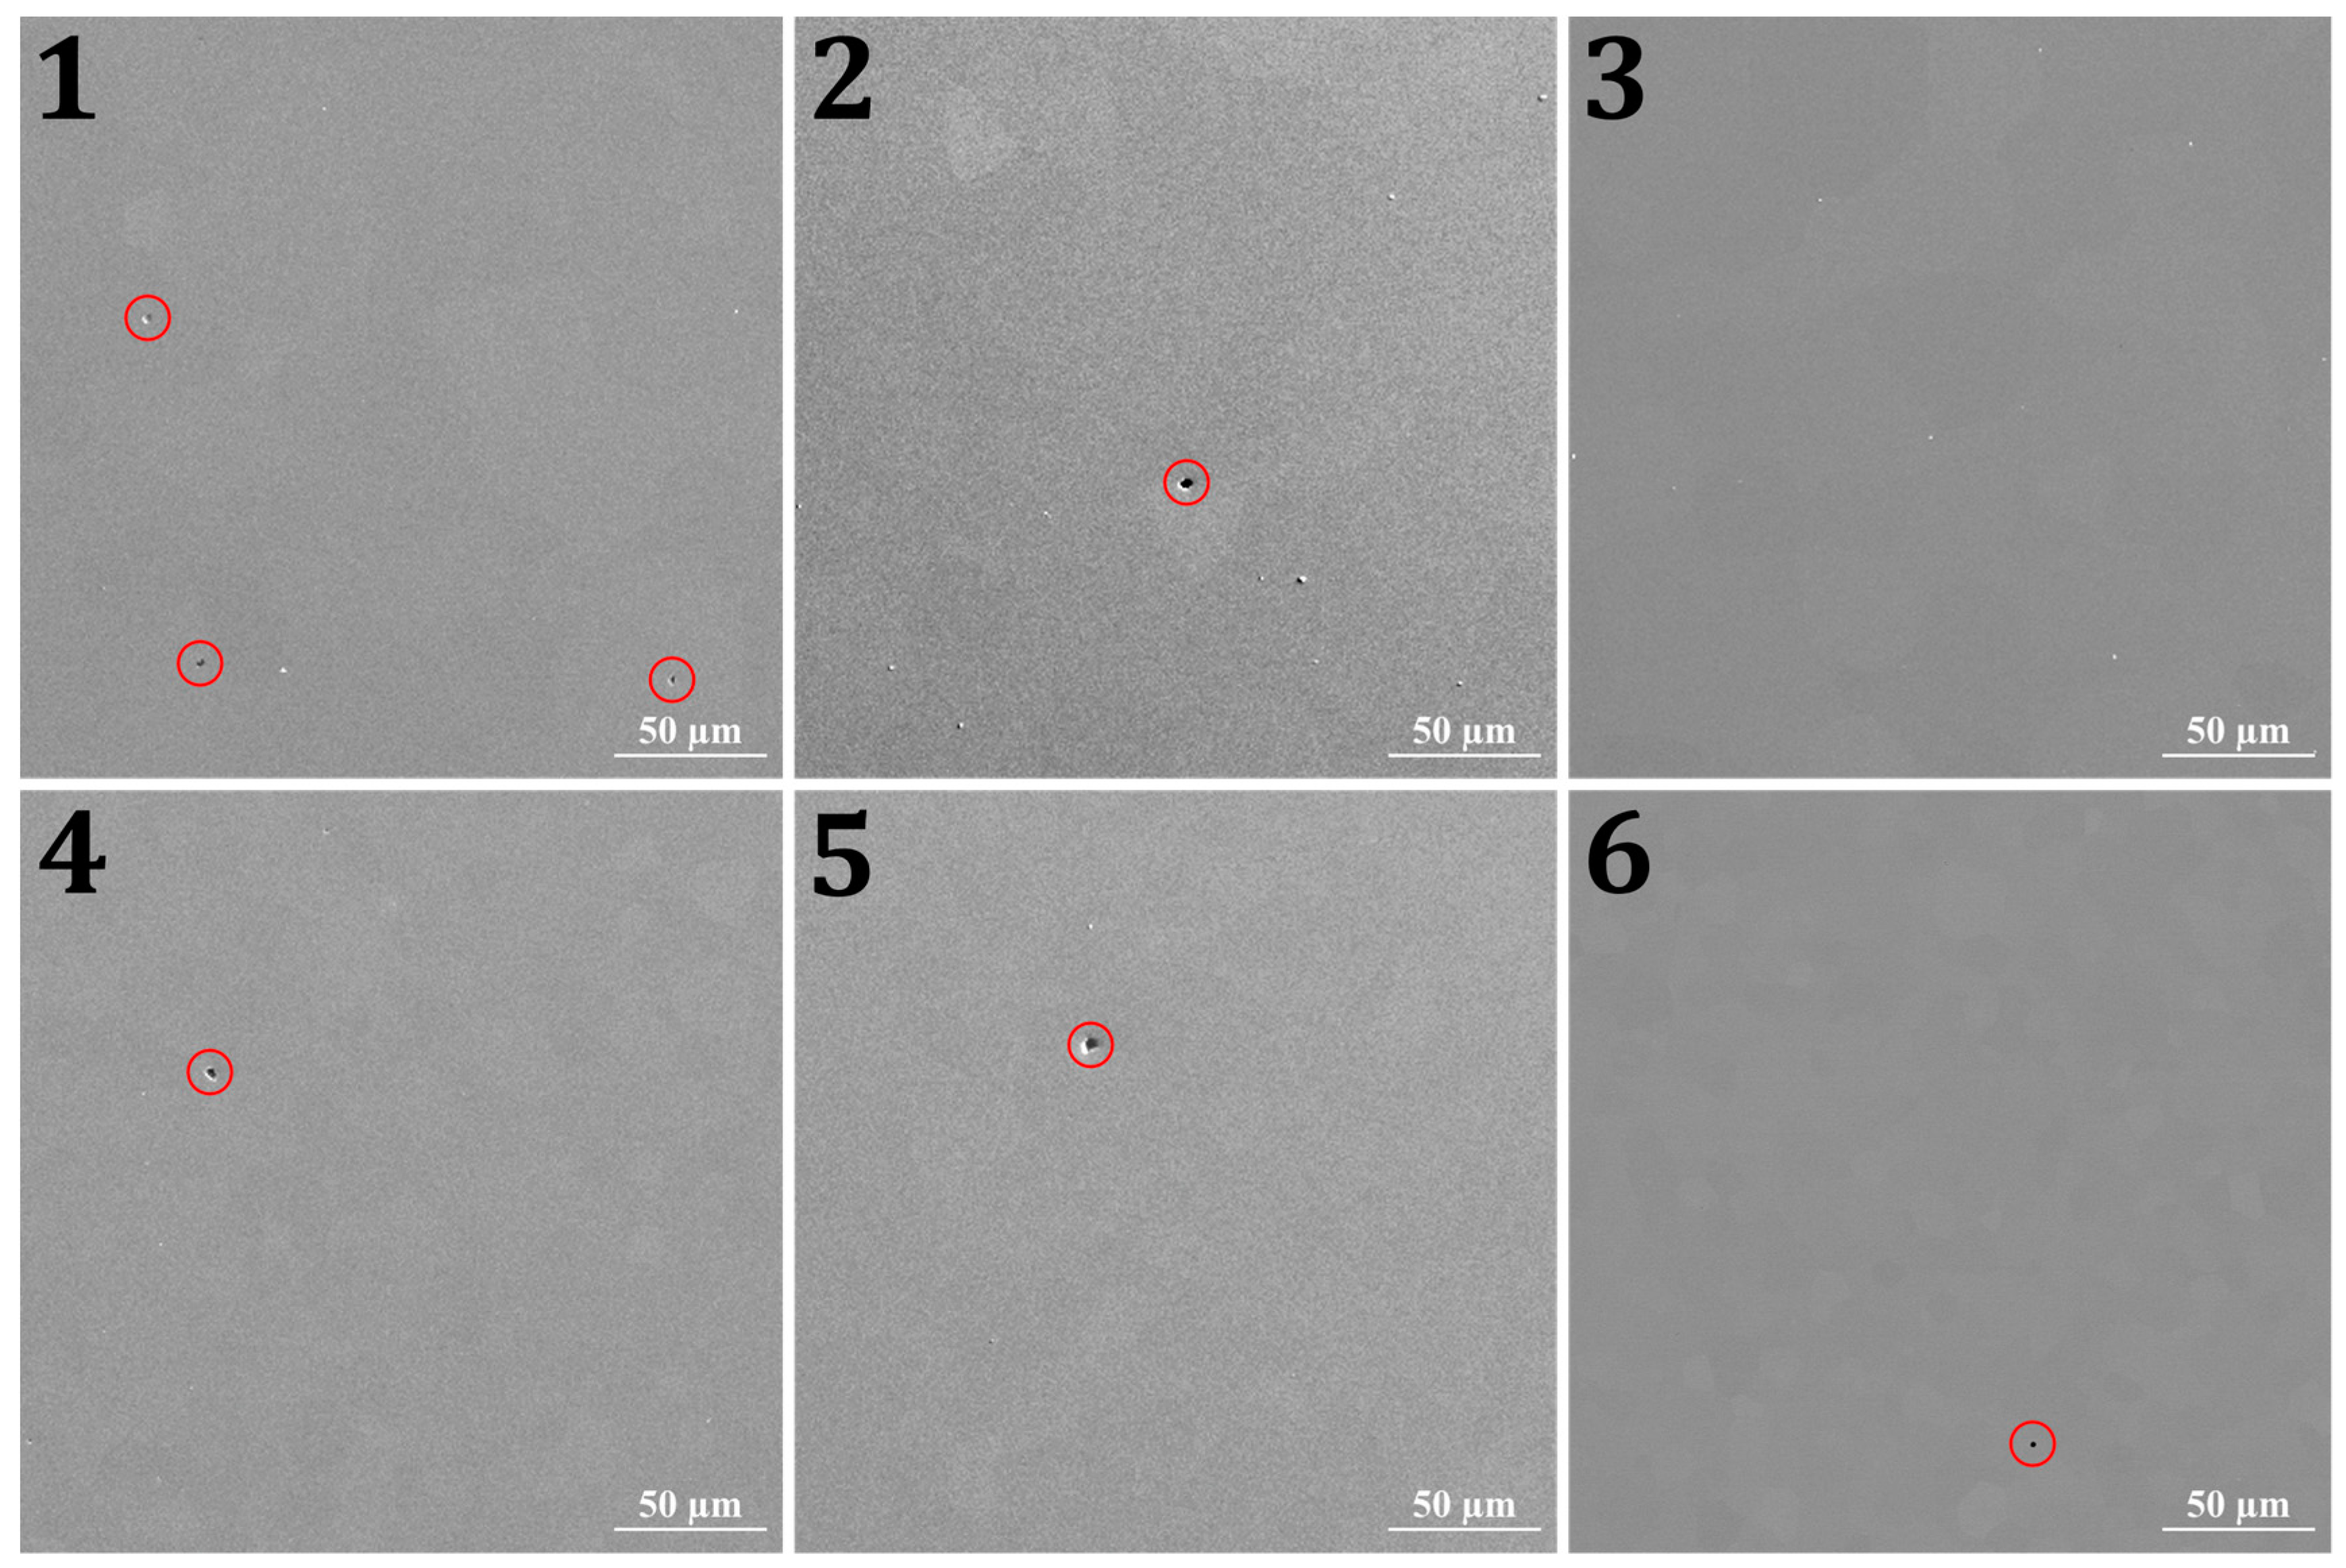
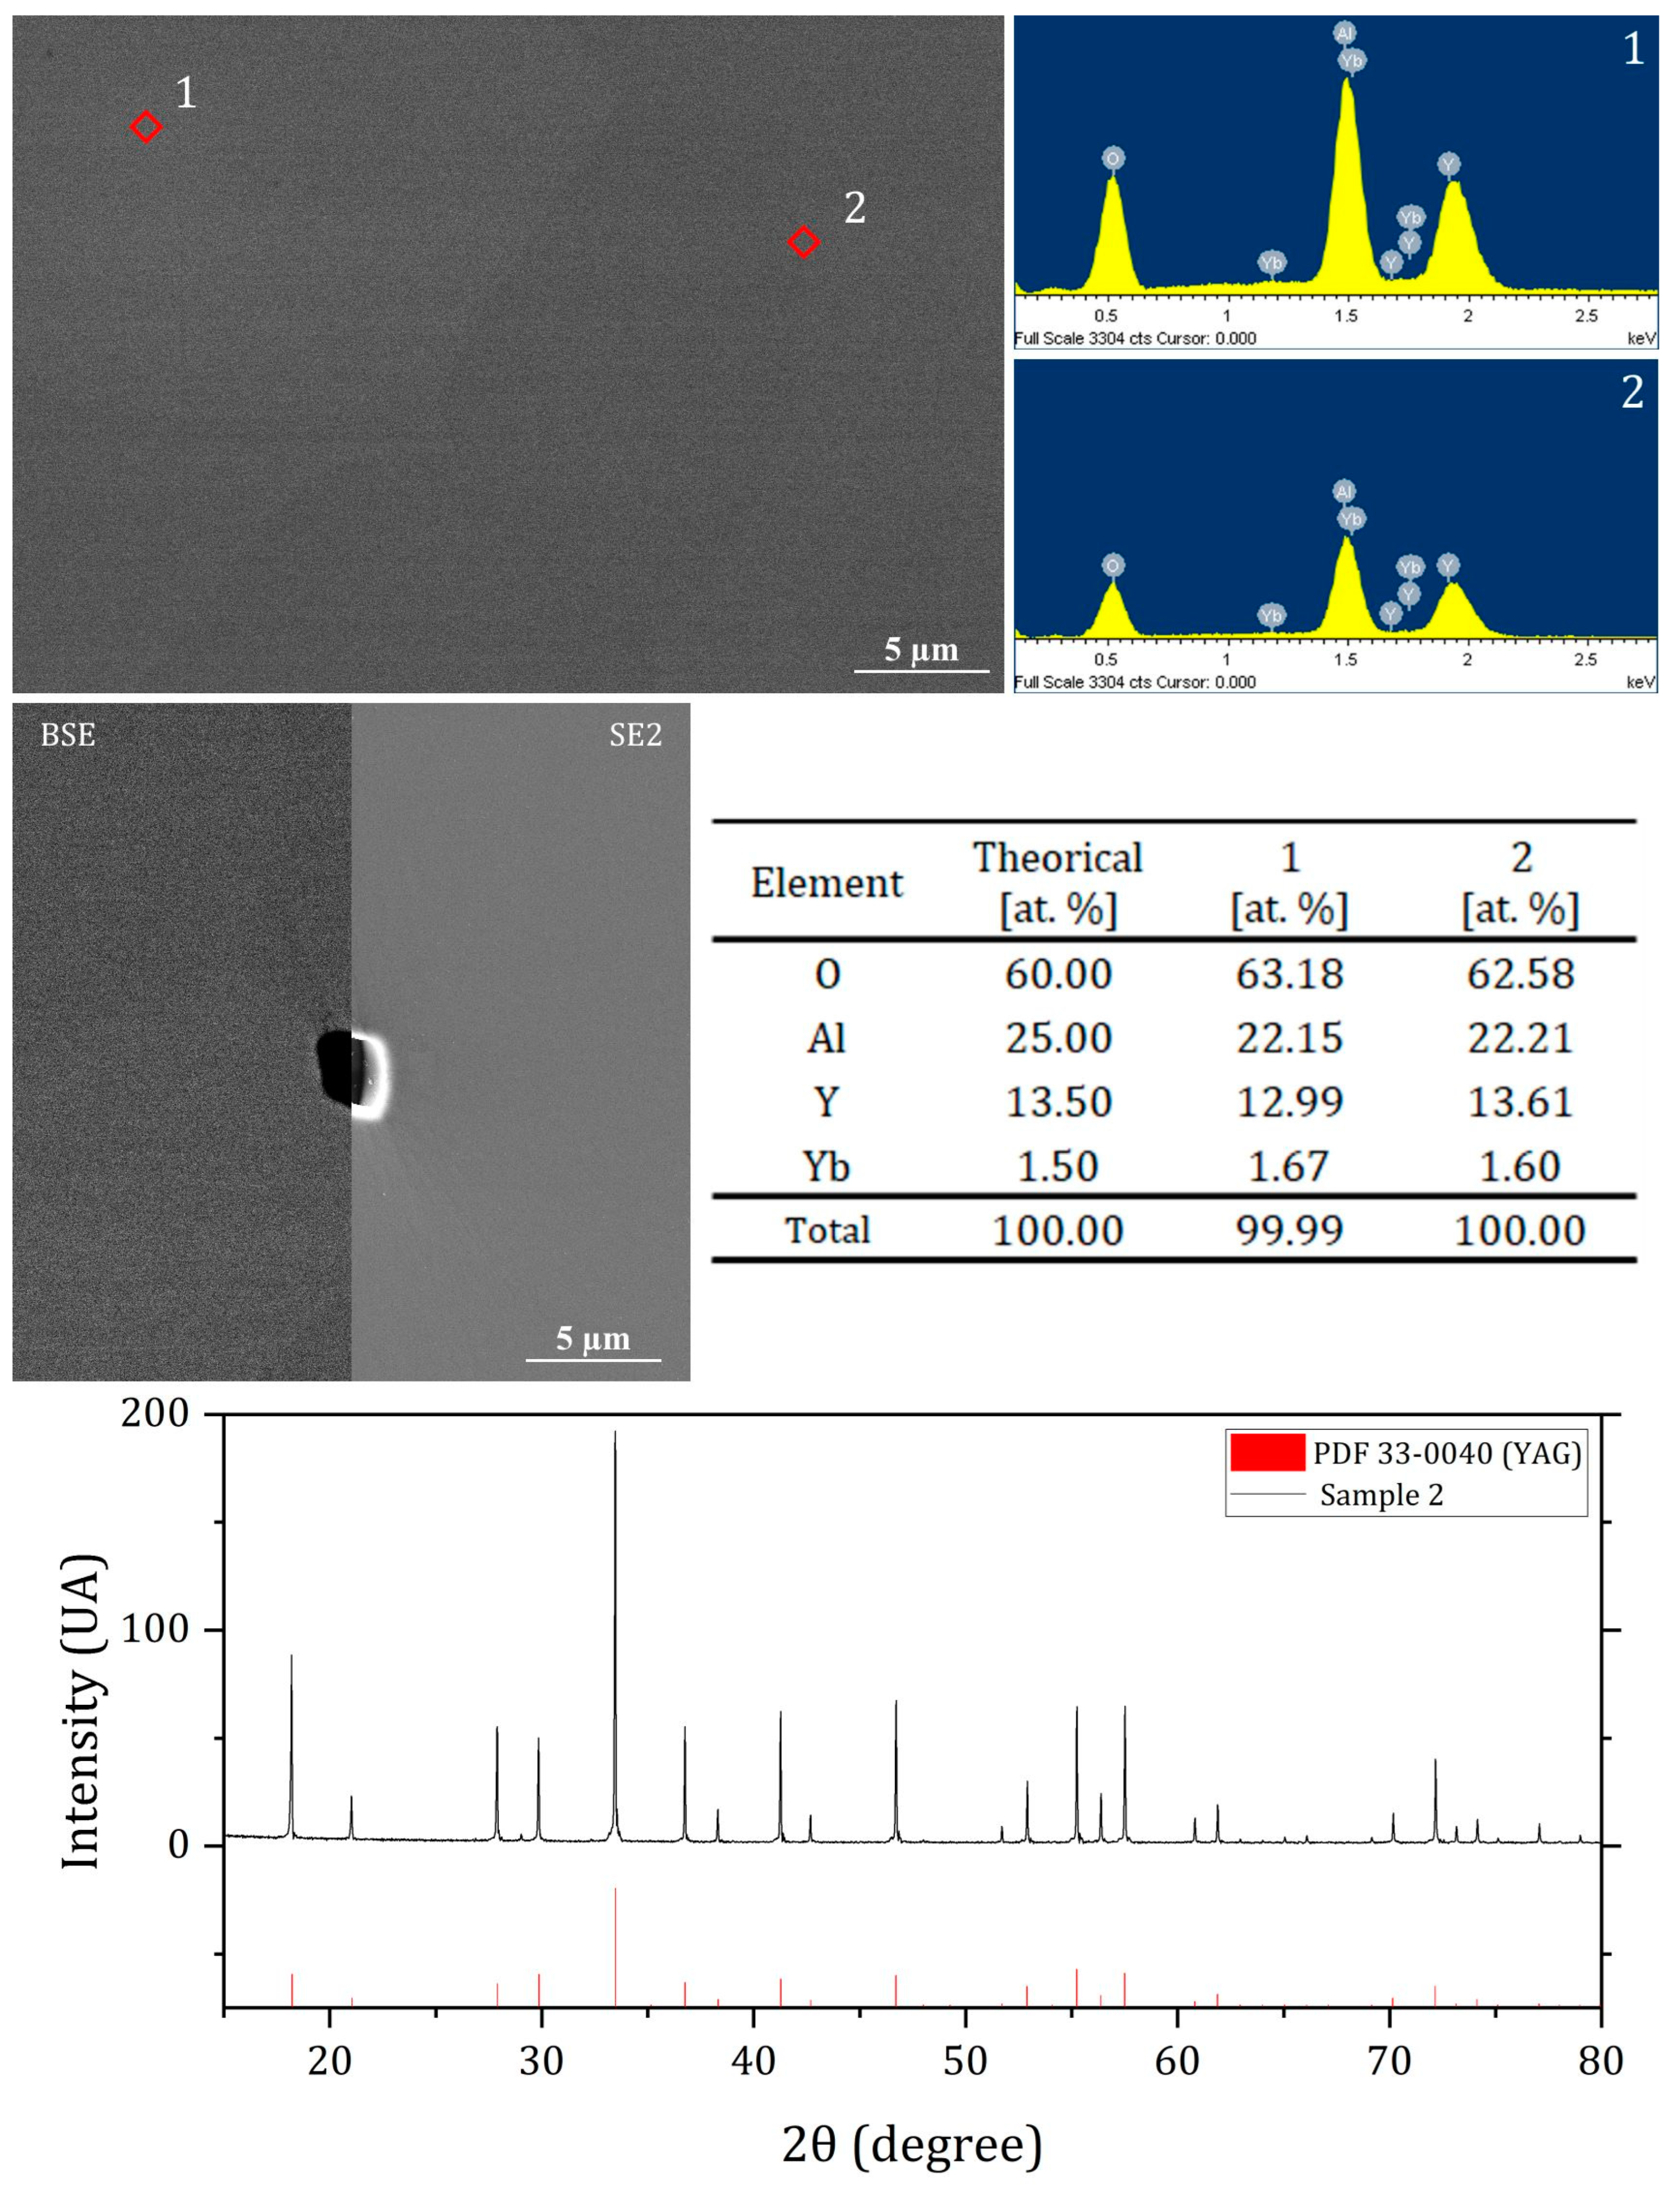
The SEM analysis (
Figure 3 and
Figure 4) revealed the absence of secondary phases. The identified defects comprised a few pores (highlighted by red circles in
Figure 3), except for sample 3, where no defects were detected via SEM observation. However, the concentration of pores on the sample surface was too low to be accurately measured via SEM and to allow a comparison between samples. The composition and crystal structure of YAG were confirmed via EDX and XRD analysis (
Figure 4).
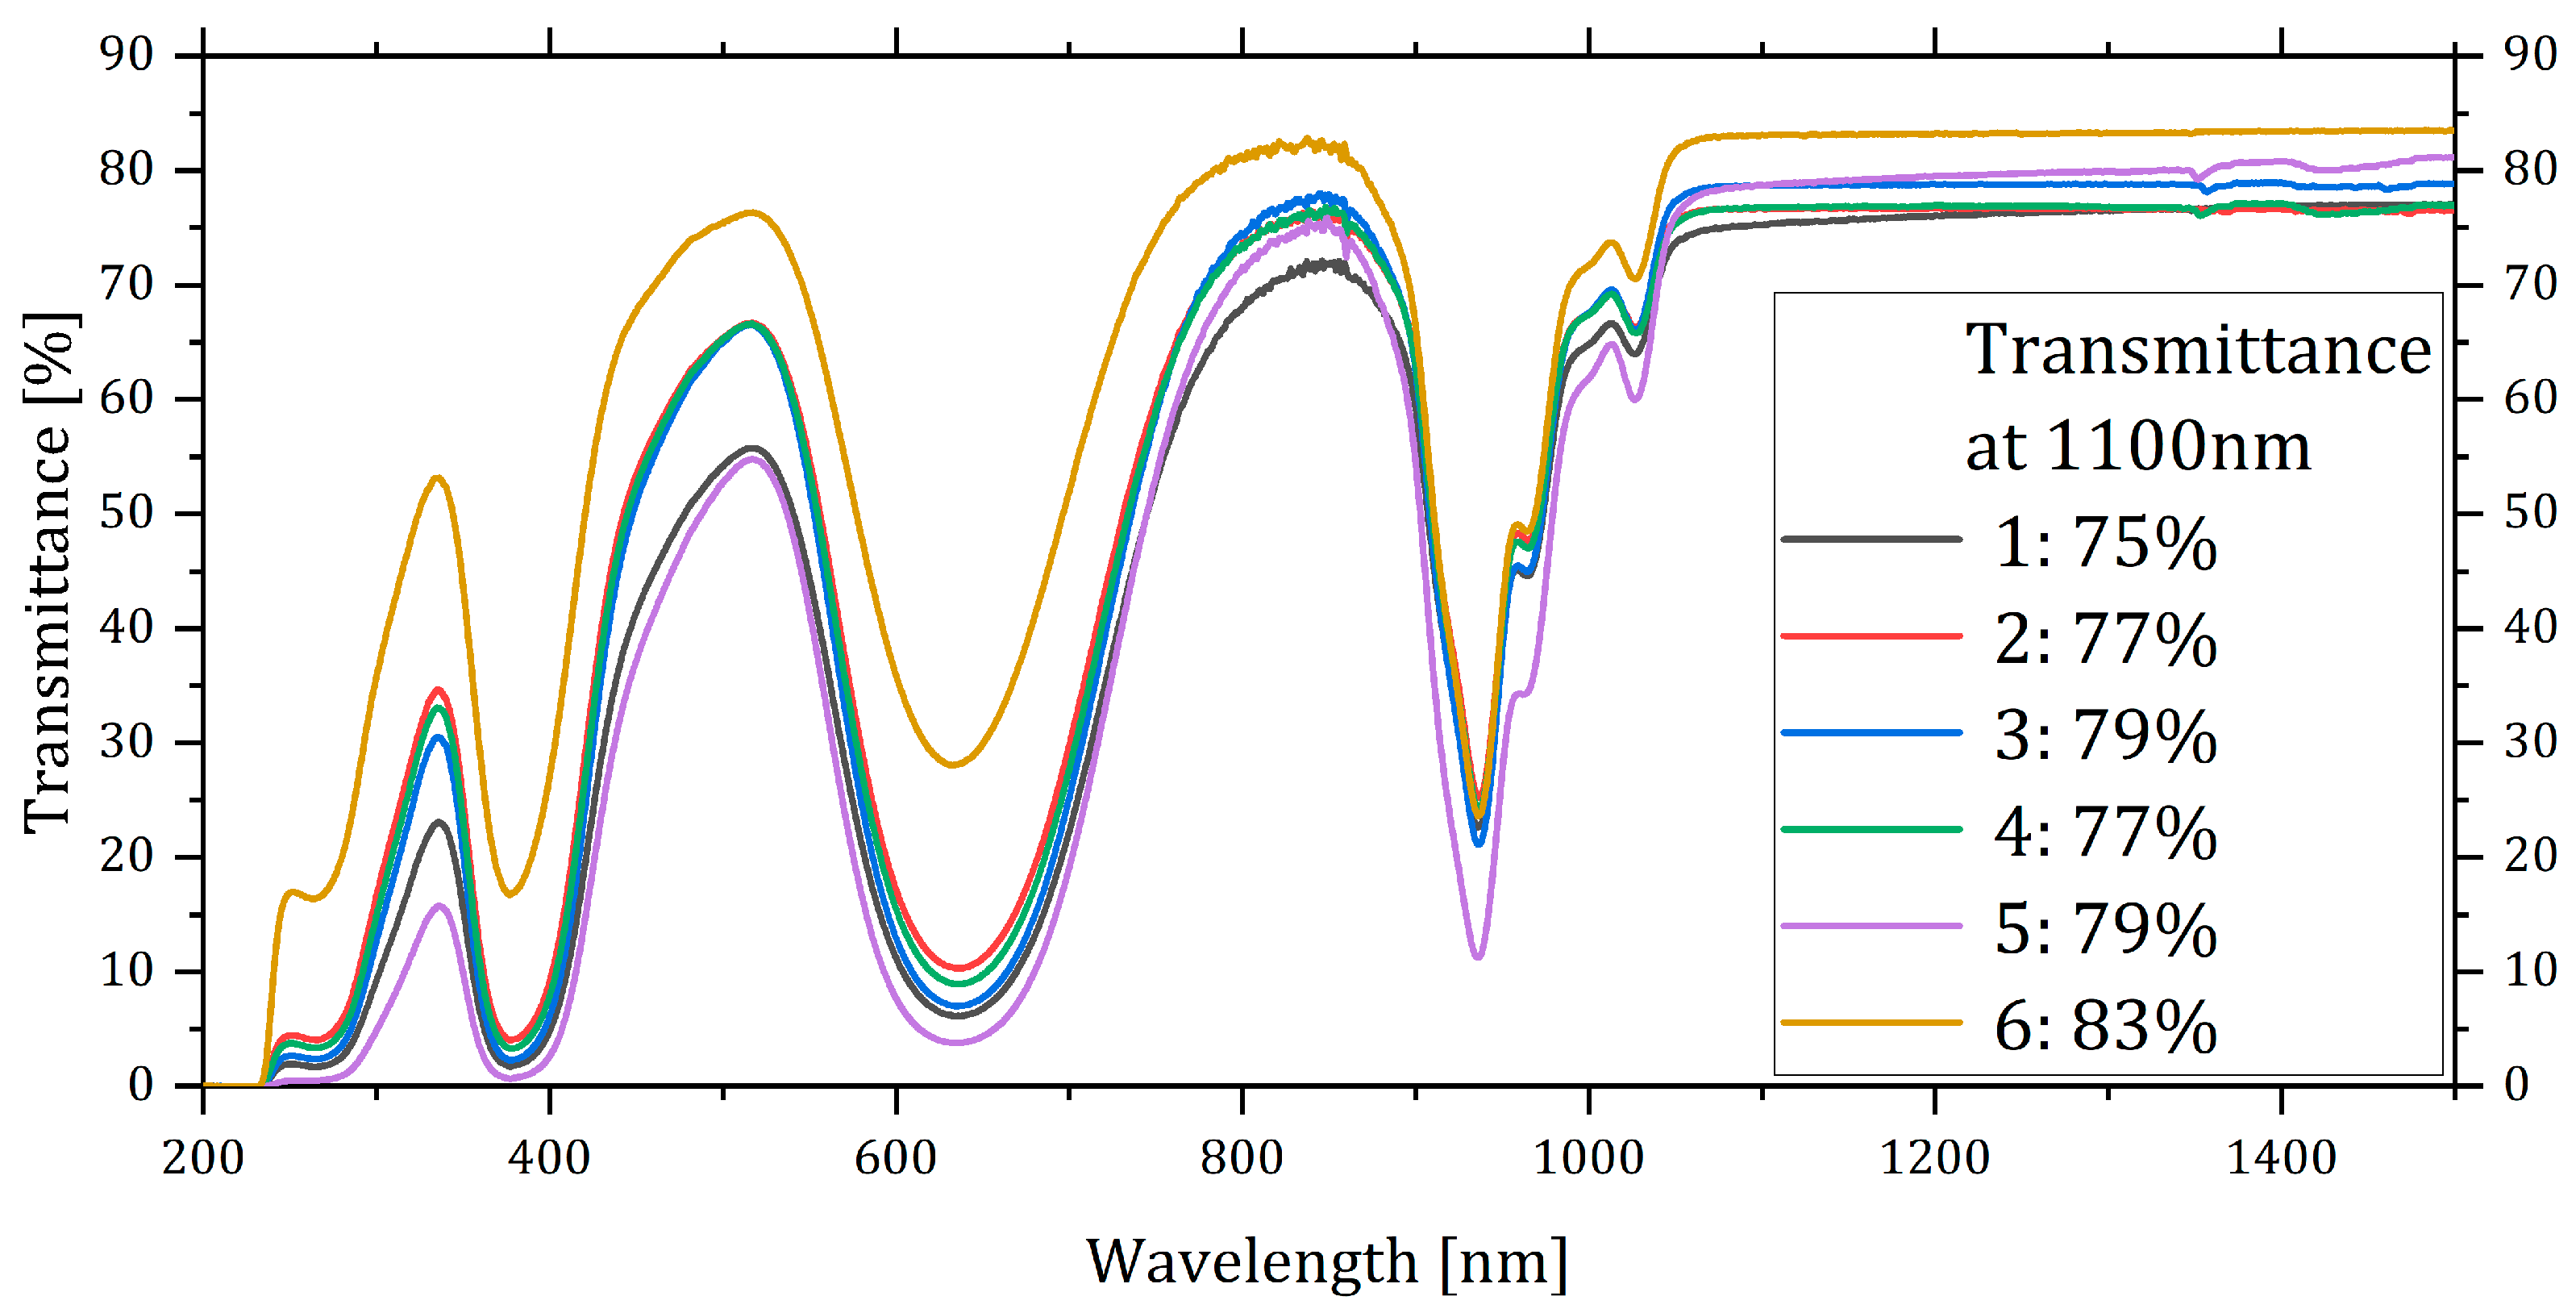
Conversely, when we compared the transmittance spectra and the transmittance values at 1100 nm (
Figure 5), differences emerged among the samples. Sample 6 exhibited the highest transmittance value, followed by samples 3 and 5. This suggested that despite the absence of visible pores on the surface of sample 3, there were pores within the volume. Sample 5 and 3 exhibited the same transmittance (79%,
Table 2). On the other hand, sample 5 was considerably thicker than sample 3. As a consequence, sample 5 should have shown a lower overall porosity, i.e., lower linear losses, compared to sample 3.
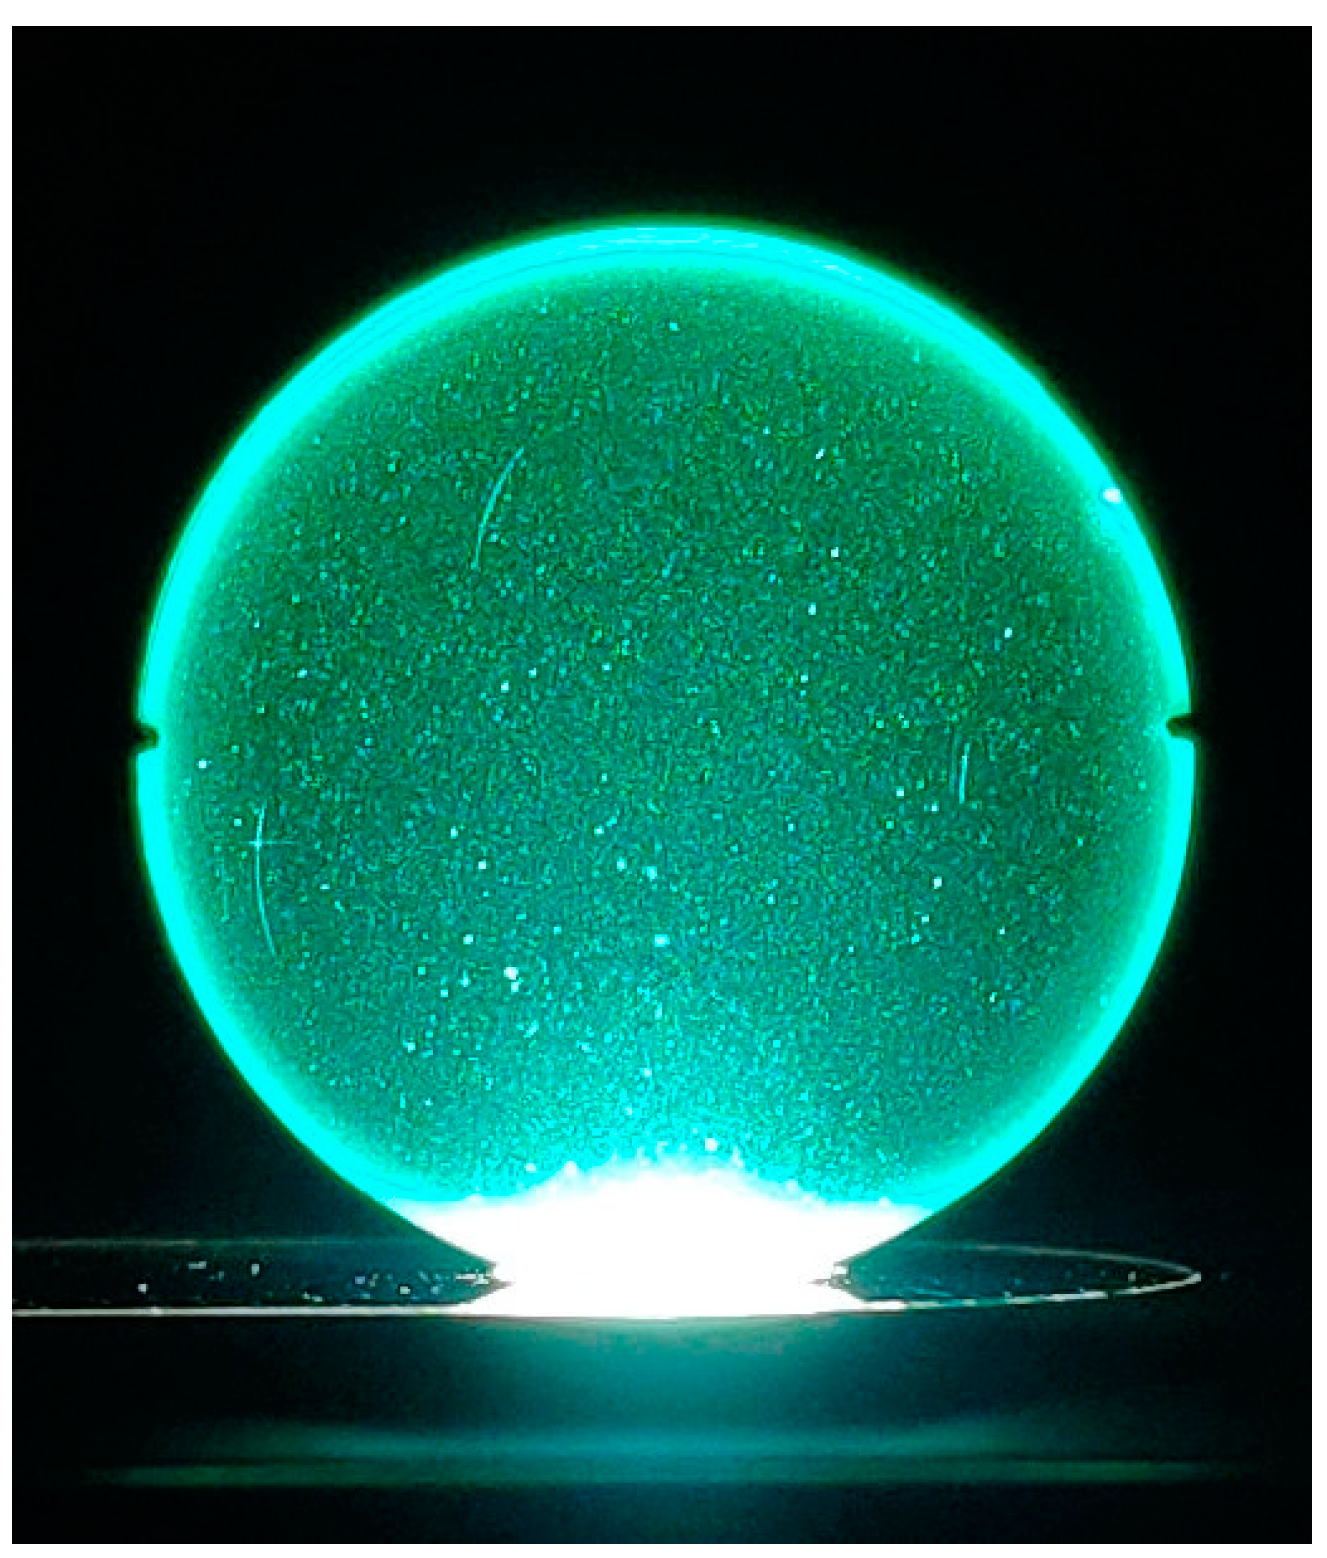
Further confirmation of the presence of defects within the volume was obtained by illuminating the samples from the edge, as shown in
Figure 6. The key question was “how many defects are there?” The state-of-the-art techniques are not able to quantify the concentration of defects in the samples. Moreover, the size distribution of the defects cannot be derived from the transmittance curve, although the reverse is possible [
12].
On the contrary, the novel bulk defect analysis technique introduced here provided information on the size and concentration of defects, even when present in small amounts, as reported in
Table 2 and
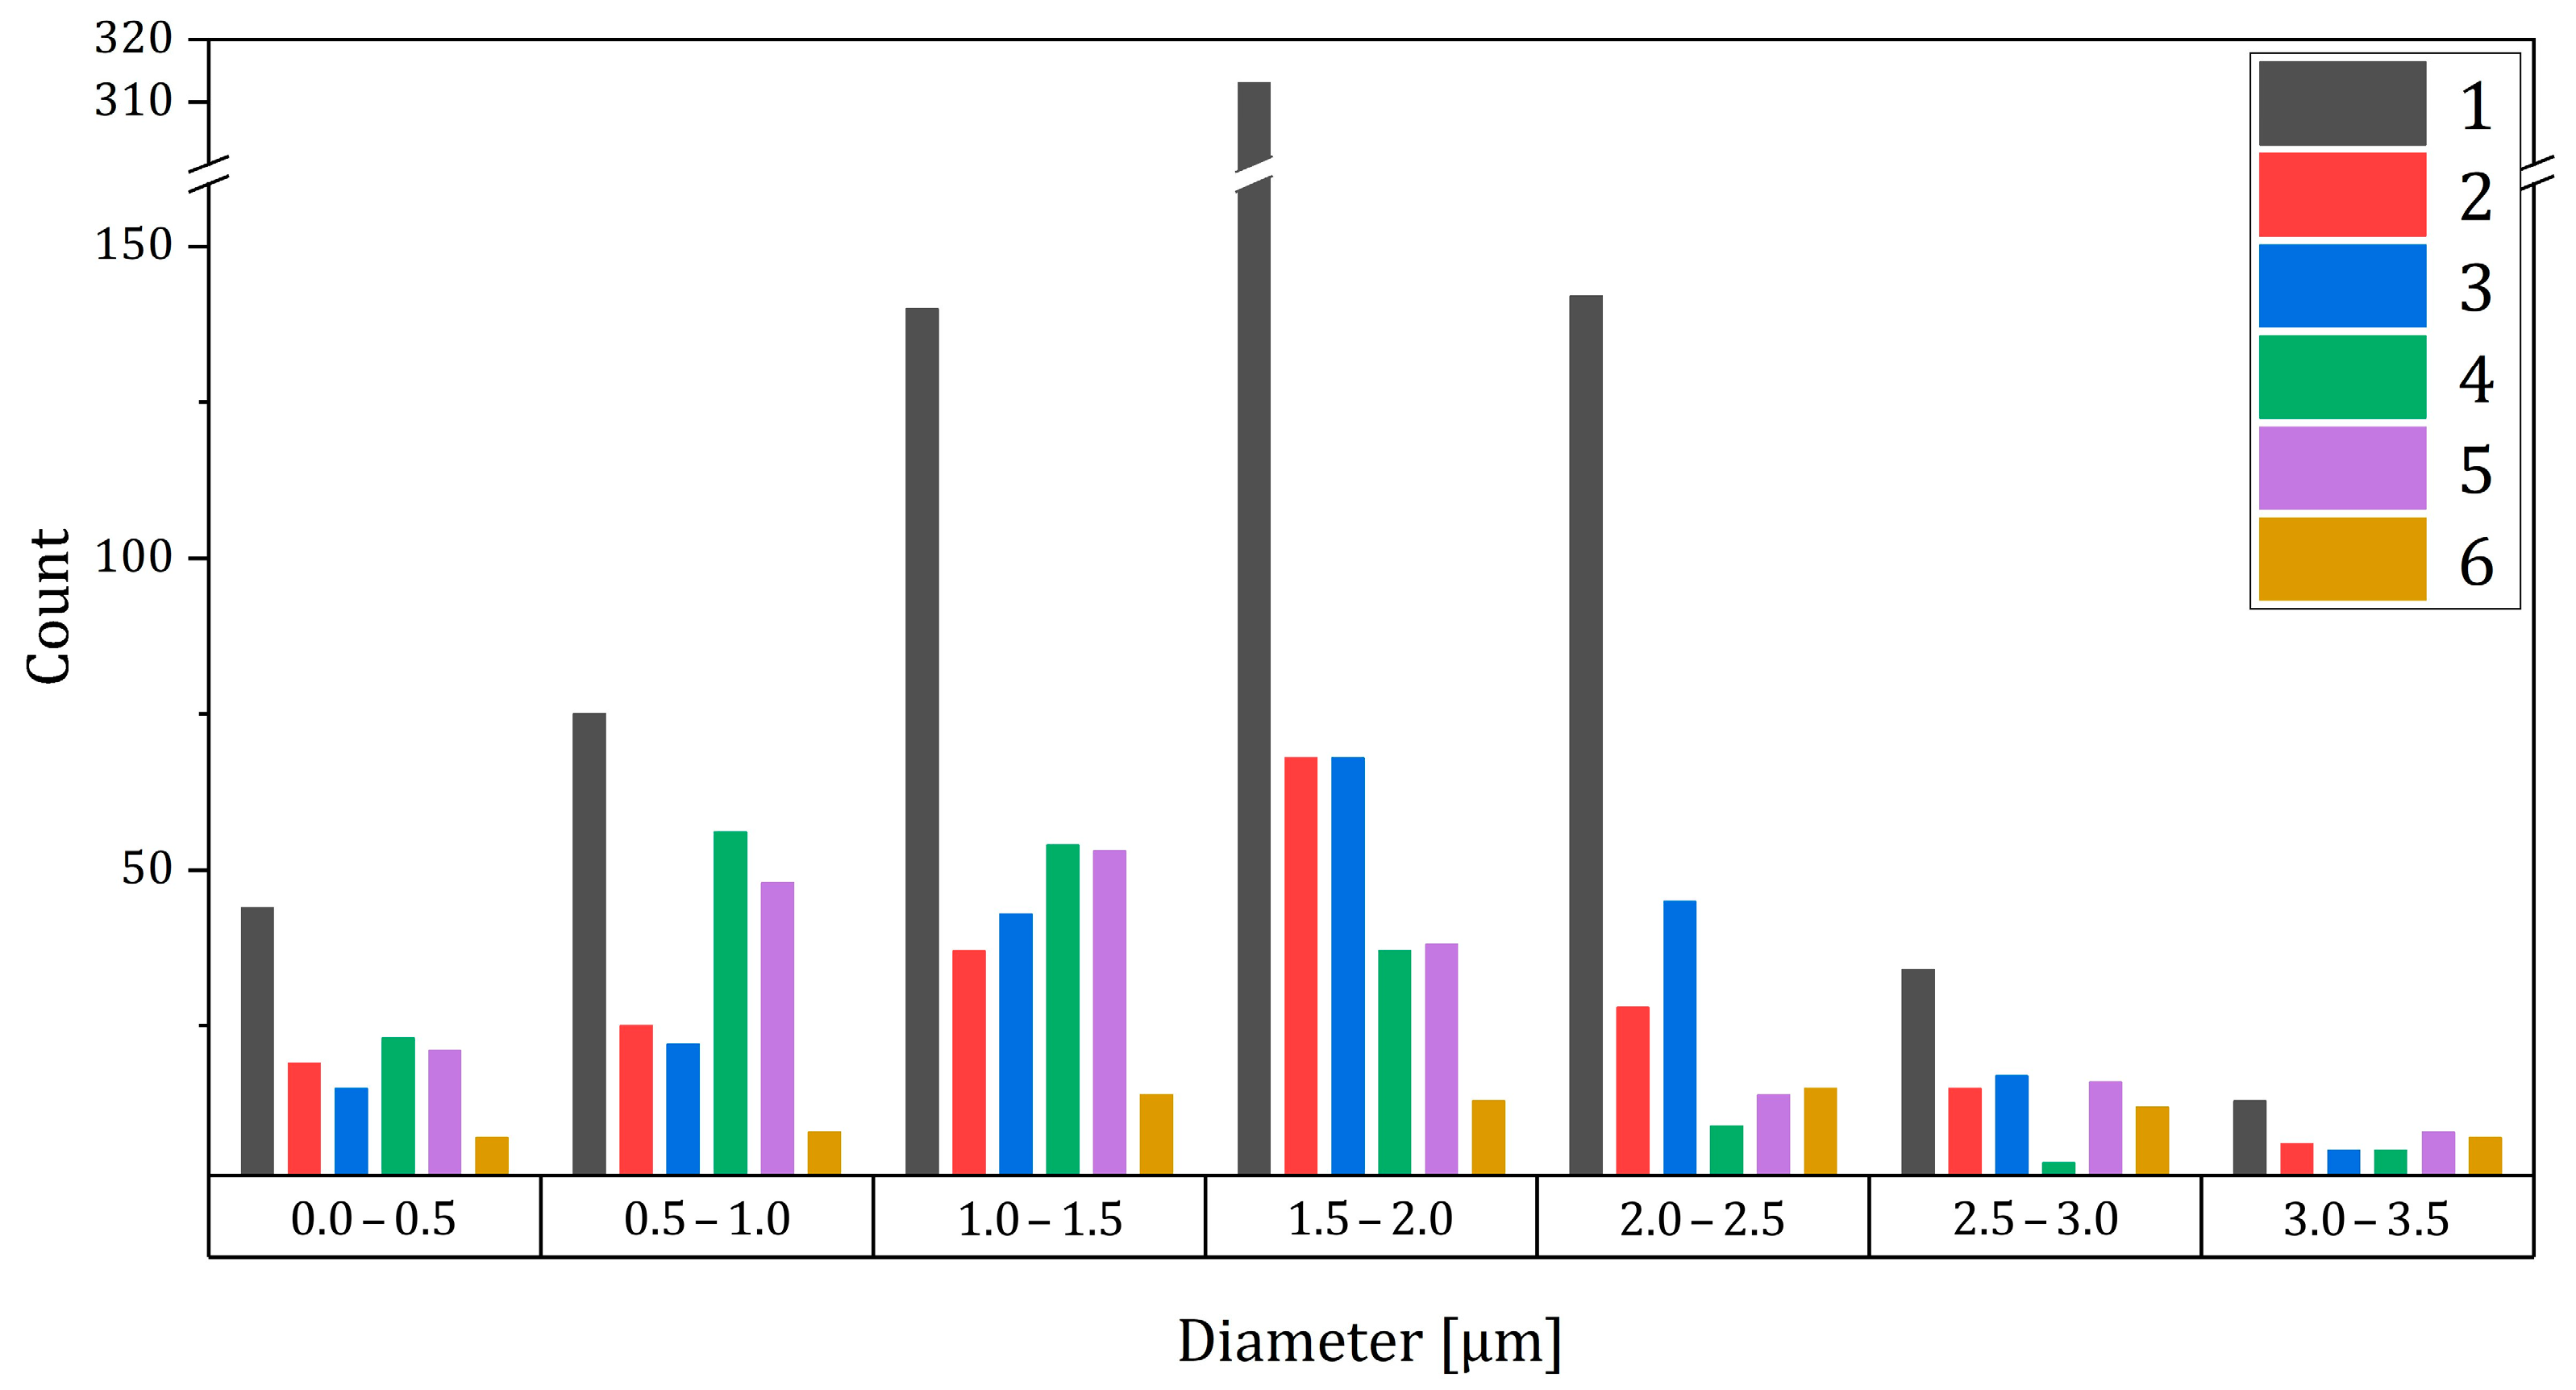
Figure 7. This enabled a comprehensive understanding of the impact of various process parameters on the final samples’ microstructure and properties. Since no secondary phases were detected via SEM, we assumed that all the defects observed with the optical microscope were pores. As shown in
Table 2, the standard deviation of the pore size was quite high. On the other hand, the size of the pores varied considerably in each sample, as shown in
Figure 7. Specifically, we found the following:
samples 1 to 3, obtained via rotary evaporation, had a similar average pore size (around 1.8 µm);
samples 4 and 5, obtained via oven drying, had a smaller pore size (around 1.6 µm) compared to 1, 2, and 3;
sample 6, containing MgO, had the highest average pore size (2.25 µm).
The variation in pore size distribution among the samples is also confirmed by the graph shown in
Figure 6. Notably, the maximum number of pores for samples 1 to 3 is in the range from 1.5 to 2.0 µm, whereas for samples 4 and 5, it is in the range from 1.0 to 1.5 µm. The residual porosity by volume (
rpV), i.e., the relative volume of the pores in the samples, shown in
Table 2, decreases from sample 1 to 6, with the exception of sample 3. The highest
rpV in sample 1 may be due to the absence of the dispersant in the mixing process. The dispersant helps to disperse the powders during milling and prevents reaggregation during drying. It also helps the particles to slide against each other during pressing, resulting in more homogenous powder packing. Samples 2 and 4 were prepared using a dispersant and differ in the drying step: rotary evaporation for sample 2 and oven drying for sample 4 (
Table 2).
Samples 3 and 5 were also prepared using a dispersant and dried via rotary evaporation and oven drying, respectively, but the powder suspensions were ultrasonicated prior to drying. The ultrasonication probably increased the deagglomeration of the powder, as the transmittance was higher compared to samples 2 and 4. Ultrasonication did not seem to have a significant effect on the
rpV or the average pore size, as shown in
Table 2. Finally, sample 6 was prepared using a dispersing agent and a combination of TEOS and MgO as sintering aids and oven-dried. This sample had the highest transmittance of all the samples studied. On the other hand, it also had the highest average pore size combined with the lowest
rpV.
For a more comprehensive comparison of samples with the highest transmittance (samples 3, 5, and 6), we also considered the residual porosity by number (rpN), i.e., the number of pores per unit volume, which has a direct impact on the scattering losses of transmittance.
As indicated in
Table 3, the high transmittance of sample 6 is not only associated with a low
rpV, but also a low
rpN compared to samples 3 and 5. The very low pore concentration (
rpN) is therefore the factor contributing to the higher transmittance, which conversely does not appear to be influenced by the pore size.
4. Conclusions
In this study, bulk defect analysis, a technique based on digital optical microscopy, has been shown to be a method that is both fast and non-destructive, making it an effective way to quantify defects in the bulk of transparent ceramics, thanks to the fact that in the case of transparent materials, optical microscopy allows for the examination not only of the surface but also of the entire sample volume. Furthermore, this technique is capable of analysing larger volumes than other techniques.
In the research, the bulk defect analysis was used to provide detailed information on the average pore size and concentration of YAG-based ceramics doped with Yb. A volume of 2.2 × 107 µm3 of each sample was analysed.
Upon visual inspection, it was observed that all the samples appeared transparent and free from macro-defects. However, differences between the samples were indicated by the transmittance spectra and the transmittance values at 1100 nm. The concentration of pores on the sample surface was too low to be accurately measured via SEM, making it difficult to compare between samples. bulk defect analysis revealed differences between the samples that were not visible via SEM. This provided a comprehensive understanding of how the process parameters affected the microstructure and properties of the final samples. In particular, it was observed that samples obtained from the rotary evaporator have a larger pore size compared to the ones obtained via oven drying. The combined use of MgO and TEOS resulted in a significant decrease in pore concentration in the material, even though an increase of pore size was observed. Additionally, the study found that there was a correlation between the increase in the transmittance value and the decrease in the rpV and rpN values.


 ,
, 


