Article

New Glasses in the PbCl2–PbO–B2O3 System: Structure and Optical Properties

1
Department of Chemistry and Technology of Crystals, D. Mendeleev University of Chemical Technology of Russia (MUCTR), Moscow 125480, Russia
2
Institute of High Technologies and New Materials, National Research Mordovia State University, Saransk 430005, Russia
*
Author to whom correspondence should be addressed.
Ceramics 2023, 6(3), 1348-1364; https://doi.org/10.3390/ceramics6030083
Submission received: 26 May 2023 / Revised: 22 June 2023 / Accepted: 25 June 2023 / Published: 27 June 2023
(This article belongs to the Special Issue Advanced Glasses and Glass-Ceramics)

Abstract

:
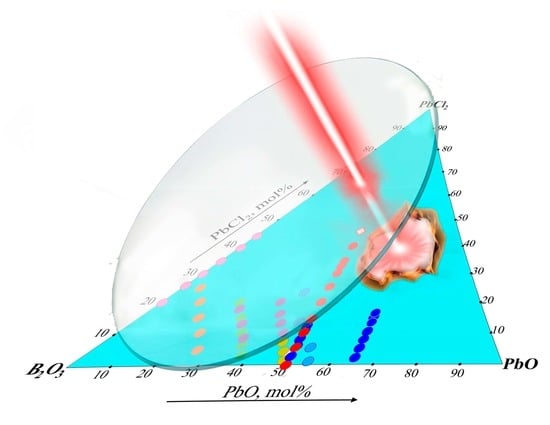
New oxychloride lead borate glasses in the xPbCl2–(50-0.5x)PbO–(50-0.5x)B2O3 system were synthesized with a maximum lead chloride content of 40 mol%. The characteristic temperatures and mechanical and optical properties were studied. The incorporation of lead chloride led to a significant expansion of the transparency range in the UV (up to 355 nm) and IR regions (up to 4710 nm). Decreases in the Vickers hardness, density, and glass transition temperature were the consequences of a change in the structure. The studied glasses are promising materials for photonics and IR optics. The structure of the PbCl2–PbO–B2O3 system was analyzed in detail using vibrational spectroscopy and X-ray diffraction.

Graphical Abstract

1. Introduction

The variety of compositions and extremely interesting properties of glasses based on boron oxide have attracted the attention of many researchers. In the last few decades, the importance of borate glasses has increased because they exhibit an exceptional combination of properties, such as transparency in a wide spectral range, mechanical strength, chemical resistance, as well as thermal shock and crystallization resistance [1].
Borate glasses containing lead compounds have unique characteristics. The inclusion of PbO and PbX2 (X = F, Cl, and Br) in glass compositions leads to a significant increase in electrical conductivity [2], transparency in the IR and UV ranges [3,4], high refractive indices [5], and optical nonlinearity [6].
Oxyhalide glasses are very promising as matrix materials for applications such as modern laser systems and fiber communication lines [7]. The incorporation of lead halides (PbX2) into glasses leads to low phonon energies, which makes them promising materials due to a decrease in nonradiative losses because of multiphonon relaxations [8]. The optical properties of glasses of the PbX2–PbO–B2O3 system doped with d-elements [5,9] and f-elements [4,10,11] have been studied. The positive effect of lead halides on their spectral and luminescent properties has been proven. However, the preparation and usage of many oxyhalide glasses are often limited due to their high tendency to crystallize, the toxicity of reagents, and the rather high content of OH groups [4,10]. There is no information on the preparation of borate glasses with a PbCl2 content of more than 25 mol% and there are limited data on their optical properties in the IR region and their structures.
This work aimed to develop a synthesis technique for new oxychloride lead borate glasses with a large amount of lead chloride (up to 40 mol%) and to investigate their optical, mechanical, and thermal properties.

2. Materials and Methods

The glasses were synthesized with the general formula xPbCl2-(50-0.5x)PbO-(50-0.5x)B2O3, where x varied from 0 to 40 mol% with a 5 mol% step. PbCl2, PbO powder preparations (99.9, Himkraft, Kaliningrad, Russia) and B2O3 glassy strips (99.9, Reachim, Moscow, Russia) were used as initial components for synthesis. The necessary amounts of components were weighed using an Explorer Ohaus PA64 electronic balance (Ohaus, Shanghai, China). The mixture was homogenized by repeated grinding in an agate mortar. The sample weight for one experiment was ~15 g. The charge was placed in a corundum crucible with a cover and melted for 30 min at 900 °C in a PM-12M1 muffle furnace (EVS, St. Petersburg, Russia) under ambient atmosphere. The melt was then cast into a glassy carbon mold and quickly pressed by another glassy carbon mold. To reduce quenching stresses, the glasses were annealed in a SNOL 7.2/1100 furnace (Umega Group, Ukmergė, Lithuania) at 240 °C for samples with PbCl2 content ≥20 mol% and at 300 °C for samples with PbCl2 content ≤ 15 mol%. The residual stress was controlled by using the optical polarization method with a PKS-250M polariscope-polarimeter (Zagorsk Optical and Mechanical Plant, Sergiev Posad, Russia). Plane-parallel samples of 2 mm thickness were polished using a T-080.00.00 stone-cutting machine (Togran, Moscow, Russia).
The amorphous nature of the glasses was confirmed by X-ray diffraction analysis using an Equinox 2000 X-ray diffractometer (Thermo Fisher Scientific, Saint-Herblain, France) with CuKα radiation (λ = 1.54060 Å) in the 2Θ angle range from 10° to 100°, with a 0.01° scanning step and 2 s/step exposure. The diffraction patterns were analyzed using Match! software (2003–2015 CRYSTAL IMPAC T, Bonn, Germany).
We used X-ray fluorescent spectroscopy (XFS) to estimate the element composition of the synthesized glasses. The measurements were carried out using a TESCAN VEGA3-LMU scanning electron microscope (TESCAN ORSAY HOLDING, Brmo, Czech Republic) equipped with an X-MAX-50 EDS detector (Oxford Instruments, Abingdon, UK) at 30 kV voltage.
The absorption spectra were recorded using a JASCO V-770 spectrophotometer (JASCO Corporation, Tokyo, Japan) in the range of 190–2700 nm. The absorption spectra were obtained using a Bruker Tensor 27 FT-IR spectrometer (Bruker, Berlin, Germany) in the 1.25–27.00 µm range.
The refractive index of glass samples was measured on a Metricon 2010 refractometer (Metricon, Pennington, NJ, USA). The measurement method was based on determining the critical angle of incidence at which light began to penetrate the sample volume through the surface of the measuring prism, similar to the Abbe refractometer. The refractive index was measured at three wavelengths: 633, 969, and 1539 nm.
Glass transition (Tg), crystallization (Tc), and melting (Tm) temperatures were determined by differential scanning calorimetry (DSC) using an SDT Q-600 thermal analyzer (TA Instruments, New Castle, DE, USA) at 10 °C/min rate from RT to 800 °C. Aluminum oxide (Al2O3) was used as a reference. For analysis, glass samples were preliminarily ground into powder. At the same time, thermogravimetric analysis was performed to assess the volatilization of glass components.
The structure of the glasses was studied using Fourier transform IR spectra and Raman spectra (RS). FT-IR spectroscopy was performed on a Bruker Tensor 27 spectrometer (Bruker, Berlin, Germany). For FT-IR measurements, the glass samples were ground into a fine powder and then mixed with KBr powder in a weight ratio of 0.01:0.19. The prepared mixture was pressed into pellets, which were immediately measured (in the range of 400–8000 cm−1) to avoid exposure to atmospheric moisture. Raman spectra were recorded in the 80–3500 cm−1 range using standard laser excitation on a Vertex 70 FT-IR spectrometer with the Raman module RAM II (Bruker, Berlin, Germany) equipped with a 1064 nm neodymium laser. The laser power was 350 mW. Powder preparations were used for Raman measurements.
The glass density was determined using the hydrostatic weighing method with a MERTECH M-ER 123 ACF JR balance and special equipment (MERTECH, Moscow, Russia).
Vickers hardness of glasses was measured by indenting a diamond pyramid with a square base and an angle between the faces equal to 136°. To increase the statistical reliability, the measurements were carried out 5 times for each of the four weight loads (50, 100, 150, and 200 g), and the measurement results were averaged. For each point, the average deviation was calculated, and these were then averaged. Samples were measured using a PMT-3 tester (LOMO, St. Petersburg, Russia).

3. Results and Discussion

3.1. Glass Composition and Structure Characterization

The compositions of the obtained glasses are shown in Figure 1.
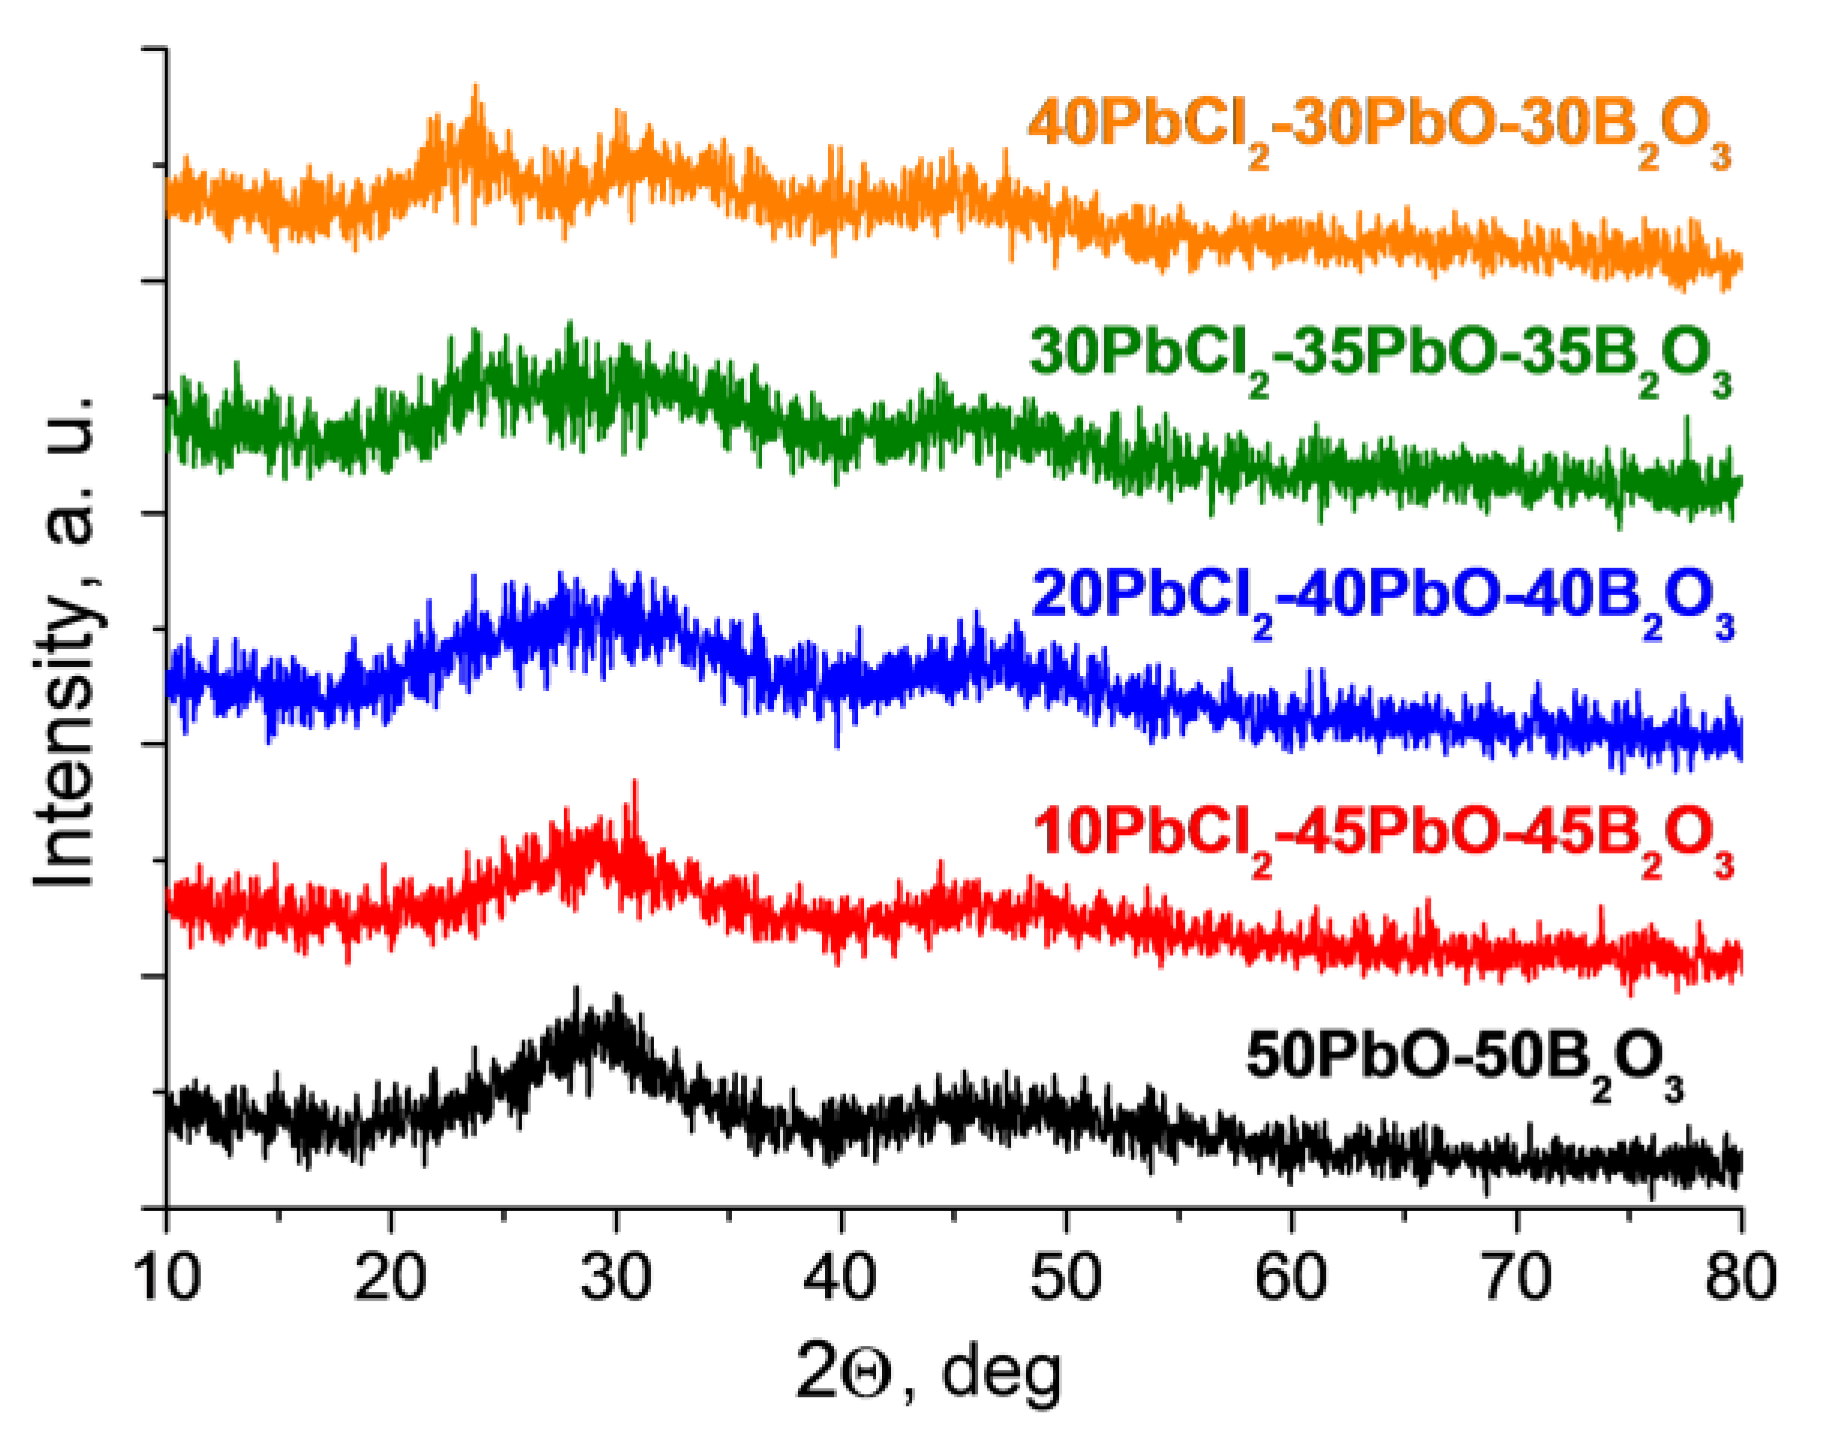
The diffraction patterns of the synthesized glasses confirmed the amorphous nature of the samples (Figure 2).
Figure 2 shows that the glass halo underwent significant changes upon the addition of PbCl2, which indicated a change in the short-range order structure. We assumed that at high PbCl2 concentrations, the local glass structure tended toward the structure of crystalline PbCl2 but with a greater degree of disorder, which was specific for the glassy state (Figure S1) [17,18]. Heavily doped glasses (>20%) were possibly partly crystallized (nanocrystals formation), but the limited resolution of the patterns did not allow a clear conclusion. When glasses with a PbCl2 content of more than 40% were synthesized, partial crystallization of the melt occurred with the formation of the PbCl2 phase (Figure S1). The PbCl2 phase was rhombic (space group Pnma, a = 7.623 Å, b = 9.048 Å, c = 4.535 Å, Z = 4). Card ID 01-084-1177 (MATCH) or pdf 26-1159 PCPDFWIN.
The synthesis of oxychloride glasses is complicated due to the high hygroscopicity of Cl-containing components. In the process of glass melting, in addition to direct volatilization, pyrohydrolysis occurs [4]:
PbCl2 + H2O→PbO + 2HCl↑
An exchange reaction is also possible [19]:
3PbCl2 + B2O3→3PbO + 2BCl3
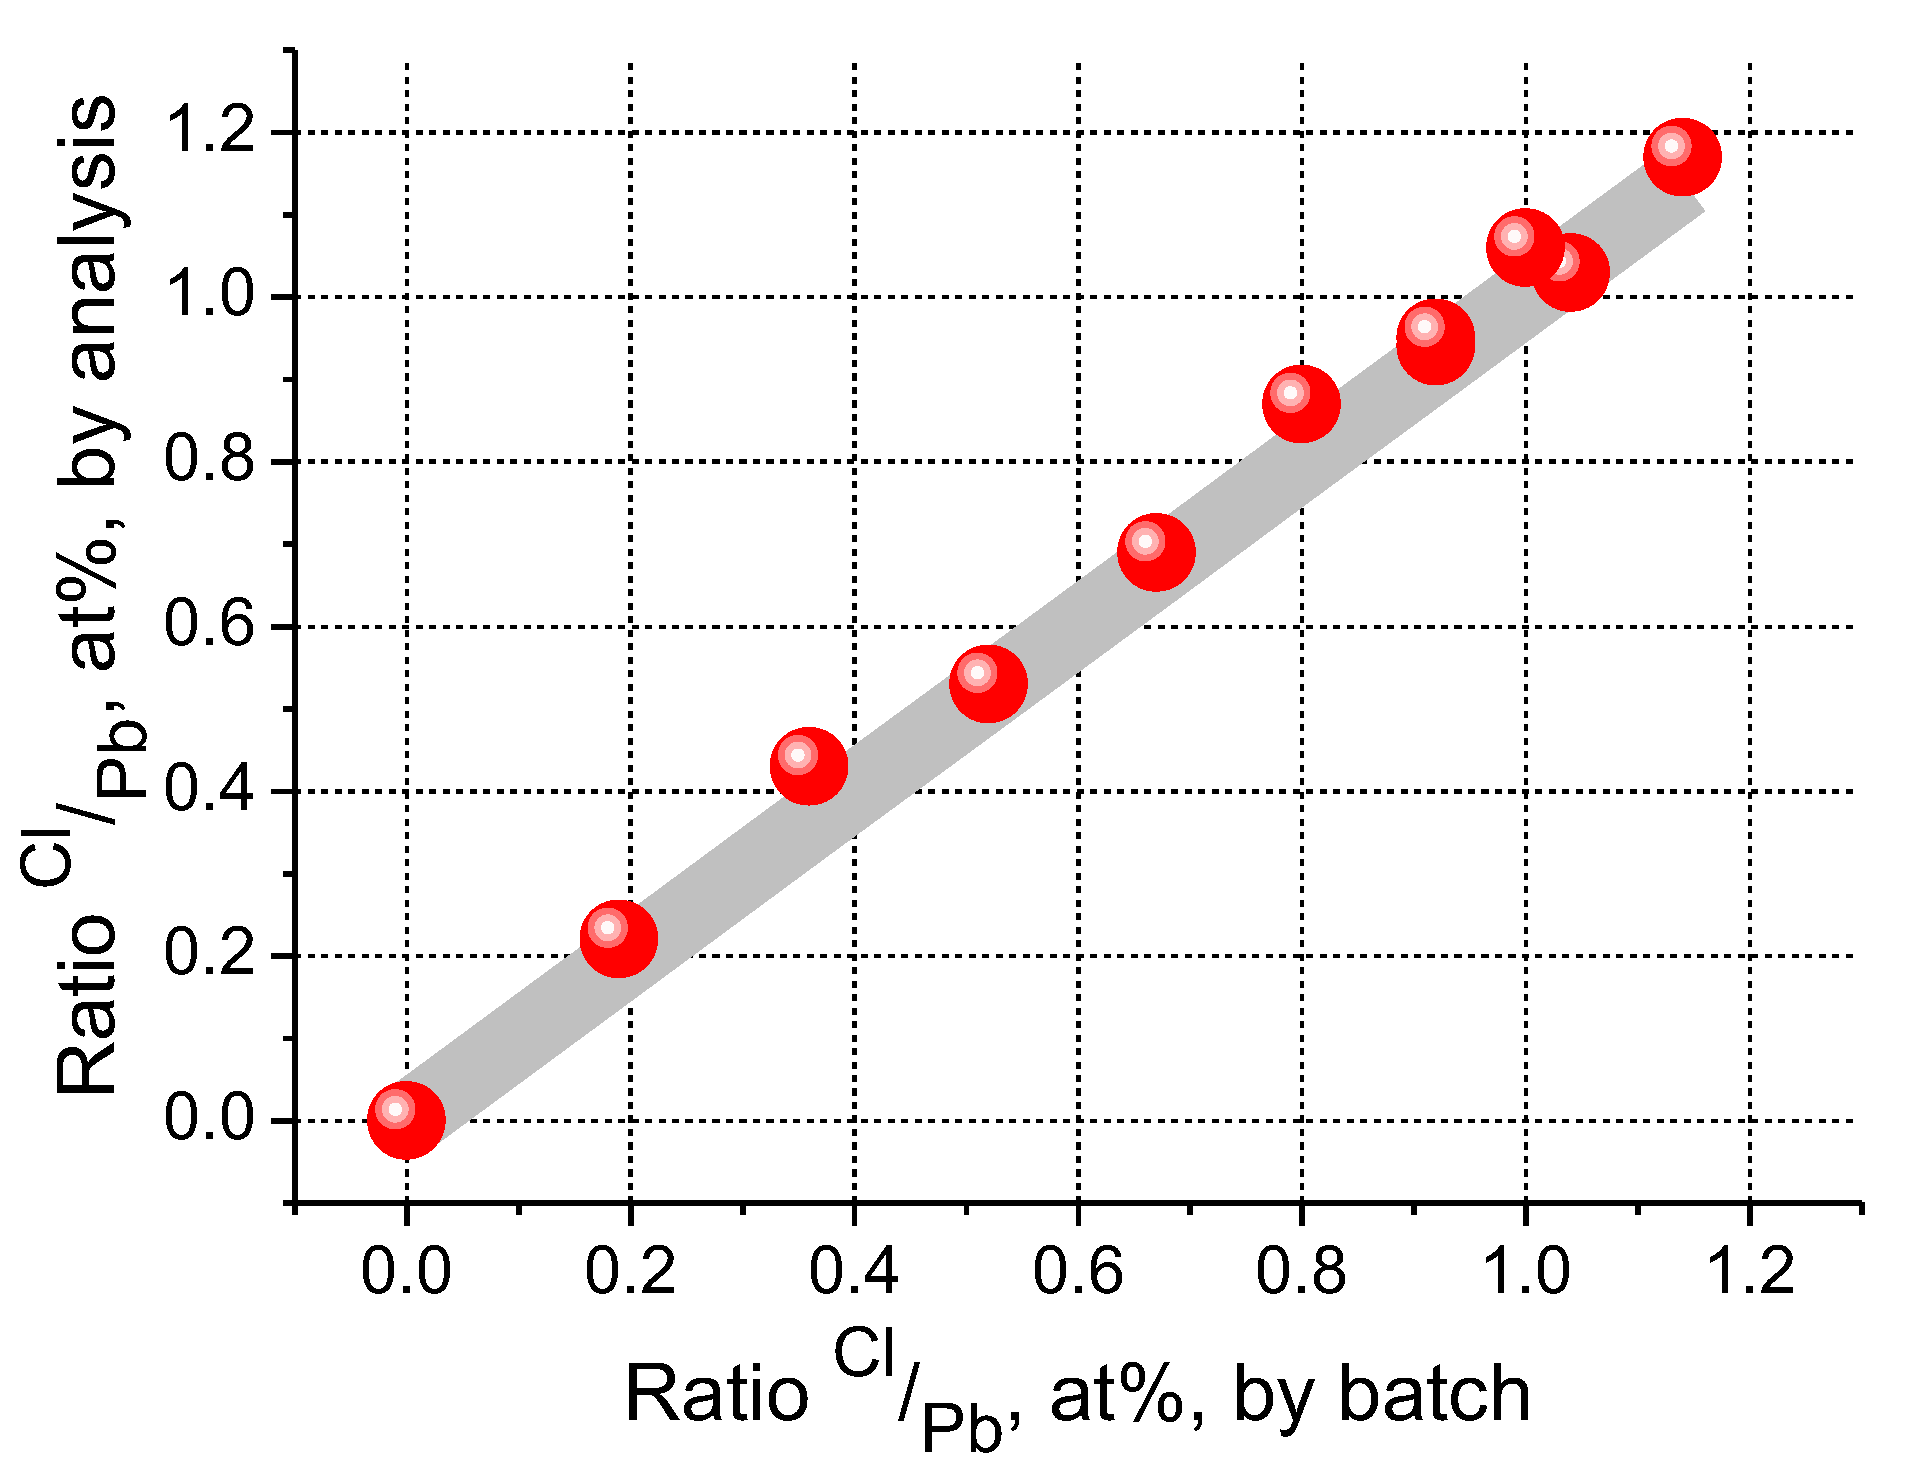
The results of the elemental analysis (Table S1) showed that the Cl/Pb ratio in the synthesized glasses remained almost the same as in the initial batch (Figure 3).
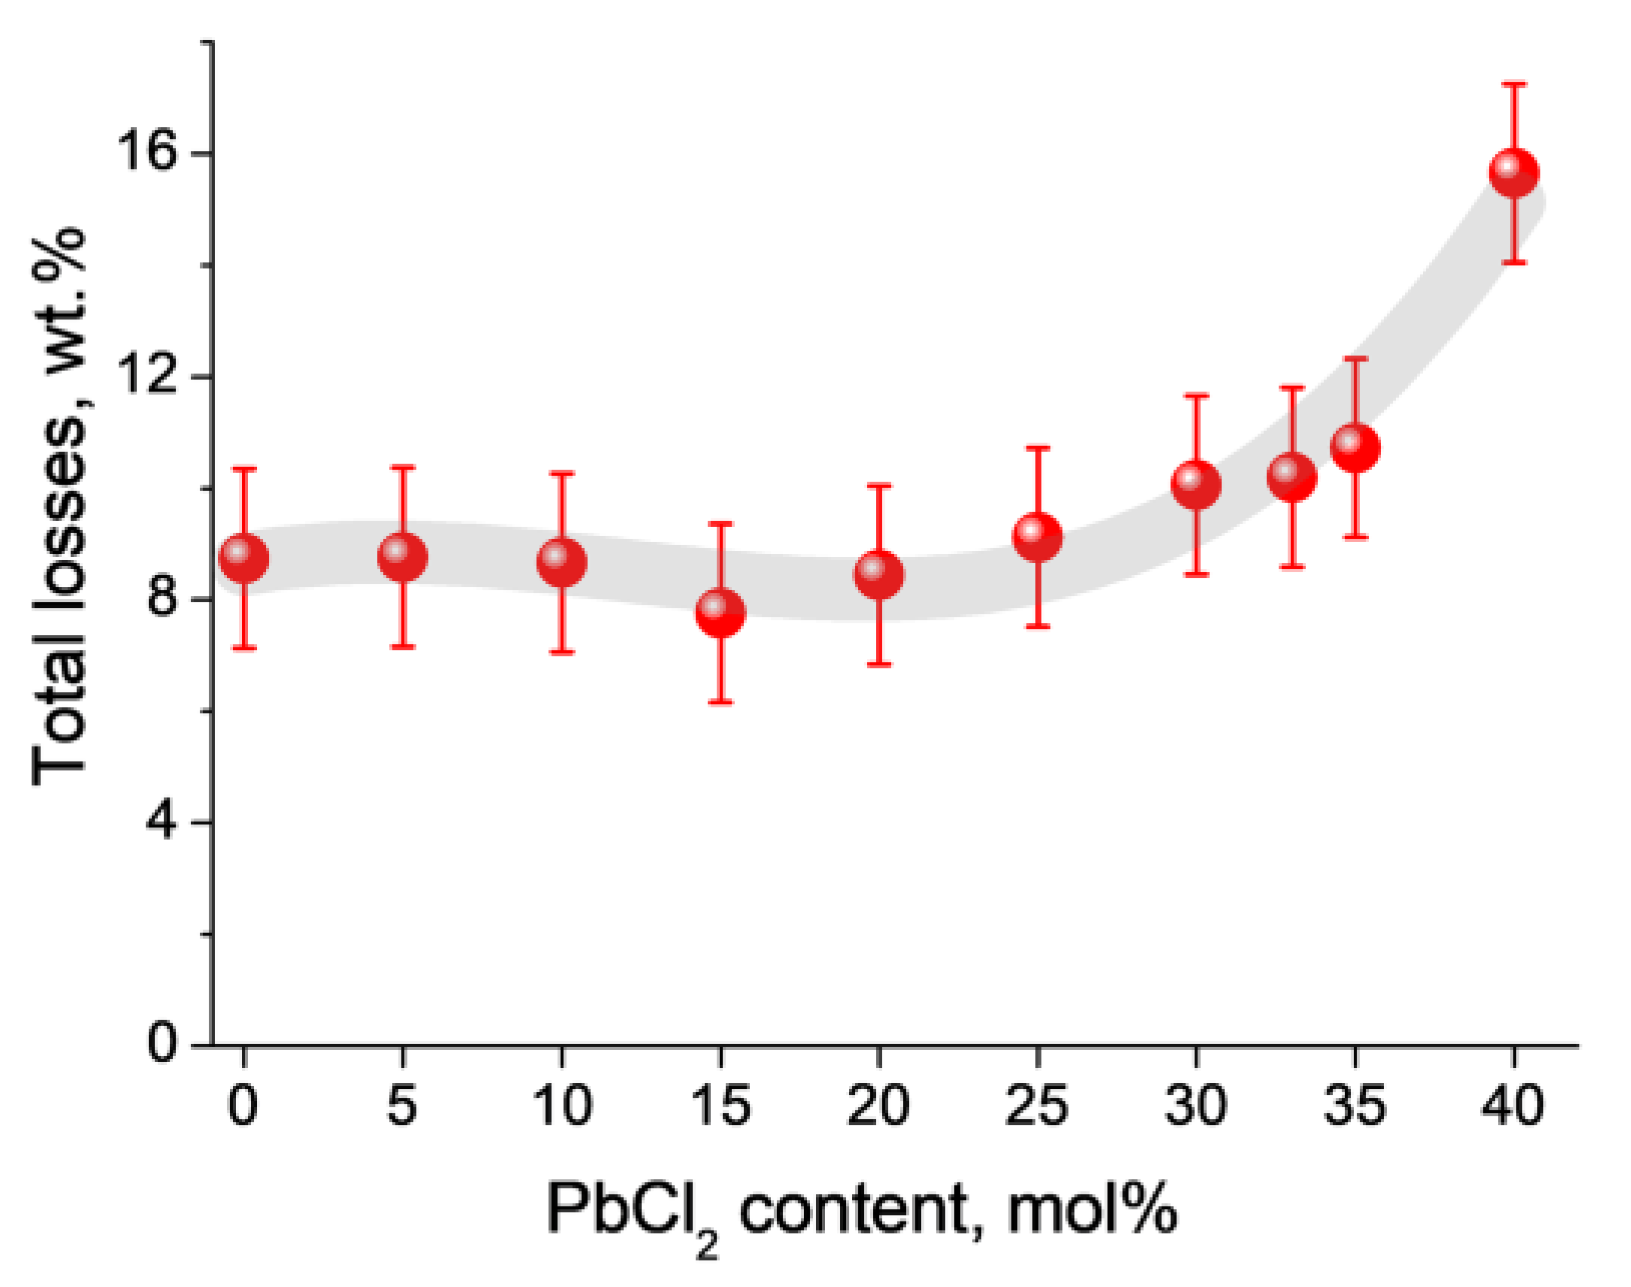
To evaluate the volatilization of the glass components during synthesis, we applied a direct weighing technique. It was shown that volatilization remained almost constant for all compositions with PbCl2 below 35 mol% (Figure 4). Thus, we assumed that B2O3 and water volatilized simultaneously with PbCl2. However, there was no way to confirm this assumption, since the XFS technique is limited in detecting light elements such as boron (ZB = 5). This is the reason that the data in Table S1 are presented in the form of ratios of elements.
The synthesized glasses contained a small amount of aluminum (Table S1) because of the dissolution of the corundum crucible by the aggressive PbO-based melt. However, Al2O3 has a positive effect on the spectral and mechanical properties of glasses due to it being a network former [20]. We did not observe significant losses of PbCl2 during synthesis, which made it possible to correctly describe the physicochemical properties of the glasses based on their batch composition.
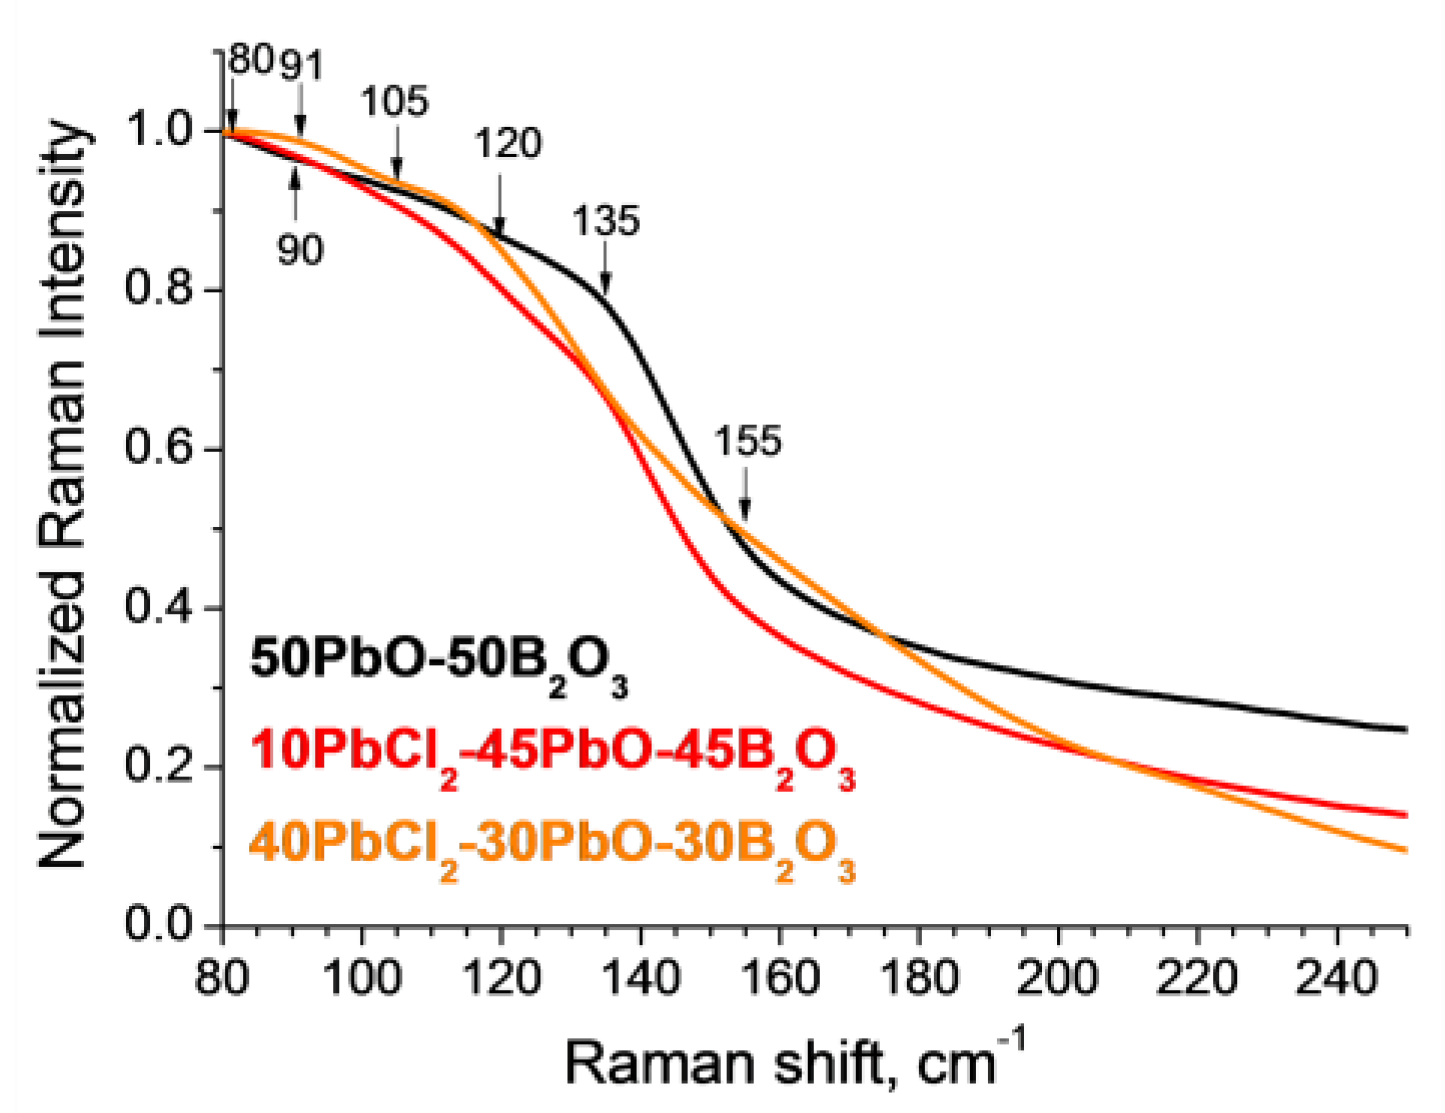
The glass structure was studied by Raman spectroscopy in the 80–3500 cm−1 range, which was divided into 3 parts for detailed analysis: 80–250 cm−1 (Figure 5, Figures S2 and S3), 250–1750 cm−1 (Figure 6), and 1750–3500 cm−1 (Figure S4). In Raman spectroscopy, vibrations with wavenumbers less than 400 cm−1 are usually attributed to vibrational modes associated with heavy metal atoms. In addition, the frequencies of halide compounds with predominantly ionic bonds are generated in this range [21,22].
We observed a broadened peak in the 80–250 cm−1 range (Figure 5), which was a superposition of several fundamental modes and a bosonic peak [4,23]. The assignment of vibrational modes to the corresponding structural groupings is presented in Table 1. The observed broadened peak underwent significant changes depending on the glass composition. For the 50PbO–50B2O3 glass composition, we observed 4 main modes at 80, 90, 105, and 135 cm−1 (Figure S2). These were the result of bending vibrations in PbO4 structural units [23], stretching of the ionic component of the Pb–O bond [24], Pb2+ cations in the glass network [25], and covalent symmetric stretching of the Pb–O bond in PbO4 tetrahedra [26], respectively. In lead borate glasses with a high PbO content, [PbO4]2− pyramids are glass network-forming units and most of the lead went into building these pyramids. The rest of the lead acted as a charge compensator in the form of free Pb2+ ions. [PbO4]2− units preferentially bridge bonds with BO3 groups rather than BO4 groups [25]. The dominant units in these glasses are BO3 and [PbO4]2− with Pb—O—B bridges between them. The introduction of lead chloride caused a sharp decrease in mode intensity around 135 cm−1, indicating the destruction of these bridges [25].
In addition, local peaks with maxima at 80 and 90 cm−1 were strongly smoothed and had reduced intensities, which also indicated the disappearance of PbOn units in the glass network. On the other hand, we observed a generation of new bands at 91, 105, and 120 cm−1. They belonged to vibrations of Cl [27] ions, Pb2+ [28] cations, and stretching vibrations of the Pb–Cl bond [29]. The further growth of PbCl2 concertation up to 40 mol% resulted in the generation of new modes at 150–180 cm−1 [27], while the modes related to the structural units of PbOn practically disappeared. Cl acts as a non-bridging anion and two halogen anions replace one O2−. This leads to the destruction of [PbO4]2− units and the formation of Pb2+ cations. The appearance of Raman bands related to vibrations of chlorine anions and the Pb–Cl bond directly indicated the formation of new chlorine- and lead-containing structural units. It was suggested that such units could be presented as ClPb2+[BO4/2] complexes [2]. This composition of structural units could be explained by the fact that chlorine entered the glass network only in interstitial positions and acted as a non-bridging anion in the glass network [2,25]. Because the strength of an ionic bond is inversely proportional to the square of the ionic radius, substitution of O2− with r O 2 = 1.40 Å by Cl with r C l = 1.81 Å further weakened the bonds in the glass network. Thus, depolymerization and weakening of the glass network occurred with the formation of isolated ion-containing structural units.
Table 1. Interpretation of Raman bands in glasses.
Range of 80–250 cm−1Range of 250–1750 cm−1
Wavenumber, cm−1InterpretationReferenceWavenumber, cm−1InterpretationReference
80Bending vibrations in structural units of PbO4[23,30]310Vibrations of [PbO4]2− units [23,31]
90Stretching of predominantly ionic Pb–O bonds in polyhedral PbOn units[23,24]476Pb–O bond vibrations[32,33]
570Oscillations of borate tetrahedrons BØ4ˉ[23,25]
91Vibrations associated with PbCl2, presumably Cl[21,22,27,34,35]620Deformation modes of BO3 metaborate chains[23,26]
710BO3 deformation modes in ring metaborate groups[23,26]
105Cations Pb2+[25,28,36]870Oscillations BØ4ˉ in pentaborate groups[26,37]
120Pb-Cl stretching vibration[22,29],910Oscillations BØ4ˉ in ortho- and pentaborate groups[26,37]
135Symmetric Pb–O stretching in the [PbO4]2− pyramid configuration[25,26,32,38]980Oscillations BØ4ˉ of diborate groups[26,39,40]
150–180Valence vibrations of Pb–Cl, bending vibrations of the Pb–Cl bond[22,27,32,34,35,41]1050Oscillations BØ4ˉ of diborate groups[23,39,40]
1075Oscillations BØ4ˉ of diborate groups[23,39]
1285B-Oˉ stretches in metaborate triangles (BØ2Oˉ), mostly forming chain structures. A minor fraction: BØ3 extensions[23,25,33]
We observed several characteristic bands related to different groups in the glass structure in the 250–1750 cm−1 range (Figure 6). An increase in PbCl2 content resulted in a decrease in band intensities.
The band around 310 cm−1 indicated the existence of PbO4 polyhedral units in the network [23]. This was caused by the superposition of two bands centered at 280 and 330 cm−1, which were attributed to vibrations of these units in PbO crystals with orthorhombic and tetragonal symmetry, respectively [18]. The decrease in the band intensity indicated the destruction of PbO4 tetrahedra in the network with PbCl2 content growth. The band at 476 cm−1 was also assigned to Pb–O bond vibrations and it underwent similar changes [33].
The 570 cm−1 band was associated with the borate tetrahedron (BØ4ˉ) and it decreased with PbCl2 content growth. The BO3—PbO4 bridge bond formed a fourfold coordination of boron with oxygen [23].
Bands at 620 and 710 cm−1 were assigned to the deformation modes of metaborate chains and rings, respectively [23,26,37]. They also lost their intensity with PbCl2 content growth. However, the band at 710 cm−1 conserved its shape even for systems with 40 mol% of lead chloride, which indicated greater stability of the ring metaborate groups.
The 870 and 910 cm−1 bands decreased while the PbCl2 content grew to 20 mol% and then remained constant with further PbCl2 content growth. The 980, 1050, and 1075 cm−1 bands referred to the presence of BØ4ˉ in diborate groups and showed a similar evolution with PbCl2 content growth.
The 1285 cm−1 band referred to B-Oˉ extensions in metaborate triangles (BØ2Oˉ), mostly forming chain structures, and to BØ3 stretching. The band intensity strongly decreased with PbCl2 content growth.
For the 50-50 glass composition, the intensity of the bands related to the BO4 vibrations was noticeably lower than for the bands related to the BO3 vibrations, primarily at 710 and 1285 cm−1. We observed a reduction in the I710/I1285 ratio with PbCl2 content growth resulting from destruction of the Pb-O bond. The glass network was rearranged to a more ionic and depolymerized one, with the gradual replacement of BO3 groups by BO4 groups [25].
In the range up to 3500 cm−1 (Figure S4), only water oscillations were observed.
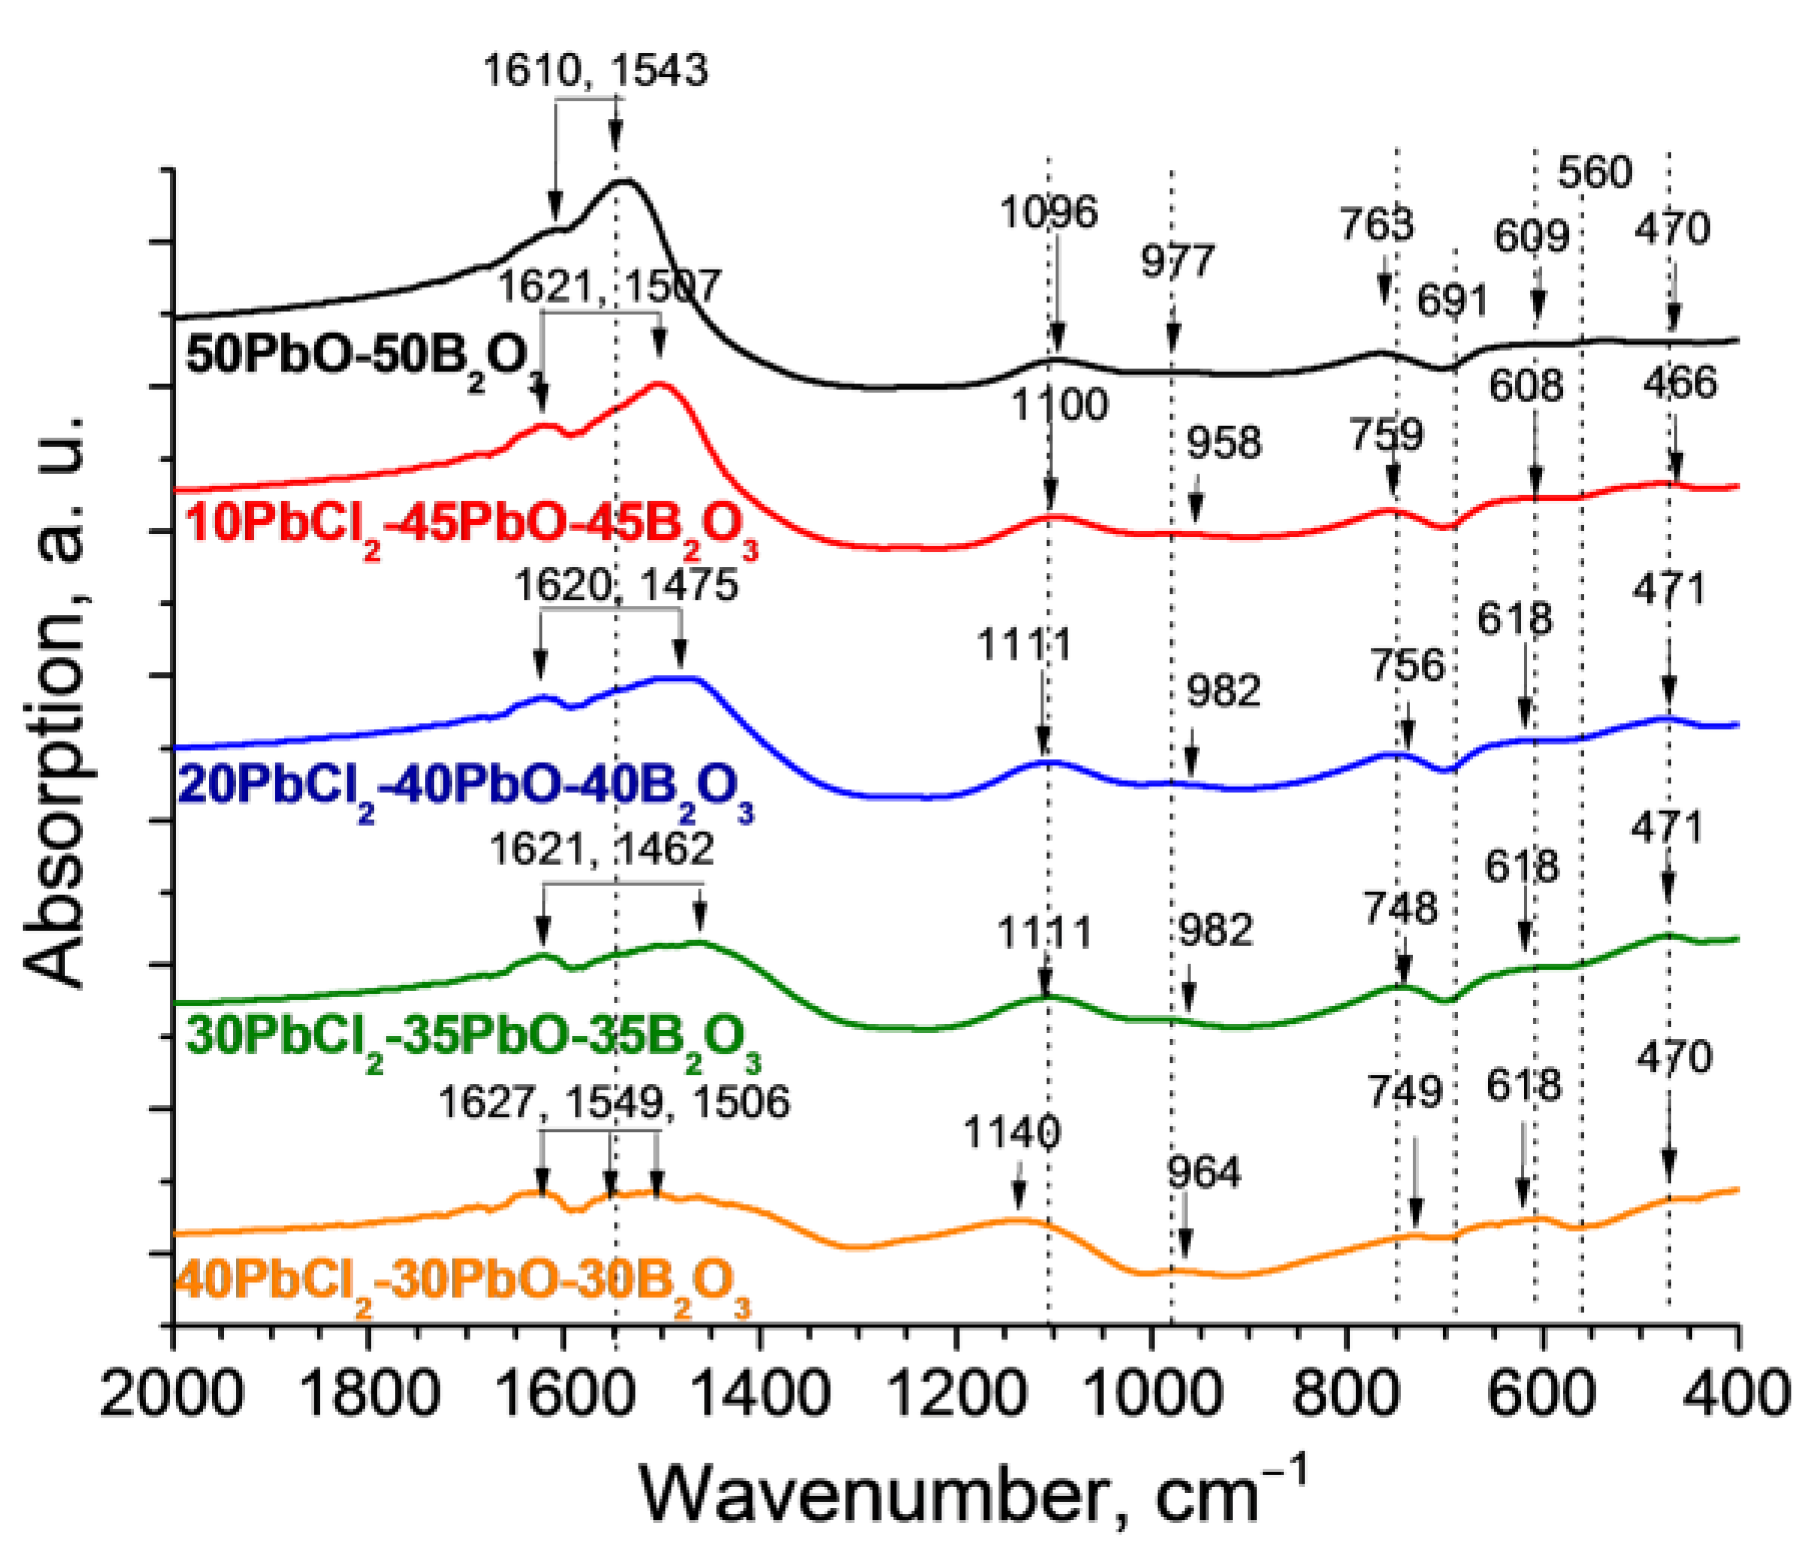
The FT-IR spectra showed several bands (Figure 7 and Figure S5), interpreted in Table 2.
The 470 cm−1 band referred to the vibrations of Pb2+ cations and its intensity increased with PbCl2 content growth. The 660 cm−1 band referred to vibrations of free BO4 groups. It was practically absent in the 50-50 glass but it manifested itself and increased with PbCl2 content growth.
The 691 cm−1 band was associated with B-O vibrations in the PbO—BO3 bridge and the band intensity rapidly decreased with PbCl2 content growth, which directly indicated the destruction of PbO4 tetrahedra.
Peaks in the 800–1200 cm−1 range referred to vibrations of the B–O bond in units of BO4. The bands were retained and even slightly increased with PbCl2 content growth, which indicated the retention of BO4 units in the grid.
Peaks in the 1300–1700 cm−1 range were attributed to bond fluctuations in the BO3 groups. Their intensities decreased with PbCl2 content growth, which indicated the destruction of the corresponding structural units.
Table 2. Interpretation of FT-IR bands in glasses.
Wavenumber, cm−1Corresponding Vibrational ModeReference
~466Lead cation oscillations Pb2+[42,43]
~560Oscillations of free BO4 groups [44]
~610bending vibrations of the B–O–B bonds in the BO3 group[45]
~691B-O oscillations associated with the PbO—BO3 bridge in the lead borate network[45,46]
~760Bending vibrations of the O3B–O–BO4 bond [5]
~800–1200Tensile vibrations of the B–O bonds of the tetrahedral block BO4 in ortho-, pyro-, and metaborate groups[5,45,46]
970Tensile vibrations of B–O bonds in BO4 groups[45,46]
~1050–1150Tensile B-O oscillations in BO4 units from tri-, tetra-, and pentaborate groups[4,5]
1300–1700Bond fluctuations in BO3 groups[4,5,45,46]
~1505, 1559, 1611 Asymmetric relaxations of B–O bond stretching of BO3 trigonal blocks[44]
~2350Asymmetric modes of CO2 stretching[47]
~3445Stretching vibrations of OH groups[4,44,47]
We should note that the FT-IR data were in full agreement with the Raman spectroscopy data. PbCl2 content growth resulted in the generation of new lead–chloride structural-chemical units, accompanied by a significant decrease in concentrations of BO3 groups and PbO4 tetrahedra.

3.2. DSC Characterization and Physical Properties

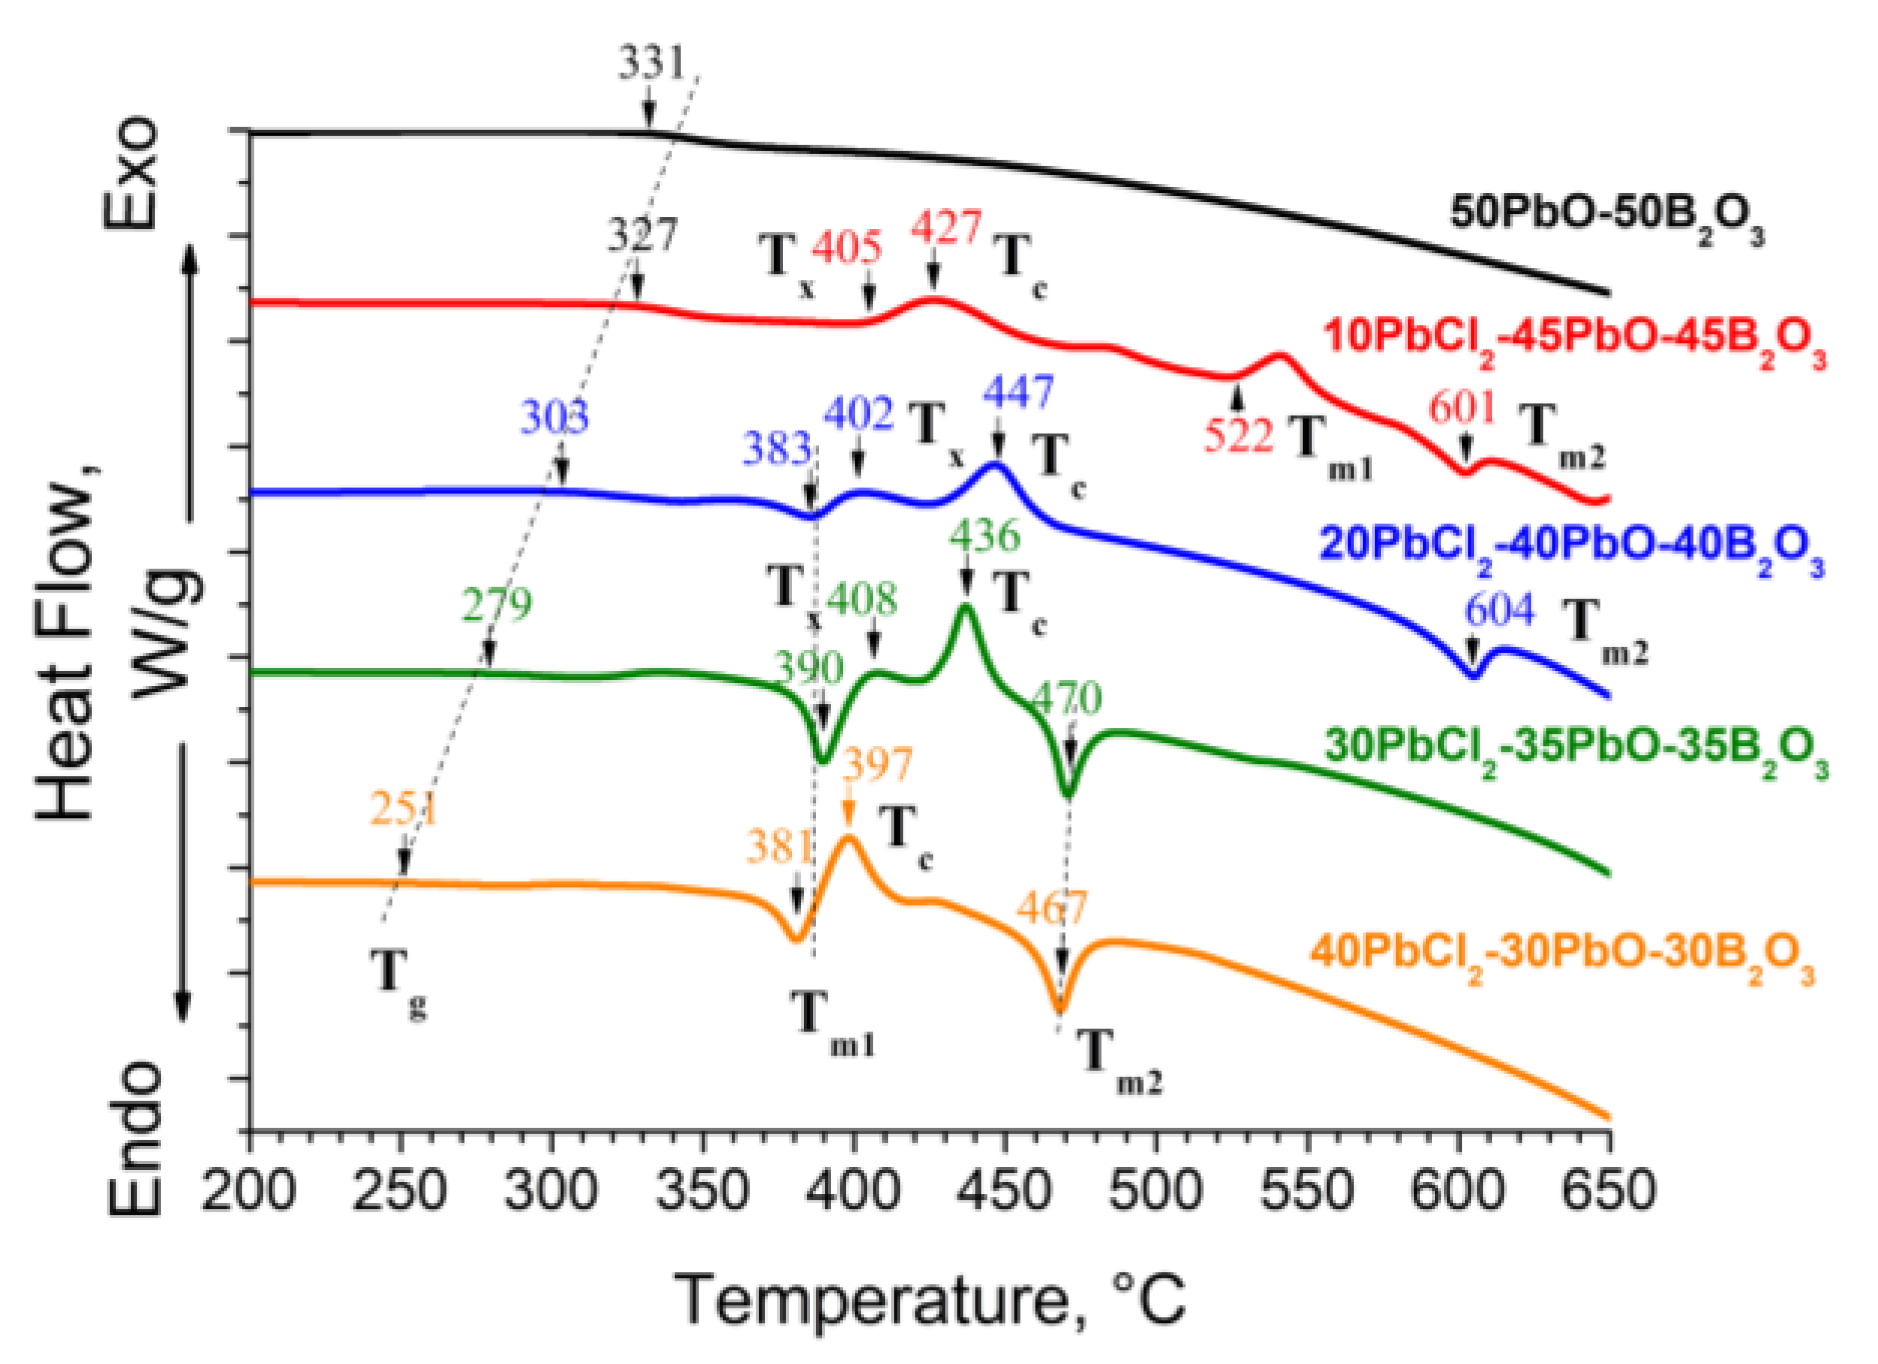
The presented DSC data (Figure 7, Figures S6–S10, Table 3) led us conclude that for the glasses of this system, the glass transition temperature (Tg) decreased with PbCl2 content growth. For the boundaries of PbCl2 composition, the difference was 80 °C. Such a significant change in the glass transition temperature (Tg) has been observed by other researchers and was attributed to structural changes in the glass network [16,48,49].
The incorporation of halogen ions (Cl, Br, I) into the gaps of the borate network led to a violation of the order of the BO3 groups. The overall disorder in halogen-doped glass occurred mainly due to the expansion of the boron–oxygen network [50,51]. Glasses with PbCl2 concentrations < 20 mol% consisted mainly of BO3 units, which had a relatively open structure. The large Cl ions could be easily incorporated in the network only in interstitial positions. With the further addition of PbCl2 (>20 mol%), the B–O network began to expand due to PbCl2. The network retained its connectivity, but it contained large voids that allowed the placement of Cl ions. The expansion of the B–O network, and hence the progressive weakening of the structure, manifested itself in a significant decrease in the glass transition temperature (Tg) [16]. This mechanism was confirmed by our structural studies.
At the same time, the DSC curves showed that the characteristics of crystallization in the studied glasses changed. The 50PbO–50B2O3 sample did not exhibit an exothermic peak corresponding to crystallization. However, we observed a broadened exothermic peak of crystallization with PbCl2 content growth. A further increase in PbCl2 content resulted in the splitting of the peak into two components. At 40 mol% PbCl2, we observed only the crystallization peak with a lower Tc.
The lead borate oxychloride glasses demonstrated two endothermic peaks at continuous heating, marked as Tm1 and Tm2 (Figure 8). This indicated the stepwise nature of the glass softening. We observed the final melting temperature of the studied glasses at ≤600 °C, which made it possible to classify these glasses as low-melting glasses (Figures S6–S10).
One of the most important criteria for glasses is the thermal stability coefficient (ΔT), defined as the difference between the onset of crystallization (Tx) and glass transition (Tg) [52] temperatures (Table 3). For all glass compositions, ΔT was higher than 70 °C. This meant that the studied glasses were resistant to crystallization. An increase in ΔT indicated an increase in glass stability with PbCl2 content growth [53,54,55].
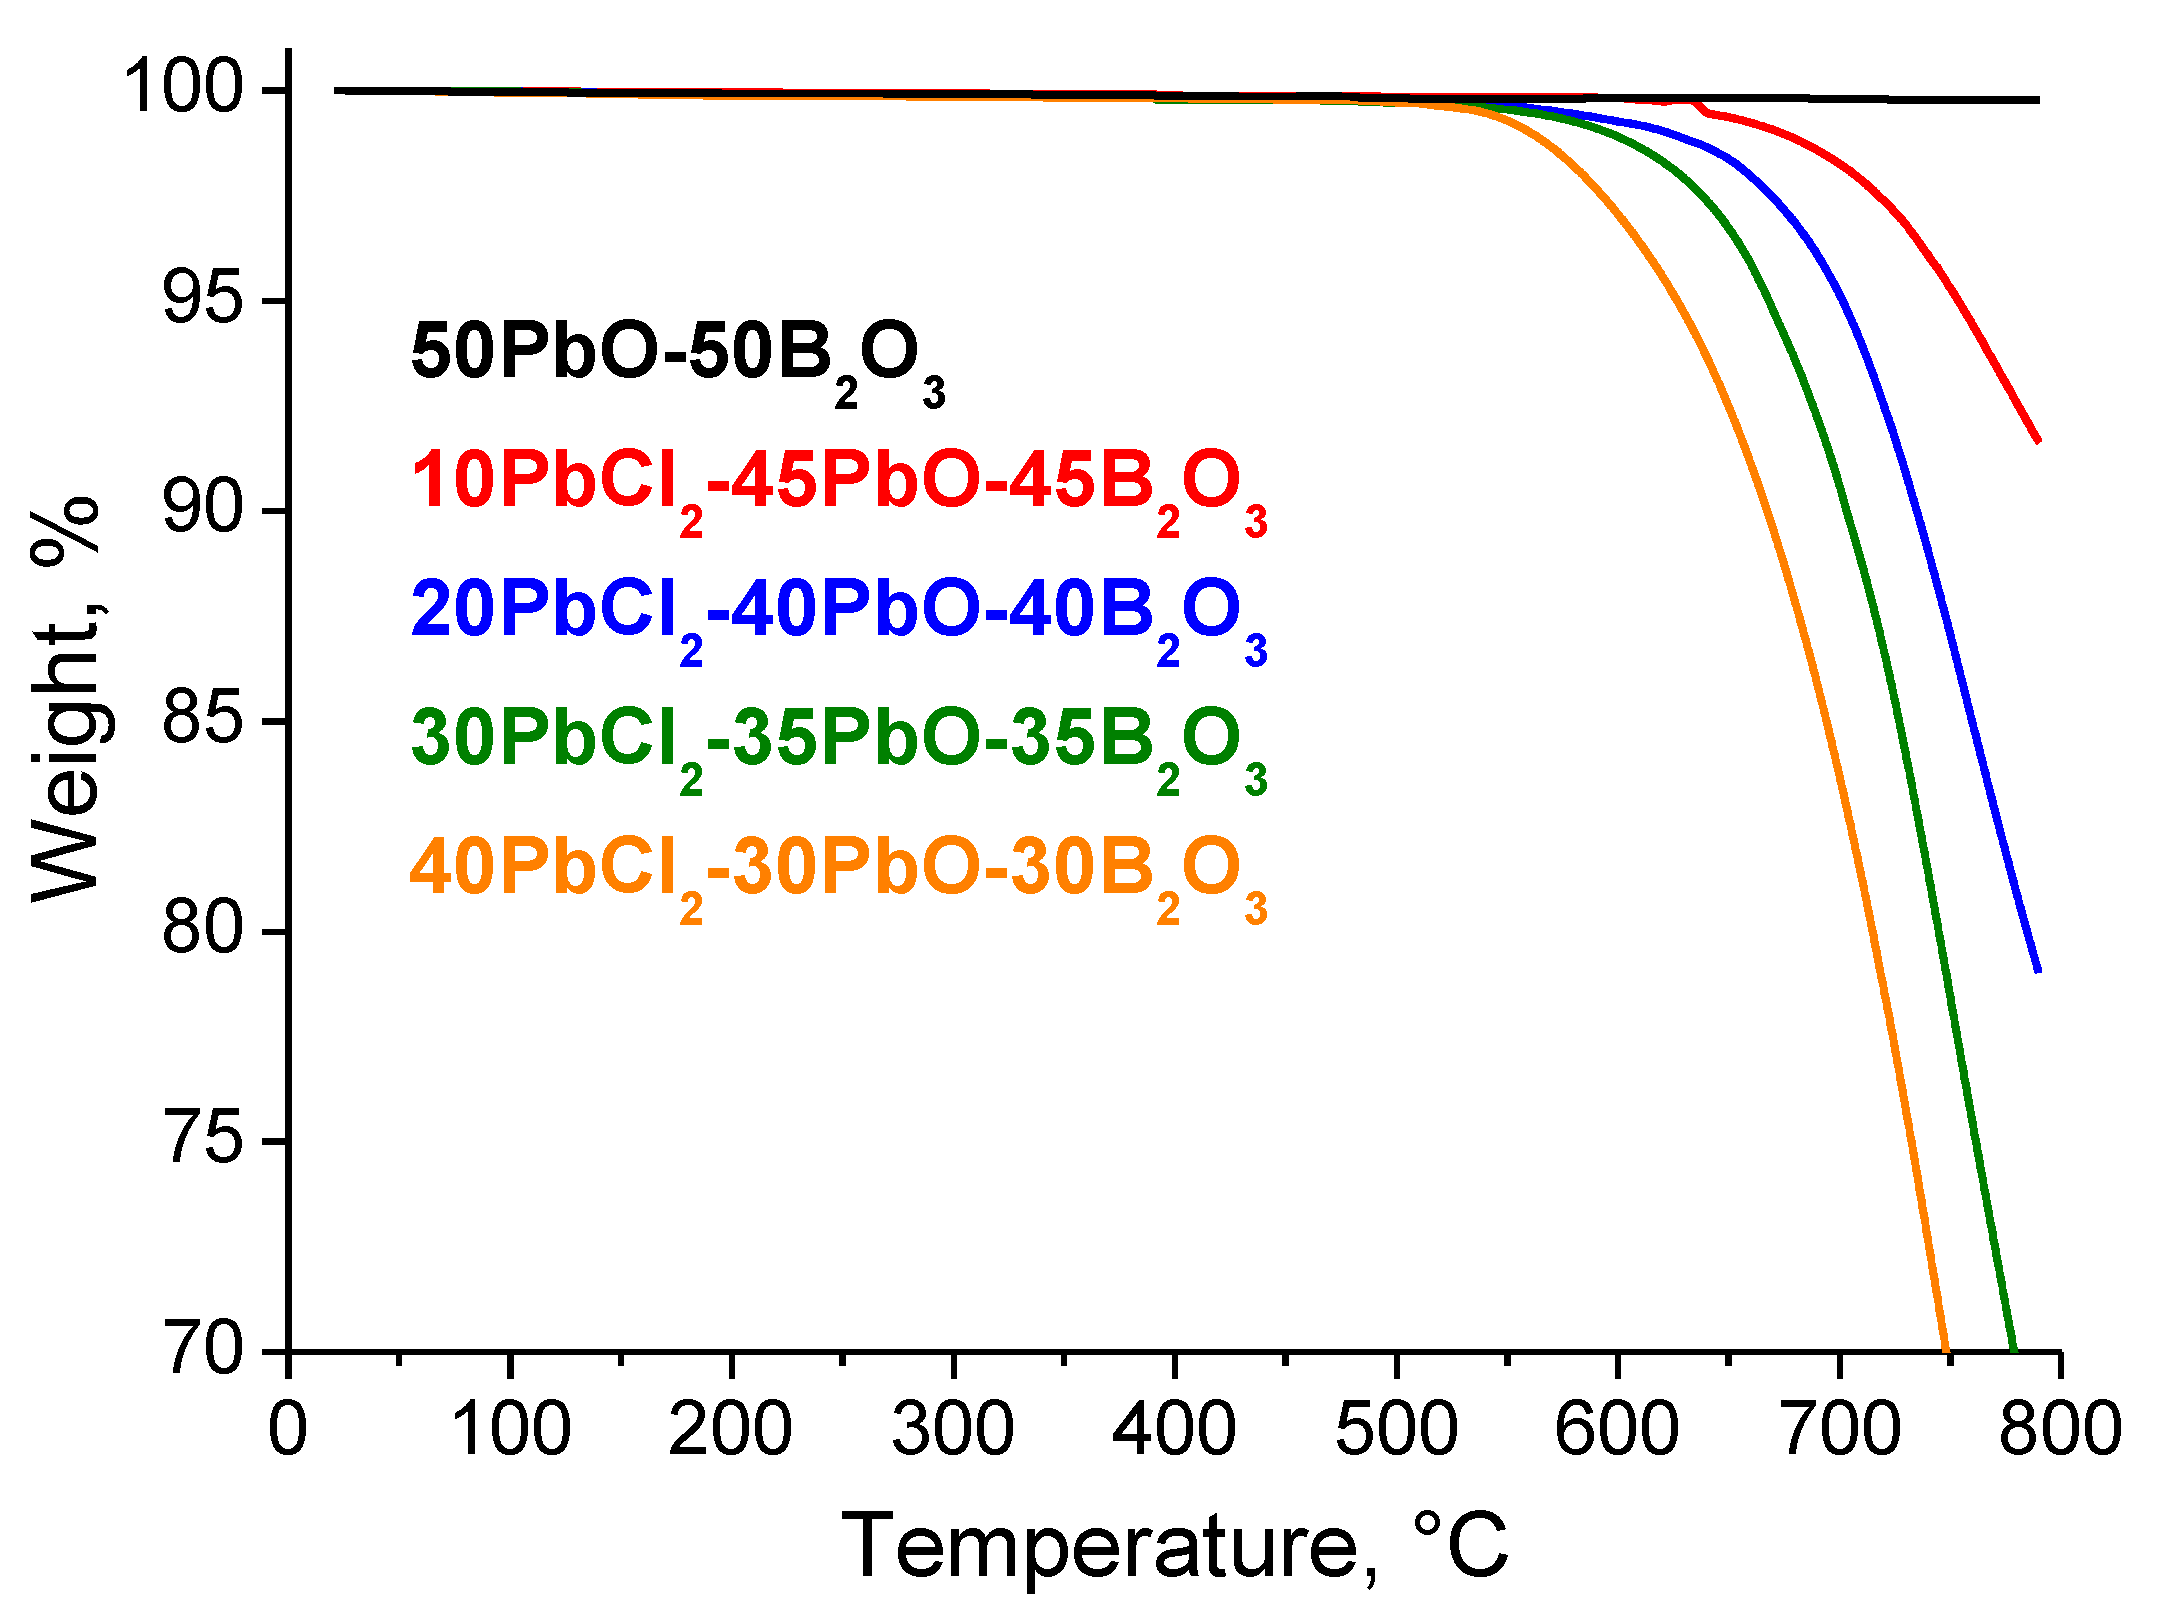
According to the TGA data, volatilization of the studied glasses began in the temperature region of 540–630 °C, and PbCl2 content growth intensified the volatilization (Figure 9). In contrast, the 50PbO–50B2O3 glass did not volatilize up to 800 °C. Since the crystallization of the corresponding compositions occurred before active volatilization had begun, one could conclude that it was possible to create glass-crystalline materials based on glasses without changing the chemical composition.
Based on the data from measuring the density (ρ) of the glass samples, the molar volume Vm was calculated using formula (3):
Vm = M/ρ,
where M is the average molecular weight of the glass [9].
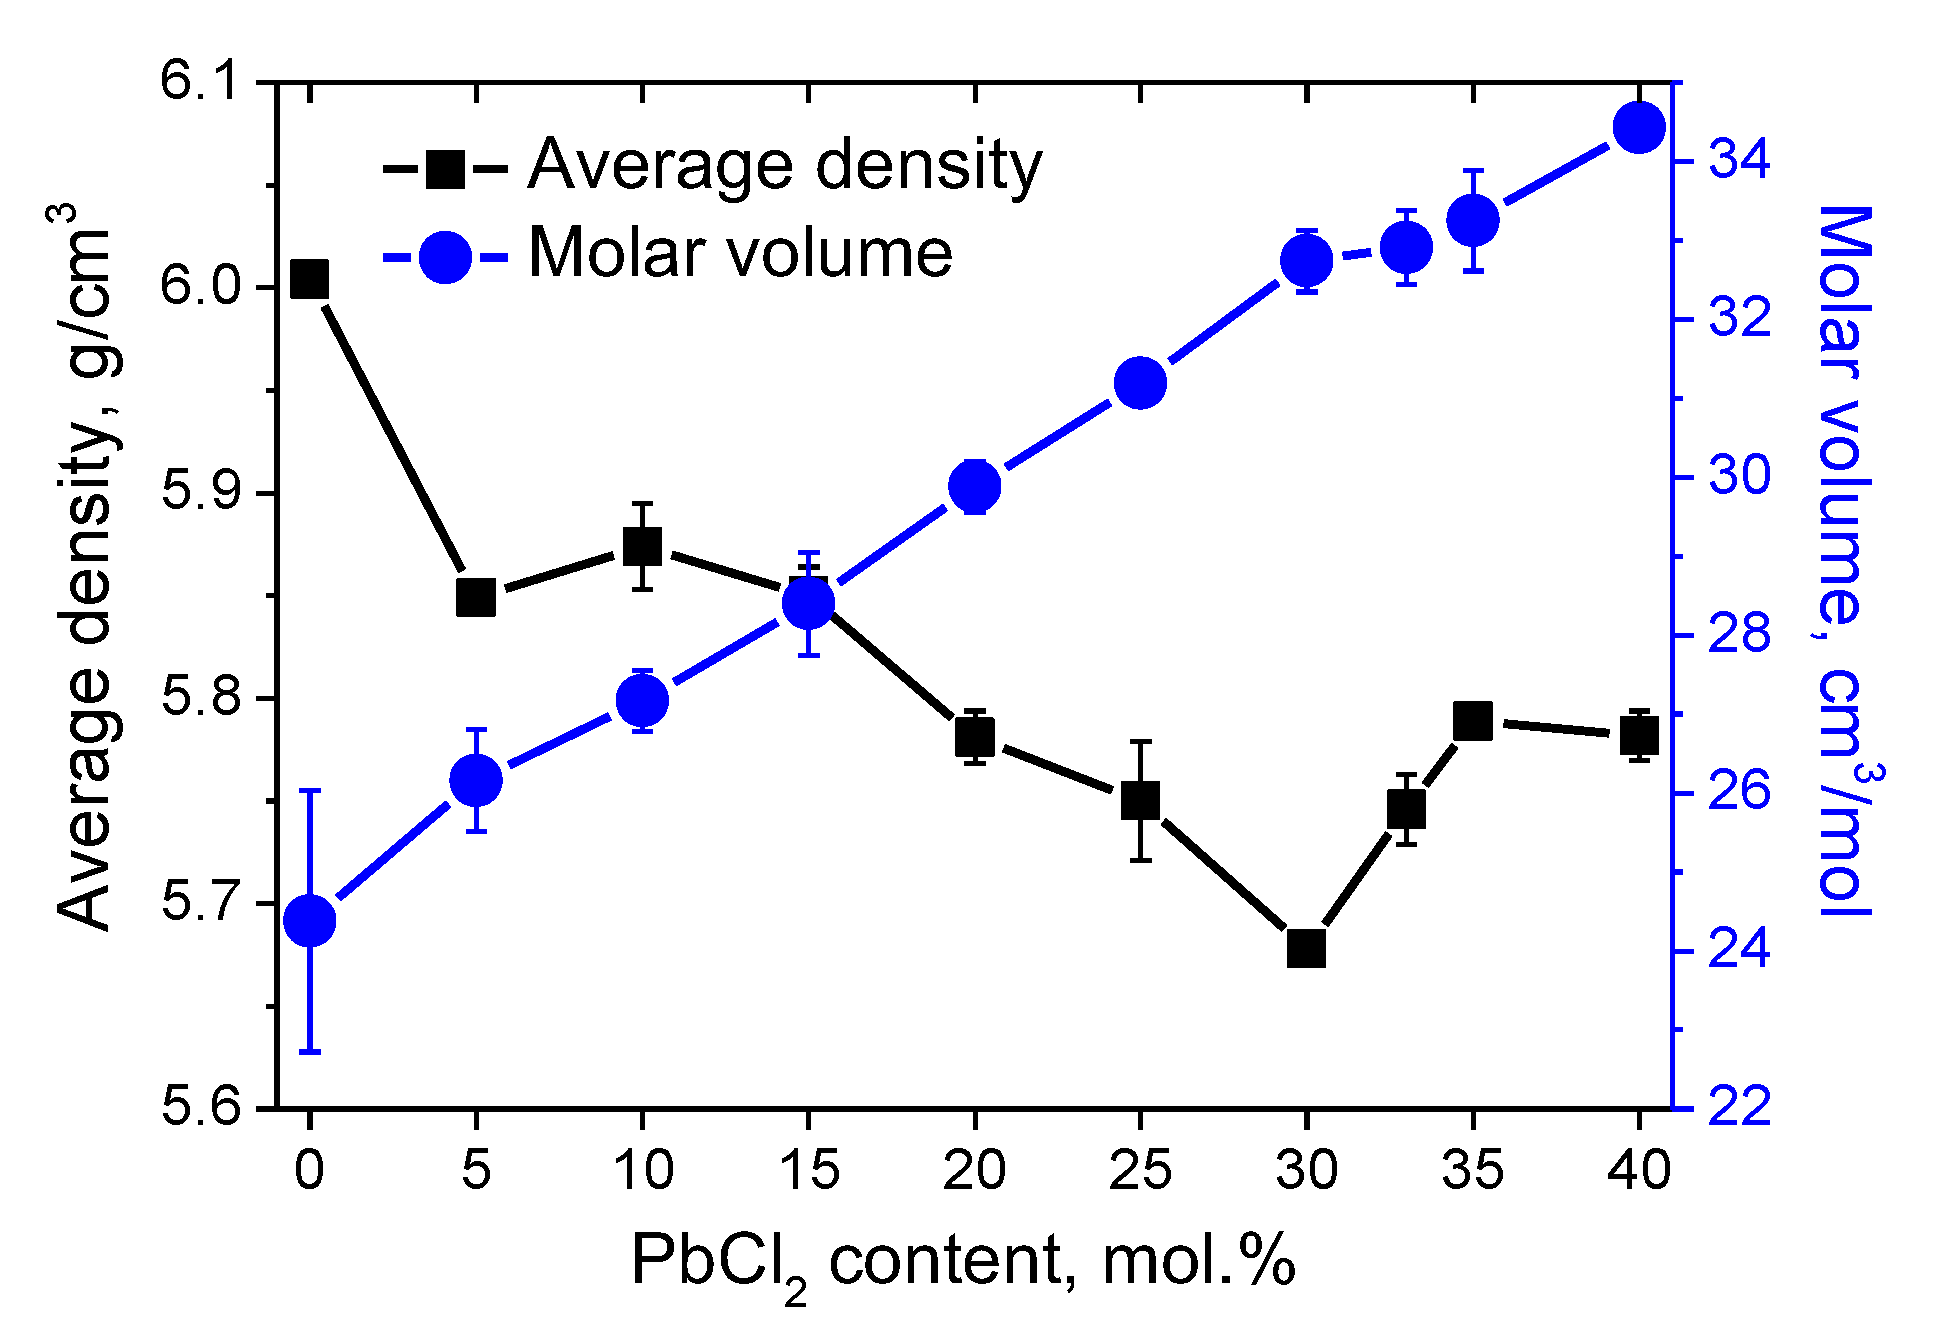
The glass density gradually decreased with increasing PbCl2 content in glass (Figure 10). In similar oxychloride glass systems [5,16,49], the same dependencies were observed.
An increase in PbCl2 concentration caused the density decrease and molar volume growth that were associated with a change in the structure of the glass network [5]. The big Cl ion occupies more space than the smaller O2− and expands the glass network, thereby increasing the molar volume [9,12], which was consistent with the data on the glass structure.
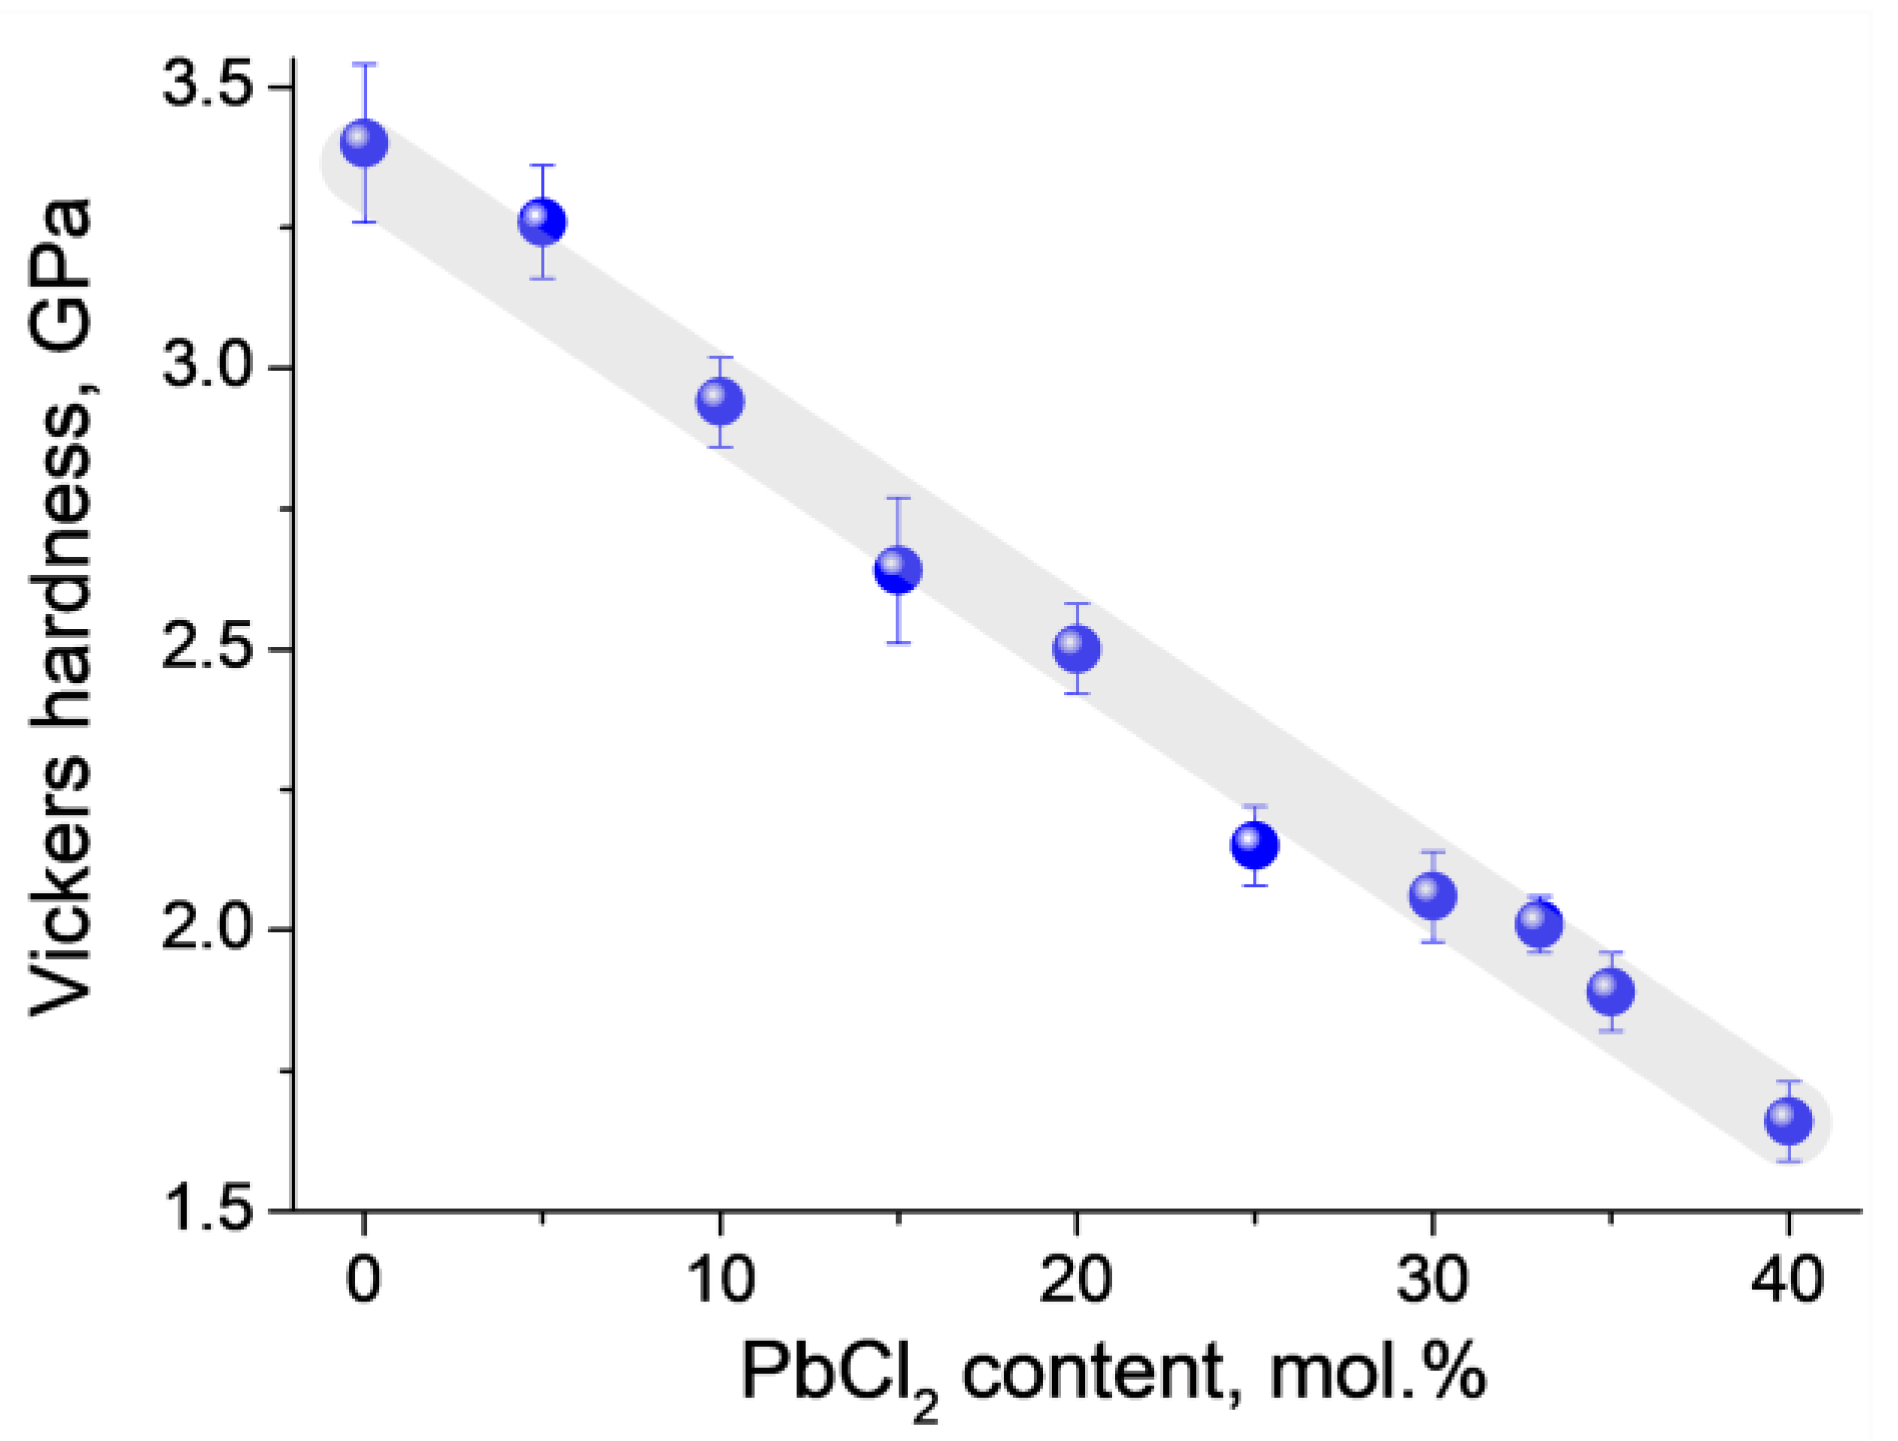
Glass samples containing a larger amount of PbCl2 had lower Vickers hardness (Figure 11 and Figure S11). Similar results for the same glass systems were presented in [14,48]. The transition from triangular BO3 groups to tetrahedral BO4 groups reduced the hardness and increased the non-bridging oxygens in binary [56] and ternary [57] borate glass systems. The trend towards a decrease in Vickers hardness with increased PbCl2 composition was associated with the formation of a larger number of depolymerizable boron structural units and a decrease in the rigidity of covalent bonds within them [58]. According to [20], the Vickers hardness of lead borate glasses mainly depends on the nature of the types of lead and boron structural units present in the glasses.

3.3. Optical Properties

The optical absorption spectra obtained in the UV, visible, and near-IR regions of the glasses under study are shown in Figure 12. The optical absorption coefficient, α(λ), was calculated from the absorption, A(λ), based on the following relation [9]:
α ( λ ) = 2.303 A ( λ ) d ,
where d is the thickness of the glass sample.
On the other hand, the optical absorption coefficient, α(ν), for amorphous materials is given by the Tauc equation [13]:
α ( ν ) = c o n s t [ ( h ν E g ) 2 h ν ] ,
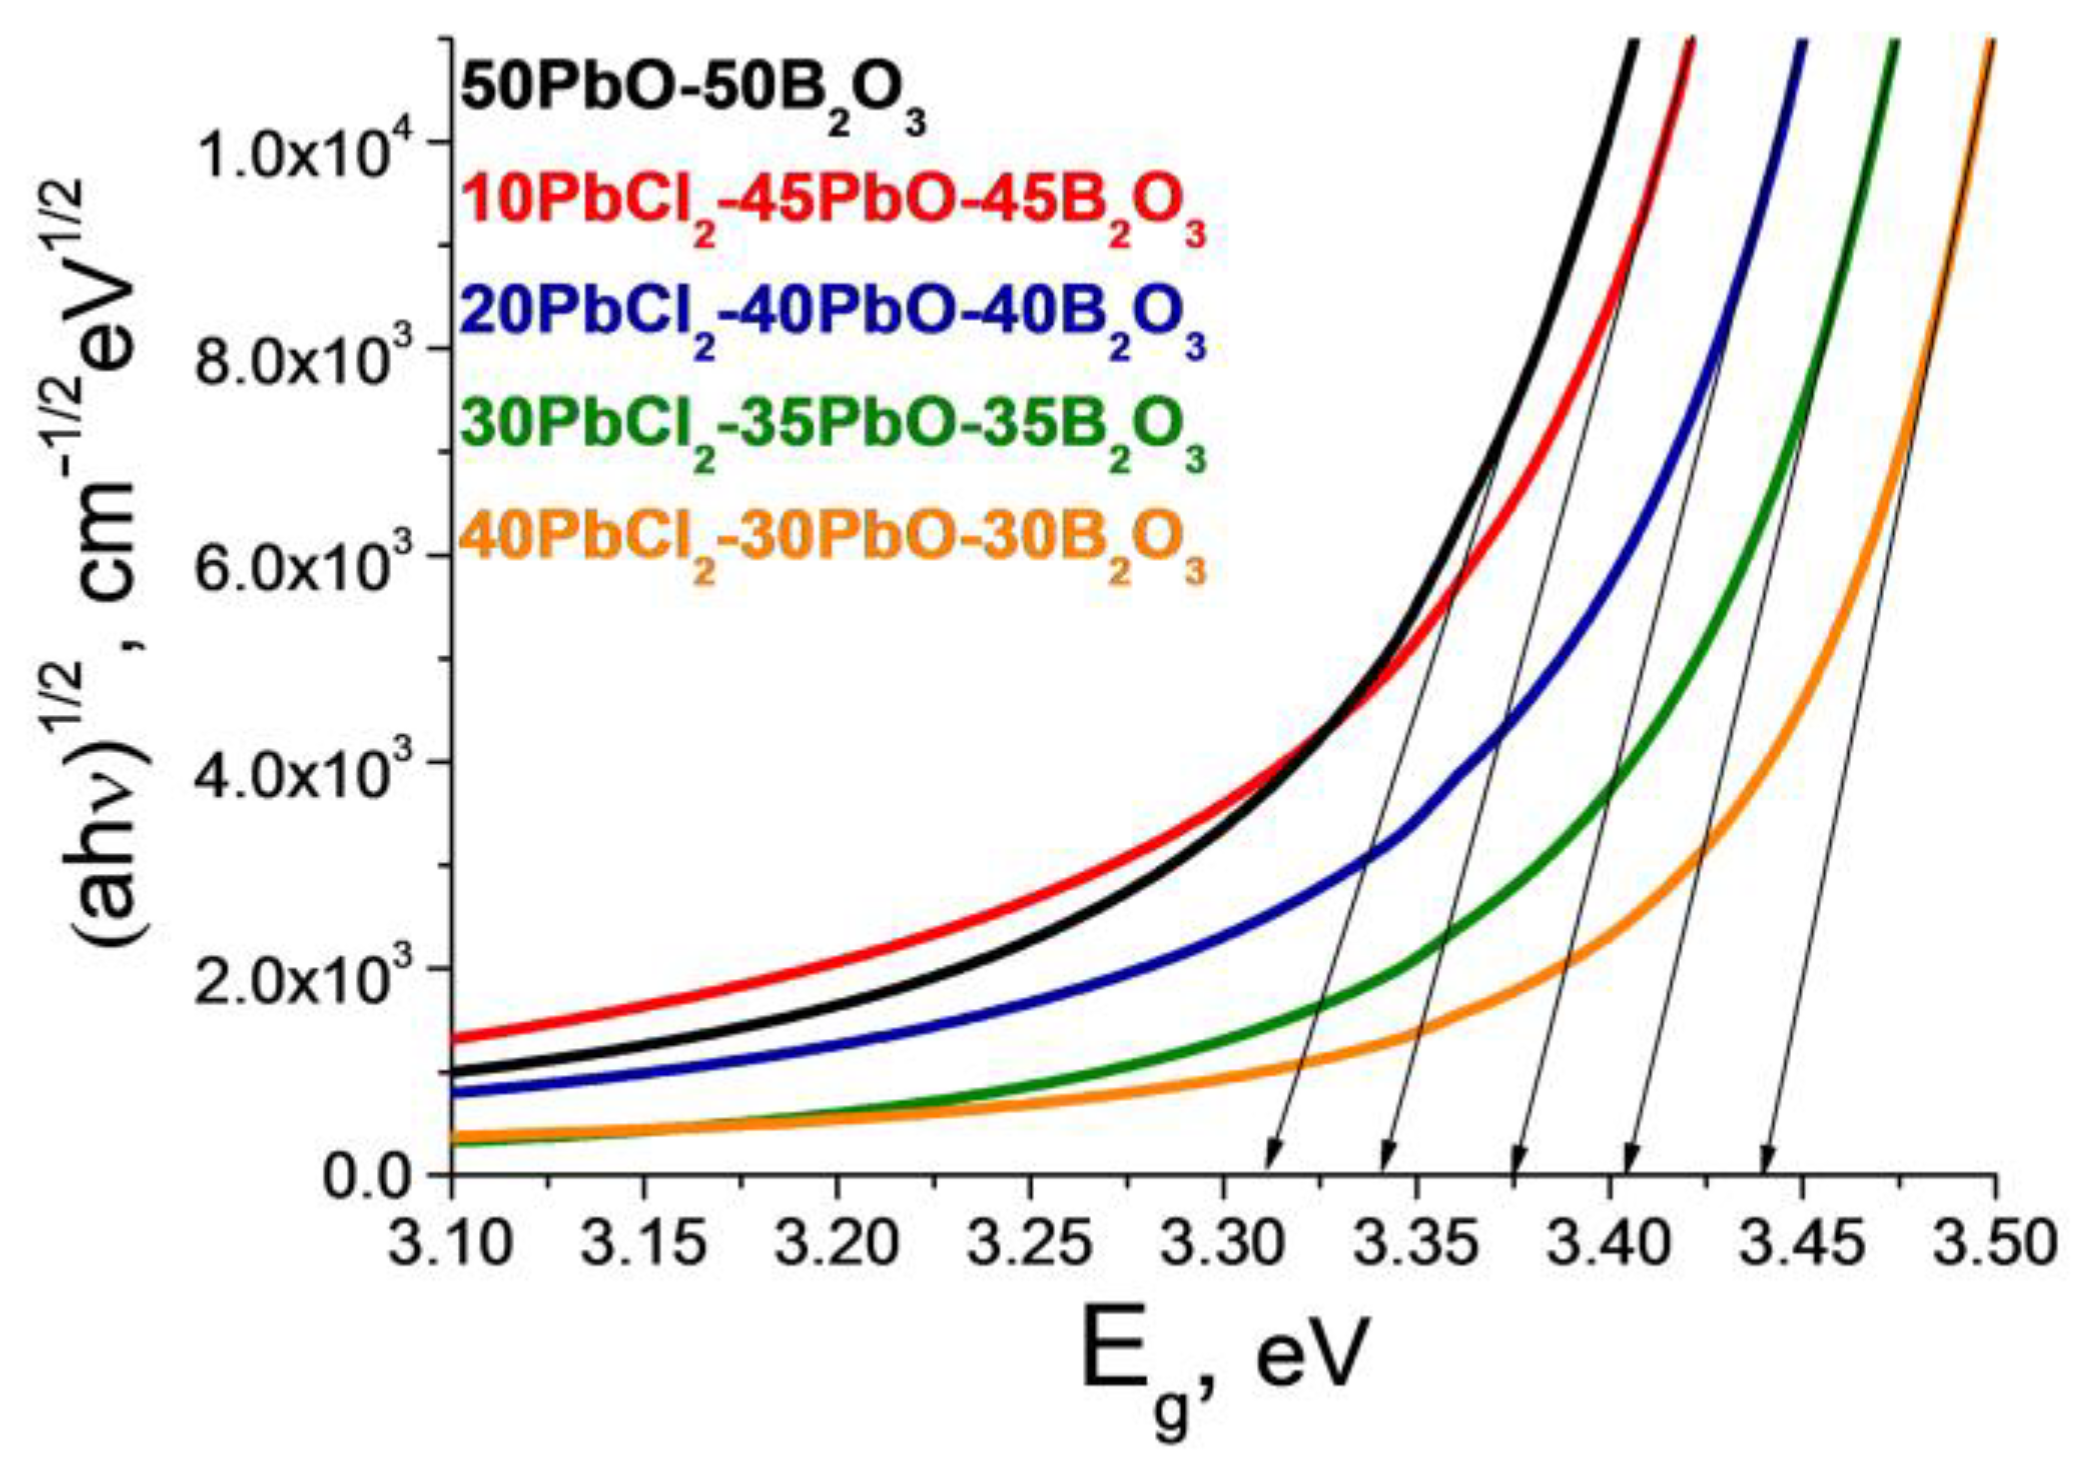
where is the photon energy and Eg is the optical energy gap. Thus, based on the Tauc plots (Figure 13), the optical gap (Eg) of the studied glasses was estimated.
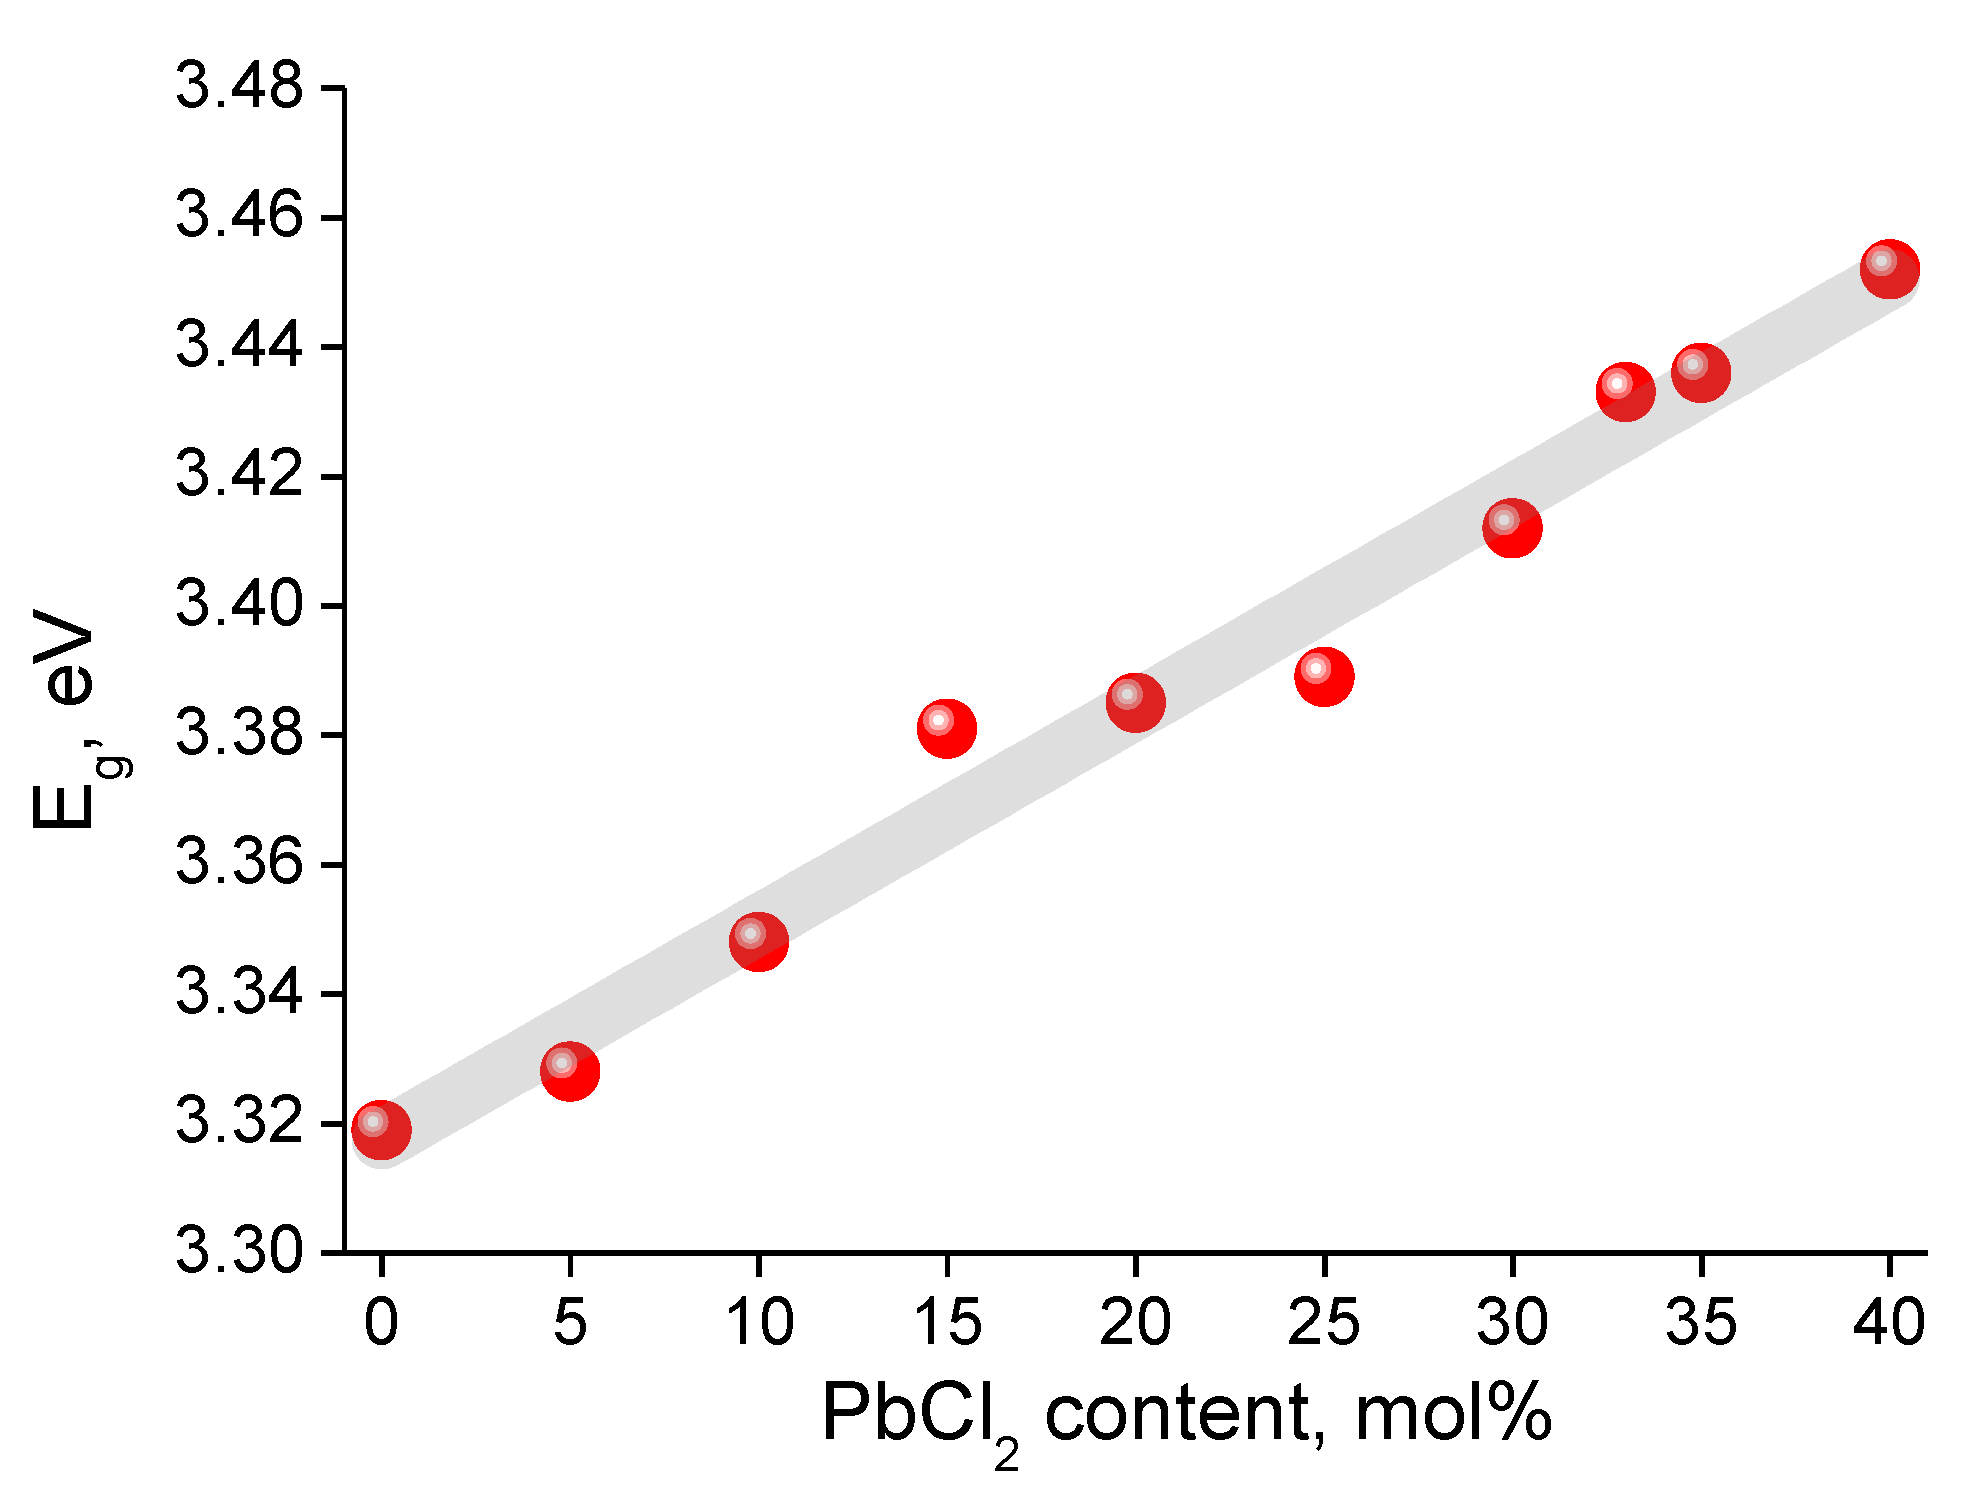
The Tauc energy (optical band gap) increased linearly with an increase in the PbCl2 content (Figure 14). This was the reason for the shift of the short-wavelength absorption edge of the glasses to the UV region (inset in Figure 12, Table 4).
The absorption edge in oxide glasses corresponds to the transition of an oxygen electron to the excited state [59]. The more weakly these oxygen electrons are bound, the more easily absorption occurs. In glasses, non-bridging oxygen is more negative than bridging oxygen. Increasing the proportion of ionized oxygen by converting it from bridging to non-bridging oxygen raises the valence band top, which leads to a decrease in the band gap (Eg) [60].
In our case, the increase in the optical energy gap (Eg) with PbCl2 content growth could be explained by a decrease in the content of non-bridging oxygen together with BO3 groups. On the other hand, the expansion of the band gap can be explained in terms of the Eg values of the initial glass components: E g P b O = 2.8 eV; E g B 2 O 3 = 5.4 eV; and E g P b C l 2 = 4.9 − 5.0 eV [61].
The absorption coefficient, α(ν), in amorphous materials in the optical region near the absorption edge at a certain temperature obeys an empirical relation known as the Urbach rule [62]:
α ( ν ) = α 0 e x p ( h ν E e ) ,
where is the photon energy, α0 is a constant, and Ee is the energy, which is interpreted as the width of the localized state in the normal bandgap known as the Urbach energy. The Urbach energy values were obtained by finding the reciprocal of the tangent of the slope of the graph plotted in the ln(α(ν)) − coordinates and are presented in Table 4.
The origin of exponential absorption is still a matter of debate, but it is generally believed that random potential fluctuations are associated with any lattice distortions, which can affect the Urbach energy by the generation of energy states within the band gap [13]. The nonlinear change in the Urbach energy depending on the PbCl2 concentration may have been due to the uneven distribution of defects in the studied glasses. Similar results for the Urbach energy were presented in [5,9].
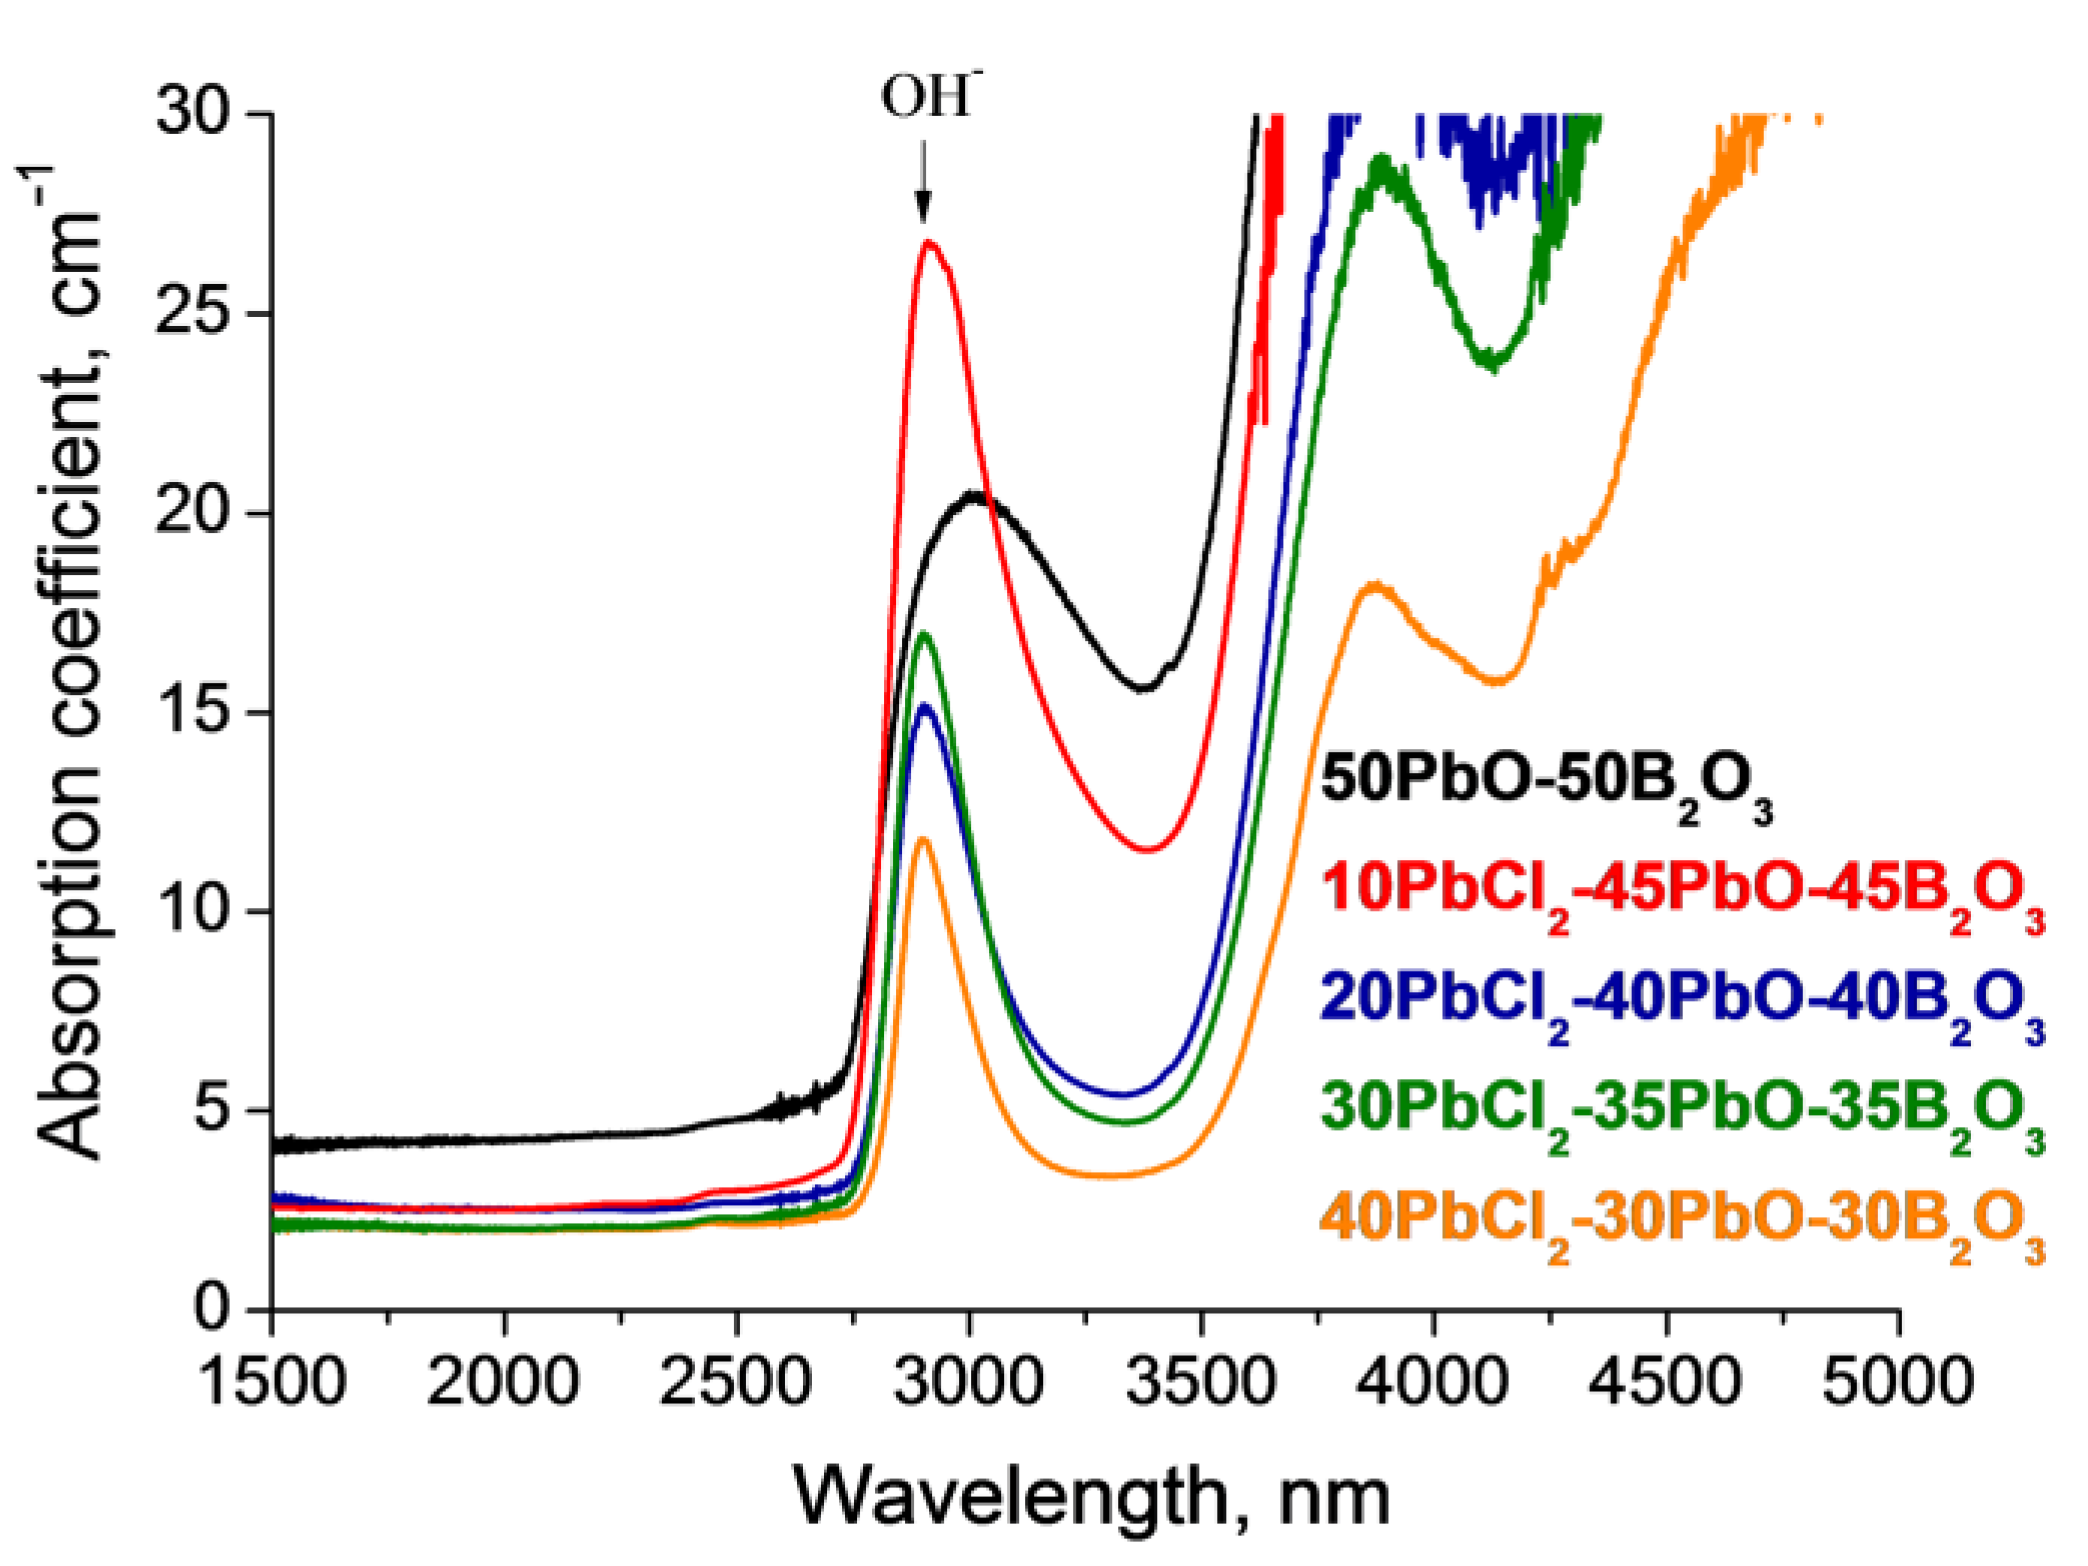
For the mid-IR spectrum range, we found that an increase in PbCl2 concentration shifted the long-wavelength absorption edge to the IR region (Figure 15, Table 4) due to the replacement of atoms with a low atomic number (B, ZB = 5) by atoms with a high atomic number (Pb, ZPb = 82). The glass matrix became heavier when we increased the total concentration of lead compounds (PbCl2 and PbO). This resulted in the shift of the long-wavelength absorption edge in the IR region and the expansion of the transparency range of the glasses [63]. The addition of a low-energy phonon component (PbCl2 is 230 cm−1 compared to borate glass ~1500 cm−1) also increased the transparency range in the IR region.
We observed a decrease in the intensity of the absorption band of hydroxyl groups with PbCl2 content growth (Figure 15, Table 4). According to the FT-IR spectroscopy results of the starting reagents, B2O3 had the largest content of OH groups (Figure S12). To reduce the content of OH groups, it is possible to use dry boron oxide [64] and bubble the melt with dry oxygen [65].
The theoretical refractive index of the studied glasses, (n), was calculated using Equation (7) [38]:
n = χ ( P b C l 2 ) · n ( P b C l 2 ) + χ ( P b O ) · n ( P b O ) + χ ( B 2 O 3 ) · n ( B 2 O 3 ) ,
where χ ( P b C l 2 ) , χ ( P b O ) , and χ ( B 2 O 3 ) are the molar fractions of the corresponding glass components; n ( P b C l 2 ) , n ( P b O ) , and n ( B 2 O 3 ) are the refractive indices of pure lead chloride, lead oxide, and boron oxide, respectively.
The refractive index was determined experimentally at three wavelengths: 633, 969, and 1539 nm (Table 5). The dispersions of the refractive index depending on the wavelength are presented in Figure S13.
The values of the calculated refractive index were slightly overestimated relative to the experimental ones. We assumed that this was due to some difference in the nominal and actual compositions of the glasses, primarily due to the incorporation of Al2O3 (n = 1.70–0.76) into the glasses, as determined by XPS [66].

4. Conclusions

For the first time we investigated the properties of glasses in the xPbCl2–(50-0.5x)PbO–(50-0.5x)B2O3 system with a wide range of PbCl2 concentrations from 0 to 40 mol%. This allowed us to fill gaps in the fundamental data for the system under study, which has applications for the production of optical fibers with extended transmission ranges for use in medical lasers and telecommunication systems.
The introduction of PbCl2 modified the structural network and led to drastic changes in the glassy network, resulting in a significant decrease in the numbers of BO3 groups and PbO4 tetrahedra, Tg reduction by 80 °C with a simultaneous increase in resistance to crystallization by 52 °C, glass molar volume growth of 30%, Vickers hardness reduction by 2 times, and refractive index growth from 1.9 to 2.1.
The decrease in bridge oxygen content with PbCl2 content growth resulted in the expansion of transparency in the UV region by 10 nm. The increase in heavy metal content in the glass matrix resulted in a decrease in the phonon energy, which resulted in the expansion of the IR range to 4700 nm.

Supplementary Materials

The following supporting information can be downloaded at: https://www.mdpi.com/article/10.3390/ceramics6030083/s1, Figure S1. Comparison of XRD patterns of glasses in the xPbCl2–(50-0.5x)PbO–(50-0.5x)B2O3 system with crystalline PbCl2; Table S1. The composition of glasses according to the XFS data; Figure S2. Decomposition of the 50PbO–50B2O3 glass Raman spectrum into Gaussian; Figure S3. Decomposition of the 40PbCl2–30PbO–30B2O3 glass Raman spectrum into Gaussian; Figure S4. Raman spectra of xPbCl2–(50-0.5x)PbO–(50-0.5x)B2O3 glasses (1750–3500 cm−1 range); Figure S5. FT-IR spectra of synthesized glasses; Figure S6. DSC curve for glass composition 50PbO–50B2O3 and characteristic temperatures; Figure S7. DSC curve for glass composition 10PbCl2–45PbO–45B2O3 and characteristic temperatures; Figure S8. DSC curve for glass composition 20PbCl2–40PbO–40B2O3 and characteristic temperatures; Figure S9. DSC curve for glass composition 30PbCl2–35PbO–35B2O3 and characteristic temperatures; Figure S10. DSC curve for glass composition 40PbCl2–30PbO–30B2O3 and characteristic temperatures; Figure S11. Dependence of Vickers hardness on the applied load in xPbCl2–(50-0.5x)PbO–(50-0.5x)B2O3 glasses; Figure S12. FT-IR spectra of the initial reagents, with the indicated band of the OH group; Figure S13. The dispersion of the refractive index of xPbCl2–(50-0.5x)PbO–(50-0.5x)B2O3 glasses.

Author Contributions

Conceptualization, D.B. and O.P.; methodology, D.B., K.R. and O.P.; software, A.B.; validation, O.P. and I.A.; formal analysis, M.U.; investigation, D.B., A.B., K.R., I.K., M.U. and A.P.; resources, K.R, A.P., M.U. and I.A.; data curation, D.B. and O.P.; writing—original draft preparation, D.B., A.B., O.P. and I.A.; writing—review and editing, O.P. and I.A.; visualization, D.B., I.K., A.P. and M.U.; supervision, I.A.; project administration, O.P.; funding acquisition, K.R. All authors have read and agreed to the published version of the manuscript.

Funding

The research was financially supported by the Ministry of Science and High Education of Russia by the project FSSM-2020-0005.

Institutional Review Board Statement

Not applicable.

Informed Consent Statement

Not applicable.

Data Availability Statement

Not applicable.

Acknowledgments

Analytical studies were carried out using the scientific equipment of the Central Collective Use Center of the National Research Center «Kurchatov Institute»—IREA.

Conflicts of Interest

The authors declare no conflict of interest.

References

  1. Bengisu, M. Borate glasses for scientific and industrial applications: A review. J. Mater. Sci. 2016, 51, 2199–2242. [Google Scholar] [CrossRef]
  2. Sokolov, I.A.; Murin, I.V.; Mel’Nikova, N.A.; Pronkin, A.A. A Study of Ionic Conductivity of Glasses in the PbCl2–PbO · B2O3 and PbCl2–2PbO · B2O3 Systems. Glas. Phys. Chem. 2003, 29, 291–299. [Google Scholar] [CrossRef]
  3. Singh, G.P.; Singh, J.; Kaur, P.; Singh, T.; Kaur, R.; Singh, D.P. The Role of Lead Oxide in PbO-B2O3 Glasses for Solid State Ionic Devices. Mater. Phys. Mech. 2021, 47, 951–961. [Google Scholar] [CrossRef]
  4. Pisarska, J. Novel oxychloroborate glasses containing neodymium ions: Synthesis, structure and luminescent properties. J. Mol. Struct. 2008, 887, 201–204. [Google Scholar] [CrossRef]
  5. Sekhar, K.C.; Hameed, A.; Sathe, V.G.; Chary, M.N.; Shareefuddin, M. Physical, optical and structural studies of copper-doped lead oxychloro borate glasses. Bull. Mater. Sci. 2018, 41, 79. [Google Scholar] [CrossRef] [Green Version]
  6. Saddeek, Y.B. Structural and acoustical studies of lead sodium borate glasses. J. Alloys Compd. 2009, 467, 14–21. [Google Scholar] [CrossRef]
  7. Yousef, E.S.S. Thermal and optical properties of zinc halotellurite glasses. J. Mater. Sci. 2007, 42, 4502–4507. [Google Scholar] [CrossRef]
  8. Brown, E.; Hömmerich, U.; Bluiett, A.G.; Trivedi, S.B.; Zavada, J.M. Synthesis and spectroscopic properties of neodymium doped lead chloride. J. Appl. Phys. 2007, 101, 113103. [Google Scholar] [CrossRef]
  9. Sekhar, K.C.; Hameed, A.; Ramadevudu, G.; Chary, M.N. Shareefuddin Physical and spectroscopic studies on manganese ions in lead halo borate glasses. Mod. Phys. Lett. B 2017, 31, 1750180. [Google Scholar] [CrossRef]
  10. Pisarski, W.A.; Pisarska, J.; Lisiecki, R.; Grobelny, Ł.; Dominiak-Dzik, G.; Ryba-Romanowski, W. Erbium-doped oxide and oxyhalide lead borate glasses for near-infrared broadband optical amplifiers. Chem. Phys. Lett. 2009, 472, 217–219. [Google Scholar] [CrossRef]
  11. Pisarska, J. Borate glasses with PbO and PbCl2 containing Dy3+ ions. Opt. Appl. 2010, 40, 367–374. [Google Scholar]
  12. El-Damrawi, G. Influence of PbCl2 on physical properties of lead chloroborate glasses. J. Non-Cryst. Solids 1994, 176, 91–97. [Google Scholar] [CrossRef]
  13. Sebastian, S.; Khadar, M.A. Optical properties of 60B2O3-(40-x)PbO-xMCl2 and 50B2O3-(50-x) PbO-xMCl2 (M = Pb, Cd) glasses. Bull. Mater. Sci. 2004, 27, 207–212. [Google Scholar] [CrossRef] [Green Version]
  14. Sebastian, S.; Khadar, M.A. Microhardness indentation size effect studies in 60B2O3-(40-x)PbO-xMCl2 and 50B2O3(50-x)PbO-xMCl2 (M = Pb, Cd) glasses. J. Mater. Sci. 2005, 40, 1655–1659. [Google Scholar] [CrossRef]
  15. Menezes, D.; Bannwart, E.; De Souza, J.; Rojas, S. Thermoluminescence emission on lead oxychloroborate glasses under UV exposure. Luminescence 2019, 34, 918–923. [Google Scholar] [CrossRef] [PubMed]
  16. Silim, H.A.; El-Damrawi, G.; Moustafa, Y.M.; Hassan, A.K. Electrical and elastic properties of binary lead chloroborate glasses. J. Phys. Condens. Matter 1994, 6, 6189–6196. [Google Scholar] [CrossRef]
  17. Nunes, C.; Mahendrasingam, A.; Suryanarayanan, R. Quantification of Crystallinity in Substantially Amorphous Materials by Synchrotron X-ray Powder Diffractometry. Pharm. Res. 2005, 22, 1942–1953. [Google Scholar] [CrossRef] [PubMed]
  18. Bates, S.; Zografi, G.; Engers, D.; Morris, K.; Crowley, K.; Newman, A. Analysis of Amorphous and Nanocrystalline Solids from Their X-ray Diffraction Patterns. Pharm. Res. 2006, 23, 2333–2349. [Google Scholar] [CrossRef]
  19. Cattaneo, A.S.; Lima, R.P.; Tambelli, C.E.; Magon, C.J.; Mastelaro, V.R.; Garcia, A.; de Souza, J.E.; de Camargo, A.S.S.; de Araujo, C.C.; Schneider, J.F.; et al. Structural Role of Fluoride in the Ion-Conducting Glass System B2O3–PbO–LiF Studied by Single- and Double-Resonance NMR. J. Phys. Chem. C 2008, 112, 10462–10471. [Google Scholar] [CrossRef]
  20. Singh, G.P.; Kaur, P.; Kaur, S.; Singh, D. Role of WO3 in structural and optical properties of WO3–Al2O3–PbO–B2O3 glasses. Phys. B Condens. Matter 2011, 406, 4652–4656. [Google Scholar] [CrossRef]
  21. Tsai, P.; Cooney, R.P. Raman spectra of polynuclear hydroxo-compounds of lead(II) chloride. J. Chem. Soc. Dalton Trans. 1976, 1631–1634. [Google Scholar] [CrossRef]
  22. Melo, F.E.A.; Filho, J.M.; Moreira, J.E.; Lemos, V.; Cerdeira, F. Anharmonic effects in Raman-active modes of PbCl2. J. Raman Spectrosc. 1984, 15, 128–131. [Google Scholar] [CrossRef]
  23. Chatzipanagis, K.I.; Tagiara, N.S.; Kamitsos, E.I.; Barrow, N.; Slagle, I.; Wilson, R.; Greiner, T.; Jesuit, M.; Leonard, N.; Phillips, A.; et al. Structure of lead borate glasses by Raman, 11B MAS, and 207Pb NMR spectroscopies. J. Non-Cryst. Solids 2022, 589, 121660. [Google Scholar] [CrossRef]
  24. Takaishi, T.; Jin, J.; Uchino, T.; Yoko, T. Structural Study of PbO-B2O3 Glasses by X-ray Diffraction and 11B MAS NMR Techniques. J. Am. Ceram. Soc. 2004, 83, 2543–2548. [Google Scholar] [CrossRef]
  25. Pan, Z.; Henderson, D.O.; Morgan, S.H. A Raman investigation of lead haloborate glasses. J. Chem. Phys. 1994, 101, 1767–1774. [Google Scholar] [CrossRef]
  26. Filho, A.S.; Filho, J.M.; Melo, F.; Custódio, M.; Lebullenger, R.; Hernandes, A. Optical properties of Sm3+ doped lead fluoroborate glasses. J. Phys. Chem. Solids 2000, 61, 1535–1542. [Google Scholar] [CrossRef]
  27. Ozin, G.A. The single crystal Raman spectrum of orthorhombic PbCl2. Can. J. Chem. 1970, 48, 2931–2933. [Google Scholar] [CrossRef]
  28. Mendes-Filho, J.; Melo, F.E.; Moreira, J.E. Raman spectra of lead chloride single crystals. J. Raman Spectrosc. 1979, 8, 199–202. [Google Scholar] [CrossRef]
  29. Sun, H.-T.; Wen, L.; Duan, Z.-C.; Hu, L.-L.; Zhang, J.-J.; Jiang, Z.-H. Intense frequency upconversion fluorescence emission of Er3+/Yb3+-codoped oxychloride germanate glass. J. Alloys Compd. 2006, 414, 142–145. [Google Scholar] [CrossRef]
  30. Witke, K.; Hübert, T.; Reich, P.; Splett, C. Quantitative Raman investigations of the structure of glasses in the system B2O3-PbO. Phys. Chem. Glas. 1994, 35, 28–33. [Google Scholar]
  31. Adams, D.M.; Stevens, D.C. Single-crystal vibrational spectra of tetragonal and orthorhombic lead monoxide. J. Chem. Soc. Dalton Trans. 1977, 1096–1103. [Google Scholar] [CrossRef]
  32. Frost, R.L.; Williams, P.A. Raman spectroscopy of some basic chloride containing minerals of lead and copper. Spectrochim. Acta Part A: Mol. Biomol. Spectrosc. 2004, 60, 2071–2077. [Google Scholar] [CrossRef] [PubMed] [Green Version]
  33. Sekhar, K.C.; Rao, G.V.; Chary, B.S.; Phani, A.V.L.; Sathe, V.G.; Narsimlu, N. Shareefuddin Raman study on lead halo borate glasses: Effect of PbO as modifier. In Proceedings of the International Conference on Advanced Materials: ICAM 2019, Kerala, India, 12–14 June 2019; p. 020144. [Google Scholar] [CrossRef]
  34. Zakir’yanov, D.O.; Chernyshev, V.; Zakir’yanova, I.D. Phonon spectrum of lead oxychloride Pb3O2Cl2: Ab initio calculation and experiment. Phys. Solid State 2016, 58, 325–332. [Google Scholar] [CrossRef]
  35. Maroni, V.A.; Cunningham, P.T. Laser-Raman spectra of gaseous BiBr3 and PbCl2. Appl. Spectrosc. 1973, 27, 428–430. [Google Scholar] [CrossRef]
  36. Faulques, E.; Zubkowski, J.D.; Perry, D.L. Infrared and Raman Spectra of bis-Thiourea Lead(II) Chloride. Spectrosc. Lett. 1996, 29, 1275–1284. [Google Scholar] [CrossRef]
  37. Li, Z.; Sun, Y.; Liu, L.; Zhang, Z. Modification of the Structure of Ti-Bearing Mold Flux by the Simultaneous Addition of B2O3 and Na2O. Met. Mater. Trans. E 2016, 3, 28–36. [Google Scholar] [CrossRef]
  38. Kurushkin, M.; Semencha, A.; Blinov, L.N.; Mikhail, M. Lead-containing oxyhalide glass. Glas. Phys. Chem. 2014, 40, 421–427. [Google Scholar] [CrossRef]
  39. Górny, A.; Kuwik, M.; Pisarski, W.A.; Pisarska, J. Lead Borate Glasses and Glass-Ceramics Singly Doped with Dy3+ for White LEDs. Materials 2020, 13, 5022. [Google Scholar] [CrossRef]
  40. Meera, B.; Sood, A.; Chandrabhas, N.; Ramakrishna, J. Raman study of lead borate glasses. J. Non-Cryst. Solids 1990, 126, 224–230. [Google Scholar] [CrossRef]
  41. Coleman, F.; Feng, G.; Murphy, R.W.; Nockemann, P.; Seddon, K.R.; Swadźba-Kwaśny, M. Lead(ii) chloride ionic liquids and organic/inorganic hybrid materials—A study of chloroplumbate(ii) speciation. Dalton Trans. 2013, 42, 5025–5035. [Google Scholar] [CrossRef] [Green Version]
  42. Chukanov, N.V.; Chervonnyi, A.D. Infrared Spectroscopy of Minerals and Related Compounds; Springer Mineralogy; Springer International Publishing: Cham, Switzerland, 2016. [Google Scholar] [CrossRef]
  43. Muthuselvi, C.; Anbuselvi, T.; Pandiarajan, S. Synthesis and Characterization of Lead (II) Chloride and Lead (II) Carbonate Nano. Part. Rev. Res. 2016, 5, 1–13. [Google Scholar]
  44. Abdelghany, A.M. Combined DFT, Deconvolution Analysis for Structural Investigation of Copper–doped Lead Borate Glasses. Open Spectrosc. J. 2012, 6, 9–14. [Google Scholar] [CrossRef]
  45. Abdullah, M.; Shafieza, S.; Kasim, A.; Hashim, A. The Effect of PbO on the Physical and Structural Properties of Borate Glass System. Mater. Sci. Forum 2016, 846, 177–182. [Google Scholar] [CrossRef]
  46. Pisarski, W.A.; Pisarska, J.; Ryba-Romanowski, W. Structural role of rare earth ions in lead borate glasses evidenced by infrared spectroscopy: BO3↔BO4 conversion. J. Mol. Struct. 2005, 744–747, 515–520. [Google Scholar] [CrossRef]
  47. Ma, Y.; Yan, W.; Sun, Q.; Liu, X. Raman and infrared spectroscopic quantification of the carbonate concentration in K2CO3 aqueous solutions with water as an internal standard. Geosci. Front. 2021, 12, 1018–1030. [Google Scholar] [CrossRef]
  48. Rao, K.J.; Rao, B.G.; Elliott, S.R. Glass formation in the system PbO-PbCl2. J. Mater. Sci. 1985, 20, 1678–1682. [Google Scholar] [CrossRef]
  49. El-Damrawi, G. PbCl2 conducting glasses with mixed glass formers. J. Phys. Condens. Matter 1995, 7, 1557–1563. [Google Scholar] [CrossRef]
  50. Gressler, C.A.; Shelby, J.E. Lead fluoroborate glasses. J. Appl. Phys. 1988, 64, 4450–4453. [Google Scholar] [CrossRef]
  51. Coon, J.; Horton, M.; Shelby, J.E. Stability and crystallization of lead halosilicate glasses. J. Non-Cryst. Solids 1988, 102, 143–147. [Google Scholar] [CrossRef]
  52. Pisarski, W.; Pisarska, J.; Goryczka, T.; Dominiak-Dzik, G.; Ryba-Romanowski, W. Influence of thermal treatment on spectroscopic properties of Er3+ ions in multicomponent InF3-based glasses. J. Alloys Compd. 2005, 398, 272–275. [Google Scholar] [CrossRef]
  53. Gressler, C.A.; Shelby, J.E. Properties and structure of PbO-PbF2-B2O3 glasses. J. Appl. Phys. 1989, 66, 1127–1131. [Google Scholar] [CrossRef]
  54. Cheng, Y.; Xiao, H.; Guo, W. Structure and crystallization kinetics of PbO–B2O3 glasses. Ceram. Int. 2007, 33, 1341–1347. [Google Scholar] [CrossRef]
  55. Petrova, O.; Velichkina, D.; Zykova, M.; Khomyakov, A.; Uslamina, M.; Nischev, K.; Pynenkov, A.; Avetisov, R.; Avetissov, I.C. Nd/La, Nd/Lu-co-doped transparent lead fluoroborate glass-ceramics. J. Non-Cryst. Solids 2020, 531, 119858. [Google Scholar] [CrossRef]
  56. Greenblatt, S.; Bray, P.J. Structural Aspects of B-O Network in Glassy Borates. Glas. Phys. Chem. 1967, 8, 312. [Google Scholar]
  57. Konijnendijk, W.; Stevels, J. The structure of borate glasses studied by Raman scattering. J. Non-Cryst. Solids 1975, 18, 307–331. [Google Scholar] [CrossRef]
  58. Abdullah, M.; Mohd, W.; Husin, H.W.; Kassim, A.; Yahya, N. The physical properties of lead borate (PbO-B2O3) glass. KONAKA Konf. Akad. 2015, 2015, 380–386. [Google Scholar]
  59. Hogarth, C.A.; Assadzadeh-Kashani, E. Some studies of the optical properties of tungsten-calcium-tellurite glasses. J. Mater. Sci. 1983, 18, 1255–1263. [Google Scholar] [CrossRef]
  60. Duffy, J.A. Ultraviolet transparency of glass: A chemical approach in terms of band theory, polarisability and electronegativity. Glas. Phys. Chem. 2001, 42, 151–157. [Google Scholar]
  61. Butenkov, D.A.; Runina, K.I.; Petrova, O.B. Synthesis and Properties of Nd-Doped Chlorofluorosilicate Lead Glasses. Glas. Ceram. 2021, 78, 135–139. [Google Scholar] [CrossRef]
  62. Urbach, F. The Long-Wavelength Edge of Photographic Sensitivity and of the Electronic Absorption of Solids. Phys. Rev. 1953, 92, 1324. [Google Scholar] [CrossRef]
  63. Lezal, D.; Pedlikova, J.; Kostka, P.; Bludska, J.; Poulain, M.; Zavadil, J. Heavy metal oxide glasses: Preparation and physical properties. J. Non-Cryst. Solids 2001, 284, 288–295. [Google Scholar] [CrossRef]
  64. Avetissov, I.C.; Petrova, O.B.; Anurova, M.O.; Khomyakov, A.V.; Akkuzina, A.A.; Taidakov, I.V. Mechanical and optical properties of hybrid materials based on inorganic glass matrix and organic metal complex phosphors. J. Phys. Conf. Ser. 2018, 1045, 012006. [Google Scholar] [CrossRef] [Green Version]
  65. Richards, B.D.O.; Teddy-Fernandez, T.; Jose, G.; Binks, D.; Jha, A. Mid-IR (3–4 μm) fluorescence and ASE studies in Dy3+ doped tellurite and germanate glasses and a fs laser inscribed waveguide. Laser Phys. Lett. 2013, 10, 085802. [Google Scholar] [CrossRef] [Green Version]
  66. French, R.H.; Müllejans, H.; Jones, D.J. Optical Properties of Aluminum Oxide: Determined from Vacuum Ultraviolet and Electron Energy-Loss Spectroscopies. J. Am. Ceram. Soc. 2005, 81, 2549–2557. [Google Scholar] [CrossRef]
Figure 1. The compositions of glasses in the PbCl2–PbO–B2O3 system: 1—our work; 2—[2]; 3—[12]; 4—[13,14]; 5—[5]; 6—[15]; 7—[16]; 8—[4,10,11].
Ceramics 06 00083 g001
Figure 2. XRD patterns of glasses in the xPbCl2–(50-0.5x)PbO–(50-0.5x)B2O3 system.
Ceramics 06 00083 g002
Figure 3. Comparison of Cl/Pb ratio in the batch and glasses synthesized in the xPbCl2–(50-0.5x)PbO–(50-0.5x)B2O3 system.
Ceramics 06 00083 g003
Figure 4. Volatilization of glass components from the melt during synthesis depending on PbCl2 content for glasses in the xPbCl2–(50-0.5x)PbO–(50-0.5x)B2O3 system. The line provides a guide for the eyes.
Ceramics 06 00083 g004
Figure 5. Raman spectra of xPbCl2–(50-0.5x)PbO–(50-0.5x)B2O3 glasses (80–250 cm−1 range).
Ceramics 06 00083 g005
Figure 6. Raman spectra of xPbCl2–(50-0.5x)PbO–(50-0.5x)B2O3 glasses (250–1750 cm−1 range).
Ceramics 06 00083 g006
Figure 7. FT-IR spectra of synthesized glasses.
Ceramics 06 00083 g007
Figure 8. DSC curves of synthesized glasses.
Ceramics 06 00083 g008
Figure 9. Results of thermogravimetric analysis of synthesized glasses.
Ceramics 06 00083 g009
Figure 10. Dependence of density (black) and molar volume (blue) on the content of PbCl2 in xPbCl2–(50-0.5x)PbO–(50-0.5x)B2O3 glass.
Ceramics 06 00083 g010
Figure 11. Dependence of Vickers hardness on the content of PbCl2 in xPbCl2–(50-0.5x)PbO–(50-0.5x)B2O3 glass. The line is guide for the eyes.
Ceramics 06 00083 g011
Figure 12. Optical absorption spectra of synthesized glasses. Enlarged fragment in the inset.
Ceramics 06 00083 g012
Figure 13. Tauc plots of optical absorption spectra of synthesized glasses.
Ceramics 06 00083 g013
Figure 14. Dependence of the optical band gap on the PbCl2 content in glasses. The line provides a guide for the eyes.
Ceramics 06 00083 g014
Figure 15. Optical absorption spectra of synthesized glasses in the range from 1500 to 5000 nm.
Ceramics 06 00083 g015
Table 3. Glass characteristic temperatures *.
Glass Composition, mol%Tg, °CTx1, °CTc1, °CTx2, °CTc2, °CTm1, °CTm2, °CΔT = (Tx1Tg), °C
50PbO–50B2O3331-------
10PbCl2-–5PbO–45B2O332740542748554052260178
20PbCl2–40PbO–40B2O3303402447--38360499
30PbCl2–35PbO–35B2O3279408436--390470129
40PbCl2–30PbO–30B2O3251381397428-381467130
*—the determination error for all characteristic temperatures was ±1 °C.
Table 4. Optical properties of glasses.
Glass Composition, mol%Short-
Wavelength Absorption Edge λ, nm
Tauc
Energy
Eg, eV *
Urbach
Energy
Ee, eV *
Average
Absorption
Coefficient, cm−1
Long-
Wavelength
Absorption Edge λ, nm
Absorption of the OH Group Band, cm−1
50PbO–50B2O33653.3070.4685.7361115.5
5PbCl2–47.5PbO–47.5B2O33653.3200.3933.6362622.0
10PbCl2–45PbO–45B2O33633.3270.5044.7366422.4
15PbCl2–42.5PbO–42.5B2O33603.3780.4324.4369020.3
20PbCl2–40PbO–40B2O33603.3760.4355.0373912.4
25PbCl2–37.5PbO–37.5B2O33593.3890.5055.2378811.9
30PbCl2–35PbO–35B2O33573.4060.3772.4434914.6
33PbCl2–33PbO–34B2O33563.4140.4534.6437010.9
35PbCl2–32.5PbO–32.5B2O33563.4230.4344.444629.5
40PbCl2–30PbO–30B2O33553.4400.4273.847109.4
*—the determination errors for Eg and Ee were ±0.005 eV.
Table 5. The values of the calculated and experimental refractive indices (n) of glasses in the xPbCl2–(50-0.5x)PbO–(50-0.5x) system.
Glass Composition, mol%Refractive Indices (n)
Estimated,
±0.01
Experimental, ±0.001
633 nm969 nm1539 nm
50PbO–50B2O32.041.9141.8951.890
5PbCl2–47.5PbO–47.5B2O32.051.9691.9301.903
10PbCl2–45PbO–45B2O32.061.9891.9491.932
15PbCl2–42.5PbO–42.5B2O32.061.9911.9631.940
20PbCl2–40PbO–40B2O32.072.0091.9691.954
25PbCl2–37.5PbO–37.5B2O32,082.0171.9781.960
30PbCl2–35PbO–35B2O32.092.0402.0001.981
33PbCl2–33PbO–34B2O32.092.0512.0101.991
35PbCl2–32.5PbO–32.5B2O32.102.0582.0161.997
40PbCl2–30PbO–30B2O32.102.0762.0322.013
Disclaimer/Publisher’s Note: The statements, opinions and data contained in all publications are solely those of the individual author(s) and contributor(s) and not of MDPI and/or the editor(s). MDPI and/or the editor(s) disclaim responsibility for any injury to people or property resulting from any ideas, methods, instructions or products referred to in the content.